
Eurozone Stock Market Reaction to Monetary Policy Interventions and Other Covariates


Abstract
:1. Introduction
- RQ 1:
- Do eurozone markets react to ECB’s expansionary monetary policy interventions?
- RQ 2:
- Do inflation and output affect the returns of eurozone equity markets?
- RQ 3:
- What impact does a sentiment indicator have on the performance of eurozone stock markets?
- RQ 4:
- Is there a heterogeneous reaction to expansionary monetary policy innovations and to other covariates between core and peripheral eurozone countries?
2. ECB’s Monetary Interventions
3. Literature Review of Monetary Policy
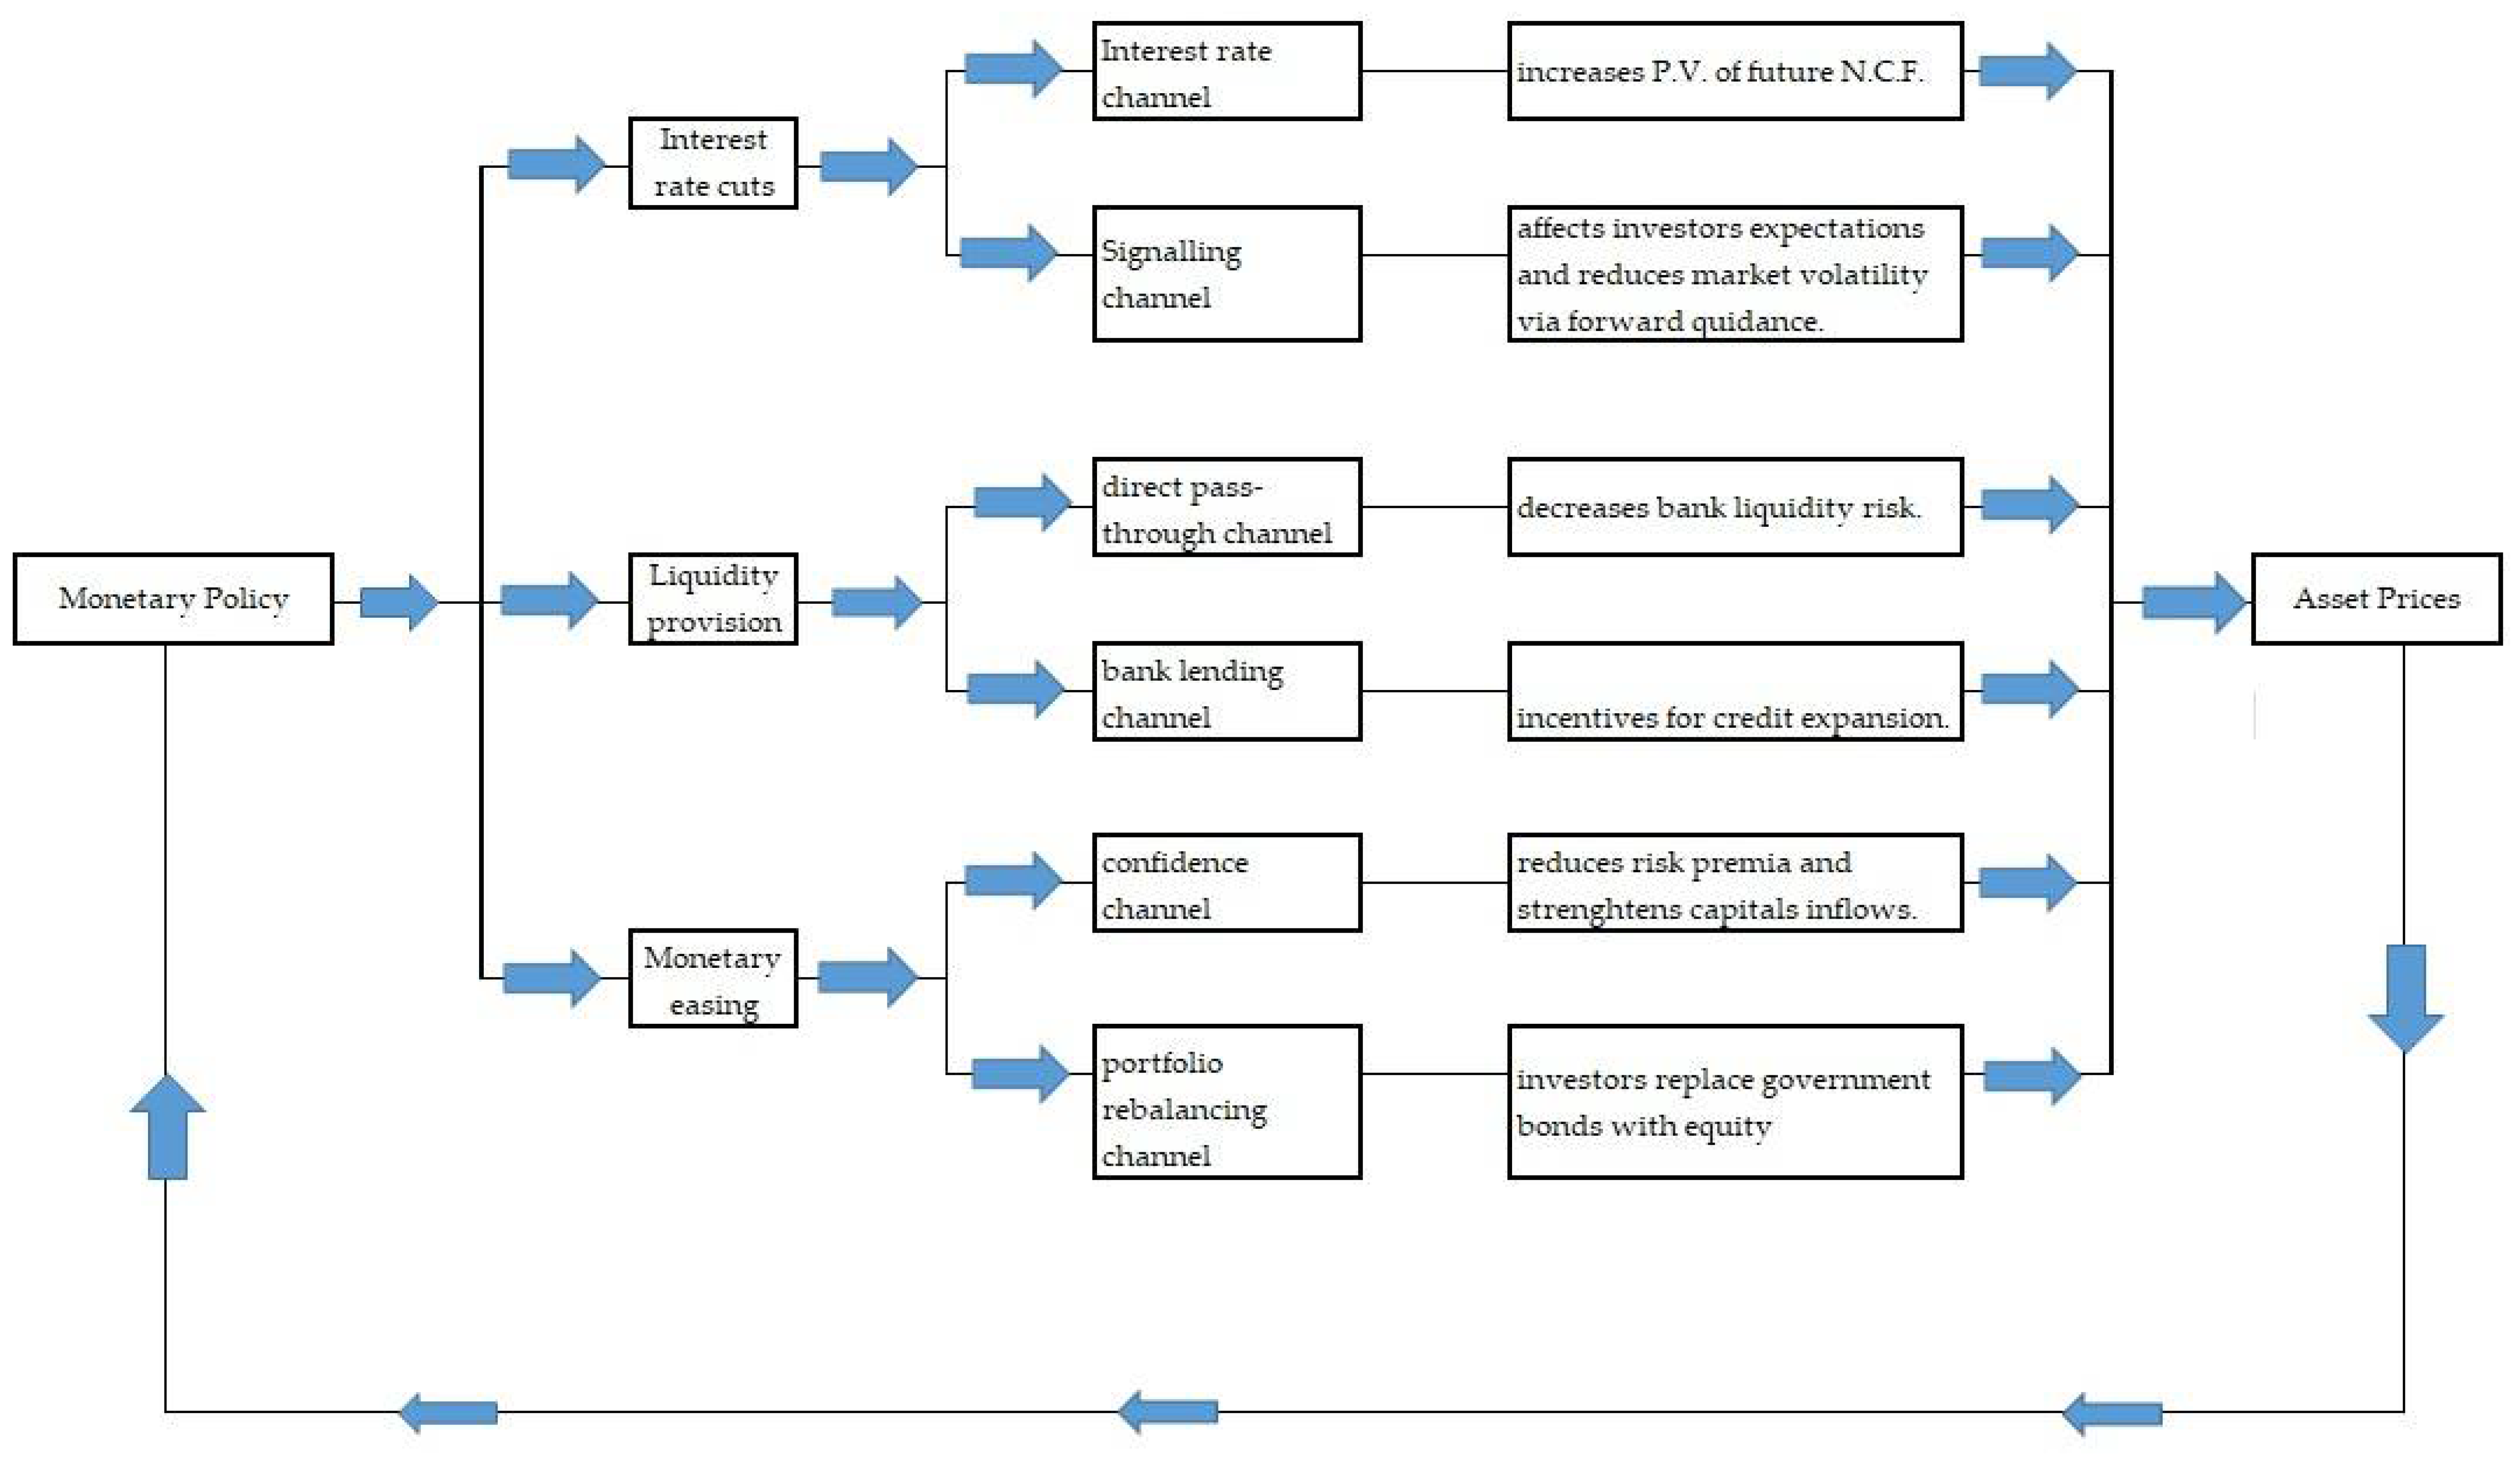
4. Transmission Channels of Monetary Policy
5. Empirical Approach
5.1. Data
5.1.1. Dependent Variable
5.1.2. Independent Variables
5.2. Methodology
6. Results
Robustness Tests
7. Conclusions
Author Contributions
Funding
Institutional Review Board Statement
Informed Consent Statement
Data Availability Statement
Conflicts of Interest
Appendix A

| Country | Mean | Median | Max | Min | Std. Dev. |
|---|---|---|---|---|---|
| Belgium | −0.000744 | 0.004634 | 0.110650 | −0.240879 | 0.049945 |
| France | −0.000320 | 0.002259 | 0.118287 | −0.145225 | 0.049831 |
| Germany | 0.005091 | 0.010683 | 0.154968 | −0.213096 | 0.055215 |
| Greece | −0.011196 | −0.003996 | 0.198539 | −0.326730 | 0.097612 |
| Italy | −0.004847 | −0.003831 | 0.188966 | −0.178007 | 0.063794 |
| Netherlands | 0.000718 | 0.010110 | 0.105922 | −0.219583 | 0.053387 |
| Portugal | −0.005541 | −0.003481 | 0.100720 | −0.233478 | 0.057707 |
| Spain | −0.002595 | 0.002270 | 0.153789 | −0.219408 | 0.060079 |
| All | −0.002413 | 0.004244 | 0.198539 | −0.326730 | 0.062535 |
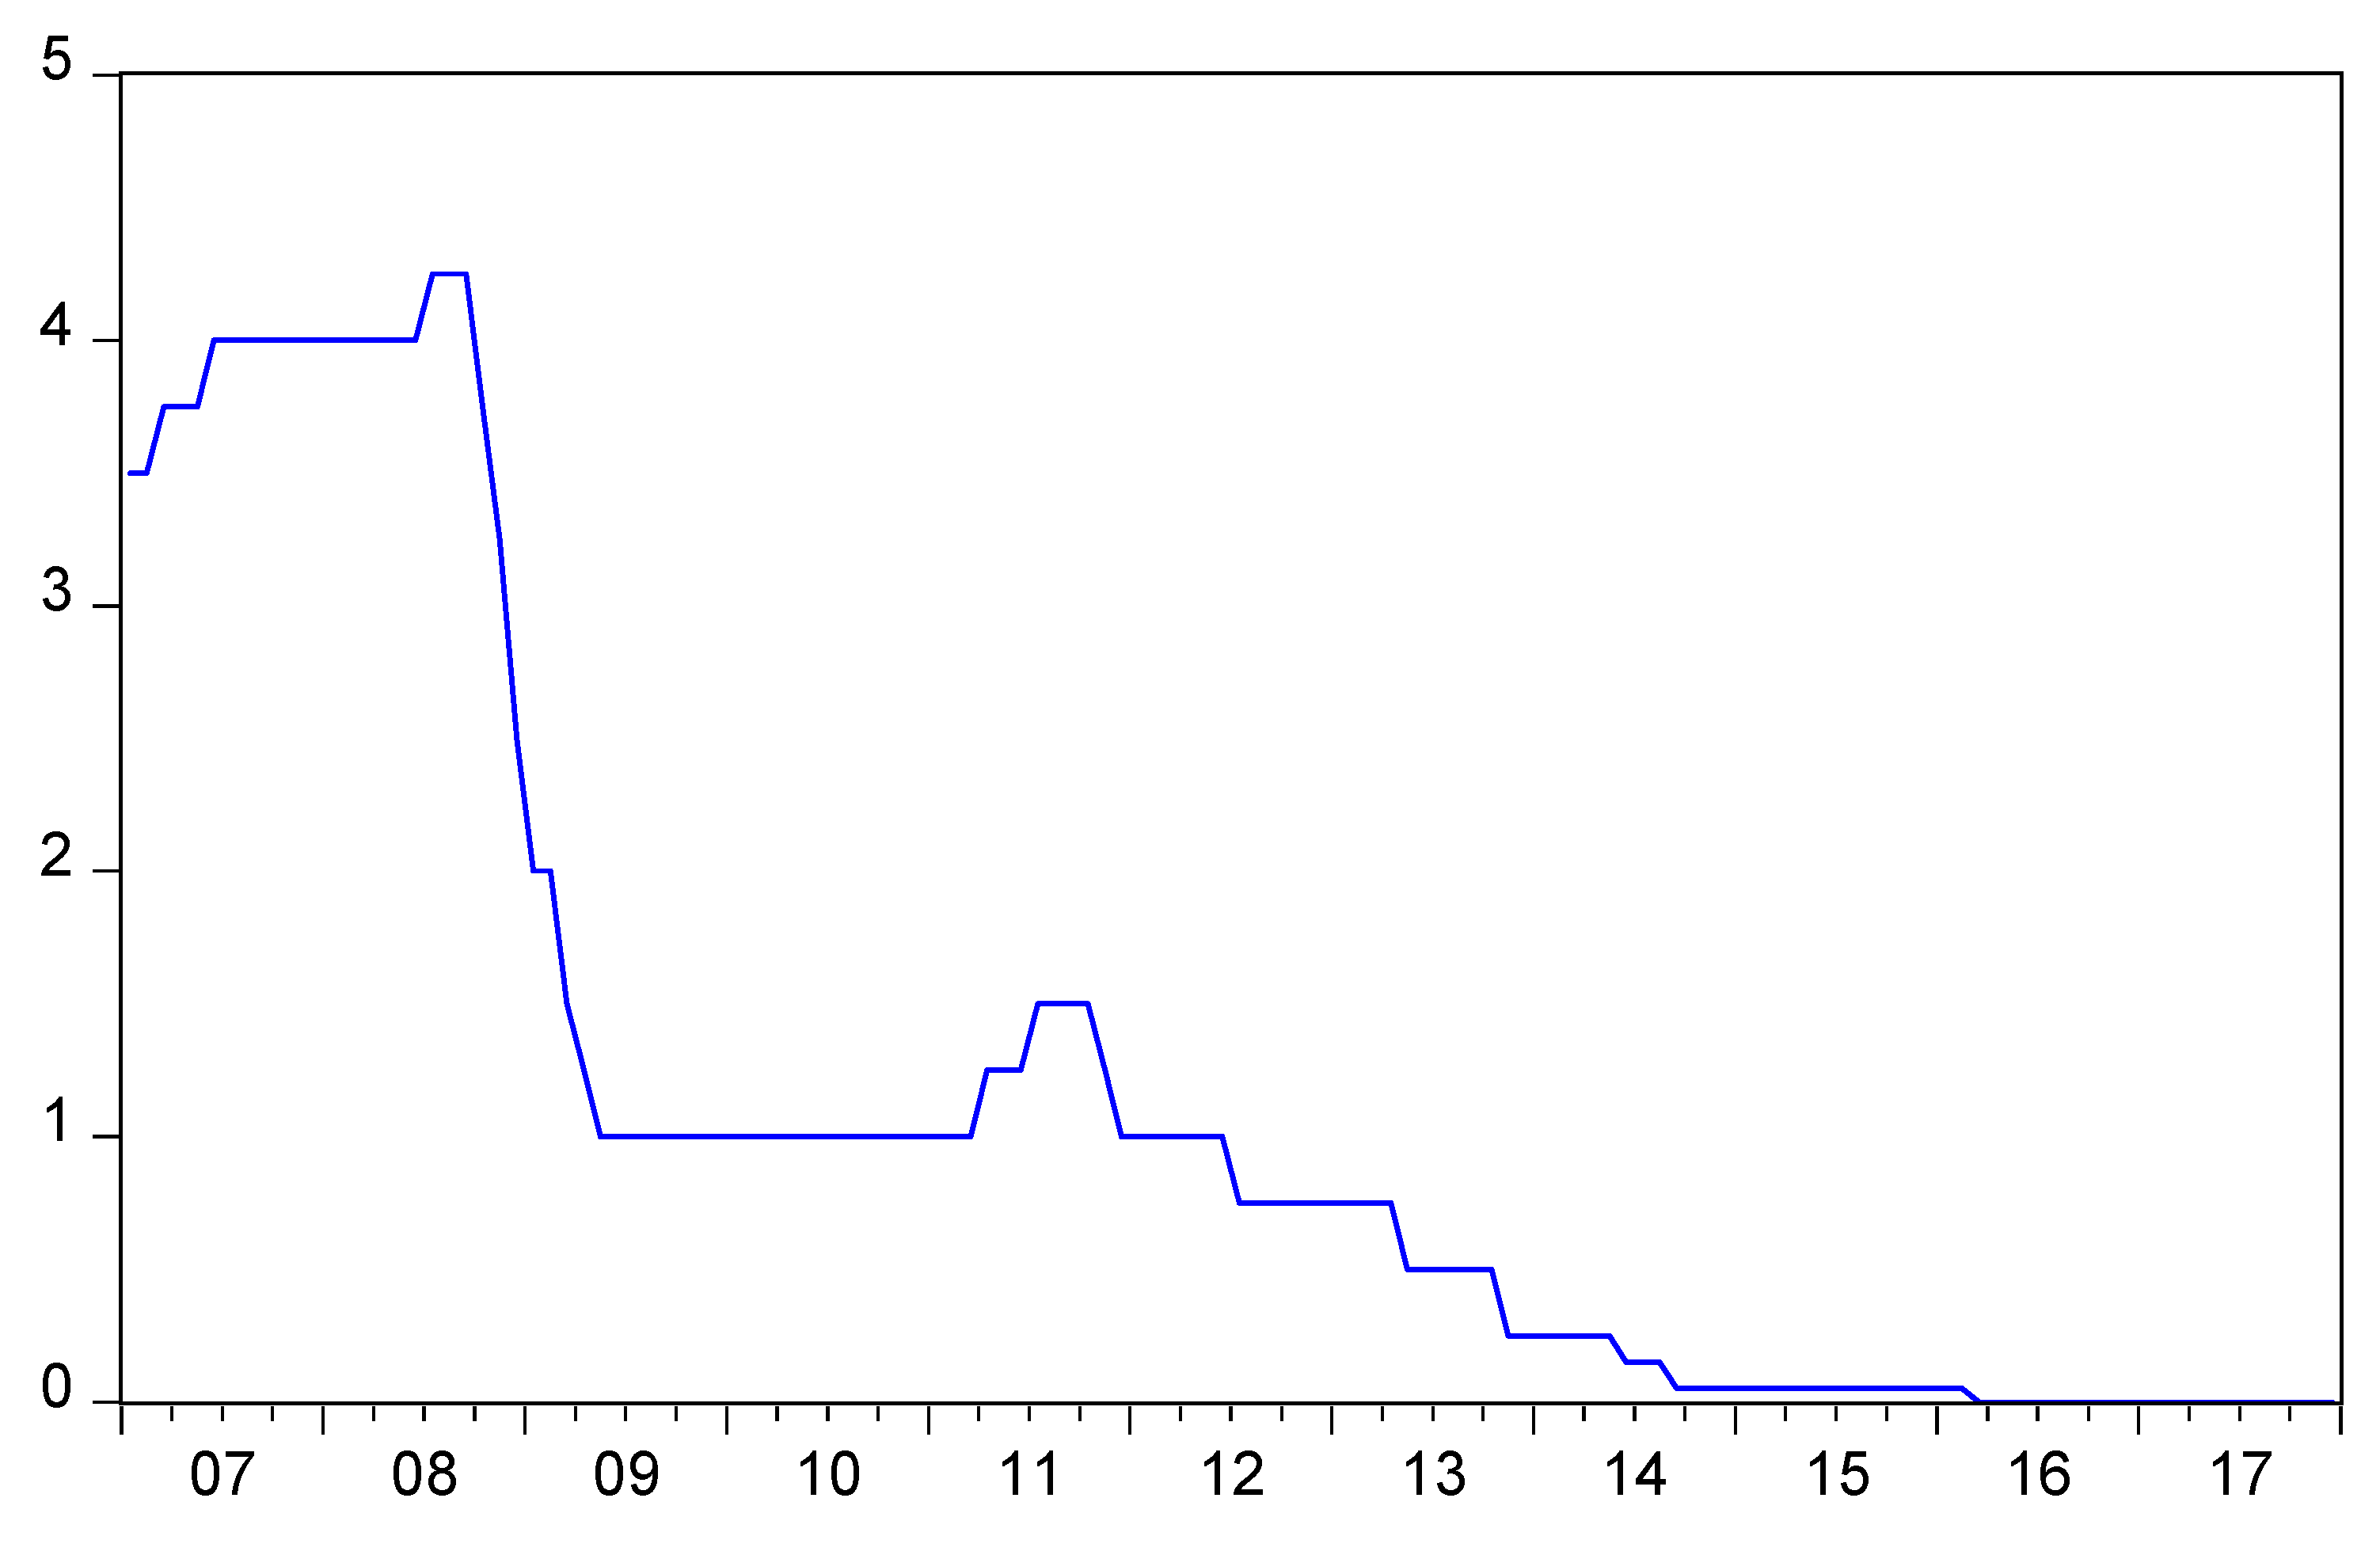
| Date | MRO Rate Change |
|---|---|
| 8 October 2008 | −0.5 |
| 6 November 2008 | −0.5 |
| 4 December 2008 | −0.75 |
| 15 January2009 | −0.5 |
| 5 March 2009 | −0.5 |
| 2 April 2009 | −0.25 |
| 7 May 2009 | −0.25 |
| 3 November 2011 | −0.25 |
| 8 December 2011 | −0.25 |
| 5 July 2012 | −0.25 |
| 2 May 2013 | −0.25 |
| 7 November 2013 | −0.25 |
| 5 June 2014 | −0.1 |
| 4 September 2014 | −0.1 |
| 10 March 2016 | −0.05 |
| Date | Description |
|---|---|
| 22 August 2007 | Supplementary LTROs |
| 28 March 2008 | 6 month Supplementary LTROs |
| 7 May 2009 | One year LTROs and purchases of covered bonds |
| 4 June 2009 | Details for CBPP1 |
| 3 December 2009 | LTROs enhancement |
| 4 March 2010 | LTROs enhancement |
| 10 May 2010 | SMP and other liquidity measures |
| 3 March 2011 | Fixed-rate full allotment procedure for MROs and LTROs |
| 4 August 2011 | 6-month Supplementary LTROs at fixed rate full allotment procedure and other measures |
| 6 October 2011 | CBPP2 and 12-month Supplementary LTROs launched |
| 8 December 2011 | Two 3-year LTROs and other measures |
| 9 February 2012 | Approval of National credit claims criteria |
| 26 July 2012 | Draghi’s speech “whatever it takes” |
| 2 August 2012 | Outright open market transactions (OMT) |
| 6 September 2012 | Details for OMT |
| 22 March 2013 | Collateral rule amendments |
| 5 June 014 | Targeted LTROs launched and other measures |
| 3 July 2014 | Details for first series of T-LTROs |
| 4 September 2014 | CBPP3 and ABSPP |
| 22 January 2015 | Expanded Asset Purchase Programme (APP) and other measures |
| 5 March 2015 | Public Sector Purchase Programme details |
| 23 September 2015 | ECB adjusts purchase process in ABSPP |
| 9 November 2015 | ECB increases the PSPP share limit |
| 3 December 2015 | Extension of APP until the end of March 2017. |
| 10 March 2016 | ECB’s decision to increase monthly purchases under APP, to launch second series of Targeted LTROs and Corporate Sector PP |
| 21 April 2016 | Details for CSPP |
| 3 May 2016 | Legal acts for the second series of T-LTROs |
| 2 June 2016 | The Eurosystem will start making purchases under CSPP |
| 8 December 2016 | ECB’s decision to continue net asset purchases at a monthly pace of €60 billion until the end of December 2017, starting from April 2017. |
| 26 October 2017 | ECB’s decision to continue net asset purchases at a monthly pace of €30 billion until the end of September 2018, starting from January 2018 |
| Country | Mean | Median | Max | Min | Std. Dev. |
|---|---|---|---|---|---|
| Belgium | 0.019080 | 0.018373 | 0.058927 | −0.017293 | 0.014168 |
| France | 0.012979 | 0.011884 | 0.040416 | −0.007963 | 0.010429 |
| Germany | 0.014695 | 0.015350 | 0.033784 | −0.006501 | 0.009544 |
| Greece | 0.013880 | 0.010462 | 0.056552 | −0.028560 | 0.021675 |
| Italy | 0.015477 | 0.014078 | 0.042529 | −0.005076 | 0.012854 |
| Netherlands | 0.014092 | 0.014117 | 0.033742 | −0.006702 | 0.010678 |
| Portugal | 0.013530 | 0.010743 | 0.040464 | −0.017872 | 0.014122 |
| Spain | 0.015184 | 0.018326 | 0.053256 | −0.014574 | 0.017094 |
| All | 0.014865 | 0.014340 | 0.058927 | −0.028560 | 0.014386 |
| 1 | For more information about financial assistance to eurozone peripheral countries, see https://www.esm.europa.eu/, accessed on 3 December 2021. |
| 2 | For more details about the ECB’s non-standard monetary policy measures in response to the financial and sovereign debt crisis see Cour-Thiman and Winkler (2013). |
| 3 | See Falagiarda and Reitz (2015) for details on the ECB’s securities holdings under the SMP. |
| 4 | For details about APP, see European Central Bank (2015, 2019), Economic Bulletin, issue 7, 2015 and issue 2, 2019. |
| 5 | |
| 6 | |
| 7 | The higher cross-correlation, in absolute value, was 0.2633, between inflation rate and first difference of the economic sentiment indicator. |
| 8 | For example, L = −2 means two periods (months) lagged. |
| 9 | Many researchers used the same econometrical approach to study this topic (see among others, Fiordelisi and Ricci 2016; Fiordelisi and Galloppo 2018; Pacicco et al. 2019; Fasas et al. 2021). |
| 10 | The dummy variable UNC is displayed with two lags, UNC(−2) in models for the full country sample, and peripheral countries only in comparison with the corresponding models for core countries. |
| 11 | See Boeckx et al. (2017) for the effectiveness of ECB’s balance sheet policies. |
References
- Altavilla, Carlo, Domenico Giannone, and Michele Lenza. 2016. The financial and macroeconomic effects of OMT announcements. International Journal of Central Banking 12: 29–57. [Google Scholar] [CrossRef]
- Baker, Malcolm, and Jeremy Stein. 2004. Market liquidity as a sentiment indicator. Journal of Financial Markets 7: 271–99. [Google Scholar] [CrossRef] [Green Version]
- Bakshi, Gurdip, and Zhiwu Chen. 1996. Inflation, Asset Prices, and the Term Structure of Interest Rates in Monetary Economies. Review of Financial Studies 9: 241–75. [Google Scholar] [CrossRef]
- Barsky, Robert, and Eric Sims. 2012. Information, animal spirits, and the meaning of innovations in consumer confidence. American Economic Review 102: 1343–77. [Google Scholar] [CrossRef] [Green Version]
- Beck, Nathaniel, and Jonathan Katz. 1995. What to do (and not to do) with time series cross section data. American Political Science Review 89: 634–47. [Google Scholar] [CrossRef]
- Bernanke, Ben S., and Kenneth N. Kuttner. 2005. What explains the stock market’s reaction to Federal Reserve policy? Journal of Finance 60: 1221–57. [Google Scholar] [CrossRef] [Green Version]
- Boeckx, Jef, Maarten Dossche, and Gert Peersman. 2017. Effectiveness and transmission of the ECB’s balance sheet policies. International Journal of Central Banking 13: 297–333. [Google Scholar] [CrossRef]
- Bohl, Martin, Pierre Siklos, and David Sondermann. 2008. European stock markets and the ECB’s monetary policy surprises. International Finance 11: 117–30. [Google Scholar] [CrossRef]
- Bredin, Don, Stuart Hyde, Dirk Nitzsche, and Gerard O’Reilly. 2009. European monetary policy surprises: The aggregate and sectoral stock market response. International Journal of Finance & Economics 14: 156–71. [Google Scholar]
- Brown, Gregory, and Michael Cliff. 2004. Investor sentiment and the near-term stock market. Journal of Empirical Finance 11: 1–27. [Google Scholar] [CrossRef]
- Carroll, Christopher, Jeffrey Fuhrer, and David Wilcox. 1994. Does consumer sentiment forecast household spending? If so, Why? American. Economic Review 84: 1397–408. [Google Scholar]
- Chebbi, Tarek. 2019. What does unconventional monetary policy do to stock markets in the euro area? International Journal of Financial Economics 24: 391–411. [Google Scholar] [CrossRef] [Green Version]
- Choi, Jongmoo Jay, Shmuel Hauser, and Kenneth Kopecky. 1999. Does the stock market predict real activity? Time series evidence from the G-7 countries. Journal of Banking and Finance 23: 1771–92. [Google Scholar] [CrossRef] [Green Version]
- Choudry, Taufiq. 2001. Inflation and rates of return on stocks: Evidence from high inflation countries. Journal of International Financial Markets, Institutions and Money 11: 75–96. [Google Scholar] [CrossRef]
- Cour-Thiman, Philippe, and Bernhard Winkler. 2013. The ECB’s Non-Standard Monetary Policy Measures. The Roll of Institutional Factors and Finance Structure. ECB Working Paper Series 1528. Frankfurt am Main: European Central Bank. [Google Scholar]
- Dahmene, Meriam, Adel Boughrara, and Skander Slim. 2021. Nonlinearity in stock returns: Do risk aversion, investor sentiment and monetary policy shocks matter? International Review of Economics and Finance 71: 676–99. [Google Scholar] [CrossRef]
- Ehrmann, Michael, and Marcel Fratzscher. 2004. Taking stock: Monetary policy transmission to equity markets. Journal of Money, Credit, and Banking 36: 719–37. [Google Scholar] [CrossRef] [Green Version]
- European Central Bank. 2015. The Transmission of the ECB’s Recent Non-Standard Monetary Policy Measures. ECB Article, Economic Bulletin, Issue 7. Frankfurt am Main: European Central Bank, pp. 32–51. [Google Scholar]
- European Central Bank. 2019. Taking Stock of the Eurosystem’s Asset Purchase Programme after the End of Net Asset Purchases. ECB Article, Economic Bulletin, Issue 2. Frankfurt am Main: European Central Bank, pp. 69–92. [Google Scholar]
- Falagiarda, Matteo, and Stefan Reitz. 2015. Announcements of ECB unconventional programs: Implications for the sovereign spreads of stressed euro area countries. Journal of International Money and Finance 53: 276–95. [Google Scholar] [CrossRef]
- Falagiarda, Matteo, Peter McQuade, and Marcel Tirpak. 2015. Spillovers from the ECB’s Non-Standard Monetary Policies on Non-Euro Area E.U. Countries: Evidence from an Event Study Analysis. ECB Working Paper Series 1869; Frankfurt am Main: European Central Bank. [Google Scholar]
- Fama, Eugene F. 1981. Stock returns, real activity, Inflation and money. American Economic Review 71: 545–65. [Google Scholar]
- Fama, Eugene F. 1990. Stock returns, expected returns, and real activity. Journal of Finance 45: 1089–108. [Google Scholar] [CrossRef]
- Fama, Eugene F., and William Schwert. 1977. Asset returns and Inflation. Journal of Business 55: 201–31. [Google Scholar] [CrossRef]
- Fasas, Athanasios, Dimitris Kenourgios, and Stephanos Papadamou. 2021. U.S. unconventional monetary policy and risk tolerance in major currency markets. The European Journal of Finance 27: 994–1008. [Google Scholar] [CrossRef]
- Fausch, Jurg, and Markus Sigonius. 2018. The impact of ECB monetary policy surprises on the german stock market. Journal of Macroeconomic 55: 46–63. [Google Scholar] [CrossRef]
- Fiordelisi, Franco, and Giussepe Galloppo. 2018. Stock market reaction to policy interventions. The European Journal of Finance 24: 1817–34. [Google Scholar] [CrossRef] [Green Version]
- Fiordelisi, Franco, and Ornella Ricci. 2016. “Whatever it takes” An empirical assessment of the value of policy actions in banking. Review of Finance 20: 2321–47. [Google Scholar] [CrossRef] [Green Version]
- Fiordelisi, Franco, Giuseppe Galloppo, and Ornella Ricci. 2014. The effect of monetary policy interventions on interbank markets, equity indices and G-SIFIs during financial crisis. Journal of Financial Stability 11: 49–61. [Google Scholar] [CrossRef]
- Fiorelli, Cristiana, and Valentina Meliciani. 2019. Economic growth in the era of unconventional monetary instruments: A FAVAR approach. Journal of Macroeconomics 62: 1–20. [Google Scholar] [CrossRef]
- Fisher, Kenneth, and Meir Statman. 2003. Consumer confidence and stock returns. Journal of Portfolio Management 30: 115–27. [Google Scholar] [CrossRef]
- Fratzscher, Marcel, Marco Lo Duca, and Roland Straub. 2014. ECB unconventional monetary policy actions: Market impact, international spillovers and transmission channels. Paper presented at 15th Jacques Polak Annual Research Conference, Washington, DC, USA, November 13–14. [Google Scholar]
- Georgiadis, Georgios, and Johannes Gräb. 2016. Global financial market impact of the announcement of the ECB’s asset purchase programme. Journal of Financial Stability 26: 257–65. [Google Scholar] [CrossRef]
- Graham, Fred. 1996. Inflation, real stock returns, and monetary policy. Applied Financial Economics 6: 29–35. [Google Scholar] [CrossRef]
- Haitsma, Reinder, Deren Unlamis, and Jacob de Haan. 2016. The impact of the ECB’s conventional and unconventional monetary policies on stock markets. Journal of Macroeconomics 48: 101–16. [Google Scholar] [CrossRef]
- Hau, Harald, and Sandy Lai. 2016. Asset allocation and monetary policy: Evidence from the Eurozone. Journal of Financial Economics 120: 309–29. [Google Scholar] [CrossRef] [Green Version]
- Ho, Jerry Chienwe, and Chi-Hsiou Hung. 2012. Predicting stock market returns and volatility with investor sentiment: Evidence from eight developed countries. Journal of Accounting and Finance 12: 49–65. [Google Scholar] [CrossRef] [Green Version]
- Im, Kyung So, Hanslem Pesaran, and Yongcheol Shin. 2003. Testing for unit roots in heterogeneous panels. Journal of Econometrics 115: 53–74. [Google Scholar] [CrossRef]
- Jäger, Jannik, and Theocharis Grigoriadis. 2017. The effectiveness of the ecb’s unconventional monetary policy: Comparative evidence from crisis and non-crisis euro-area countries. Journal of International Money and Finance 78: 21–43. [Google Scholar] [CrossRef]
- Jansen, W. Jos, and Niek Nahius. 2003. The stock market and consumer confidence: European evidence. Economics Letters 79: 89–98. [Google Scholar] [CrossRef] [Green Version]
- Jensen, Gerald, and Jeffrey Mercer. 2002. Monetary policy and the cross section of expected stock returns. The Journal of financial Research 25: 125–39. [Google Scholar] [CrossRef]
- Kilponen, Juha, Helina Laakkonen, and Jouko Vilmunen. 2015. Sovereign risk, European crisis, resolution policies, and bond spreads. International Journal of Central Banking 11: 285–323. [Google Scholar]
- Lemmon, Michael, and Evgenia Portniaguina. 2006. Consumer confidence and asset prices: Some empirical evidence. Review of Financial Studies 19: 1499–529. [Google Scholar] [CrossRef]
- Martins, Luis Felipe, Joana Batista, and Alexandra Ferreira-Lopes. 2019. Unconventional monetary policies and bank credit in the Eurozone: An events study approach. International Journal of Finance and Economics 24: 1210–24. [Google Scholar] [CrossRef]
- Mauro, Paolo. 2003. Stock returns and output growth in emerging and advanced economies. Journal of Development Economics 71: 129–53. [Google Scholar] [CrossRef]
- Mishkin, Frederic. 2001. The Transmission Mechanism and the Role of Asset Prices in Monetary Policy. Working Paper 8617. Cambridge: National Bureau of Economic Research. [Google Scholar]
- Moder, Isabella. 2019. Spillovers from the ECB’s non standard monetary policy measures on southeastern Europe. International Journal of Central Banking 15: 127163. [Google Scholar]
- Pacicco, Fausto, Luigi Vena, and Andrea Venegoni. 2019. Market reactions to ECB policy innovations: A cross-country analysis. Journal of International Money and Finance 91: 126–37. [Google Scholar] [CrossRef] [Green Version]
- Patelis, Alex D. 1997. Stock return predictability and the role of monetary policy. Journal of Finance 52: 1951–72. [Google Scholar] [CrossRef]
- Ricci, Ornella. 2015. The impact of monetary policy announcements on the stock price of large European banks during the financial crisis. Journal of Banking and Finance 52: 245–55. [Google Scholar] [CrossRef]
- Ridogon, Roberto, and Brian Sack. 2004. The impact of monetary policy on asset prices. Journal of Monetary Economics 51: 1553–75. [Google Scholar]
- Rogers, John H., Chiara Scotti, and Jonathan H. Wright. 2014. Evaluating asset-market effects of unconventional monetary policy: A multi-country review. Economic Policy 29: 749–99. [Google Scholar] [CrossRef]
- Schwert, William. 1990. Stock returns and real activity: A century of evidence. Journal of Finance 45: 1237–57. [Google Scholar] [CrossRef]
- Sellin, Peter. 2001. Monetary policy and stock market: Theory and empirical evidence. Journal of Economic Surveys 15: 491–541. [Google Scholar] [CrossRef]
- Stambaugh, Robert, Jianfeng Yu, and Yu Yuan. 2011. The short of it: Investor sentiment and anomalies. Journal of Financial Economics 104: 288–302. [Google Scholar] [CrossRef] [Green Version]
- Thorbecke, Willem. 1997. On stock market returns and monetary policy. Journal of Finance 52: 635–54. [Google Scholar] [CrossRef]
- Tobin, James. 1978. Monetary policy and the economy: The transmission mechanism. Southern Economic Journal 44: 421–31. [Google Scholar] [CrossRef]
- Trebesch, Christoph, and Jeromin Zettelmeyer. 2014. ECB Interventions in Distressed Sovereign Debt Markets: The Case of Greek Bonds. Working Paper 4731. Munich: CESifo. [Google Scholar]
- Wooldride, Jeffrey. 2010. Econometric Analysis of Cross Section and Panel Data. Cambridge: MIT Press. [Google Scholar]


| Stock Index | Country |
|---|---|
| BEL 20 | Belgium |
| CAC 40 | France |
| DAX 30 | Germany |
| ASE Comp. | Greece |
| FTSE MIB | Italy |
| AEX | Netherlands |
| PSI 20 | Portugal |
| IBEX 30 | Spain |
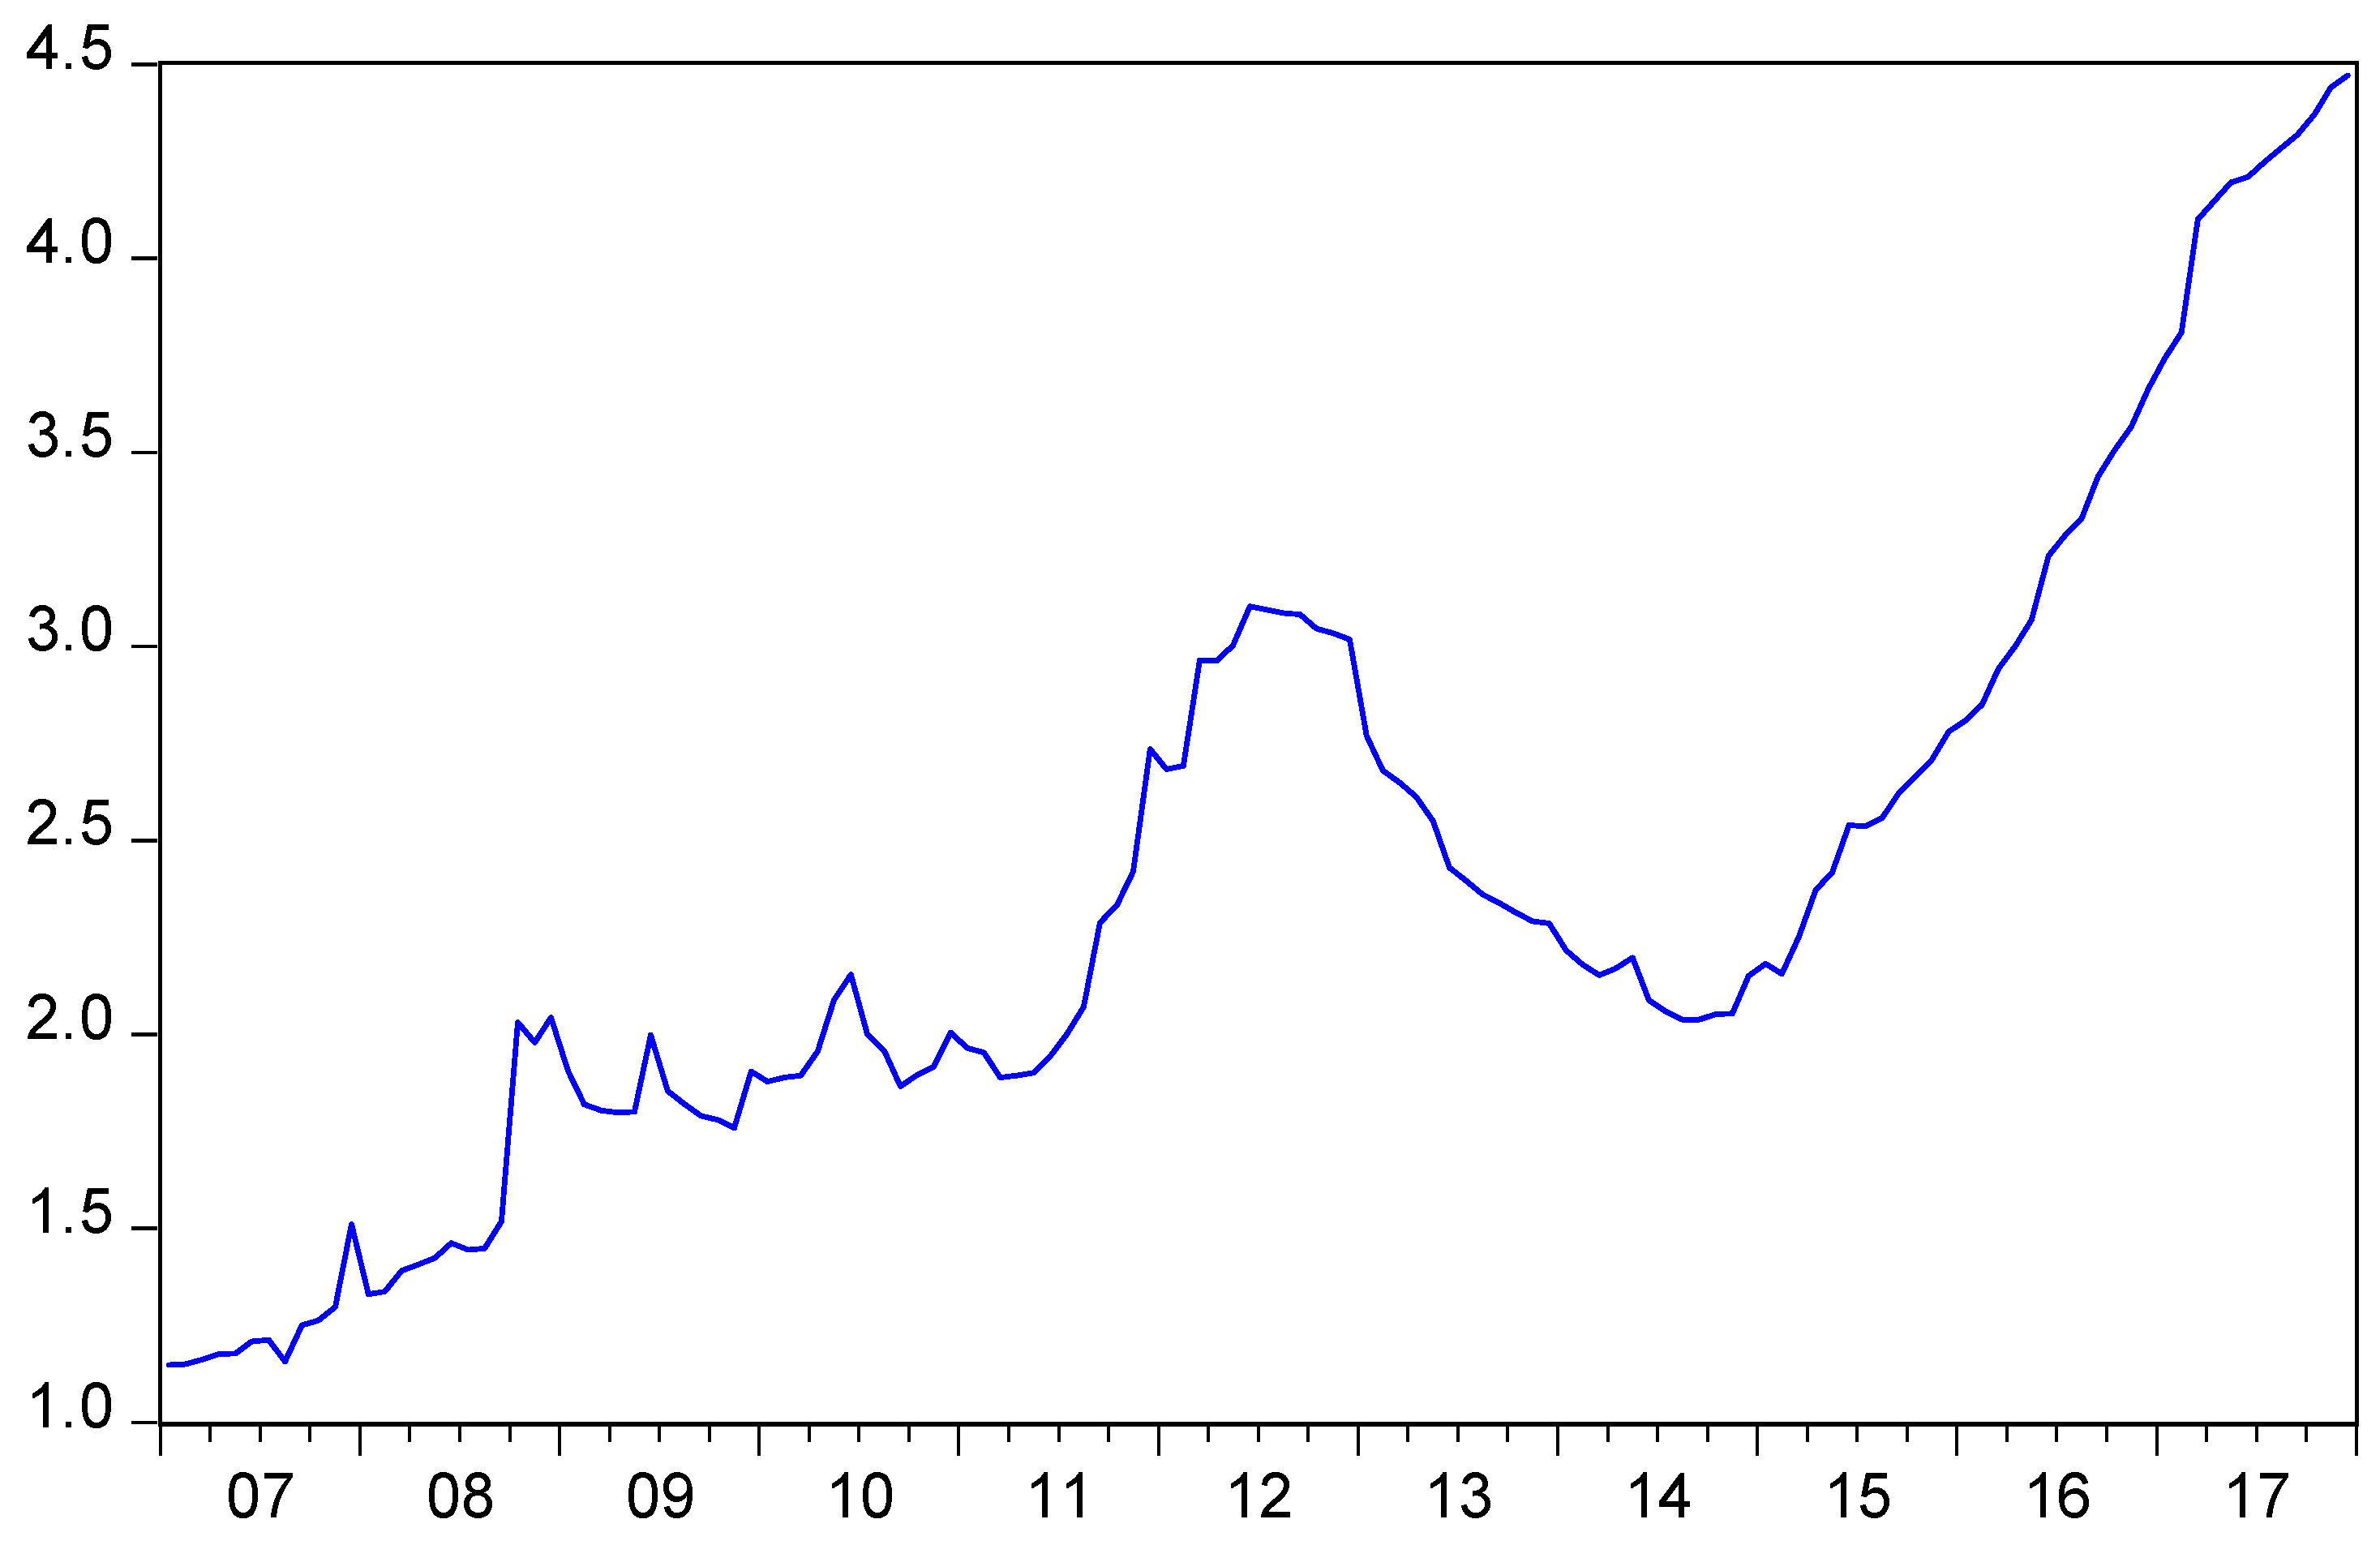
| Variable | Mean | Median | Max | Min | Std. Dev. |
|---|---|---|---|---|---|
| RET | −0.002413 | 0.004244 | 0.198539 | −0.326730 | 0.062535 |
| IPI | −0.000645 | 0.000932 | 0.110244 | −0.096355 | 0.021470 |
| INFL | 0.014865 | 0.014340 | 0.058927 | −0.028560 | 0.014386 |
| ESI | 0.000758 | 0.100 | 8.100 | −10.800 | 2.411.091 |
| Dependent Variable RET | ||||||||
|---|---|---|---|---|---|---|---|---|
| Panel OLS | Random Effects | Fixed Effects | Panel OLS with PCSEs | |||||
| Independent Variables | Coeff. | Std.Error | Coeff. | Std.Error | Coeff. | Std.Error | Coeff. | Std.Error |
| C | 0.001111 | 0.003098 | 0.001111 | 0.003098 | 0.001400 | 0.003111 | 0.001111 | 0.003335 |
| IPI | 0.080181 | 0.088117 | 0.080181 | 0.088115 | 0.066169 | 0.088316 | 0.080181 | 0.096750 |
| INFL | −0.475166 * | 0.136316 | −0.475166 * | 0.136313 | −0.493096 * | 0.137454 | −0.475166 * | 0.155883 |
| IRC(−2) | 0.016715 * | 0.005997 | 0.016715 * | 0.005997 | 0.016487 * | 0.005999 | 0.016715 * | 0.006027 |
| UNC(−2) | 0.006144 | 0.004465 | 0.006144 | 0.004465 | 0.006118 | 0.004465 | 0.006144 | 0.004462 |
| ESI | 0.006674 * | 0.000812 | 0.006674 * | 0.000812 | 0.006669 * | 0.000812 | 0.006674 * | 0.000799 |
| R squared | 10.45% | 10.45% | 11.07% | 10.45% | ||||
| Hausman test RE/FE | 6.518 | |||||||
| LM test for no cross-sectional dependence | 1793.05 * | |||||||
| LR test for cross-sectional heteroskedasticity | 125.14 * | |||||||
| Dependent Variable RET | ||||||||
|---|---|---|---|---|---|---|---|---|
| Panel OLS | Random Effects | Fixed Effects | Panel OLS with PCSEs | |||||
| Independent Variables | Coeff. | Std.Error | Coeff. | Std.Error | Coeff. | Std.Error | Coeff. | Std.Error |
| C | 0.006153 | 0.004016 | 0.006153 | 0.004024 | 0.006442 | 0.004080 | 0.006153 | 0.003991 |
| IPI | 0.182698 | 0.103476 | 0.182698 *** | 0.103682 | 0.179951 *** | 0.103751 | 0.182698 *** | 0.101367 |
| INFL | −0.582786 * | 0.195515 | −0.582786 * | 0.195904 | −0.600562 * | 0.200300 | −0.582786 * | 0.190955 |
| IRC(−2) | 0.013870 ** | 0.006818 | 0.013870 ** | 0.006831 | 0.013752 ** | 0.006836 | 0.013870 ** | 0.006817 |
| UNC(−2) | 0.009806 *** | 0.005087 | 0.009806 *** | 0.005097 | 0.009784 *** | 0.005097 | 0.009806 *** | 0.005087 |
| ESI | 0.006827 * | 0.000942 | 0.006827 * | 0.000943 | 0.006794 * | 0.000945 | 0.006827 * | 0.000915 |
| R squared | 16.92 | 16.92 | 17.07 | 16.92 | ||||
| Hausman test RE/FE | 0.918 | |||||||
| LM test for no cross-sectional dependence | 489.09 * | |||||||
| LR test for cross-sectional heteroskedasticity | 6.61 | |||||||
| Dependent Variable RET | ||||||||
|---|---|---|---|---|---|---|---|---|
| Panel OLS | Random Effects | Fixed Effects | Panel OLS with PCSEs | |||||
| Independent Variables | Coeff. | Std.Error | Coeff. | Std.Error | Coeff. | Std.Error | Coeff. | Std.Error |
| C | −0.002543 | 0.004740 | −0.002543 | 0.004747 | −0.002430 | 0.004750 | −0.002543 | 0.004938 |
| IPI | −0.035462 | 0.141639 | −0.035462 | 0.141863 | −0.040430 | 0.141950 | −0.035462 | 0.159566 |
| INFL | −0.456559 ** | 0.192437 | −0.456559 ** | 0.192742 | −0.464099 ** | 0.192991 | −0.456559 ** | 0.211265 |
| IRC(−2) | 0.019174 *** | 0.009866 | 0.019174 *** | 0.009882 | 0.019093 *** | 0.009882 | 0.019174 *** | 0.009937 |
| UNC(−2) | 0.001584 | 0.007364 | 0.001584 | 0.007376 | 0.001570 | 0.007376 | 0.001584 | 0.007348 |
| ESI | 0.006348 * | 0.001326 | 0.006348 * | 0.001328 | 0.006348 * | 0.001328 | 0.006348 * | 0.001296 |
| R squared | 7.55 | 7.55 | 7.80 | 7.55 | ||||
| Hausman test RE/FE | 0.00 | |||||||
| LM test for no cross-sectional dependence | 386.04 * | |||||||
| LR test for cross-sectional heteroskedasticity | 49.19 * | |||||||
| Dependent Variable RET | ||||||
|---|---|---|---|---|---|---|
| Instrument Specification: C IPI INFL IRC(−2) UNC(−2) INDU | ||||||
| Full Country Sample | Core Countries | Peripheral Countries | ||||
| Independent Variables | Coeff. | Std.Error | Coeff. | Std.Error | Coeff. | Std.Error |
| C | 0.000226 | 0.003390 | 0.006426 | 0.004027 | −0.003745 | 0.005021 |
| IPI | 0.071168 | 0.097086 | 0.193015 *** | 0.100187 | −0.046648 | 0.159609 |
| INFL | −0.423797 * | 0.159545 | −0.608979 * | 0.194946 | −0.394386 *** | 0.216272 |
| IRC(−2) | 0.017358 * | 0.006034 | 0.013941 ** | 0.006748 | 0.020075 ** | 0.009959 |
| UNC(−2) | 0.006247 | 0.004470 | 0.009759 *** | 0.005023 | 0.002079 | 0.007379 |
| ESI | 0.007769 * | 0.001099 | 0.006875 * | 0.001145 | 0.008080 * | 0.001835 |
| R squared | 10.29 | 17.92 | 7.24 | |||
Publisher’s Note: MDPI stays neutral with regard to jurisdictional claims in published maps and institutional affiliations. |
© 2022 by the authors. Licensee MDPI, Basel, Switzerland. This article is an open access article distributed under the terms and conditions of the Creative Commons Attribution (CC BY) license (https://creativecommons.org/licenses/by/4.0/).
Share and Cite
Petrakis, N.; Lemonakis, C.; Floros, C.; Zopounidis, C. Eurozone Stock Market Reaction to Monetary Policy Interventions and Other Covariates. J. Risk Financial Manag. 2022, 15, 56. https://0-doi-org.brum.beds.ac.uk/10.3390/jrfm15020056
Petrakis N, Lemonakis C, Floros C, Zopounidis C. Eurozone Stock Market Reaction to Monetary Policy Interventions and Other Covariates. Journal of Risk and Financial Management. 2022; 15(2):56. https://0-doi-org.brum.beds.ac.uk/10.3390/jrfm15020056
Chicago/Turabian StylePetrakis, Nikolaos, Christos Lemonakis, Christos Floros, and Constantin Zopounidis. 2022. "Eurozone Stock Market Reaction to Monetary Policy Interventions and Other Covariates" Journal of Risk and Financial Management 15, no. 2: 56. https://0-doi-org.brum.beds.ac.uk/10.3390/jrfm15020056