Article

Do the Underlying Portfolios Matter? A Comparative Study of Equity-Linked Pay-at-Maturity Principal Protected Notes in Canada and the UK

Ted Rogers School of Management, Toronto Metropolitan University, Toronto, ON M5B 2K3, Canada
*
Author to whom correspondence should be addressed.
J. Risk Financial Manag. 2022, 15(10), 462; https://0-doi-org.brum.beds.ac.uk/10.3390/jrfm15100462
Submission received: 17 August 2022 / Revised: 30 September 2022 / Accepted: 30 September 2022 / Published: 14 October 2022

Abstract

:
This study examines the relationship between the return and the holding cost of equity-linked pay-at-maturity principal protected notes (EL-PAM-PPNs) and the mean return and volatility of the underlying portfolio using 1568 EL-PAM-PPNs issued in the UK and Canada between 2003 and 2015. We find that: (i) the underlying portfolio’s mean return decreases the note holding cost; (ii) the underlying portfolio’s volatility increases the note return and decreases the note holding cost; (iii) investors could maximize note return and minimize holding costs by choosing EL-PAM-PPNs prudently. Investors in both countries should purchase notes with higher participation rates, where the underlying portfolio contains a higher number of stocks and lower expected volatility. UK investors should avoid callable notes and choose notes with a longer time to maturity, where payoff is determined by a single observation of the underlying portfolio’s value at maturity. Surprisingly, Canadian investors should choose callable notes and notes with a shorter time to maturity, where payoff is determined by the average of multiple observations of the underlying portfolio’s value over the life of the note. They should also look for notes that include a guaranteed positive return, and where the underlying asset has a higher dividend yield.

1. Introduction

Financial institutions have developed structured products that allow retail investors access to equity, currency, and commodity markets through a payout formula based on the returns of the underlying assets which may be market indices or asset portfolios created by the issuer. These retail structured products can have capital protection that varies from 100% (principal protected) to 0% (principal at risk). The structured product return can be a simple percentage of the underlying portfolio’s returns over the term of the product or can be calculated using multiple option payoffs based on the underlying portfolio’s return over the term of the product as specified in the information documents. The complexity of these products’ payoff functions and their highly customizable features make it extremely difficult for retail investors to assess and compare the return across various categories of structured products. The features of the structured products are determined by the issuer, usually a financial institution.
Previous studies, Stoimenov and Wilkens (2005); Krein (2007); Bertrand and Prigent (2015); Burth et al. (2001); and Deng et al. (2014), have shown that there is a substantial overpricing of structured products in different countries including Germany, France, Switzerland, and the United States. The overpricing is related to product complexity (Stoimenov and Wilkens 2005), market transparency (Rathgeber and Wang 2011), behavioral bias (Wallmeier and Diethelm 2009), and the time horizon (Milevsky and Kim 1997).
The structured product markets in both Canada and the UK have developed substantially since the year 2000 and many financial institutions, including deposit-taking institutions such as banks and credit unions, offer a range of retail structured products with multiple options which allow retail investors to participate in equity, commodity, and currency markets, with and without putting their initial principal at risk. The choice has become so broad and the contracts so complex that some analysts have advised Canadian retail investors to be wary of, or to avoid, investment in equity-linked structured products (Heinzl 2016; Milstead 2016; Roseman 2014).
Despite the significant development of structured product markets in Canada and the UK in the past two decades, little attention has been paid to these two markets. Milevsky and Kim (1997) studied one type of structured product, the index-linked guaranteed investment certificates (ILGICs) offered by banks in Canada. Since then, the market has evolved but there have been no further investigations about Canadian or UK structured products.
Furthermore, while the volume and types of structured products have expanded greatly since 2000, structured products have introduced more features (cap, floor, participation rate, callable, etc.), many of which have not been fully examined in the literature. It is difficult for unsophisticated retail investors to value structured products and to assess the unobserved premiums charged by the issuers. More importantly, the complexity of some products limits the ability of a retail investor to assess the risk, even with adequate information disclosure.
While much attention has been devoted to the complex features of structured products, little has been paid to the underlying portfolios of structured products. To the best of our knowledge, this research is the first comprehensive study that examines the relationship between the return of structured products and the mean return and volatility of the underlying portfolio (e.g., a stock market index or a portfolio of stocks). It is also the first comparative study between the Canadian and the UK markets, given the similar regulatory environment in these two countries, for a special category of structured products—the equity-linked pay-at-maturity principal protected notes (EL-PAM-PPNs)—that analyzes the variables driving the return and holding cost of EL-PAM-PPNs. The findings presented in this paper are of particular interest to: (i) the investors with regard to comparing the EL-PAM-PPN return in a more parametric approach; and (ii) the financial industry regulators with regard to the information disclosure requirements in EL-PAM-PPN markets in order to promote investor protection and market integrity in the overall structured product market.
The rest of this paper is organized as follows: Section 2 outlines the industry background (typology of structured products, regulations) for structured products. Section 3 reviews the related literature, develops two hypotheses, and describes the research design. Section 4 describes the data and presents the summary statistics and empirical results in the Canadian and UK markets. Section 5 concludes.

2. Industry Background

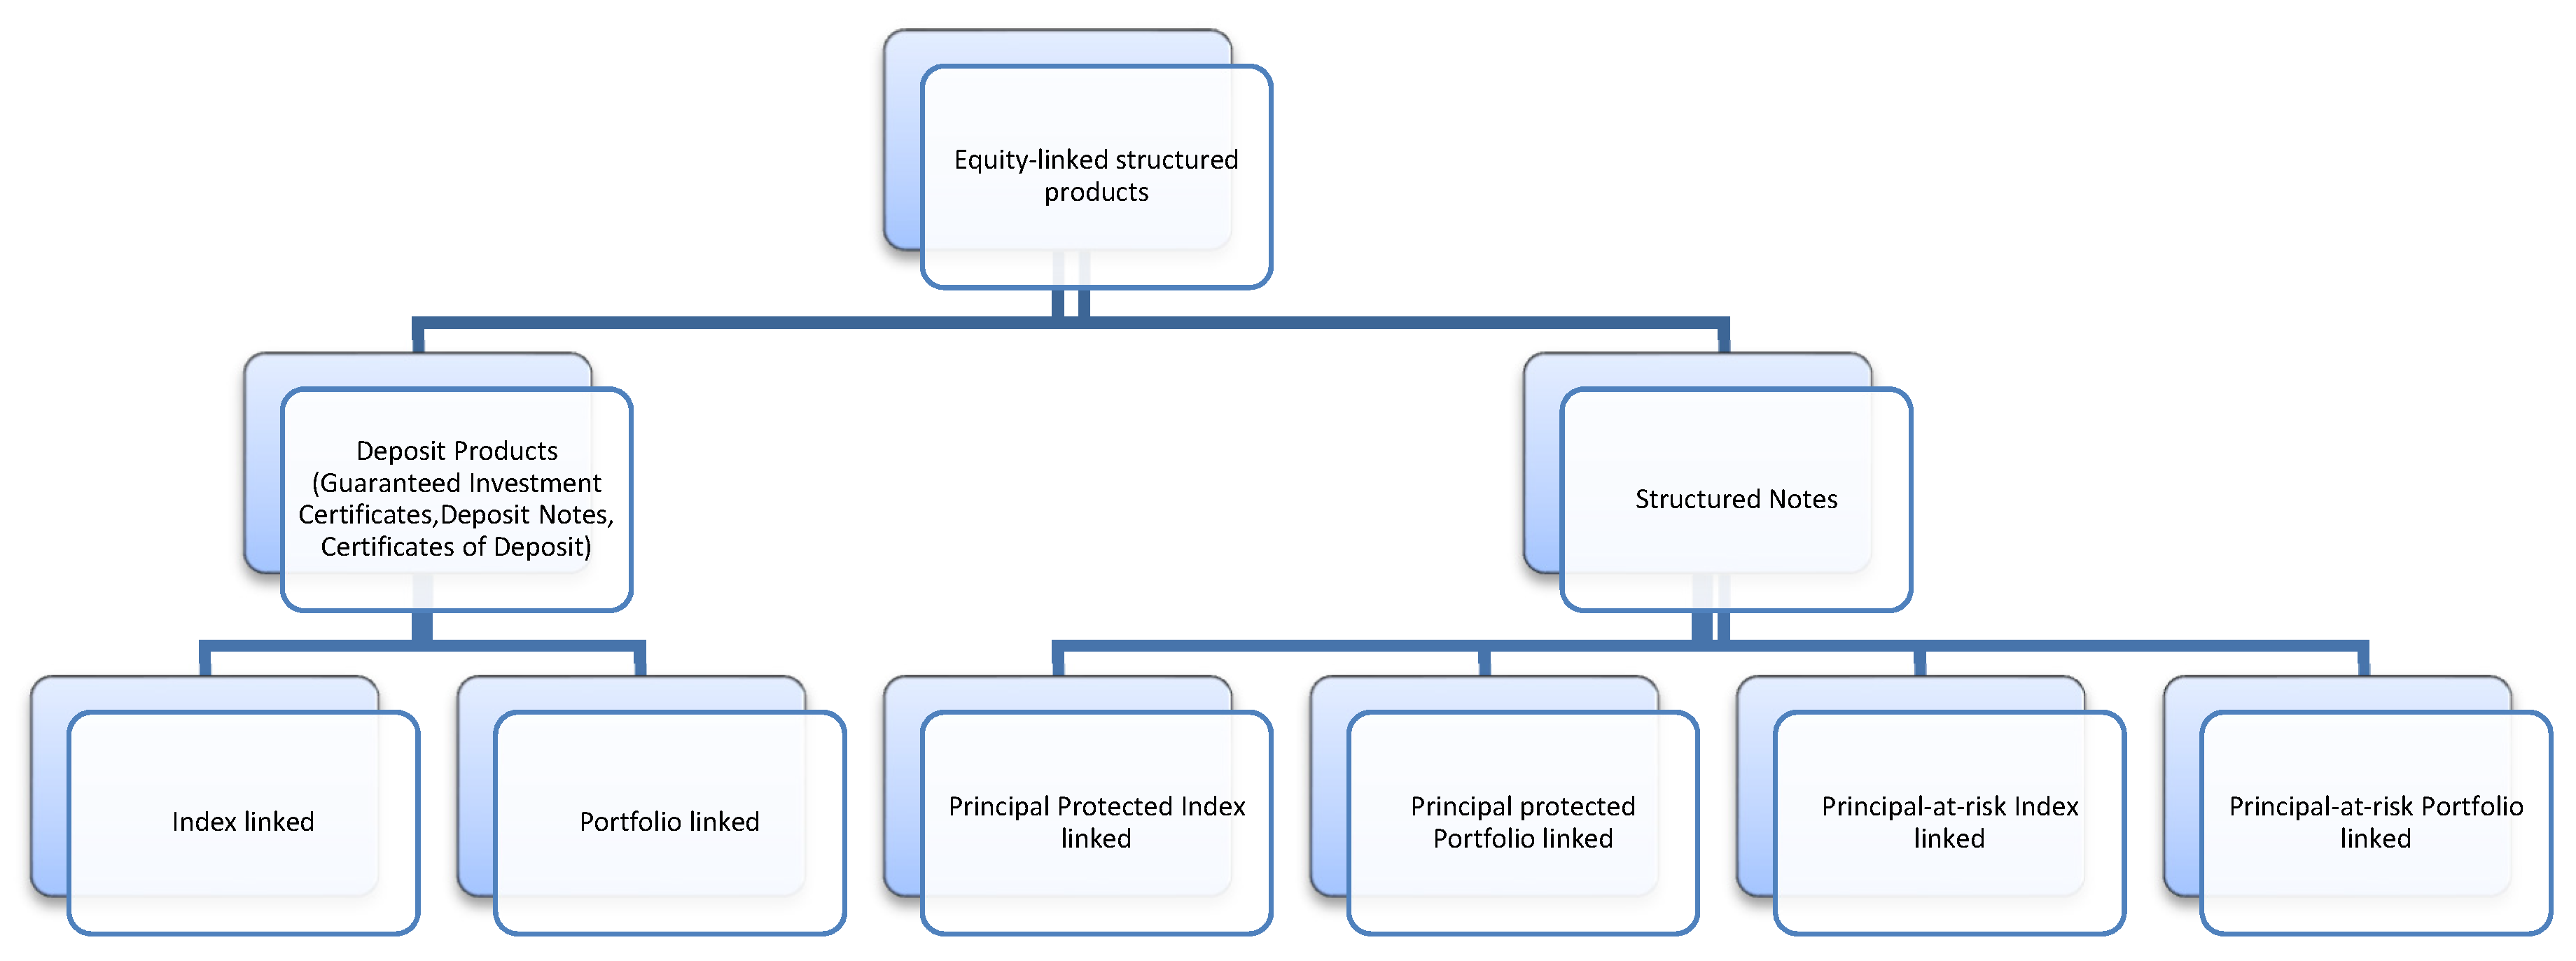
2.1. Typology of Structured Products

Structured notes can have annual payments or one payment made at maturity. The note principal can be protected or at risk. The notes in this study are pay-at-maturity (PAMs) and principal protected notes (PPN). If the principal is protected by the guarantee of the issuing financial institution, they are an investment security with fixed income. If the principal is protected by the guarantee of a government-sponsored deposit insurance corporation, they become a deposit instrument issued by a bank, e.g., certificates of deposit (CDs) in the U.S., guaranteed investment certificates (GICs) in Canada, or deposit notes (DNs) in the UK and Europe. Figure 1 presents a generic typology of equity-linked pay-at-maturity principal protected notes (EL-PAM-PPN) versus principal-at-risk notes (EL-PAM-PRN).

2.2. Regulatory Background

During the 2008 financial crisis, some retail investors in structured products suffered losses as a result of the collapse of a major counterparty: the investment bank Lehman Brothers. Since then, regulators, both government and industry self-regulatory organizations, have been examining the exposure of unsophisticated retail investors to securities with complex payoffs. The focus has been on the appropriateness of structured products for retail investors, the disclosure of information both pre- and post-sale, and the regulation of secondary markets.1
Concerns about global financial stability risk and regulatory arbitrage were raised in 2010 by the Joint Forum, involving insurance, securities, and banking regulators, which is composed of the Basel Committee on Banking Supervision (BCBS), the International Organization of Securities Commissions (IOSCO), and the International Association of Insurance Supervisors (IAS). In 2014, the BCBS issued a report of the Joint Forum that addressed the disclosure required for complex financial products issued by intermediaries in the insurance, securities, and banking industries.
Structured products that are manufactured and distributed by financial institutions are subject to the securities regulations in each jurisdiction where they are offered for sale. In January 2013, the IOSCO addressed complex financial products and recommended distinguishing between retail and non-retail customers. In December 2013, the IOSCO provided a toolkit with fifteen regulatory tools relating specifically to retail structured products which addressed investor suitability and disclosure pre-sale and post-sale. The application of these tools differs by country based on whether there are national regulators such as the U.S. Securities and Exchange Commission (SEC) or the UK Financial Conduct Authority (FCA), provincial securities regulators such as in Canada, or a trans-national regulator such as the European Securities and Markets Authority (ESMA) that governs the issuance of structured products in the European Union (EU).

2.3. The UK Regulatory Framework

Financial institutions in the UK issue both deposit notes and non-deposit structured notes. In the event of the bankruptcy of an issuer, the deposit notes are protected by deposit insurance coverage under the Financial Services Compensation Scheme (FSCS). The institutions eligible for the FSCS are regulated by the Financial Conduct Authority (FCA), with a mandate to protect consumers, and the Prudential Regulation Authority (PRA), which supervises financial institutions. Both are the responsibility of the Bank of England.2
Non-deposit structured notes are investment-type products that are not insured by deposit insurance, and are governed by securities regulations set by the Financial Conduct Authority (FCA) in the UK. Since UK companies issue retail structured products in the European Union (EU), the UK Structured Products Association (UKSPA) is an associate member of the European Structured Investment Products Association (EUSIPA), a non-profit industry umbrella organization that provides the framework for categorization and disclosure of retail structured investment products in order to support market development for retail structured products in Europe. EUSIPA member associations include Austria, France, Germany, Italy, Sweden, Switzerland, The Netherlands, and Belgium. The goal of EUSIPA is to make structured products transparent and understandable for the retail investor. To achieve this goal, EUSIPA member countries agree to follow similar product categorizations which are outlined in the EUSIPA Derivative Map. This derivative map provides comparability between products in member countries and the provision of secondary trading, both over-the-counter (OTC) and exchange trading. EUSIPA’s regulatory focus is on the development of the ability to trade structured notes for the retail investor.
In 2013, the International Organization of Securities Commissions (IOSCO) published two reports related to retail sales of structured products: Suitability Requirements with respect to the Distribution of Complex Financial Products on 21 January 2013, and Regulation of Retail Structured Products on 20 December 2013.3 After much discussion and several postponements, new European regulations for key information documents (KIDs) related to packaged retail and insurance-based products (PRIIPS) came into effect in 2018.
KIDs require manufacturers of PRIIPS to provide key information documents that allow retail investors to compare product offerings from different issuers as well as across countries. From 2014 to December 2017, the UKSPA provided a Risk Rating for Structured Products for use by the industry.4 As of January, 2018, the regulation of KIDs for PRIIPs issued in the European Union and in the UK require a risk rating and a UKSPA classification by sector. The risk rating is currently calculated by Structured Edge, a UK consulting firm based on the European Commission PRIIP rating system.5
The PRIIP regulations mandate that the KIDs provided to investors be transparent and allow for comparison between products. The summary provided by the European Commission indicates that the KIDs ”should be a maximum of 3 pages and provide clear information on investment products.“6 Additionally, KIDS should include the following information:
  • The name of the product and the identity of the producer;
  • The types of investors for whom it is intended;
  • The risk and reward profile of the product, which includes a summary risk indicator, the possible maximum loss of invested capital, and appropriate performance scenarios of the products;
  • The costs investors have to bear when investing in the product;
  • Information about how and to whom an investor can make a complaint in case there is a problem with the product of the person producing, advising on, or selling the product.

2.4. The Canadian Regulatory Framework for Principal Protected Notes

Canadian regulation on principal protected notes covers both deposit-based GICs and structured notes.7 Canadian securities regulators participate in IOSCO, and banking regulators are active participants in the Basel Committee on Banking Supervision (BCBS) and so had an opportunity to contribute to the 2013 and 2014 reports (IOSCO 2013a, 2013b; BCBS 2014) noted previously. However, Canada has yet to update its regulations to equal the disclosure requirements of KIDs for PRIIPs in the UK and Europe.
From 1 June 2009, principal protected notes regulations (SOR/2008-180)8 govern the sale of PPNs by federally regulated financial institutions (FRFIs) in Canada. The legislation defines a PPN as follows:
“Principal protected note means a financial instrument that is issued in Canada by an institution to an investor and that
(a) 
provides for one or more payments to be made by the institution that is determined, in whole or in part, by reference to an index or reference point, including (i) the market price of a security, commodity, investment fund or other financial instrument, and (ii) the exchange rate between any two currencies;
and
(b) 
provides that the principal amount that the institution is obligated to repay at or before the note’s maturity is equal to or more than the total paid by the investor for the note.”
Most of the issuers of PPNs in Canada are banks which market and distribute the products through their websites and branches and through dealers selling retail investments. As stated in the regulations, all of the returns payable by the PPNs are classified as interest relative to principal. Therefore, the distributions are taxable as income for the investor.
PPNs are required under SOR/2008-180 to use “clear and simple language” for examples of potential returns to reflect realistic assumptions. The FRFI must provide verbal and written information about the term, payments of interest, repayment of principal, risks, suitability of the PPN as an investment, redemption before maturity, and secondary markets. If past market performance is demonstrated in the advertising of these products, “the assumptions underlying those examples must be realistic and must be disclosed in the advertisement.”9 Further, SOR/2008-180 requires institutions to disclose if a PPN is not eligible for deposit insurance from Canada Deposit Insurance Corporation (CDIC). Any CDIC-eligible PPN that has been collected for this study is labeled as a “GIC” (guaranteed investment certificate). GICs whose returns are based on fixed or variable rates of interest are specifically excluded from SOR/2008-180.
Since deposits are not transferable, CDIC considers PPNs to be tradable debt securities and, therefore, not eligible for deposit insurance.10 However, some non-trading PPNs, both index-linked and portfolio-linked, that are sold by Canadian FRFIs qualify for deposit insurance coverage. These PPNs are marketed as guaranteed investment certificates (GICs). The initial term to maturity for an eligible GIC must be equal to or less than 5 years and the GIC must be issued in Canada in Canadian dollars and pay in Canadian dollars. PPNs that are CDIC-eligible have their guarantee of principal provided by CDIC in the event of failure of the issuing institution. All other PPNs carry the guarantee of the issuing institution and are marketed as structured products. Nomenclature varies, but structured notes are variously called deposit notes, linked notes, and principal protected notes. Thus, the distinction is made between deposits and debt as a funding source for FRFIs.
Regulatory issues related to the sale of PPNs to the public are governed by provincial regulatory bodies. The Investment Industry Regulatory Organization of Canada (IIROC) and the Canadian Securities Administrators (CSA) work to co-ordinate securities regulations across Canada. The IIROC and the CSA are concerned with “know your client” (KYC) rules related to investment products that are marketed to the public. The IIROC provided guidance notes on 31 August 2010 and 18 December 2012 with recommendations for dealers selling PPNs. The IIROC’s focus is on the dealer’s knowledge of the product, training of personnel, suitability of the investment, and disclosure to investors.11

3. Literature Review and Hypothesis Development

3.1. Prior Literature and Our Contribution

Many researchers have documented the overpricing pattern of several types of structured products in different countries including Germany, France, Switzerland, and the United States. Stoimenov and Wilkens (2005) find an average overpricing at issuance of 3.89% on structured products on DAX stocks. Bertrand and Prigent (2015) examine retail structured products available in France and provide a typology of the market. They find that the mispricing of products ranges from 2% to 7%, consistent with other studies of the European markets, including an earlier study of the Swiss market by Burth et al. (2001). Deng et al. (2014) look at the market for, and the valuation of, structured certificates of deposit (structured CDs) available for sale in the United States. They find that mispricing of structured CDs and their estimates show that structured CDs are worth, on average, 93% of the value of a fixed-rate CD that is issued at the same time.
Some researchers have found that overpricing is mainly attributed to product complexity, market transparency, investors’ behavioral bias, and investment time horizon. Stoimenov and Wilkens (2005) find the overpricing ranging from 3.67% for plain vanilla (low complexity) to 5.17% for rainbow (high complexity) option products. They find that overpricing at issuance is higher for products with stock underlying than for those with index underlying, and is also higher for more complex products compared to classic instruments. Rathgeber and Wang (2011) discover that credit-linked notes in Germany are generally greatly overpriced in the primary market and the more complex the product and the less transparent the market, the more overpricing there is. Wallmeier and Diethelm (2009) find that complex structured products (multi-asset barrier reverse convertibles) for sale in Switzerland’s market were overpriced by an average of 3.4% in April 2007. They show a behavioral bias wherein investors underestimate the risk and overweigh the coupon. Milevsky and Kim (1997) looked at index-linked GICs (ILGICs) offered by banks in Canada and concluded that the longer the time horizon of ILGICs, the lower the return earned by the investor.
While the literature has attributed the overpricing pattern mainly to product complexity, market transparency, investors’ behavioral bias, and investment time horizon, little attention has been paid to the characteristics (such as mean return and volatility) of the underlying portfolio. This paper will explore whether the overpricing pattern can be better explained by combining analysis of structured product features and underlying portfolio characteristics. After all, whether a structured product is overpriced ultimately depends on whether the structured product return outweighs its holding cost, or vice versa. Product return is calculated from the underlying portfolio’s return, subject to the adjustments specified by various product features. Issuers have the liberty not only to design various features of structured products, but also to choose the specific underlying portfolio. The investors have freedom to choose structured products based on product features (i.e., complexity) and also the underlying portfolio. In the end, the structured product return depends on the interaction between structured product features and the underlying portfolio’s return characteristics.

3.2. Hypotheses and Research Design

Denote the return of EL-PAM-PPN as R SP , and the return of the underlying portfolio as R up . Since EL-PAM-PPN has its principal protected, R SP has a minimum value of zero and can be defined as a function of R up , i.e.,
R SP ( X ) = {   X R up ,   if   R up 0   0 ,   if   R up < 0  
where X   ( x 1 ,   x 2 ,   x 3 , x 17 ) ( 0 ,   1 ) , is a return-sharing function dependent on a vector of return adjustment variables,
[ Y T M ,   C D I C , B A C K , F E E , G P R , V O A ,   O B Y ,   O B T ,   C A P S R ,   C A S S R ,   C A P U P , C A P A U P ,   F L R S R ,   B U P , N S K , D I V L ,   P C R U P ,   E V O L ,   R V O L ]
These 19 return adjustment variables are designed by the issuers, specified in the issuing documents, and may include the participation rate, years to maturity, risk of the underlying portfolio, etc., as listed in Table 1.
The number of years to maturity (YTM) impacts the return realized on the underlying portfolio. The provision of a government guarantee (CDIC) reduces the risk of the retail investor. The callable feature (BACK) allows the issuer to call back the note, i.e., to shorten the term, at the issuer’s discretion. The exercise of the call by the issuer can potentially limit the return earned by the investor. An account fee (FEE) is an upfront cost to the investor. A guaranteed positive return (GPR) promises the investor a fixed positive return. Additional variables (Table 1) such as Asian option (VOA), the number of performance observations per year (OBY), the number of performance observations over the life of the note (OBT), a cap on the positive return of individual stocks (CAPSR), a positive return treated as a digital option (CASSR), a cap on the positive return of the underlying portfolio (CAPUP), the value of the cap on the return of the underlying portfolio (CAPAUP), whether there is a floor on the negative stock return (FLRSR), the number of stocks in the underlying portfolio (NSK), and the fixed rate that the investor can receive as a percentage of the underlying portfolio return (PCRUP) are variables which influence the return, positively or negatively, earned by the investor. These variables are collected from the information documents for each note issued.
The investor agrees to forego a portion ( 1 X ) of R up if R up 0 , in exchange for an insurance (or guarantee) of not losing the principal invested in an EL-PAM-PPN if R u p < 0 . The investor’s cost of holding an EL-PAM-PPN is, therefore, ( 1 X ) R up if R up 0 . The investor’s benefit is not losing the principal amount, i.e., R up if R up < 0 . The participation constraint for the investor is defined as
( 1 X ) E [ ( R up ) + ] = E [ ( R up ) ] = E [ ( R up ) + ] E [ R up ]
Therefore, the equilibrium price (i.e., the return sharing function) is
X = E [ R up ] E [ ( R up ) + ]
where E [ ( R up ) + ] = max ( R up , 0 ) and E [ ( R up ) ] = max ( R up , 0 ) .
Suppose R up ~ N ( μ ,   σ 2 ) , i.e., R up follows a normal distribution with a mean of μ and a standard deviation of σ , we have
X = μ 1 2 π σ e μ 2 2 σ 2 + μ N ( μ σ )
Let γ   be the probability of R U P < 0 , i.e., P ( R up 0 ) = γ
N ( μ σ ) = 1 N ( μ σ ) = 1 P ( z μ σ ) = 1 P ( R up 0 ) = 1 γ
Hypothesis 1.
Because X σ < 0 ,   X μ > 0 (proof provided in Appendix A), the equilibrium price (i.e., the return-sharing function), X = μ 1 2 π σ e μ 2 2 σ 2 + μ N ( μ σ ) , increases with an increase in the mean return of the underlying portfolio, but decreases with an increase in the volatility of the underlying portfolio’s return and the probability of the underlying portfolio return being negative. Since R S P (measured as the note return, NR) depends positively on X , NR will follow the same pattern of X , i.e., it increases with an increase in the mean return of the underlying portfolio, but decreases with an increase in the volatility of the underlying portfolio’s return and the probability of the underlying portfolio return being negative.
The volatility σ is measured by two volatility variables: EVOL and RVOL. EVOL is the expected volatility calculated as the standard deviation of the daily price return on the underlying asset or index (indices) calculated for the 365 days prior to issue date. RVOL is the realized volatility calculated as the standard deviation of daily price return on the underlying portfolio or index (indices) calculated from the issue date to the maturity (or call-back) date. The mean return of the underlying portfolio μ is measured by two proxy variables: BUP and DIVL. Model 3 uses three different specifications to test Hypothesis 1, and will be estimated as a cross-sectional OLS regression.
{ NR = α 1 + i = 1 19 β i x i + ε 1   ( 3 a ) NR = α 2 + i = 1 19 β i x i + δ 2 E C R P + ε 2       ( 3 b ) NR = α 3 + i = 1 19 β i x i + δ 3 E C R P + θ 3 E C R T + ε 3             ( 3 c )
where x i = [ Y T M ,   C D I C , B A C K , F E E , G P R , V O A ,   O B Y ,   O B T ,   C A P S R ,   C A S S R ,   C A P U P , C A P A U P ,   F L R S R ,   B U P , N S K , D I V L ,   P C R U P ,   E V O L ,   R V O L ] .
The investor’s holding cost of an EL-PAM-PPN is equivalent to the excess return of the underlying portfolio, R up R SP = ( 1 X ) R up , which can be measured as the difference between the underlying portfolio’s return (PRUP or TRUP) and the note return (NR). The excess return has two measurements, ECRP, calculated as PRUP minus NR, and ECRT, calculated as TRUP minus NR. ECRPY and ECRTY are simply the annualized versions of ECRP and ECRT.
Hypothesis 2.
The cost of an EL-PAM-PPN (equivalently, the excess return of the underlying portfolio), measured as ECRP, ECRT, ECRPY, and ECRTY, should be decreasing with an increase in the mean return of the underlying portfolio, but increasing with an increase in the volatility of the underlying portfolio return and the probability of the underlying portfolio return being negative.
Higher mean return μ leads to higher equilibrium price X , which leads to lower excess return ( 1 X ) R up . Higher volatility σ and/or higher γ leads to lower equilibrium price X , which leads to higher excess return ( 1 X ) R up . Model 4 is used to test Hypothesis 2 and will be estimated as a cross-sectional OLS regression.
ECRP = a + i = 1 19 φ i x i + ϵ
ECRT   = a + i = 1 19 φ i x i + ϵ  
ECRPY = a + i = 1 19 φ i x i + ϵ  
ECRTY = a + i = 1 19 φ i x i + ϵ  
where x i = [ Y T M ,   C D I C , B A C K , F E E , G P R , V O A ,   O B Y ,   O B T ,   C A P S R ,   C A S S R ,   C A P U P , C A P A U P ,   F L R S R ,   B U P , N S K , D I V L ,   P C R U P ,   E V O L ,   R V O L ] .

4. Empirical Results

4.1. Data Description and Analysis

For this study, a total of 1568 retail EL-PAM-PPNs that were issued between 2003 and 2015, and that matured from 2006 to 2019, were collected from the websites of 15 financial institutions (FIs hereafter) in Canada and the UK. Table 2 provides the detailed distribution of EL-PAM-PPNs in our dataset within different categories.
For Canada, we have collected 1101 retail structured products, 56 of which are structured notes and the remaining 1045 are GICs. For the UK, of the 467 structured products collected, 228 are structured notes and 239 are deposit notes. As noted above, issuers are required to provide information documents for current offerings. However, not all issuers publish returns for matured notes. Therefore, although over-represented by financial institutions, who publish note returns and offer documents for current and matured PPNs on their websites, our dataset is not subject to sample selection bias in the context of investigating the EL-PAM-PPN overpricing pattern, on the assumption that overpricing information is not a feature that financial institutions would choose to publish. Those institutions choosing to publish this information are most likely confident that their products are fairly priced.
Lack of disclosure of past performance may be seen as a barrier for retail investors to evaluate competing products, particularly since some of the issuers change the terms of the notes from one issue to another or provide more than one choice of product with similar issue dates. The Canadian market provides notes based on a portfolio chosen by the issuer. All of the UK notes collected are based on a single market index, e.g., FTSE100, or on multiple indices.
For the UK, Table 3 shows that the average note return is 21.94%. The mean excess return excluding dividends (ECRP) is negative at −0.79%, which suggests that UK investors would be slightly better off choosing the structured product rather than the underlying portfolio if dividends are not included. However, the excess return including dividends (ECRT) is 20.44%, indicating that, on average, the investor would be better off buying the underlying portfolio. Table 4 verifies that the underlying portfolio outperforms UK structured products 87.15% of the time if the dividends from the underlying portfolio are included, and only 46.47% of the time if the dividends from the underlying portfolio are excluded.
For Canada, Table 3 shows that the average return on the 1101 structured products is 9.68%. The average excess returns, both ECRP (4.10%) and ECRT (16.65%), are positive which suggests that, on average, Canadian investors would be better off choosing the underlying portfolio for the time period under study: from 2003 to 2015. Table 4 verifies that for Canadian products, the underlying portfolio outperforms the structured notes 81.93% of the time if the dividends from the underlying portfolio are included, and 59.04% of the time if the dividends from the underlying portfolio are excluded.
The two-sample mean difference t-test shown in Table 5 shows that the total product return and the excess return for UK and Canadian data are significantly different. Excluding dividends, the annual excess return of the underlying portfolio is smaller in the UK (0.0009%) compared to that in Canada (0.8326%); however, when including dividends, the annual excess return of the underlying portfolio is larger in the UK (4.4511%) compared to that in Canada (3.9635%). This implies that UK issuers are better able to pick the underlying stocks (or indices) that are more likely to pay dividends.

4.2. The Distribution of Returns

The return of an EL-PAM-PPN is based on the “price return” of the underlying portfolio or index rather than the total return because the investor does not receive any dividends that are paid on the underlying assets. As shown in Figure 2 below, the structured product returns R SP are always above zero, since these notes are principal protected and it is impossible for EL-PAM-PPN investors to lose money. The underlying portfolio total returns R UP are distributed mostly above zero across the entire sample period, i.e., it has a positive mean, which suggests that if the investors chose to invest in the underlying portfolios, their expected returns would have been positive. It also suggests that issuers may have been choosing underlying portfolios with positive expected returns so that the principal protection feature was less likely to be exercised.
The four measures of excess return, ECRP, ECRT, ECRPY, and ECRTY, are graphed by issue date (ISSD) and maturity date (MATD) in Figure 3a,b. Overall, the excess returns (especially the two measures of total excess return, ECRT and ECRTY) are distributed mostly above zero. This suggests that underlying portfolios have been mostly outperforming the EL-PAM-PPNs in our sample period, which is consistent with the results shown in Table 4.
Figure 2 and Figure 3 together show the holding cost of EL-PAM-PPNs outweighs their benefit, i.e., the protection of the principal.
In Table 6, we break down the return measures by issuer. FI4 (Financial Institution 4) provides the highest structured product return (45%), and FI6 provides the lowest (8.31%). FI14 has the highest underlying portfolio excess return, meaning they are the most overpriced structured products. FI15 has the lowest underlying portfolio excess return, meaning they provide the least overpriced structured products.
Table 7 presents the summary statistics of 19 return adjustment variables, YTM, CDIC, BACK, FEE, GPR, VOA, OBY, OBT, CAPSR, CASSR, CAPUP, CAPAUP, FLRSR, BUP, NSK, DIVL, PCRUP, EVOL, and RVOL and various return variables, ECRP, ECRT, ECRPY, ECRTY, and NR.

4.3. The Effects of μ and σ on the Return of EL-PAM-PPNs

Model 3 results are presented in Table 8. BUP is dropped in the UK regression since all UK notes are based on a market index which has a beta of one. BUP is not significant in Canada; DIVL is significantly negative in both countries but not stable across 3a, 3b, and 3c, suggesting the mean return of the underlying portfolio has some impact on the return of EL-PAM-PPNs. EVOL is significantly positive in the UK, but insignificant in Canada. RVOL is strongly negative in the UK but not in Canada. Hypothesis 1 is partially supported.
The implications here are twofold. First, in the UK, all EL-PAM-PPNs are linked with the market index and investors are not able to choose the underlying portfolio; hence, the mean return of the underlying portfolio has no impact on the return of EL-PAM-PPNs. In Canada, EL-PAM-PPNs are either linked with the market index or a portfolio of stocks, and so investors choosing EL-PAM-PPNs based on higher-dividend-paying stocks will receive a lower note return. Second, the expected volatility of the underlying portfolio is a positive indicator for EL-PAM-PPN return in the UK but not so much in Canada. The realized volatility of the underlying portfolio is a strong negative indicator for EL-PAM-PPN return in the UK but not in Canada.

4.4. The Effects of μ and σ on the Holding Cost of EL-PAM-PPNs (or the Excess Return of the Underlying Portfolio)

The results of Model 4 are presented in Table 9. Again, the estimated beta of the underlying portfolio BUP is dropped in the UK regression since all UK notes are based on a market index which has a beta of one, but BUP is significantly negative in Canada. The underlying portfolio dividend yield in the year before the note issuance, DIVL, is strongly negative in Canada but not in the UK, suggesting the mean return of the underlying portfolio decreases the holding cost of EL-PAM-PPNs. When the mean return of the underlying portfolio is higher, the return-sharing function X needs to be higher to retain investors, and a higher X , therefore, leads to a lower holding cost.
EVOL, the expected volatility, is strongly positive in both countries. RVOL, the realized volatility, is strongly negative in both countries. Hypothesis 2 is supported by the results. The difference between EVOL and RVOL is that EVOL is included in the equilibrium price X , but RVOL is not, even though RVOL will ultimately affect the return and the holding cost of EL-PAM-PPNs.
The implication is that, in the UK, investors are better off choosing EL-PAM-PPNs that are linked to a portfolio with lower expected volatility, whereas in Canada, investors are better off choosing EL-PAM-PPNs that are linked to a portfolio with higher mean return and/or lower expected volatility (EVOL). The realized volatility (RVOL) strongly reduces the holding cost of EL-PAM-PPNs, which is consistent with the intuition that a sudden risk increase after the insurance premium is paid usually benefits the insured more.

4.5. What Kind of EL-PAM-PPNs Should Investors Choose?

We have shown how the characteristics (i.e., EVOL, RVOL, BUP, DIVL) of the underlying portfolios affect the return and holding cost of EL-PAM-PPNs, but what about the characteristics of EL-PAM-PPNs? To address this question, we have included in the regression the remaining 15 return adjustment variables: YTM, CDIC, BACK, FEE, GPR, VOA, OBY, OBT, CAPSR, CASSR, CAPUP, CAPAUP, FLRSR, NSK, and PCRUP. These 15 variables are endogenous decision variables in that they are purely based on the issuers’ decisions. In theory, these endogenous decision variables should affect the return and/or the holding cost of EL-PAM-PPNs. However, their impacts may or may not be consistent in practice.
Note return-positive variables (YTM, CDIC, FEE, GPR, FLRSR, PCRUP) boost the note return, improve the insurance level for the investor and, therefore, should reduce the holding cost of EL-PAM-PPNs. In Table 8, the positive effect of YTM on the note return is confirmed in both countries; the effect of GPR on the note return is positive in the UK but negative (supposed to be positive) in Canada and the effects of CDIC, FEE, and FLRSR are insignificant and dropped in both countries. PCRUP is positive in the UK. As shown in Table 9, the effect of YTM on the holding cost is negative in the UK but positive in Canada, the effect of GPR on the holding cost is negative in Canada, the effect of FEE and CDIC on the holding cost are positive (supposed to be negative) in Canada, and PCRUP is negative in both countries. FLRSR is insignificant and dropped in both countries. As such, to minimize the holding cost (or to avoid the lost excess return from the underlying portfolio), UK investors should choose EL-PAM-PPNs with longer maturity and higher fixed rates as a percent of the underlying portfolio’s return received by investors, whereas Canadian investors should choose EL-PAM-PPNs with shorter maturity, no account fee, no CDIC insurance, and higher fixed rates as a percent of the underlying portfolio’s return received by investors.
Note return-negative variables (BACK, CAPSR, CASSR, CAPUP, CAPAUP) reduce the note return, reduce the level of insurance provided by the EL-PAM-PPN and, therefore, should increase the holding cost of EL-PAM-PPNs. In Table 8, BACK is positive (supposed to be negative) in Canada. CAPSR is negative in Canada. CAPUP is negative in the UK. As shown in Table 9, BACK is positive in the UK but negative (supposed to be positive) in Canada. CAPSR is insignificant in both countries. CAPUP is positive in both countries. As such, to minimize the holding cost (or to avoid the lost excess return from the underlying portfolio), UK investors should choose EL-PAM-PPNs without a call-back option and without a cap on the positive return of the underlying portfolio, whereas Canadian investors should choose EL-PAM-PPNs with a call-back option and without a cap on the positive return of the underlying portfolio. CASSR and CAPAUP are insignificant and dropped in both countries.
Note-complexity variables (VOA, OBY, OBT, NSK) measure the complexity of the EL-PAM-PPN. As projected by Stoimenov and Wilkens (2005), Rathgeber and Wang (2011), and Wallmeier and Diethelm (2009), these variables should increase the overpricing, i.e., decrease the note return, and increase the holding cost of EL-PAM-PPNs. In Table 8, VOA is significantly negative in the UK. OBT is significantly positive (supposed to be negative) in the UK; NSK is significantly negative in both countries. As shown in Table 9, VOA (equal to 1 if the note return is calculated as a vanilla option and 2 if as an Asian option, and 0 otherwise) is significantly positive in the UK but negative (supposed to be positive) in Canada, OBT (the number of performance observations over the life of the note) is significantly positive in Canada, and NSK (number of stocks in the underlying portfolio) is significantly negative (supposed to be positive) in both countries. As the number of stocks in the underlying portfolio increases, the portfolio risk decreases and the equilibrium price X increases, which leads to higher note return and lower holding cost. As such, UK investors should choose EL-PAM-PPNs with note returns calculated as a plain vanilla option and with more stocks in the underlying portfolio, whereas Canadian investors should choose EL-PAM-PPNs with note returns calculated as an Asian (or other) option, with a smaller number of performance observations over the note life, and with more stocks in the underlying portfolio.
Overall, the empirical results show that the mean return of the underlying portfolio decreases the note holding cost and the volatility of the underlying portfolio increases the note return, decreasing the note holding cost. Investors could maximize note return and minimize holding cost by choosing EL-PAM-PPNs prudently. More specifically, investors in both countries who are seeking to minimize the holding cost of EL-PAM-PPNs should purchase notes where the underlying asset contains a larger number of stocks (NSK), where the participation rate (PCRUP) is higher, and where the volatility of the underlying portfolio in the previous year (EVOL) is lower. For investors in UK notes, if they wish to reduce the holding cost of EL-PAM-PPNs, they should invest in notes with a longer time to maturity (YTM) and they should avoid notes which are callable (BACK = 0) and whose payoffs are determined by a single observation of the underlying portfolio’s value at maturity (VOA = 1). Surprisingly, for investors in Canadian notes, if they wish to reduce the holding cost of EL-PAM-PPNs, they should invest in notes with a shorter time to maturity (YTM) and they should purchase notes which are callable (BACK = 1) and whose payoffs are determined by taking the average of multiple observations of the underlying portfolio’s value over the life of the note (VOA = 2). In addition, investors in Canadian notes should look for notes that include a guaranteed positive return and notes where the underlying asset has a higher dividend yield.

5. Conclusions

We examined 19 return adjustment variables of EL-PAM-PPNs, 4 of which were exogenous variables (EVOL, RVOL, BUP, DIVL) related to the underlying portfolio, and 15 of which were endogenous variables related to the various characteristics of EL-PAM-PPNs (YTM, CDIC, BACK, FEE, GPR, VOA, OBY, OBT, CAPSR, CASSR, CAPUP, CAPAUP, FLRSR, NSK, and PCRUP). Using a large sample of EL-PAM-PPNs from the UK and Canada that were issued from 2003 to 2015, and that matured from 2006 to 2019, we show that: (i) the mean return of the underlying portfolio does not provide clear indication about the return of EL-PAM-PPNs, but it does reduce the holding cost of EL-PAM-PPNs; (ii) the volatility of the underlying portfolio positively impacts EL-PAM-PPN returns in the UK only, but increases the holding cost of EL-PAM-PPNs in both countries.
EL-PAM-PPNs’ remaining 15 endogenous characteristic variables are categorized as return-positive, return-negative, or note-complexity. The effects of these variables on the return and holding cost of EL-PAM-PPNs are sometimes consistent with the theoretical construct, but sometimes not. This suggests that the equilibrium price of an EL-PAM-PPN X is probably not entirely controlled by the issuer. It also suggests that investors can and probably should choose EL-PAM-PPNs prudently based on the empirical results provided in this paper in order to maximize the return of EL-PAM-PPNs and to minimize the holding cost of EL-PAM-PPNs.
Our analysis contributes to the existing literature on the overpricing pattern of structured products. Our findings are not only consistent with the view that complexity leads to overpricing, but also establish the relationship, for the first time, between the underlying portfolio characteristics and the return/holding cost of a very unique structured product, EL-PAM-PPNs. Our study has implications for investors who want to select EL-PAM-PPNs as part of their investment decisions and risk management decisions.
The analysis based on the collected data shows that underlying portfolios matter and the significant variables affecting returns on EL-PAM-PPNs are not the same for the UK and Canada over the period covered by this study. It is not apparent that there are significant market structure differences to explain the different results between the UK and Canada.
Future research could investigate other time periods and economic variables which could affect the timing of returns. For example, market corrections could cause lower returns on issued notes before they mature. Furthermore, notes issued after a market correction could benefit from increases in an exuberant market. The drawback to this analysis is that the data gathering is time consuming and, importantly, dependent on issuers providing information documents and returns before and after the notes are issued.

Author Contributions

Conceptualization, Y.L., S.A. and P.A.M.; methodology, Y.L.; software, Y.L.; validation, Y.L., S.A. and P.A.M.; formal analysis, Y.L.; investigation, Y.L.; resources, S.A. and P.A.M.; data curation, Y.L., S.A.; writing—original draft preparation, Y.L.; writing—review and editing, Y.L., S.A. and P.A.M.; visualization, Y.L. and P.A.M.; supervision, Y.L.; project administration, Y.L.; funding acquisition, S.A. All authors have read and agreed to the published version of the manuscript.

Funding

The APC was funded by the Ted Rogers School of Management publishing fund.

Data Availability Statement

The data presented in this study are available on request from the corresponding author.

Conflicts of Interest

The authors declare no conflict of interest.

Appendix A. Proof of X γ < 0 , X σ < 0 , X μ > 0

(1)
Let s > 0 be a constant, and let z be a standard normal random variable, i.e., z ~ N ( 0 , 1 ) .
E [ ( z + s ) + ] = s ( z + s ) 1 2 π e z 2 2 d z = s z 1 2 π e z 2 2 d z + s s 1 2 π e z 2 2 d z = 1 2 π s e z 2 2 d z 2 2 + s P ( z s ) = 1 2 π e s 2 2 + s P ( z s )
where P ( z s ) = P ( z s ) = N ( s ) = 1 2 π e s 2 2 + s N ( s ) , and N ( s ) is the CDF of z .
(2)
Let R up ~ N ( μ , σ 2 ) , μ > 0 , then R up = μ + σ z .
E [ R up ) + ] = E [ ( μ + σ z ) + ] = σ E [ ( μ σ + z ) + ]
= σ ( 1 2 π e μ 2 2 σ 2 + μ σ N ( μ σ ) )
Now, let X be the EL-PAM-PPN issuer’s decision factor on the return-sharing plan, then
( 1 X ) E [ ( R up ) + ] = E [ ( R up ) ]
= E [ ( R up ) + ] E [ R up ]
So
X E [ ( R up ) + ] = E [ R up ]
X = E [ R up ] E [ ( R up ) + ]
Suppose R up ~ N ( μ ,   σ 2 )
X = t 1 2 π e t 2 2 + t N ( t ) = t N ( t ) + t N ( t )
where t = μ σ , N ( t ) = 1 γ , γ = 1 N ( t ) .
(3)
N ( t ) = t 1 2 π e s 2 2 d s
N ( t ) = 1 2 π e t 2 2   and   N ( t ) = 1 2 π e t 2 2 ( t )
d X d t = 1 · ( N ( t ) + t N ( t ) ) t ( N ( t ) + N ( t ) + t N ( t ) ) ( N ( t ) + t N ( t ) ) 2
= ( 1 t 2 ) N ( t ) t N ( t ) ( N ( t ) + t N ( t ) ) 2
= ( 1 t 2 ) 1 2 π e t 2 2 t 1 2 π e t 2 2 ( t ) ( N ( t ) + t N ( t ) ) 2
= 1 2 π ( ( 1 t 2 ) e t 2 2 + t 2 e t 2 2 ) ( N ( t ) + t N ( t ) ) 2
= 1 2 π e t 2 2 ( N ( t ) + t N ( t ) ) 2
= N ( t ) ( N ( t ) + t N ( t ) ) 2 > 0
Therefore,
X μ = d X d t · t μ = d X d t · 1 σ > 0
X σ = d X d t · t σ = d X d t · ( μ σ 2 ) < 0
(4)
N ( t ) = 1 γ , or t = t ( γ )
d N ( t ( γ ) ) d γ = d N d t · d t d γ = 1
d t d γ = 1 d N d t = 1 N ( t )
Therefore,
X γ = d X d t · d t d γ = d X d t · ( 1 N ( t ) ) < 0

Notes

1
There are no secondary markets for structured products in Canada except as provided by the issuer. In the UK and Europe, a secondary market is available.
2
See ”What does the Bank of England do?” at https://0-www-bankofEngland-co-uk.brum.beds.ac.uk/about (accessed on 29 September 2022) and ”Structured Deposits: A consumer’s guide, produced jointly by TISA and the UK Structured Products Association” available at https://www.ukspassociation.co.uk/assets/documents/Structured%20Deposits%20Guide.pdf (accessed on 29 September 2022). The Basel Committee on Banking Supervision (BCBS) Joint Forum report, Point of Sale disclosure in the insurance, banking, and securities sectors, April 2014, notes that in most jurisdictions, only banks are usually able to issue structured deposits, whereas structured notes or certificates are usually issued by investment banks. See http://www.bis.org/publ/joint35.pdf (accessed on 29 September 2022).
3
See https://www.iosco.org/ (accessed on 29 September 2022).
4
Understanding UKSPA Risk Ratings for Structured Products: A guide to the UKSPA Risk Ratings for UK financial advisors, available at https://www.ukspassociation.co.uk/assets/documents/UKSPA_RiskRatingsGuide_FINAL.pdf (accessed on 29 September 2022).
5
See the web site for Structured Edge at http://www.structurededge.co.uk (accessed on 29 September 2022).
6
See Key information documents for packaged retail and insurance-based investment products (PRIIPs) that can be accessed at https://finance.ec.europa.eu/consumer-finance-and-payments/retail-financial-services/key-information-documents-packaged-retail-and-insurance-based-investment-products-priips_en#documents (accessed on 29 September 2022).
7
See SOR/2008-180 available at https://laws-lois.justice.gc.ca/eng/Regulations/SOR-2008-180/index.html (accessed on 29 September 2022).
8
Available from the Minister of Justice at available at https://laws-lois.justice.gc.ca/eng/Regulations/SOR-2008-180/index.html (accessed on 29 September 2022).
9
SOR/2008-180 Paragraph 13(3), page 6 available at available at https://laws-lois.justice.gc.ca/eng/Regulations/SOR-2008-180/index.html (accessed on 29 September 2022).
10
11
IIROC Guidance Note 10-0233 31 August 2010 Principal Protected Notes Compliance Review: Findings, Requirements and Recommendations available at https://www.iiroc.ca/news-and-publications/notices-and-guidance/principal-protected-notes-compliance-review-findings-requirements-and-recommendations (accessed on 29 September 2022), and IIROC Guidance Note 12-034 18 December 2012 Sale of principal protected notes by Approved Persons of IIROC Dealer Members available at: https://www.iiroc.ca/news-and-publications/notices-and-guidance/sale-principal-protected-notes-approved-persons-iiroc-dealer-members (accessed on 29 September 2022).

References

  1. Basel Committee on Banking Supervision. 2014. Point of Sale Disclosure in the Insurance, Banking and Securities Sectors, the Basel Committee on Banking Supervision Joint Forum Report. April. Available online: http://www.bis.org/publ/joint35.pdf (accessed on 29 September 2022).
  2. Bertrand, Philippe, and Jean-Luc Prigent. 2015. French Retail Financial Structured Products: A Typology and Assessment of Their Fair Pricing. Available online: http://ssrn.com/abstract=2513231 (accessed on 29 September 2022).
  3. Burth, Stefan, Thomas Kraus, and Hanspeter Wohlwend. 2001. The Pricing of structured products in the Swiss Market. Journal of Derivatives 9: 30–40. [Google Scholar] [CrossRef]
  4. Deng, Geng, Dulaney Tim, Husson Tim, and McCann Craig J. 2014. Structured Certificates of Deposit: Introduction and Valuation. Financial Services Review 23: 219–37. [Google Scholar] [CrossRef] [Green Version]
  5. Heinzl, John. 2016. A ‘growth GIC’? It sounds seductive, but I’ll pass. The Globe and Mail, December 2. [Google Scholar]
  6. International Organization of Securities Commissions. 2013a. Suitability Requirements with Respect to the Distribution of Complex Financial Products. Available online: https://www.iosco.org/library/pubdocs/pdf/IOSCOPD400.pdf (accessed on 29 September 2022).
  7. International Organization of Securities Commissions. 2013b. Regulation of Retail Structured Products. December 20. Available online: https://www.iosco.org/library/pubdocs/pdf/IOSCOPD434.pdf (accessed on 29 September 2022).
  8. Krein, David. 2007. Rethinking Principal Protection. The Journal of Wealth Management 9: 62–68. [Google Scholar] [CrossRef]
  9. Milevsky, Moshe Arye, and Sharon Kim. 1997. The Optimal Choice of Index-Linked GICs: Some Canadian Evidence. Financial Services Review 64: 271–84. [Google Scholar] [CrossRef]
  10. Milstead, David. 2016. Market-based GICs: A look under the hood. The Globe and Mail. Available online: http://www.theglobeandmail.com/globe-investor/investment-ideas/market-based-gics-a-look-under-the-hood/article28353990/ (accessed on 29 September 2022).
  11. Rathgeber, Andreas, and Yun Wang. 2011. Market pricing of credit-linked notes: The case of retail structured products in Germany. Journal of Credit Risk 7: 73–101. [Google Scholar] [CrossRef] [Green Version]
  12. Roseman, Ellen. 2014. Avoid GICs Linked to Stock Markets: Roseman. The Toronto Star. Available online: http://www.thestar.com/business/personal_finance/2014/02/02/you_can_profit_by_avoiding_packaged_gics_roseman.html (accessed on 29 September 2022).
  13. Stoimenov, Pavel A., and Sascha Wilkens. 2005. Are structured products ‘fairly’ priced? An analysis of the German market for equity-linked instruments. Journal of Banking & Finance 29: 2971–93. [Google Scholar]
  14. Wallmeier, Martin, and Martin Diethelm. 2009. Market Pricing of Exotic Structured Products: The Case of Multi-Asset Barrier Reverse Convertibles in Switzerland. The Journal of Derivatives 17: 59–72. [Google Scholar] [CrossRef]
Figure 1. A generic typology of pay at maturity (PAM) equity-linked structured products.
Jrfm 15 00462 g001
Figure 2. The structured product return R SP (NR) and the underlying portfolio total return R UP (TRUP) by issue date (ISSY) and maturity date (MATD).
Jrfm 15 00462 g002aJrfm 15 00462 g002b
Figure 3. (a) The excess return ECRP, ECRT by ISSD and MATD; (b) The annualized excess return ECRPY, ECRTY by ISSD and MATD.
Jrfm 15 00462 g003aJrfm 15 00462 g003b
Table 1. Definition of variables.
Variable NameDescription
YTMYears to maturity when issued
CDICThe note may be insured by CDIC or FSCS, 1 if yes, 0 if no
BACKThe issuer can call the product, 1 if yes 0 if no
FEEAccount fee payable, 1 if yes, 0 if no
GPRGuaranteed positive return, 1 if yes, 0 if no
VOA1 if the note return is calculated as a vanilla option, 2 if the note return is calculated as an Asian option, 0 otherwise
OBYThe number of performance observations per year
OBTThe total number of performance observations over the life of EL-PAM-PPNs
NSKThe number of stocks in the underlying portfolio
CAPSRThe cap on the positive return of individual stocks, 1000 if no cap
CASSRAny positive stock return is treated as a digital option, 1000 if not digital
FLRSRThe floor on the negative stock return
DIVLThe stock dividend yield in the year before product issuance
PCRUPThe fixed rate the investor can receive as a percentage of the underlying portfolio’s return
CAPUPA cap on the positive return of the underlying portfolio, 1 if yes, 0 if no
CAPAUPThe cap on the positive return of the underlying portfolio, 1000 if no cap
BUPEstimated beta of the underlying portfolio
PRUPThe price return on the note’s underlying portfolio
TRUPThe total return (price and dividends) on the note’s underlying portfolio
NRThe return paid on the structured product
CTRY0 if Canada, 1 if United Kingdom
IDXL1 if linked to an index; 0 if not
EVOLExpected volatility calculated as the standard deviation of the daily price return on the underlying asset or index (indices) calculated for the 365 days prior to issue date
RVOLRealized volatility calculated as the standard deviation of daily price return on the underlying portfolio or index (indices) calculated from the issue date to the maturity (or call) date
ISSYIssuance year of EL-PAM-PPN
MATYMaturity year of EL-PAM-PPN
Table 2. Product distribution by category.
CanadaPortfolio-BasedIndex-LinkedSubtotal
Structured Notes362056
GICs1279181045
Subtotal1639381101
UKPortfolio-BasedIndex-Linked *Subtotal
Structured Notes0228228
Deposit Notes0239239
Subtotal0467467
* Three notes are based on 3 indices (FTSE100, S&P500, and EUROSTOXX50). All others are based on a single index.
Table 3. The summary statistics of the note return and the excess return.
UKObsMeanSDMinMax
NR4670.21940.14710.00000.8574
ECRP467−0.00790.1643−0.45300.7884
ECRT4670.20440.1981−0.28461.1642
ECRPY4670.00000.0343−0.08020.1577
ECRTY4670.04450.0415−0.05520.2328
CanadaObsMeanSDMinMax
NR11010.09680.13000.00000.9723
ECRP11010.04100.1491−0.37540.8864
ECRT11010.16650.1839−0.39111.1492
ECRPY11010.00830.0490−0.33010.2236
ECRTY11010.03960.0537−0.30280.2899
Table 4. The percentage of the underlying portfolios that outperform the structured products.
UKPositiveOutperform
ECRP, ECRPY21746.4668%
ECRT, ECRTY40787.1520%
CanadaPositiveOutperform
ECRP, ECRPY65059.0372%
ECRT, ECRTY90281.9255%
Table 5. The two-sample mean difference t-test.
UKCanadat-Stats
NR21.9448%9.6768%−15.6187
ECRP−0.7874%4.0990%5.5335
ECRT20.4360%16.6497%−3.5347
ECRPY0.0009%0.8326%3.8375
ECRTY4.4511%3.9635%−1.9411
Table 6. The structured product return (NR) and the excess returns (ECRP, ECRT, ECRPY, and ECRTY) by issuer.
NRECRPECRTECRPYECRTY
MeanSEMeanSEMeanSEMeanSEMeanSE
FI125.47%1.63%1.65%1.84%26.53%2.12%0.62%0.40%5.77%0.46%
FI222.81%1.44%1.00%2.66%24.55%2.96%0.48%0.53%5.31%0.60%
FI328.93%4.48%−2.62%4.14%26.35%4.23%−0.40%0.72%4.47%0.76%
FI445.00%0.00%−32.07%1.86%−4.55%2.14%−5.35%0.31%−0.76%0.36%
FI59.21%0.41%3.14%0.52%15.75%0.65%0.42%0.17%3.51%0.19%
FI68.31%0.83%3.90%0.99%14.03%1.23%1.30%0.33%4.53%0.40%
FI75.06%0.79%9.46%1.20%19.55%1.34%3.83%0.51%7.37%0.56%
FI820.82%0.98%0.99%1.10%19.37%1.31%0.48%0.26%5.21%0.29%
FI929.10%0.71%−6.76%1.83%17.22%2.05%−1.35%0.37%3.44%0.41%
FI1019.21%2.09%−2.53%2.23%22.91%2.66%−0.16%0.44%4.46%0.53%
FI1121.47%3.08%7.00%1.03%22.68%0.87%1.79%0.24%4.82%0.27%
FI1225.78%9.58%−1.64%1.29%26.91%3.40%−0.40%0.32%4.61%0.68%
FI1312.54%1.93%−10.80%1.56%−0.80%1.87%−2.10%0.31%−0.10%0.36%
FI1417.25%2.01%31.20%3.72%45.40%4.16%6.58%0.77%9.53%0.83%
FI1542.50% 33.78% 7.56% 5.63%.1.26%.
Table 7. The summary statistics for the return adjustment factors.
UKCanada
VariableObsMeanSDMinMaxObsMeanSDMinMax
YTM4674.56581.23941.00006.000011013.95701.30160.95898.0301
CDIC4670.51180.50040.00001.000011010.94910.21980.00001.0000
BACK4670.08350.27700.00001.000011010.02270.14900.00001.0000
FEE4670.00000.00000.00000.000011010.02270.14900.00001.0000
GPR4670.28690.45280.00001.000011010.05720.23240.00001.0000
VOA4671.86940.34980.00002.000011011.79110.40671.00002.0000
OBY40059550250110152112
OBT40059540250110153120
NSK46711510740875110153161060
CAPSR46784236501000110195520801000
CASSR46770345701000110195520801000
FLRSR467−1.00000.0000−1.0000−1.00001101−0.95910.1875−1.0000−0.1000
DIVL4670.03810.01110.00000.061311010.02640.00640.00000.0657
PCRUP4611.45521.15080.50005.000011010.63950.21870.20001.1500
CAPUP4670.76660.42350.00001.000011010.05810.23410.00001.0000
CAPAUP3622013801000110193824101000
BUP2991.00000.00001.00001.000011010.98350.25970.41227.1440
EVOL4670.01420.0058−0.01360.039211010.01250.00740.00500.0778
RVOL4650.01090.00260.00190.022111010.01290.00560.00570.1104
PRUP4670.21160.2058−0.36390.888411010.13780.2300−0.31651.1480
TRUP4670.42380.2635−0.27621.336911010.26330.2694−0.39111.3992
IDXL4671.00000.00001.00001.000011010.85200.35530.00001.0000
NR4670.21940.14710.00000.857411010.09680.13000.00000.9723
ECRP467−0.00790.1643−0.45300.788411010.04100.1491−0.37540.8864
ECRT4670.20440.1981−0.28461.164211010.16650.1839−0.39111.1492
ECRPY4670.00100.0358−0.08020.157711010.00830.0490−0.33010.2236
ECRTY4670.04750.0426−0.05520.232811010.03960.0537−0.30280.2899
ISSY467200922003201511012008220032015
MATY467201422006201911012012220082016
Note: (i) For CAPSR, CASSR, and CAPAUP, the value of 1000 is used to replace no cap at all. (ii) BUP is always 1 for UK data since all UK notes are index-linked.
Table 8. The regression results for the structured product return model.
UK Note Return (NR)Canada Note Return (NR)
Model 3aModel 3bModel 3cModel 3aModel 3bModel 3c
YTM0.0212 ***0.0184 ***−0.0813 ***0.0515 ***0.0364 ***0.00705
(4.08)(3.52)(−6.30)(8.69)(6.61)(0.62)
CDIC−0.0185−0.0208−0.0223 *0.01100.00334−0.0253
(−1.14)(−1.39)(−2.13)(0.22)(0.06)(−0.49)
BACK−0.0004900.0301−0.02150.07050.151 *0.163 *
(−0.02)(0.92)(−1.00)(1.06)(2.21)(2.55)
FEE0000.02900.0285−0.0340
(.)(.)(.)(0.69)(0.68)(−0.77)
GPR0.0564 ***0.0490 ***0.0320 **−0.113 ***−0.0967 ***−0.0732 ***
(3.83)(3.71)(2.94)(−6.11)(−5.04)(−3.85)
VOA−0.104 ***−0.0620 ***−0.0555 ***−0.05480.01820.0195
(−7.51)(−3.84)(−4.46)(−1.27)(0.47)(0.49)
OBT0.000474 *0.000353 *0.0002450.00251−0.00268−0.00417
(2.44)(2.01)(1.81)(0.73)(−0.93)(−1.41)
NSK−0.000131 *−0.000127 *0.000244 ***−0.00232 *−0.00144−0.00124
(−2.48)(−2.20)(3.90)(−2.41)(−1.57)(−1.30)
CAPSR−0.0000166−0.00001600.00000534−0.0000763**−0.0000675 **−0.0000225
(−0.80)(−0.83)(0.37)(−3.30)(−2.97)(−0.86)
DIVL0.8810.781−2.108 ***−1.628 *−0.886−1.384 *
(1.36)(1.15)(−3.61)(−2.47)(−1.44)(−2.29)
CAPUP−0.0651 **−0.0468−0.0700 *** 0.04120.02830.0123
(−2.75)(−1.93)(−3.93)(0.89)(0.66)(0.27)
PCRUP0.0403 ***0.0325 ***0.0204 ***−0.06800.03320.0346
(7.82)(6.52)(4.40)(−1.02)(0.60)(0.61)
EVOL12.80 ***16.41 ***9.837 ***0.886−0.241−0.940
(8.82)(9.55)(7.74)(1.30)(−0.42)(−1.60)
RVOL−10.22 ***−13.18 ***−17.55 ***−1.547−0.430−0.441
(−3.71)(−4.60)(−8.72)(−0.53)(−0.17)(−0.17)
ECRP −0.274 ***−2.469 *** 0.258 ***−0.617 *
(−4.19)(−7.73) (5.70)(−2.06)
ECRT 1.933 *** 0.781 **
(7.53) (2.97)
BUP −0.0140−0.00545−0.0140
(−0.96)(−0.36)(−1.02)
CONS0.210 **0.1270.400 ***0.275 **0.07830.110
(3.19)(1.75)(8.28)(3.09)(0.89)(1.28)
N396396396110111011101
Adj. R0.4790.5320.7560.3320.3900.410
Note: (i) t-statistics in parentheses, * p < 0.05, ** p < 0.01, *** p < 0.001; (ii) Due to collinearity, FEE and BUP are omitted for the UK, and FLRSR is omitted for Canada.
Table 9. The regression results for the excess return model.
UKCanada
ECRPECRTECRPYECRTYECRPECRTECRPYECRTY
YTM−0.01000.0402 ***−0.00521 **−0.00415 *0.0587 ***0.103 ***0.0146 ***0.0183 ***
(−1.49)(4.97)(−3.20)(−2.21)(8.99)(14.18)(7.10)(8.03)
CDIC−0.00843−0.00879−0.00504−0.004920.02970.06990.0222 *0.0336 **
(−0.45)(−0.40)(−1.24)(−1.03)(0.75)(1.65)(2.22)(3.08)
BACK0.112 ***0.153 ***0.0244 ***0.0328 ***−0.310 ***−0.364 ***−0.0615 ***−0.0707 ***
(4.28)(5.17)(4.84)(5.63)(−5.29)(−5.42)(−4.16)(−4.12)
FEE00000.001680.08210.01130.0273 *
(.)(.)(.)(.)(0.04)(1.73)(1.05)(2.15)
GPR−0.0270−0.0219−0.0003480.00116−0.0614−0.0991 **−0.0272 ***−0.0367 ***
(−1.36)(−0.95)(−0.08)(0.24)(−1.93)(−2.95)(−3.67)(−4.60)
VOA0.153 ***0.170 ***0.0272 ***0.0303 ***−0.282 ***−0.318 ***−0.0821 ***−0.0929 ***
(9.60)(9.16)(7.88)(7.57)(−5.83)(−5.77)(−5.55)(−5.59)
OBT−0.000441 *−0.000445−0.0000679−0.00006960.0201 ***0.0244 ***0.00748 ***0.00901 ***
(−2.06)(−1.79)(−1.57)(−1.40)(6.41)(6.58)(6.32)(6.79)
NSK0.0000135−0.000177 *−0.00000312−0.0000391 *−0.00339 ***−0.00406 ***−0.00137 ***−0.00162 ***
(0.28)(−2.29)(−0.32)(−2.59)(−3.41)(−3.45)(−4.35)(−4.56)
CAPSR0.00000226−0.00000847−0.00000649−0.00000811−0.0000342−0.0000959 *0.0000119−0.00000267
(0.09)(−0.29)(−1.10)(−1.21)(−0.86)(−2.31)(0.56)(−0.12)
DIVL−0.3621.084−0.1600.0907−2.872 *−2.583−1.286 **−1.248 **
(−0.58)(1.15)(−1.21)(0.47)(−2.31)(−1.82)(−3.29)(−2.91)
CAPUP0.0669 *0.0880 *0.006760.01050.04990.07650.0326 *0.0427 **
(2.41)(2.57)(1.22)(1.58)(1.18)(1.52)(2.39)(2.75)
PCRUP−0.0282 ***−0.0258 **−0.00456 **−0.00397 *−0.392 ***−0.441 ***−0.129 ***−0.144 ***
(−3.64)(−2.87)(−2.83)(−2.14)(−6.16)(−6.09)(−5.82)(−5.93)
EVOL13.15 ***18.34 ***2.722 ***3.781 ***4.362 ***5.788 ***0.916 ***1.211 ***
(6.98)(8.30)(6.78)(8.17)(5.28)(5.54)(4.34)(4.73)
RVOL−10.79 ***−9.991 *−2.370 ***−2.256 **−4.321 *−4.833 *−1.801 *−1.924 *
(−3.65)(−2.49)(−3.56)(−2.59)(−2.06)(−2.05)(−2.13)(−2.12)
BUP −0.0330 ***−0.0260 *−0.00411−0.00316
(−3.49)(−2.37)(−1.22)(−0.84)
CONS−0.302 ***−0.485 ***−0.0235−0.01320.760 ***0.812 ***0.231 ***0.281 ***
(−5.20)(−5.78)(−1.66)(−0.69)(5.96)(5.72)(5.51)(6.16)
N3963963963961101110111011101
Adj. R0.3550.4020.3380.3850.3340.4320.2830.317
Note: (i) t-statistics in parentheses, * p < 0.05, ** p < 0.01, *** p < 0.001; (ii) Due to collinearity, FEE and BUP are omitted for the UK, and FLRSR is omitted for Canada.
Publisher’s Note: MDPI stays neutral with regard to jurisdictional claims in published maps and institutional affiliations.

