
Consumer Segmentation of Green Financial Products Based on Sociodemographic Characteristics

Abstract
:1. Introduction
2. Literature Review
2.1. Green Consumption
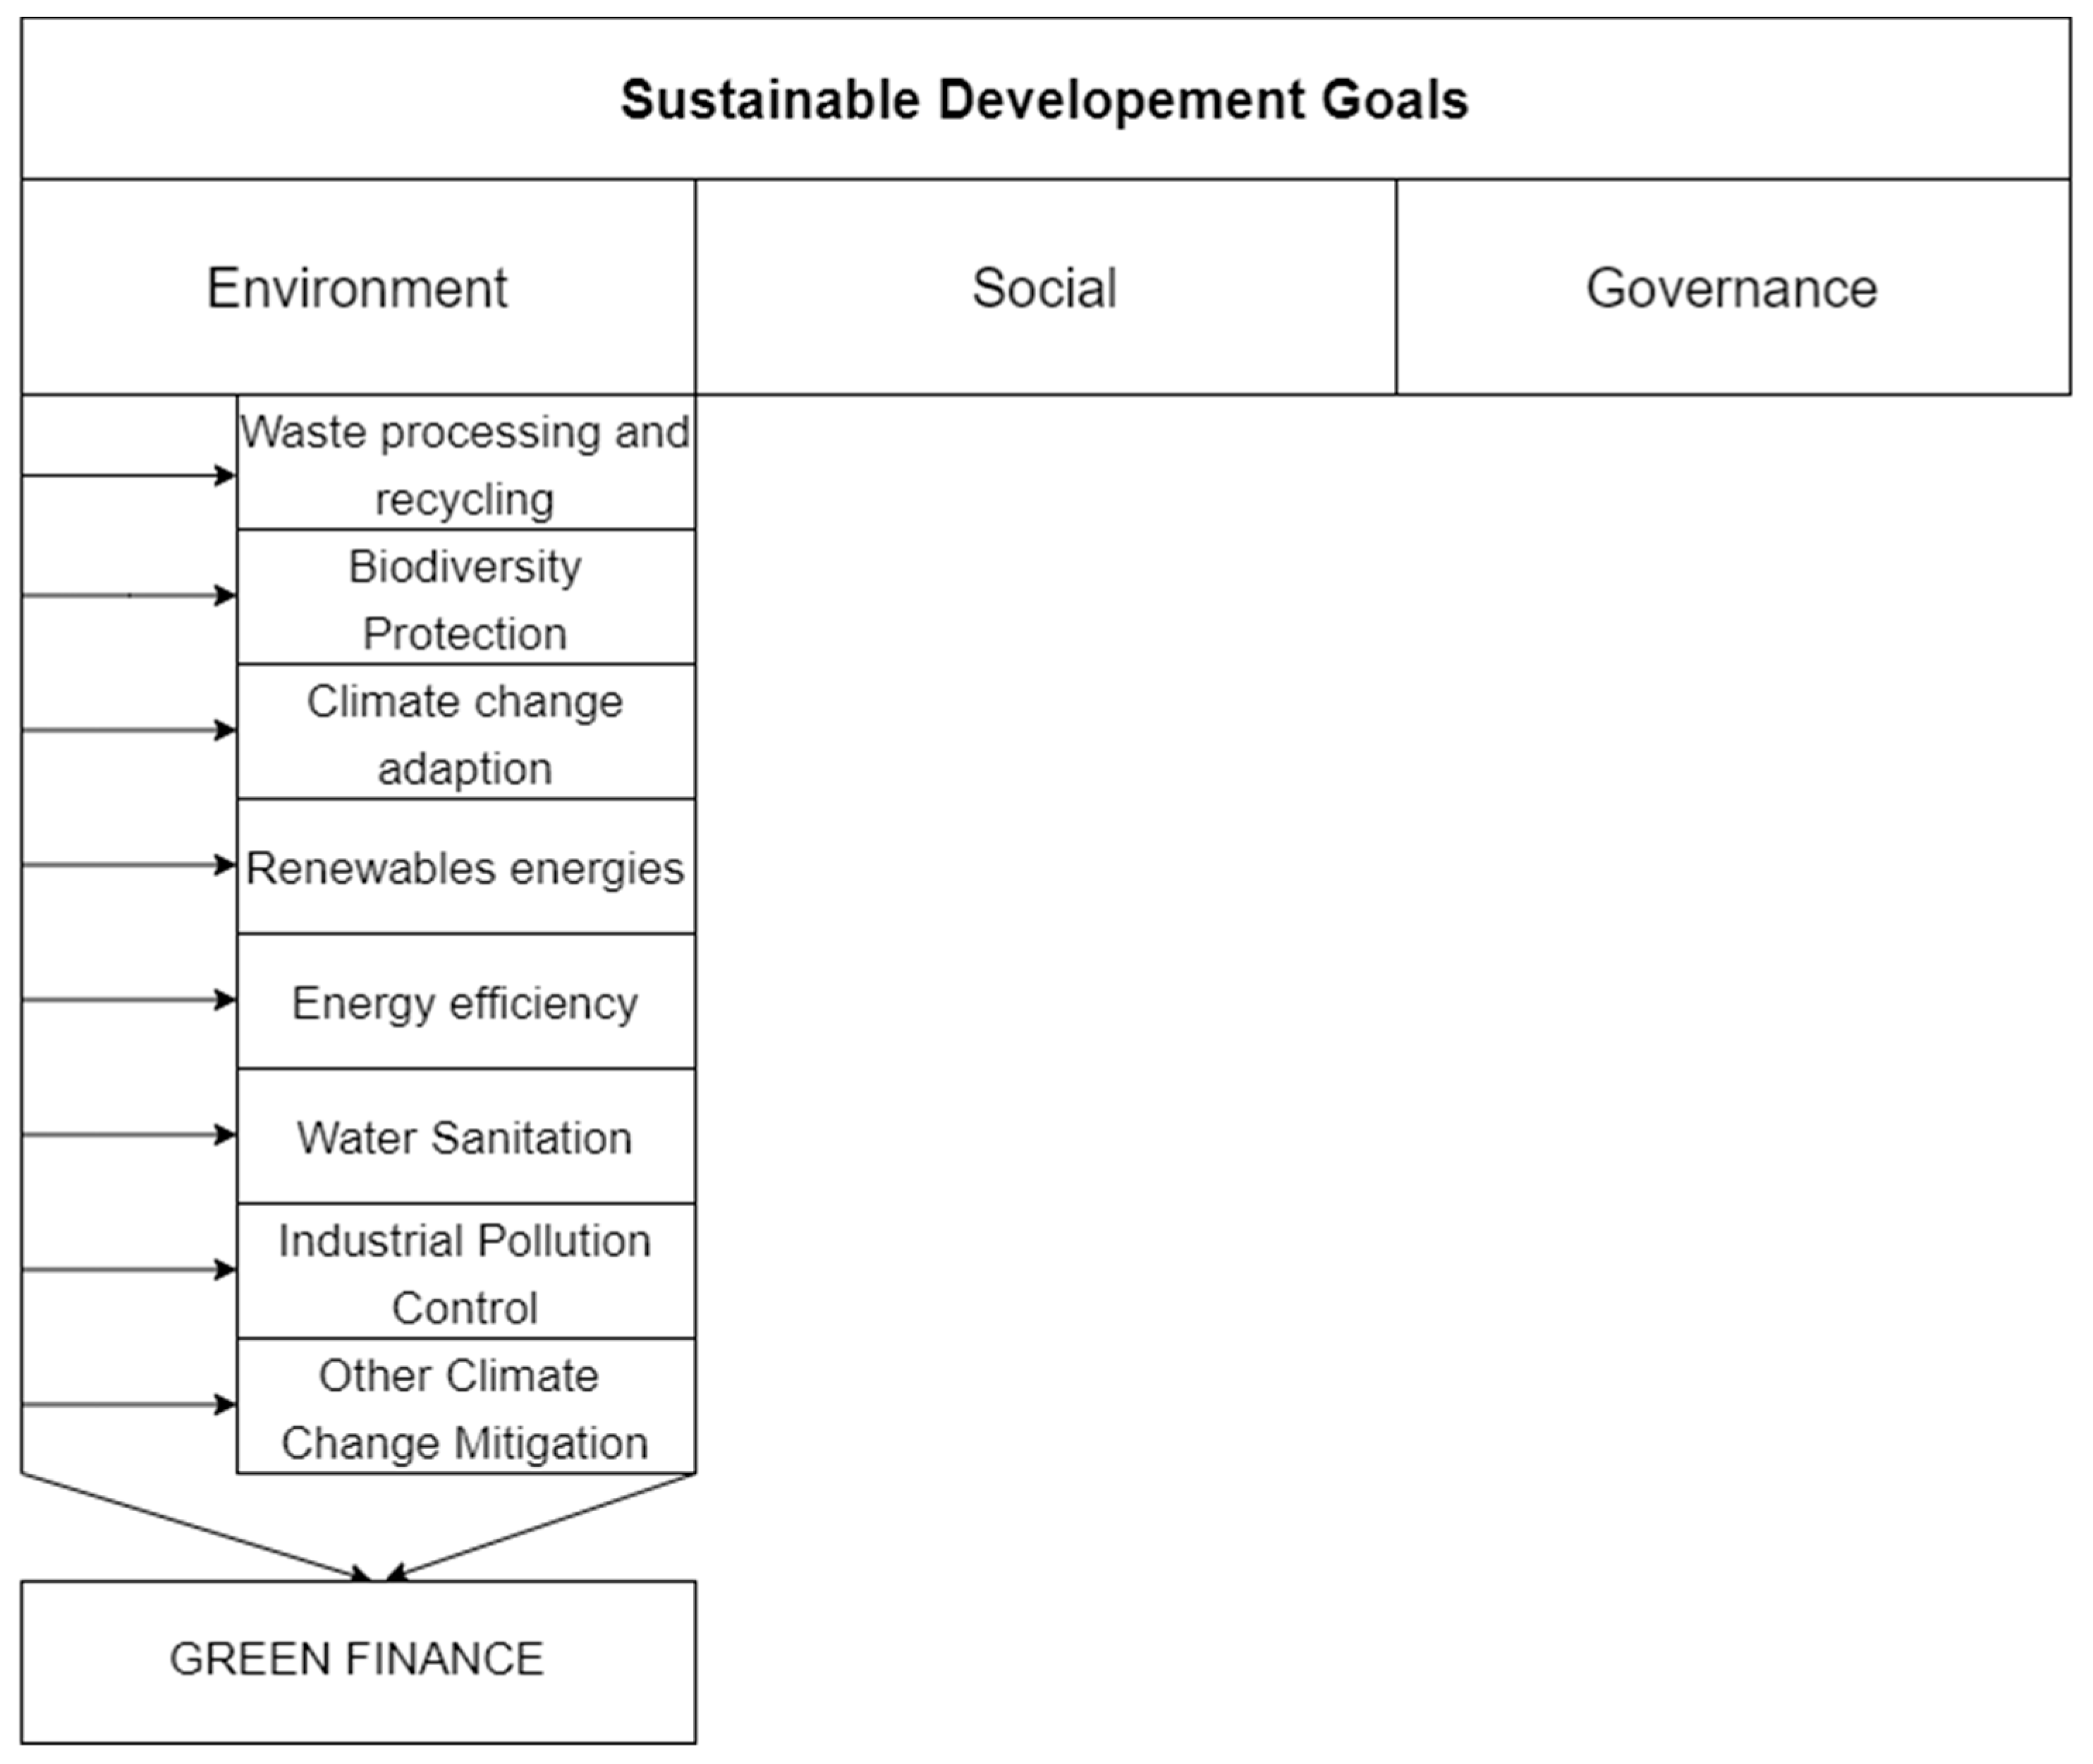
- Environment: climate change, greenhouse gas emissions, air pollution, resource efficiency, biodiversity, toxic emissions and waste and clean technology;
- Social: human rights, labor management, health and safety, human diversity, human capital development, relationship with the local community and product responsibility;
- Governance: corporate governance, compliance, corruption, board diversity, ownership, executive pay, tax transparency and risk management (Nakajima 2021).
2.2. Sociodemographic Characteristics
2.3. The Role of Information
2.4. Risk Taking
3. Materials and Methods
3.1. Factor Analysis
3.2. Cluster Analysis
- Selection of the sample of variables to be included in the given cluster;
- Defining the set of variables used to measure the individuals in the selected sample;
- Calculation of identities between variables;
- Using the cluster analysis method to create clusters of identical or similar data;
- Interpretation and characterization of the obtained results.
3.3. Crosstabs Analysis
4. Results
4.1. Sample
4.2. Segmentation
5. Discussion
6. Conclusions
Supplementary Materials
Author Contributions
Funding
Data Availability Statement
Conflicts of Interest
References
- Akaike, Hirotogu. 1998. Information Theory and an Extension of the Maximum Likelihood Principle. In Selected Papers of Hirotugu Akaike. New York: Springer, pp. 199–213. [Google Scholar]
- Amel-Zadeh, Amir, and George Serafeim. 2018. Why and How Investors Use ESG Information: Evidence from a Global Survey. Financial Analysts Journal 74: 87–103. [Google Scholar] [CrossRef]
- Anderson, W. Thomas, and William H. Cunningham. 1972. The socially conscious consumer. Journal of Marketing 36: 23–32. [Google Scholar] [CrossRef]
- Ashwin Kumar, N. C., Camille Smith, Leïla Badis, Nan Wang, Paz Ambrosy, and Rodrigo Tavares. 2016. ESG factors and risk-adjusted performance: A new quantitative model. Journal of Sustainable Finance & Investment 6: 292–300. [Google Scholar]
- Bachelet, Jua Maria, Leonardo Becchetti, and Stefano Manfredonia. 2019. The Green Bonds Premium Puzzle: The Role of Issuer Characteristics and Third-Party Verification. Sustainability 11: 1098. [Google Scholar] [CrossRef]
- Barber, M. Brad, and Terrance Odean. 2001. Boys will be boys. Gender, Overconfidence, and Common Stock Investment. The Quarterly Journal of Economics 116: 261–91. [Google Scholar] [CrossRef]
- Barreda-Tarrazona, Iván, Juan Carlos Matallín-Sáez, and M. Rosario Balaguer-Franch. 2011. Measuring investors’ socially responsible preferences in mutual funds. Journal of Business Ethics 103: 305–30. [Google Scholar] [CrossRef]
- Bassen, Alexander, Katrin Gödker, Florian Lüdeke-Freund, and Josua Oll. 2019. Climate Information in Retail Investors’ Decision-Making: Evidence From a Choice Experiment. Organization & Environment 32: 62–82. [Google Scholar]
- Bauer, Rob, and Paul Smeets. 2015. Social identification and investment decisions. Journal of Economic Behavior & Organization 117: 121–34. [Google Scholar]
- Bauer, Rob, Tobias Ruof, and Paul Smeets. 2021. Get Real! Individuals Prefer More Sustainable Investments. The Review of Financial Studies 34: 3976–4043. [Google Scholar] [CrossRef]
- Bellofatto, Anthony, Catherine D’Hondt, and Rudy DeWinne. 2018. Subjective financial literacy and retail investors’ behavior. Journal of Banking & Finance 92: 168–81. [Google Scholar]
- Benson, L. Karen, and Jacquelyn E. Humphrey. 2008. Socially responsible investment funds: Investor reaction to current and past returns. Journal of Banking & Finance 32: 1850–59. [Google Scholar]
- Berkowitz, Leonard, and Kenneth G. Lutterman. 1968. The Traditional Socially Responsible Personality. Public Opinion Quarterly 32: 169–85. [Google Scholar] [CrossRef]
- Berrou, Romain, Philippe Dessertine, and Marco Migliorelli. 2019. An Overview of Green Finance. In The Rise of Green Finance in Europe. Edited by Marco Migliorelli and Philippe Dessertine. Palgrave Studies in Impact Finance. Cham: Palgrave Macmillan. [Google Scholar]
- Bikas, Egidijus, Daiva Jurevičienė, Petras Dubinskas, and Lina Novickytė. 2013. Behavioural Finance: The Emergence and Development Trends. Procedia—Social and Behavioral Sciences 82: 870–76. [Google Scholar] [CrossRef]
- Bioy, Hortense. 2020. Do Sustainable Funds Beat their Rivals? Morningstar. Available online: https://www.morningstar.co.uk/uk/news/203214/do-sustainable-funds-beat-their-rivals.aspx (accessed on 27 January 2023).
- Bourghelle, David, Hager Jemel, and Celine Louche. 2009. The Integration of ESG Information into Investment Processes: Toward an Emerging Collective Belief? Working Paper. Ghent: Vlerick Leuven Gent Management School. [Google Scholar]
- Carolina Rezende de Carvalho Ferrei, Maria, Vinicius Amorim Sobreiro, Herbert Kimura, and Flavio Luiz de Moraes Barboza. 2016. A systematic review of literature about finance and sustainability. Journal of Sustainable Finance & Investment 6: 112–47. [Google Scholar]
- Cheah, Eng-Tuck, Dima Jamali, Johnnie E. V. Johnson, and Ming-Chien Sung. 2011. Drivers of Corporate Social Responsibility Attitudes: The Demography of Socially Responsible Investors. British Journal of Management 22: 305–23. [Google Scholar] [CrossRef]
- Chen, Hong-Yi, and Sharon S. Yang. 2020. Do Investors exaggerate corporate ESG information? Evidence of the ESG momentum effect in the Taiwanese market. Pacific-Basin Finance Journal 63: 101407. [Google Scholar] [CrossRef]
- Chiu, Yi-Bin, and Chien-Chiang Lee. 2020. Effects of financial development on energy consumption: The role of country risks. Energy Economics 90: 104833. [Google Scholar] [CrossRef]
- Climent, Francisco, and Pilar Soriano. 2011. Green and Good? The Investment Performance of US Environmental Mutual Funds. Journal of Business Ethics 103: 275–87. [Google Scholar] [CrossRef]
- Cornell, Bradford. 2020. ESG preferences, risk and return. European Financial Management 27: 12–19. [Google Scholar] [CrossRef]
- Cronbach, J. Lee. 1951. Coefficient alpha and the internal structure of tests. Psychometrika 16: 297–324. [Google Scholar] [CrossRef]
- Cui, Herui, Ruoyao Wang, and Haoran Wang. 2020. An evolutionary analysis of green finance sustainability based on multi-agent game. Journal of Cleaner Production 269: 121799. [Google Scholar] [CrossRef]
- de Freitas Netto, Sebastião Vieira, Marcos Felipe Falcão Sobral, Ana Regina Bezerra Ribeiro, and Gleibson Robert da Luz Soares. 2020. Concepts and forms of greenwashing: A systematic review. Environmental Sciences Europe 32: 19. [Google Scholar] [CrossRef]
- Diouf, Dominique, Tessa Hebb, and El Hadji Touré. 2014. Exploring Factors that Influence Social Retail Investors’ Decisions: Evidence from Desjardins Fund. Journal of Business Ethics 134: 45–67. [Google Scholar] [CrossRef]
- Dorfleitner, Gregor, and Sebastian Utz. 2014. Profiling German-speaking socially responsible investors. Qualitative Research in Financial Markets 6: 118–56. [Google Scholar] [CrossRef]
- Escrig-Olmedo, Elena, María Jesús Muñoz-Torres, and María Ángeles Fernández-Izquierdo. 2012. Sustainable Development and the Financial System: Society’s Perceptions About Socially Responsible Investing. Business Strategy and the Environment 22: 410–28. [Google Scholar] [CrossRef]
- Falcone, Pasquale Marcello, and Edgardo Sica. 2019. Assessing the Opportunities and Challenges of Green Finance in Italy: An Analysis of the Biomass Production Sector. Sustainability 11: 517. [Google Scholar] [CrossRef] [Green Version]
- Faradynawati, Ida Ayu Agung, and Inga-LillI Söderberg. 2022. Sustainable Investment Preferences among Robo-Advisor Clients. Sustainability 14: 12636. [Google Scholar] [CrossRef]
- Garg, Aashish, Pooja Goel, Anuj Sharma, and Nripendra P. Rana. 2022. As you sow, so shall you reap: Assessing drivers of socially responsible investment attitude and intention. Technological Forecasting and Social Change 184: 122030. [Google Scholar] [CrossRef]
- Ghvanidze, Sophie, Natalia Velikova, Tim H. Dodd, and Wilna Oldewage-Theron. 2016. Consumers’ environmental and ethical consciousness and the use of the related food products information: The role of perceived consumer effectiveness. Appetite 107: 311–22. [Google Scholar] [CrossRef]
- Gilchrist, David, Jing Yu, and Rui Zhong. 2021. The Limits of Green Finance: A Survey of Literature in the Context of Green Bonds and Green Loans. Sustainability 13: 478. [Google Scholar] [CrossRef]
- Goodella, John W., Shaen Corbet, Miklesh Prasad Yadav, Satish Kumar Sudhi Sharma, and Kunjana Malikg. 2022. Time and frequency connectedness of green equity indices: Uncovering a socially important link to Bitcoin. International Review of Financial Analysis 84: 102379. [Google Scholar] [CrossRef]
- Graham, Jhon R., and Alok Kumar. 2006. Do dividend clienteles exist? Evidence on dividend preferences of retail investors. The Journal of Finance 61: 1305–36. [Google Scholar] [CrossRef]
- Hachenberg, Britta, and Dirk Schiereck. 2018. Are green bonds priced differently from conventional bonds? Journal of Asset Management 19: 371–83. [Google Scholar] [CrossRef]
- Halbritter, Gerhard, and Gregor Dorfleitner. 2015. The wages of social responsibility—Where are they? A critical review of ESG investing. Review of Financial Economics 26: 25–35. [Google Scholar] [CrossRef]
- Han, Tea-Im. 2018. Determinants of Organic Cotton Apparel Purchase: A Comparison of Young Consumers in the U.S.A. and South Korea. Sustainability 10: 2025. [Google Scholar] [CrossRef]
- Han, Bangwool, and Minho Kim. 2019. Hofstede’s Collectivistic Values and Sustainable Growth of Online Group Buying. Sustainability 11: 1016. [Google Scholar] [CrossRef] [Green Version]
- Hansmann, Ralph, Harald A. Mieg, and Peter Frischknecht. 2012. Principal sustainability components: Empirical analysis of synergies between the three pillars of sustainability. International Journal of Sustainable Development & World Ecology 19: 451–59. [Google Scholar]
- Hao, Yu, Ling’ou Wang, Lingyun Zhu, and Minjie Ye. 2018. The dynamic relationship between energy consumption, investment and economic growth in China’s rural area: New evidence based on provincial panel data. Energy 154: 374–82. [Google Scholar] [CrossRef]
- Herman, Bernadett. 2022. Fontos a fiataloknak a zöld bankolás, de keveset tudnak róla. Available online: https://www.napi.hu/magyar-gazdasag/magyar-bankholding-mastercard-fenntarthatosag-zold-penzugyek-felmeres-fiatalok-bank-bakszamla.763679.html (accessed on 28 November 2022).
- Higgins, E. T. 1997. Beyond pleasure and pain. American Psychologist 52: 1280–300. [Google Scholar] [CrossRef]
- Hill, Paul Ronald, Thomas Ainscough, Todd Shank, and Daryl Manullang. 2006. Corporate Social Responsibility and Socially Responsible Investing: A Global Perspective. Journal of Business Ethics 70: 165–74. [Google Scholar] [CrossRef]
- Hofstetter, Hedwig, Elise Dusseldorp, Pepijn van Empelen, and Theo W. G. M. Paulussen. 2014. A primer on the use of cluster analysis or factor analysis to assess co-occurrence of risk behaviors. Preventive Medicine 67: 141–46. [Google Scholar] [CrossRef]
- Hood, Matthew, John R. Nofsinger, and Abhishek Varma. 2013. Conservation, Discrimination, and Salvation: Investors’ Social Concerns in the Stock Market. Journal of Financial Services Research 45: 5–37. [Google Scholar] [CrossRef]
- Hotelling, Harold. 1933. Analysis of a complex of statistical variables into principal components. Journal of Educational Psychology 24: 417–41. [Google Scholar] [CrossRef]
- IFC. 2020. Emerging Market Green Bonds Report 2020. On the Road to Green Recovery. Washington, DC: Amundi Asset Management (Amundi) and International Finance Corporation (IFC), pp. 3–37. [Google Scholar]
- Jansson, Magnus, Joakim Sandberg, Anders Biel, and Tommy Gärling. 2014. Should pension funds’ fiduciary duty be extended to include social, ethical and environmental concerns? A study of beneficiaries’ preferences. Journal of Sustainable Finance & Investment 4: 213–29. [Google Scholar]
- Jókuthy, Laura. 2020. Zöld kötvények: Befektetés a jövő generációnak (Green Bonds: Investment for the Next Generation). Available online: https://www.mnb.hu/letoltes/jokuthy-laura-zold-kotvenyek-befektetes-a-jovo-generaciojanak.pdf?fbclid=IwAR028Z_dpYZWJPpmA5_V1muEiDza_hqfUvaSSQXiNH3SOjMGqfkcfyiVxps (accessed on 27 January 2023).
- Jonwall, Renu, Seema Gupta, and Shuchi Pahuja. 2022. A comparison of investment behavior, attitudes, and demographics of socially responsible and conventional investors in India. Social Responsibility Journal, ahead-of-print. [Google Scholar]
- Junkus, C. Joan, and Thomas C. Berry. 2010. The demographic profile of socially responsible investors. Managerial Finance 36: 474–81. [Google Scholar] [CrossRef]
- Khemir, Souhir, Chedli Baccouche, and Salma Damak Ayadi. 2019. The influence of ESG information on investment allocation decisions: An experimental study in an emerging country. Journal of Applied Accounting Research 20: 458–80. [Google Scholar] [CrossRef]
- Kopnina, Helen. 2015. The victims of unsustainability: A challenge to sustainable development goals. International Journal of Sustainable Development & World Ecology 23: 113–21. [Google Scholar]
- Kuslits, Béla, and Tamás Kocsis. 2019. Back to the marketplace: Sustainable food consumption in budapest. Magyar Tudomány 180: 884–93. [Google Scholar]
- Lee, Chi-Chuan, and Chien-Chiang Lee. 2022. How does green finance affect green total factor productivity? Evidence from China. Energy Economics 107: 105863. [Google Scholar] [CrossRef]
- Lozano, Josep M., Laura Albareda, and M. Rosario Balaguer. 2006. Socially Responsible Investment in the Spanish financial market. Journal of Business Ethics 69: 305–16. [Google Scholar] [CrossRef]
- Luo, Cuicui, and Desheng Wu. 2016. Environment and economic risk: An analysis of carbon emission market and portfolio management. Environmental Research 149: 297–01. [Google Scholar] [CrossRef] [PubMed]
- Machová, Renáta, Rebeka Ambrus, Tibor Zsigmond, and Ferenc Bakó. 2022. The impact of green marketing on consumer behavior in the market of palm oil products. Sustainability 14: 1364. [Google Scholar] [CrossRef]
- Maiti, Moinak. 2020. Is ESG the succeeding risk factor? Journal of Sustainable Finance & Investment 11: 199–213. [Google Scholar]
- McLachlan, Jonathan, and John Gardner. 2004. A comparison of socially responsible and conventional investors. Journal of Business Ethics 52: 11–25. [Google Scholar] [CrossRef]
- Nakajima, Tadahiro. 2021. ESG Investment. In ESG Investment in the Global Economy. SpringerBriefs in Economics. Singapore: Springer. [Google Scholar]
- Ng, Artie W. 2018. From sustainability accounting to a green financing system: Institutional legitimacy and market heterogeneity in a global financial centre. Journal of Cleaner Production 195: 585–92. [Google Scholar] [CrossRef]
- Nilsson, Jonas. 2009. Segmenting socially responsible mutual fund investors: The influence of financial return and social responsibility. International Journal of Bank Marketing 27: 5–31. [Google Scholar] [CrossRef]
- Ortas, Eduardo, and José M. Moneva. 2013. The Clean Techs equity indexes at stake: Risk and return dynamics analysis. Energy 57: 259–69. [Google Scholar] [CrossRef]
- Pérez-Gladish, Blanca, Karen Benson, and Robert Faff. 2012. Profiling socially responsible investors: Australian evidence. Australian Journal of Management 37: 189–09. [Google Scholar] [CrossRef]
- Pham, Michel Tuan, and Tamar Avnet. 2004. Ideals and Oughts and the Reliance on Affect versus Substance in Persuasion. Journal of Consumer Research 30: 503–18. [Google Scholar] [CrossRef]
- Przychodzen, Justyna, Fernando Gómez-Bezares, Wojciech K. Przychodzen, and Mikel Larreina. 2016. ESG Issues among Fund Managers—Factors and Motives. Sustainability 8: 1078. [Google Scholar] [CrossRef]
- Raberto, Marco, Bulent Ozel, Linda Ponta, Andrea Teglio, and Silvano Cincotti. 2019. From financial instability to green finance: The role of banking and credit market regulation in the Eurace model. Journal of Evolutionary Economics 29: 429–65. [Google Scholar] [CrossRef] [Green Version]
- Reboredo, Juan C., Miguel Quintela, and Luis A. Otero. 2017. Do investors pay a premium for going green? Evidence from alternative energy mutual funds. Renewable and Sustainable Energy Reviews 73: 512–20. [Google Scholar] [CrossRef]
- Riedl, Arno, and Paul Smeets. 2017. Why Do Investors Hold Socially Responsible Mutual Funds? The Journal of Finance 72: 2505–550. [Google Scholar] [CrossRef]
- Risi, David, Falko Paetzold, and Anne Kellers. 2021. Wealthy Private Investors and Socially Responsible Investing: The Influence of Reference Groups. Sustainability 13: 12931. [Google Scholar] [CrossRef]
- Rosen, Barry N., Dennis M. Sandler, and David Shani. 1991. Social issues and socially responsible investment behavior: A preliminary empirical investigation. The Journal of Consumer Affairs 25: 221–34. [Google Scholar] [CrossRef]
- Rossi, Mariacristina, Dario Sansone, Arthur van Soest, and Costanza Torricelli. 2019. Household Preferences for Socially Responsible Investments. Journal of Banking & Finance 105: 107–20. [Google Scholar]
- Saleem, Mohd, and Matloob Ullah Khan. 2021. Green finance for sustainable development: A bibliometric review of current status, development and prospects. International Journal of Advanced Research in Commerce, Management & Social Science (IJARCMSS) 4: 1–9. [Google Scholar]
- Schwarz, Gideon. 1978. Estimating the dimension of a model. The Annals of Statistics 6: 461–64. [Google Scholar] [CrossRef]
- Sreekumar, Nair Abhilash, and Rani Ladha. 2014. Determinants of non-economic investment goals among Indian investors. Corporate Governance 14: 714–27. [Google Scholar] [CrossRef]
- Statman, Meir. 2014. Behavioral finance: Finance with normal people. Borsa Istanbul Review 14: 65–73. [Google Scholar] [CrossRef]
- Sultana, Sayeman, Norhayah Zulkifli, and Dalilawati Zainal. 2018. Environmental, Social and Governance (ESG) and Investment Decision in Bangladesh. Sustainability 10: 1831. [Google Scholar] [CrossRef]
- Tippet, John, and Philomena Leung. 2001. Defining ethical investment and its demography in Australia. Australian Accounting Review 11: 44–55. [Google Scholar] [CrossRef]
- van Duuren, Emiel, Auke Plantinga, and Bert Scholtens. 2015. ESG Integration and the Investment Management Process: Fundamental Investing Reinvented. Journal of Business Ethics 138: 525–33. [Google Scholar] [CrossRef] [Green Version]
- Velicer, Wayne F., and Douglas N. Jackson. 1990. Component Analysis versus Common Factor Analysis: Some issues in Selecting an Appropriate Procedure. Multivariate Behavioral Research 25: 1–28. [Google Scholar] [CrossRef] [PubMed]
- Von Wallis, Miriam, and Christian Klein. 2014. Ethical requirement and financial interest: A literature review on socially responsible investing. Business Research 8: 61–98. [Google Scholar] [CrossRef]
- Wang, Yao, and Qiang Zhi. 2016. The Role of Green Finance in Environmental Protection: Two Aspects of Market Mechanism and Policies. Energy Procedia 104: 311–16. [Google Scholar] [CrossRef]
- Wang, En-Ze, Chien-Chiang Lee, and Yaya Li. 2022. Assessing the impact of industrial robots on manufacturing energy intensity in 38 countries. Energy Economics 105: 105748. [Google Scholar] [CrossRef]
- Wen, Huwei, Chien-Chiang Lee, and Fengxiu Zhou. 2022. How does fiscal policy uncertainty affect corporate innovation investment? Evidence from China’s new energy industry. Energy Economics 105: 105767. [Google Scholar] [CrossRef]
- Wood, Johnny. 2022. Gen Z Cares about Sustainability More than Anyone Else—And Is Starting to Make Others Feel the Same Way. Available online: https://www.weforum.org/agenda/2022/03/generation-z-sustainability-lifestyle-buying-decisions/ (accessed on 22 October 2022).
- Young, William, Kumju Hwang, Seonaidh McDonald, and Caroline J. Oates. 2010. Sustainable consumption: Green consumer behaviour when purchasing products. Sustainable Development 18: 20–31. [Google Scholar] [CrossRef]
- Yousaf, Imran, Muhammad T. Suleman, and Riza Demirer. 2022. Green investments: A luxury good or a financial necessity? Energy Economics 105: 105745. [Google Scholar] [CrossRef]
- Zhou, Kaile, and Yiwen Li. 2019. Carbon finance and carbon market in China: Progress and challenges. Journal of Cleaner Production 214: 536–49. [Google Scholar] [CrossRef]
- Zhou, Rongrong, and Michel Tuan Pham. 2004. Promotion and Prevention across Mental Accounts: When Financial Products Dictate Consumers& Investment Goals. Journal of Consumer Research 31: 125–35. [Google Scholar]
- Zhu, Dajian. 2017. Research from global Sustainable Development Goals (SDGs) to sustainability science based on the object-subject-process framework. Chinese Journal of Population Resources and Environment 15: 8–20. [Google Scholar] [CrossRef]


| Factors and Items | Factor Loading | Eigenvalue | Cumulative Percent of Variance | Cronbach’s α |
|---|---|---|---|---|
| Greens, the financial return matters less | 2.97 | 14.356 | 0.739 | |
| How important is sustainability to you? | 0.768 | |||
| In the case of investments with the same risk, my decision is influenced by the sustainability criteria, not the return. | 0.760 | |||
| My goal is to increase the proportion of my investments in green financial products. | 0.738 | |||
| Green financial products finance socially higher added value investments. | 0.722 | |||
| Sustainable | 2.288 | 28.654 | 0.701 | |
| How much more are you willing to pay for sustainably sourced products? | 0.704 | |||
| To what extent do you consider yourself a responsible consumer? | 0.699 | |||
| Social expectations and long-term sustainable thinking can influence me to invest in green financial products. | 0.651 | |||
| My goal is to invest as much as possible in long-term, predictable, low-risk stocks and financial assets (blue-chip shares, developed country government bonds etc.). | 0.651 | |||
| Diversifying my portfolio. | 0.650 | |||
| Risk takers for return | 2.210 | 42.464 | 0.708 | |
| For a financial product with the same risk but a higher return, I prefer the higher return. | 0.795 | |||
| In the case of a green financial product with the same risk but with a higher return, I would rather choose the green financial product than another financial product. | 0.743 | |||
| In my investment portfolio, stocks and financial assets with higher risk represent a significant percentage (government bonds of risky developing countries, start-up investments, cryptocurrencies, etc.). | 0.740 | |||
| Cryptocurrencies are the investment option with the highest return in the future, which is why I prefer to invest in cryptocurrencies. | 0.636 | |||
| Influenceable | 1.700 | 53.088 | 0.596 | |
| My family and environment can influence me to invest in green financial product. | 0.786 | |||
| How influenceable do you consider yourself to be in making financial investment decisions? | 0.749 | |||
| I prefer to keep my money in a sight deposit for future opportunities. | 0.650 |
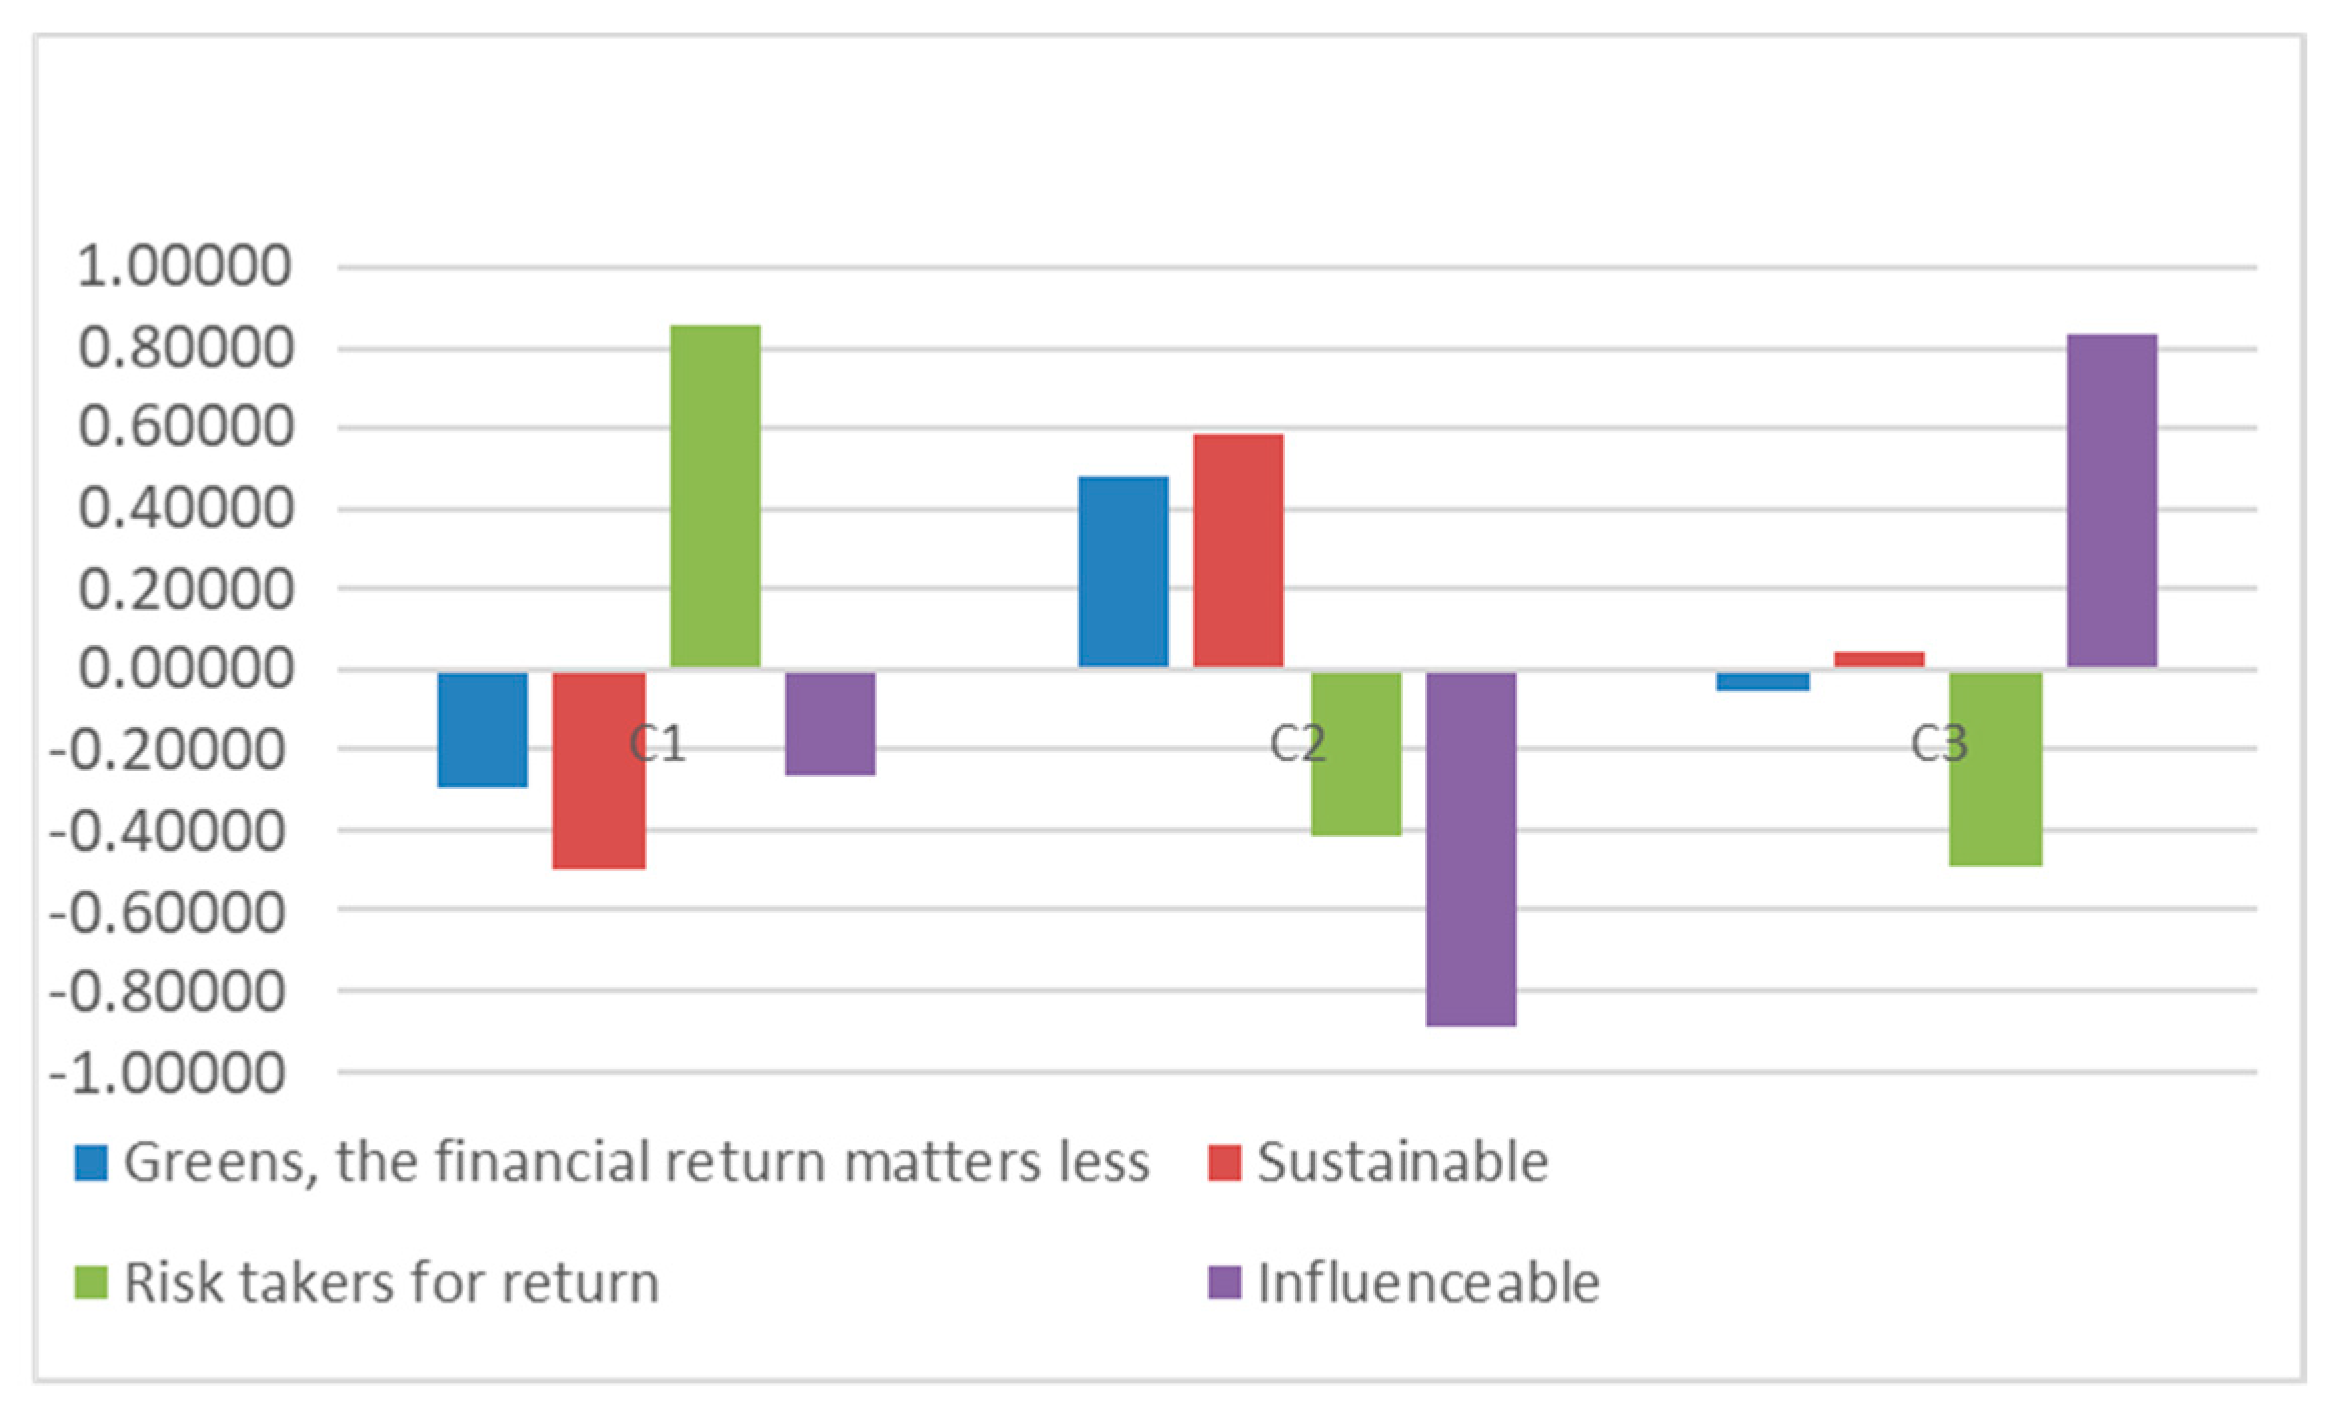
| Factors | Cluster (Mean of Factor Scores) | F | p (sig.) | ||
|---|---|---|---|---|---|
| C1 (n = 170) | C2 (n = 128) | C3 (n = 190) | |||
| Greens, the financial return matters less | −0.29803 | 0.47966 | −0.05648 | 24,783 | <0.001 |
| Sustainable | −0.49623 | 0.58767 | 0.04809 | 52,379 | <0.001 |
| Risk takers for return | 0.85744 | −0.41524 | −0.48744 | 158,101 | <0.001 |
| Influenceable | −0.26520 | −0.88680 | 0.83471 | 245,499 | <0.001 |
| Items | p (sig.) | C1—Interested in Financial Return | C2—Sustainable Financial Investor | C3—Influenceable |
|---|---|---|---|---|
| Gender | <0.001 | female (37.6%), male (62.4%) | female (62.5%), male (37.5%) | female (66.8%), male (33.2%) |
| Age | <0.05 | 32–38 (23.5%), 39–45 (24.1%), over 45 (21.8%) | 18–24 (18.0%), 25–31 (26.6%), 32–38 (27.3%) | 18–24 (12.6%), 25–31 (26.8%), 32–38 (26.8%) |
| Education | <0.001 | Primary school (8 primary) (11.2%), Vocational school (26.5%), Higher vocational school (28.2%) | Currently studying in higher school (29.7%), Diploma (BSC/MSC) (28.9%), Postgraduate qualification (6.3%) | Primary school (8 primary) (11.6%), Vocational school (25.8%), Higher vocational school (20.0%) |
| Position at work | <0.001 | Manager (35.9%), Entrepreneur (20.0%) | Student (37.5%) | Student (34.2%), Employees (39.5%) |
| Expense per month (thousand HUF) | <0.001 | 381–480 (27.1%), over 481 (30.6%) | 180 below (14.8%), 181–280 (26.6%), 281–380 (25.8%) | 181–280 (27.4%), 281–380 (21.1%), 381–480 (27.9%) |
| Financial goals | <0.001 | Long- and short-term financial goals (50.0%) | Long- and short-term financial goals (56.3%) | In some cases, it states financial goals (47.9%) |
| Gathering information on financial topics | <0.001 | Daily information gathering (58.2%) | Daily information gathering (58.6%) | Information gathering is not typical (35.8%) |
Disclaimer/Publisher’s Note: The statements, opinions and data contained in all publications are solely those of the individual author(s) and contributor(s) and not of MDPI and/or the editor(s). MDPI and/or the editor(s) disclaim responsibility for any injury to people or property resulting from any ideas, methods, instructions or products referred to in the content. |
© 2023 by the authors. Licensee MDPI, Basel, Switzerland. This article is an open access article distributed under the terms and conditions of the Creative Commons Attribution (CC BY) license (https://creativecommons.org/licenses/by/4.0/).
Share and Cite
Gáspár, S.; Pataki, L.; Barta, Á.; Thalmeiner, G.; Zéman, Z. Consumer Segmentation of Green Financial Products Based on Sociodemographic Characteristics. J. Risk Financial Manag. 2023, 16, 98. https://0-doi-org.brum.beds.ac.uk/10.3390/jrfm16020098
Gáspár S, Pataki L, Barta Á, Thalmeiner G, Zéman Z. Consumer Segmentation of Green Financial Products Based on Sociodemographic Characteristics. Journal of Risk and Financial Management. 2023; 16(2):98. https://0-doi-org.brum.beds.ac.uk/10.3390/jrfm16020098
Chicago/Turabian StyleGáspár, Sándor, László Pataki, Ákos Barta, Gergő Thalmeiner, and Zoltán Zéman. 2023. "Consumer Segmentation of Green Financial Products Based on Sociodemographic Characteristics" Journal of Risk and Financial Management 16, no. 2: 98. https://0-doi-org.brum.beds.ac.uk/10.3390/jrfm16020098