Wireless Networks for Traffic Light Control on Urban and Aerotropolis Roads


1
Instituto Superior Técnico, Universidade de Lisboa, 1049-001 Lisboa, Portugal
2
ICT, Universidade de Évora, 7000-645 Évora, Portugal
3
IDMEC, Instituto Superior Técnico, Universidade de Lisboa, 1049-001 Lisboa, Portugal
4
Departmento de Física, Escola de Ciências e Tecnologia, Universidade de Évora, 7000-645 Évora, Portugal
*
Author to whom correspondence should be addressed.
J. Sens. Actuator Netw. 2020, 9(2), 26; https://0-doi-org.brum.beds.ac.uk/10.3390/jsan9020026
Submission received: 8 February 2020
/
Revised: 6 May 2020
/
Accepted: 13 May 2020
/
Published: 28 May 2020
(This article belongs to the Special Issue Advanced Instrumentation for Power Converter Applications)
Abstract
:This paper presents a traffic light system based on wireless communication that provides a support infrastructure for intelligent control in the context of smart cities and aerotropolis areas. An aerotropolis is a metropolitan subregion with an infrastructure centered an airport. Traffic intensity is increasing all over the world. Intelligent dynamic traffic light system control is being sought to replace classic conventional manual and time-based systems. In this work, a wireless sensor network is designed and implemented to feed real-time data into an intelligent traffic light system control. A physical prototype is implemented for experimental validation outside the laboratory environment. The physical prototype shows robustness against unexpected issues and local failures. The results are positive in terms of the scope of experience gained, and there is potential for these tests to be extended to larger areas.
1. Introduction
In large cities and cities in which the metropolitan area has a percentage of its infrastructure and economy centered around an airport (aerotropolis) [1], a large percentage of the population travels the streets. Traffic jams are frequent [2,3] and contribute to lower efficiency in people’s work. The objectives of airport and surface transportation planning objectives are to ensure maximal access to airports and business sites with minimal time and cost. In the aerotropolis model, the time and cost of connectivity supersede space and distance as the primary planning metrics. It is not the speed, but the time required for aerotropolis firms to connect to their suppliers, customers, and enterprise partners that is important [1,4]. Synergy between airports and urban development is necessary for sustainable development, such as through improvement of the urban surface transport capacity [5,6].
To deal with this problem, the most natural solution is to build new roads, but this is generally unfeasible in urban areas due to the presence of existing buildings, which makes the construction of these new roads very expensive or even impossible [7]. Hence, traffic density keeps increasing at an alarming rate in major cities, which calls for the development of intelligent traffic light control to replace the conventional manual and time-based methods [8]. To ease this problem and improve mobility, safety, and traffic efficiency, many countries are improving their existing transportation systems [9]. Traffic signal control systems can be either static or dynamic. In static systems, the predetermined timing of the signal is optimized using historically measured data. However, such systems are not able to predict or adapt to changes in demand. Moreover, they do not deal well with accidents and other disturbances [10,11]. When dynamic systems are used, traffic signal timing is adapted to the current conditions, which are measured from sensors [11]. This leads to better traffic control (TC).
Large cities usually implement a traffic monitoring system. A large number of sensors are deployed under the pavement. TC central receives all of the information and controls the traffic accordingly. The necessity of a large cabling infrastructure usually limits their use to central areas. Currently, wireless sensor devices are becoming less and less expensive, which enables the rapid expansion of monitoring system structures [12].
Hence, the sensor market has become larger, which allows the connection of more sophisticated sensors. The usage of radar sensors or digital cameras has been increased in order to allow the measurement of car speeds as well as general variables, such as the quantity of cars on the road to be measured in order to inform drivers directly and avoid congestion [13].
TC systems have evolved to provide better traffic management [14]. Intelligent Transport Systems (ITSs) are applications that provide innovative services for traffic management. ITS provide users with better information to allow smarter, safer, and more coordinated use of ITS infrastructures. In this paper, the authors combine ITSs with wireless communication technology (WCT) [15] systems that are easier to install and more easily expandable to areas outside the city center. In a similar context, Reference [16] presents a self-contained review of machine learning techniques and the Internet of Things (IoT) applications in ITSs.
An ITS acquires plenty of information important for the optimization of traffic from sensors installed along roads and from traffic signals. However, it is also important for communication to be trustworthy [8,17]. Moreover, there should be no limits to the sensor coverage available to TC. Temperature, pressure, CO2 levels, and noise are examples of data that can be used to optimize TC [18,19].
The integration of TC is just one component of the Smart Cities (SCs). Actually, SCs encompass other aspects of city management such as waste, energy, water supply, and water sanitation [20].
One of the main goals of the work presented in this paper is to create an independent and secure wireless infrastructure to support ITS and SCs. Wireless technologies present advantages and drawbacks, but the balance seems to be in favor of their use for traffic sensing and control.
The main contribution of this paper is the definition and performance analysis of a reliable communication infrastructure for maintaining and continuously refreshing the real-time database of sensors and actuators that support the optimization methods for intelligent traffic management.
2. Related Work
Many solutions exist with respect to wireless communications, including WiMAX, WiFi, Bluetooth, ZigBee, UWB, NFC, RFID, and GSM [21]. There is no single solution for dealing with traffic light control. NFC and RFID are primarily used for shorter distances than the typical distances between traffic lights in a crossroad. The Bluetooth range is adequate for communication on the scale of a crossroad, but it is not adequate for communication among crossroads. ZigBee has a range compatible with relatively close crossroads. A large advantage of ZigBee is its capability to establish a mesh grid that can achieve much larger distances as long as there are ZigBee devices to propagate the signal. Moreover, the grid has a high level of robustness because there are many possible ways to route the messages along the different devices, even if some devices are faulty. GSM is a reliable solution for almost all distances, but it means that the system is dependent on a private operator. UWB and WiMax are not yet fully established.
Hence, in this paper, we examine ZigBee as the solution. ZigBee [22,23,24] is a solution used for wireless sensor networks. ZigBee devices have low power consumption due to their ability to reduce power consumption when they enter a sleep stage.
In Reference [25], the concept of the association of an IoT network with the interconnections of different services in the SC structure is presented. The use of acoustic measurement sensors and air quality is addressed to provide data about traffic congestion at the central control point. The different styles and communication modules that make up the structure of SC are also developed.
In the traffic lights scope, data acquired in a certain location are used in that same location to determine which roads to open based on any pre-programmed or pre-defined algorithm or local sensors. In Reference [26], an infrastructure for vehicle communication and a control system for intelligent speed control is used to automatically adjust vehicle speeds to the circumstances of the road. In Reference [27], an adaptive traffic light control algorithm is presented that adjusts both the sequence and length of traffic lights in accordance with the real time traffic detected. In Reference [28], a Sensor Network is used for emergency vehicle alert and traffic density calculation methods using Infrared Sensors and GPS. In Reference [10], an approach is made that includes some of the intelligent computational methods developed in recent times: neural networks, fuzzy inference system controllers, and machine learning. A controller that uses the Q-learning algorithm to make adaptations to the switching time of TC signals is also developed. Two different scenarios are used to compare the different switching time control methods. In Reference [29], a system for responding to traffic light failures using the use of written messages via GSM is presented. Typical faults are indicated and how the entire controller deals with a possible fault and its resolution is discussed. In Reference [30], an adaptive system based on wireless sensors is presented in real time. It is used to collect sensor data about the number and length of vehicles and their speed. The information is processed by a local agent and control measures are made depending on the analysis of the data received. A comprehensive study similar to this work using Fog Computing is presented in Reference [31]. However, it lacks experimental results.
In the wider area scope, the central system processes the data acquired remotely in the various locations with devices able to do so. The central system sends information to all of the local controllers not only to improve the traffic flow in that intersection but also in the neighbor intersections. This type of system also allows priority vehicles, like ambulances, to be tracked to accommodate easier and quicker transportation of critical patients and public transportation priority roads. In a wider view, such systems might also be regarded as essential elements of “Just In Time” logistics strategies [32]. The reaction capability of a system is limited to the central data analysis. Nevertheless, the central system has to have the capacity to respond to foreseeable events [33,34].
The robustness of the TC system communications is an important issue that must be handled. The overall TC is critical and a general failure would have very severe consequences. The choice of communication technology may have a strong impact on the robustness. Centralized solutions are avoided because they rely on a single central point that may fail. Mesh grids are the preferred solution since they do not rely on a unique device to keep the traffic going [35]. Moreover, even the central control stations may be redundant. In References [36,37,38,39,40], the evolution of different communication architectures is characterized when applied to Smart Grids. Each of the different technologies currently used is approached and comparisons are made between them, which indicates their current state of development and application.
Compared with previous work, this paper presents the definition and performance analysis of a reliable wireless communications infrastructure for intelligent traffic management. The system relies on a ZigBee wireless structure. A communication protocol (CP) for packing the sensor and actuator data into messages is defined and its performance is studied under realistic conditions outside the laboratory.
3. System Development
3.1. Configuration
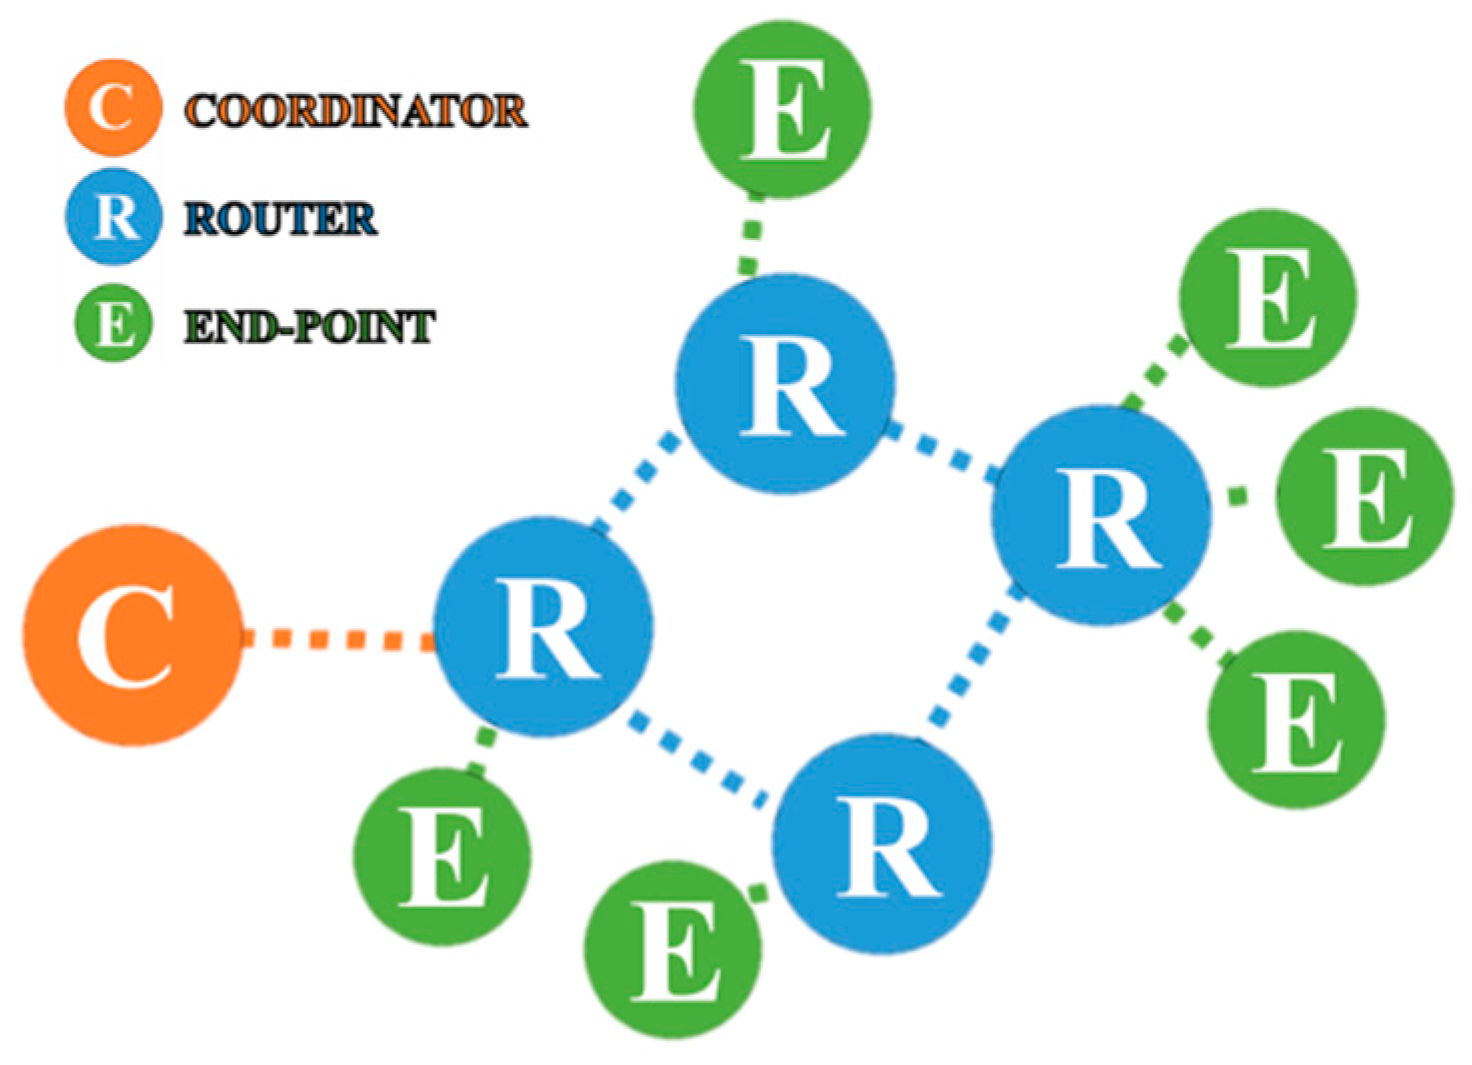
As shown in the previous chapter, a communication system based on a mesh topology was chosen for its robustness. The ZigBee mesh relies on the coordinator, the router, and the end-points, as shown in Figure 1.
3.2. Protocol and Security
ZigBee implements several complex security measures to ensure secure network communication. ZigBee implements the security measures of IEEE 802.15.4, including access control, message integrity, message confidentiality, and replay protection [41], which adds extra security layers to the Network and Application layers. The ZigBee security measures rely on an Advanced Encryption Standard (AES) 128b encryption algorithm that is deployed with a master key pre-installed in the device. This is a link key managed by the Application layer that is unique between two nodes, and a unique 128b key that is shared among all nodes in a ZigBee network [42].
A 128-bit link key is shared by two devices to secure the communication between them. To broadcast communications, all the devices share a 128-bit network key. Link keys are acquired via key-transport, key-establishment, or pre-instalment [43].
The CP is based on a framework consisting of five fields: the start delimiter, the frame length, and the frame data portion, which is composed of the Application Programming Interface (API) identifier and specific data, the contents of the specific data that change according to the API identifier, and, lastly, the checksum, which is a byte containing the hash sum of the API frame bytes.
Each sender receives feedback from each device for transmission confirmation. An encrypted password is used to protect any relevant information at the information processing level [33,34,44].
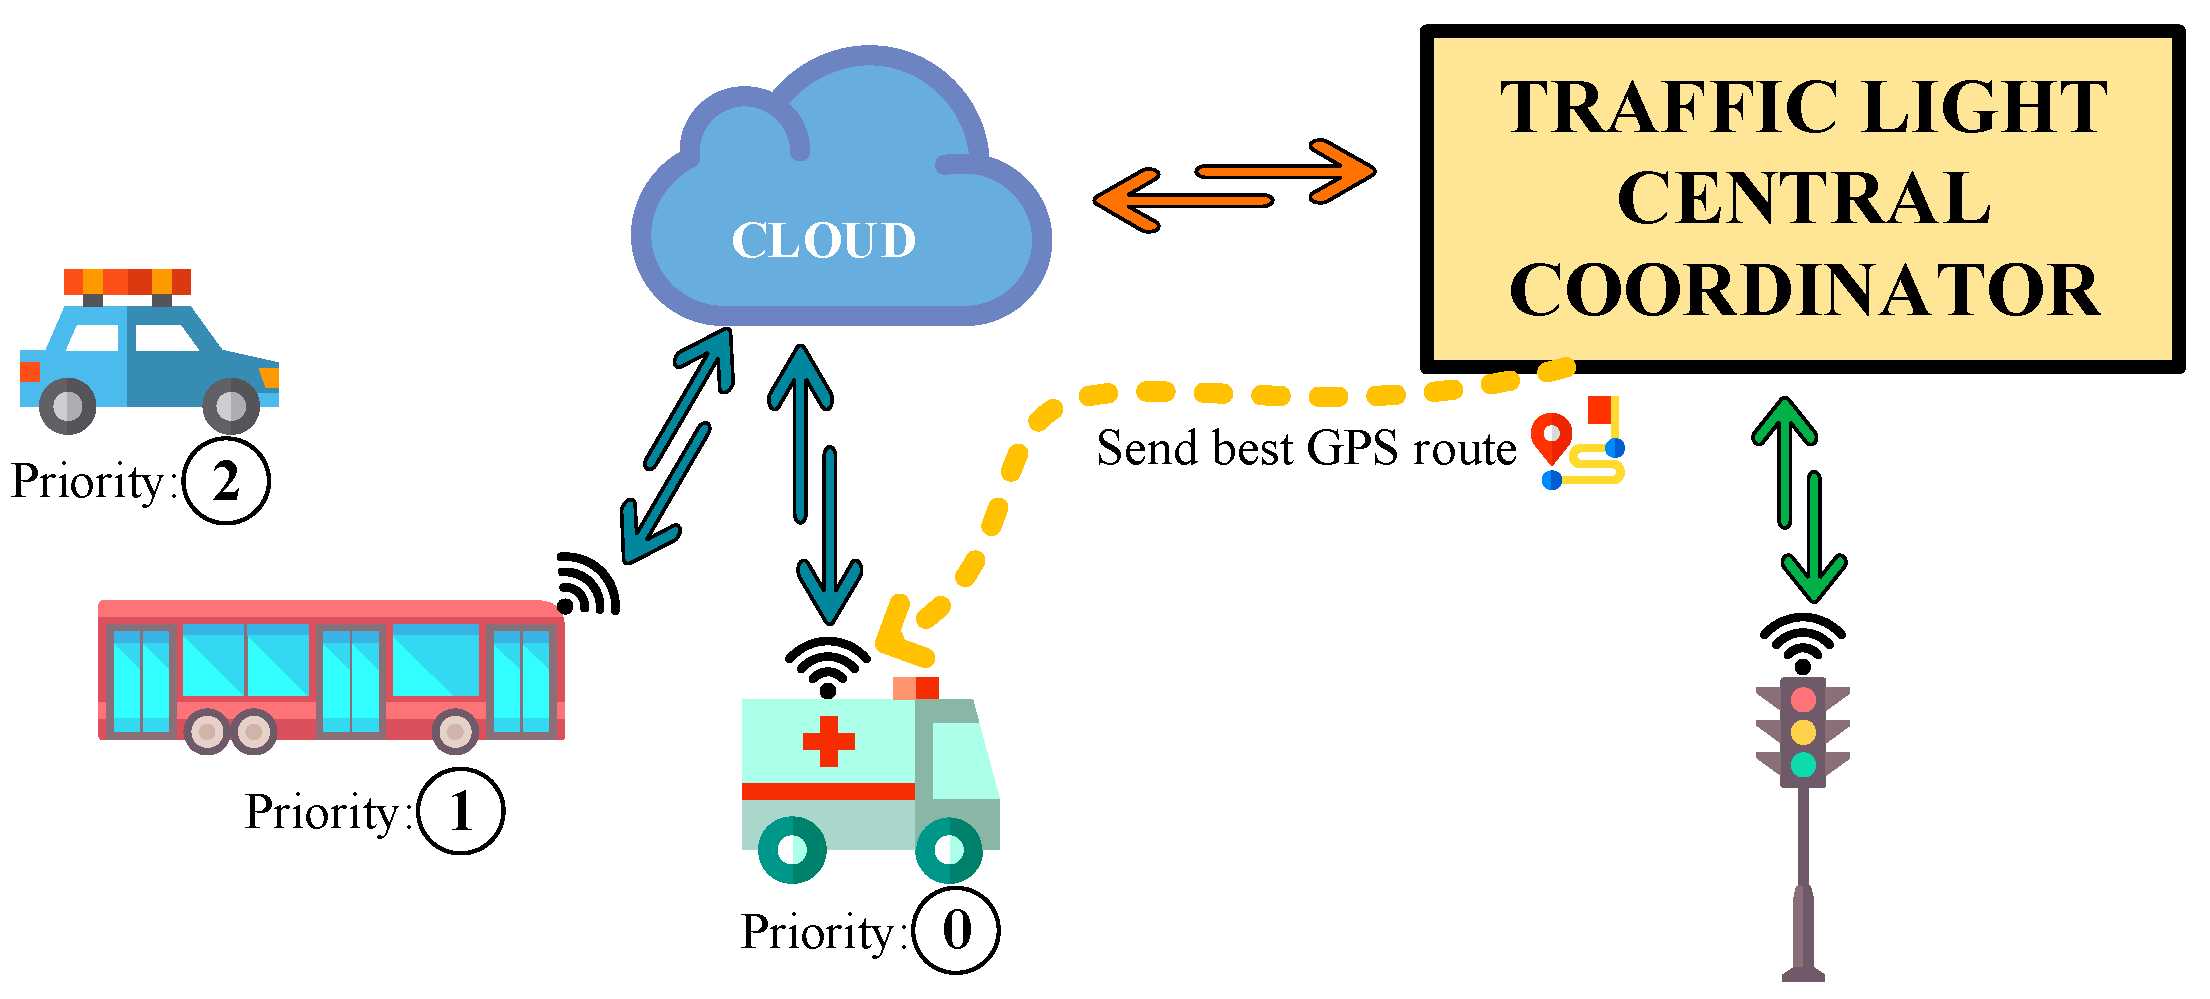
One of the main difficulties in the traffic flow near the crossroad points is when some priority vehicle needs to pass through a red light [45,46]. In these situations, the cars at the front of the line usually pass the red light without permission and move to other lanes to let priority one flow through the traffic queue. One solution for this problem is presented in this work. When a priority vehicle is in an emergency state, an onboard controller communicates with the cloud, coordinating with the central platform to determine the best route available and determining the traffic light network accordingly. Therefore, a vehicle priority parameter is introduced into the developed CP that may also be used for emergency vehicles or public buses [47,48,49]. The same solution can be foreseen for transportation corridors radiating and coming from the airport [50,51].
The diagram of vehicle priority parameters is shown in Figure 2.
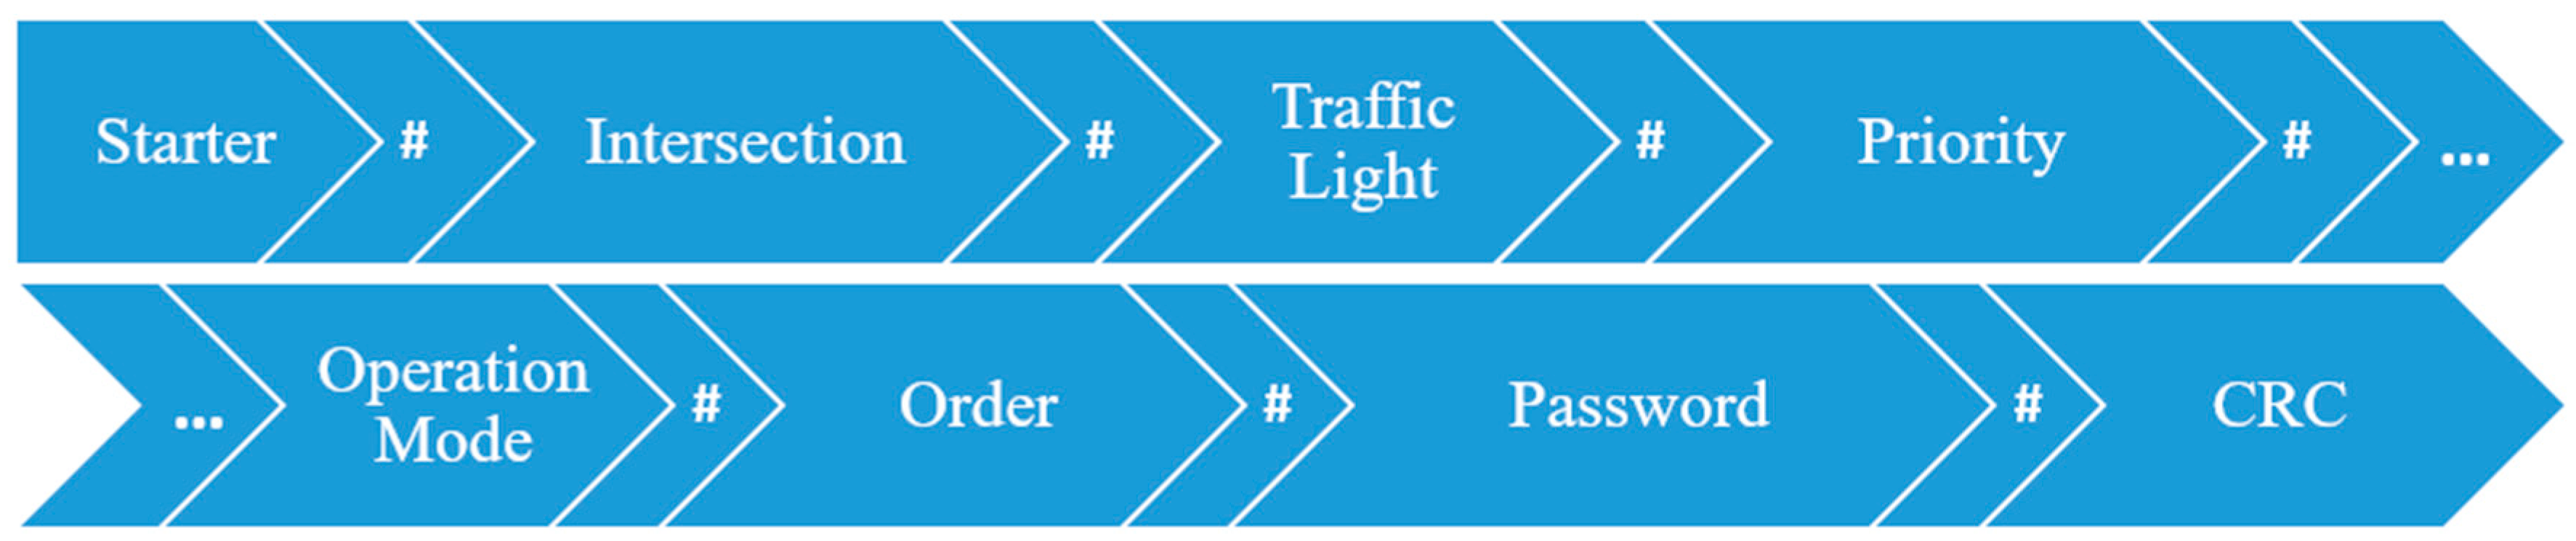
The CP used to communicate between every pair of devices in the grid is shown below. For the prototype, no size optimization of the message length is implemented to allow message readability. The validation of the presence and absence of deadlocks is needed to develop a more complete version of the CP. The hash symbol (#) is used as a general separator, and STARTER is used as a message starter. The CP prototype format is:
STARTER#INTERSECTION#TRAFFICLIGHT#PRIORITY#
OPERATIONMODE#ORDER#PASSWORD#CRC
For a better visualization of the developed CP, a diagram was created, and this is shown in Figure 3.
To confirm the correct reception of the complete message with the correct parameters that obeys the developed CP, one regular expression is written and tested out:
STARTER#[0-9]{3}#([0-9]{3}|ALL)#[0-1]{1}#
(MANUAL#(RED|YELLOW|GREEN))|(AUTO#(ON|DANGER))#PASSWORD#CRC
Regular expressions are formally used to ease the implementation and testing of the CP. The password is not transmitted with the message. The password field is reserved for an encrypted key to hide the real password using public/private keys. If the coordinator needs to send a specific non-prioritized red-light manual order to the third traffic light at intersection number 15, the message sent, according to this CP, is the following one:
STARTER #015#003#0#MANUAL#RED#PASSWORD#CRC
If the coordinator needs the intersection to enter the self-management automatic mode, the message is:
STARTER #015#ALL#0#AUTO#ON#PASSWORD#CRC
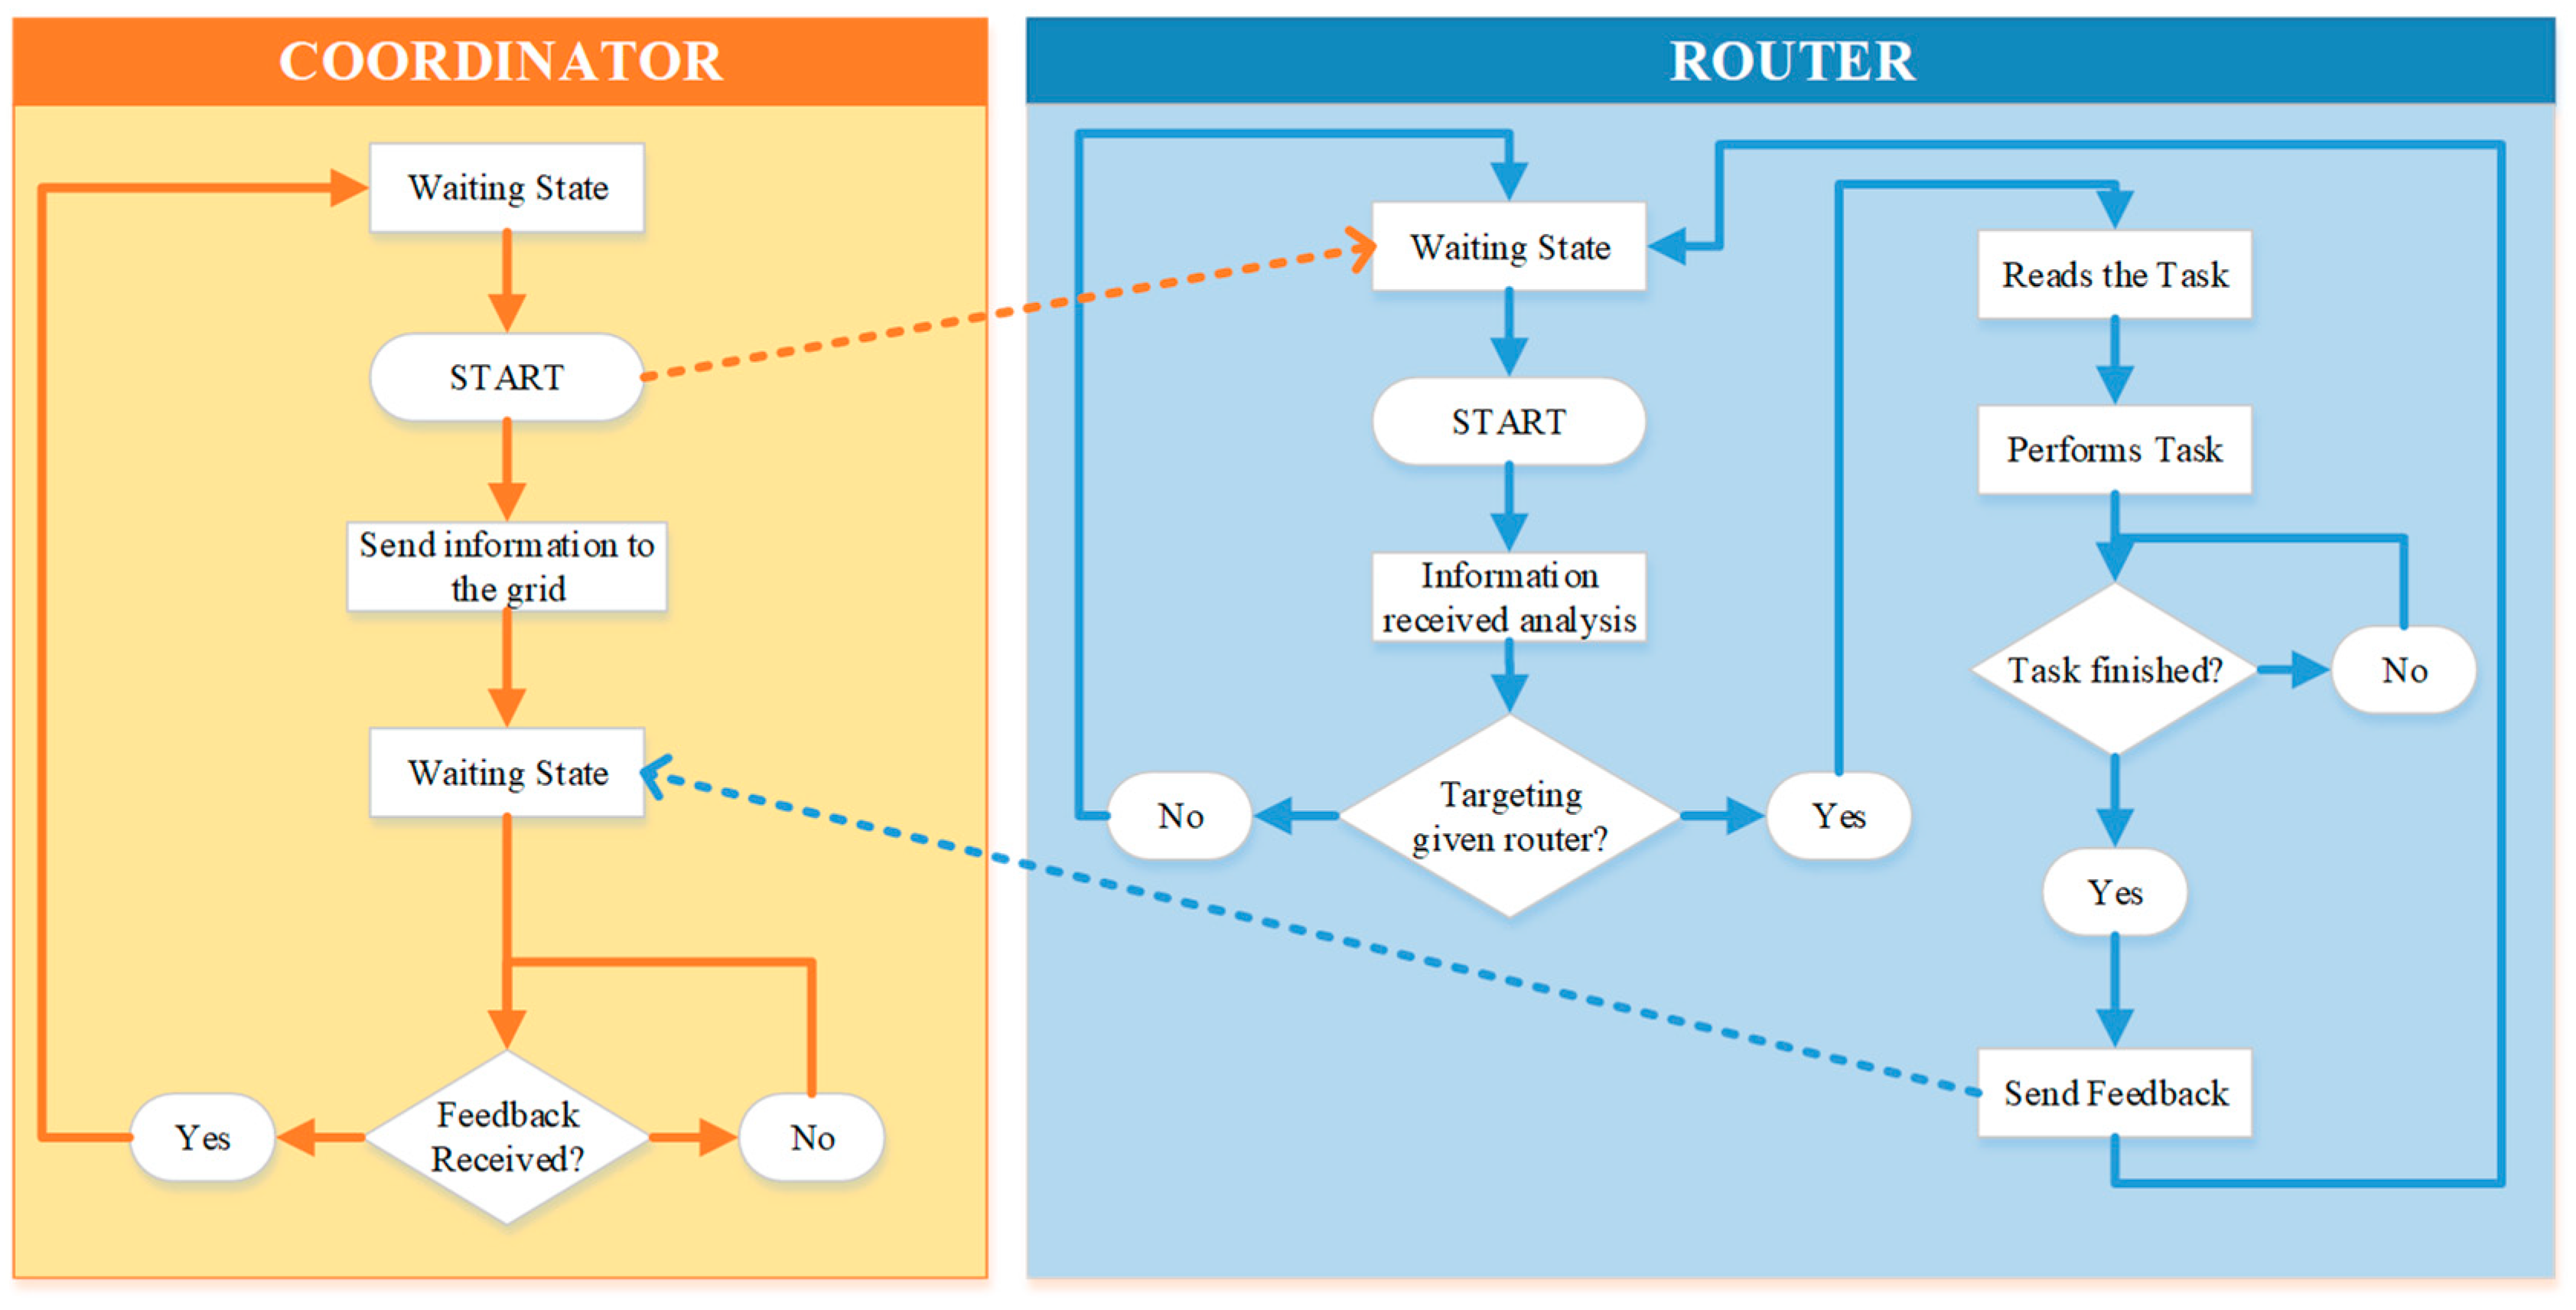
Broadcast messages are used by the coordinator to send information to all devices. Each device checks if it is the recipient of the message or not. Figure 4 shows the flowchart of the communication system.
4. Experimental Setup
A prototype was developed to test the proposed system. The prototype was composed of an energy storage unit like a battery or a Power Bank and four traffic lights with three lights in which each corresponded to the standard colors of red, yellow, and green.
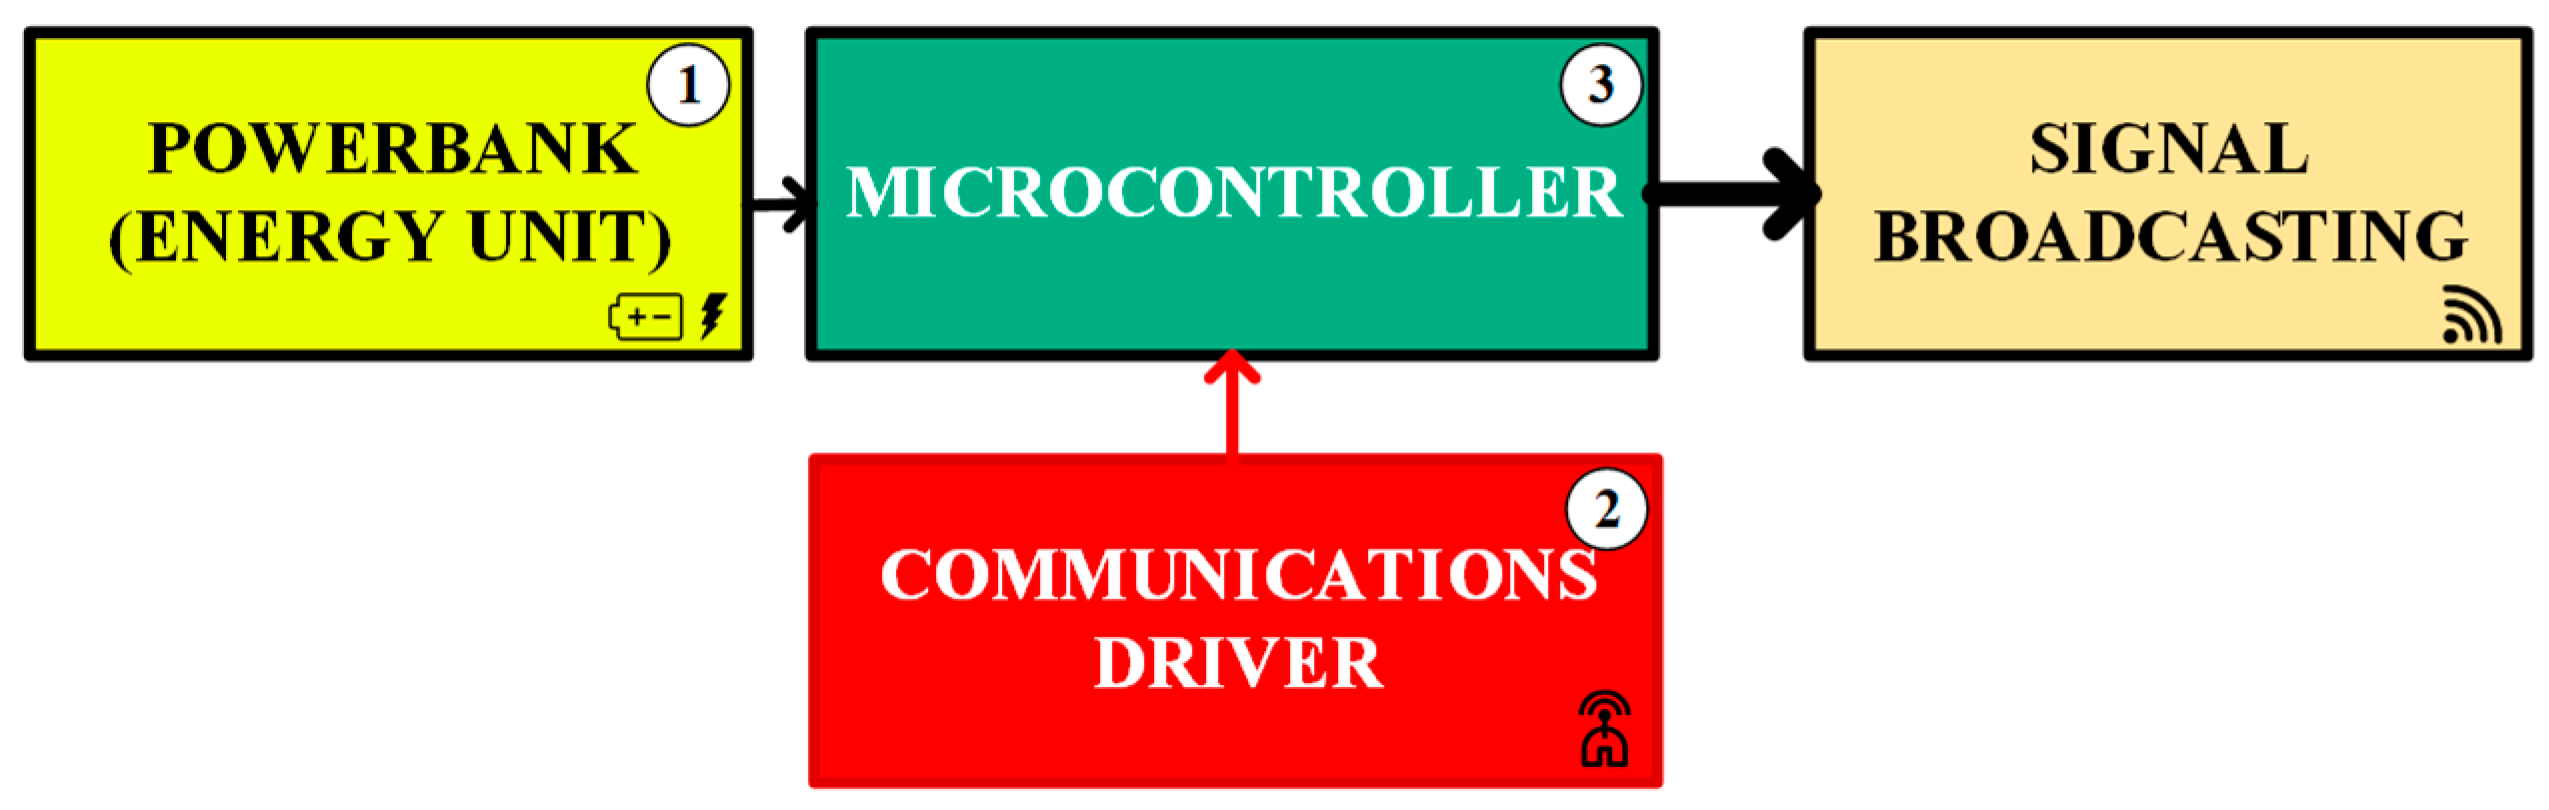
For the performance of the communication system, two subsystems were developed including one static, which was kept in the same location, and one mobile, which was used to carry out the measurements along a distance. A diagram of the static system used in this test to broadcast a signal received by the mobile system is shown in Figure 5.
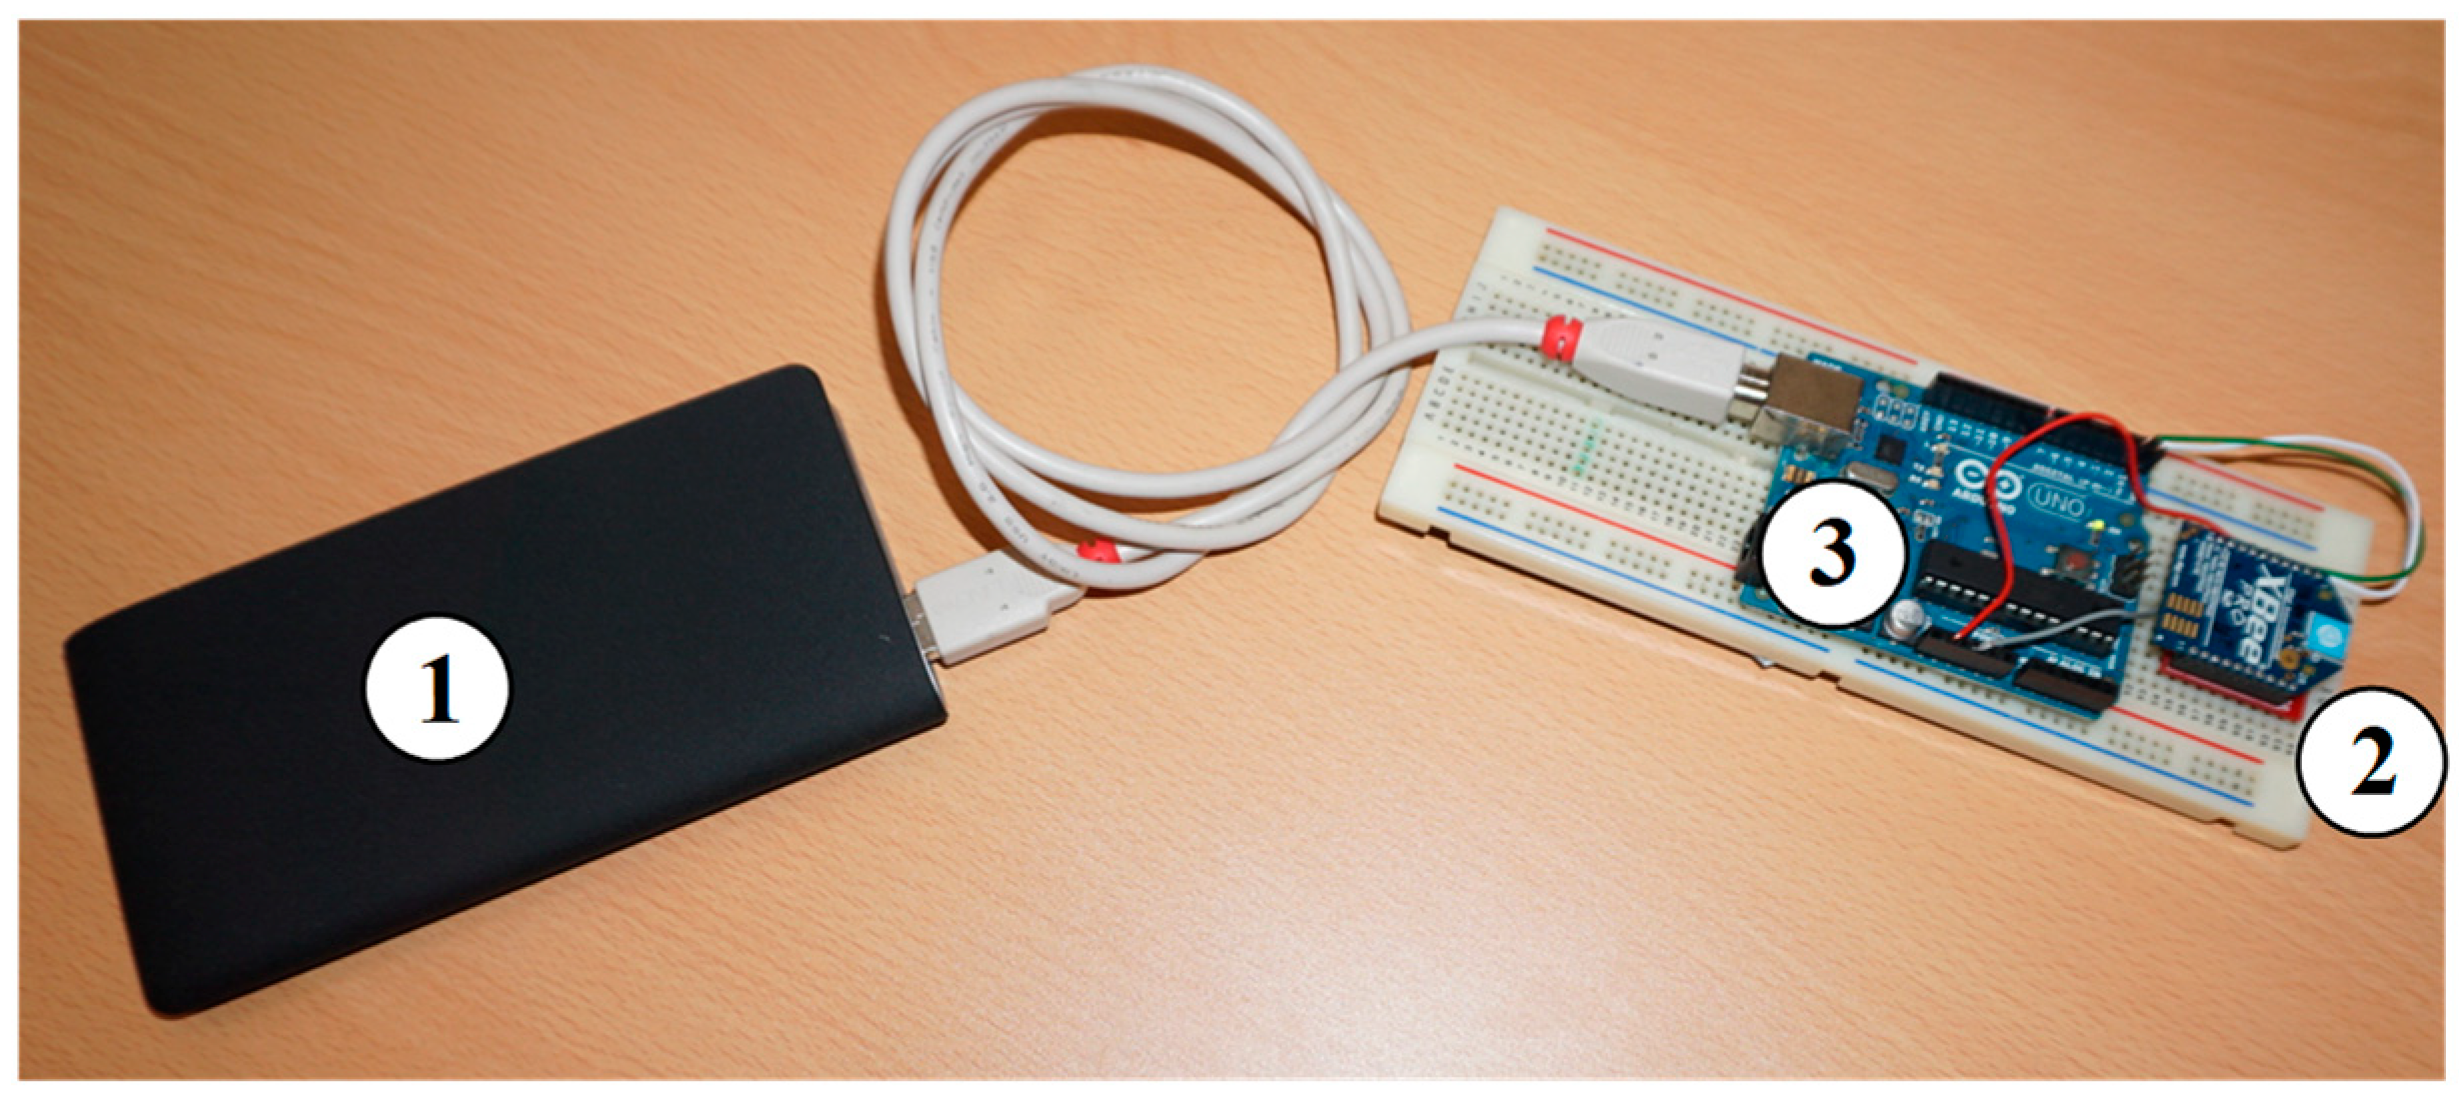
The components of the static system are shown in Figure 6. Modules 1, 2, and 3 correspond to the numbers used in Figure 5.
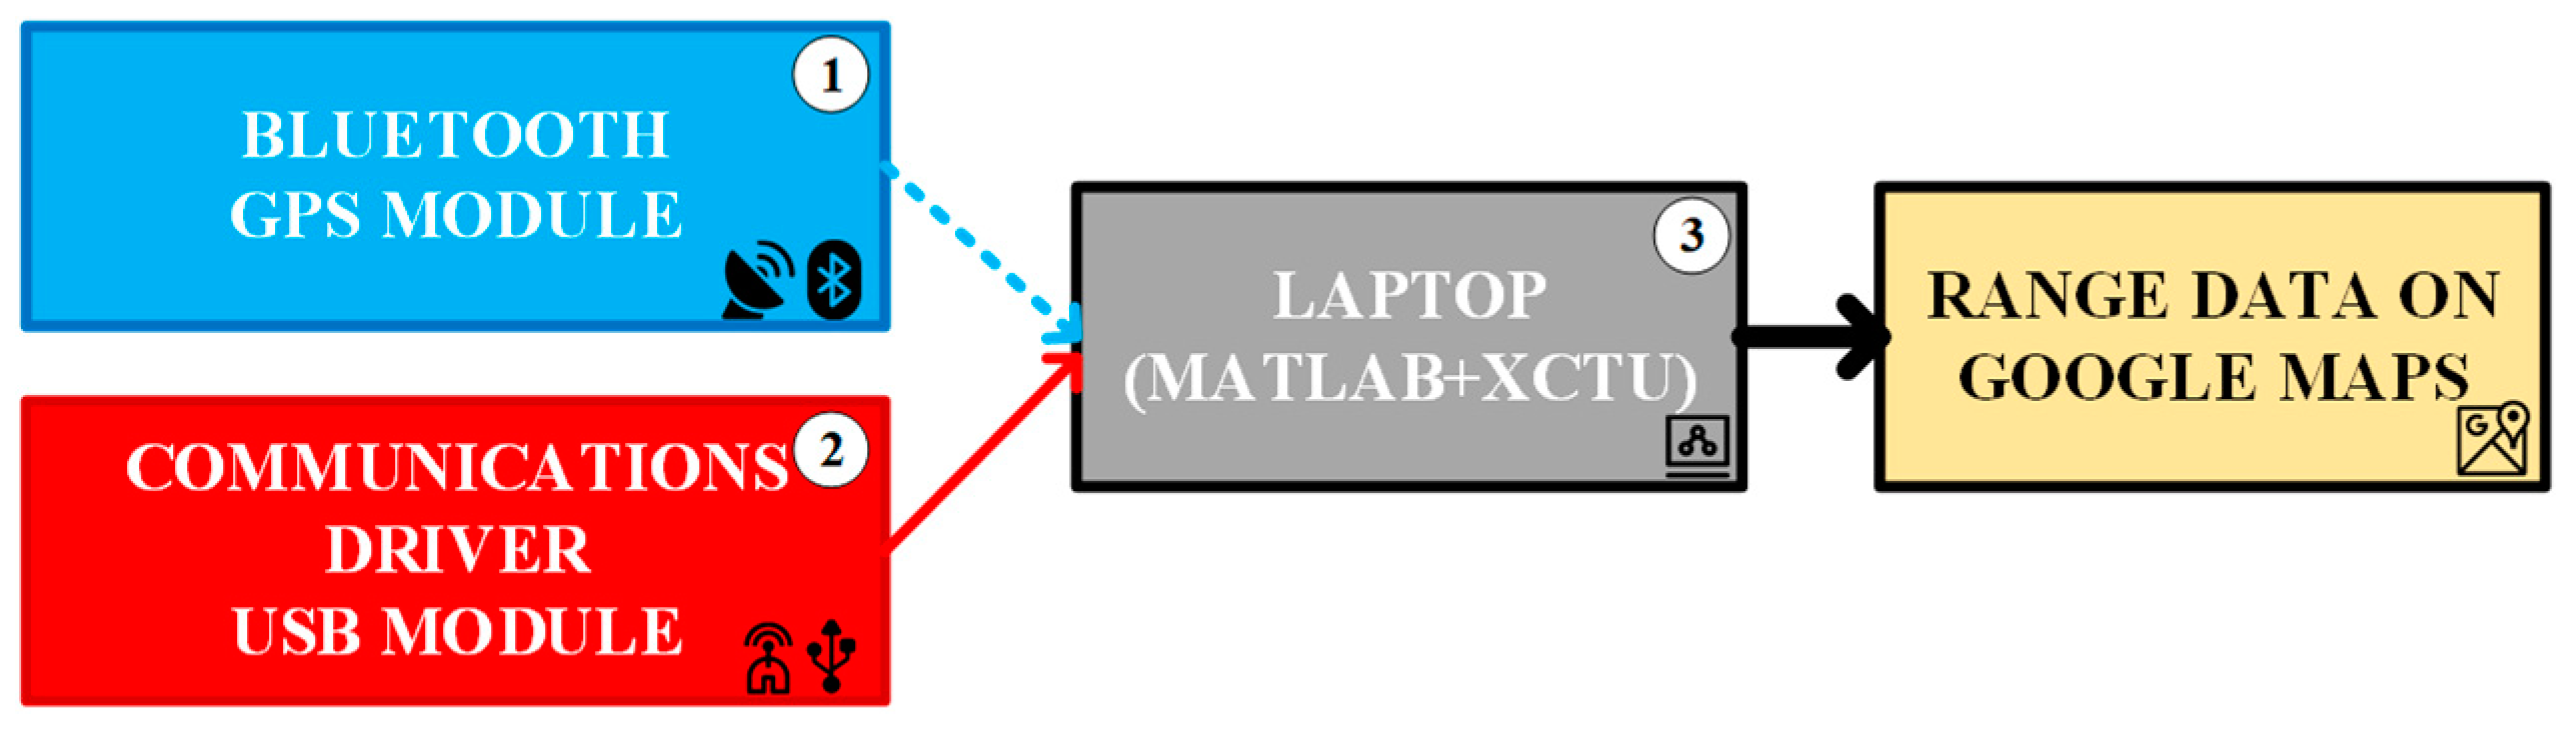
A diagram of the mobile system developed is shown in Figure 7.
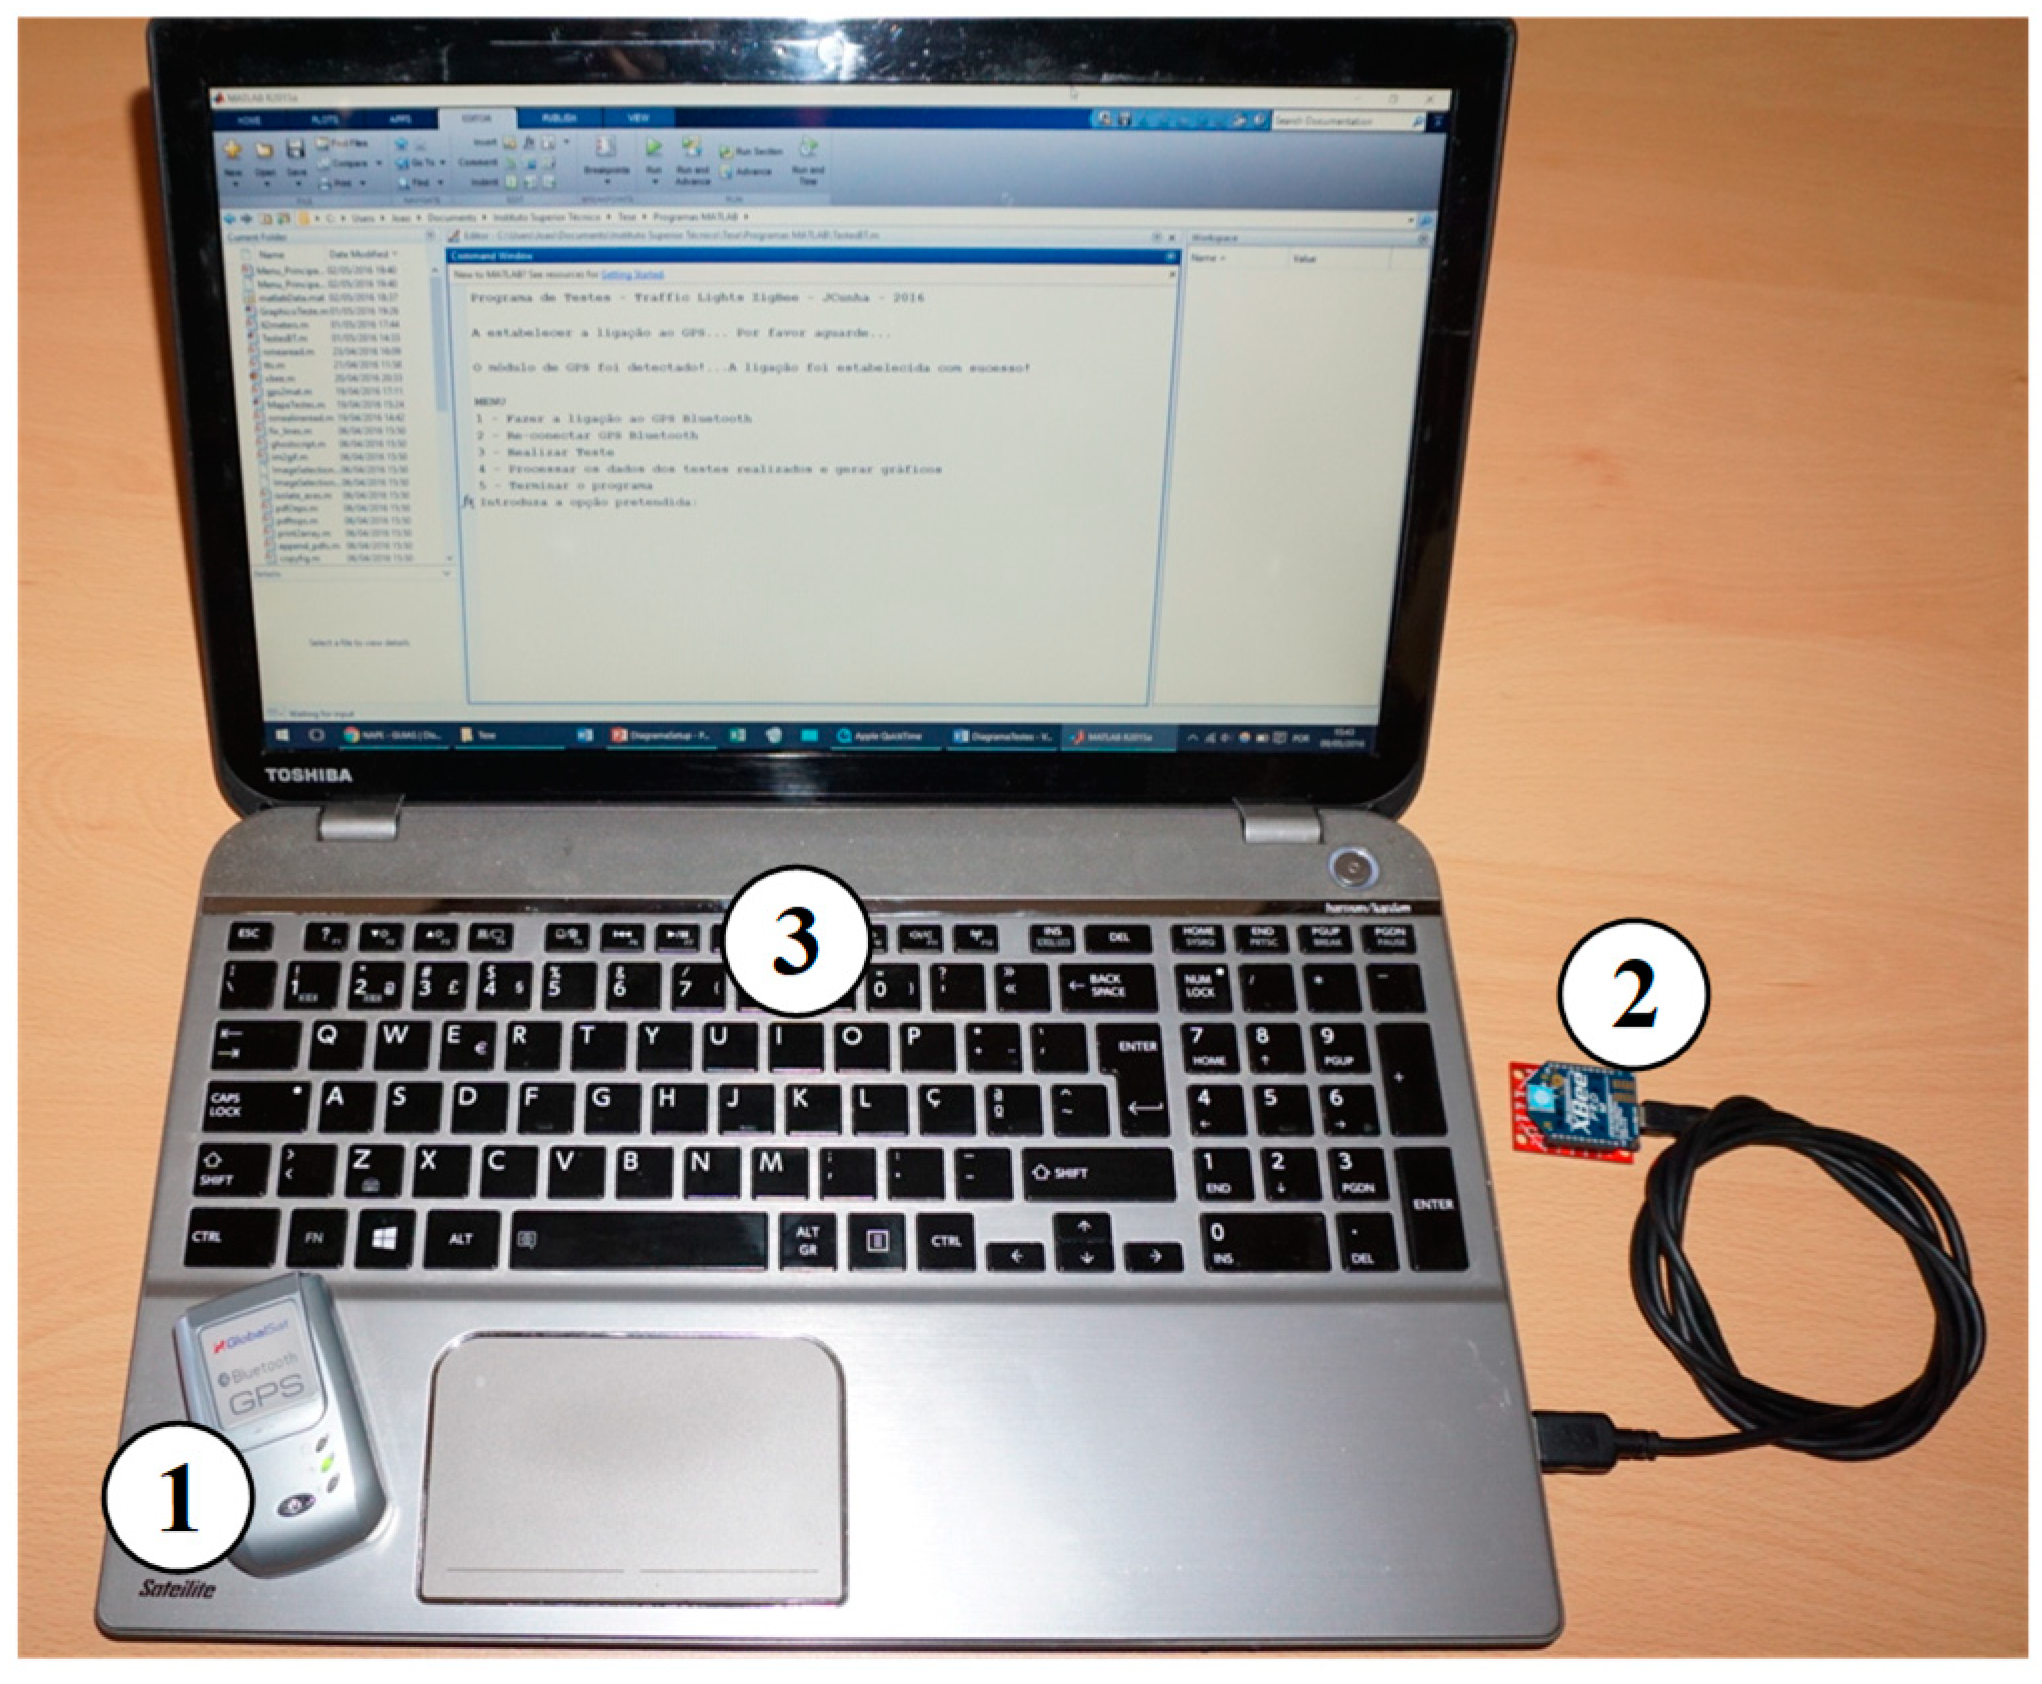
The components used in the mobile system are shown in Figure 8. Modules 1, 2, and 3 correspond to the numbers used in Figure 7.
4.1. Case Study A—Communication Devices
For the first test, two microcontrollers and three communication driver devices were used. With these, a network between two routers (in AT mode) and a coordinator (in API mode) was formed. The coordinator was connected to a computer running MATLAB code to receive and send data. Using the X-CTU, the program used for interfacing with the ZigBee communication devices, it was possible to access the list of packets received on the coordinator. A testing program was loaded into each of the routers to transmit data to the coordinator. The test program consisted of increments of a number every five seconds.
Tests were conducted to check the limits of the various communication devices. Treatment and data analysis were conducted in MATLAB.
4.2. Case Study B—Interference Frequency of Communication Devices
A test was implemented to assess the existence of interference within the 2.4 GHz frequency range. The communication devices used to perform these initial tests were the ones with higher transmission power. However, these devices use the same frequency range as the WiFi routers. For that reason, and because one of the main objectives of this work was to test this prototype under SC Grids, the frequency interference was tested.
To perform this test, one configurable router with WiFi CP 802.11 and the norms b/g/n with 13 channels available were set up near the coordinator to assess whether the connection was initially established, whether all data were transferred without data loss, and whether the Link Quality Indicator (LQI), which reflects the signal-to-noise ratio (SNR) at the receiver, were affected by the presence of the WiFi router [52].
4.3. Case Study C—Range of Communication Devices and Signal Quality
To implement this test, a microcontroller was connected to a communication driver device in Router API mode to transmit a message within a one-second period. Using another communication device connected via USB and a Bluetooth GPS connected to a laptop, it was possible to register the local coordinates and the corresponding LQI given by the network.
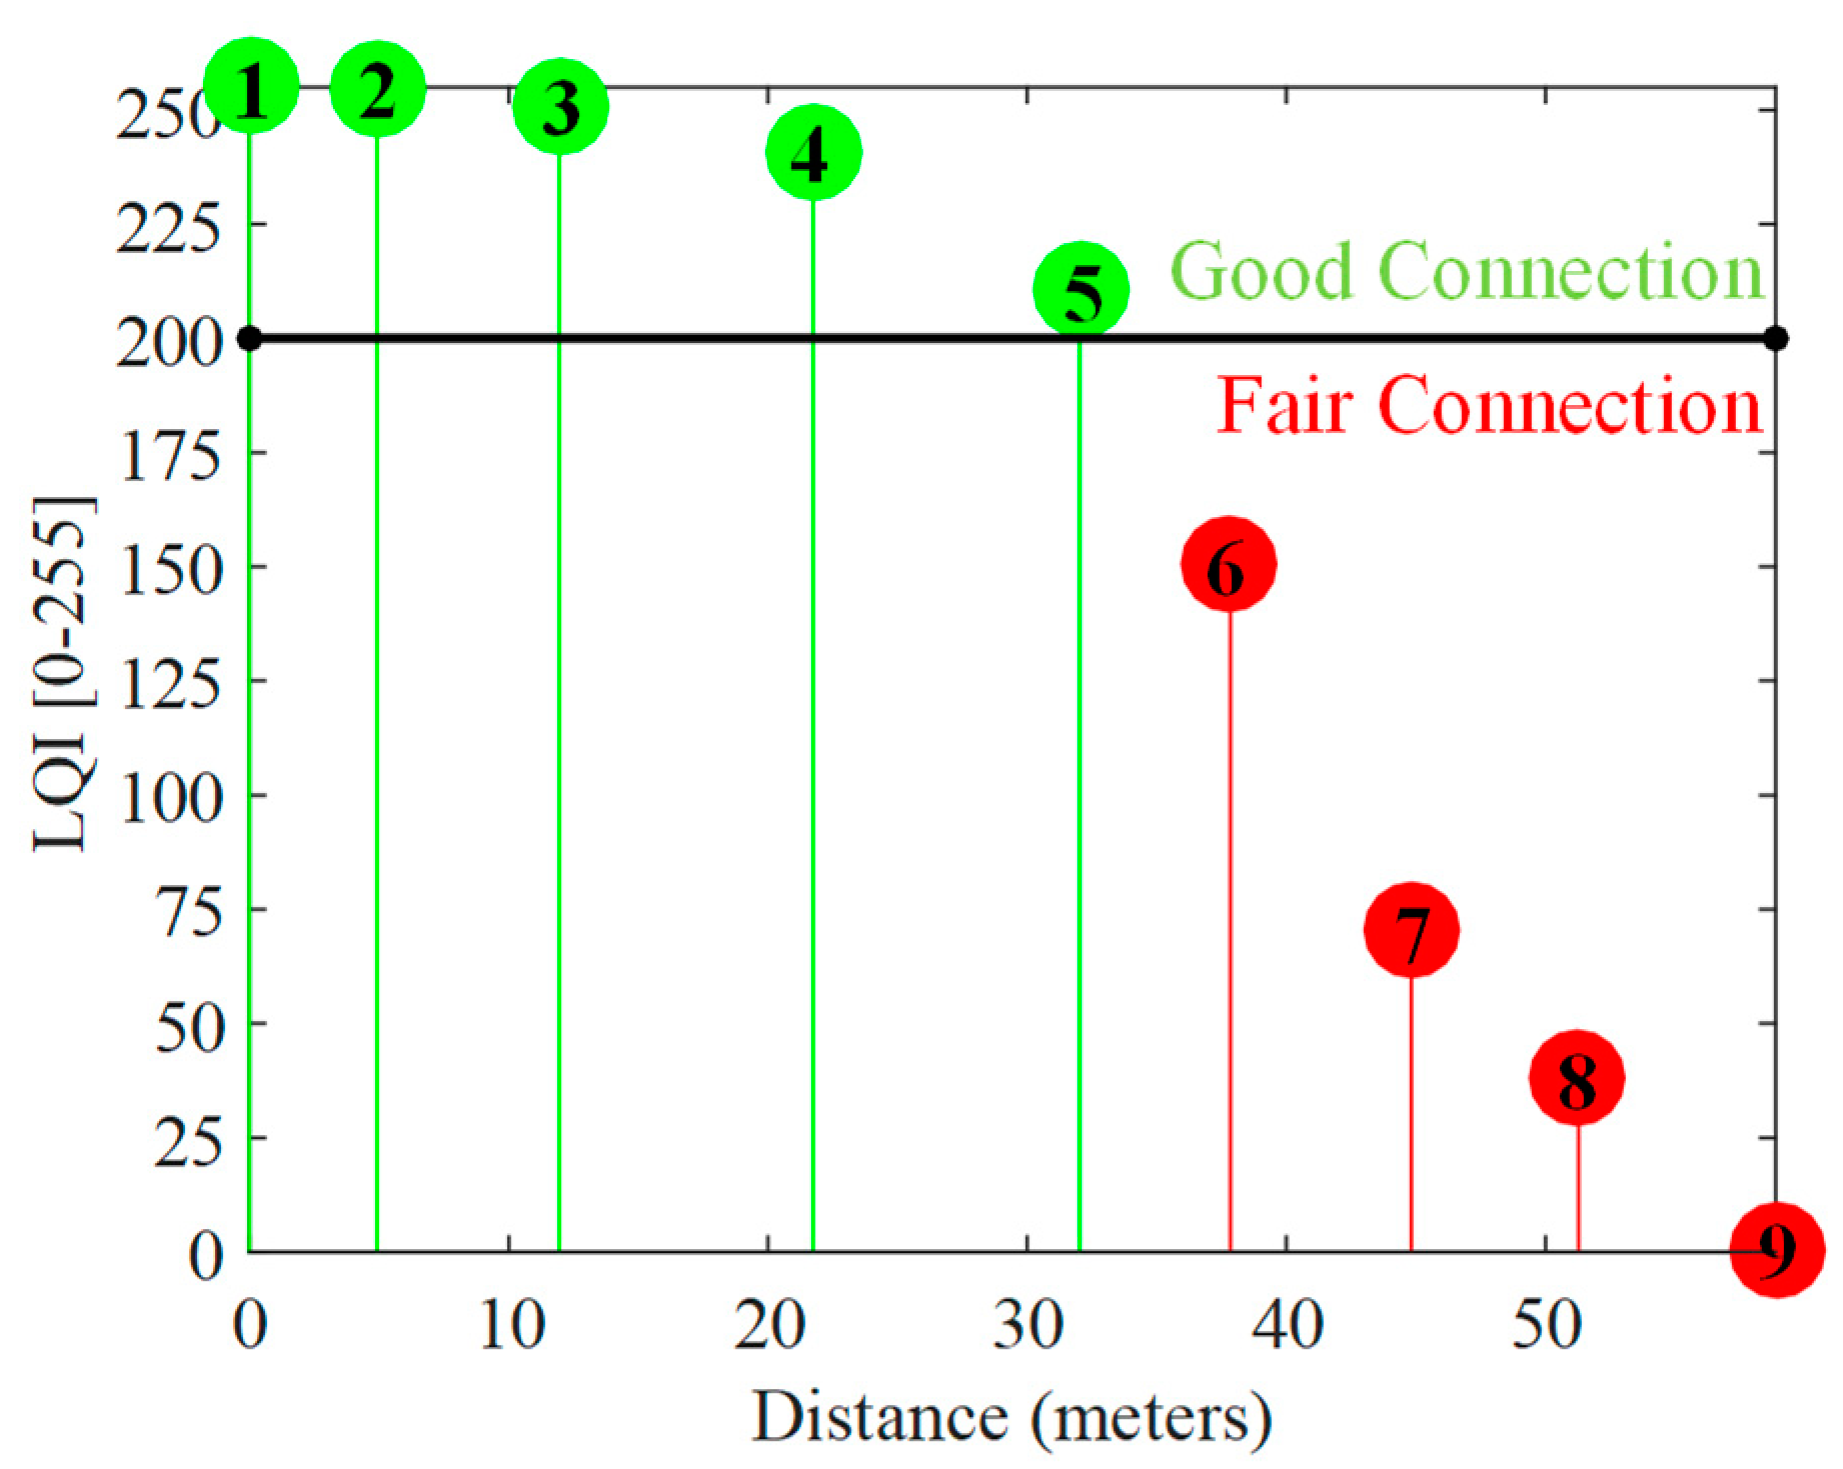
The MATLAB script started the Bluetooth GPS and made the necessary connections. At this point, one new test was initiated. The GPS coordinates were saved and three LQI values were prompted to the user. The mean point was then calculated and applied to the remaining data. Lastly, the same script was used to process all of the tests conducted. A Google Maps figure was generated to show the map and locations of the points in the test. The LQI was divided in two zones (Good and Fair Connections). Using different color dots in the map, the LQI connection for each location was represented.
4.4. Case Study D—Traffic Light Operation
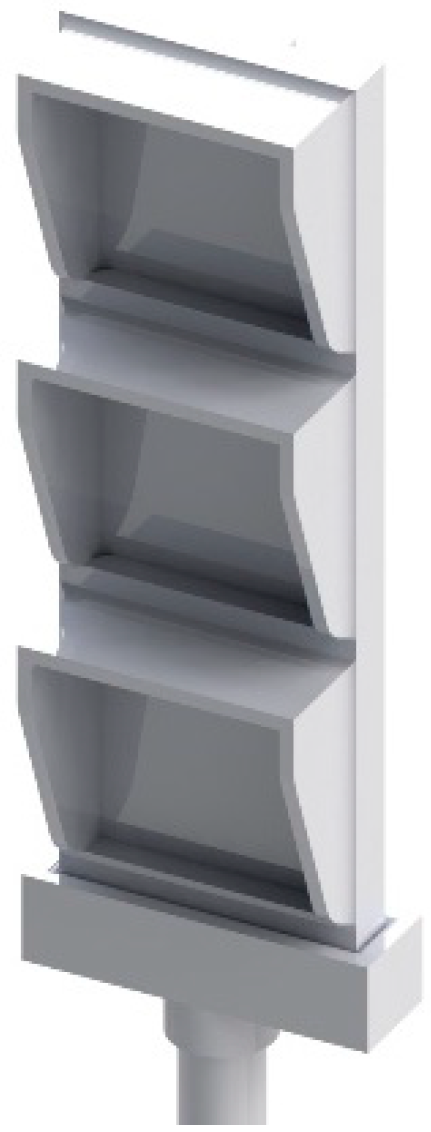
For the prototype construction and communications test, the structure of a few traffic lights was modeled in a CAD program and then printed on a 3D printer, as shown in Figure 9.
LED strips of various colors (red, yellow, and green) were used to simulate the traffic lights and were turned on and off by a microcontroller.
Tests were conducted to ensure that the information sent or received by the devices was interpreted correctly.
5. Experimental Results
5.1. Experimental Results for Case Study A
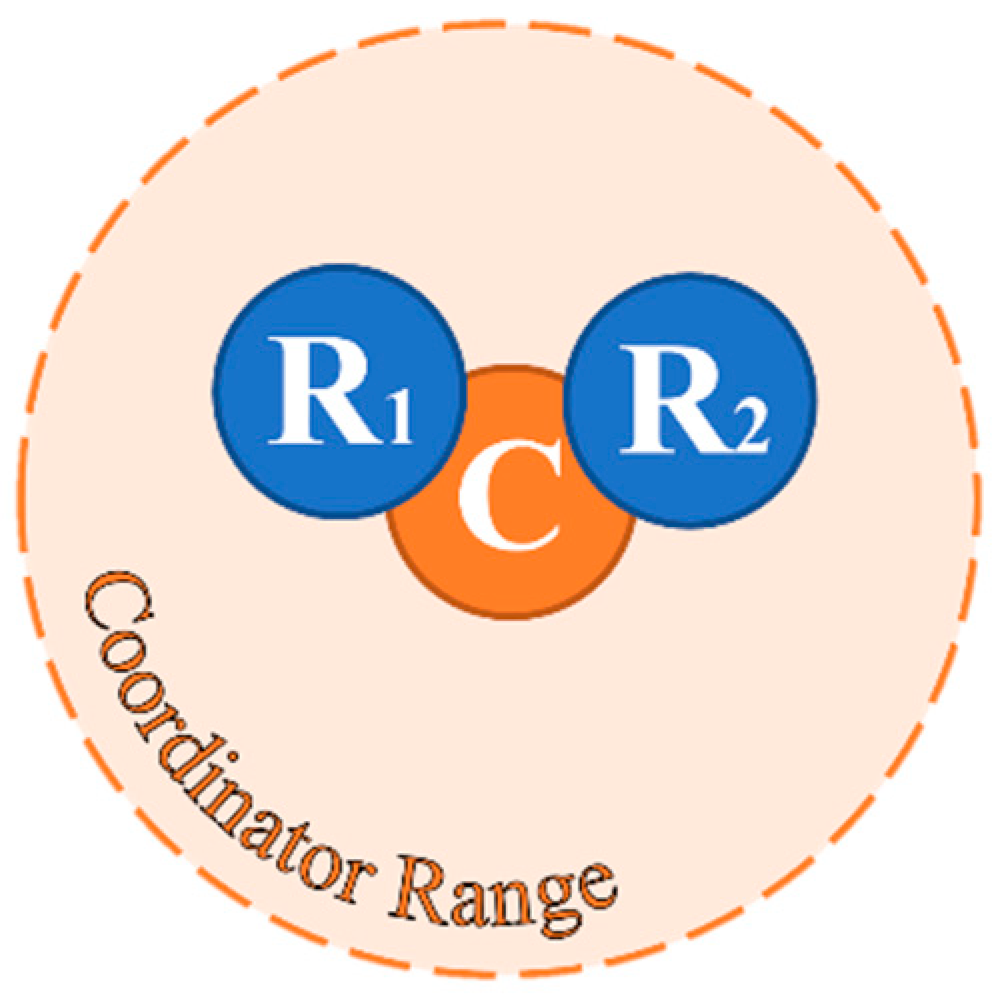
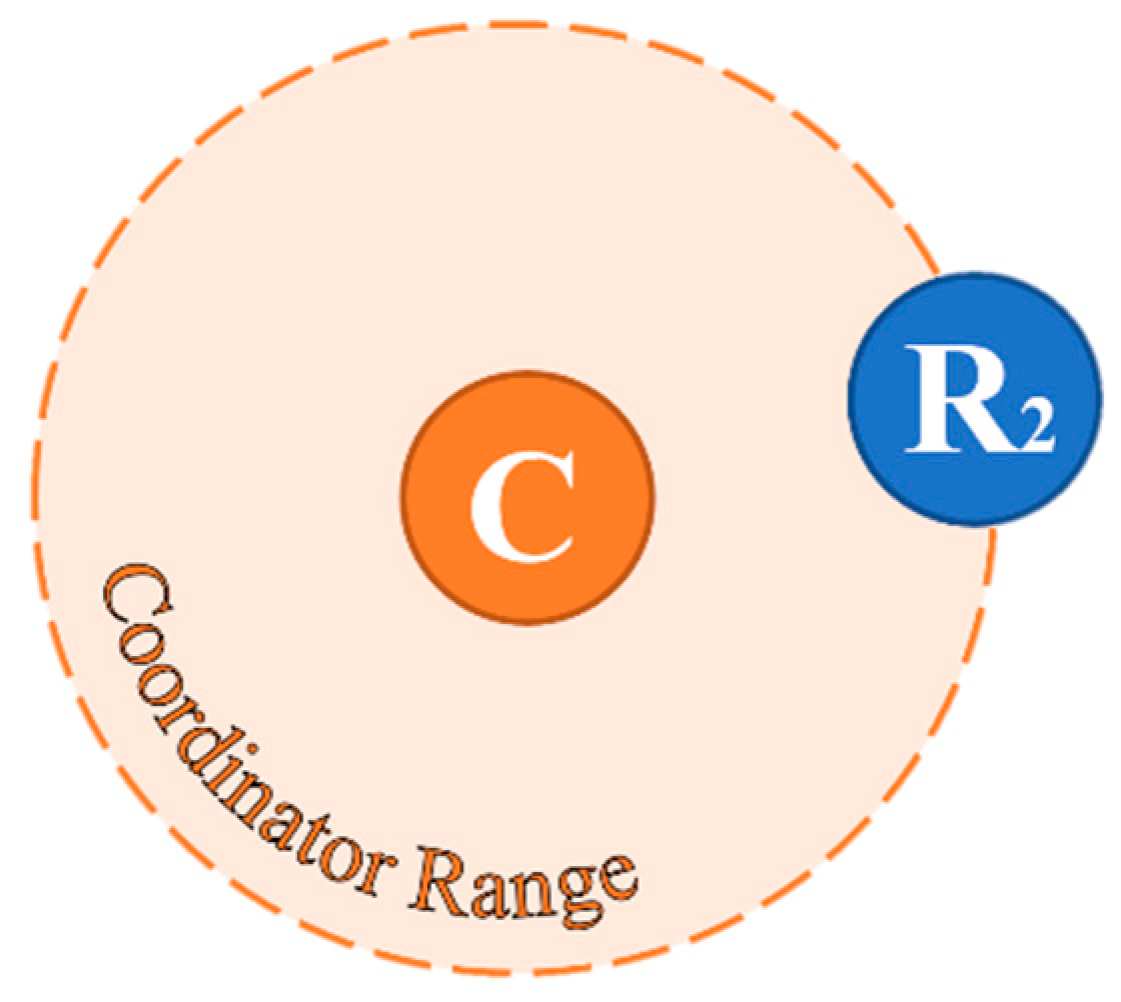
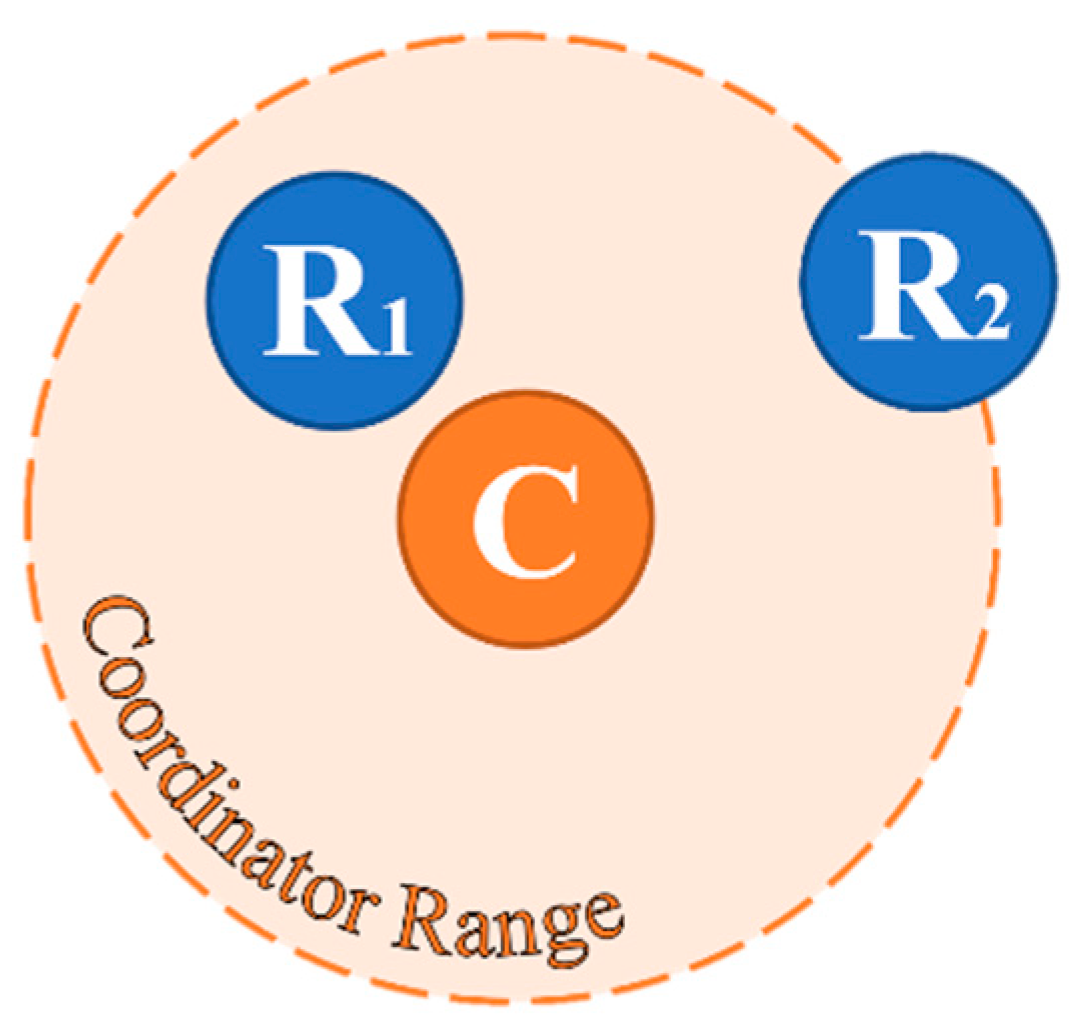
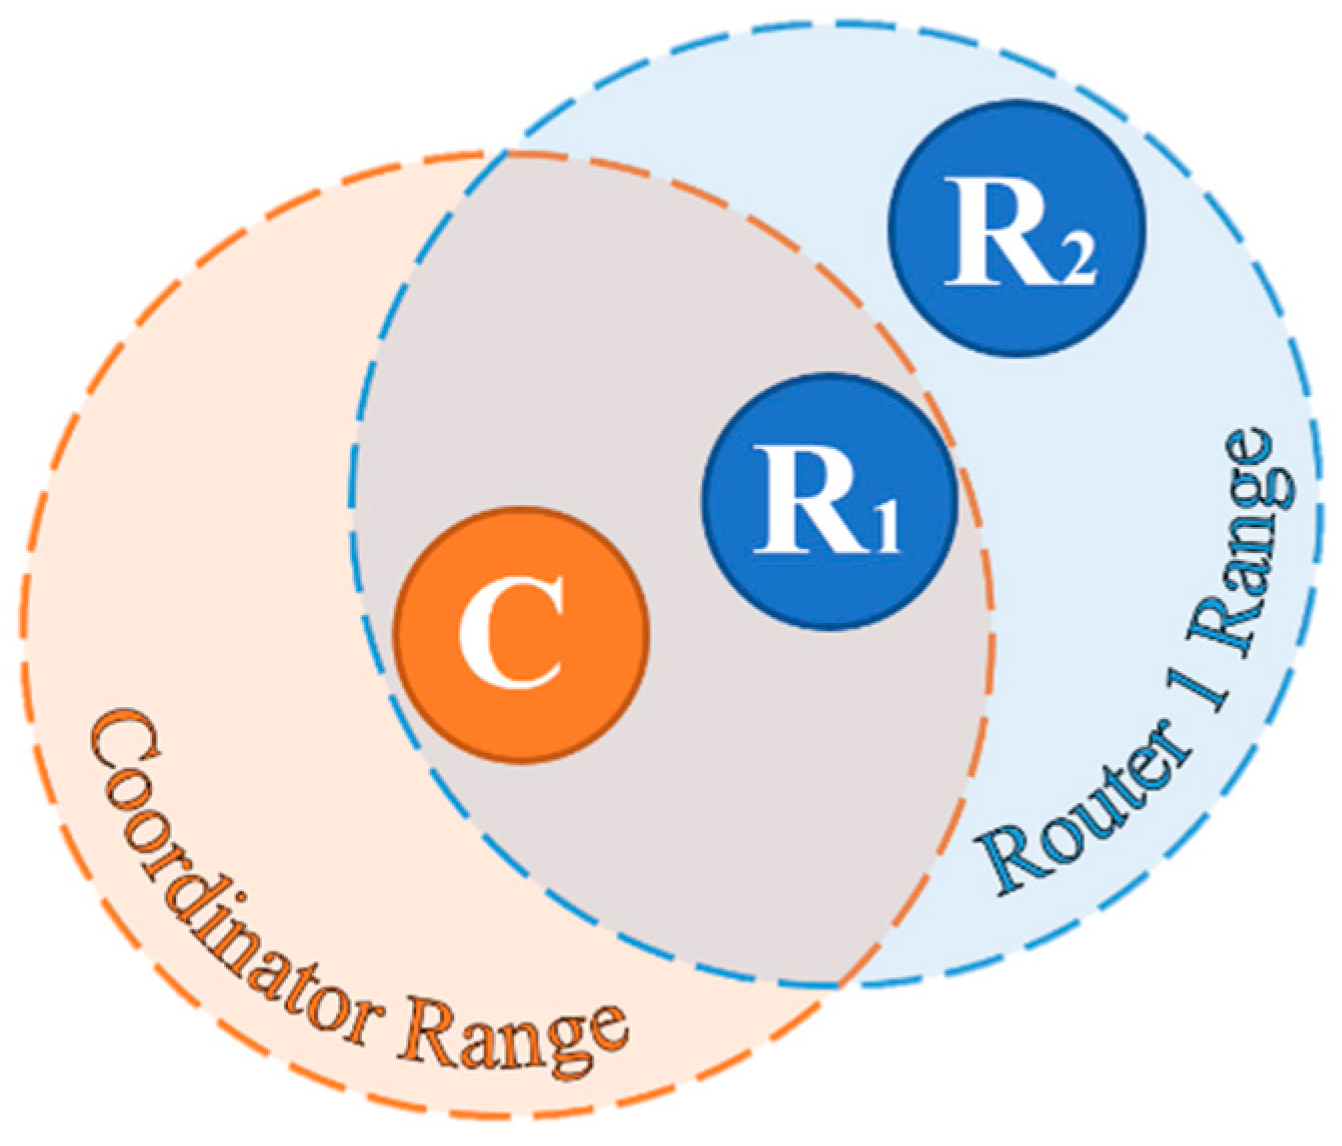
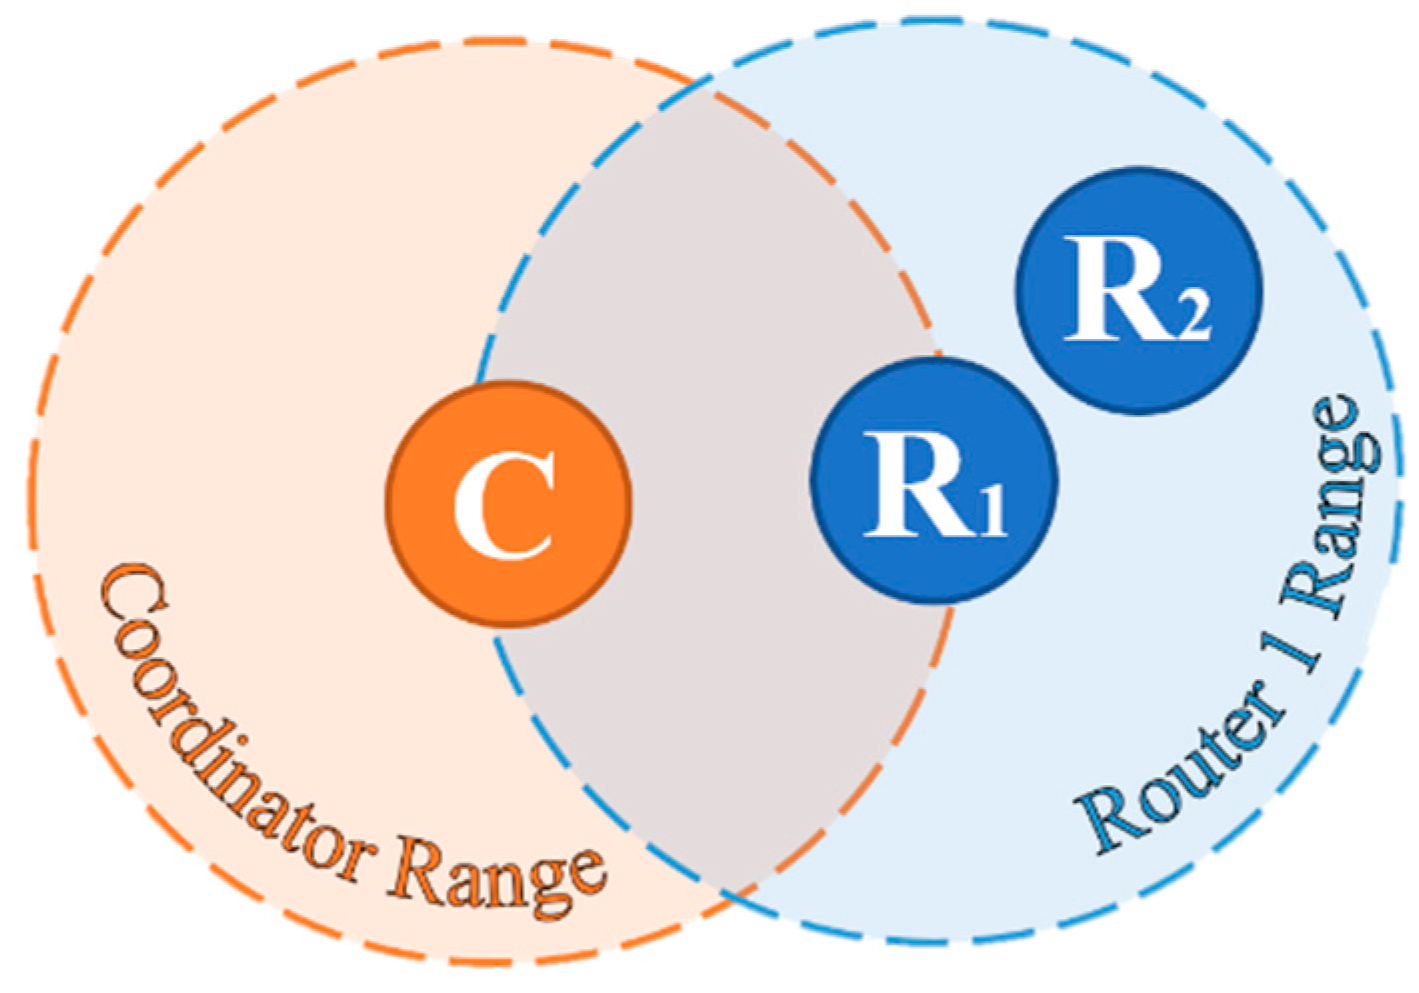
Five tests were conducted to verify the range, signal strength, and communication reliability in five different situations. The communication system was composed of one coordinator (C) and two routers (R1 and R2). The following cases were considered to check the Packet Reception Ratio (PRR): In Case A.1, all devices were within the communication range, as shown in Figure 10 while, in Case A.2, one device, R1, was disconnected. The other was located in the limit range, as shown in Figure 11. In Case A.3, all devices were connected but one was in the limit range, as shown in Figure 12. In Case A.4, one device was out of the range of the coordinator but in the range of other devices, as shown in Figure 13. Case A.5 was the same as Case 4 and all devices kept the same positions except for the device closer to the coordinator, which was moved to the limit range of the coordinator [33,34], as shown in Figure 14.
Special care was given to the analysis of packet losses. To evaluate the ratio between sent and received packets, a PRR was defined. The routers were programmed to send an ASCII character with a number increasing from zero for each packet sent with a five second delay. The PPR was defined by:
where is the number of packets received, is the number of packets sent, and is the number of packets not received.
Table 1 details the results.
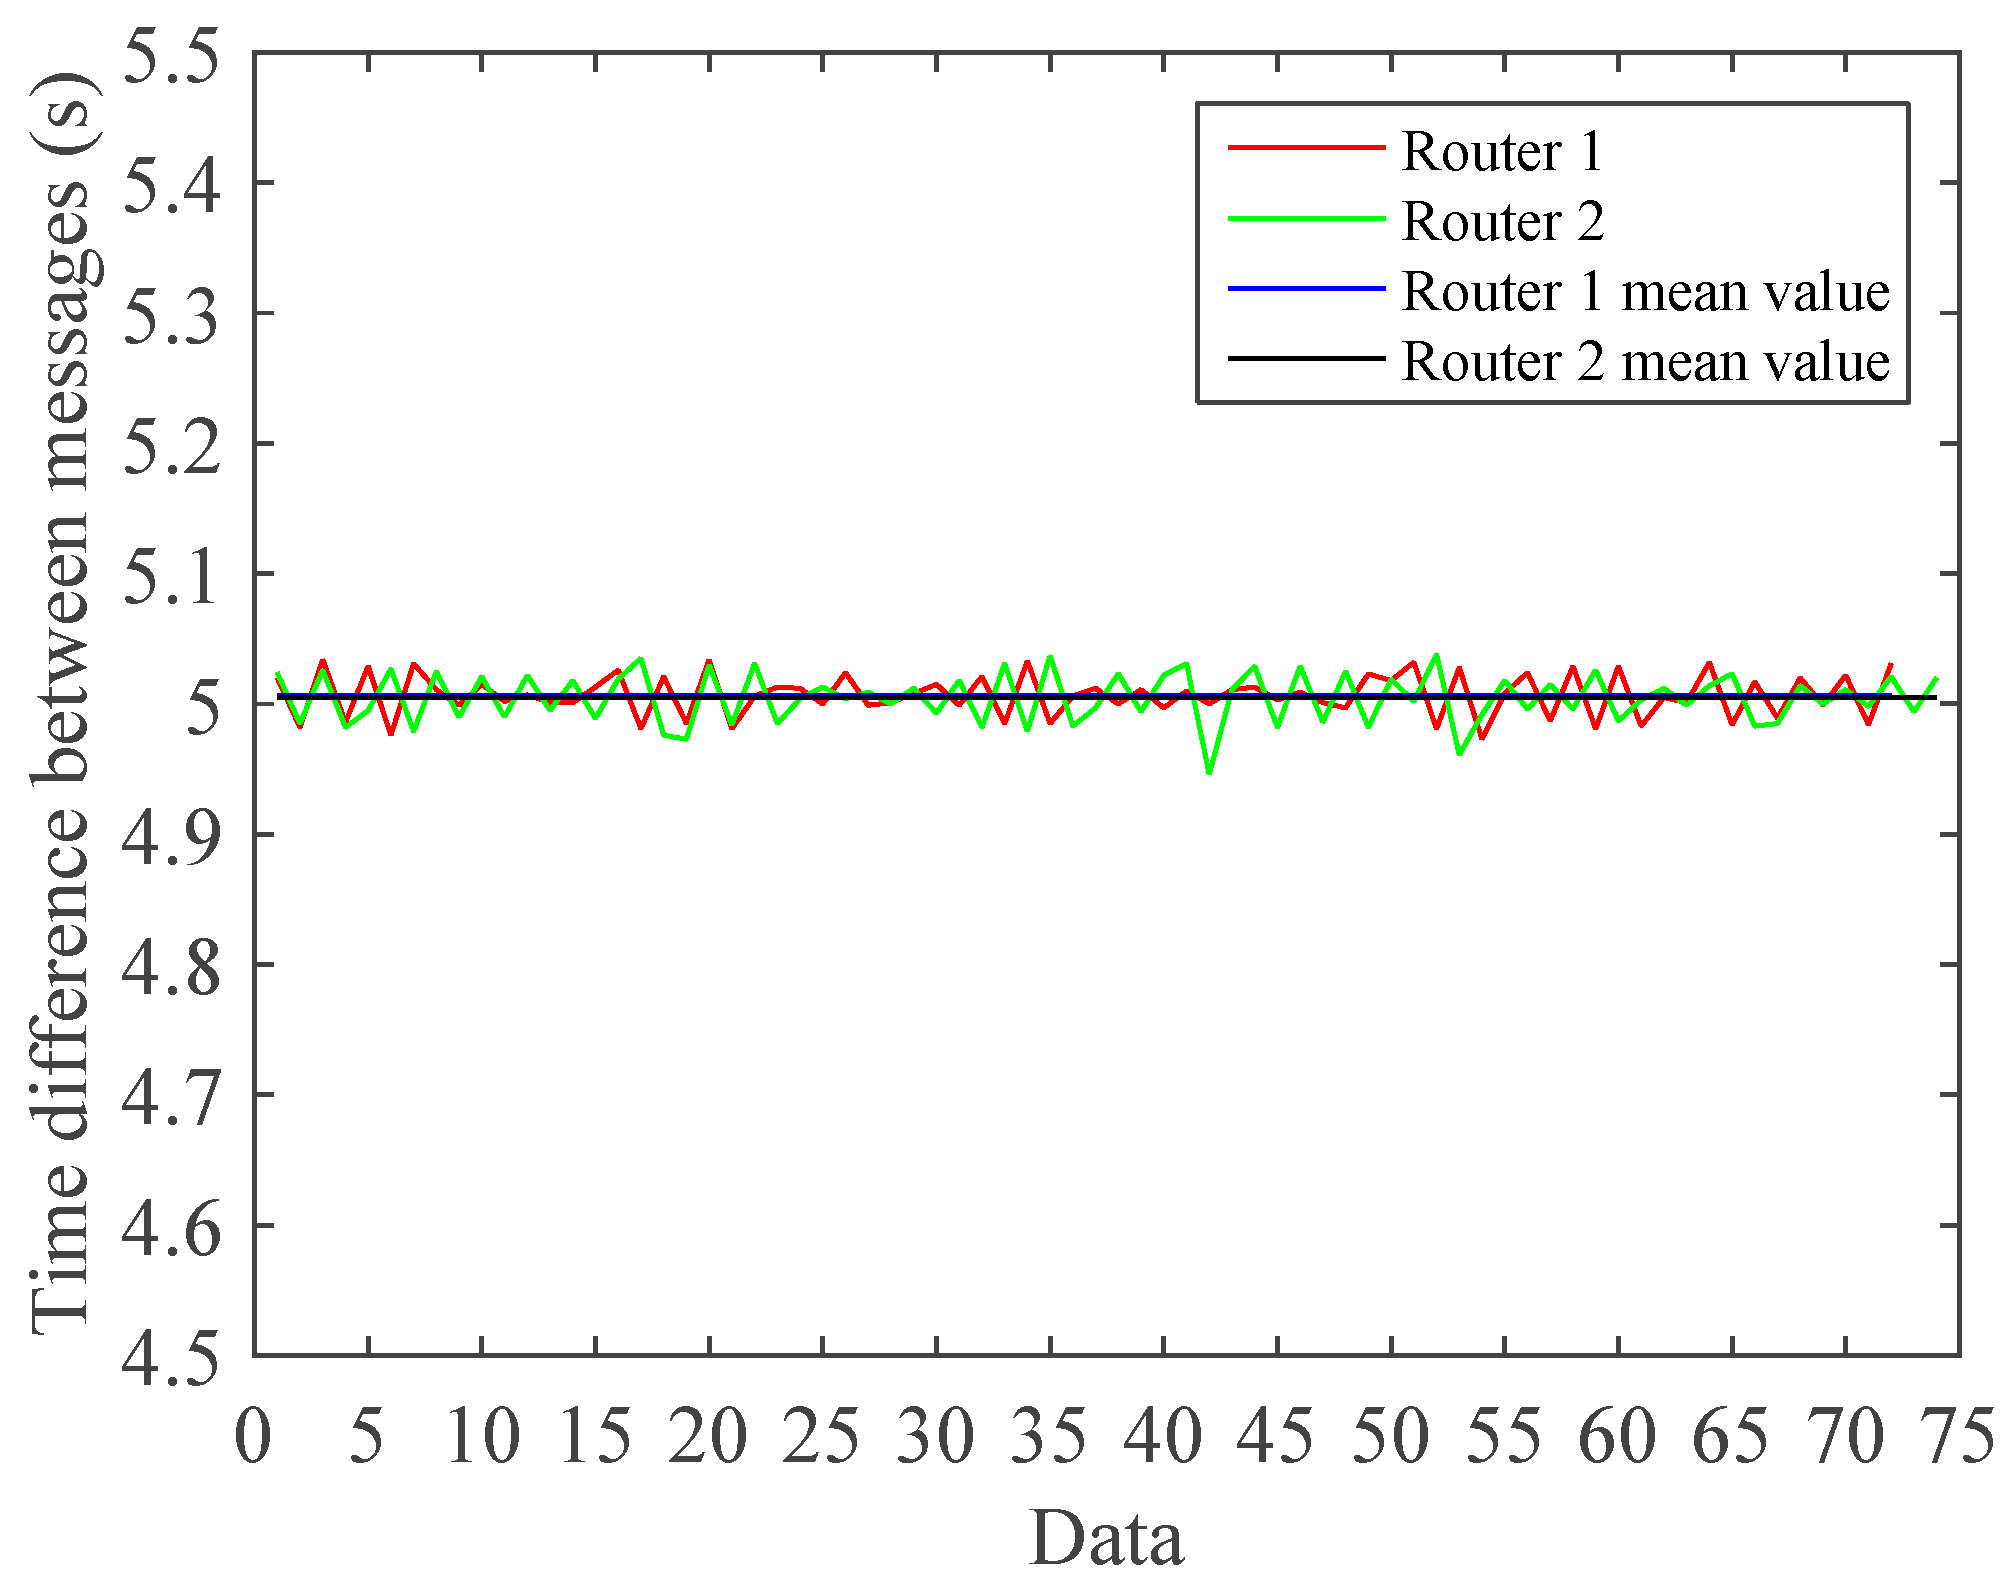
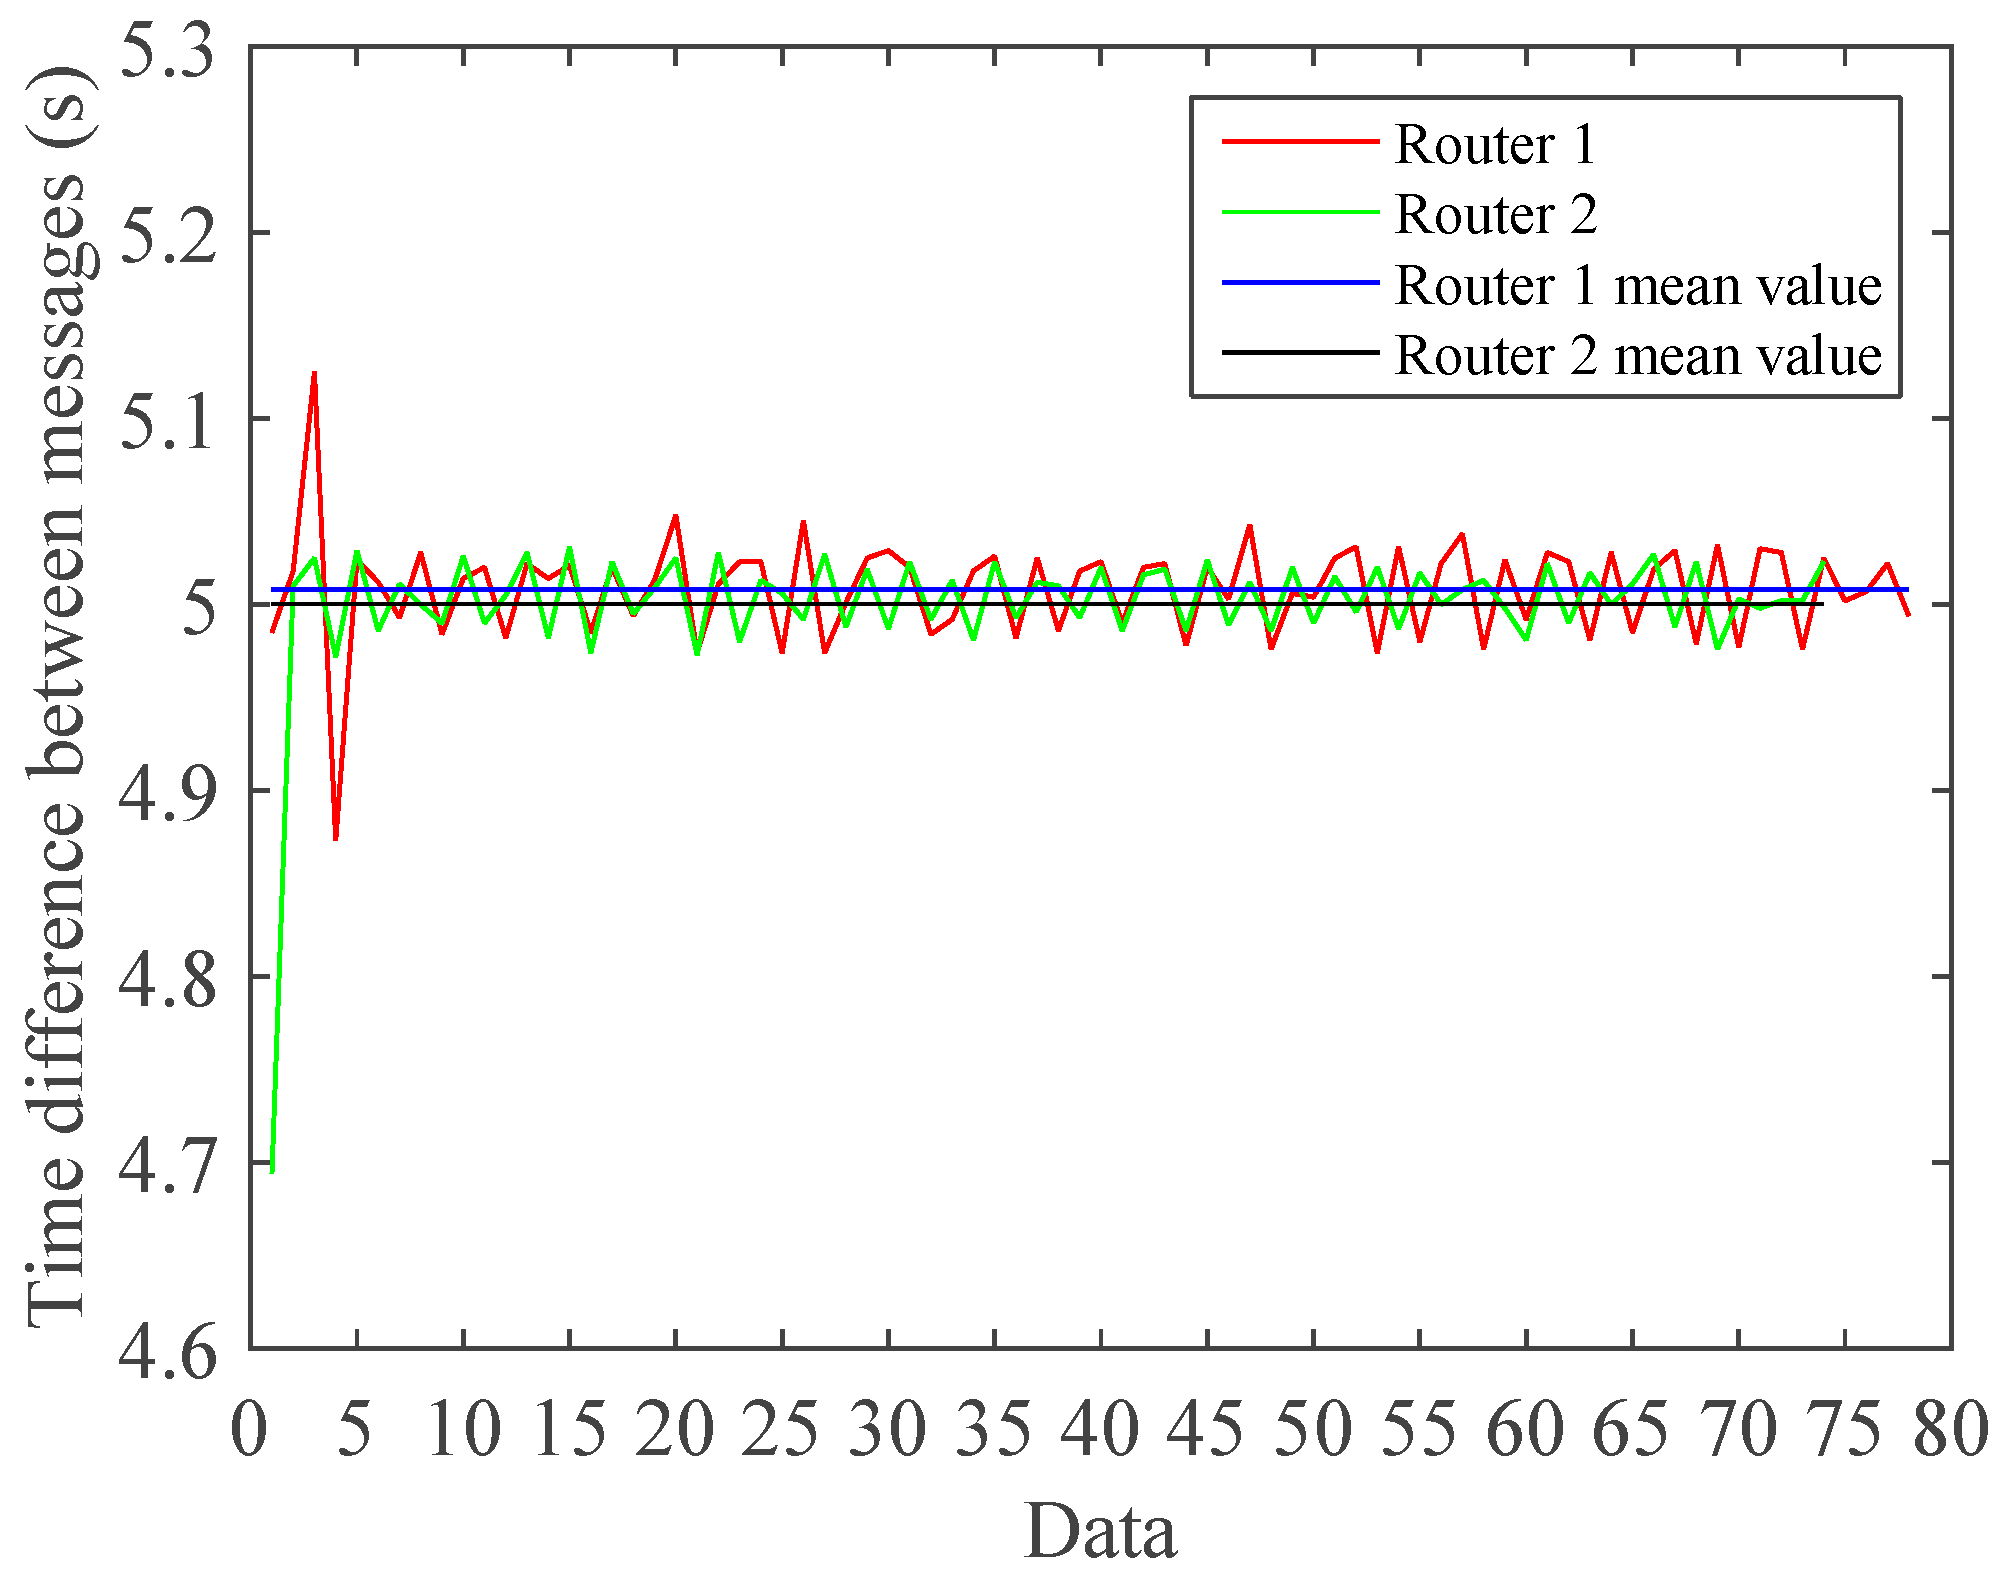
Case A.1 Results: For this case, two routers, R1 and R2, were within their expected ranges. As expected, the PRR was around 97% for R1 and 100% for R2 (in the experiments made). The small percentage of packets lost was likely caused by the delays in the initialization process.
As expected, there were no major delays in the packet reception. The expected five-second delay was obtained with very low variance. The time intervals between the data received for this case are shown in Figure 15. In this and remaining figures, the horizontal axis “Data” label represents the number of packets sent.
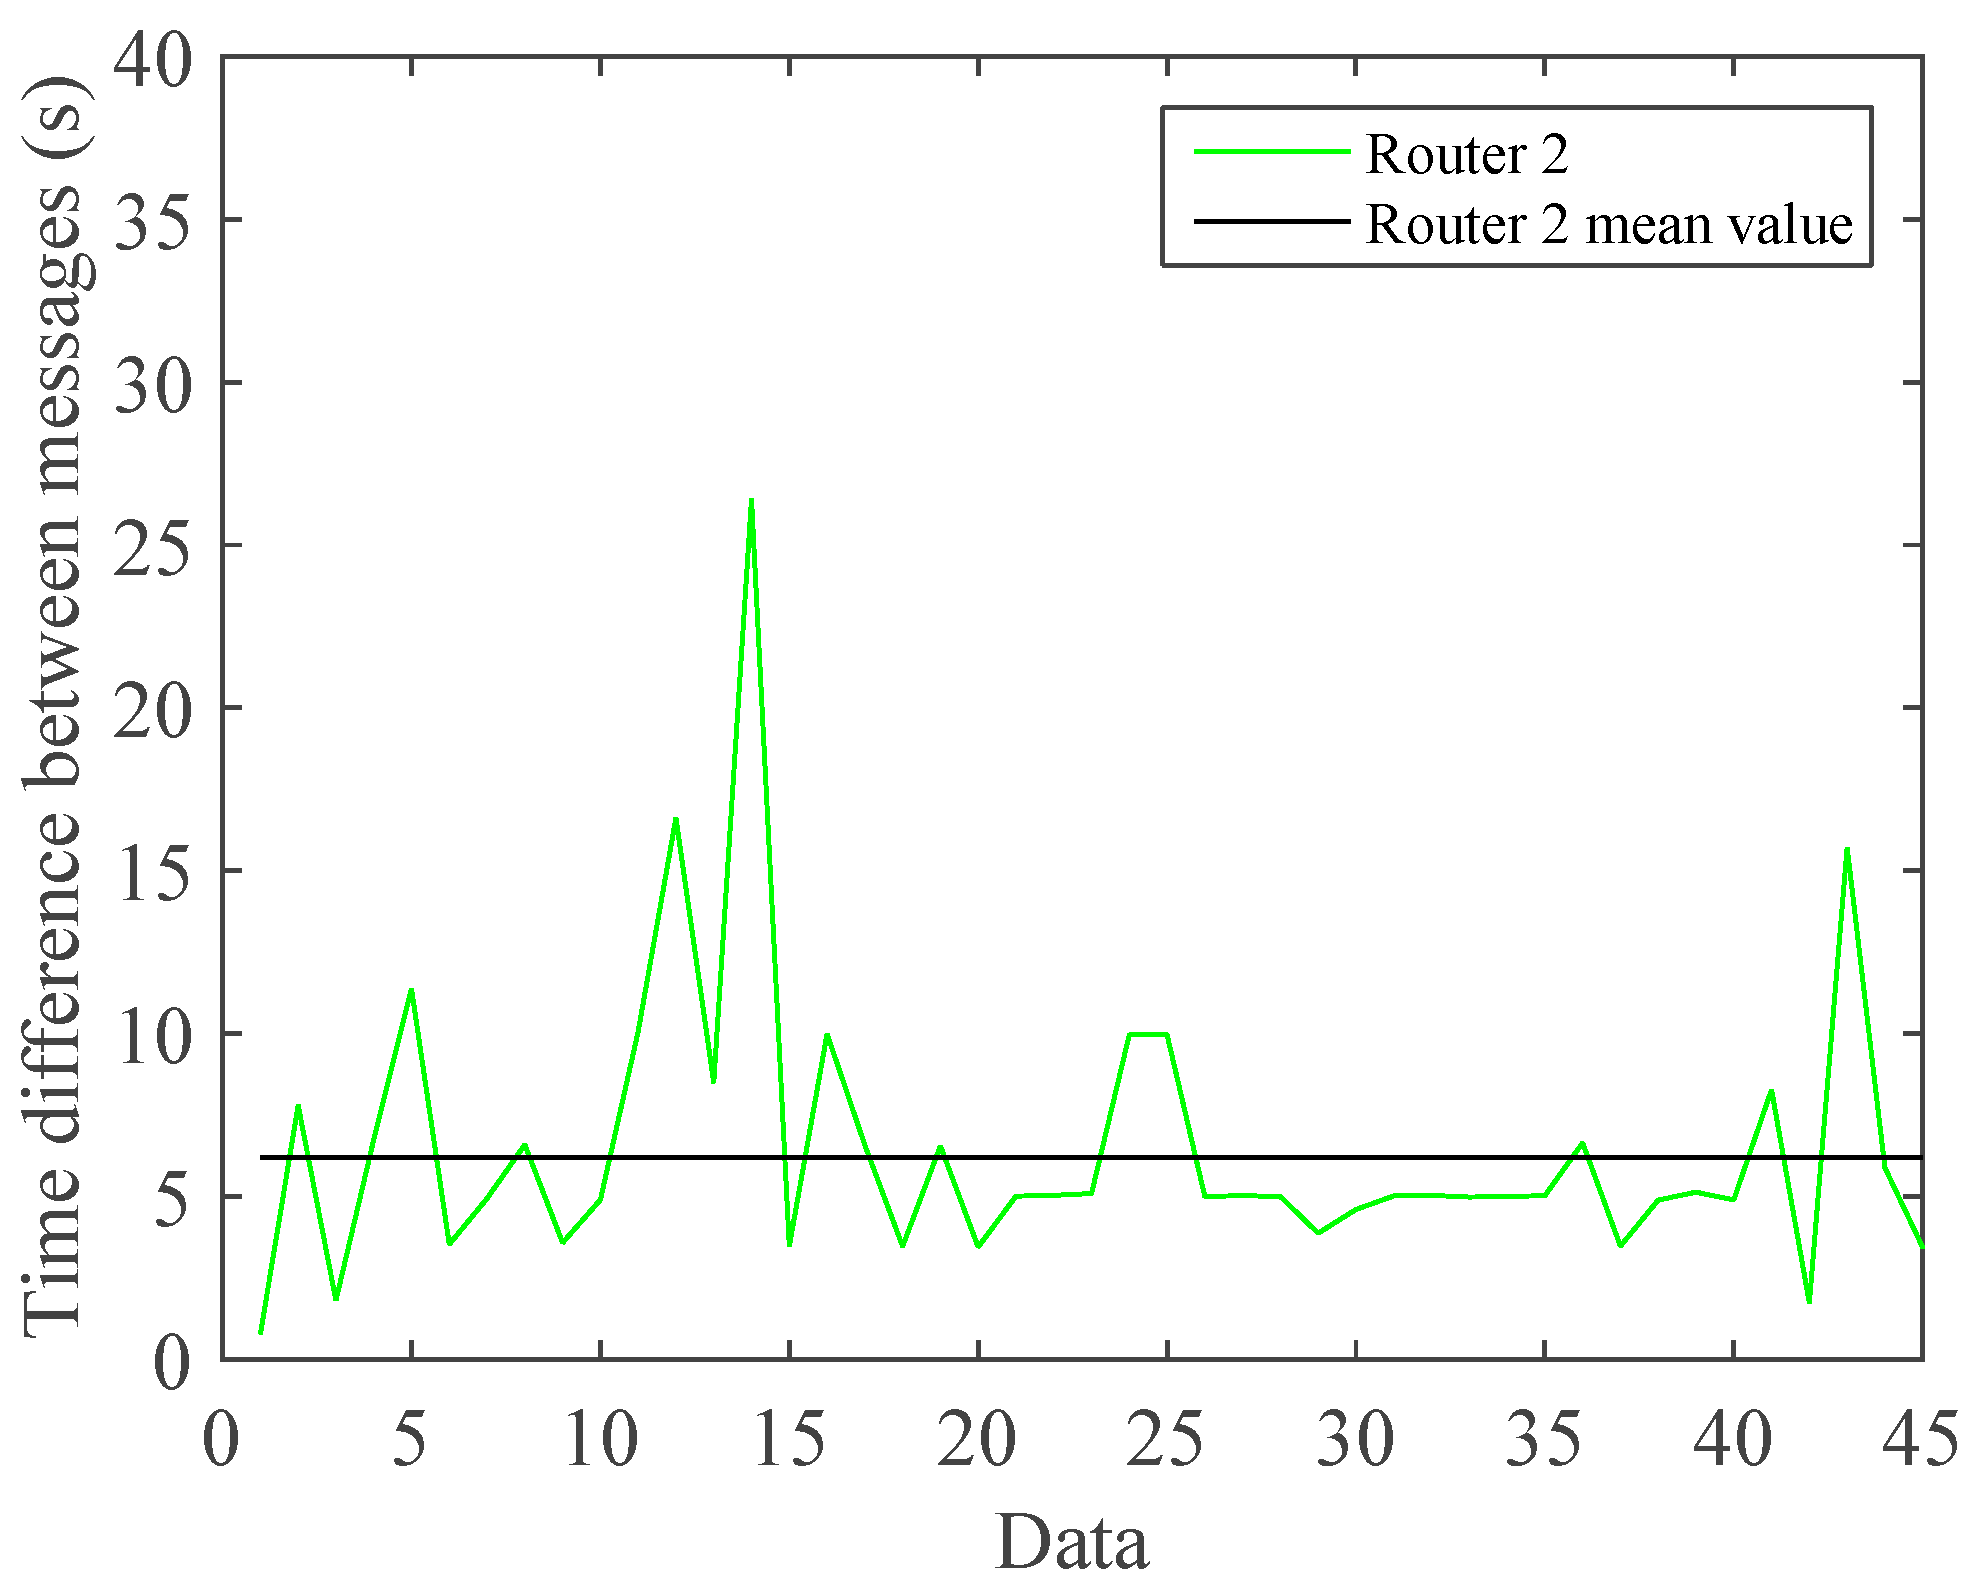
Case A.2 Results: For this case, router R2 was placed in its range limit. Degradation of the PPR was expected. This was confirmed, as the PPR was worse than in Case 1. However, a nearly 80% PRR does not compromise the system, since, in real cases, the coordinators would be set in API mode. Therefore, the system can always resend the message. In this case, the mean packet reception time was increased by about one second. The time intervals between the data points received are shown in Figure 16.
Case A.3 Results: In this case, R1 was placed between the limit range router R2 and the coordinator to improve the PRR of R2. Due to some issues at the start of the test, the first packet took a longer time to arrive at the coordinator. Therefore, the initial points shown in Figure 17 can be ignored. Nevertheless, the PRR increased as expected.
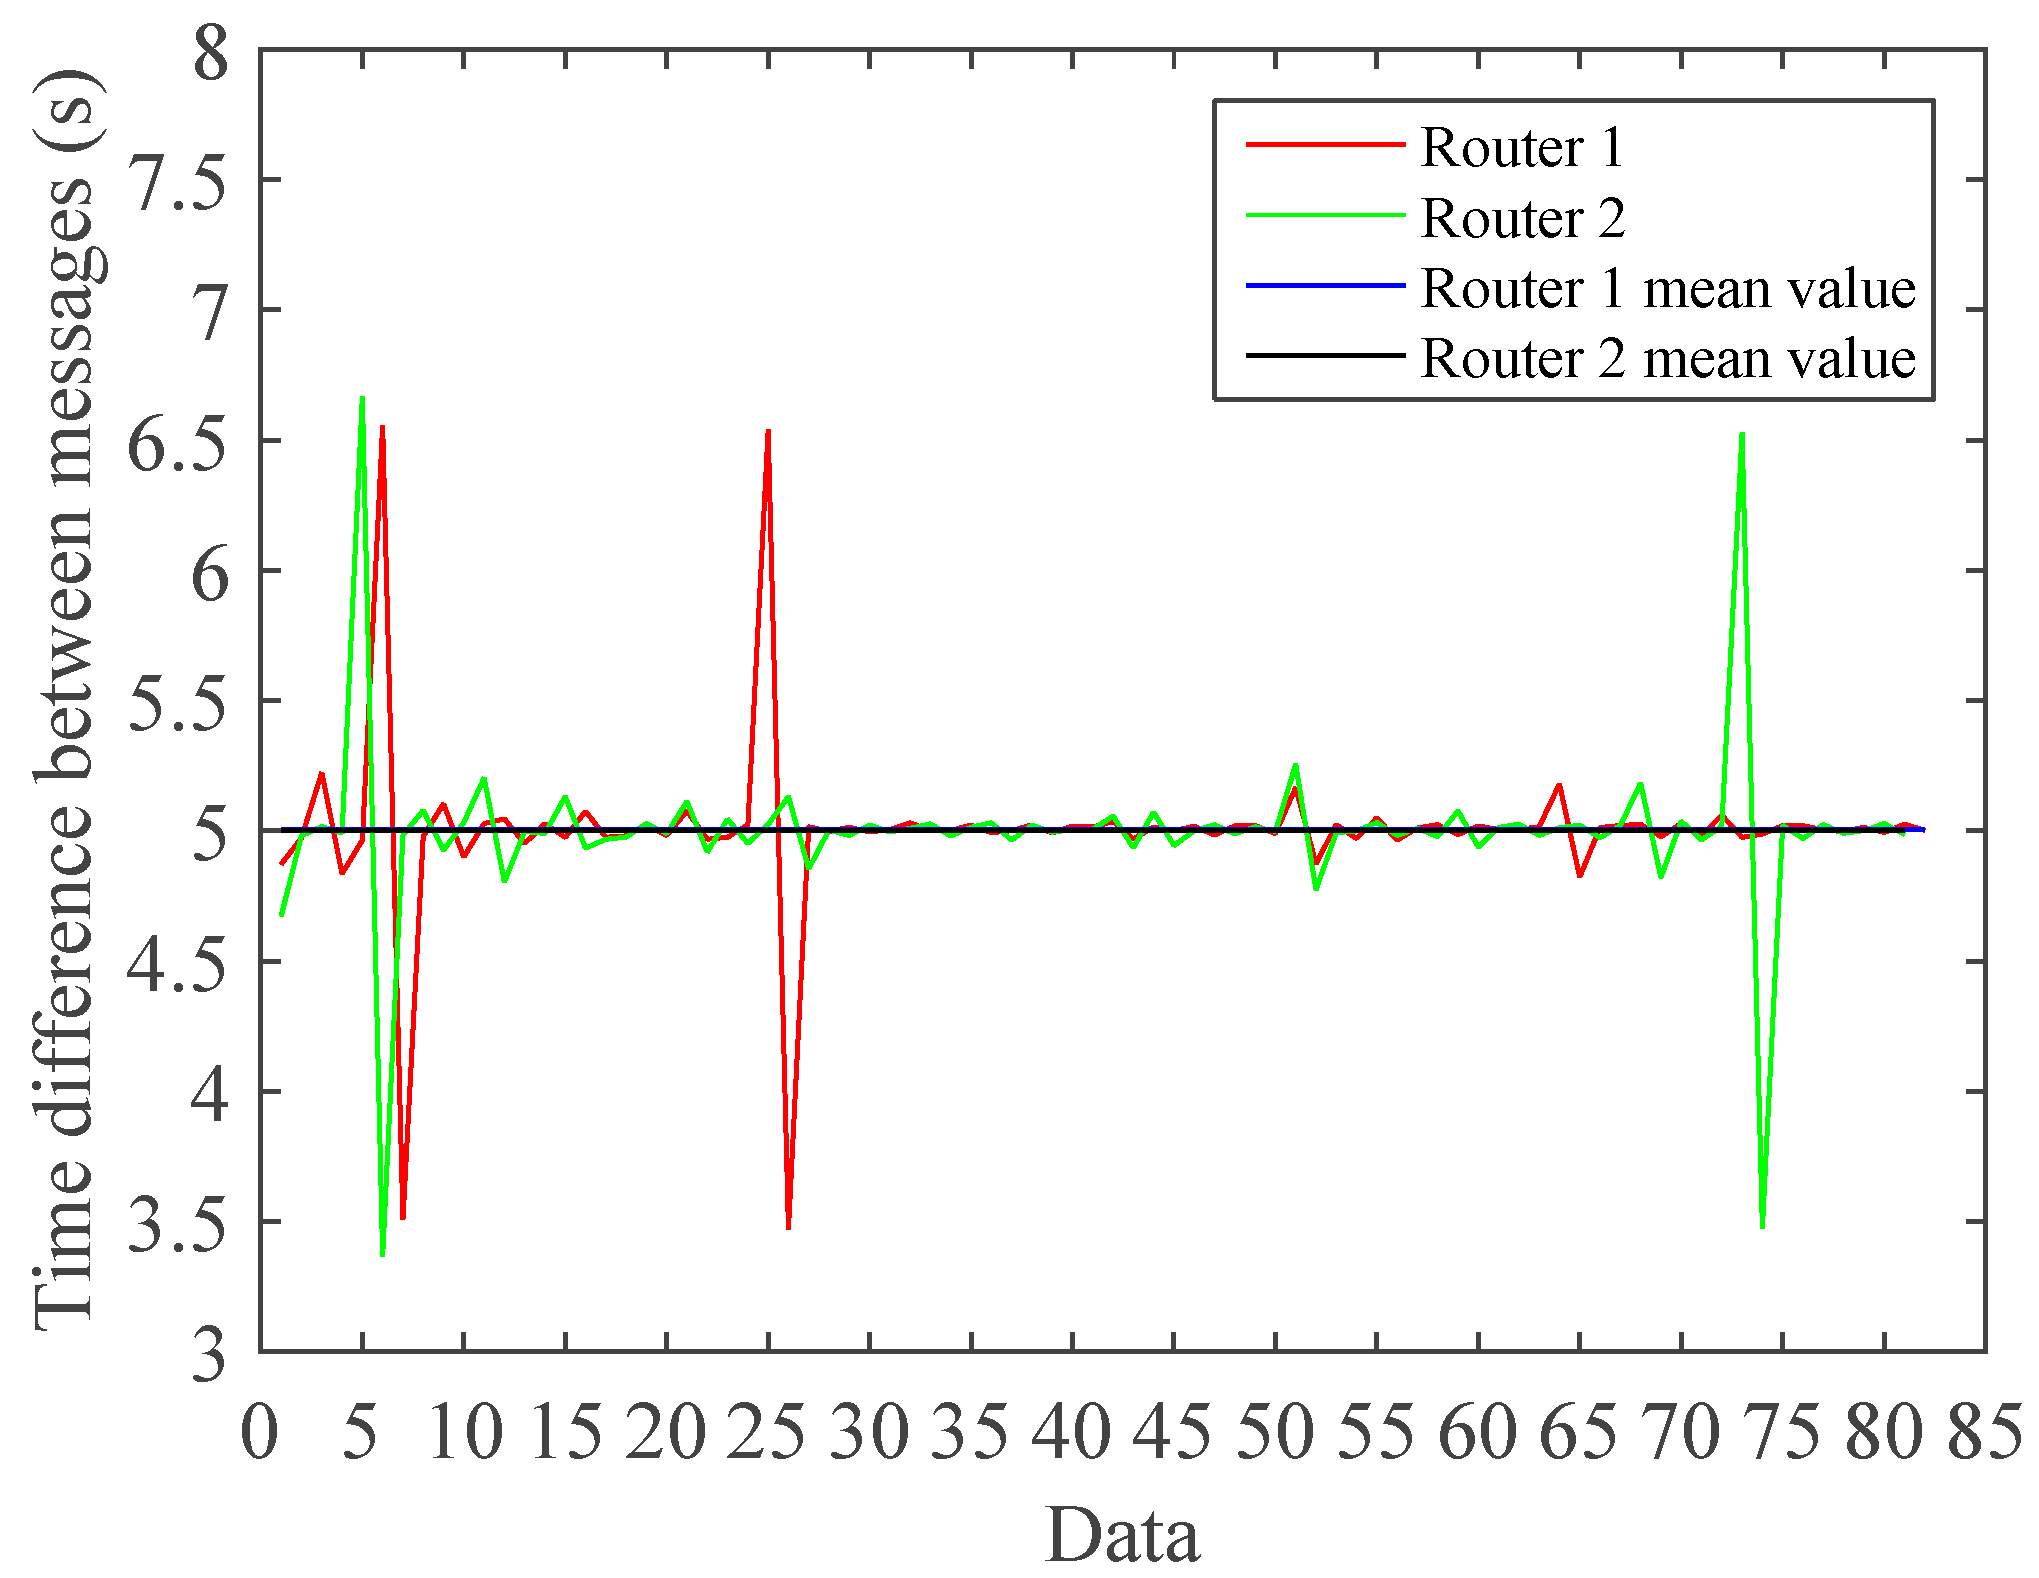
Case A.4 Results: In this case, R1 was within range, and R2 was located outside the coordinators’ range.
The relations between the packets received by the routers are shown in Figure 18. The PRR remained above 90%.
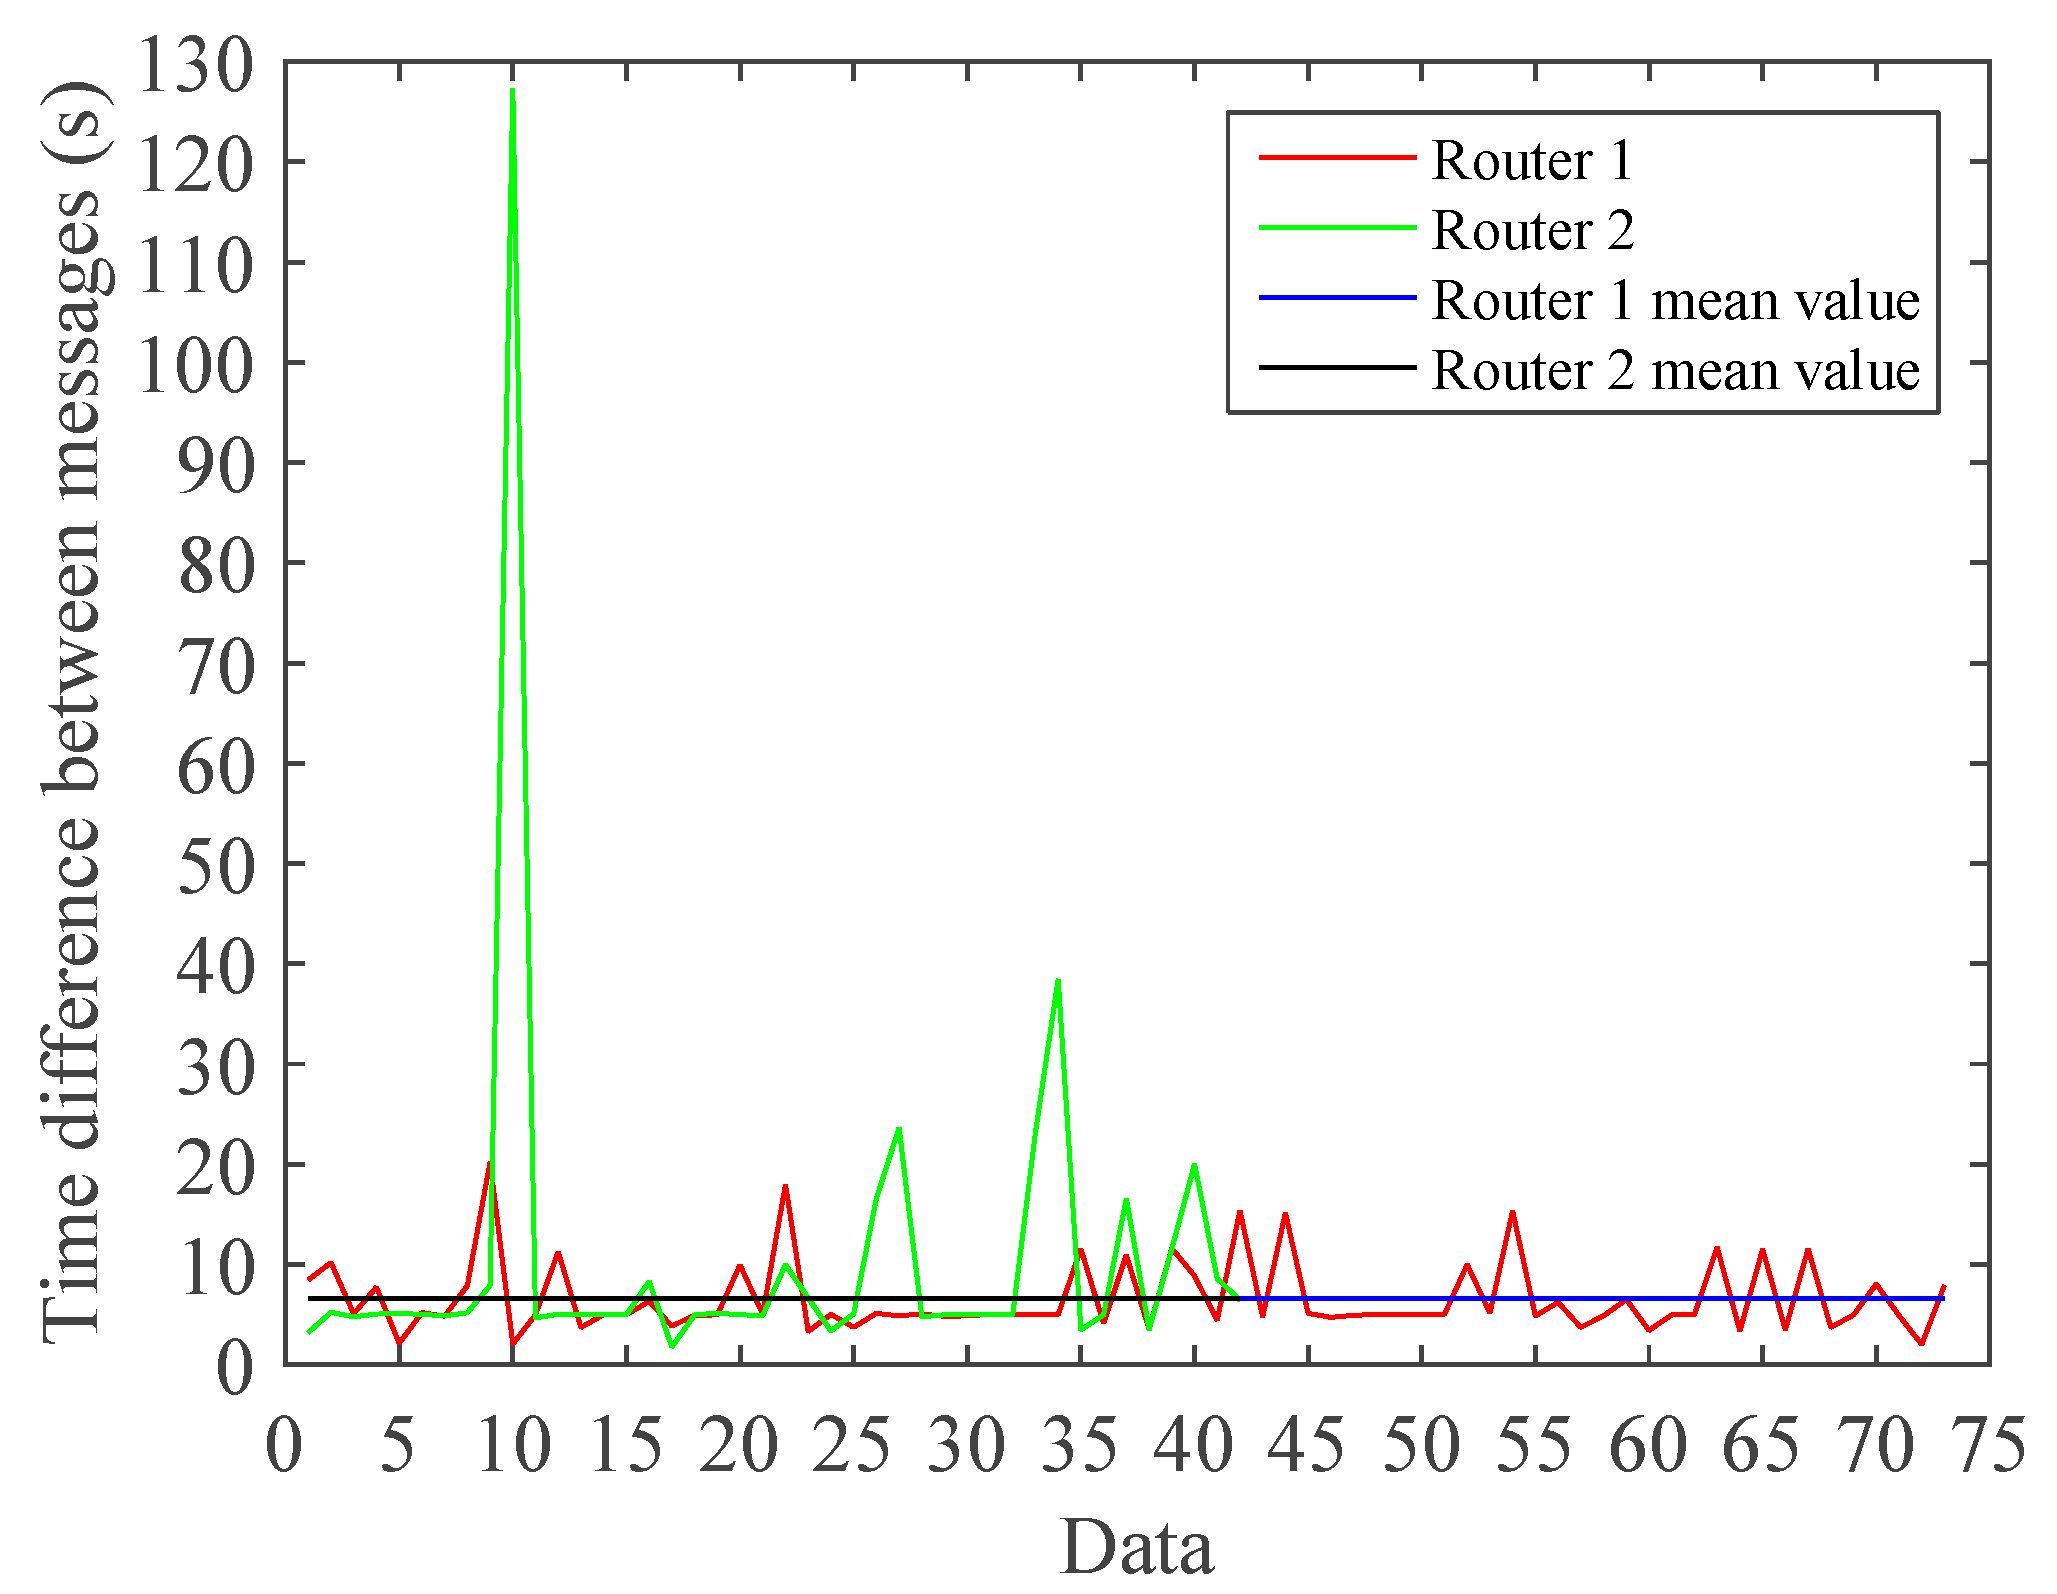
Case A.5 Results: This case corresponded to the worst-case scenario. It combined Cases A.3 and A.4, i.e., R1 was placed in the range limit and R2 was placed out of range of the coordinator. The influence of the transmission of all communications of R2 through R1 at its limit range is shown in Figure 19.
A much greater number of packets was lost. Table 1 shows that this is the worst scenario with the lowest packet reception ratio.
For a better comparison of all five cases, the results are plotted together to show which scenario gives the best packet reception ratio. Figure 20 shows that the proximity of the routers and coordinator resulted in a better performance of the transmission of information. Case 5 had the largest distance between the routers and coordinator, as shown in Figure 14.
5.2. Experimental Results for Case Study B
In this case, the effect of a WiFi router operating in the same 2.4 GHz band was studied. By switching on and off, the WiFi router in the proximity of one of the prototype devices caused the connection to experience some instability. However, the connection was always re-established after a few seconds. This test was an ON-OFF test to verify the system’s tolerance against failures and interference of other equipment. This is an important issue for the overall system reliability. However, a complete test exploiting the robustness of the system against multiple combinations of failures and types of interference is underway. This case study illustrates that the system is robust against a router interference in the same frequency band and recovers to normal operation in a few seconds.
5.3. Experimental Results for Case Study C
This case consisted of varying the distance between the static device and the mobile device to check the PRR variation with distance.
Three types of antenna were tested: chip, wired, and external RPSMA antennas. The results show that the range of specifications for each device does not correspond to the range achieved using that type of antenna. The range of the devices tested was nearly 16 times lower than the announced value.
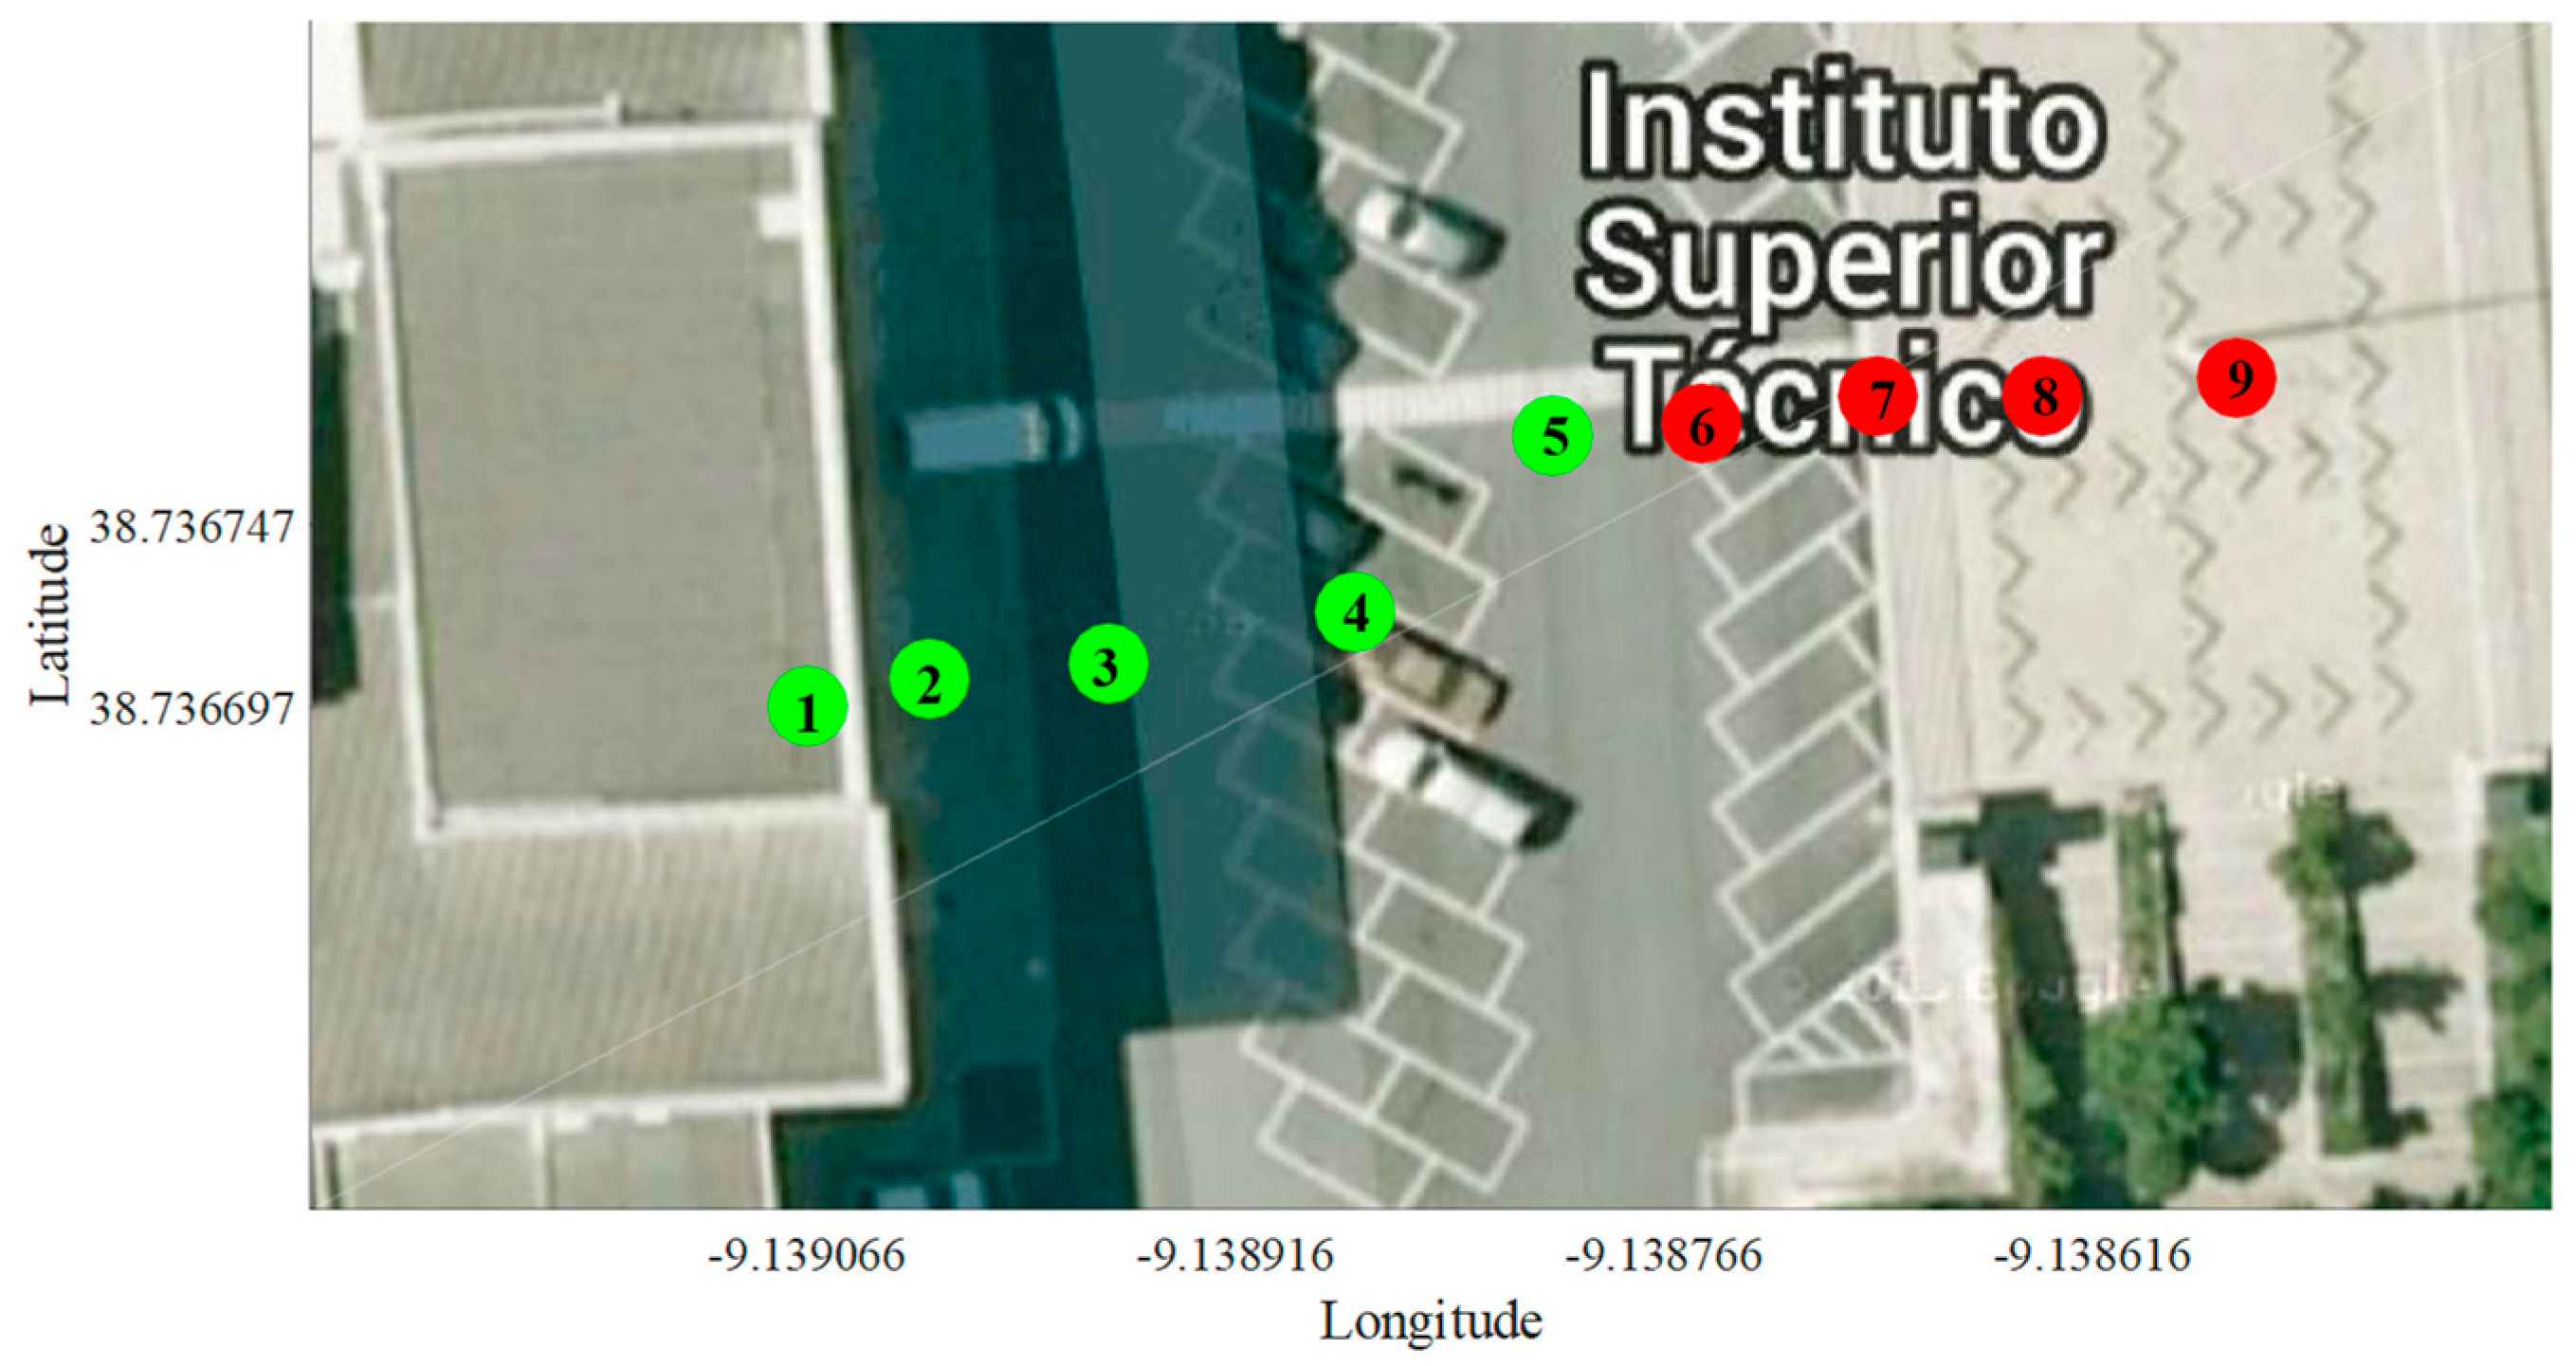
In Figure 21, the results collected from using a chip antenna with a Google Maps view in an urban environment are shown. The green and red circles correspond to good connection or fair connection quality, as explained in Table 2 and Figure 22.
The results were compiled in a table and a graph was plotted with all of the information gathered. Table 2 shows the results obtained in this test for the longitude, latitude, and mean LQI.
One possible solution for this case is the use of an external antenna connected to the RP-SMA plug. Other alternatives are now being considered under other frequency ranges to increase the outdoor (line of sight) and indoor ranges.
6. Conclusions
This paper proposed an alternative, upgraded solution to outdated traffic control systems, which implements a communication network using grid-based wireless devices with application in aerotropolis areas. The communications network shows high performance for the simulated traffic control system while also providing secure network communication. In a dynamic intelligent transport system, it is necessary to add, replace, or remove devices from the grid. The used communications drivers were shown to be capable of integrating a self-forming network without the need for manual reconfiguration. Possible failures of devices are compensated by the other devices to allow the adjustment of routes. As for communication robustness, the communication devices were found to give satisfactory results, especially when used in a grid. Tests were performed in limited distance situations. The results were positive, which indicated that the communication between devices can maintain a decent packet received ratio. Other algorithms could be tested and implemented. However, this article focused on the validation of a wireless infrastructure for traffic light control. This infrastructure may support traffic control optimization, which is a topic of research in line with this work. The integration of smart traffic lights into a dynamic intelligent transport system lays the foundation for better utilization of roads and special corridors. This process limits the number of traffic jams, improves the air quality, and provides greater sustainability in aerotropolis areas.
Author Contributions
J.C. carried out this work as part of his MSc Thesis and was mainly involved in the implementation, software validation, data collection, and analysis. N.B. was mainly involved in the communications protocol and software design and implementation. C.C. and R.M. were the supervisors of this work. All authors were involved in the preparation of this paper and have read and agreed to the published version of the manuscript.
Funding
This research received no external funding.
Acknowledgments
FCT, through IDMEC, under LAETA (project UIDB/50022/2020) and the European Union through the European Regional Development Fund, included in the COMPETE 2020 (Operational Program Competitiveness and Internationalization) through the ICT project UID/GEO/04683/2019 with the reference POCI010145FEDER007690, supported this work.
Conflicts of Interest
The authors declare no conflict of interest.
Nomenclature
| AES | Advanced encryption standard |
| API | Application programming interface |
| CP | Communication protocol |
| IoT | Internet of Things |
| ITS | Intelligent transport system |
| LQI | Link quality indicator |
| PRR | Packet reception ratio |
| SCs | Smart Cities |
| SNR | Signal-to-noise ratio |
| TC | Traffic control |
| WCT | Wireless communication technology |
References
- Kasarda, J.D. Aerotropolis. In The Wiley Blackwell Encyclopedia of Urban and Regional Studies; Orum, A., Ed.; John Wiley & Sons: Hoboken, NJ, USA, 2019; pp. 1–7. [Google Scholar]
- Yousef, K.M.; Al-Karaki, J.N.; Shatnawi, A.M. Intelligent traffic flow control system using wireless sensors networks. J. Inf. Sci. Eng. 2010, 26, 753–768. [Google Scholar]
- Pescaru, D.; Curiac, D. Ensemble based traffic light control for city zones using a reduced number of sensors. Transp. Res. Part C: Emerg. Technol. 2014, 46, 261–273. [Google Scholar] [CrossRef]
- Kasarda, J.D.; Stephen, J.A. Planning a competitive aerotropolis. In The Economics of International Airline Transport; James, H.P., Jr., Ed.; Emerald Group Publishing Limited: West Yorkshire, UK, 2014; pp. 281–308. [Google Scholar]
- Graham, A. How important are commercial revenues to today’s airports? J. Air Transp. Manag. 2009, 15, 106–111. [Google Scholar] [CrossRef]
- Airport Planning Manual: Part 2 Land Use and Environmental Control, 3rd Ed. ed; Doc 9184; International Civil Aviation Organization (ICAO): Montréal, QC, Canada, 2002.
- Knaian, A.N. A Wireless Sensor Network for Smart Roadbeds and Intelligent Transportation Systems. Master’s Thesis, Massachusetts Institute of Technology, Cambridge, MA, USA, 2000. [Google Scholar]
- Faye, S.; Chaudet, C. Characterizing the topology of an urban wireless sensor network for road traffic management. IEEE Trans. Veh. Technol. 2016, 65, 5720–5725. [Google Scholar] [CrossRef] [Green Version]
- Wen, W. A dynamic and automatic traffic light control expert system for solving the road congestion problem. Expert Syst. Appl. 2008, 34, 2370–2381. [Google Scholar] [CrossRef]
- Araghi, S.; Khosravi, A.; Creighton, D. A review on computational intelligence methods for controlling traffic signal timing. Expert Syst. Appl. 2015, 42, 1538–1550. [Google Scholar] [CrossRef]
- Jiang, R.; Chen, J.; Ding, Z.; Ao, D.; Hu, M.; Gao, Z.; Jia, B. Network operation reliability in a Manhattan-like urban system with adaptive traffic lights. Transp. Res. Part C 2016, 69, 527–547. [Google Scholar] [CrossRef]
- Hodge, V.J.; O’Keefe, S.; Weeks, M.; Moulds, A. Wireless Sensor networks for condition monitoring in the railway industry: A survey. IEEE Trans. Intell. Transp. Syst. 2015, 16, 1088–1106. [Google Scholar] [CrossRef]
- Wen, W. An intelligent traffic management expert system with RFID technology. Expert Syst. Appl. 2010, 37, 3024–3035. [Google Scholar] [CrossRef]
- Franceries, E.; Liver, K. Centralized traffic management system as response to the effective realization of urban traffic fluency. Arch. Transp. Telemat. 2011, 4, 4–10. [Google Scholar]
- Directive 2010/40/EU. On the Framework for the Deployment of Intelligent Transport Systems in the Field of Road Transport and for Interfaces with Other Modes of Transport; European Parliament and of the Council: Brussels, Belgium, 2010.
- Zantalis, F.; Koulouras, G.; Karabetsos, S.; Kandris, D.A. A review of machine learning and IoT in smart transportation. Future Internet 2019, 11, 94. [Google Scholar] [CrossRef] [Green Version]
- Collotta, M.; Lo Bello, L.; Pau, G. A novel approach for dynamic traffic lights management based on wireless sensor networks and multiple fuzzy logic controllers. Expert Syst. Appl. 2015, 42, 5403–5415. [Google Scholar] [CrossRef]
- Kafi, M.A.; Challal, Y.; Djenouri, D.; Doudou, M.; Bouabdallah, A.; Badache, N. A study of wireless sensor networks for urban traffic monitoring: Applications and architectures. Procedia Comput. Sci. 2013, 19, 617–626. [Google Scholar] [CrossRef] [Green Version]
- Hussian, R.; Sharma, S.; Sharma, V. WSN applications: Automated intelligent traffic control system using sensors. Int. J. Soft Comput. Eng. 2013, 3, 77–81. [Google Scholar]
- Siemens Mobility 2016. Sitraffic Wimag: Wireless Magnetic Detector, Innovation in Traffic Detection. Available online: http://www.siemens.com/mobility/ (accessed on 20 January 2020).
- Cardeira, C.; Colombo, A.W.; Schoop, R. Wireless solutions for automation requirements. ATP Int. -Autom. Technol. Pract. 2006, 2, 51–58. [Google Scholar]
- Batista, N.C.; Melicio, R.; Matias, J.C.O.; Catalão, J.P.S. Photovoltaic and wind energy systems monitoring and building/home energy management using ZigBee devices within a smart grid. Energy 2013, 49, 306–315. [Google Scholar] [CrossRef]
- IEEE Standard for Information Technology-Telecommunications and Information Exchange between Systems-Local and Metropolitan Area Networks-Specific Requirements—Part 15.4: Wireless Medium Access Control (MAC) And Physical Layer (PHY) Specifications for Low-Rate Wireless Personal Area Networks (LR-WPANs); IEEE Computer Society: Washington, DC, USA, 2018; pp. 1–679, IEEE Std 802.15.4‐2003.
- Morais, R.; Fernandes, M.A.; Matos, S.G.; Serôdio, C.; Ferreira, P.J.S.G.; Reis, M.J.C.S. A ZigBee multi-powered wireless acquisition device for remote sensing applications in precision viticulture. Comput. Electron. Agric. 2008, 62, 94–106. [Google Scholar] [CrossRef]
- Zanella, A.; Bui, N.; Castellani, A.; Vangelista, L.; Zorzi, M.A. Internet of things for smart cities. IEEE Internet Things J. 2014, 1, 22–32. [Google Scholar] [CrossRef]
- Pérez, J.; Seco, F.; Milanés, V.; Jiménez, A.; Díaz, J.C.; De Pedro, T. An RFID-based intelligent vehicle speed controller using active traffic signals. Sensors 2010, 10, 5872–5887. [Google Scholar] [CrossRef] [Green Version]
- Zhou, B.; Cao, J.; Zeng, X.; Wu, H. Adaptive traffic light control in wireless sensor network-based intelligent transportation system. In Proceedings of the 72nd IEEE Vehicular Technology Conference-Fall, Otawa, ON, Canada, 6–9 September 2010; pp. 1–5. [Google Scholar]
- Swathi, K.; Sivanagaraju, V.; Manikanta, A.K.S.; Kumar, S.D. Traffic density control and accident indicator using WSN. Int. J. Mod. Trends Sci. Technol. 2016, 2, 2455–3778. [Google Scholar]
- Sivarao, S.K.S.; Mazran, E.; Anand, T.J.S. Electrical & mechanical fault alert traffic light system using wireless technology. Int. J. Mech. Mechatron. Eng. 2010, 10, 15–18. [Google Scholar]
- Tubaishat, M.; Shang, Y.; Shi, H. Adaptive traffic light control with wireless sensor networks. In Proceedings of the 4th IEEE Consumer Communications and Networking Conference, Las Vegas, NV, USA, 11–13 January 2007; pp. 187–191. [Google Scholar]
- Naranjo, P.G.V.; Pooranian, Z.; Shojafar, M.; Conti, M.; Buyya, R. FOCAN: A Fog-supported smart city network architecture for management of applications in the internet of everything environments. J. Parallel Distrib. Comput. 2019, 132, 274–283. [Google Scholar] [CrossRef] [Green Version]
- Charles, M.B.; Barnes, P.; Ryan, N.; Clayton, J. Airport futures: Towards a critique of the aerotropolis model. Futures 2007, 39, 1009–1028. [Google Scholar] [CrossRef]
- Cunha, J.; Cardeira, C.; Melicio, R. Traffic lights control prototype using wireless technologies. Renew. Energy Power Qual. J. (RE&PQJ) 2016, 1, 1031–1036. [Google Scholar]
- Cunha, J.; Cardeira, C.; Melicio, R. Wireless technologies for controlling a traffic lights prototype. In Proceedings of the 17th IEEE International Conference on Power Electronics and Motion Control, Varna, Bulgaria, 25–30 September 2016; pp. 866–871. [Google Scholar]
- Batista, N.C.; Melicio, R.; Mendes, V.M.F. Services enabler architecture for smart grid and smart living services providers under industry 4.0. Energy Build. 2017, 141, 16–27. [Google Scholar] [CrossRef] [Green Version]
- Usman, A.; Shami, S.H. Evolution of communication technologies for smart grid applications. Renew. Sustain. Energy Rev. 2013, 3, 191–199. [Google Scholar] [CrossRef]
- Batista, N.C.; Melicio, R.; Matias, J.C.O.; Catalão, J.P.S. ZigBee standard in the creation of wireless networks for advanced metering infrastructures. In Proceedings of the 16th IEEE Mediterranean Electrotechnical Conference, Yasmine Hammamet, Tunisia, 25–28 March 2012; pp. 220–223. [Google Scholar]
- Batista, N.C.; Melicio, R.; Matias, J.C.O.; Catalão, J.P.S. ZigBee wireless area network for home automation and energy management: Field trials and installation approaches. In Proceedings of the 3rd IEEE PES Europe Conference on Innovative Smart Grid Technologies, Berlin, Germany, 14–17 October 2012; pp. 1–5. [Google Scholar]
- Batista, N.C.; Melicio, R.; Matias, J.C.O.; Catalão, J.P.S. ZigBee devices for distributed generation management: Field tests and installation approaches. In Proceedings of the 6th IET International Conference on Power Electronics, Machines and Drives, Bristol, UK, 27–29 March 2012; pp. 1–5. [Google Scholar]
- Batista, N.C.; Melicio, R.; Mendes, V.M.F. Layered smart grid architecture approach and field tests by ZigBee technology. Energy Convers. Manag. 2014, 88, 49–59. [Google Scholar] [CrossRef]
- IEEE Standard for Local and Metropolitan Area Networks-Part 15.4: Low-Rate Wireless Personal Area Networks (LR-WPANs); IEEE Computer Society: Washington, DC, USA, 2011; pp. 1–314, IEEE Std 802.15.4‐2011.
- Digi International. XBee/XBee-PRO ZB RF Modules; Digi International, Inc.: Hopkins, MN, USA, 2012; pp. 1–157. [Google Scholar]
- ZigBee Alliance. ZigBee Specification—Document 053474r20; ZigBee Standards Organization: Davis, CA, USA, 2012; pp. 1–622. [Google Scholar]
- Koopman, P.; Chakravarty, T. Cyclic redundancy code (CRC) polynomial selection for embedded networks. In Proceedings of the International Conference on Dependable Systems and Networks, Florence, Italy, 28 June–1 July 2004; pp. 1–11. [Google Scholar]
- Goel, A.; Ray, S.; Chandra, N. Intelligent traffic light system to prioritized emergency purpose vehicles based on wireless sensor network. Int. J. Comput. Appl. 2012, 40, 36–39. [Google Scholar] [CrossRef]
- Iyyappan, M.S.; Nandagopal, M.V. Automatic accident detection and ambulance rescue with intelligent traffic light system. Int. J. Adv. Res. Electr. Electron. Instrum. Eng. 2013, 2, 1319–1325. [Google Scholar]
- Vieira, M.A. Melhoria da velocidade dos transportes públicos de superfície em Lisboa por regulação da admissão de trânsito. Master’s Thesis, Instituto Superior Técnico, Lisbon, Portugal, 2004. [Google Scholar]
- Koehler, L.A.; Kraus, W., Jr. Simultaneous control of traffic lights and bus departure for priority operation. Transp. Res. Part C 2010, 18, 288–298. [Google Scholar] [CrossRef]
- Huang, Y.; Shiue, J.; Luo, J. A traffic signal control policy for emergency vehicles preemption using timed petri nets. IFAC-PapersOnLine 2015, 48, 2183–2188. [Google Scholar] [CrossRef]
- Antipova, A.; Ozdenerol, E. Using longitudinal employer dynamics (LED) data for the analysis of Memphis Aerotropolis, Tennessee. Appl. Geogr. 2013, 42, 48–62. [Google Scholar] [CrossRef]
- Banai, R. The aerotropolis: Urban sustainability perspectives from the regional city. J. Transp. Land Use 2017, 10, 357–373. [Google Scholar] [CrossRef] [Green Version]
- Zheng, G.; Han, D.; Zheng, R.; Schmitz, C.; Yuan, X. A link quality inference model for IEEE 802.15.4 low-rate WPANs. In Proceedings of the IEEE Global Telecommunications Conference, Houston, TX, USA, 5–9 December 2011; pp. 1–6. [Google Scholar]
Figure 1.
ZigBee mesh.

Figure 2.
Diagram of vehicle priority parameters.

Figure 3.
Diagram of the developed communication protocol (CP).

Figure 4.
Flowchart of the communication system.

Figure 5.
Diagram of the static system.

Figure 6.
Components used in the static system.

Figure 7.
Diagram of the mobile system.

Figure 8.
Components of the mobile system.

Figure 9.
Three-dimensional model of the prototype.

Figure 10.
Representation of Case A.1.

Figure 11.
Representation of Case A.2.

Figure 12.
Representation of Case A.3.

Figure 13.
Representation of Case A.4.

Figure 14.
Representation of Case A.5.

Figure 15.
Case A.1: Time intervals between the data points received.

Figure 16.
Case A.2: Time intervals between the data points received.

Figure 17.
Case A.3: Time intervals between the data points received without the initial points.

Figure 18.
Case A.4: Time intervals between the data points received.

Figure 19.
Case A.5: Time intervals between the data points received.

Figure 20.
Graphical comparison of the five cases tested in case study A

Figure 21.
Case study C: Google Maps view with the results achieved.

Figure 22.
Graphical comparison of all Link Quality Indicator (LQI) values acquired in test 4.3.


Table 1.
Results achieved in test 5.1.
| Cases | Data Analysis | ||||
|---|---|---|---|---|---|
| Source | Mean Time per Packet (s) | Maximum Time per Packet (s) | Minimum Time per Packet (s) | Packet Reception Ratio (PRR) | |
| Case 1 | Router 1 | 5.0068 | 5.0340 | 4.9730 | 97.33 |
| Router 2 | 5.0047 | 5.0380 | 4.9460 | 100 | |
| Case 2 | Router 1 (OFF) | NA | NA | NA | NA |
| Router 2 | 6.1841 | 26.4100 | 0.7650 | 79.80 | |
| Case 3 | Router 1 | 5.0083 | 5.1250 | 4.8730 | 96.34 |
| Router 2 | 5.3491 | 31.1570 | 4.6940 | 92.68 | |
| Case 4 | Router 1 | 5.0059 | 6.5560 | 3.4710 | 97.65 |
| Router 2 | 5.0003 | 6.6680 | 3.3680 | 95.35 | |
| Case 5 | Router 1 | 6.6024 | 20.1980 | 2.0120 | 74.75 |
| Router 2 | 10.8373 | 127.3110 | 1.7620 | 44.33 | |
Table 2.
Results achieved in test 5.3.
| Points | Data Analysis | |||
|---|---|---|---|---|
| Longitude | Latitude | Mean Link Quality Indicator (LQI) (0–255) | Observations | |
| Point 1 | –9.139066 | 38.736697 | 255 | Connection established |
| Point 2 | –9.139023 | 38.736705 | 254.7 | Good connection |
| Point 3 | –9.138960 | 38.736709 | 250.7 | Good connection |
| Point 4 | –9.138874 | 38.736723 | 241 | Good connection |
| Point 5 | –9.138805 | 38.736771 | 210.3 | Good connection |
| Point 6 | –9.138753 | 38.739775 | 150.3 | Fair connection |
| Point 7 | –9.138691 | 38.736782 | 70.7 | Fair connection |
| Point 8 | –9.138633 | 38.736782 | 38.3 | Fair connection |
| Point 9 | –9.138565 | 38.736787 | 0 | Connection lost |
© 2020 by the authors. Licensee MDPI, Basel, Switzerland. This article is an open access article distributed under the terms and conditions of the Creative Commons Attribution (CC BY) license (http://creativecommons.org/licenses/by/4.0/).
Share and Cite
MDPI and ACS Style
Cunha, J.; Batista, N.; Cardeira, C.; Melicio, R. Wireless Networks for Traffic Light Control on Urban and Aerotropolis Roads. J. Sens. Actuator Netw. 2020, 9, 26. https://0-doi-org.brum.beds.ac.uk/10.3390/jsan9020026
AMA Style
Cunha J, Batista N, Cardeira C, Melicio R. Wireless Networks for Traffic Light Control on Urban and Aerotropolis Roads. Journal of Sensor and Actuator Networks. 2020; 9(2):26. https://0-doi-org.brum.beds.ac.uk/10.3390/jsan9020026
Chicago/Turabian StyleCunha, João, Nelson Batista, Carlos Cardeira, and Rui Melicio. 2020. "Wireless Networks for Traffic Light Control on Urban and Aerotropolis Roads" Journal of Sensor and Actuator Networks 9, no. 2: 26. https://0-doi-org.brum.beds.ac.uk/10.3390/jsan9020026
Note that from the first issue of 2016, this journal uses article numbers instead of page numbers. See further details here.