1. Introduction
In 2020, the entire world faced an unprecedented situation which impacted the global population in different ways. The COVID-19 pandemic has not only had major impacts on economies, but has also impacted other aspects of human activity, such as social, ecological, political or behavioral dimensions. This creates problems in terms of identifying the nature of the sources, the consequences for evaluating their magnitude, as well as in designing therapeutic measures. Over a period of several months, the COVID-19 pandemic crisis has led to an unforeseen global transformation, with the human and economic impacts of this outbreak needing time to be quantified and addressed [
1] (p. 7).
Many studies have analyzed the impacts of COVID-19 from various points of view, and in different parts of the world. For example, Coccia [
2] highlighted that medical infrastructure in states with high investment in healthcare reduced the fatality rate of COVID-19 and necessitated shorter full lockdowns, thus reducing economic contractions. In time, a growing concern has been observed regarding the economic and social impacts of the pandemic, which may redefine aspects of society as the “new normal” [
3] (p. 443). This atypical crisis has led to different social and economic responses. Kraus [
4] (p. 1080) explored the impact of the pandemic on strategic modifications in business models and the operational use of digital tools, as well as the forced culture of digitalization. The pandemic created unexpected situations because, for a short while, social and economic activities were ceased, forcing individuals and organizations to respond with appropriate measures, including social distancing, a context in which online applications represent crucial means in maintaining the functionality of personal and business services [
5] (p. 1). Social distancing has also determined the growing tendency to use e-commerce as a way to avoid public exposure due to the risks of infection [
6] (p. 25). However, companies will also benefit from the use of new technologies. Ivanov et al. [
7] (p. 12) stated that companies decrease fixed costs by using automation technologies and gain a competitive advantage over non-automated companies; at the same time, physical distancing is facilitated by a technological shield.
Due to the pandemic, the complex social and economic contexts have become more uncertain, highlighting the acute need for a strategic digital transformation of small- and medium-sized enterprises (SMEs) [
8] (p. 10). In response to the COVID-19 crisis, digital technologies have been shown to play an important role; moreover, digitalization, which has enabled the implementation of public crisis response strategies, has contributed to increases in the performance of SMEs [
9] (p. 19). More and more studies have analyzed the digitalization phenomenon from different points of view. Jun’s [
10] study revealed how SMEs acting in the digital economy can benefit from digital platforms, in order to achieve innovation performance through organizational readiness. Klein and Todesco [
11] (p. 122) observed the tendency of rapid digitalization and of forming strategic partnerships in order to adapt to new supply–demand relationships, as well as the intensification of e-commerce as a clear response by small companies. To survive in the digital age, many companies have adopted digitization, a process that has been proven necessary, beneficial, and has materialized in the creation of e-commerce websites, the development of applications and platforms, and the transfer of document storage to cloud storage servers, thus making everything faster and more accessible [
12] (p. 86). The intensification of digital transformation has presented financial challenges and opportunities, due to the high potential in the development of digital technologies [
11] (p. 129).
In the context of the COVID-19 pandemic, specialists in the field have estimated that the turnovers of European companies will record drastic decreases, and also that the operational margins could suffer.
Given the shock suffered by domestic demand and the contraction of international trade flows caused by the spread of COVID-19, a contraction of Eurozone GDP has taken place. Indicators suggest that European firms face upward pressure in production costs, due to deficiencies in the supply chain, and descending pressures on their sales prices, caused by the shocks on demand. Lower long-term prices for oil and government policies can represent certain support.
In Europe, there are many SMEs (7% out of total) and medium capitalization businesses which faced risks prior to the pandemic. The crisis of cash flows associated with the pandemic period has become an aggravating risk factor of non-payment. It is understood that a deterioration in some financial indicators signals the future bankruptcy of a company. A study by Euler Hermes [
13] identified three such indicators—profitability, capitalization and interest coverage—whose examination has produced evidence of the relatively close proportions of companies that are in this category and so under threat of bankruptcy. The sectors most at risk are construction, the agri-food sector and services.
The pattern has been an increase in insolvencies, with variations from country to country. Overall, the number of insolvencies has been underestimated by pre-pandemic calculations.
This article has five sections. The first part begins with an introduction and the following section summarizes the literature as regards to various perspectives on e-commerce and digitalization trends and on enterprise human resource training in information and communications technology (ICT) in the pandemic context.
Section 3 discusses research methodological aspects related to the identification of behavioral patterns of enterprises with e-commerce activity. This section provides the necessary framework for applying a hierarchical clustering method. The analysis performed by grouping was based on the values of four indicators (Value of e-commerce sales, Cloud computing services, Enterprises that provided training to develop/upgrade ICT skills of their personnel, E-commerce, customer relationship management (CRM) and secure transactions) covering 31 European countries in both 2018 and 2020.
Section 4 and
Section 5 include the results and the conclusions: supremacy is held by Belgium, Ireland, the Czech Republic and Denmark, respectively, for value of e-commerce sales, E-commerce, customer relationship management and secure transactions, while Finland and Norway lead as regards cloud computing services and enterprises that provided training to develop/upgrade ICT skills of their personnel. In order to provide a full image, we analyzed EU countries and some European non-EU countries.
Considering the research undertaken so far in relation to enterprises with e-commerce activity, this study complements analyses and results reported in the field about such companies’ performance against the background of the COVID-19 pandemic.
The novelty of the article is given by the selected indicators, considered significant for enterprises that carried out e-commerce activity under conditions of the COVID-19 pandemic: Value of e-commerce sales, Cloud computing services, Enterprises that provided training to develop/upgrade ICT skills of their personnel, and E-commerce, customer relationship management (CRM) and secure transactions.
In addition, the originality of the article consists of the use of a hierarchical clustering method at the level of 31 European countries included in the sample, highlighting a detailed and complex picture of the behavior of e-commerce enterprises in relation to the indicators included in analysis from 2018 and 2020.
Following the description of the economic context created by the COVID-19 pandemic, whereby enterprises’ digitalization becomes more important and, in some cases, even vital, the different approaches adopted by the enterprises are depicted, as well as the opportunities created by the adoption of new technologies, such as e-commerce, that can potentially increase the enterprises’ performance. With the increase of e-commerce sales, enterprises are adapting to the digital economy by also using cloud computing services and by training their employees—another important aspect of digitalization approached in our study. Additionally, companies must take into account the changing behavior of online customers, and, consequently, adapt their own behavior. An entrepreneurial orientation and knowledge management together with e-commerce adoption must be part of an enterprises’ strategies. The clustering process is applied to highlight the grouping of countries in relation to the level reached by the following indicators: Value of e-commerce sales, Cloud computing services, Enterprises that provided training to develop/upgrade ICT skills of their personnel, and E-commerce, customer relationship management (CRM) and secure transactions. The differences in the percentage levels that appear in 2020, compared with 2018, are based on behavioral changes that occurred as a result of the crisis triggered by the COVID-19 pandemic. The comparison between 2018 and 2020 has enabled us to emphasize the changes that have occurred and the effect of the pandemic on enterprises using e-commerce.
2. Literature Review
2.1. E-Commerce and Digitalization Trends in the Actual Context
E-commerce has registered an upward trend in recent years, but, in the pandemic context, it has soared. E-commerce is a “spring” for business opportunities and market entrance, as well as a way for digital technologies to get into outlying and rural areas [
14] (p. 995) where businesses were seriously affected by the pandemic [
15] (p. 422). The necessity of an e-commerce implementation system comes from the fact that it will better automate commercial management, leading to a new business direction and bringing new sales opportunities and new customers, and thus more production and sales [
16] (p. 672). Kiba-Janiak [
17] observes the following current trends in e-commerce and sustainable development: preoccupation with sustainability, modification of consumers’ expectations on last mile delivery, transport companies’ meeting their expectations, and the adoption of sharing economy business models.
The survival of small and big companies from several economic fields depends on their use of e-commerce applications [
18] (p. 396). In a global context, e-commerce is a necessary, but not sufficient, condition for survival. The introduction of e-commerce applications is not simple and the barriers to its adoption can vary, from economic—fiscal, monetary—to those related to consumer psychology. The latter category is more important than it is generally believed, even though the tendency is to give priority to technical, institutional or financial barriers. Parasuram et al. [
19] (p. 748) found that a category of obstacles for micro, small and medium enterprises (MSMEs) in adopting e-commerce consists of behavioral barriers in the market, such as the businesses’ preference for face-to-face transactions. Diffusion of digitization across industries and through the supply chains of micro and small enterprises (MSEs) is uneven, so digital transformation for the sustainability of MSEs needs the support of external stakeholders such as government, supply chain partners, and communities [
20]. For SMEs in the EU, e-commerce is limited because certain goods or services are not suitable for these kind of transactions, because of problems regarding both logistics and payments, as well as security and legal frameworks [
21] (p. 44). Nasution [
22] underlines the importance of the following factors in adopting e-commerce: knowledge management processes, entrepreneurial orientation and dynamic capabilities, and an examination of the knowledge management process when regarded as the mediating variable of the relationship between an entrepreneurial orientation and the adoption of e-commerce. Unlike conservative companies, companies with a high entrepreneurial orientation usually recognize actual entrepreneurial processes and procedures and understand more accurately the key role of the resources contributed by suppliers and distribution channels that are likely to generate superior performance [
23] (p. 44).
In the context of the current crisis, there are also opportunities regarding professional growth, reinvention of services, new methods of working, professional improvement, business model modifications, e-commerce and time for internal evaluation and professional growth [
24] (p. 59). Klein [
11] underlines the necessity of knowledge management for a digital technologies’ capacity to be both explored and exploited, something which, when combined with an entity’s resilience, can facilitate a good cycle of learning, anticipation, and adaptation, a cycle founded on the elaboration and application of knowledge, to enable continuous innovation. It is also worth mentioning that some companies have already implemented various electronic tools that contributed to the digitalization of innovation processes [
25].
Zhang et al. [
26] (p. 12) state that, for survival in a competitive context, SMEs need to adapt to the digital environment and to customer needs. According to these authors, it is very important for cloud service providers to make continuous efforts in order to increase the quality of their services. Only then can businesses capitalize the benefits of cloud services, such as flexibility, scalability, reduced entry, and computing costs.
The Coronavirus pandemic closed country by country and changed the world in a few months. However, there will certainly be a substantial economic cost for companies. Technology is vital in helping people stay in touch during the necessary lockdown. Social networks and other online activities have increased at an unprecedented pace. Online retail platforms have grown globally by 6% from January to March 2020, as consumers used the internet for daily food shopping and for other items. [
27] (p. 109). While retail stores did not respond immediately to the changes caused by COVID-19, the prolonged focus of the pandemic is likely to further facilitate a spatial transformation that has been stimulated by the growth of online retail [
28] (p. 1).
A study by Chang and Meyerhoefer [
29] (p. 462) has made a notable contribution to the literature, being the first to reveal the impact of the COVID-19 pandemic on the use of online food platforms. The use of online platforms by food stores can lead to a positive public health externality, as there is a low probability that individuals, staying at home, will infect others in the community. Thus, responsible health factors have the opportunity to successfully promote online food shopping.
The latest trends in e-commerce, emphasized by the COVID-19 pandemic, show significant changes in online consumer behavior. Many specialists talk about the occurrence of a new paradigm in terms of consumption and about possible evolutions towards sustainable consumption [
30] (p. 12). The development of infrastructure and higher customer confidence contribute to the increase of sales turnover of the ‘web shops’ worldwide, with experts predicting that 18.1% of the total turnover by 2021 will emerge from an electronic channel, while for some products such as software, electronic sales have already exceeded traditional sales [
31] (p. 1141). For SMEs, e-commerce generates more turnover share than for some of the largest firms [
20]. In the context of the pandemic, companies have been focused more on social media and sales using e-commerce websites, while consumers have modified their habits due to the need to purchase essential items [
32] (p. 7).
However, enterprises face considerable challenges, the adaptation to the new context proving to be sometimes difficult. Roy, Patnaik and Satpathy [
33] proposed a series of measures to protect SMEs, such as cash flow and tax exemption, during the COVID-19 pandemic. In addition, some more recommendations can be mentioned to protect entrepreneurs, such as those taken by India: settlement of credit guarantees, granting subsidies to the SME sector, providing the legal framework for loans from several sources, extending periods of loan reimbursement, and control of multinationals’ competitiveness. [
33] (p. 9).
The factors of online shopping behavior are regarded as important elements for the successful implementation of an e-commerce strategy. Svobodová and Rajchlová’s research [
34] (p. 19) confirmed that “e-commerce companies in the online sales industry of electronic products consider the factors of online shopping behavior in the implementation of e-commerce strategy”.
In the opinion of Zhou et al., consumer behavior has an important impact on the development of an online shopping supply chain, the market being influenced by this behavior. It has been inferred that as commodity prices decrease, the profits of the online shopping supply chain system experience a tendency to increase first and then decrease [
35] (p. 1409).
The study by Leite Gustmann de Castro et al. [
24] (pp. 58–59) is aimed at identifying the impact and strategies of entrepreneurs from different market segments in the COVID-19 crisis scenario. The massive spread of the new Coronavirus severely affected both health and economy, resulting in overwhelming challenges in all economic sectors. In order to stand out on the competitive and highly innovative market, actions and strategies do not depend only on managers and leaders but are also influenced by the diversification of the field in which the organization operates. Therefore, the changes imposed by the COVID-19 pandemic indicate the need to implement new perspectives, based on changing consumption and innovation behavior in the business model focused on SMEs.
2.2. Enterprises’ Human Resources ICT Training
Based on the study of Volkova et al. [
36], it has been established that most developed countries have an average level of digitization of the business environment and a high level of digitization of socially oriented public services, in contrast to developing countries that are at the stage of creating the digital infrastructure and training qualified personnel.
Personnel training is a vital part of the management system that contributes to the development of organizational processes and to the achievement of a company’s main objectives. The evaluation of efficiency and training results should be grounded on a systematic training model, starting with the setting of objectives, development of training plans and supervision of their implementation; the company’s innovation is built by making use of innovative solutions in this process [
37] (p. 6). According to Boza et al. [
38] (p. 12), defining different training resources is not an easy task, as it is essential to also identify the most appropriate technology for the development of each training resource. As the COVID-19 pandemic affects the entire world, managers need to have adequate skills to motivate their team members; thus, it is essential to study virtual teams, training and development, skills management, change management, and other human resources practices [
39] (p. 1).
Foroughi’s research [
40] (p. 683) approaches the critical need for training the workforce, in order to enable employees to use new digital technologies for finding and evaluating current sources of training in the supply chain. In order to succeed in today’s digital transformation environment, employees need opportunities to develop their digital skills, which are required by corporations around the world.
Managers of SMEs face financial difficulties in staff organizing and training, even though they represent 99% of European affairs, provide 2/3 of private sector jobs and register more than 50% of the total value added created by EU businesses. The development and application of e-learning programs, usually requiring an initial investment, could be an obstacle regarding staff training for smaller enterprises, confronted with limited budgets [
41] (p. 3898).
Ignatiev et al. [
42] (p. 201) points out that the nature of the digital economy and network-centered management set new requirements for training systems, from the level of schools and small innovative enterprises to the global socio-cultural cycle. It is necessary to continuously update the educational content of disciplines, to resort to new forms and methods of training, together with the development of the information and education environments of institutions in the IT field [
43] (p. 5).
Underpinned by the CobiT methodology and the Computing Curricula 2005 models, Olifirov et al. [
44] (p. 217) developed a graphical training model for the digital economy, based on the study and selection of processes for governing IT enterprises in e-commerce. Azevedo and Almeida [
45] (p. 18) propose a training program constructed on a hybrid learning strategy and self-directed learning methodology; the program is based on state-of-the-art knowledge and pre-training benchmark assessments made to evaluate the training course efficiency and is backed by reference cases and real applications.
2.3. Companies’ Strategies of Adaptation in the COVID-19 Context. E-Commerce and Digitalization Opportunities
In the current context, companies need to adapt their strategies according to the new realities, taking into account the advantages of e-commerce and digitalization. In general, market performance requires the entrepreneur to give up less productive resources in favor of others with higher returns. In times of the current COVID-19 pandemic, entrepreneurs give up less productive workers and invest in staff training, which leads to reduced unit labor costs and increased production and productivity [
46] (p. 673). Worker training is one of the sources of long-term constant growth for both a company and an economy as a whole.
The study by Katz et al. [
47] provides a rigorous analysis arguing that a good telecommunications infrastructure and a high level of digitalization are vital to maintaining a functional economy in pandemic conditions; consequently, public and private sectors need to collaborate and cooperate to promote the improvement of digital ecosystem.
Regardless of the strategy, enterprises must not forget to put the customer at the center of their concerns. Based on evidence, Nanda [
48] considers that the key functions of multi-channel retail business are the repositioning of the physical shop and the adoption of digital platforms, both seen as a strong need. The Pandemic has been considered by managers an opportunity to increase efficiency and, what is more, firms have to create e-commerce platforms as part of their strategy and act together with offline methods for suppliers due to the fact that consumers choose online sources out of precaution and tend to adopt sustainable consumption behaviors [
49] (p. 7). In the context of online consumers’ reactions—faced with and adapting to this kind of hard and unusual life event—Guthrie et al. [
50] found that “the usefulness of the react-cope-adapt framework of constrained consumer behavior in an online environment” gained validation. According to Panasenko [
51] (p. 475), e-commerce enterprises should focus on the consumer, collecting existing information, studying the frequency, place, time, and preferred channel of purchases, and elaborate customized offers.
Besides the strategies and measures taken by companies in order to adapt to the new economic reality and adopt technologies, administrations can also take measures in order to stimulate and help enterprises in this process, especially those that face difficulties. Bai [
20] suggests that policymakers can contribute to the creation of a multi-agency platform for helping MSEs use digital technologies, while also paying attention to environmental and social performance, and providing training and support in using e-commerce and social commerce, digital payments, and alternate financing methods. Governments should implement large-scale Industry 4.0 policies to heighten the digitalization competencies of SMEs, and, at the same time, they should make sure that SMEs are familiar with these policies and that the required delivery channels for services and incentives are in place [
52]. A survey conducted by UNCTAD in 23 countries from Africa and Asia-Pacific showed that the most important measures for COVID-19 economic recovery are “the development or update of the national e-commerce strategy (54%), reduction of costs for internet access (47%), as well as for mobile and other electronic payments (43%)” [
32] (p. 32).
The pandemic accelerated the digitalization process and with the help of administrations and lessons learned from this crisis, enterprises will become even more efficient, thus contributing to economic growth. While companies try to continue their activities in the COVID-19 context, they are becoming aware of the function of the sustainable supply chain, of dynamic feedback strategies, of the value of technology implementation and a culture of collaboration, of a diversified supply base and synchronized strategic processes, all of which are crucial for success in times of atypical crises [
3] (p. 449). In the context of the pandemic and the increase of the e-commerce sector, Wang [
53] finds that, in order to keep a balanced inventory turn and operating expenses, the strategies of online merchants should include measures for reverse logistics supply chain management, thus influencing customer relationships and leading to sustainability and long-time profitability of business activities. Hoang [
54] recommends SME managers focus primarily on a favorable strategy toward the deployment of e-commerce by undertaking the following: investing in e-commerce, thoroughly training and familiarizing staff or clients with the relevant technologies and finalizing the whole process. There are no large budgets dedicated to the digitalization approach, and good results can be obtained using the right experts, developing self-service kits and offering them to communities [
55] (p. 585). E-commerce companies should promote an entrepreneurial orientation based on three dimensions: innovativeness, proactivity, and risk taking [
23] (p. 45). In time, empirical evidence shows net benefits to society and environment produced by technological advances and innovation [
56].
3. Research Methodology
The analysis has been conducted on 31 European states in relation to availability and comparability of data, thus we have eliminated three countries: Iceland, Montenegro and North Macedonia. The study includes four significant variables: Value of e-commerce sales (VES), Cloud computing services (CCS), Enterprises that provided training to develop/upgrade ICT skills of their personnel (EPTS), and E-commerce, customer relation management and secure transactions (ECRM) (
Table 1). The source of the data used in this research is the Eurostat database.
The analysis of enterprise behavior regarding e-commerce activity at the level of the 31 states has been conducted by means of a hierarchical clustering method in several stages:
- -
The application of the Wards method to determine the matrix of the proximities at Euclidean distance and the transformation of the score z in order to generate clusters;
- -
Testing of the significance of a variable belonging to clusters by using the Levene test beforehand, with statistical hypotheses used to test the homoscedasticity of data series dispersions; if the homoscedasticity hypothesis is accepted, the testing of statistical significance for the average values at the level of each cluster through the analyzed variables will be conducted using ANOVA methodology and the F test. Otherwise, the Welch test (Robust Test of Equality of Means) will be applied.
The first step in applying the Wards method is to form a matrix of proximity at Euclidean distance. The application of this method starts with a matrix of the type:
In the matrix, n is the volume of the sample formed by the European states under analysis, and m represents the number of variables taken into account for the determination of the clusters.
Then, at this stage, the transformation of the
Z score follows in order to generate the clusters. The elements of the
Y matrix require the application of the following transformations:
The relations used together with the Euclidian distance [
57] allow for the attainment of a proximity matrix:
Then, the Ward’s method is applied to calculate the distance between the clusters. Taking two clusters
A and
B and an item
xi (a cluster or an individual element, not yet included in a cluster) to include in a cluster, the distance is defined according to Marinoiu [
58]:
In (4), mi is the centroid, and ni is the number of elements from cluster i.
The validation of a cluster’s structure presupposes the establishment of the best solutions through determination of the values total sum of squared error (TSSE) for each possible solution containing
n > 2 clusters. As
n increases, TSSE decreases as the number of cluster elements decreases, so that, as Peeples and Matthew put it, “an appropriate cluster solution could be defined as the solution at which the reduction in SSE slows dramatically” [
59].
The second stage requires testing the significance of a variable’s belonging to clusters. Thus, the use of a hierarchical clustering method continues with the testing of the homoscedasticity of the data series dispersions by applying the Levene test. The statistical hypotheses are:
Hypothesis 1 (H1). Dispersions do not differ significantly (they are homoscedastic).
Hypothesis 2 (H2). Dispersions differ significantly (they are heteroskedastic).
The acceptance of the H1 hypothesis, of homoscedasticity, allows further testing of the statistical meanings for the average values, at the level of each cluster, by applying the ANOVA methodology (test F).
Taking into account the number of variables in the analysis for cluster generation () and the sample volume (ni) formed by the data series corresponding to variable i, the hypotheses tested are:
Hypothesis 3 (H3). The cluster membership of the analyzed variable is not statistically significant because there is no significant difference between the means of the analyzed variables.
Hypothesis 4 (H4). The cluster membership of the analyzed variable is statistically significant because there is a significant difference between the averages of the analyzed variables.
In the context of accepting the hypothesis H4, of heteroskedasticity, testing the statistical meanings for the average values, at the level of each cluster, requires the application of the Welch test (robust test of equality of means). The statistical hypotheses used are similar to Hypotheses H1 and H2, but different in the way the statistics are determined. The statistical values of the Welch test are significant in the conditions in which Sig < 0.05 showing that the averages of the variables at the level of each cluster differ significantly.
A significance threshold α = 0.05 (confidence level 95%) was used to test the statistical hypotheses. Data series processing was performed with SPSS and Excel software with Real Statistic Resource Pack [
60].
The comparison of the results obtained in 2020 with those of 2018 was made primarily at the level of clusters through changes in their composition, through a comparative analysis of dendrograms obtained as a result of the application of Euclidian distance and Ward’s method, respectively. At the same time, the difference in results was highlighted by the average values of the variables determined by countries. The average value of each variable was the basic descriptive indicator in the ranking and comparison interpretations used in the analysis.
4. Results
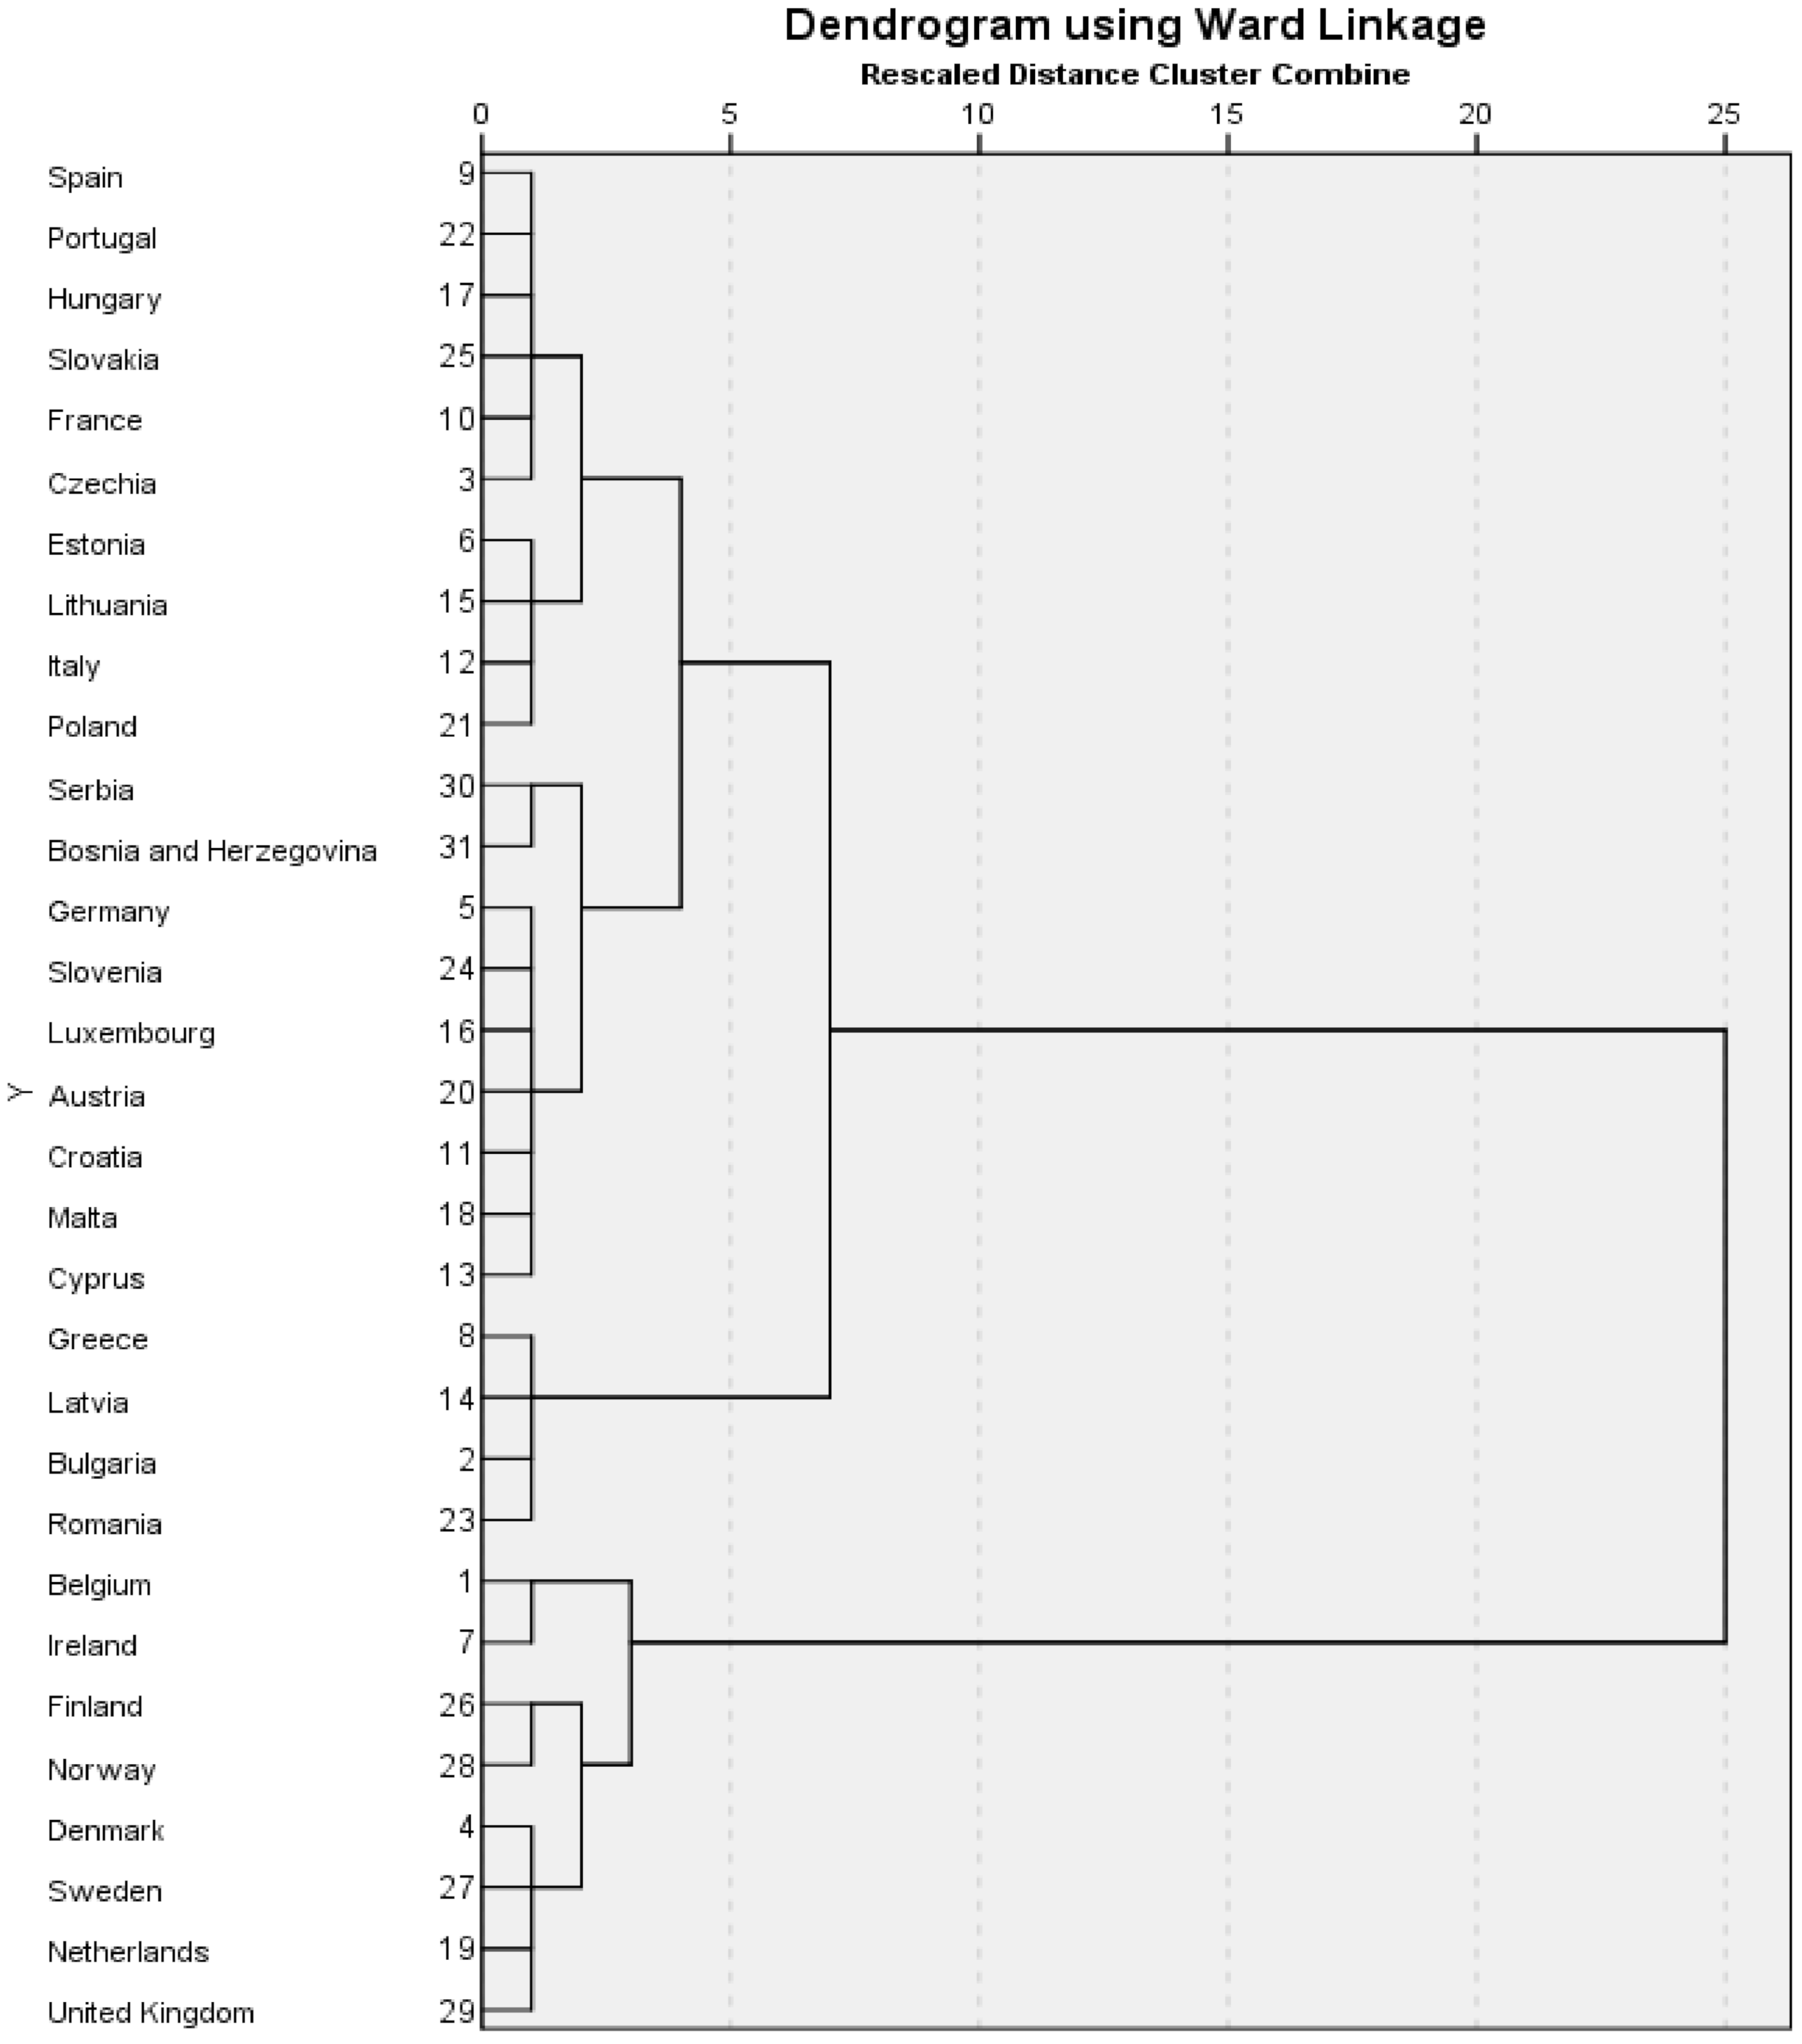
The results of the COVID-19 pandemic in 31 European countries (including the 27 EU member states), as regards the activity of companies with e-commerce sales, were highlighted as a result of their grouping, through four significant indicators: Value of e-commerce sales, Cloud computing services, Enterprises that provided training to develop/upgrade ICT skills of their personnel, and E-commerce, customer relationship management (CRM) and secure transactions. The study began with a comparative analysis of the dendrograms in 2018 and 2020, obtained by Euclidian distance and Ward’s method, respectively, which allowed the realization of a grouping of countries in 7 clusters.
Taking into account the evolution of the total sum of squared error values depending on the number of clusters, presented in
Figure 1, an optimal solution with seven clusters at the level of 2018 has been obtained.
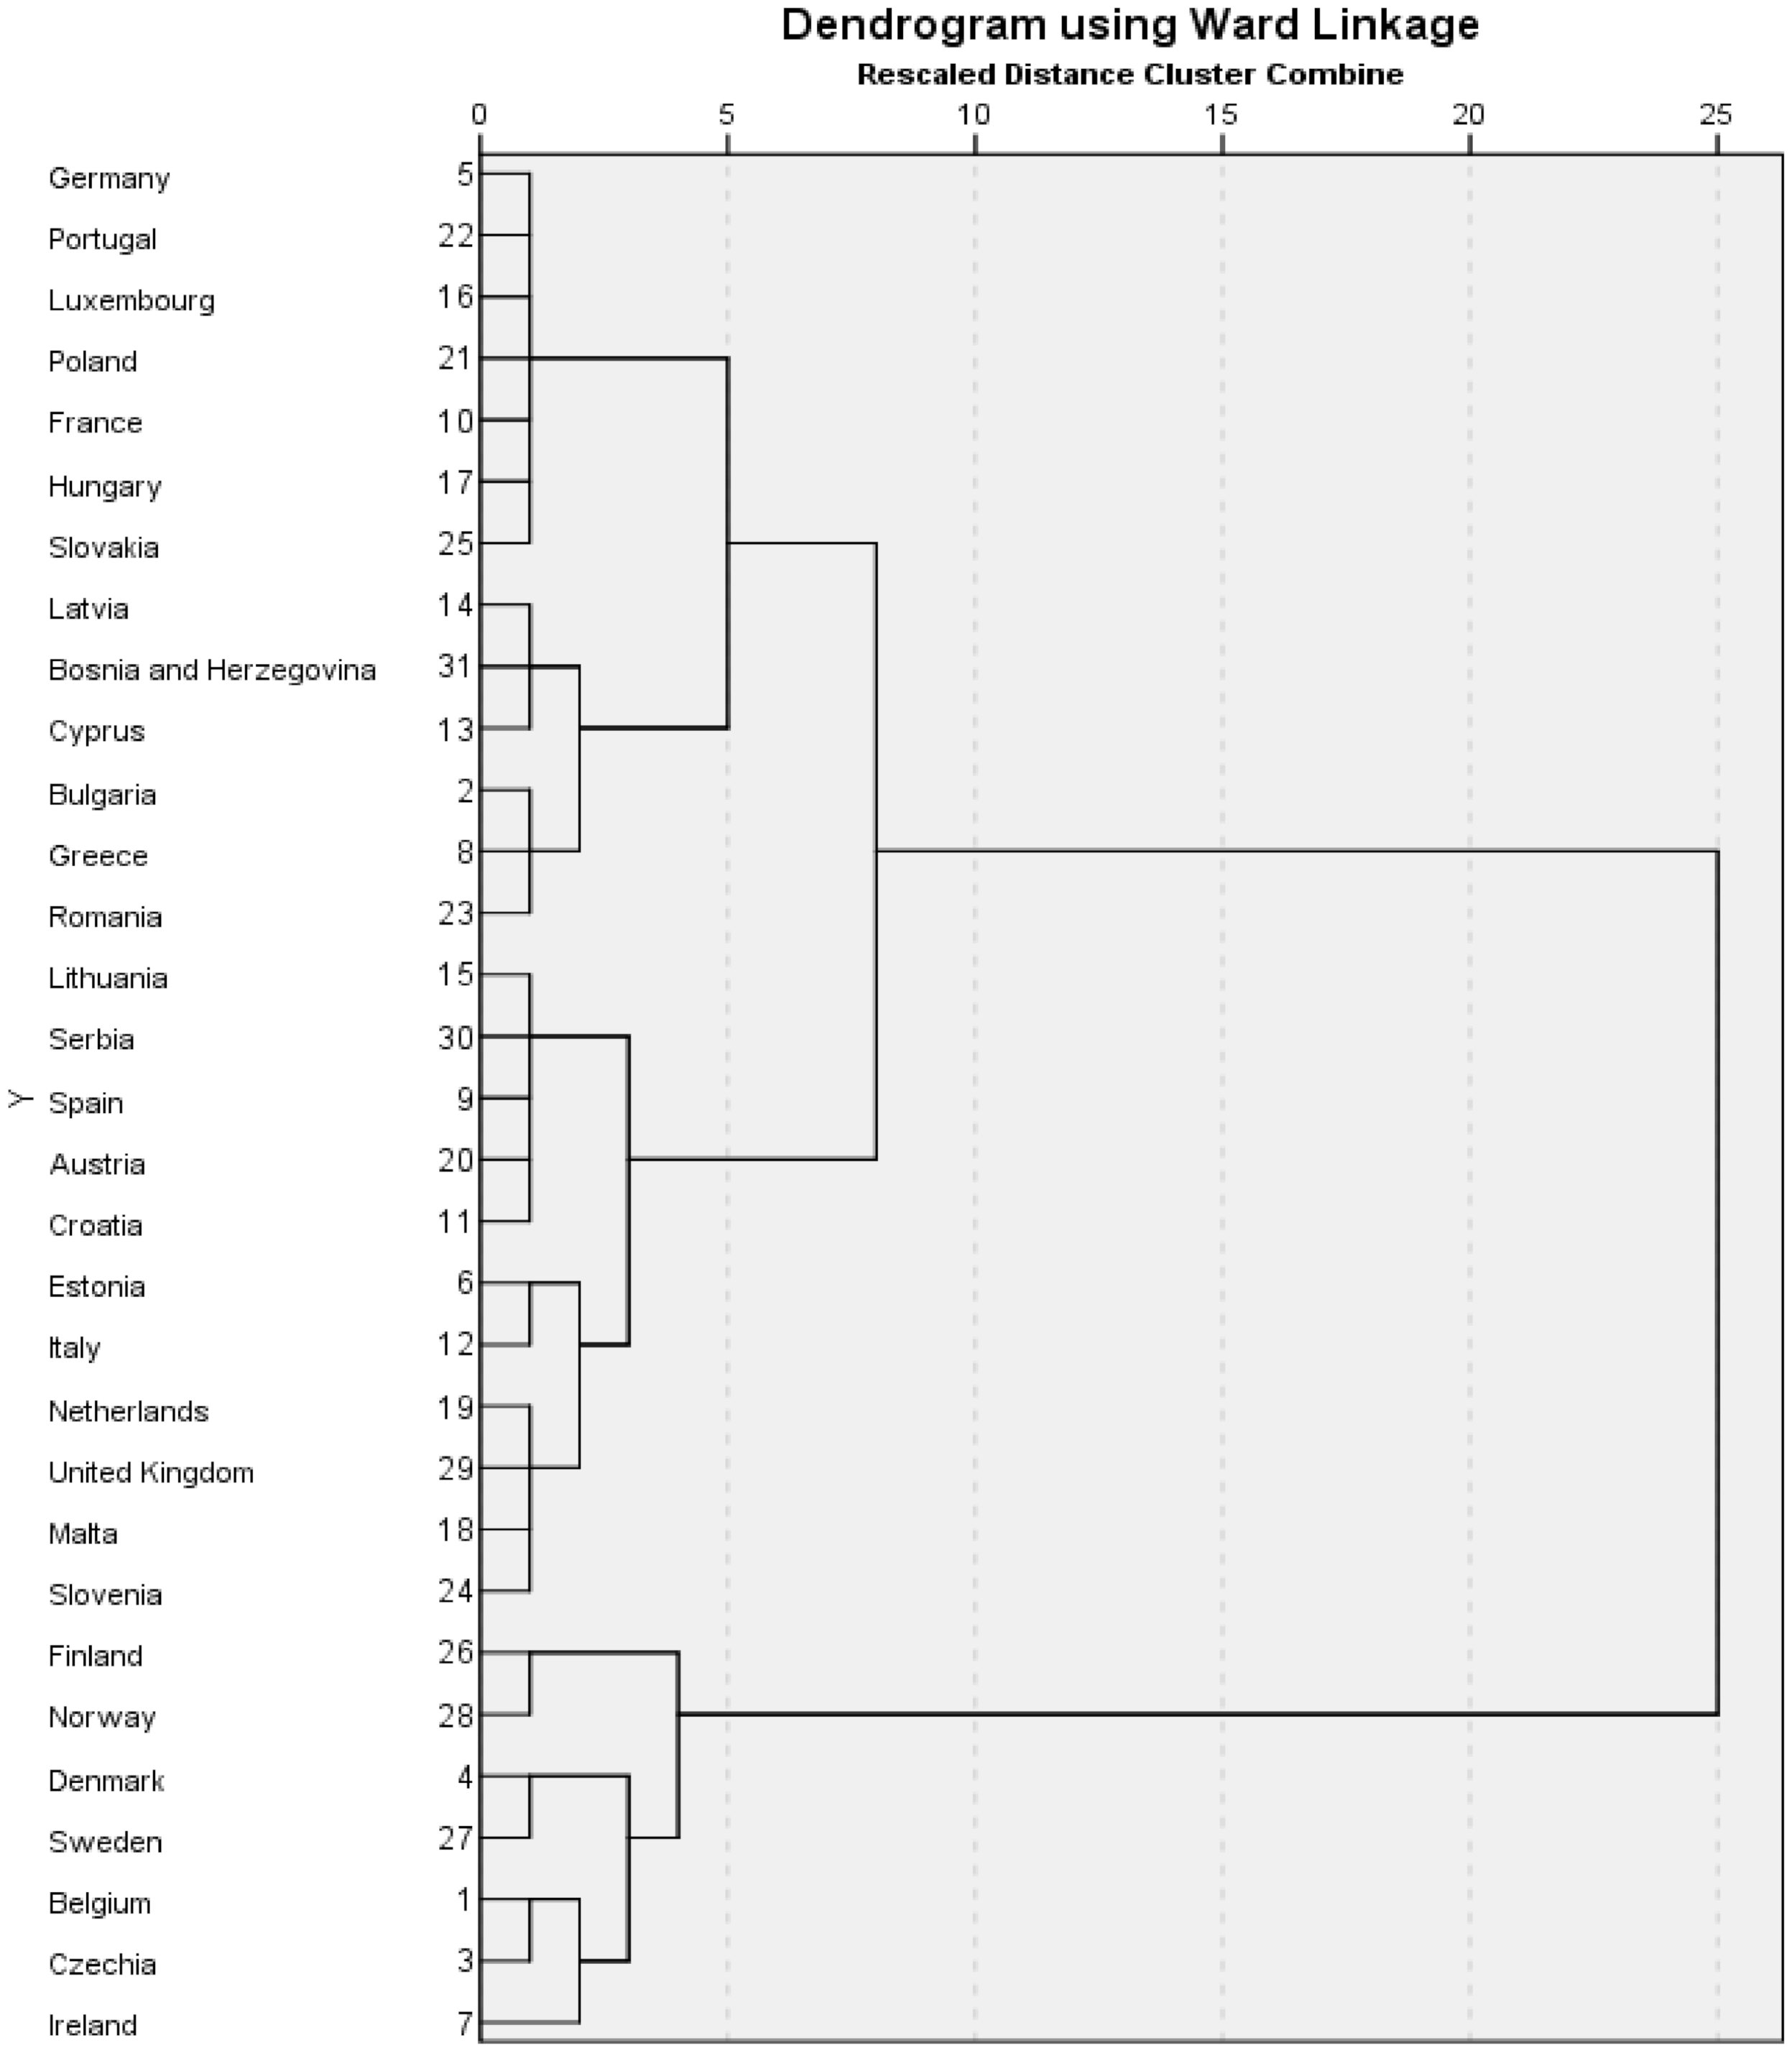
The same optimal solution of seven clusters was determined for 2020 (
Figure 2), but with a different distribution of countries.
A much clearer rendition of the 31 European countries’ distribution to the seven clusters is presented as the structure of the clusters determined by VES, CCS, EPTS and ECRM in 2018 and 2020 in
Table 2.
The results of the clustering show that only cluster 7 has the same countries (Finland, Norway) in both 2018 and 2020. Additionally, in cluster 1 and cluster 2 most states found in 2018 are also found in 2020. Thus, C_1 in 2020 consists of two countries (Belgium, Ireland) from 2018 to which Czechia is added. C_2 shares the same feature with the four countries from 2018 (Bulgaria, Greece, Latvia, Romania) found in its structure together with two other states in 2020—Cyprus, and Bosnia and Herzegovina. At the same time, in C_5 there are only two countries (Malta, Slovenia) that are found in both years in which the analysis has been performed. The rest of the clusters included in 2020 different countries compared with 2018, which means that they face different situations in terms of the manifestation of the variables analyzed as a result of the COVID-19 pandemic. This can be accounted for by different behavioral modeling recorded from one country to another.
A better emphasis of the grouping of the 31 European states, taking into account the four indicators, requires both a graphical representation and a test of their belonging to the respective clusters.
The first step in testing the statistical validity of the chosen solution is the application of the hypothesis test (H1) regarding the absence of significant differences among the data series dispersions in the case of the seven clusters. Testing that hypothesis required the use of the Levene’s Test. The results of the homogeneity test of variance are presented in
Table 3.
In 2018, all Levene statistic values are lower than the critical value F0.05,6,24 = 2.699. This aspect is confirmed by the Sig. values higher than a significance level of 0.05 (95% confidence level). In this context, the null hypothesis (H1) is accepted, which states that there are no significant differences among the values of the dispersions of the data series corresponding to the clusters. Following the acceptance of the H1 hypothesis, of homoscedasticity, the statistical meanings for the average values are further tested, at the level of each cluster, by applying the ANOVA methodology (test F) for 2018.
At the level of 2020, as a result of the application of the Levene test, not all results are significant. For the CCS variable, the Levene statistic value (2.762) is higher than the critical value of 2.699, with SigCCS = 0.035 lower than the significance level of 0.05, which indicates that not all dispersions within the groups are homogeneous. In this context, the Welch test is further applied.
The application of the ANOVA methodology (test F) for 2018 allows for the obtaining of results to test the hypothesis regarding the affiliation of the variables presented in
Table 4.
Analyzing each variable separately, the results show that each value of the Fischer statistics (
Table 5) is significantly higher than the critical value F
0.05,6,24 = 2.699. In this context, the null hypothesis (H3) is rejected and the alternative hypothesis (H4) is accepted for all four variables. Therefore, the analyzed variables are statistically significant in terms of cluster membership.
The results of applying the Welch robustness test for the 2020 data of the variables are presented in
Table 5.
Studying the results from
Table 5, it can be specified that the averages of the variables at the level of each cluster differ significantly (Sig < 0.05), so membership of each variable to the determined clusters is highlighted.
A detailed analysis of these allegiances is underlined more clearly through the average values of the variables determined for the analyzed states for both 2018 and 2020.
The average values of the analyzed variables (VES, CCS, EPTS, ECRM) and their 95% confidence interval for mean, which are presented both in
Table 6 (2018) and in
Table 7 (2020), represent the landmarks in the interpretation of ranking and comparison included in the analysis.
At the level of all states, the percentage average of the indicator VES has recorded a growth in 2020 in comparison to 2018, from 16.45% to 17.87%. The process of growth that this variable confronts us with is noticed for the majority of clusters. An exception is observed for the 7th cluster, with Finland and Norway recording an average reduction of the percentage from 23% in 2018 to 21% in 2020, and in the cluster C_4. For the fourth cluster the situation is rather uncommon (from 20.25% to 19.57%), as its structure is totally different from the one in 2018.
In 2020, in contrast to 2018, the average percentage of the enterprises that used cloud computing services (CCS) recorded the most significant growth in comparison to the average values of the other variables (VES, EPTS, ECRM), of 8.9 percentage points (from 20.26% to 29.16%). This manifestation is noticed at the level of clusters too, which is confirmed by the way in which average percentages are higher in 2020 than in 2018 for six of the seven clusters. The only cluster with a reduction of the average percentage value is the same fourth cluster.
The ECRM indicator has a similar evolution with the other two variables in the sense of a general growth underlined by an average percentage that has risen from 20.68% in 2018 to 22.95% in 2020. At the level of clusters, the growths were noticed at four clusters (C_2, C_3, C_5, C_6), with the others indicating decreases.
The only indicator that recorded a different evolution from the others is EPTS. The average percentage of the enterprises that offered training for the development/actualization of TIC skills of their personnel (EPTS) does not represent a very favorable situation as in the case of the other variables. Thus, in general, the reduction from 2020 in comparison with 2018 is of 1.03 percentage points (from 22.26% to 21.23%). Concerning the evolution of the variables on clusters, the results of
Table 6 and
Table 7 underline that only three of the seven clusters (C_2, C_3, C_6) have recorded a growth through higher average values in 2020 than in 2018.
A behavioral analysis of the states on clusters was conducted, taking into consideration the average percentages determined for each indicator at the level of the year 2018.
The cluster C_1 comprises two countries in 2018. Thus, Ireland is the country in this cluster with the highest weights for Value of e-commerce sales (VES) and E-commerce, customer relation management and secure transactions (ECRM) with 35% and Cloud computing services (CCS) with 33%. For the variable Enterprises that provided training to develop/upgrade ICT skills of their personnel (EPTS), Belgium is the country that shows the most significant value—36%. For 2020, Czechia is added in this cluster with the lowest values for the majority of variables: VEC with 30%, CCS with 20% and EPTS with 25%. The hierarchy of the other two countries is similar in 2020 to that of 2018, with an exception for the indicator CCS, where Belgium occupies first place with 43% and Ireland second with 41%.
Bulgaria, Greece, Latvia and Romania represent the component countries of cluster C_2 in 2018. The highest average weights are signaled for Romania at VES (9%), for Latvia at CCS (11%) and ECRM (13%), with Greece at EPTS achieving 14%. Bulgaria is the only country that does not record maximal average percentage values for any variable, but only minimum weights for CCS (6%) and ECRM (8%). In 2020, another two countries are added to this cluster: Cyprus and Bosnia and Herzegovina. Romania remains in first place for the indicator VES with 3 percentage units over the value of 2018. At the same time, Romania occupies first place for the indicator ECRM near Bosnia and Herzegovina with 19%. Cyprus is in the top of the ranking for both CCS, with 22%, and EPTC, with 25%.
Cluster C_7 includes the same countries (Finland, Norway) in both 2018 and 2020. Finland is at the top of the ranking in 2018 for only CCS with 50%, while in 2020 it is dominant for all the variables: VES with 23%, CCS with 62%, EPTS with 38% and ECRM with 22%. Norway dominates in 2018 regarding VES with 25%, EPTS with 42% and ECRM with 29%, while in 2020 it occupies the last place for all variables.
The different behavioral modeling from one country to another regarding the four variables is noticed at the level of the clusters as well, through the modifications recorded in 2020 to their components, differentiating them from 2018, especially for the clusters C_3, C_4 and C_5.
In 2018, in the cluster C_3 there are included six countries (Czechia, Spain, France, Hungary, Portugal, Slovakia). Czechia is the state that holds supremacy for all the variables: VES with 29%, CCS with 16%, as do Spain and Portugal for EPTS and ECRM with 25% each. If Spain with 17% is the last country of this cluster with the lowest share for VES, Hungary is in last place for the other three variables (CCS with 11%, EPTS with 17% and ECRM with 15%). Two countries are included in the C_3 cluster in 2020. Thus, VES with 29% and ECRM with 38% are the variables that place Denmark on the first place, while Sweden has the highest percentage values for CCS with 59% and EPTS with 32%.
Cluster C_4 has four components: Denmark, Netherlands, United Kingdom and Sweden. In this cluster, in 2018 Sweden is the country with the most significant shares for VES (24%) and CCS (43%), and Denmark for EPTS with 28% and ECRM with 32%. The Netherlands registers shares of 15% in VES, United Kingdom 30% in CCS and 22% in ECRM, while Sweden with 24% in EPTS occupies last place in the rankings among the countries of that cluster on each variable. For 2020, the composition of the cluster is totally different from that of 2018. The most significant results of the variables are recorded for VES with 23% for France and Hungary, and the same percentage in CCS for Luxembourg, with 24% for Germany and 21% for Portugal. With only 15%, Luxembourg and France have the lowest percentages for VES and EPTS, while Hungary scored 17% for CCS and Luxembourg 13% for the ECRM variable. This cluster also includes Poland and Slovakia, which have an intermediate position for each variable analyzed.
For 2018, the C_5 cluster includes most countries. Slovenia is the only country that has weights of variables that exceed the average level for each variable. Regarding the VES variable, Slovenia is at the top of the cluster of countries with 17%, while Cyprus registers only 4%. For the rest of the countries, the shares of the variables range between 7% (Bosnia and Herzegovina) and 22% (Malta and Croatia) in the CCS, between 16% (Bosnia and Herzegovina) and 30% (Germany), and between 14% in Cyprus and 27% in Serbia. Luxembourg and Austria have weights of variables that do not constitute extreme values for any variable.
At the level of 2020, the C_5 cluster includes only Malta among the countries of 2018. Within this cluster, the weights recorded in VES range between 13% in Italy and 21% in the United Kingdom, in CCS between 26% and 48% in Slovenia and Estonia, at EPTS between 15% (Italy) and 28% (Malta), and between 16% (Italy) and 29% (United Kingdom), respectively. Netherlands represents the country for which the recorded weights place it within the ranking.
Cluster C_6 shows percentage changes of the variables so that in 2018 Estonia with 15% (similar to Poland) and 26% ranks first in VES, similar to Italy with 17% in EPTS and Lithuania with 22% in ECRM. The minimum percentages are reported for Italy at VES (11%) and ECRM with 14%. These percentages for that variable are also to be found in Poland, which occupies the last place for CCS as well, with only 7%. Lithuania also registered a minimum percentage in 2018 at EPTS with only 9%. In 2020, in the C_5 cluster, Croatia ranks first with 29% in CCS, 23% in EPTS and 31% in ECRM, while Spain with 19% is dominant in VES. The minimum percentages were found primarily in Serbia through 9% for VES, 15% for CCs and 26% for ECRM. The EPTS variable will register a minimum percentage of 14% in Lithuania, the only country that is part of C_6 in both 2018 and 2020. Austria is the only country that does not record extreme values of the ranking.
The conclusion is that all the changes registered are the result of the intensification of digital transformations due to the COVID-19 pandemic, resulting in behavioral modeling that manifests differently from one country to another and from one cluster to another.
5. Discussions
Given that there are limitations in terms of complete and detailed analysis of e-commerce activity, mainly due to difficulties in data collection and the selection of variables that best reflect e-commerce, this paper addressed the problem of business behavior in the context of the COVID-19 pandemic, a pandemic which has had significant impact in this field of activity. This aspect was analyzed by studying the evolution of the variables included in the study in order to highlight behavioral changes in 31 European countries against the background of the COVID-19 pandemic, comparing the values of 2020 with those of 2018. A limitation of our study may be the fact that our analysis focused only on the European continent, while future studies could include countries from other parts of the world.
The value of e-commerce sales (VES) is expressed by the total turnover of companies with e-commerce sales. At the level of all countries, the highest percentage of turnover is between 32% and 35% in Belgium and Ireland in 2018 (C_1), but also in 2020 (30–44%) in Belgium, Ireland and Czechia (C_1). In 2018, these countries also have supremacy in E-commerce, customer relationship management and secure transactions, with the percentage of enterprises with e-commerce being between 30% and 35%. In 2020, the highest percentage of enterprises with e-commerce is registered by the countries of cluster C_3: Denmark, Sweden.
Finland and Norway are the countries of the C_7 cluster which, compared with other states, have the highest percentage of enterprises purchasing at least one of the following cloud computing services: hosting of the enterprise’s database, accounting software applications, CRM software and computing power, with percentages between 43 % and 50% in 2018, and between 58% and 62% in 2020. Additionally, the top countries there are those which also rank highest for the value Enterprises that provided training to develop/upgrade ICT skills of their personnel (EPTS). The percentage of enterprises that provided training to develop/upgrade ICT skills of their personnel in total enterprises was between 36–42% in 2018 and 33–38% in 2020.
Bulgaria, Greece, Latvia and Romania, together with two other states (Cyprus, Bosnia and Herzegovina) have the lowest weights for all variables analyzed in both 2018 and 2020. This aspect highlights the lowest level of variables compared with the other countries included in the analysis.
A major challenge for the development of e-commerce enterprises has mainly been represented by one particular global problem facing humanity—the COVID-19 pandemic. This pandemic has represented a great challenge for many fields of activity, requiring to a large extent the use of alternative solutions for human connection for survival, among which e-commerce has had an important place.
6. Conclusions
The COVID-19 crisis has had a huge impact and has led to a transformation of the economy. One of the most obvious responses has been a forced digitalization, which became strategic for a lot of enterprises, some of whom have adopted digitalization in order to survive.
The behavior of enterprises with e-commerce sales under conditions of the COVID-19 pandemic was analyzed in 31 European countries. The study was conducted at the level of four variables considered significant for the activities of companies with e-commerce sales by applying a hierarchical clustering method which allowed the construction of seven clusters. These clusters were configured for 2018 and 2020 in order to highlight behavioral changes at the state level against the background of the COVID-19 pandemic.
Changes in countries’ behavioral patterns can be attributed to the acceptance of advanced information technology. Promoting a positive attitude in this direction is a key factor in the success of the enterprise systems that use them.
At the same time, the behavioral models were based on the particularity of the bi-univocal relationship between electronic commerce and economy that manifests itself at the level of each country. The cultural peculiarities and those regarding the socio-economic factors in each state are essential in the process of reducing the gap between the use of the internet and the diffusion of e-commerce, thus putting an imprint on the manifested behavioral models.
The global crisis triggered by the COVID-19 pandemic puts enormous pressure on businesses. In order to survive, companies change their behavior by adopting various digital technologies. Additionally, business models have had to be modified, so the role of e-commerce, online platforms and applications increased, leading to smaller fixed costs. The development of technology has a high potential and brings various opportunities. However, diffusion of technology is uneven due to logistic, payment or habit reasons; it is because of this uneven diffusion that the support of government and administrations is needed to create and implement policies for digitalization. At the same time, in the situation in which online sales are increasing, enterprises should adopt an entrepreneurial orientation with knowledge management. E-commerce must clearly be part of this strategy, together with a focus on consumers, and it is to be expected that, after this crisis, these enterprises will become more efficient.
SMEs have had to adapt to the digital environment. It is necessary to encourage companies to use cloud computing services, which, in fact, will also bring benefits to companies. Online sales have increased for all products, including food. There are also changes in online consumer behavior, a fact that influences companies’ strategies and supply chain development. In the new context, SMEs need to consider changing consumption patterns and innovating their business model. HR training in the field of digital skills is very important in the current period. Here, several aspects need to be considered: finding the right technology, motivating employees, and developing educational content. However, there are also difficulties for SMEs in terms of staff training, the biggest issue being financial.
The role and importance of SMEs also derives from the fact that they represent around 99% of EU businesses, provide 2/3 of private sector jobs and contribute over 50% of the total value added created. SMEs are a key source of entrepreneurship and innovation, vital aspects of the competitiveness of EU businesses.
The impact of the COVID-19 pandemic has led to the development of measures such as:
- -
The adoption of various action programs to increase the competitiveness of SMEs through research and innovation, as well as to improve access to finance;
- -
The goals of carbon emission neutrality and digital transition which have been taken into account in the strategies adopted for ensuring better conditions for SMEs;
- -
The stimulation of new reflections on economic recovery, reconstruction and strengthening the resilience of SMEs.
The obtained results can be a starting point for future adaptation strategies of companies, in the context of both COVID-19 and the new economic realities that place increasing emphasis on digitalization.
Within the frame of future research, some analyses could be conducted using data from countries from all over the world. Additionally, more indicators could be used in the statistical processing to reveal other aspects of the enterprises and customers behavior in a pandemic context.


 ,
, 


