1. Introduction
Video sites usually make money by charging advertisers a fee; this includes short video platforms (e.g., Instagram, TikTok, and Kuaishou), or SVPs hereafter, a new type of video platform [
1]. Short videos have more condensed and fragmented content than general videos, ranging from a few seconds to a few minutes, making them suitable for watching in leisure time [
2]. By integrating video recording, editing, sharing, and other functions, SVPs provide users with the opportunity to create videos quickly. Users can even use beauty cameras, filters, editing features (e.g., transitions, split screens, slow motion), background music, and subtitles to improve video quality.
The use of short videos has recently risen worldwide. As of June 2021, the number of short video app users in China was 888 million, accounting for 88% of Internet users [
3]. In the United States, TikTok users watch about 68 min of short videos per day [
4]. Since short videos are characterized by their clear presentation, high frequency, and short length, they not only have a wide audience but are also favored by many advertisers, for which the quality of the video advertisement is especially important for attracting viewers’ attention [
5]. On the one hand, the convenient methods offered by SVPs provide advertisers with more opportunities to produce high-quality video advertisements; on the other hand, the short duration and high frequency of short videos make advertisers pay more attention to advertisement quality: they need to ensure their products stand out from the competition.
Before the emergence of SVPs, advertisers could only use general video platforms (GVPs) such as YouTube and online TV shows to place online advertisements; however, while short video advertisements have a similar format to general video advertisements, these platforms have key differences in terms of their profitability and audience experience, which demands new investment and pricing strategies for advertisers to operate on SVPs. Hence, the following questions are worth exploring:
How should advertisers control the quality of their advertisements on SVPs?
How should advertisers adjust their product prices on SVPs?
Why do advertisers choose to advertise on SVPs instead of other platforms?
Compared with GVPs, SVPs have two main advantages. The first is that users can skip advertisements for free on SVPs. GVPs typically adopt the advertising model or hybrid model. Under the former, viewers are forced to watch advertisements (e.g., TV shows), whereas under the latter, viewers can choose to pay for membership and receive ad-free services (e.g., YouTube) [
6]; however, SVP users can skip all advertisements cost-free. When users watch videos, they only continue to use a platform if their net utility is greater than the advertising nuisance cost. Clearly, the advertising nuisance cost for SVP users is much less than that on other video platforms, which allows SVPs to obtain a larger user base.
The second advantage is that the advertising time on SVPs is freer and more flexible than that on GVPs. GVPs only provide limited advertising time (e.g., online TV channels need to strictly schedule their program and advertising times), while other video platforms such as iQIYI in China only show advertisements in the first 30–60 s of a video program. By contrast, SVPs can flexibly control the frequency of pushing advertisements (e.g., every 10 min), which is more conducive for advertisers to optimize their revenue.
Accordingly, this study focuses on advertisers’ control of video advertisement quality. Based on the different attributes of users and products, we analyze the operating behavior of advertisers and determine how advertisers can maximize their revenue from advertising on video platforms. Furthermore, we consider the impact of product pricing factors on the optimal advertising quality strategy. In addition, we compare the differences between SVPs and GVPs, determining the circumstances under which it is profitable for advertisers to choose SVPs and providing a theoretical basis for advertisers’ choice of platform. Finally, we examine the budget allocation of small companies on SVPs.
Our main novelty is that we provide operational strategies for suppliers (e.g., sellers and advertisers) based on a two-sided platform environment. By contrast, most of the literature focuses on platforms, and few scholars have analyzed advertisers, a gap in the research that this study bridges; moreover, on the supply side, scholars generally consider advertiser utility to be independent of the fixed costs of content generation. Unlike other studies, we consider advertisers’ online advertisement placements and argue that advertisers’ profitability should increase as the costs of content production rise. The contributions of this study are as follows. First, we present an advertising profitability model for general advertisers to optimize their investment strategies and analyze how advertisers on video platforms should adjust the optimal strategy under change; we also analyze the advertisement design guidelines and advertisers’ expectations of video platforms, which are especially important for SVPs that have the flexibility to adjust advertisement placement. Second, we determine the circumstances under which it is profitable for advertisers to choose SVPs. Finally, we construct a bidding profit model for small advertisers on SVPs and show the cost allocation strategy that maximizes their profits.
The remainder of this paper is structured as follows: The next section,
Section 2, presents the literature review;
Section 3 introduces the model;
Section 4 discusses the product pricing and platform selection strategies of advertisers; we also distinguish SVPs from GVPs and assess when advertisers should use SVPs rather than other video platforms;
Section 5 analyzes the bidding problem of small advertisers on SVPs and provides an advertisement design and delivery strategy for them, while
Section 6 is the discussion.
3. Advertisement Quality Strategy
In this section, we construct a profit model for a general advertiser to advertise on a video platform. Video platforms provide video content services to meet users’ need for entertainment as well as advertising space to meet advertisers’ need for profits.
Table 1 defines some notations.
While watching videos, consumers can obtain perceived utility by satisfying their need for entertainment and curiosity. For example, people watch TV shopping channels to buy or learn about products; the net utility of advertisements to such users is positive. Nonetheless, the inclusion of advertisements may annoy some consumers, thereby reducing their utility. For example, users may become bored with video advertisements owing to disinterest. Hence, the relationship between video and advertisement durations is a key factor affecting consumers’ perceived utility. Some scholars solve media platform-related problems through utility models, and get some results (Reisinger [
25], Amaldoss et al. [
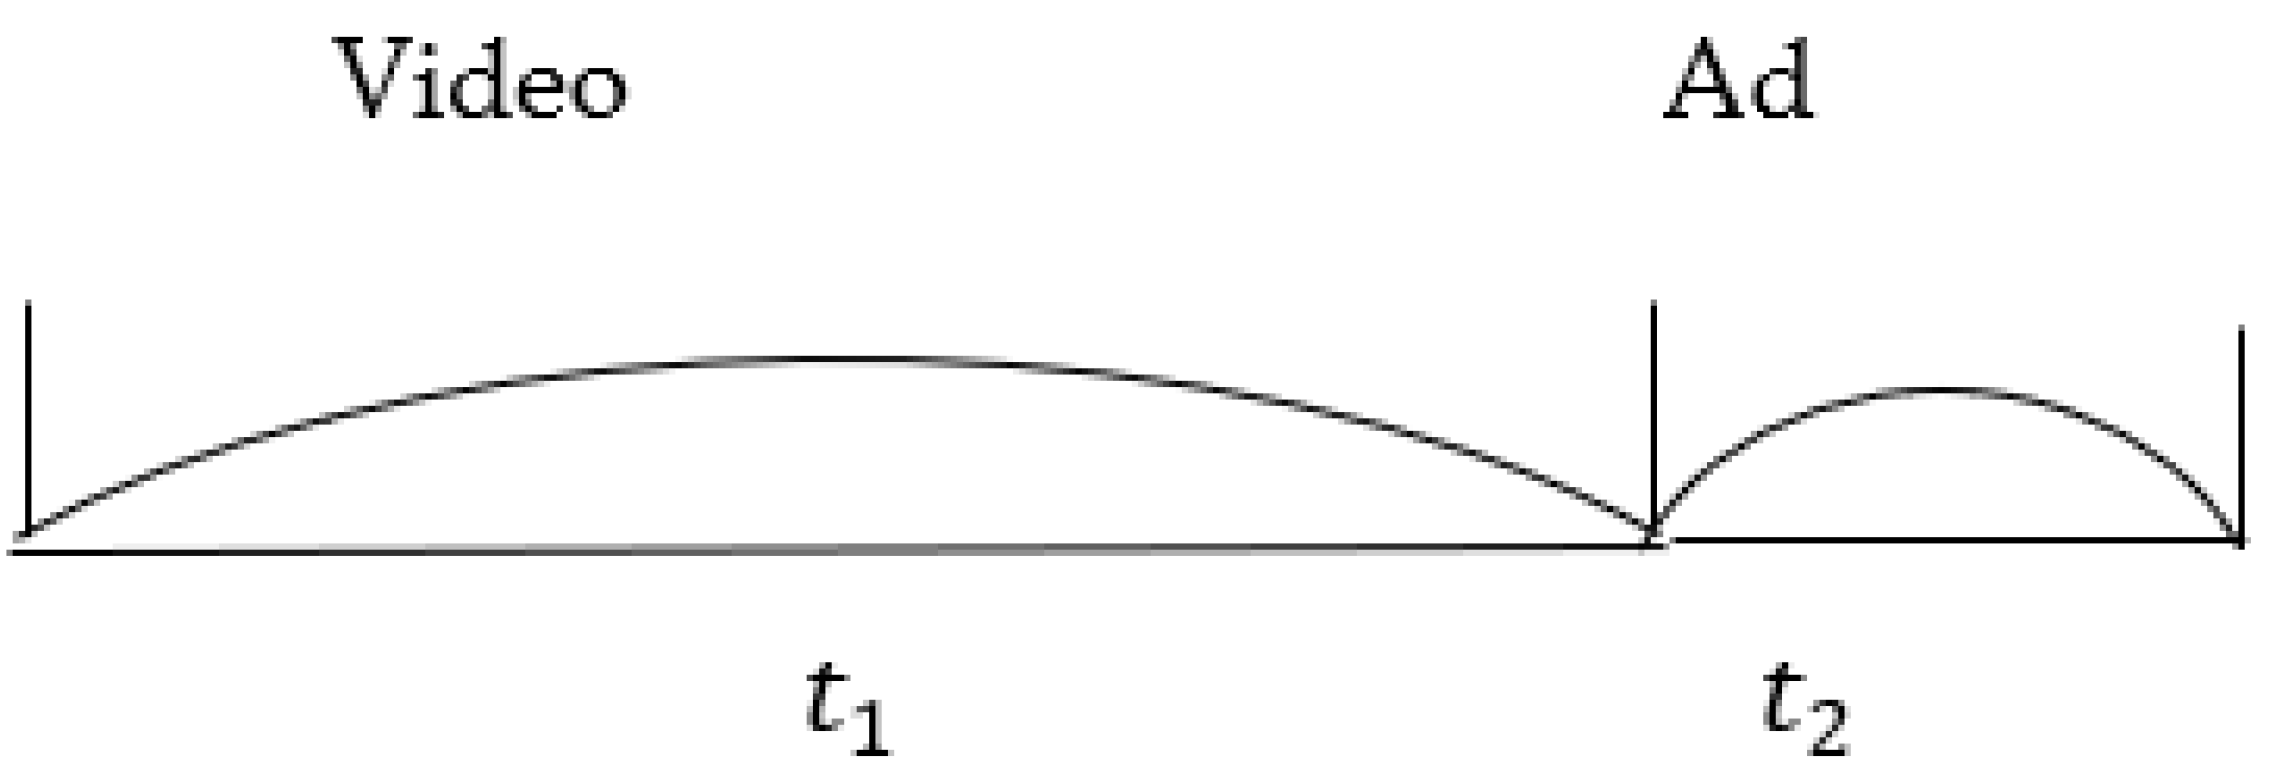
31]). According to their contribution, we suggest that the relationship between the perceived utility of consumers and the duration of videos and advertisements on SVPs is as follows:
is the user’s utility from watching the video per unit time,
is the duration of the video content between two advertisements, and
is the duration of an advertisement. We define
as the shortest duration that advertisers need to advertise their products effectively.
Figure 1 depicts the relationship between
and
in a video platform environment.
is the user’s advertisement nuisance cost and
.
is the user’s sensitivity to advertising and
is the quality of the video advertisement.
When viewers use a video platform, their net utility comprises the utilities from watching the video and watching the advertising, as well as the advertising nuisance cost. When users’ net utility is positive, they continue using the video platform.
The number of consumers on the platform is
. When
, consumers join the platform and become valid consumers. Suppose
is the probability of
, that is,
. Hence,
, where
is the number of valid consumers of the platform. Thus,
For advertisers, the revenue generated by advertising is influenced by both the number of viewers
and the quality of video advertising
. Some scholars study decision-making problems by constructing advertising quality models and using model optimization methods (Kramer [
5], Hagiu et al. [
13]). According to their theory, we argue the function of the advertiser’s profit is:
is the entry cost for advertisers to advertise on the platform.
represents the cost incurred by the advertiser to produce advertisements with a video quality of
.
fulfills the Inada conditions:
. As in Kim’s research [
32], advertising influences users’ purchase intention.
indicates users’ purchase intention due to advertisement quality.
is the profit conversion rate per unit of purchase intention, which represents the profitability of the advertiser. In related research (Hagiu et al. [
13], Dou et al. [
18]), fixed costs and profitability are independent; however, in practice, the profitability of a seller’s product is often related to its investment, and our model fits this logical relationship. From Equations (2) and (3), advertisers’ maximum profit from advertising on the video platform is:
Lemma 1. The optimal advertising quality strategyof advertisers on the video platform is determined, andis:
Figure 2 shows the advertising quality strategy of advertisers on the video platform. When
, advertisers lower the cost of advertising design by reducing advertising quality; however, poor advertising quality means that advertisers cannot maximize the revenue generated from the users on the platform. For example, embryonic companies have not yet developed a mature process for producing advertising content; their limited funds force them to lower the cost of advertisement design. A common initial strategy is for them to test the market by designing advertisements at a small proportion of the cost. As their advertisement content production process matures and they begin to understand the market size, advertisement revenue, and target users, they gradually increase their investment in advertisement design until
is satisfied.
When , although advertisers do create high-quality advertisements by increasing the cost of advertising design and entice consumers to buy products, excessive investment in advertising design incurs high design costs. An example is when large companies expand their markets on video platforms. Large companies have sufficient funds to design high-quality advertisements. When they initially join the video platform, they attempt to grow their market reputation and user base through high-quality advertising; however, when the growth in market demand does not match the cost of advertising design, advertisers find that the profits from well-designed advertising do not meet their expectations; these companies may then reduce the cost of designing advertisements until .
Corollary 1. . In the extreme case, when , advertisers aim to improve the quality of their advertisements.
From Corollary 1, the number of viewers on the platform
positively affects optimal advertising quality
, as market demand increases when the number of platform users increases. In this case, advertisers can attract more users to become potential consumers by enhancing the quality of their advertisements to obtain the optimal profits. The increase in users’ purchase intention
also improves optimal advertisement quality
. In some cases, advertising quality is a strong driving force behind users’ purchasing behavior, and advertisers must actively invest in advertising quality to maximize their benefits. An increase in advertiser profitability
positively affects optimal advertising quality
. Once advertisers hold high-quality or highly competitive products, they become more profitable than their competitors. To expand their advantage, advertisers must then improve their advertising to maximize their profits.
Figure 3 shows advertisers’ advertising design decisions under different numbers of potential users when
. Here,
.
There is a special case, although this is not our focus. When , advertisers generate more benefits than costs by improving the quality of their advertisements; they then invest as much as possible in the production of video advertising content to help users find the right product. Compared with other audiences, consumers of video advertising are more sensitive to and less tired of advertising; hence, the optimal strategy, in this case, is to produce high-quality advertisements.
Lemma 2. When designing advertisements, advertisers tend to display the advertisement in the shortest effective duration rather than deliberately extending the advertisement. In addition, advertisers want platforms to place their advertisements after playing a longer video.
To prove Lemma 2, we add the advertiser’s optimal strategy
into Equation (4) and analyze the ratio of video duration to advertising duration. Let
.
represent the ratio of video duration to advertising duration in a period:
The positivity and negativity of is influenced by advertising nuisance cost .
Case 1: When , , the optimal revenue and ratio of advertisers are monotonically increasing. To increase , advertisers must increase or decrease . As is affected by the platform’s strategy, advertisers can only reduce to . That is, advertisers deliberately display the advertisement in the shortest duration; moreover, they want the platform to offer a larger , meaning they want it to play a longer video before their advertisement.
Case 2: When , , although advertisers’ optimal revenue decreases monotonically with ratio , it also conforms to Lemma 2. There is no optimal strategy for advertisers. can be obtained based on Equation (4), and we can draw the same conclusion as in Case 1.
Lemma 2 shows that, to obtain optimal profits, advertisers must maximize the time efficiency of advertisements (i.e., display advertisements in the shortest duration) for two reasons. First, this can reduce users’ viewing time and optimize their platform experience. Second, it can provide more video space for SVP; such a strategy thus benefits platforms, advertisers, and users. In addition, advertisers want their advertisements to be played after a longer program for two reasons. First, a long program without advertisements encourages users to see the platform as effective; hence, more users join the SVP, which increases the potential pool of consumers for advertisers. Second, a long program can relieve users’ boredom with previous advertisements, which improves users’ viewing experience of subsequent advertisements.
In light of the problems for video platforms, this section proposed an optimal advertisement quality strategy for advertisers. Analyzing the impact of different situations on the optimal decisions, we conclude that advertisers should not waste extra time playing advertisements, and that advertisers want to show their advertisements after a longer program. These conclusions suggest the following questions: How should advertisers adjust their product prices on SVPs? Why do advertisers choose to advertise on SVPs instead of other platforms? We answer these questions in the next section.
4. Pricing and Platform Selection Strategies
4.1. Pricing Strategy
As mentioned previously, higher advertisement quality increases users’ willingness to buy products and thus raises advertisers’ profitability. In practice, however, once advertisers have set an unreasonable price for a product, users refuse to buy the product regardless of the quality of the advertisement. Therefore, we consider the effect of product price factors on advertisement quality strategies and advertisers’ profits. Advertisers must consider both product price and advertisement quality when advertising on SVPs to maximize their profits. Hence, advertisers’ profit
is:
Here, represents the price sensitivity of the user. The higher the price sensitivity of the user, the stronger the negative effect of price on the user’s purchase intention (based on the Van Buren effect, raising the price of a product can induce consumers to buy it in some cases; however, this is not the subject of our study). is the price of the advertiser’s product. Since the product price directly affects the advertiser’s profit, we set .
When advertising on SVPs, advertisers first decide on the quality of their advertisements and then set their product prices based on the optimal quality of those advertisements. Therefore, we use reverse derivation to optimize price under advertisement quality :
Lemma 3. Let.
Table 2 shows the quality and pricing strategies of advertisers on SVPs.
Lemma 3 shows that when the user’s price sensitivity is below threshold , it is the optimal strategy for advertisers to invest as many resources as possible to enhance the quality of their advertisements. Contrarily, advertisers must invest a certain amount to improve the quality of their advertising to maximize profits. Furthermore, in both cases, the advertiser’s pricing strategy is independent of the advertising quality strategy.
The reason for such results is that advertisers can obtain higher profits from advertising to users who are less price-sensitive. Therefore, they invest sufficiently in advertising quality, and the advertising quality income can compensate for the loss due to the high price; however, for users with high price sensitivity, the negative impact of the product price can reduce the earnings of advertisers. Although advertisers can increase users’ purchase intention by controlling advertising quality, they must consider the decline in purchase intention caused by users’ price sensitivity; this limits advertisers’ investment in advertisement quality design; hence, advertisers must balance product price and advertisement quality to make their final decision.
Corollary 2. Corollary 2 shows that the optimal price increases with an increase in users’ purchase intention due to the advertisement and decreases with an increase in users’ price sensitivity . When users’ purchase intention rises owing to advertisements, improving the quality of advertisements promotes user purchases more effectively. To bear the cost of improving advertising quality, advertisers must set higher product prices to obtain the required funds. When users’ price sensitivity increases, a higher product price reduces users’ purchase intention markedly, which lowers the profitability of advertisers.
Further, optimal advertisement quality increases with an increase in users’ purchase intention due to the advertisement and decreases with an increase in users’ price sensitivity . Again, when rises, similar to Corollary 1, advertisers benefit more by increasing their investment in improving the quality of their advertisements. When rises, higher product prices make users more dissatisfied, which reduces advertisers’ profits. Such conditions prevent advertisers from making larger investments in advertisement quality.
Finally, users’ price sensitivity threshold increases as increases. Since the rising increases consumers’ purchase intention through advertising, advertisers can set higher prices to increase their profits.
Figure 4 and
Figure 5 illustrate the influence of parameters
on the advertiser’s optimal profit
when
; they show that the greater purchase intention of users owing to advertising raises the optimal profit of advertisers and that users’ price sensitivity lowers their optimal profit.
Overall, when considering the operations of SVPs, advertisers must not only adjust the quality of their video advertisements to achieve short-term profits, but also set reasonable product prices to generate long-term profits. Therefore, users’ purchase intention and price sensitivity are both factors on which advertisers must focus. When a price increase does not affect the user’s purchase intention markedly, advertisers need only adjust the optimal product price and maximize advertising quality. In this situation, improving the quality of video advertisements is profitable. When users do not accept higher prices, advertisers must balance both the optimal product price and the optimal advertising quality. In addition, to obtain optimal profits, advertisers must select the right platforms, as discussed next.
4.2. Platform Selection Strategy
The emergence of SVPs has provided a new option for advertisers to place online advertisements; therefore, we now discuss the issue of advertisers’ platform choice. General platforms (e.g., online TV, video sites) usually use an advertising model under which users are forced to consume advertisements while watching programs; however, scholars (e.g., Chi [
6]) have found that some video platforms use a hybrid model in which users can opt for ad-free services by paying a fee. In this case, the advertisement nuisance cost is replaced by this payment. Advertisements may annoy users by wasting their time. Therefore, one of the advantages of SVPs is that users can skip the advertisements cost-free by simply swiping the screen to switch to the next video. As a result, users are usually less annoyed by advertisements on SVPs than on GVPs.
Let the advertising nuisance cost on SVPs and GVPs respectively be
and
,
Furthermore, because the users of SVPs and GVPs differ, we define the number of users on SVPs and GVPs as
and
, respectively. The entry cost of advertisers on GVPs is affected by
. For example, during online TV shows, the prime time advertising fee is relatively high. By contrast, the entry cost of SVPs is determined by their retention price. Therefore, the entry cost of advertisers on GVPs is
, whereas that on SVPs is
. The entry cost of advertising on SVPs can also be affected by bidding auctions, as discussed in
Section 5.
When advertisers choose SVPs or GVPs, they usually entrust third-party companies to create video advertisements. As platforms’ decisions do not affect the production of advertisements by third-party companies, we assume that advertisers’ advertising quality
is fixed. Hence, the profits of advertisers on GVPs can be obtained as follows:
The profits of advertisers from advertising on SVPs are:
Lemma 4. SetTable 3 shows four cases. indicates the degree to which potential consumers incur an advertising nuisance cost. Consumers on SVPs and GVPs incur different advertising nuisance costs. Usually, as the number of users on GVP is larger than that on SVP , the advertising nuisance cost of users on GVP is higher than that of users on SVP . Under different values, the advertiser’s decision mainly depends on the difference in entry cost, that is, . The two differences are related to the ratio .
Corollary 3.
When , ; when , .
According to Lemma 4, when
and
, advertisers choose to advertise on SVPs; however, when
and
, advertisers choose to advertise on GVPs. In the other two cases, advertisers’ choices are influenced by exogenous variables. When
and
, the increase in exogenous variables
, and
may lead advertisers toward advertising on SVPs. Contrarily, when
and
, the increase in these exogenous variables may lead advertisers toward advertising on GVPs. Hence, the advertising nuisance cost is a decisive factor for advertisers’ choice of strategy. As mentioned in
Section 3, increases in the exogenous variables
, and
raise advertisers’ revenue. Further, when the advertising nuisance cost of SVPs is greater than that of GVPs, advertisers can gain greater incremental profits on SVPs; therefore, advertisers choose SVPs over GVPs.
In this section, we analyzed the differences between SVPs and GVPs. Although the user base of SVPs is usually smaller than that of GVPs, and users are less annoyed by advertisements on SVPs than on GVPs, our model is also applicable to special cases. Furthermore, we discussed the options for advertisers to place their advertisements on different platforms in different situations. In some of these cases, it is more profitable for advertisers to place online video advertisements on SVPs.
Although these conclusions only apply to large companies, many small advertisers advertise on SVPs. Since the budgets of these small advertisers are limited, they cannot balance the platform’s cost of entry with the cost of advertisement design. We discuss such companies in the next section.
5. Bidding Strategy for Small Advertisers
In the previous section, we examined advertisers’ choice of platforms in different situations, showing advertisers’ preference for SVPs; however, in the previous discussion, we did not restrict the scale of advertisers. In reality, small advertisers incur large costs to design high-quality video advertisements. In addition, advertising on SVPs suffers from a bidding problem. Similar to the general bidding mechanism for sponsored advertisements, the position of advertisements on SVPs can be problematic. For example, advertiser A can bid for a higher position at a higher price so that its advertisement is viewed in the fifth minute of a short video, while advertiser B can only bid for a lower position at a lower price, causing its advertisement to be displayed only in the tenth minute. In this case, higher-positioned advertisements are bound to be viewed by more users. When solving such problems, scholars usually use game theory to build models (Varian [
33], Edelman [
34]). According to their theories, we argue that an advertiser divides its costs into the cost of designing video advertisements and the cost of competing with other advertisers for advertisement positions in SVPs. Assuming that an advertiser of a fixed scale incurs cost
and
denotes the cost ratio used to design its advertising, we obtain
. According to the previous setting,
shows that investment cost
can produce a video advertisement of quality
:
For the bidding part, according to the previous assumptions, advertisers can garner more users by making higher bids. Let σ denote the ratio of total users obtained per unit of the bidding cost. If the firm invests
to bid against other advertisers, the number of viewers
is:
According to Equation (4), we obtain:
Lemma 5. Strategyallows small advertisers to earn the optimal profit through the rational allocation of investment. Further, for differently sized advertisers, there are more suitable positions for them to advertise on SVPs so that they neither raise their bids to obtain a higher position nor lower their bids to obtain a lower position.
Lemma 5 provides proof of the existence of optimal decisions for advertisers’ investments on SVPs. For a firm that incurs total cost , its optimal bidding cost is fixed. In this case, regardless of whether it raises its bid to obtain a higher position or lowers its bid to obtain a lower position, its total gain is .
The reason for this result is that advertisers on SVPs must balance development and competition. For development, advertisers must adjust their investment in advertising design. Excessively focusing on creating high-quality advertising directly reduces advertisers’ revenue. In contrast, excessively focusing on cost savings when designing advertisements leads to the loss of consumers. In terms of competition, advertisers must adjust their ad positions on SVPs: high positions demand higher investment, while low positions lead to less exposure of advertisements to users. Therefore, under their cost constraints, advertisers must formulate cost allocation strategies based on both development and competition. In addition, as advertisers have a unique optimal position on SVPs, they tend to keep their bidding prices unchanged. Once advertisers find their best position, they no longer need to invest extra effort and cost in price competition, and SVPs do not need to make frequent adjustments to advertising positions. In this case, advertisers and SVPs both benefit.
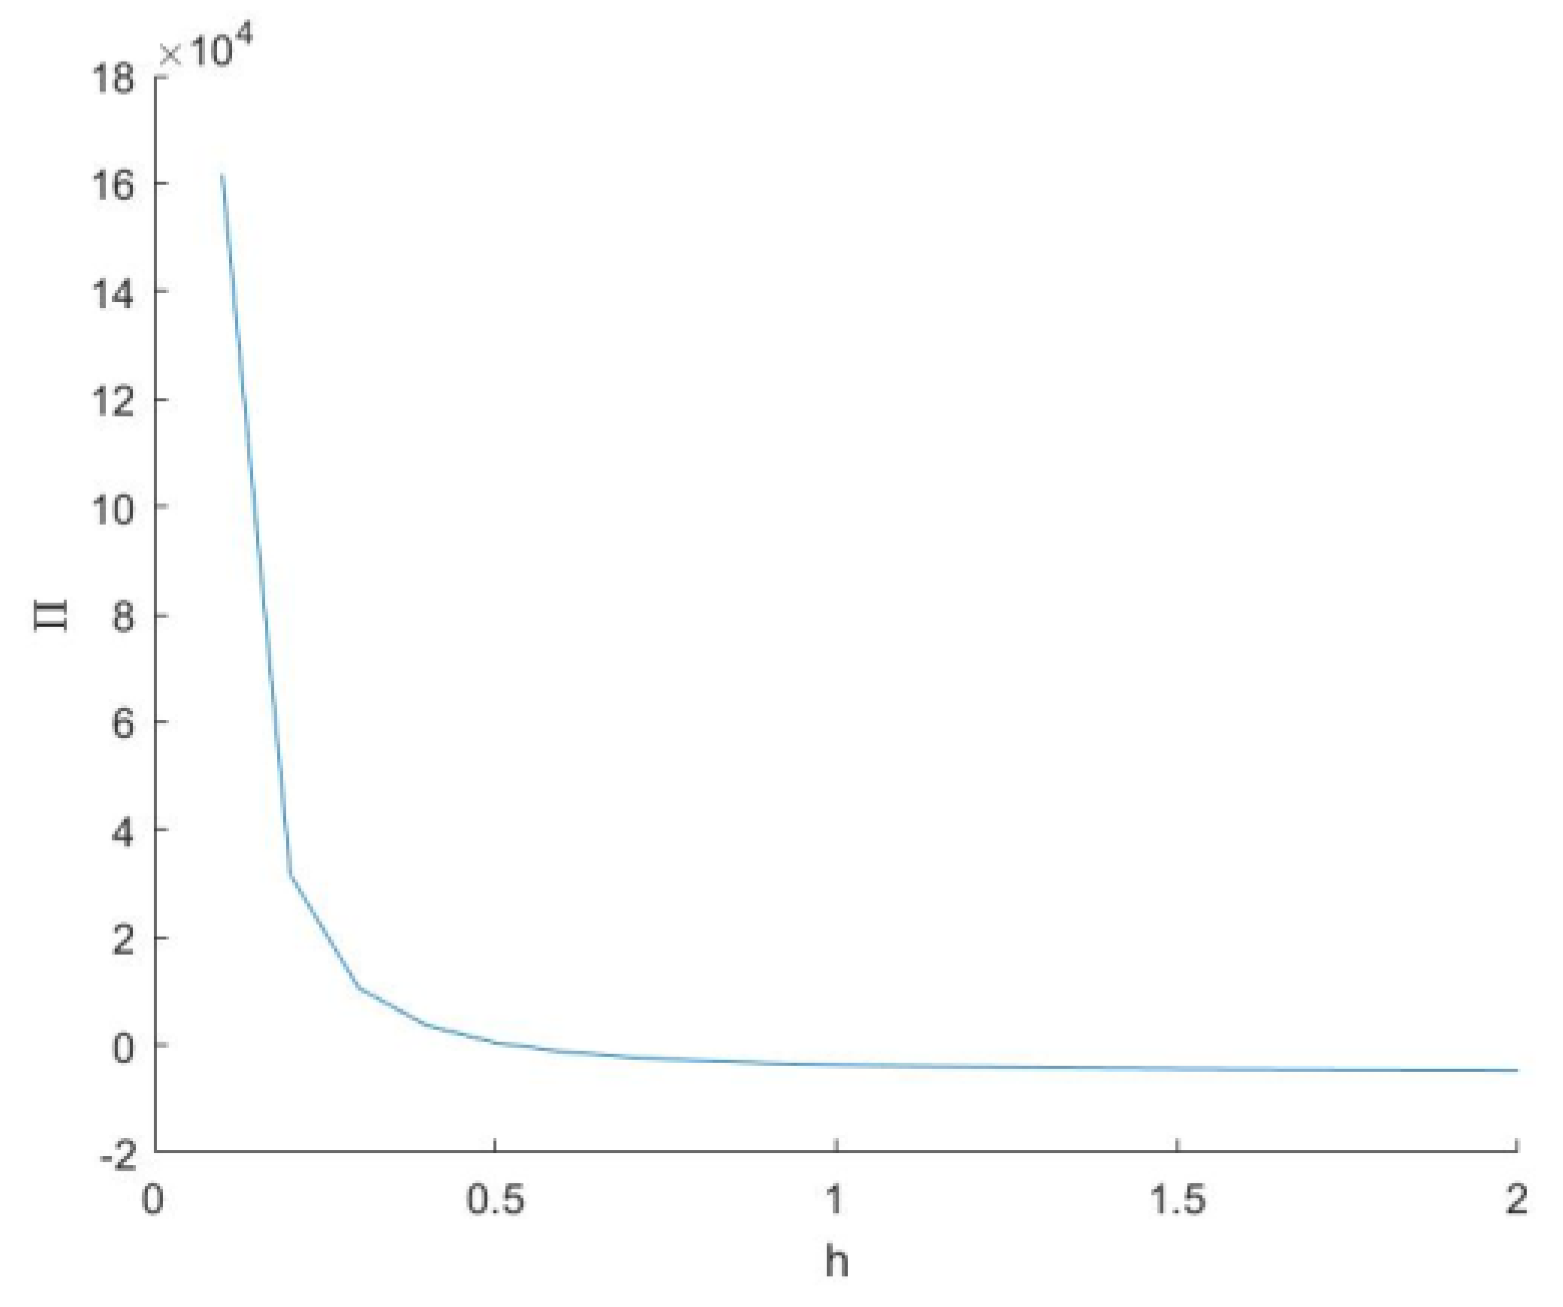
Figure 6 presents the profitability of small firms when choosing investment allocation strategies. The optimal allocation scheme
maximizes the total profit of the advertiser
.
In this section, we considered the bidding of small advertisers on SVPs. For advertisers wishing to advertise on SVPs, their limited resources leave them with a choice between competing with other advertisers for advertisement placement and investing in advertising design; this section, thus, provided the optimal decision for small companies to advertise on SVPs and proved that an optimal investment allocation scheme exists for such advertisers. In addition, it showed that the optimal position on SVPs allows advertisers with limited budgets to neither increase their bids to obtain a higher advertisement position nor decrease their bids to obtain a lower advertisement position, in line with the similar finding by Edelman [
34]; this conclusion is meaningful for designing bidding mechanisms when advertising on SVPs.
6. Discussion
Considering the influence of advertisement quality on users’ purchase behavior, we studied advertisers’ advertising behavior on SVPs. Advertisers must adopt specific strategies for advertising on video platforms to reduce their costs and increase their profits. In contrast to related research (Hagiu et al. [
13], Dou et al. [
18]), we argue that advertisers’ costs and profitability are not independent: as costs rise, so does profitability. Based on the results of advertisement quality optimization, we discussed the characteristics of advertisers’ optimal operational strategies. The main conclusions are as follows:
If the development of advertisers on the platform (e.g., number of platform users, user acceptance of advertisements, revenue generated by users’ purchase intention) exceeds a certain threshold, advertisers need to improve the advertisement quality as much as possible; otherwise, there is an optimal advertising quality. While the optimal advertising profit is affected by the advertising schedule. Shorter advertising duration and longer program duration can increase advertiser optimal profit if the advertisement is fully shown.
Advertisers’ product price strategies are independent of their advertising quality strategies. The optimal product prices are only related to users’ acceptance of advertising quality and price sensitivity. When users’ purchase intention due to the quality of advertisements increases or price sensitivity decreases, advertisers can maximize their benefits by increasing product prices, and vice versa.
Advertisers need to consider advertising nuisance costs and advertising entry costs when choosing a platform, so there are four scenarios. When the advertising nuisance cost and entry cost of SVPs are advantageous, advertisers tend to place their product advertisements on SVPs. Further, when the gap between the advertising nuisance cost and entry cost of the different platforms is difficult to measure, advertisers use the characteristics of the users and platforms to judge whether to advertise on SVPs.
Costs for small-scale advertisers are limited, and they split the cost into two parts: advertisement production cost and bidding cost. There is an optimal cost allocation strategy for small-scale advertisers. In addition, for advertisers of different scales, SVPs can provide relatively optimal advertising bidding positions. Once the advertiser reaches this position, neither increasing the bid to obtain a higher position nor decreasing the bid to obtain a lower position increases revenue.
This study provides management implications for advertisers on SVPs. Firstly, advertisers should determine the optimal quality of advertisements based on operational conditions and design difficulty; in addition, they need to investigate and observe users’ content sensitivity and price sensitivity of advertisements to make decisions of product prices; furthermore, we recommend that advertisers reduce the duration of advertisements, which is a win-win for advertisers, users, and platforms; finally, small-scale advertisers should consider both design costs and bidding costs when making advertising decisions research also provides management implications for managers of SVPs. SVPs need to balance the entry cost of advertisers. In addition, they should effort to increase the number of users and reduce nuisance, which is beneficial for attracting advertisers. An advertising schedule is beneficial to achieve such aims, that is, SVPs can present an advertisement after a long duration of the video, which benefits advertiser profitability and improves user experience.
Our study has two main limitations. The first is that the model assumed that advertisers only advertise on one video platform and viewers only use one video platform; however, in practice, advertisers may advertise on multiple platforms simultaneously and users may use multiple platforms. Advertisers on different platforms may, thus, develop cross-platform strategies to gain market share and revenue. The second limitation is that we only considered the profits of advertisers; however, in reality, while advertisers aim to increase their profits, SVPs may also modify their operational strategies to raise their profits. Hence, analyzing the profit strategies of SVPs is a direction for future research.


