1. Introduction
1.1. Heuristic Methods in Spatial Planning
Decisions concerning the visual attributes of cities are usually made by urban planners who generally focus on functional attributes and rarely consider the preferences and expectations of the users of space. The communication between urban planners and local residents who are users of the designed urban spaces is generally poor. According to Jeleński and Kosiński, there are no urban planning projects that can be classified as completely worthless, because each project has the potential to benefit members of the local community. However, most urban projects are implemented for political reasons or to cater to the needs of businesses, including property developers. Urban projects are rarely preceded by social debate to identify solutions that meet the expectations of community members. Urban solutions proposed by the local residents focus on immediate social needs, most of them are highly realistic and practical, and some are innovative. Participatory planning adds new value to urban design because the proposed scenarios offer a much broader vision than the solutions developed by individual experts or agencies [
1].
Urban space management reflects on the existing phenomena, including social processes. Therefore, it can be postulated that social aspects determine spatial management. In the urban planning process, the existing solutions in urban space should be confronted with social preferences and economic phenomena. Planning solutions rely on multiple sources of information from various domains, including geography, architecture, urban planning, economics and legal sciences. A psychological and philosophical approach is not used in the process of applying that information to spatial design. The importance of the spatial planning process should be emphasized to promote the idea of participatory planning. The applicability of heuristic methods in spatial planning practice should be investigated to support the above goal. These evaluations should be based on the results of community debates and surveys. Various research methods, including interviews, observations and analyses of source documents, and data collections tools such as interview-based questionnaires and questionnaire surveys should be used for this purpose. The data collected with the use of heuristic methods should be taken into account in the spatial planning process. In the discussed process, heuristic methods should be deployed to implement the existing knowledge in practice rather than offer theoretical solutions. This article proposes a method for evaluating public perceptions of safety in urban spaces.
1.2. Strategies Promoting the Creation of Safe Urban Spaces
The physical environment can directly influence criminal activity, and the existing urban solutions can stimulate or deter crime. For this reason, the local authorities should make every effort to preserve the high quality of the urban environment. The physical and social aspects of space should be analyzed jointly to create safe cities. The existing safety standards and the impact of physical factors on urban crime can be reliably evaluated in this approach. The resulting knowledge can be applied in the process of designing new urban structures or refurbishing the existing facilities [
2].
Certain attributes of space can stimulate crime and compromise safety in cities. These attributes can also negatively affect perceptions of safety in urban communities. In an era when social sustainability plays an increasingly important role in urban development, the reasons behind negative perceptions of safety should be identified, and adequate measures should be undertaken to eliminate these threats. The main aim of this study was to explore public perceptions of safety to maintain or improve the existing solutions in cities.
Various theories and strategies have been proposed for establishing rules and regulations whose observance contributes to preventing and eliminating crime in urban areas. In 1968, Shlomo Angel published a research paper entitled “Discouraging Crime Through City Planning”. The author analyzed street crime in Oakland and concluded that “the physical environment can exert a direct influence on crime settings by delineating territories, reducing or increasing accessibility by the creation or elimination of boundaries and circulation networks, and by facilitating surveillance by the citizenry”. Angel hypothesized that crime rates are inversely proportional to street activity [
3].
The Crime Prevention Through Environmental Design (CPTED) strategy was developed by Jeffery in 1971. This approach emphasizes that the physical environment plays a role in creating pleasurable or painful experiences for the potential offender that can stimulate or inhibit criminal outcomes. The CPTED approach relies on a stimulus-response model which postulates that humans learn from punishing or reinforcing stimuli in the environment. Jeffery argued that a crime would not occur if the environmental reinforcements for crime were eliminated. The CPTED concept has different applications in practice, and it relies on four simple principles: Natural surveillance (potential offenders are visible to the general public), natural access control (private and public property is clearly differentiated, which limits the opportunity for crime), natural territorial reinforcement (residents identify with their neighborhood) and maintenance and management (clean and well-managed neighborhoods are an expression of ownership property, and they deter potential offenders) [
2,
3,
4,
5].
When combined with other solutions, the CPTED concept is an effective tool that can significantly minimize (or even eliminate) vandalism and other undesirable behaviors. It is particularly effective in preventing delinquencies and criminal acts. The CPTED strategy introduces various urban planning solutions and mobilizes local communities to feel responsible for their neighborhood, respond to undesired events and work with law enforcement agencies and the local authorities. The fourth principle of CPTED, maintenance and management, emphasizes the importance of the positive image of the community. Deterioration and negligence disrupt spatial order, encourage crime and compromise safety. Therefore, esthetic degradation contributes to the feeling of insecurity in cities. Neglected, dirty and abandoned neighborhoods invite crime and generate unsafe spaces [
3,
6,
7].
The “Defensible Space” theory was developed by Newman who analyzed the relationships between crime and environmental and architectural design. Newman identified several environmental factors that minimize crime and delinquencies, including territoriality, natural surveillance, image and milieu [
3].
The “broken windows” theory put forward by Kelling and Wilson states that visible signs of crime and anti-social behavior, such as a broken window, encourage further crime and disorder. Tolerance of minor offences invites more serious crime, and a broken window can snowball into widespread degradation of the neighborhood. In contrast, areas where damage is quickly repaired deter vandals [
8].
The presented strategies and models for preventing crime account for urban design and environmental factors. Therefore, geospatial elements that contribute to the feeling of insecurity have be identified. The relevant information can be used during urban planning to eliminate adverse factors and create safe spaces.
1.3. Methods for Analyzing Spatial Data
The grey systems theory was developed by Julong Deng [
9,
10,
11,
12] to analyze contemporary systems based on scarce, incomplete and uncertain data. The grey systems theory provides tools for studying problems that involve small samples of imperfect information [
12].
This highly effective method for modeling and forecasting short time series can be applied in all fields of research that rely on quantifiable models with small amounts (even several) of incomplete and uncertain data, including in social sciences, economics and technical sciences [
13,
14]. The Grey Systems Theory (GST) has been successfully used to forecast trends in the economy [
15], agriculture [
16] and medicine [
17,
18], to predict demand [
19], the development of the tourism industry [
20] and localize sources of noise [
21]. Grey Relational Analysis (GRA) is most often used in practice. This approach relies on information about similarities and differences between data series describing the examined objects which can be ranked [
12].
The GST involves dedicated procedures for generating, identifying and selecting unknown information based on information that is only partly known. This approach is used to model and monitor the behavior of real-world systems, and to describe the mechanisms behind the observed changes [
12]. In this study, the GRA was applied to explore the respondents’ opinions on geospatial attributes that contribute to perceptions of insecurity in urban spaces. The survey was conducted on a small and incomplete group of respondents that had been selected in an arbitrary manner. A grey system has an advantage over regression analysis in that it requires only a small number of input data. In regression analysis, the volume of input data (observations, measurements, respondents) should be at least 10 to 20 times higher than the number of variables (questions). Regression analyses that do not meet the above requirements produce unstable results that fluctuate considerably when the number of cases increases [
22]. In turn, a grey system model requires minimum four observations, regardless of the number of the analyzed parameters [
23]. A stable sequence based on the strength of the relationships between five attributes can be obtained for 20 observations [
24].
1.4. Grey Systems vs. Statistical Analyses
Places that are described as “safe”, “interesting” and “attractive” denote locations to which people would like to return. These terms represent intangible qualitative attributes that are difficult to describe and can be quantified with the use of statistical data or the results of field observations [
1].
Spatial analyses are conducted to obtain new information based on input data. This study proposes a GRA-type grey system to determine which of the analyzed attributes exert the greatest influence on perceptions of insecurity for potential users of space.
Various methods have been proposed for solving problems with the use of spatial data analyses. The first group includes statistical methods that assign values to the identified attributes or determine the strength of relationships between different factors. Statistical methods include correlation analysis, analysis of variance, quotient transformation with a normalization basis [
25,
26,
27,
28,
29], direct comparison [
30] and land valuation models [
31].
The second group involves decision support systems for optimization, classification and problem solving [
32]. These systems are used to acquire spatial data as well as information that is based on expert knowledge and experience. Decision support systems are applied to deal with highly complex tasks and to solve spatial problems. Spatial analyses require information about the limits and internal structure of spatial data as well as their interactions with the environment. However, such data are often scarce, incomplete and unreliable [
33]. They can be processed with the use of probability theory, fuzzy sets and rough sets [
34,
35].
Spatial analyses are also conducted with the use of regression analysis. This statistical technique analyzes the effects exerted by independent variables on the observed phenomena. Regression quantifies the relationships between the studied phenomena and selected independent variables [
36]. Multiple regression analysis is widely used in socio-economic geography and land management to identify the associations between the examined factors. The results are interpreted by identifying independent variables or groups of variables that explain the highest proportion of variance in the observed phenomenon [
37]. A model describing these relationships is developed in a statistical analysis by determining the number of observations, testing linearity and normality assumptions and identifying the limitations of the method [
22]. Not all of the above requirements are always met, which complicates or even precludes the analytical process.
The GST developed by Julong Deng offers an alternative approach to spatial data analysis, in particular regression analysis. The GST has been designed specifically for modern systems that rely on scarce, incomplete and uncertain data [
9,
10,
11,
12]. The use of an accidental sample and a GRA-type grey system does not require the application of research standards that have to be met by surveys which rely on strictly statistical analyses.
The aim of the present study was to develop a reliable grey system model based on input data that are scarce, incomplete and uncertain. The relationships between multiple independent variables (geospatial attributes) and a dependent variable (perceptions of safety in space) were explored. The results of the analysis were used to rank the strength of the relationship between variables and to determine which of the analyzed attributes exert the greatest influence on the sense of insecurity in space. The method selected for the analysis is an alternative to regression analysis because it supports the acquisition of the same data by much simpler means.
2. Materials and Methods
2.1. Characteristics of the Grey Systems Theory
Studies aiming to analyze the behavior of systems require information about their boundaries, internal structure and interactions with the external environment. In practice, the information about complex systems is incomplete, uncertain or scarce [
14].
The GST was developed in China in 1982 by Julong Deng, Professor of the Huazhong University of Science and Technology. The GST identifies the following types of systems:
- –
white (white box) where information is completely known,
- –
black (black box) where information is unknown and uncertain, and the user can only observe the system based on a sequence of statements that start at an entry and end at an exit,
- –
grey (grey box) where information is limited: Part of the information is known, and part of the information is unknown [
38].
In the real-world, most information belongs to the grey area, and many phenomena, including weather or earthquakes, are uncertain. Uncertainty also applies to agricultural yields despite the fact that complete information is available about the types of sown crops and the applied agricultural treatments. The relevant observations (measurements, results of market analyses, opinions) are usually scarce, and the information about a system’s behavior is incomplete. In practice, incomplete and uncertain information is used to evaluate and predict a system’s behavior and to make functional, operational and strategic decisions which have important technological and social implications [
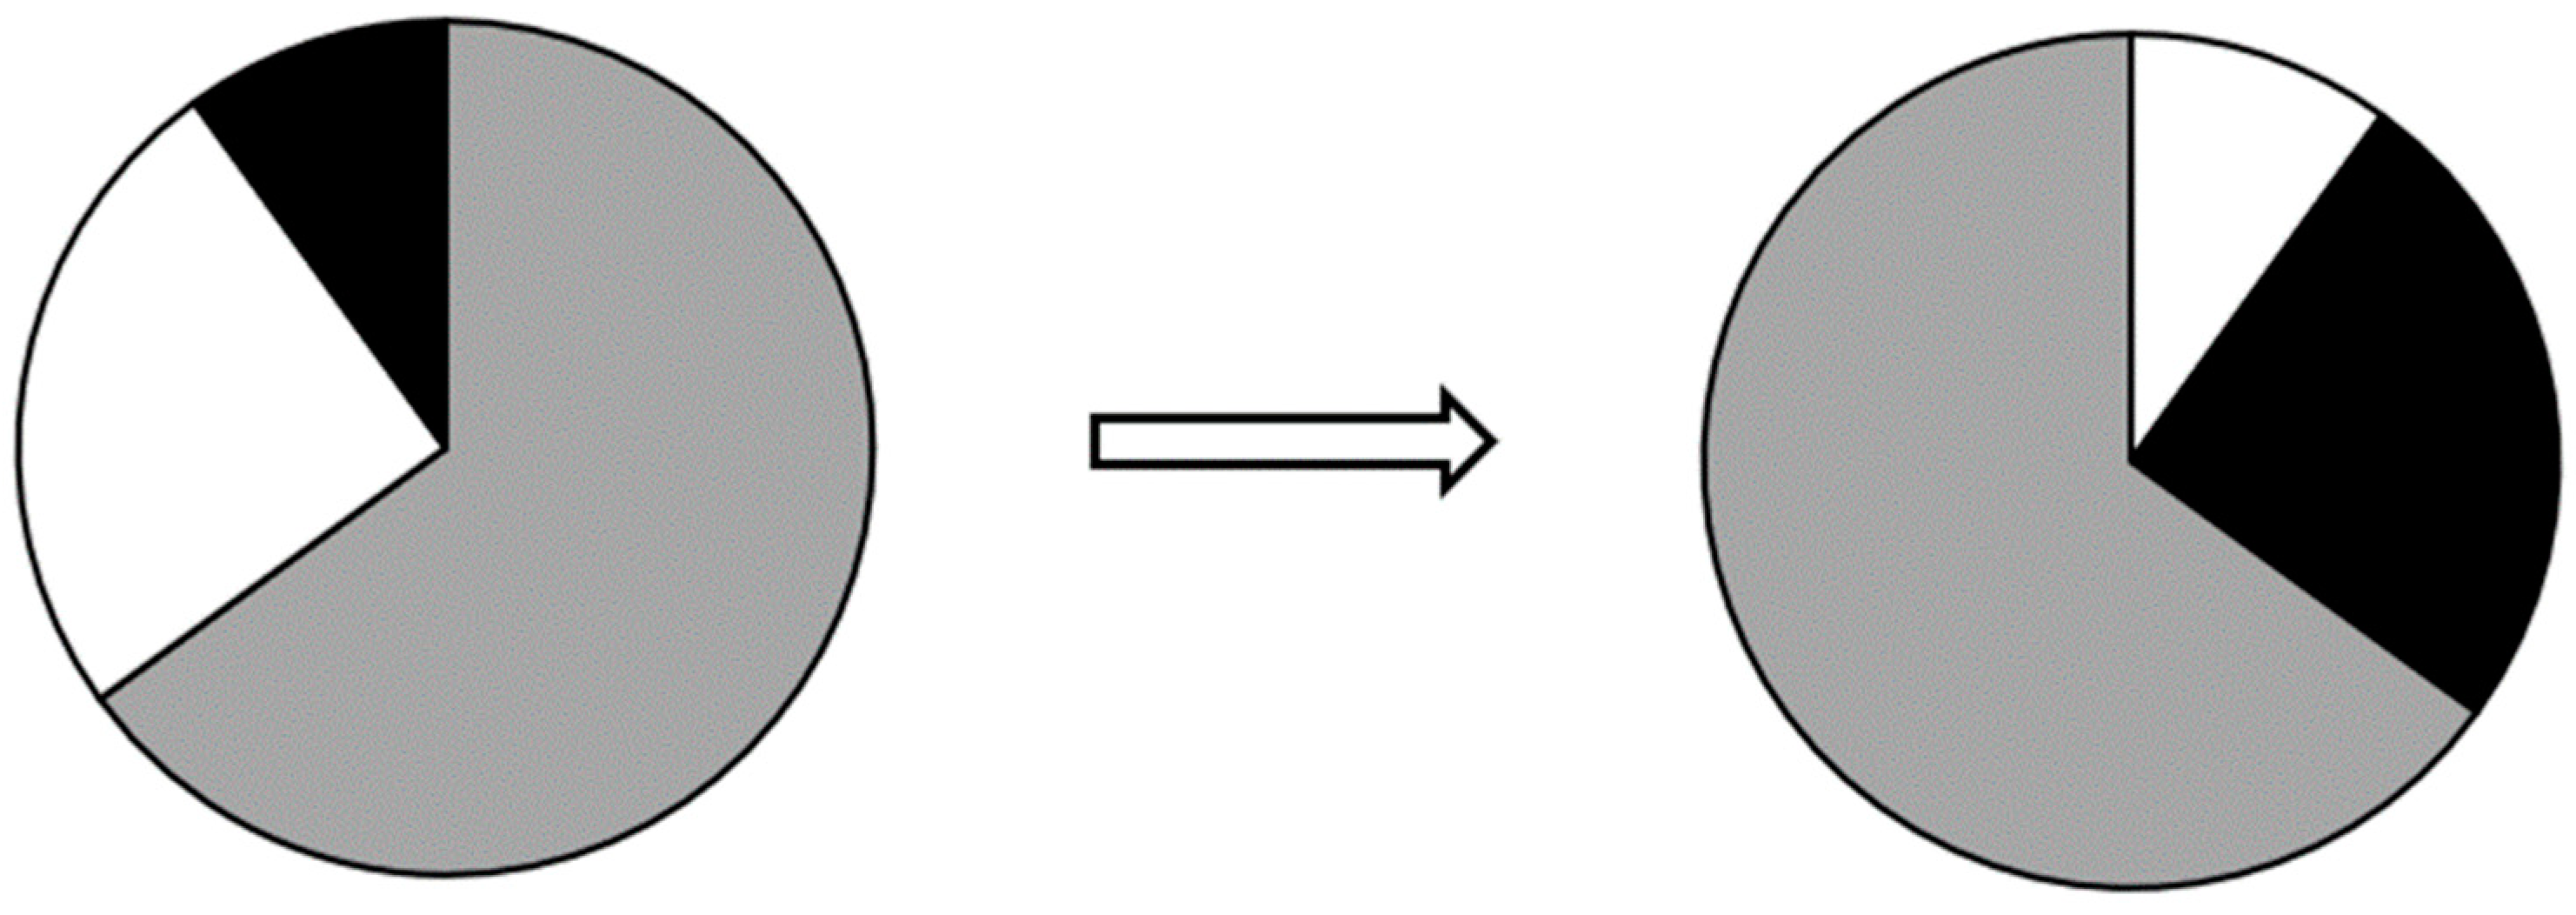
12]. Grey system models facilitate analyses of such information. In principle, grey system models are applied to obtain additional “white” and “grey” information from the available set of incomplete and uncertain of data at the expense of “grey” and “black” information, respectively (
Figure 1).
As a result, the proportion of “black” (uncertain) information is reduced. Information is acquired with whitening functions. Grey systems are applied in analytical processes that deal with imperfect information. Grey system models have an advantage over popular analytical methods in that they do not require information about the internal structure of data, only their boundary values. As a result, imperfect information can be processed in a simple, accurate and non-ambiguous manner [
12].
Grey systems theory supports the determination of the strength of relationships between the examined variables in the GRA [
12,
39]. The grey incidence (relationship) analysis can be used to determine the absolute degree of grey incidence of the observed factors and system characteristics. The analytical procedure relating to GRA has been described in the literature [
23,
33,
39], and it involves several stages:
- –
the definition of observation vectors,
- –
calculation of the reflection of observation vectors,
- –
calculation of behavior measures,
- –
calculation of the values of absolute degree of similarity, i.e., the similarity coefficient,
- –
determination of the order of impact of the analyzed system factors on the characteristics of the system.
Observation vectors containing information about system attributes (
X0) and behaviors (
X1,
X2, ...,
Xk) are defined in the first step. The number of behavior vectors is determined by the number of the observed variables. Each vector contains information about a given variable that has been received from a given number of respondents. In a grey model, the system’s real-world behavior is described by the predicted/endogenous variable
X(0)(
k), where
k = 1, 2, ...,
n is a set of explanatory variables that determine the state of the predicted variable. Therefore, an endogenous real-world process (
X(0)(
k)) is explained in time by
N number of independent (explanatory) variables [
40,
41].
The observation vector has the following form:
where:
k—the number of variables observed (system’s behavior),
n—the number of respondents.
In the next step, reflection vectors are calculated by zero initialization. This operation facilitates the smoothing of accidental disturbances, and it emphasizes evolutionary trends in a grey system’s behavior [
23]. The following formula is used for this purpose:
The measures of the behavior of observation vectors are then calculated by summing and subtracting vector values [
23,
33]:
This is followed by the calculation of the value of the absolute degree of similarity, i.e., the similarity coefficient Ɛ between the observation vectors of
X0 and
X1,
X2,
X3,
X4,
X5, [
33]:
The value of Ɛ is used to describe similarity and the degree of relatedness between two observation vectors, where one vector represents an attribute that influences a grey system, and the other vector describes the system’s responses. The value of the similarity coefficient ε plays an important role in evaluating the results:
- (1)
0 < ε ≤ 1;
- (2)
ε is related only to the geometric shape of vectors X0 and Xk, and it is unrelated to their spatial arrangement;
- (3)
ε does not equal zero if every two vectors are even minimally related;
- (4)
the higher the degree of relatedness (similarity) between two observation vectors, the higher the value of ε;
- (5)
ε is equal to or close to 1 if observation vectors are parallel or nearly parallel to each other [
23].
2.2. Identification of Factors that Compromise Safety in Urban Space
Perceptions of safety in urban space are subjective. They are influenced by the users’ personality traits which determine the extent to which various attributes of space are perceived and evaluated as dangerous. The feeling of insecurity arises from a combination of potential hazards and negative associations with specific elements of urban space.
This study set out to determine which geospatial attributes contribute most to the sense of insecurity in public spaces. The evaluated attributes were identified with heuristic methods, and their contribution to perceptions of insecurity was determined in subsequent stages of the analysis.
Several types of sampling methods can be deployed in research. A representative sample is a subset of a population that accurately reflects the characteristics of the entire population. A quasi-representative sample is a group of individuals who only partly meet the criteria of a representative sample. In turn, an accidental or convenience sample consists of respondents who are easily accessible to the researcher [
42,
43]. Purposive sampling is a non-random method where respondents have to meet specific criteria, such as age, sex or preferences concerning the topic of interest. Purposive sampling is the preferred method in studies analyzing the behaviors, opinions and attitudes of individuals with a specific social profile [
43].
Brainstorming is a heuristic method of creative problem solving that was developed by Alex Osborn. In this study, the brainstorming method was applied to identify geospatial attributes that contribute to the feeling of insecurity in urban spaces [
44,
45]. Brainstorming sessions involved university students who were enrolled in an urban management program and were familiar with the concept of urban safety. The study involved an accidental sample because the described method of data analysis supports the use of scarce, incomplete and uncertain data. The identified attributes were tested in a survey to determine the extent to which each attribute contributes to a sense of insecurity in space. The tested attributes were ranked on a scale of 1 to 7 [
46].
3. Results
3.1. Analysis Based on Input Data
In the first stage of the study, brainstorming, a heuristic technique for solving research problems, was used to identify attributes that contribute to a sense of insecurity in urban space (the selection of the respondents was described in
Section 2.2). The following geospatial attributes (variables) which influence the respondents’ sense of insecurity in urban space were identified:
- –
unlit streets (X1),
- –
clubs, pubs, 24/7 shops, alcohol shops (X2),
- –
unmanaged green areas (X3),
- –
neglected buildings (damaged exterior, window and door frames) (X4),
- –
vacant buildings, ruins (X5).
- –
trampled paths (X6),
- –
walled structures for waste containers (X7),
- –
narrow passages between buildings (X8),
- –
proximity of a cemetery (X9),
- –
unguarded car parks (X10).
- –
residential buildings without intercoms, gates or inner courts (X11),
- –
embankments (X12),
- –
other (underpass, bridge, etc.) (X13),
- –
forests, parks (X14),
- –
graffiti (X15).
- –
bus stop shelters (X16),
- –
illegal waste dumping sites (X17).
The next stage of the study involved a survey during which the respondents ranked each of the identified attributes on a scale of one to seven, where one denoted attributes that were least important and seven represented attributes that were most important for perceptions of insecurity in space. The results of the survey were applied in a GRA-type research procedure (described in
Section 2.1). The value of the similarity coefficient
ε between observation vectors containing information about the sense of insecurity in space (
X0) and the adopted geospatial attributes (
X1,
X2,…
X17) was calculated in the last step of the procedure (
Table 1).
The extent to which the evaluated attributes influence the sense of insecurity in public space was determined in the last step of the procedure. The strength of the relationships between attributes X1, X2, X3, … X17 and the sense of insecurity X0 was determined in the following order: Ɛ01 > Ɛ02 > Ɛ05 > Ɛ14 > Ɛ06 > Ɛ13 > Ɛ04 > Ɛ11 > Ɛ08 > Ɛ10 > Ɛ09 > Ɛ03 > Ɛ07 > Ɛ12 > Ɛ17 > Ɛ16 > Ɛ15.
The generated model indicates that the following attributes are most likely to contribute to a sense of insecurity in urban space: Unlit streets (X1); clubs, pubs, 24/7 shops, alcohol shops (X2); and vacant buildings, ruins (X5), for which the value of the similarity coefficient Ɛ reached 0.7805, 0.6778 and 0.6312, respectively. Perceptions of insecurity were least likely to be influenced by: Graffiti (X15), bus stop shelters (X16) and illegal waste dumping sites (X17), for which the value of Ɛ was determined at X15 = 0.5600, X16 =0.5646 and X17 = 0.5708. Forests, parks (X14, Ɛ = 0.6177) and trampled paths (X6, z Ɛ = 0.6109) also exerted a considerable influence on the respondents’ sense of insecurity.
3.2. Analysis Based on the Number of Observations
In the next stage of the study, the sequence of values of the similarity coefficient ε was analyzed in terms of the number of observations included in the model. Models were developed for 4, 5, 10, 15, 20, 25, 30, 35, 40, 45, 50 and 55 observations, and the absolute degree of similarity ε was determined in each model. The value of ε in a model with 60 observations was also included in
Table 2.
The sequence of the calculated values of the similarity coefficient ε representing the strength of the analyzed relationships was then determined in terms of the number of observations (
Table 3).
4. Discussion
The analysis revealed that the first four values in the sequence of values of the similarity coefficient ε representing the strength of the analyzed relationships were identical in models with 15 and more observations (Ɛ01 > Ɛ02 > Ɛ05 > Ɛ14). In turn, the last three values of ε were identical in models with 25 and more observations (Ɛ17 > Ɛ16 > Ɛ15).
The order of the strength of relationships was stable for 10 attributes that were most important for perceptions of security in space in a model with 25 observations (Ɛ
01 > Ɛ
02 > Ɛ
05 > Ɛ
14 > Ɛ
06 > Ɛ
13 > Ɛ
11 > Ɛ
04 > Ɛ
08 > Ɛ
10). The three least important attributes in the model were also characterized by a stable sequence (Ɛ
17 > Ɛ
16 > Ɛ
15) (
Table 3).
According to the respondents, the following factors were most likely to evoke the feeling of insecurity in urban spaces: X1 (unlit streets), where Ɛ was determined in the range of 0.7762 to 0.8333, and X2 (club, pub, 24/7 shop, alcohol shop), where Ɛ ranged from 0.6706 to 0.7024. These attributes were followed by: X5 (vacant buildings, ruins) with Ɛ values of 0.6312–0.6491; X14 (forests, parks) with Ɛ values of 0.6160–0.6328; X6 (trampled paths) with Ɛ values of 0.6066 to 0.62781; and X13 (other, such as underpasses and bridges) with Ɛ values of 0.6052–0.6241. The values of Ɛ ranged from 0.5835 to 0.6011 for X11 (residential buildings without intercoms, gates or inner courts), X4 (neglected buildings with damaged exterior, window and door frames), X8 (narrow passages between buildings) and X10 (unguarded car parks). The above attributes contributed to a sense of insecurity in space. The following attributes were least associated with perceptions of insecurity: X17 (illegal waste dumping sites) with Ɛ values of 0.5708–0.5872; X16 (bus stop shelters) with Ɛ values of 0.5646–0.57491; and X15 (graffiti) with Ɛ values of 0.5600–0.5694.
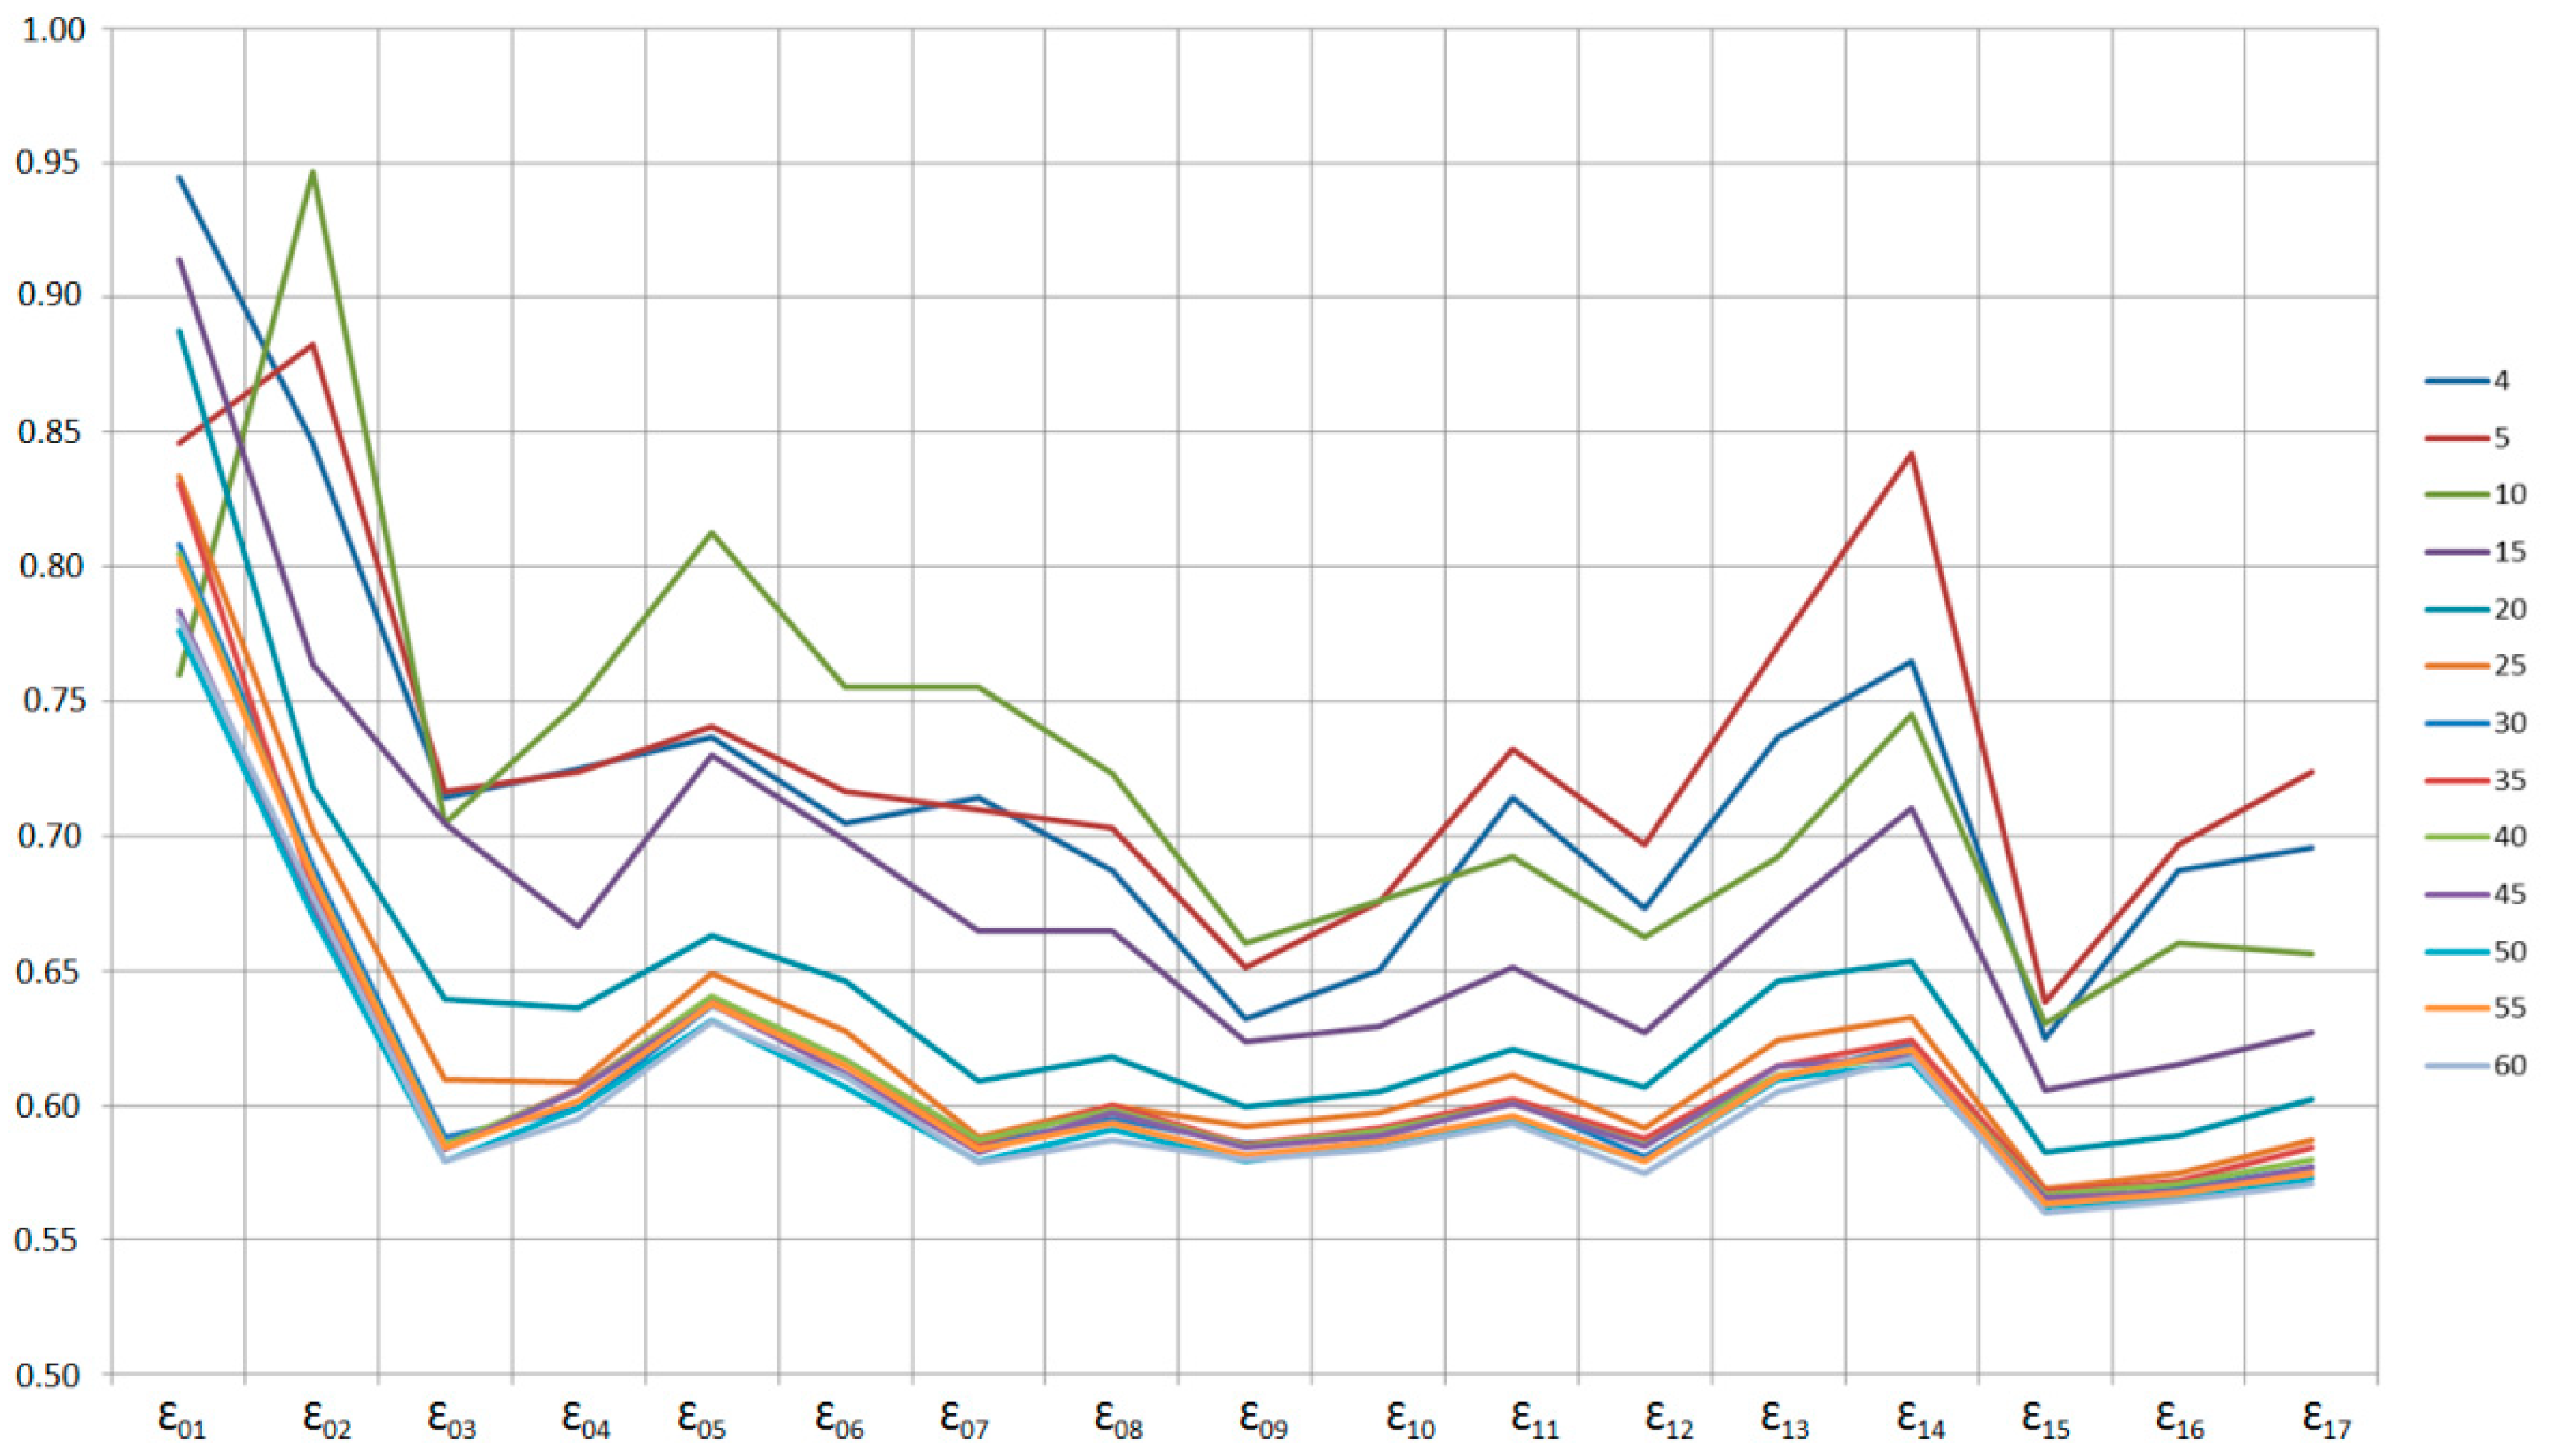
The lines representing the values of the coefficient of similarity had a similar shape in most of the analyzed cases (
Figure 2).
The lines representing the values of Ɛ in models with 4, 5, 10 and 15 observations (four top trend lines in
Figure 2) diverge from the lines plotted for models with 25 to 60 observations (bottom lines in
Figure 2). The shape of the line denoting the model with 20 observations is similar to the line representing models with 25 to 60 observations. These results indicate that for 17 evaluated attributes, the Grey Relational Analysis supports the generation of a stable model—a sequence of the values of the similarity coefficient Ɛ denoting the strength of relationships for 25 observations.
5. Conclusions
The article describes strategies for creating safe urban spaces, statistical methods for analyzing spatial data, as well as the major tenets of the GST which facilitates analyses of scarce, incomplete and uncertain data. Recent research and practical applications have demonstrated that unlike statistical methods, grey systems do not require the formulation of theoretical assumptions, and that the generated results are reliable despite a small number of observations.
The aim of the present analysis was to create a reliable grey system model for predicting a system’s behavior and supporting present or future decisions based on the sequence of values of the similarity coefficient Ɛ representing the strength of the relationships between the evaluated attributes. Data for the analysis were acquired with the use of heuristic methods in a survey of an accidental (convenience) sample. Therefore, the examined data were scarce, incomplete and uncertain, and the examined attributes were arranged in a sequence based on the significance of the relationships between the studied variables. Geospatial attributes influence perceptions of security in urban areas, and the GRA approach can be used in analyses of geospatial data to promote rational urban management in the context of safety. The resulting information can be used in the decision-making process during urban planning, in particular to identify priorities in urban management. This is a valid concern because perceptions of safety are deteriorating among urban dwellers, and many decision-makers fail to recognize the severity of this crisis.
The significance of the examined attributes determined based on the values of the coefficient of similarity Ɛ facilitates the generation of decision rules which can be used to create expert systems, make strategic decisions, identify rules and observations in data sets, and preselect data for building various types of models. According to the surveyed respondents, the following factors were most likely to negatively affect perceptions of safety in urban spaces: Unlit streets, presence of clubs, pubs and shops selling alcohol round the clock, vacant buildings, ruins, forests and parks, as well as urban structures such as underpasses and bridges. In the respondents’ opinions, illegal waste dumping sites, bus stop shelters and graffiti were least likely to contribute to the feeling of insecurity in cities. The results of the presented survey indicate that the GST, including the GRA approach, can be effectively used to optimize urban planning solutions in the context of safety.
Potential users of space have different perceptions of safety. Urban structures and spaces also differ in terms of management and maintenance. Analyses of public perceptions of safety require information that pertains to a given location and a given point in time. Surveys of social preferences are expensive and laborious. This study proposes a simple method for generating data that can be used in numerous fields of research. The GRA approach facilitates the determination of the relationships between various factors and their influence on the examined system. The processed data can be used to evaluate the interdependencies between observation vectors, to predict the system’s responses to various situations, and make optimal decisions without the need for complex statistical analyses. In the GRA approach, analyses of scarce, incomplete and uncertain data produce reliable results.
In analytical methods based on the GST, there are no quantitative limits on the number of representative samples, and samples are free of the constraints that are imposed by statistical methods. The application of the grey systems methodology supports the determination of minimal data sets (data minimization). As demonstrated in this study, a minimum number of observations n ≥ 4 required for the use of GST was not applicable. When 17 attributes were examined with the use of a GRA-type system, a relatively stable sequence of values of the similarity coefficient Ɛ relation was obtained for 25 observations included in the model. The GRA approach is easier to implement than popular statistical methods such as regression analysis because the significance of 10–20 factors can be determined by analyzing the preferences of several dozen respondents.
Author Contributions
Conceptualization, M.G.-G. and D.G.; methodology, M.G.-G.; software, D.G.; validation, M.G.-G., D.G.; formal analysis, M.G.-G.; investigation, M.G.-G., D.G.; resources, M.G.-G.; data curation, D.G.; writing original draft preparation, M.G.-G.; writing review and editing, D.G.; visualization, D.G.; supervision, M.G.-G. and D.G.; project administration, M.G.-G. All authors have read and agreed to the published version of the manuscript.
Funding
This research received no external funding.
Institutional Review Board Statement
Not applicable.
Informed Consent Statement
Not applicable.
Data Availability Statement
Not applicable.
Conflicts of Interest
The authors declare no conflict of interest. The funders had no role in the design of the study; in the collection, analyses, or interpretation of data; in the writing of the manuscript, or in the decision to publish the results.
References
- Jeleński, T.; Kosiński, W. Jak Przetworzyć Miejsce. Podręcznik Kreowania Udanych Przestrzeni Publicznych; Wydanie Polskie—Fundacja Partnerstwo dla Środowiska, Druk:BROS s.c.; Project for Public Spaces, Inc.: Kraków, Poland, 2009; ISBN 978-83-925189-9-0. [Google Scholar]
- Głowacki, R.; Łojek, K.; Urban, A. Wpływ Ukształtowania Przestrzeni Fizycznej na Zapobieganie Przestępstwom i Wykroczeniom; Wydawnictwo Wyższej Szkoły Policji: Szczytno, Poland, 2008. [Google Scholar]
- Mordwa, S. Bezpieczeństwo a Kształtowanie Przestrzeni; Artykuł Naukowy Repozytorium Uniwersytetu Łódzkiego: Łódź, Poland, 2009; Available online: http://hdl.handle.net/11089/1748 (accessed on 6 May 2020).
- Czarnecki, B.; Siemiński, W. Kształtowanie Bezpiecznej Przestrzeni Publicznej; Wydawnictwo Difin: Warszawa, Poland, 2004. [Google Scholar]
- Łojek, K. Zapobieganie Przestępczości Przez Kształtowanie Bezpiecznej Przestrzeni; Przegląd Policyjny: Szczytno, Poland, 2004. [Google Scholar]
- Osika, G. Graffiti—Znaki miasta (Graffiti—Signs of the City); Zeszyty Naukowe Politechniki Śląskiej, Seria Organizacja i Zarządzanie: Gliwice, Poland, 2008; Volume 43, pp. 125–146. [Google Scholar]
- Bajerowski, T.; Chojka, A.; Gerus-Gościewska, M.; Gościewski, D.; Kowalczyk, A.; Krajewska, M.; Parzyński, Z.; Szopińska, K.; Świtała, K. GIS and Various Approaches of Safety Management; GIS Forum, Croatian, Information Technology Society, Nacionalna Knjiżnica Zagreb: Zagreb, Croatia, 2015. [Google Scholar]
- Kelling, G.L.; Cole, C.M. Wybite Szyby. Jak Zwalczać Przestępczość i Przywrócić ład w Najbliższym Otoczeniu; Wydawnictwo Media Rodzina: Poznań, Poland, 2000. [Google Scholar]
- Deng, J.L. Introduction to Grey System Theory. J. Grey Syst. 1989, 1, 1–24. [Google Scholar]
- Liu, S.F.; Lin, Y. Grey Systems—Theory and Applications; Springer: Berlin, Germany, 2010. [Google Scholar]
- Forrest, J.; Liu, S.F. A Brief Introduction to Grey Systems Theory, Grey Systems: Theory and Applications. In Proceedings of the 2011 IEEE International Conference on Grey Systems and Intelligent Services, Nanjing, China, 15–18 September 2011; Volume 2. [Google Scholar]
- Dytczak, M.; Ginda, G. Użyteczność systemów “szarych” w transporcie i logistyce. Logistyka 2014, 3, 1515–1523. [Google Scholar]
- Deng, J. Application of Grey System Theory in China. In Proceedings of the First International Symposium on Uncertainty Modeling and Analysis, College Park, MD, USA, 3–5 December 1990. [Google Scholar]
- Donaj, Ł. Teoria szarych systemów a prognozowanie w naukach społecznych przyczynek do dyskusji. Przegląd Strateg. 2017, 7, 43–52. [Google Scholar] [CrossRef]
- Liu, X.Q.; Wang, Z.M. Grey Econometric Models and Applications; Yellow River Press: Jinan, China, 1996. [Google Scholar]
- Liu, S.F.; Dang, Y.G.; Li, B.J. Computational analysis on the periodic contribu-tion of technological advances in Henan Province. J. Henan Agric. Univ. 1998, 32, 203–207. [Google Scholar]
- Chen, K.X. The Epistemology of Grey Medical Analysis. Ph.D. Thesis, Huazhong University of Science and Technology, Wuhan, China, 1999. [Google Scholar]
- Tan, X.R. Grey Medical Incidence Theory and Applications. Ph.D. Thesis, Huazhong University of Science and Technology, Wuhan, China, 1997. [Google Scholar]
- Werner, K.; Mierzwiak, R.; Pochmara, J. Teoria systemów szarych jako narzędzie wspomagania prognozowania popytu. Logistyka 2009, 2, CD-CD. [Google Scholar]
- Wang, Z.X.; Pei, L.L. System thinking—Based grey model for sustainability evaluation of urban tourism. Kybernetes 2014, 43, 462–479. [Google Scholar] [CrossRef]
- Yang, Y.; Wang, S.W.; Hao, N.L.; Shen, X.B.; Qi, X.H. Online noise source identification based on power spectrum estimation and grey relational analysis. Appl. Acoust. 2009, 7, 493–497. [Google Scholar] [CrossRef]
- Podręcznik Internetowy ze Statystyki StatSoft. Available online: http://www.statsoft.pl/textbook/stathome.htm (accessed on 10 November 2019).
- Cempel, C. Teoria szarych systemów—Nowa metodologia analizy i oceny złożonych systemów. Przegląd możliwości. Zesz. Nauk. Politech. Poznańskiej 2014, 63, 9–20. [Google Scholar]
- Gerus-Gościewska, M.; Gościewski, D.; Bajerowski, T.; Szczepańska, A. Grey System Theory in Research into Preferences Regarding the Location of Place of Residence within a City. ISPRS Int. J. Geo-Inf. 2019, 8, 563. [Google Scholar] [CrossRef] [Green Version]
- Swamy, P. Statistical Inference in Random Coefficient Models; Springer: Berlin, Germany, 1971. [Google Scholar]
- Caseti, E. Generating models by the expansion method: Applications to geographic research. Geogr. Anal. 1972, 4, 81–91. [Google Scholar] [CrossRef]
- Anselin, L. Spatial Econometrics: Methods and Models; Kluwer Academic Publishers: Dordrecht, The Netherlands, 1988. [Google Scholar]
- Haining, R. Spatial Analysis of Regional Geostatistics Data; Cambridge University Press: Cambridge, UK, 2003. [Google Scholar]
- Gerus-Gościewska, M.; Gościewski, D.; Salata, T.; Palicki, S.; Prus, B.; Gawroński, K.; Konieczna, J.; Jaroszewicz, J.; Wilkosz-Mamcarczyk, M.; Król, K. Interpretacja Danych Przestrzennych Jako Forma Stymulowania Partycypacji Społecznej; Wydawnictwo Uniwersytetu Rolniczego: Kraków, Poland, 2015. [Google Scholar]
- Bajerowski, T.; Biłozor, A.; Cieślak, I.; Senetra, A.; Szczepańska, A. Ocena i Wycena Krajobrazu; Wydawnictwo Educaterra: Olsztyn, Poland, 2007. [Google Scholar]
- Bajerowski, T.; Bal, A.; Biłozor, A.; Gerus-Gościewska, M.; Sidor, I.; Szurek, M.; Turkowska, O.; Wielgorz, A. Teoretyczne Podstawy Teorii Gospodarki Przestrzennej i Zarządzania Przestrzenią; Bajerowski, T., Ed.; Podręcznik Akademicki, Wydawnictwo UWM: Olsztyn, Poland, 2003. [Google Scholar]
- Górniak-Zimroz, J. Wykorzystanie systemów wspomagania decyzji w gospodarce odpadami. Pr. Nauk. Inst. Górnictwa Politech. Wrocławskiej Studia Mater. 2007, 118, 23–41. [Google Scholar]
- Liu, S.; Lin, Y. Grey Information. In Theory and Practical Applications; Springer: Berlin, Germany, 2006. [Google Scholar]
- Kotkowski, B.; Ratajczak, W. Zbiory Przybliżone w Analizie Danych Geograficznych. Możliwości i Ograniczenia Zastosowań Metod Badawczych w Geografii Społeczno-Ekonomicznej i Gospodarce Przestrzennej; Rogacki, H., Ed.; Bogucki Wydawnictwo Naukowe: Poznań, Poland, 2002. [Google Scholar]
- d’Amato, M. Rough Set Theory as Property Valuation Methodology: The Whole Story. Mass Appraisal Methods. An International Perspective for Property Valuers; Kauko, T., d’Amato, M., Eds.; Blackwell Publishing, RICS Research: Oxford, UK, 2008. [Google Scholar]
- Zieliński, W. Analiza Regresji; Fundacja “Rozwój SGGW”: Warszawa, Poland, 1998. [Google Scholar]
- Herman, B. Problemy Interpretacji Wyników Metod Badawczych Stosowanych w Geografii Społeczno-Gospodarczej i Gospodarce Przestrzennej; Bogucki Wydawnictwo Naukowe: Poznań, Poland, 2003. [Google Scholar]
- Deng, J.L. Control Problems of Grey Systems. Syst. Control Lett. 1982, 1, 5. [Google Scholar]
- Mierzwiak, R.; Werner, K.; Pochmara, A. Zastosowanie teorii systemów szarych do prognozowania ekonomicznych szeregów czasowych. In Proceedings of the IV Krakowska Konferencja Młodych uczonych, Sesja Plenarna Nauki Ekonomiczne, Kraków, Poland, 17–19 September 2009. [Google Scholar]
- Barczak, S. Zastosowanie teorii szarych systemów do przewidywania przyszłych ofert składanych na aukcjach pierwszej ceny poprzez pryzmat modelu szarego GM(1,1). In Studia Ekonomiczne. Innowacje w Finansach i Ubezpieczeniach—Metody Matematyczne i Informatyczne; Mika, J., Dziwok, J., Wydawnictwo, E., Eds.; Uniwersytetu Ekonomicznego w KatowicachKatowice: Katowice, Poland, 2013. [Google Scholar]
- Barczak, S. Gold price forecasting using grey model GM(1,1) and selected classical time series models. A comparison of methods. In Proceedings of the 8th International Days of Statistics and Economics, Prague, Czech Republic, 11–13 September 2014; pp. 66–73. [Google Scholar]
- Mazurek-Łopacińska, K. Badania Marketingowe. Teoria i Praktyka; PWN: Warszawa, Poland, 2005. [Google Scholar]
- Wasilewska, E. Descriptive Statistics Not Only for Sociologists; SGGW: Warszawa, Poland, 2008. [Google Scholar]
- Matryniak, Z. Metody Organizacji i Zarządzania; Akademia Ekonomiczna w Krakowie: Kraków, Poland, 1999. [Google Scholar]
- Gołaś, H.; Mazur, A. Zasady, Metody i Techniki Wykorzystywane w Zarządzaniu Jakością; Wydawnictwo Politechniki Poznańskiej: Poznań, Poland, 2010. [Google Scholar]
- Bielecka, A. Statystyka w Biznesie i Ekonomii. Teoria i Praktyka; Wydawnictwo WSPiZ im. Leona Koźmińskiego: Warszawa, Poland, 2005. [Google Scholar]
| Publisher’s Note: MDPI stays neutral with regard to jurisdictional claims in published maps and institutional affiliations. |
© 2021 by the authors. Licensee MDPI, Basel, Switzerland. This article is an open access article distributed under the terms and conditions of the Creative Commons Attribution (CC BY) license (http://creativecommons.org/licenses/by/4.0/).


