Article

Application of Drone and WorldView-4 Satellite Data in Mapping and Monitoring Grazing Land Cover and Pasture Quality: Pre- and Post-Flooding

Department of Agricultural and Environmental Sciences, College of Agriculture, Tennessee State University, Nashville, TN 37209, USA
*
Author to whom correspondence should be addressed.
Submission received: 18 February 2021 / Revised: 15 March 2021 / Accepted: 17 March 2021 / Published: 20 March 2021

Abstract

:
Frequent flooding worldwide, especially in grazing environments, requires mapping and monitoring grazing land cover and pasture quality to support land management. Although drones, satellite, and machine learning technologies can be used to map land cover and pasture quality, there have been limited applications in grazing land environments, especially monitoring land cover change and pasture quality pre- and post-flood events. The use of high spatial resolution drone and satellite data such as WorldView-4 can provide effective mapping and monitoring in grazing land environments. The aim of this study was to utilize high spatial resolution drone and WorldView-4 satellite data to map and monitor grazing land cover change and pasture quality pre-and post-flooding. The grazing land cover was mapped pre-flooding using WorldView-4 satellite data and post-flooding using real-time drone data. The machine learning Random Forest classification algorithm was used to delineate land cover types and the normalized difference vegetation index (NDVI) was used to monitor pasture quality. This study found a seven percent (7%) increase in pasture cover and a one hundred percent (100%) increase in pasture quality post-flooding. The drone and WorldView-4 satellite data were useful to detect grazing land cover change at a finer scale.

1. Introduction

Flooding is becoming a frequent event in grazing land environments, especially with the changing climate. The response of grazing land cover to flooding events is complex and could be depended on several factors such as duration of flooding, plant species present, stand age, pasture vigor, stage of plant species development, and temperature [1,2]. For example, flooding that consists of standing water can be more harmful to grazing land cover such as pasture than flood moving water. This is because oxygen uptake during flood events by plant roots is severely restricted in standing water relative to moving water. Furthermore, standing water can also reduce the nutrient uptake of plants thereby affecting pasture quality [3]. In addition, during a standing flood event, sediment deposit increases, and this can suffocate plants thereby leading to a substantial loss in grazing land cover [2]. High-velocity flood water can also cause erosion, uproot trees, destroy natural levees, and affect vegetation cover thereby being a driving force of land cover and land-use change [4].
The use of high spatial resolution remotely sensed data from drones and satellites such as WorldView-4 can provide effective mapping and monitoring of grazing land environments. This is because high-resolution drones and satellites have the capability of capturing images at a finer scale. Furthermore, real-time drone images can be easily acquired over grazing land areas in less time. In addition, drones and satellite data are increasingly becoming less costly relative to field surveys for the mapping and monitoring of grazing land cover and pasture quality. Moreover, a plant’s vigor and health in grazing land environment can be easily monitored using drones and satellite vegetation indices including the normalized difference vegetation index (NDVI). The NDVI is a widely used vegetation quality index that is computed as the difference between near-infrared (NIR) and red reflectance divided by their sum [5,6]. The plant chlorophyll, which is a vital health indicator, strongly absorbs the visible red light of the electromagnetic spectrum, and the cellular structure of the leaves strongly reflects the near-infrared light. When the plant becomes stress through dehydration, lack of nutrients, and afflicted with diseases, the leaf structure deteriorates and the plant absorbs more of the near-infrared light rather than reflecting it. Therefore, examining how the near-infrared light changes relative to red light from plants in a multispectral remotely sensed image provides a better indication of the presence of chlorophyll which correlates with plant health and quality [6].
Some recent studies have used drones and WorldView series satellite data in mapping and monitoring grazing land environments [7,8,9,10,11]. Wiesmair et al. [9] used multispectral WorldView-2 satellite data to monitor vegetation cover in pasture grassland. Their vegetation cover map using WorldView-2 satellite data showed large areas of grassland degradation. Furthermore, Romoelo et al. [11] monitored pasture nutrients as indicators of rangeland quality using WorldView-2 satellite data. They found WorldView-2 spectral vegetation indices as useful variables in monitoring vegetation nutrients in grazing land environments. In addition, Michez et al. [8] mapped and monitored biomass in grazing land environments using drones. They found drones to be useful in grazing land cover mapping and characterizing pasture conditions.
Other studies have used NDVI as a measure of pasture quality and health [12,13,14]. Falldorf et al. [12] used NDVI and other vegetation indices to predict the quality of winter pastures for reindeer and caribou in the circumpolar region. They found NDVI useful to improve species’ management and conservation. Furthermore, Ndungu et al. [14] utilized NDVI as a measure in monitoring the quality and changes in vegetation and evaluating proxies for drought conditions in Kenyan rangelands. In addition, NDVI has also been used to estimate above-ground biomass in pastures [15,16,17,18]. For example, Theau et al. [15] used green NDVI in a regression prediction model to estimate the biomass of a pasture. Furthermore, Meshesha et al. [16] developed a relationship between NDVI and field plot datasets of above-ground biomass in pastures to estimate spatial aboveground rangeland biomass. They found NDVI useful in the estimation of aboveground forage biomass.
In addition to remotely sensed data and derived indices in pasture monitoring, machine learning technology applications for unmanned aerial vehicles (UAVs) in land cover and pasture quality mapping have also been utilized [19,20,21,22,23]. For example, Sandino et al. [20] used machine learning algorithms and drones to monitor invasive grasses and vegetation in remote arid lands. They detected and generated a pixel-wise segmentation of invasive grasses, using buffel grass (Cenchrus ciliaris) and spinifex (Triodia sp.) as examples. They found an individual detection rate of 97% for buffel grass and 96% for spinifex, with a global multiclass pixel-wise detection rate of 97%. However, this study did not monitor the quality of invasive grasses. Furthermore, Barnetson et al. [23] used drones and machine learning-based predictive models to map pasture quantity (biomass) and quality as the proportions of key pasture nutrients, across a selected range of field sites throughout the rangelands of Queensland. They found machine learning techniques useful to efficiently and accurately map pasture yield and quality at the field site scale.
Although drones, WorldView series satellite data, NDVI, and machine learning technology applications have been used in land cover and pasture quality mapping, there has been limited application in monitoring grazing land cover types and pasture quality pre-and post-flooding, especially in Tennessee. For example, do grazing land cover types and pasture quality change pre- and post-flooding events? This study aims to map and monitor grazing land cover and pasture quality pre- and post-flooding that occurred from 21st to the 26th of February, 2019, in Middle Tennessee, United States.

2. Materials and Methods
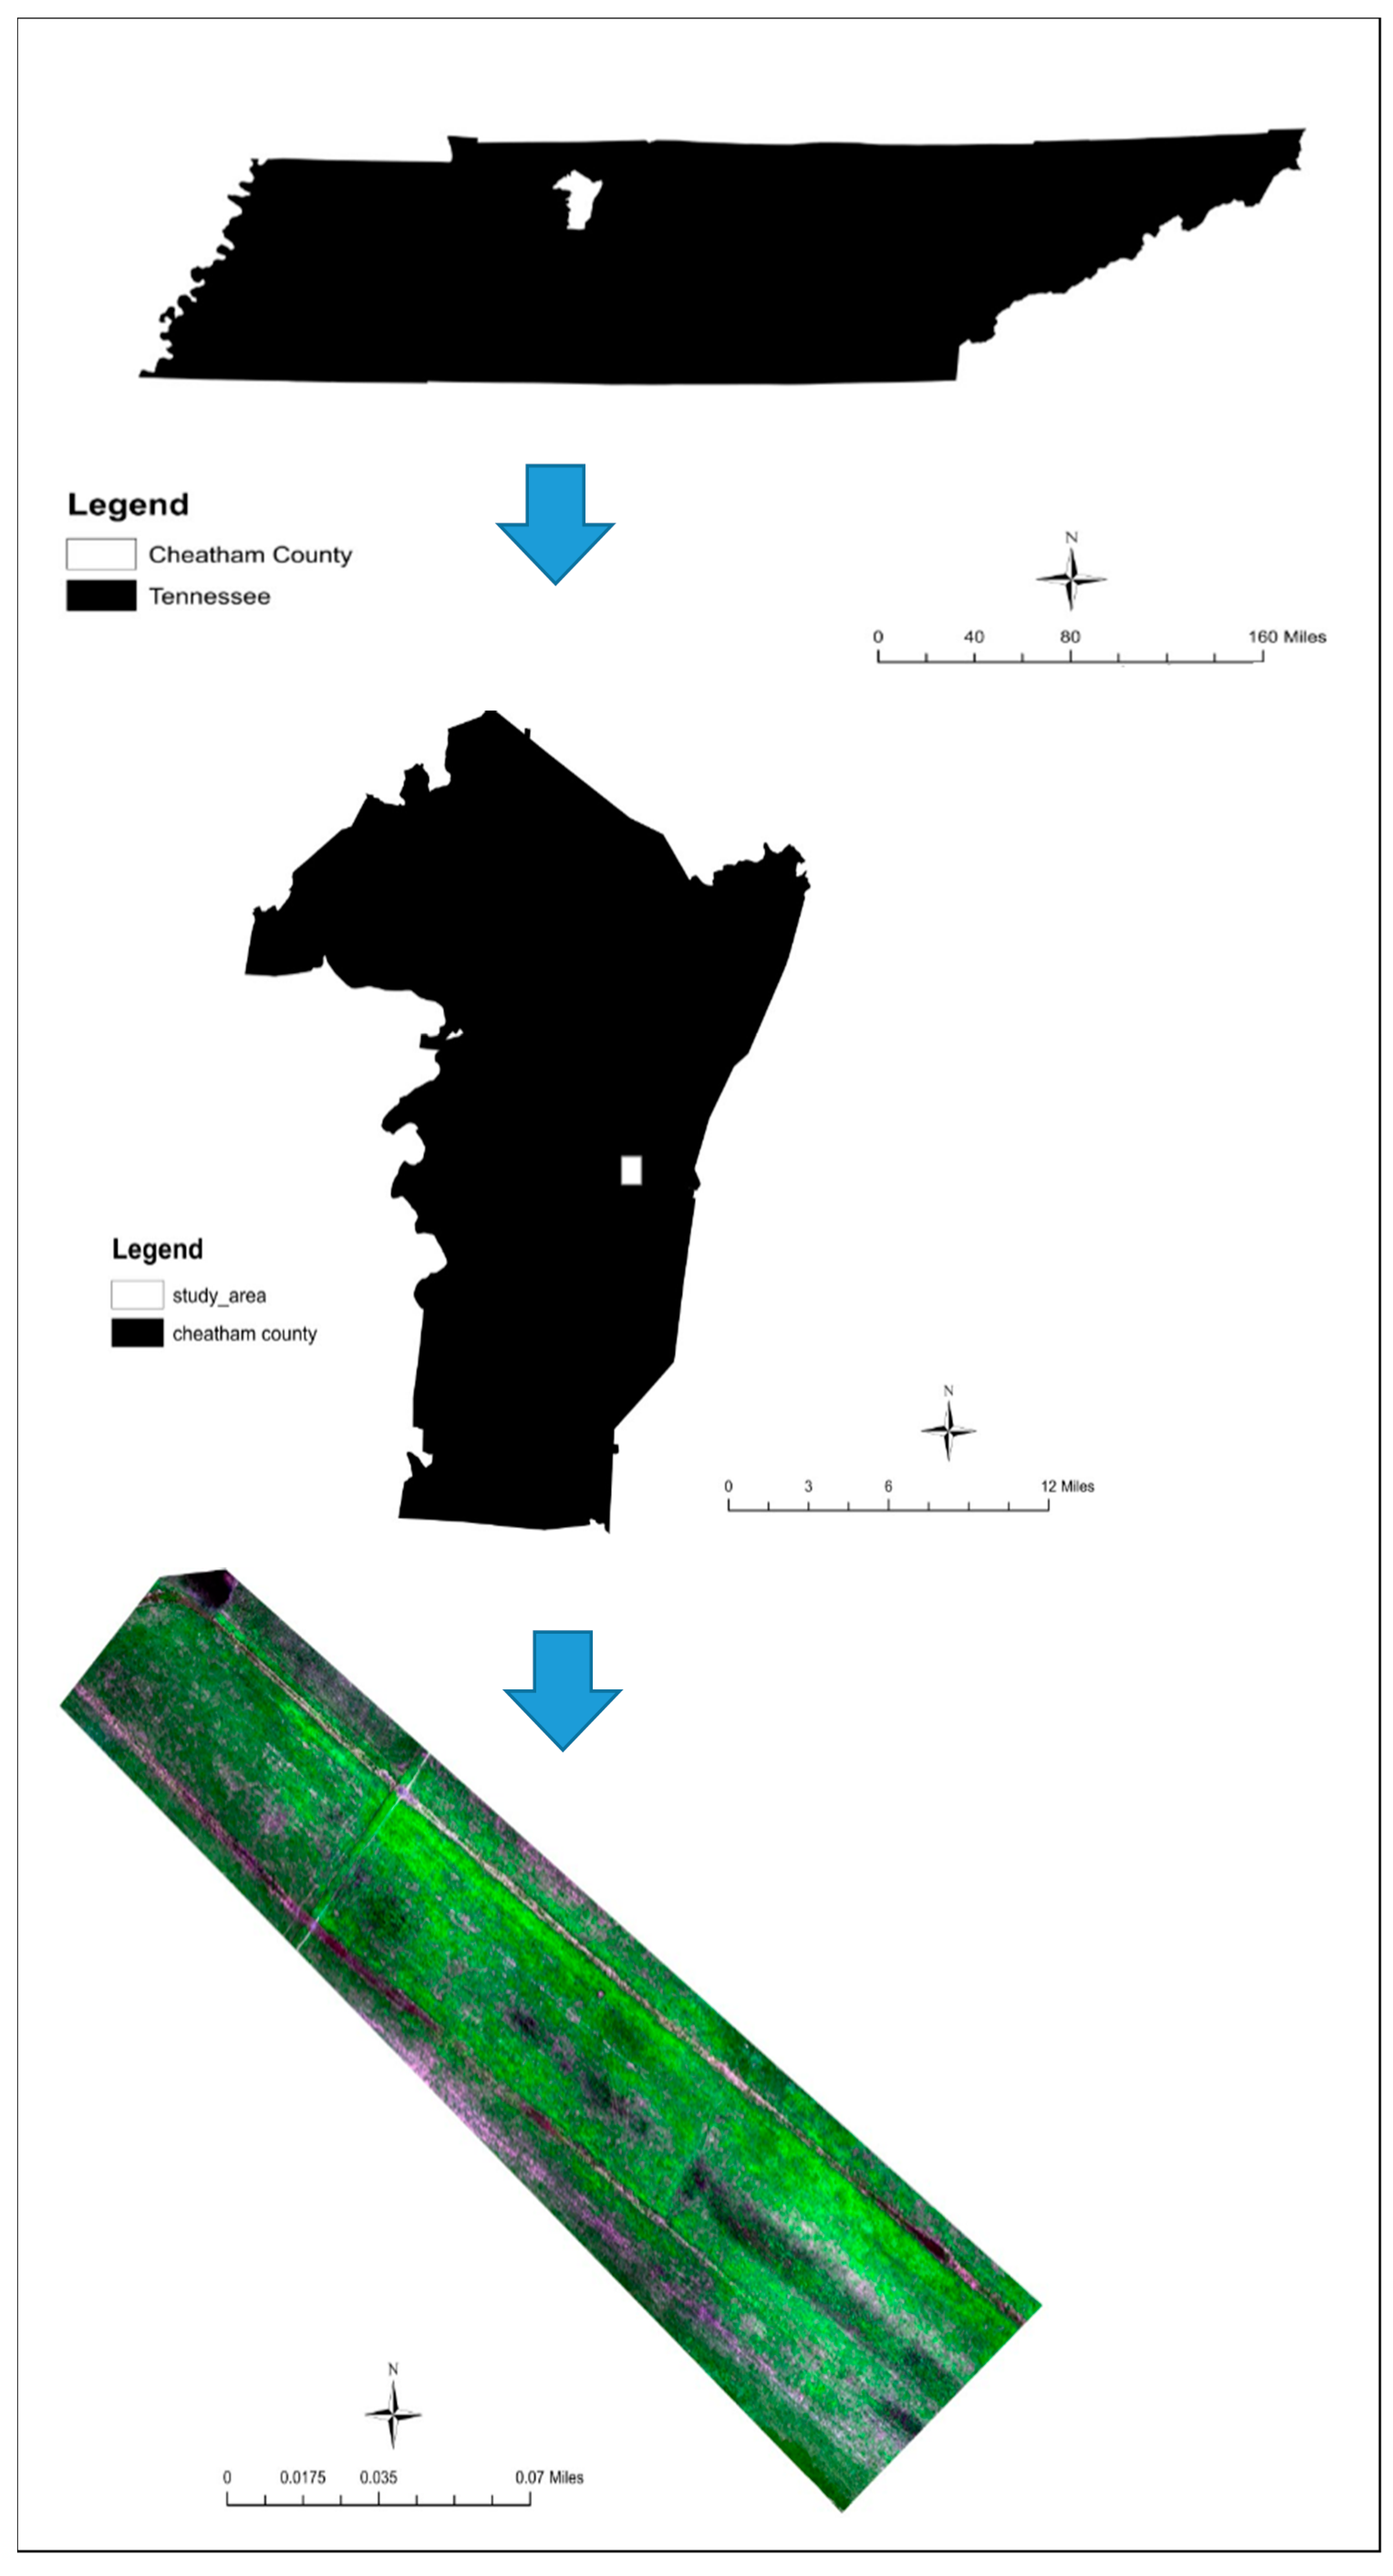
2.1. Study Area

This study area is located in Cheatham County, middle Tennessee (Figure 1). The county seat is Ashland City and is part of the Nashville-Davidson-Murfreesboro-Franklin, Tennessee Metropolitan Statistical area [24]. The grazing land location is close to the Cumberland River and is prone to flooding with an elevation of about 120 m above sea level. It is one of Tennessee State University’s farmland and beef cattle research stations with more than 10 dexter cattle grazing on the land. The cattle grazing pattern on the land is non-rotational.

2.2. Climate

The middle Tennessee region has a modest climatic condition with cool winter and warm summers [25]. The mean annual temperature in the region is 78 °F (26 °C) in summer and around 41 °F (5 °C) in winter. The yearly precipitation is about 51 inches (1300 mm) and is generally distributed evenly throughout the seasons [25]. The maximum monthly average precipitation (approximately 5.51 inches) usually occurs in the month of May and the minimum monthly average precipitation (about 3.03 inches) generally occurs in October [26]. Middle Tennessee generally experiences flooding from excessive rainfall that forces the Cumberland River and several others to go over their banks.

2.3. Geology, Soil, and Hydrology

The study area consists of a combination of gentle and highland terrains [25]. The highlands usually have acidic soils that are heavily leached, whereas the surrounding central basin is underlain by Ordovician limestone and has alkaline soils [27]. The gentle terrain and highlands are occasionally cut across by major rivers such as the Cumberland River which flows southwards [27]. The soil type in the grazing land environment is Melvin silt loam, which is frequently flooded [28]. It is a very deep, nearly level, and poorly drained soil along the Cumberland River. The soil surface layer (0–10 inches) is brown silt loam that has reddish-brown and grayish brown mottles. The soil has a moderate permeability and high available water capacity. Many of the streams in the region have been channelized to enhance drainage of adjacent wetlands for agricultural purposes. This has led to increasing downstream deposition of sediment thereby contributing to downstream flooding [29]. For example, in 2019, excessive rainfall occurred in Middle Tennessee that caused flooding and standing water that covered on average about 75% of the study area from 21st to the 26th of February 2019 (Figure 2). The standing water occupied about 100% of the area on 21st and 24th of February 2019; around 50% of the area on 25th of February and approximately 20% of the area on 26th of February 2019.

3. Methodology

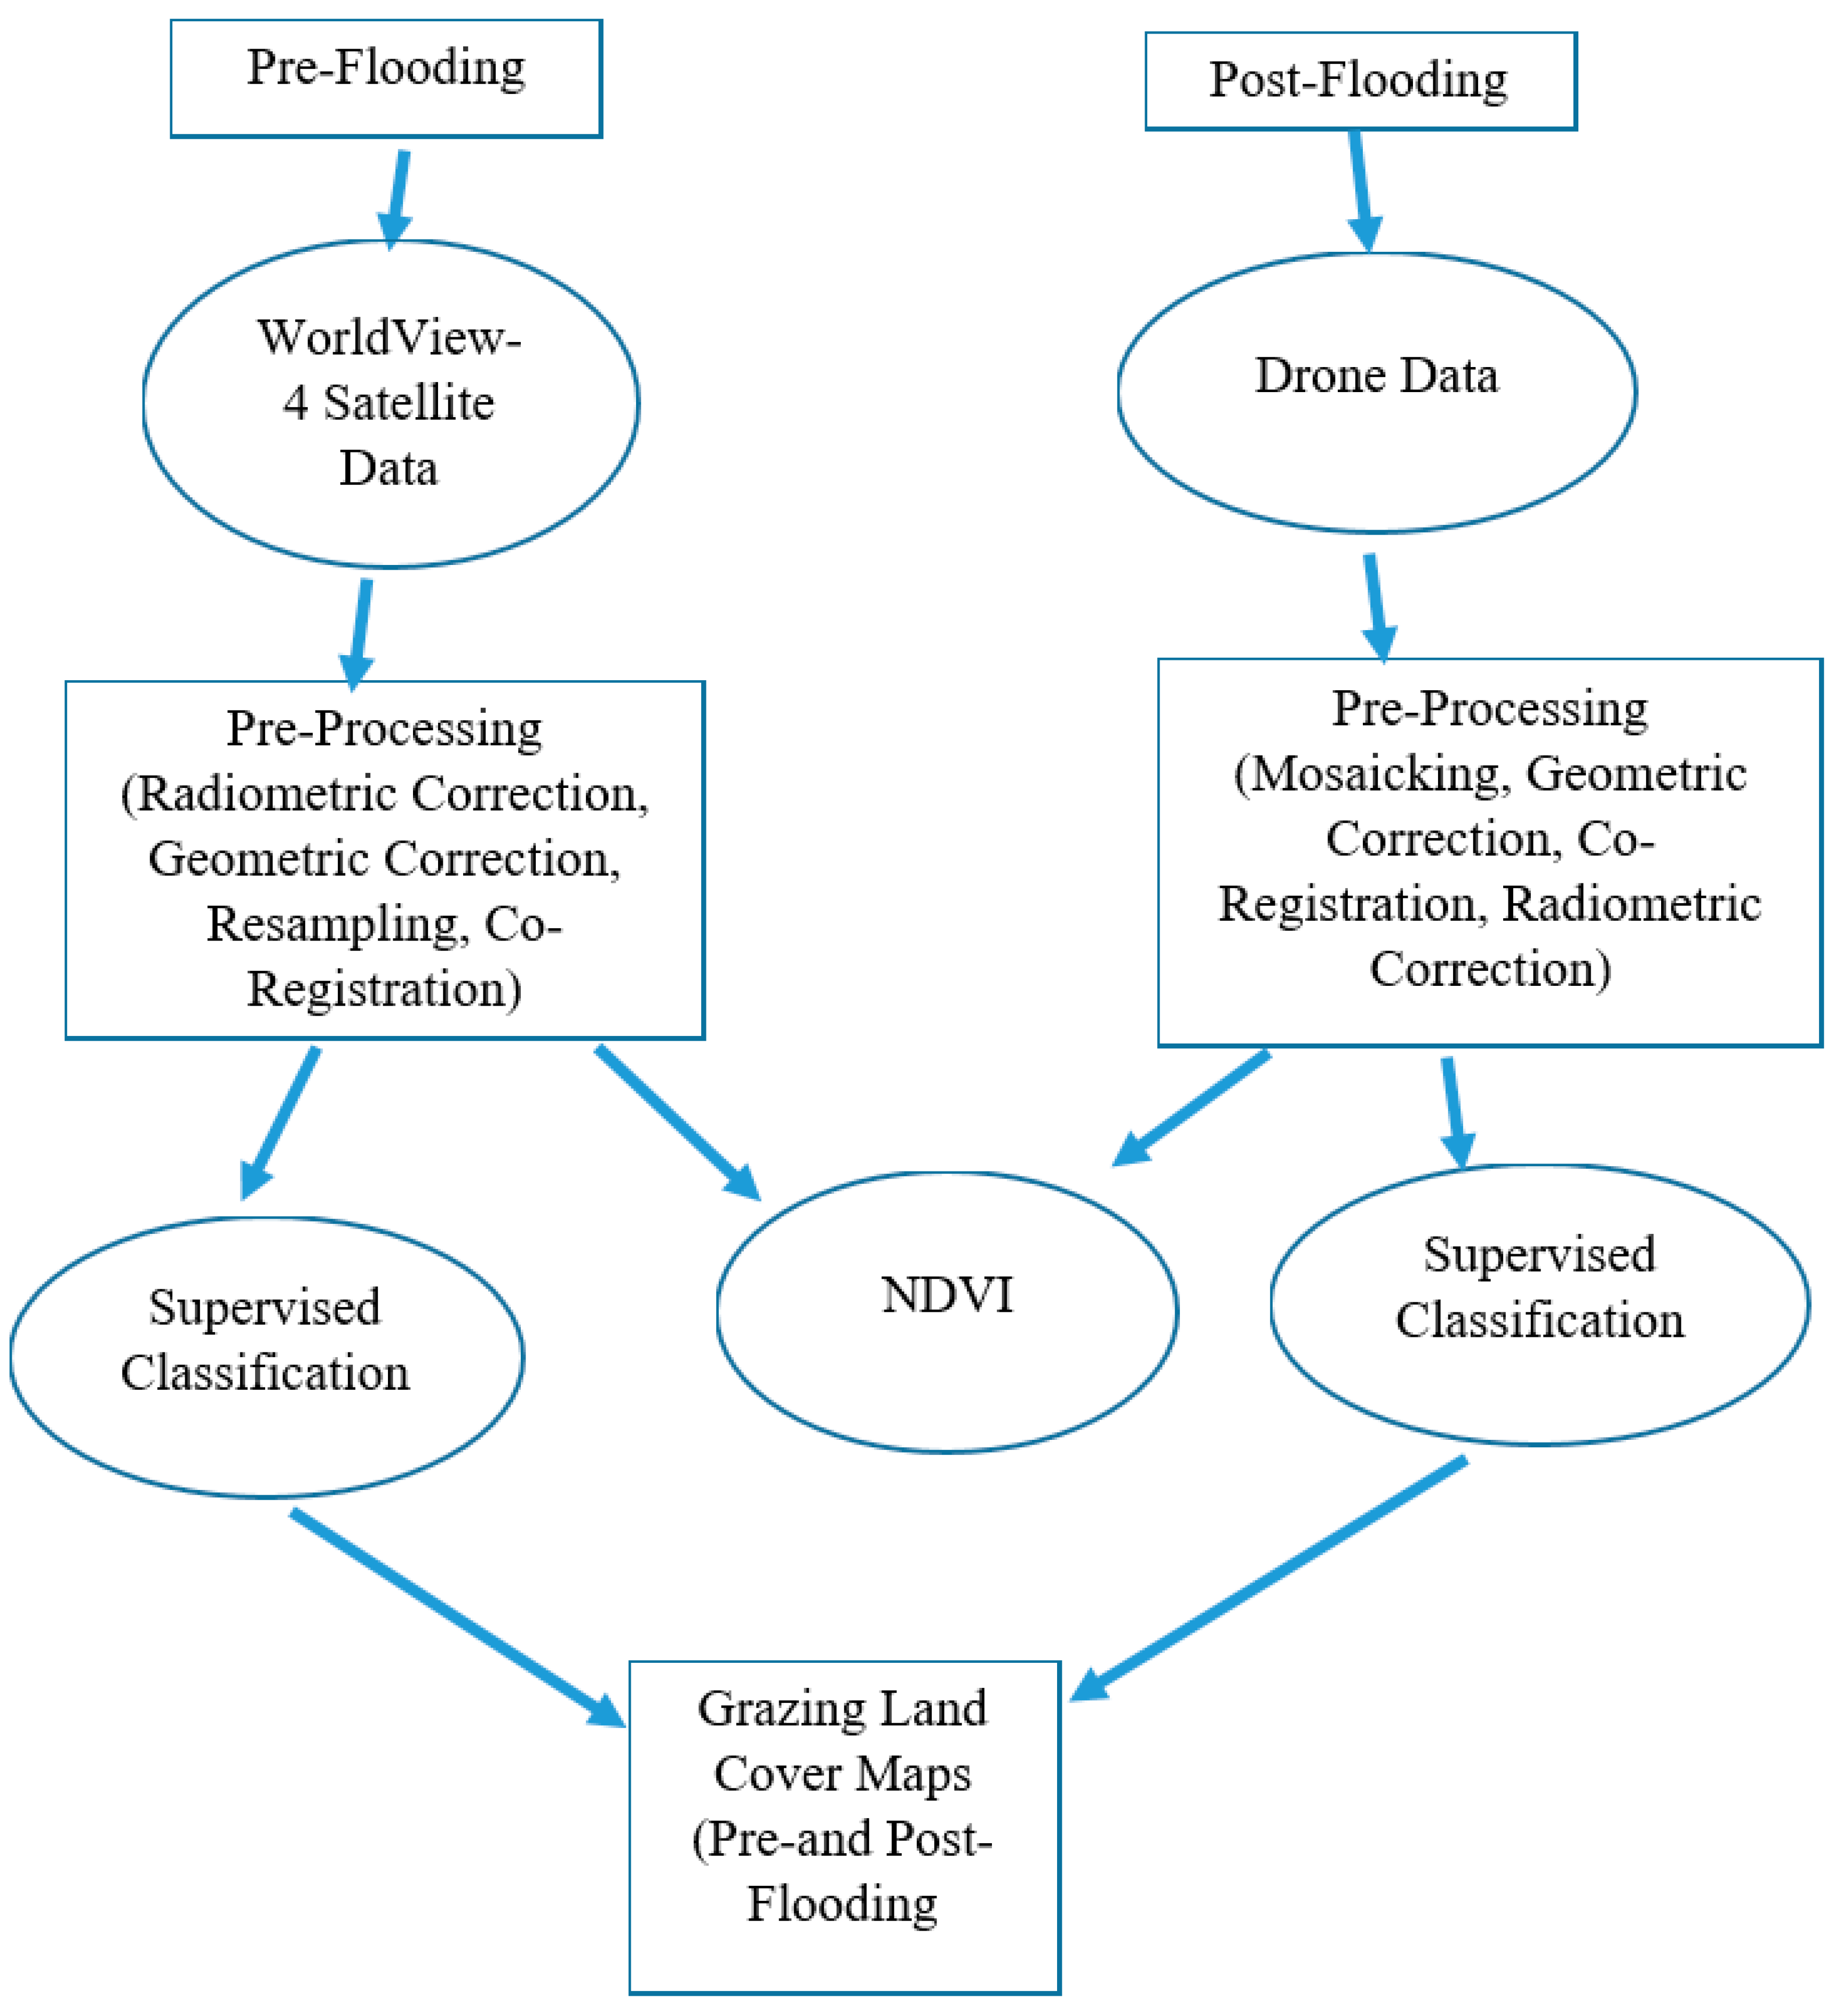
3.1. Mapping and Monitoring of Grazing Land Cover and Pasture Quality

The approach of mapping and monitoring grazing land cover pre- and post-flooding mainly involved the pre-processing, classification, and mapping of grazing land cover types using WorldView-4 satellite and drone data (Figure 3). The monitoring of pasture quality pre-and post-flooding was carried out using NDVI.

3.2. WorldView-4 Satellite Data

A scene of WorldView-4 satellite data covering the study area acquired on 17th November 2018 was used to map grazing land cover types pre-flooding. The WorldView-4 satellite data has a multispectral spatial resolution of 1.24 m and four spectral bands (blue, green, red, near-infrared), and a panchromatic band. The pre-processing of the WorldView-4 satellite data involved radiometric correction, geometric correction, resampling, and co-registration with drone aerial images. The radiometric calibration requires the correction of image pixel values for sun elevation angle variation and image calibration to account for sensor degradation over time. The changes in sensor calibration factors will obscure real changes on the ground [30]. The radiometric calibration was carried out by the conversion of digital number (DN) to at-surface reflectance using Equations (1) and (2) [31]. The geometric correction was carried out using greater than 50 ground control points and a root mean square (RMS) value of lower than 1 pixel. Furthermore, the 1.24 m spatial resolution WorldView-4 satellite imagery was resampled to an 8 cm image and co-registered to the 8 cm spatial resolution drone image.

3.3. Conversion of DN to Radiance

The top-of-atmosphere radiance, L, in units of W μm−1 m−2 sr−1, is generated by converting from DN using Equation (1) [31].
L = GAIN * DN (abscalefactor/effectivebandwidth) + OFFSET
where;
the DN is the pixel value found in the imagery,
the abscalefactor and effectivebandwidth are delivered in the imagery metadata for each band,
the GAIN = 1, and OFFSET = 0, represented the absolute radiometric calibration band dependent adjustment factors [31].

3.4. Conversion of Radiance to Top-of-Atmosphere Reflectance
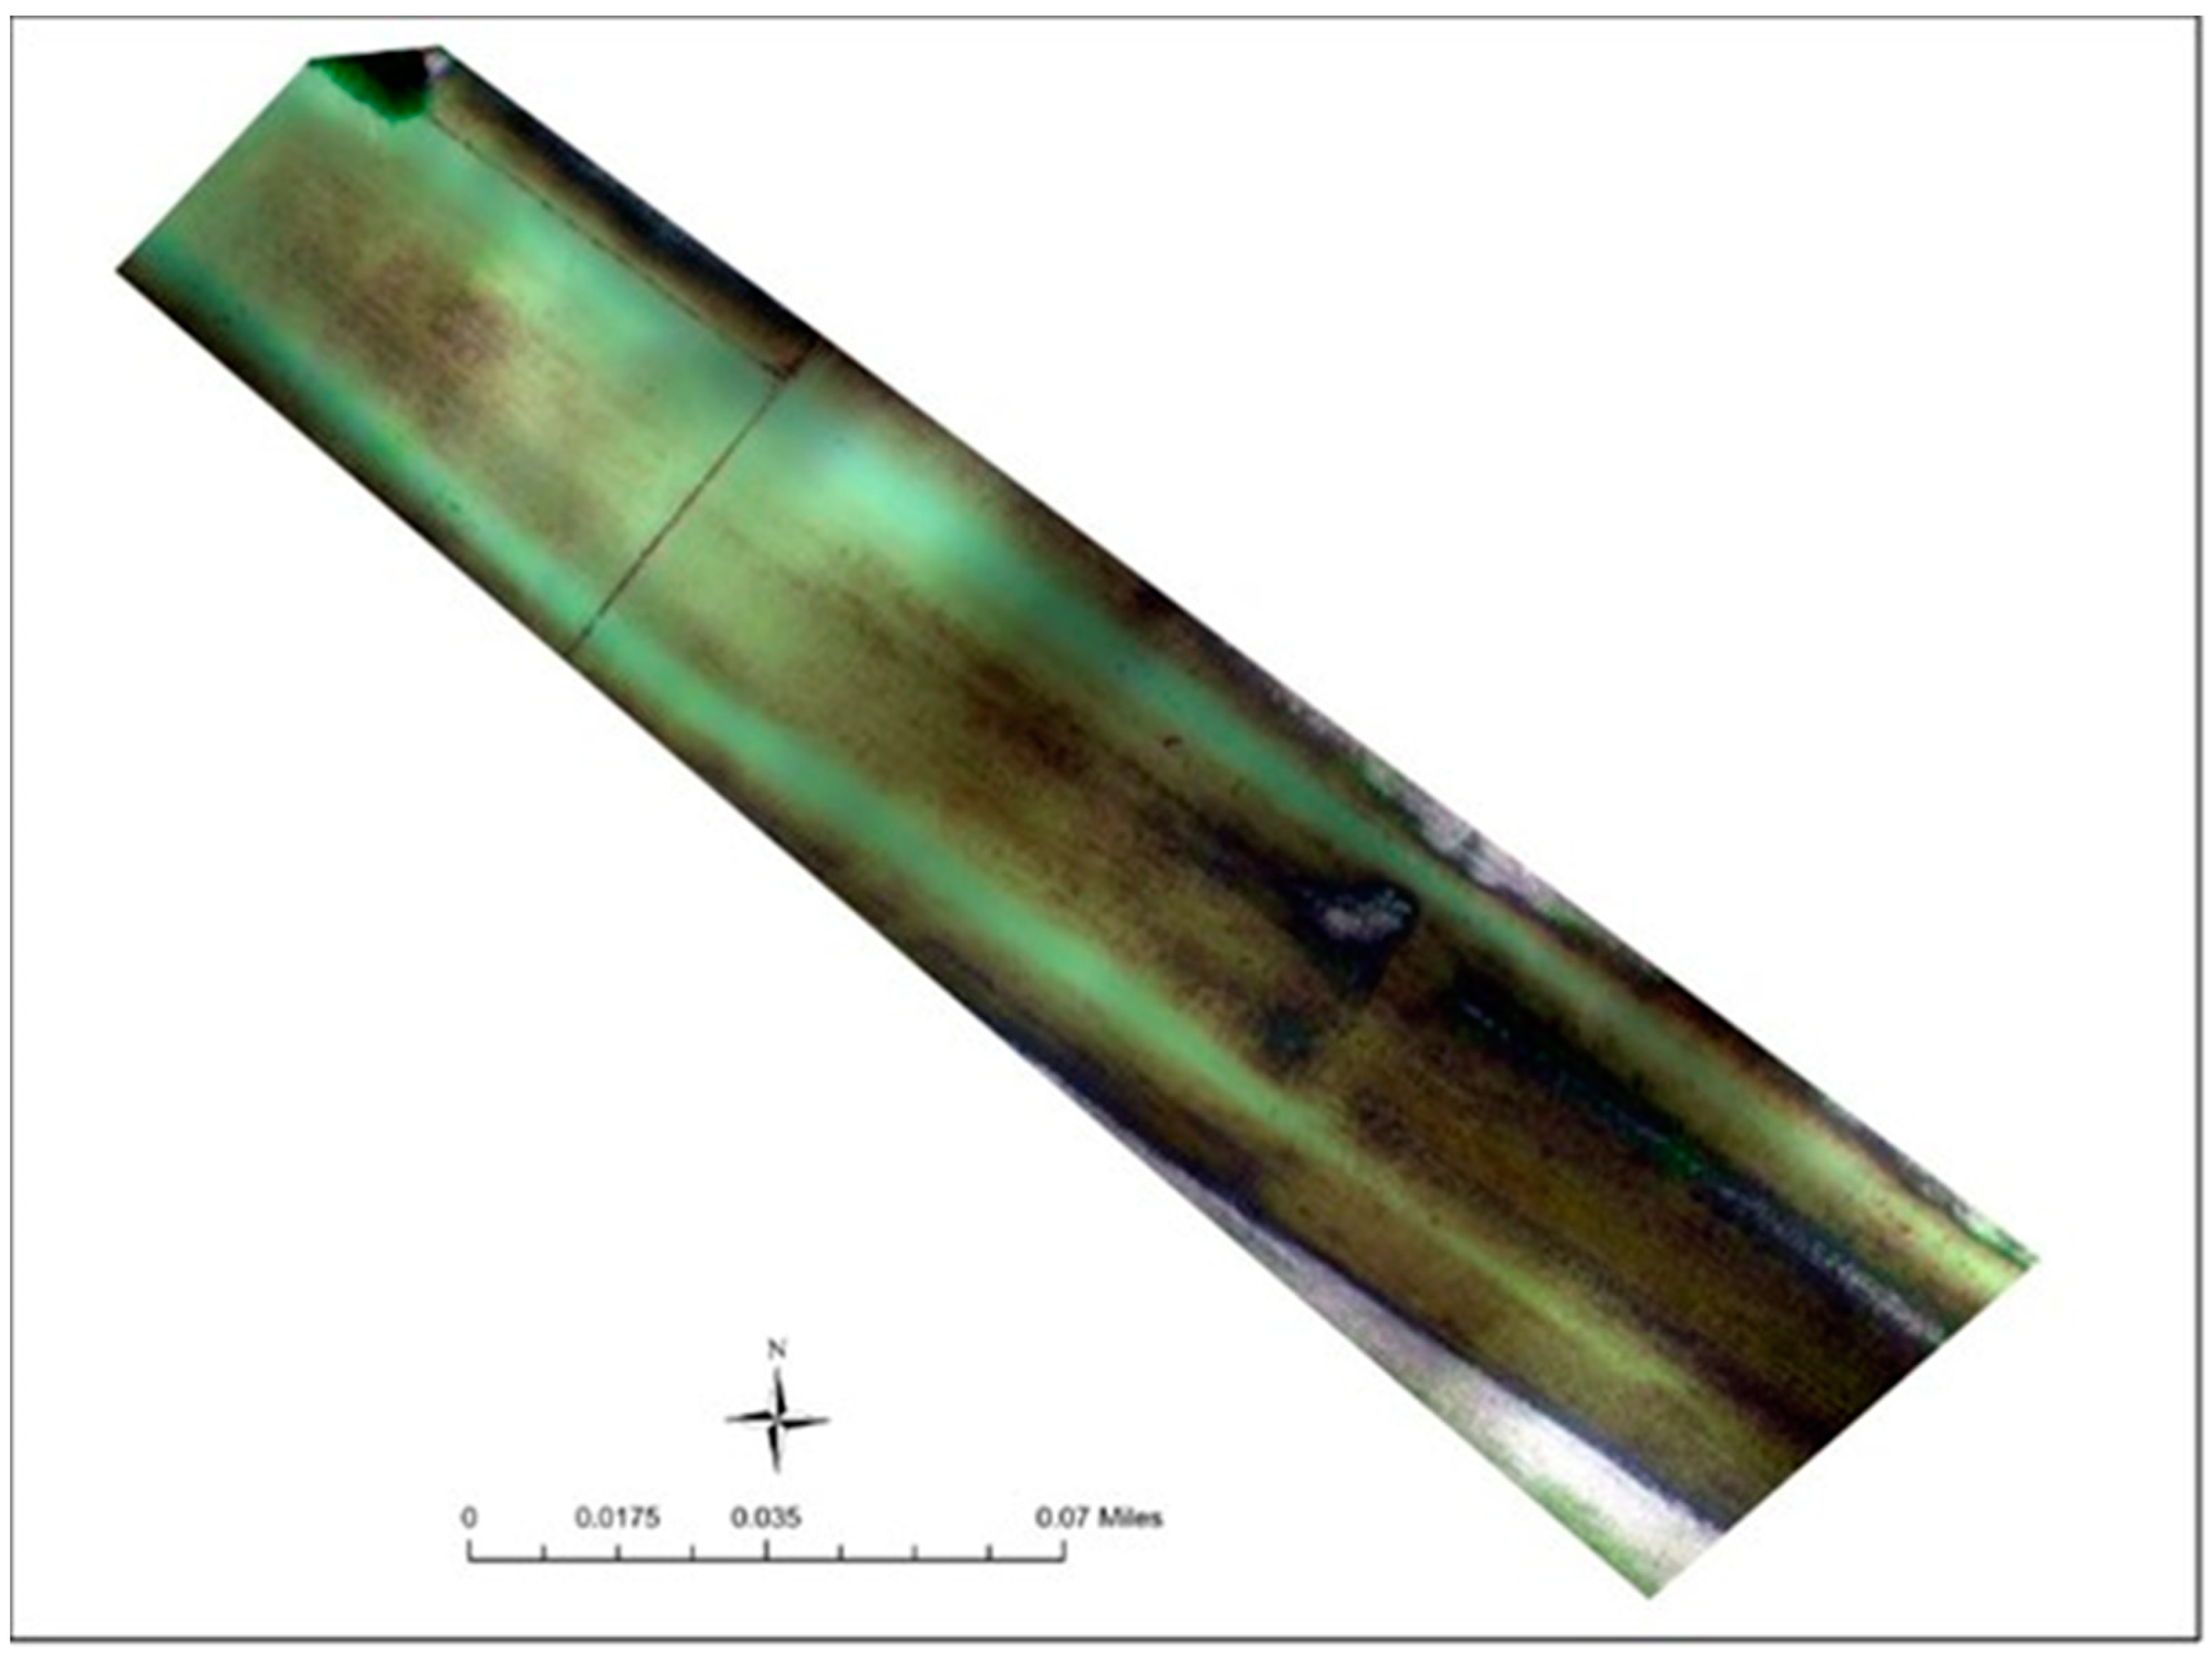
The top-of-atmosphere radiance is transformed to top-of-atmosphere reflectance using Equation (2) [31].
RTOA = (π × L × d2)/(ESUNi × cos (z))
where;
RTOA = top-of-atmosphere reflectance
L = top-of-atmosphere radiance
π = ≈3.14159
ESUNi = the mean solar exoatmospheric irradiance for each band
d = the earth-sun distance, in astronomical units,
z = solar zenith angle (zenith angle = 90—solar elevation angle from IMD file).

3.5. Drone Data

The drone aerial images were acquired post-flooding on 23rd of April 2019 using a Phantom 4-Pro drone with MicaSense RedEdge-M multispectral camera system onboard. The drone was flown at 100 m altitude and with a speed of 3 m/s using the Drone Deploy application. The MicaSense RedEdge-M multispectral camera system captures images in the five spectral bands i.e., blue, green, red, near-infrared, and RedEdge. The MicaSense RedEdge-M camera was triggered to take an image every 2 s and more than a thousand images with a spatial resolution of 8 cm were acquired. The camera was connected to a global positioning system (GPS) data and a downwelling light sensor (DLS). The GPS data was made available to the camera to allow the RedEdge-M camera system to properly geotag images and self-trigger. The downwelling light sensor is a 5-band incident light sensor that measures the ambient light during a flight for each of the five bands of the camera and records the information to the metadata of the Tag Image File Format (TIFF)F images captured by the camera. This information can be used to correct global lighting changes during flights such as clouds covering the sun. The captured drone images were pre-processed by mosaicking, geometric correction, radiometric correction, and co-registration. The drone images were geotagged and automatically mosaicked in Pix4d mapper version 4.5. The radiometric correction was performed by using calibrated reflectance panel images acquired before and after each flight to generate reflectance drone images. Furthermore, geometric correction was carried out using greater than 50 ground control points and an RMS value of lower than 1 pixel. The mosaicked drone imagery was co-registered with the resampled 8 cm WorldView-4 satellite image.

3.6. Grazing Land Cover Classification and Pasture Quality Monitoring

The top-of-atmosphere reflectance images of the WorldView-4 satellite and drone data were used to generate pasture NDVI as an indicator of pasture quality pre- and post-flooding. The NDVI was generated using Equation (3) [30].
NDVI = (Near-InfraredRed)/(Near-Infrared + Red)
The grazing land cover was classified and mapped using the top-of-atmosphere reflectance images of WorldView-4 satellite and drone platforms. The spectral bands 1–4 of WorldView-4 and spectral bands 1–5 of the MicaSense RedEdge-M camera onboard Phantom 4-Pro drone were used in the classification and mapping of grazing land cover. Supervised classification was performed using the machine learning Random Forest classification algorithm with digitized polygons (training data) of grazing land cover types. The default number of training samples was set at 5000 and the number of trees was set at 10. This algorithm was selected because the Random Forest classifier consists of a combination of tree classifiers where each classifier is generated using a random vector sampled independently from the input vector, and each tree casts a unit vote for the most popular class to classify an input vector [32]. Furthermore, the machine learning Random Forest classification algorithm has been found to outperform other machine learning classification algorithms such as support vector machines in land cover mapping [33,34]. The minimum mapping unit of the grazing land cover map was 1 m2. The grazing land cover map generated post-flooding was validated to examine how well the classified map represented grazing land cover on the ground. This was carried out by randomly selecting about 50-points of classes on the generated map and comparing them to classes on the ground and Google Earth Pro. The acquisition date of Google Earth Pro images was in May of 2019 and was relevant for accuracy assessment. This is because it was of the same season as the post-flooding drone images used in this study. The overall accuracy was computed by dividing the sum of the correct diagonal values in the error matrix table with the sum of all pixels in the error matrix table [30]. The kappa value was also computed using the method described by Mather and Koch [30]. Furthermore, using the confusion matrix values (Table 1), the widely used metrics of precision, recall, and F-score [35] were calculated to evaluate the performance of the Random Forest classification algorithm in mapping grazing land cover. The precision was calculated using Equation (4); recall using Equation (5); and F-score using Equation (6) [35,36].
P r e c i s i o n   =   T P T P   +   F P
R e c a l l   =   T P T P   +   F N
where;
TP = True Positive
FP = False Positive
FN = False Negative.
F - S c o r e   =   2   ×   P r e c i s i o n   ×   R e c a l l P r e c i s i o n   +   R e c a l l
The grazing land cover maps were converted from raster to vector in Geographic Information System (GIS)for further analyses.

4. Results and Discussion

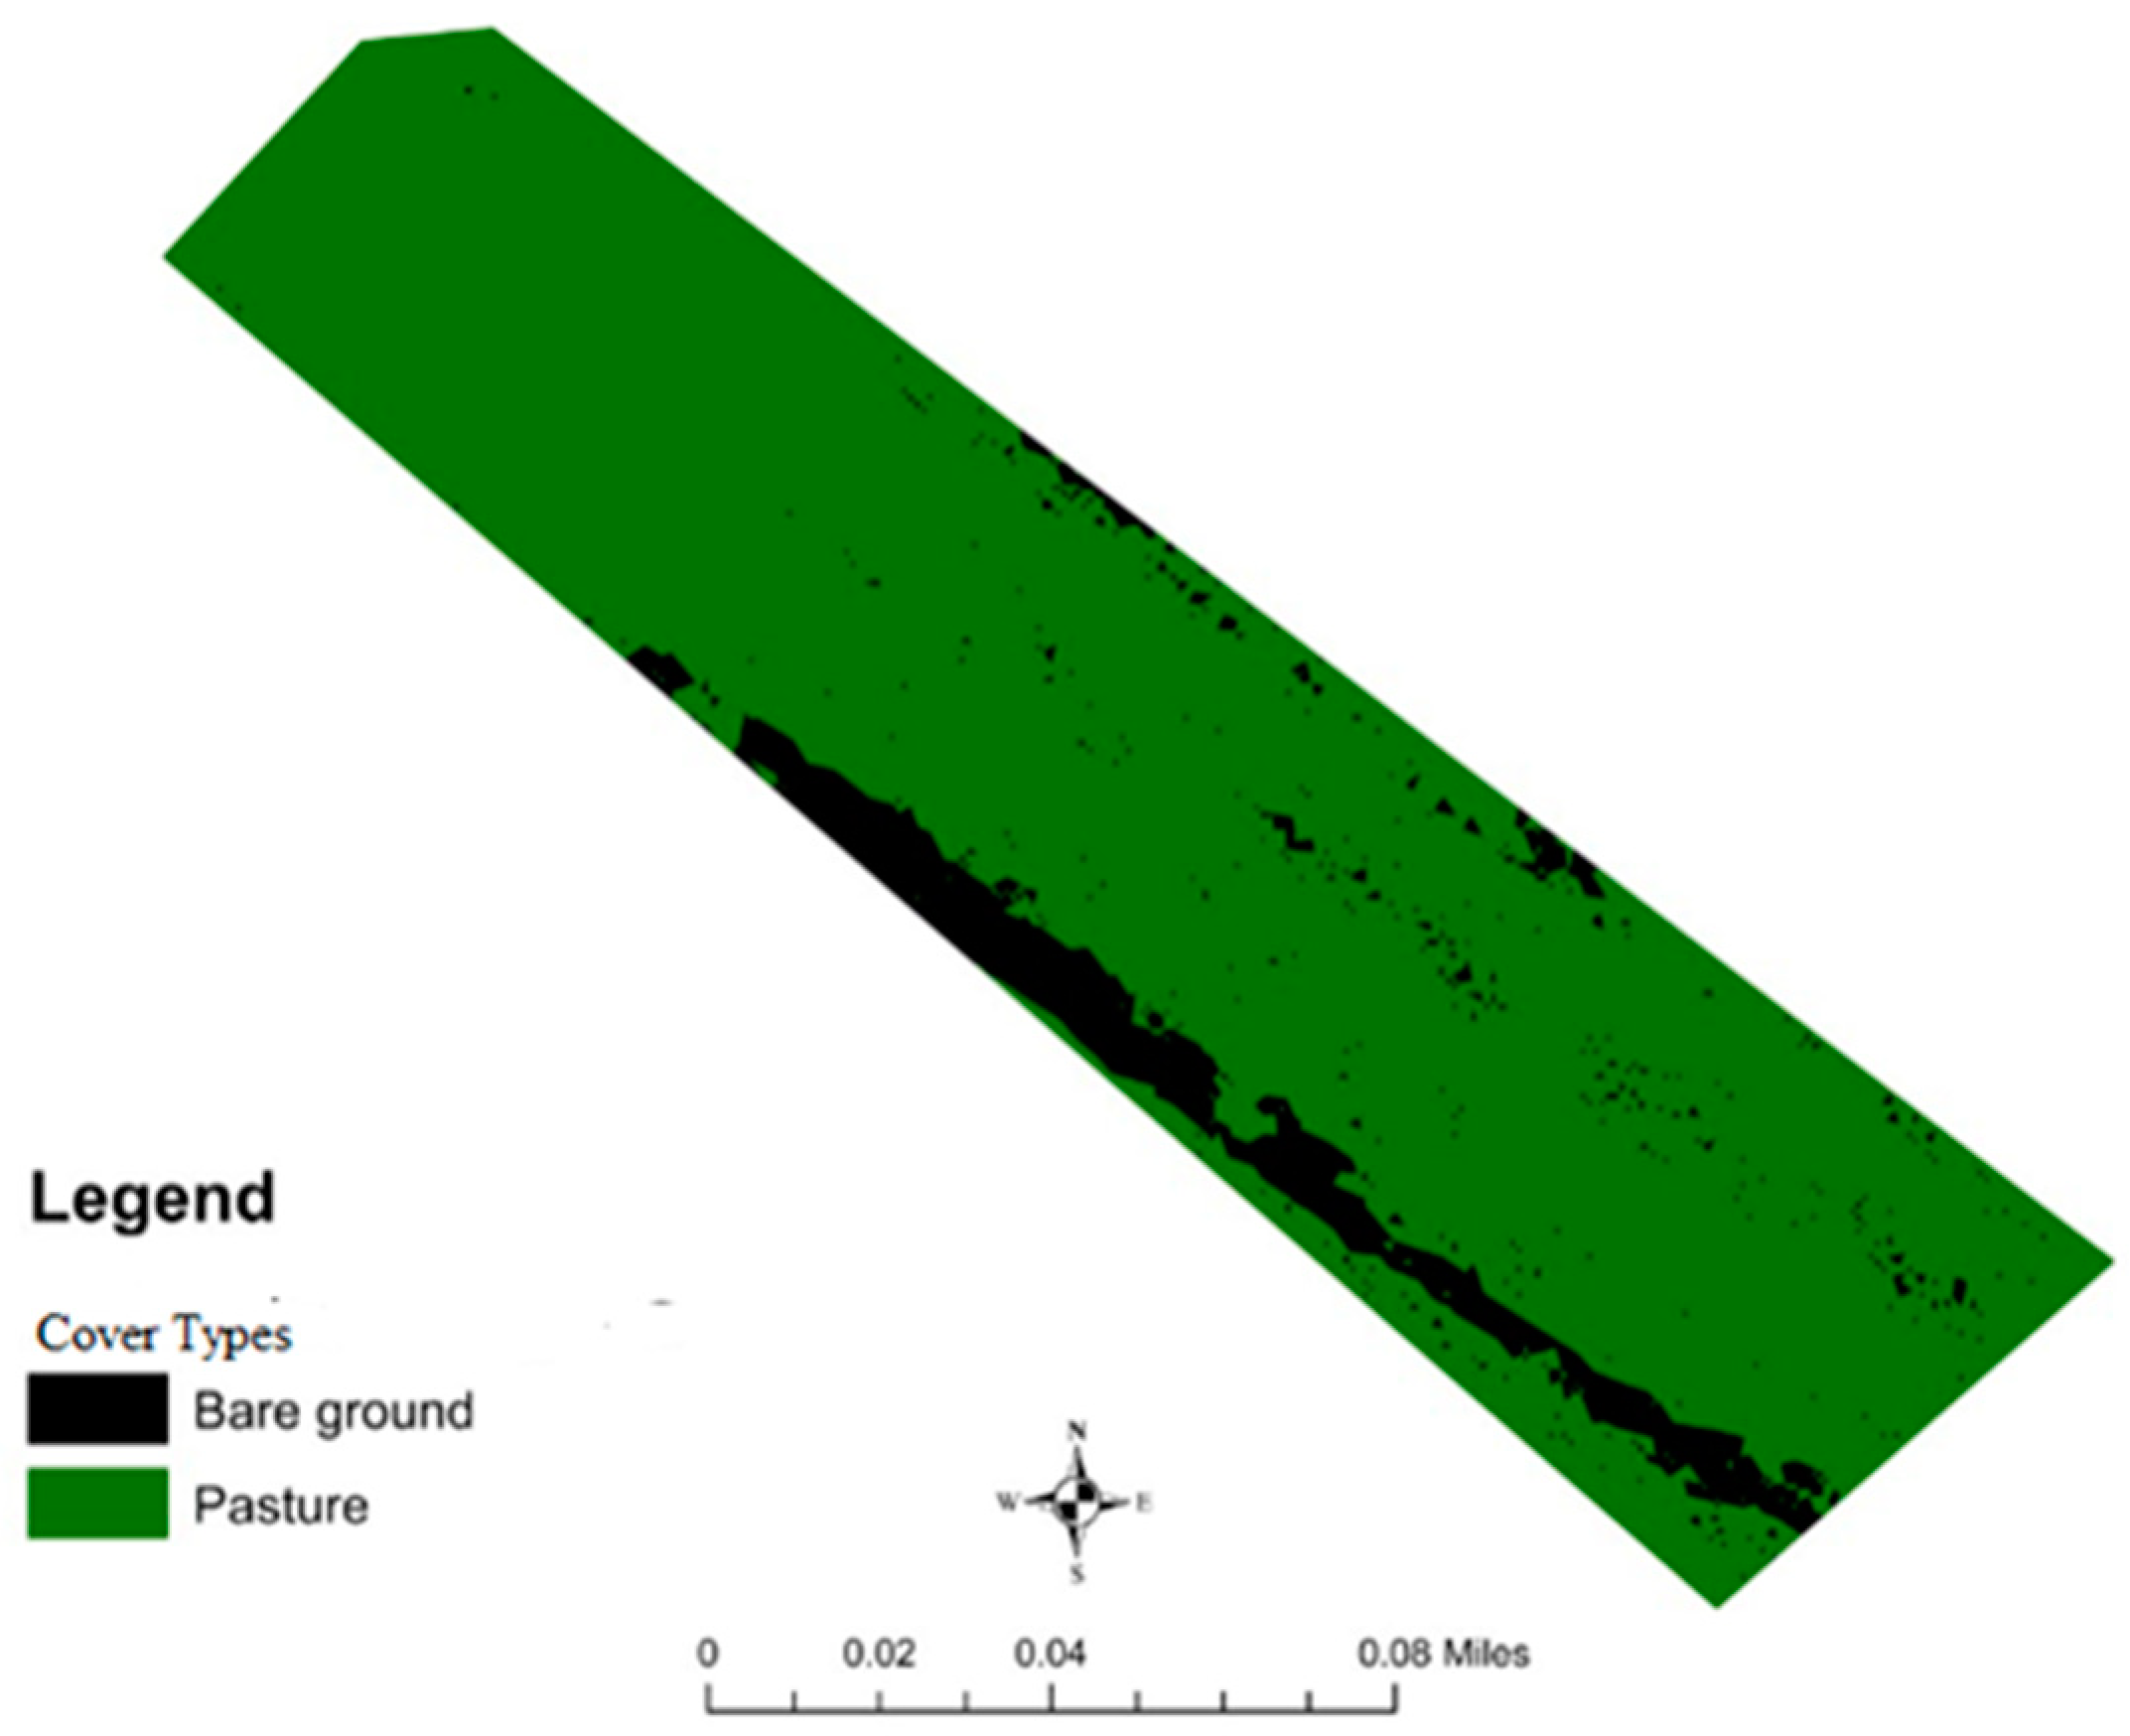
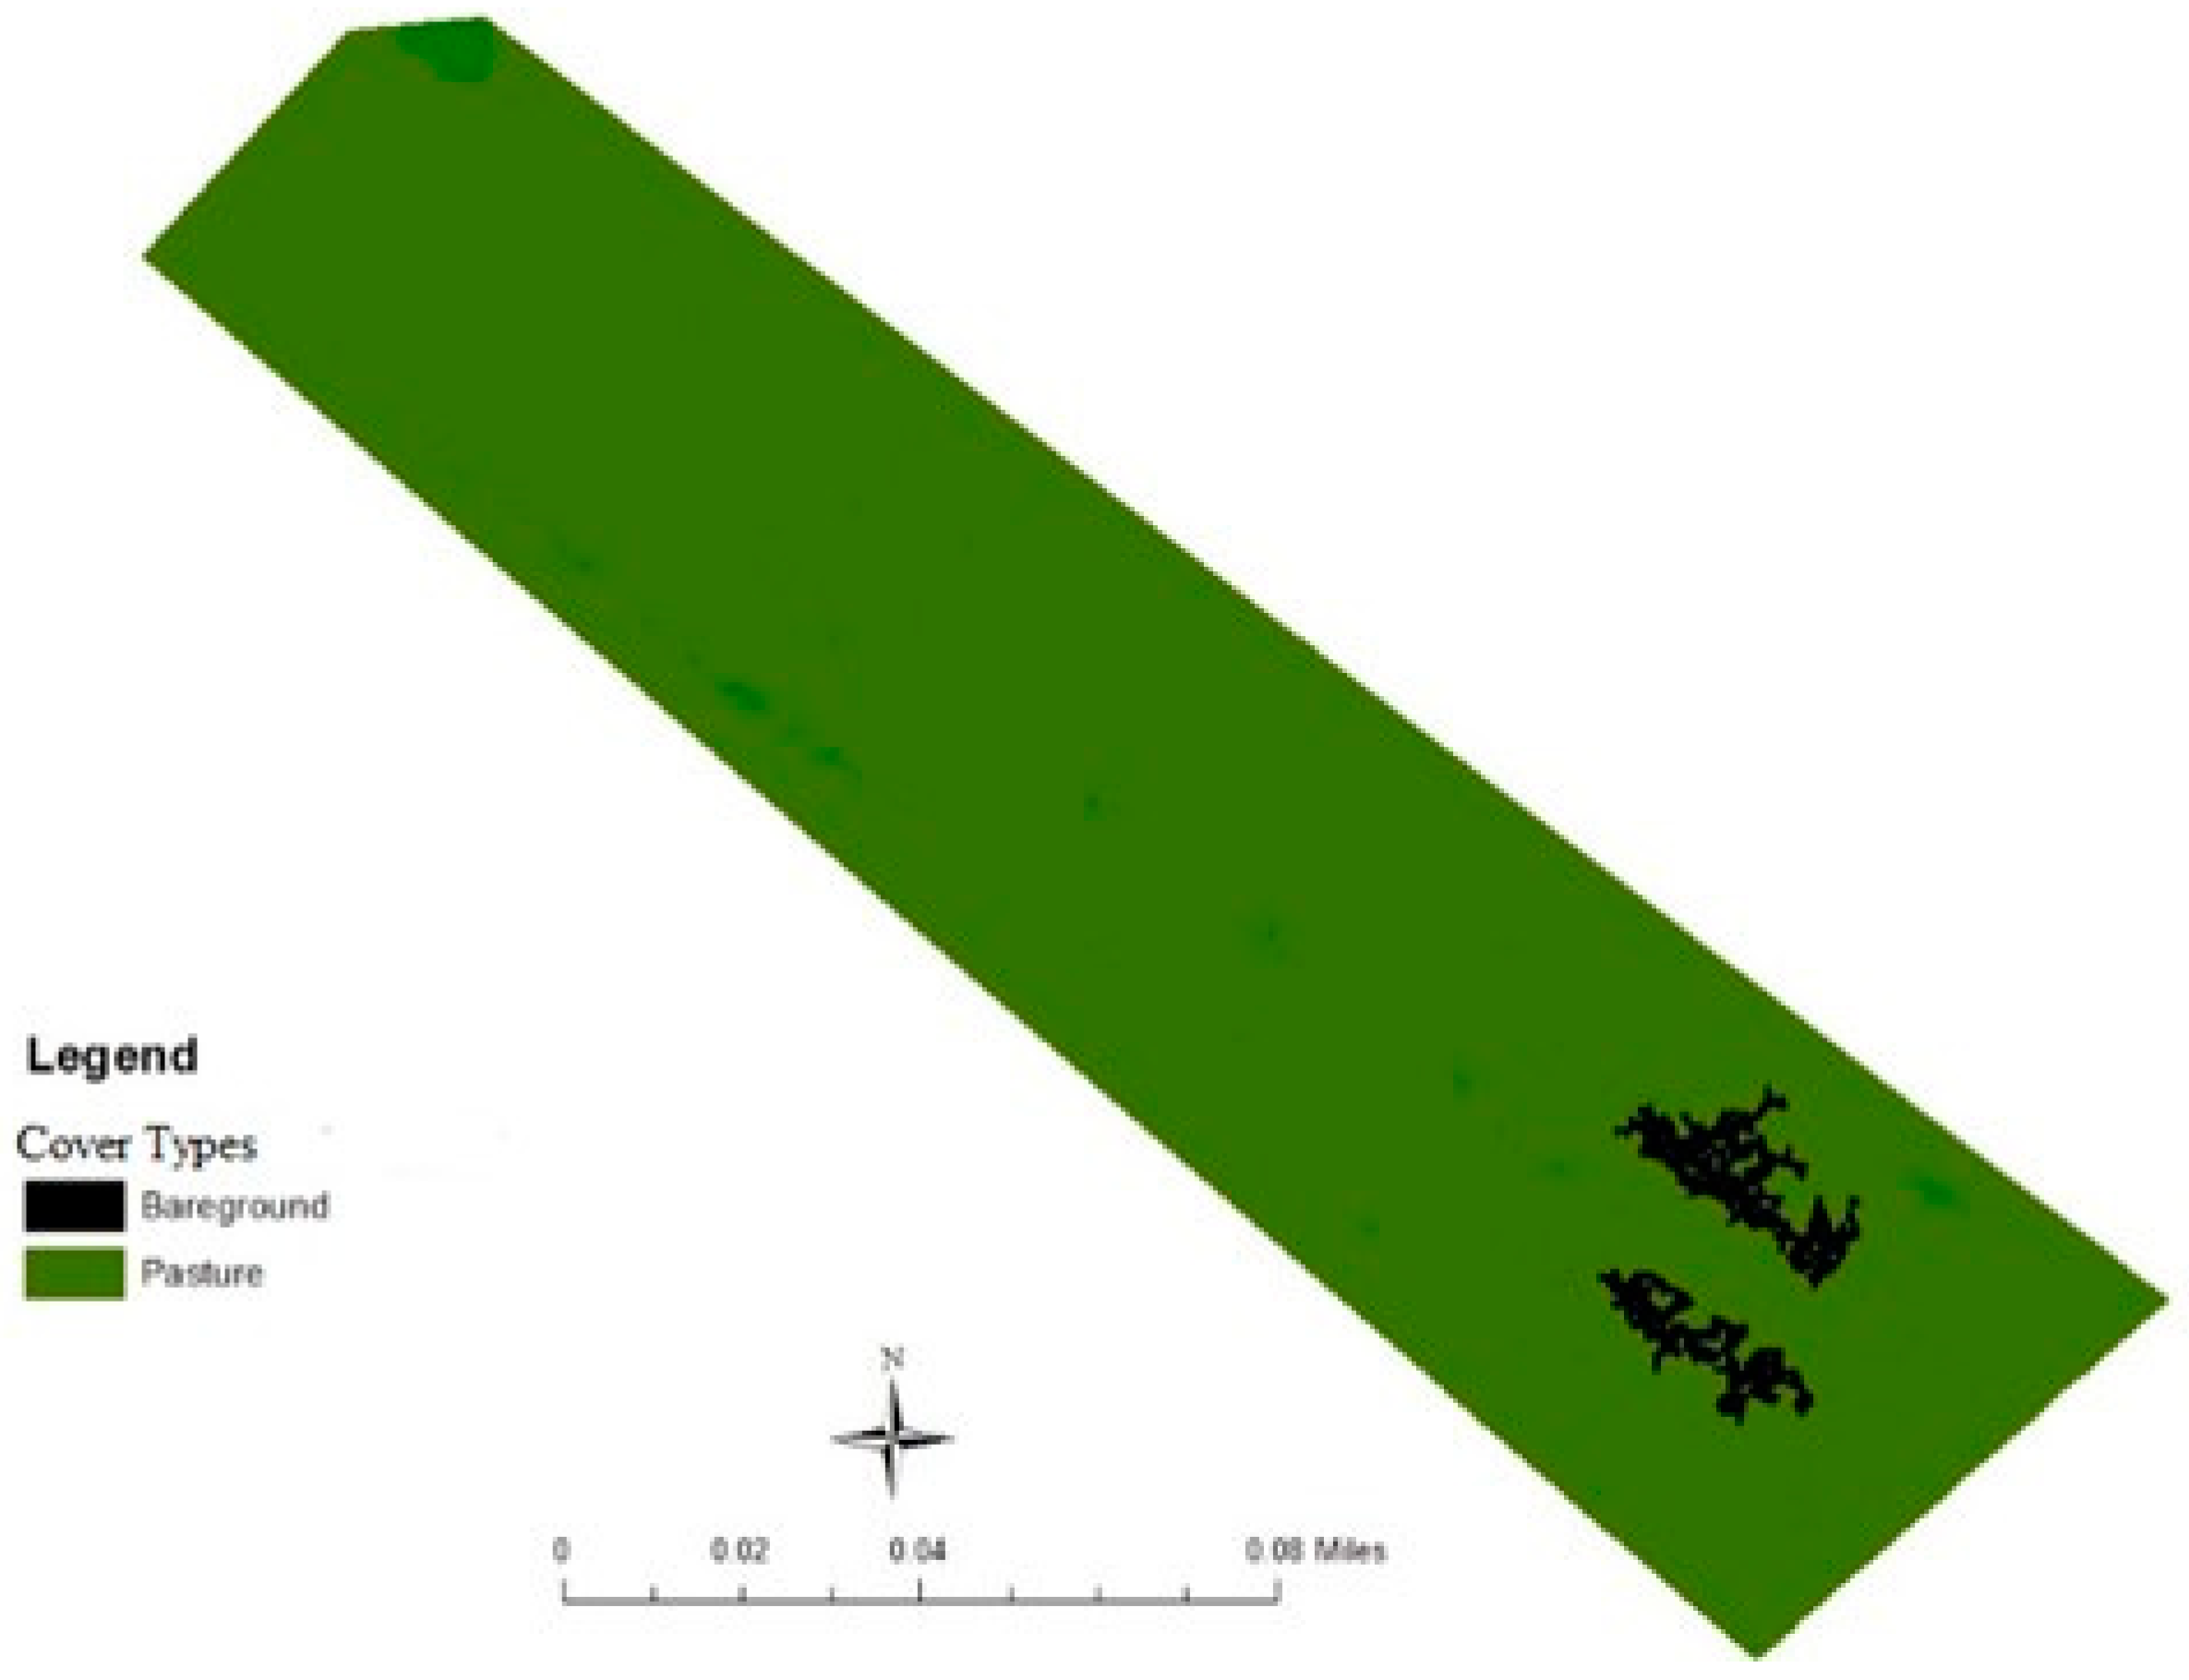
4.1. Grazing Land Cover Mapping

The grazing land cover consisted of pasture and bare ground (Figure 4 and Figure 5). The bare land represented exposed land with silt loam soil that consisted of less than 5% of the vegetation. In contrast, pasture represented vegetated areas covered by more than 5% of the vegetation. The pasture was dominated by tall fescue grass and covered an area of about 3 hectares pre-flooding. This represented about 90% of the study area. The bare ground covered an area of about 0.3 hectares pre-flooding and represented about 10% of the study area. The area covered by pasture was approximately 3.2 hectares post-flooding. The area covered by bare ground was about 0.1 hectares post-flooding. The pasture area increased by about 7% post-flooding whereas the bare ground area decreased by about 65% post-flooding. The increase in pasture post-flooding implies the vegetation was tolerant to flooding and the flood event likely stimulated vegetation growth and expansion. Furthermore, the pasture was dominated by tall fescue plants and has been found to be resilient to flooding [37,38]. In addition, the drone images were taken more than 3 weeks after flooding occurred and that likely provided recovery time for the pasture vegetation to expand. The increase in pasture cover post-flooding is similar to the findings of Mansour [39]. The decrease in bare ground post-flooding occurred predominantly south of the study area as detected by the drone data. The high spatial resolution drone and WorldView-4 satellite data successfully detected changes in grazing land cover that will likely not detected using moderate resolution remotely sensed data such as Landsat Operational Land Imager (OLI).
The overall accuracy of the grazing land cover map derived using a drone was about 96% (Table 1). The kappa statistic was approximately 0.86 and there was a very good correlation between the remotely sensed classified map and the grazing land cover on the ground. This is because kappa values of 0.75 and above indicate a very good correlation and kappa values below 0.4 are considered poor correlation, assuming the data are randomly sampled from a multinomial distribution with a large sample size [40]. Similarly, the F-score that measures the test accuracy of the classification was about 0.97 and was closed to its best value of 1.
The mean user’s accuracy, which demonstrates how well the classified grazing land cover types on the map actually represented land cover on the ground, was about 8% lower than the mean producer’s accuracy, which determines the ability of the Random Forest algorithm to generate grazing land cover.

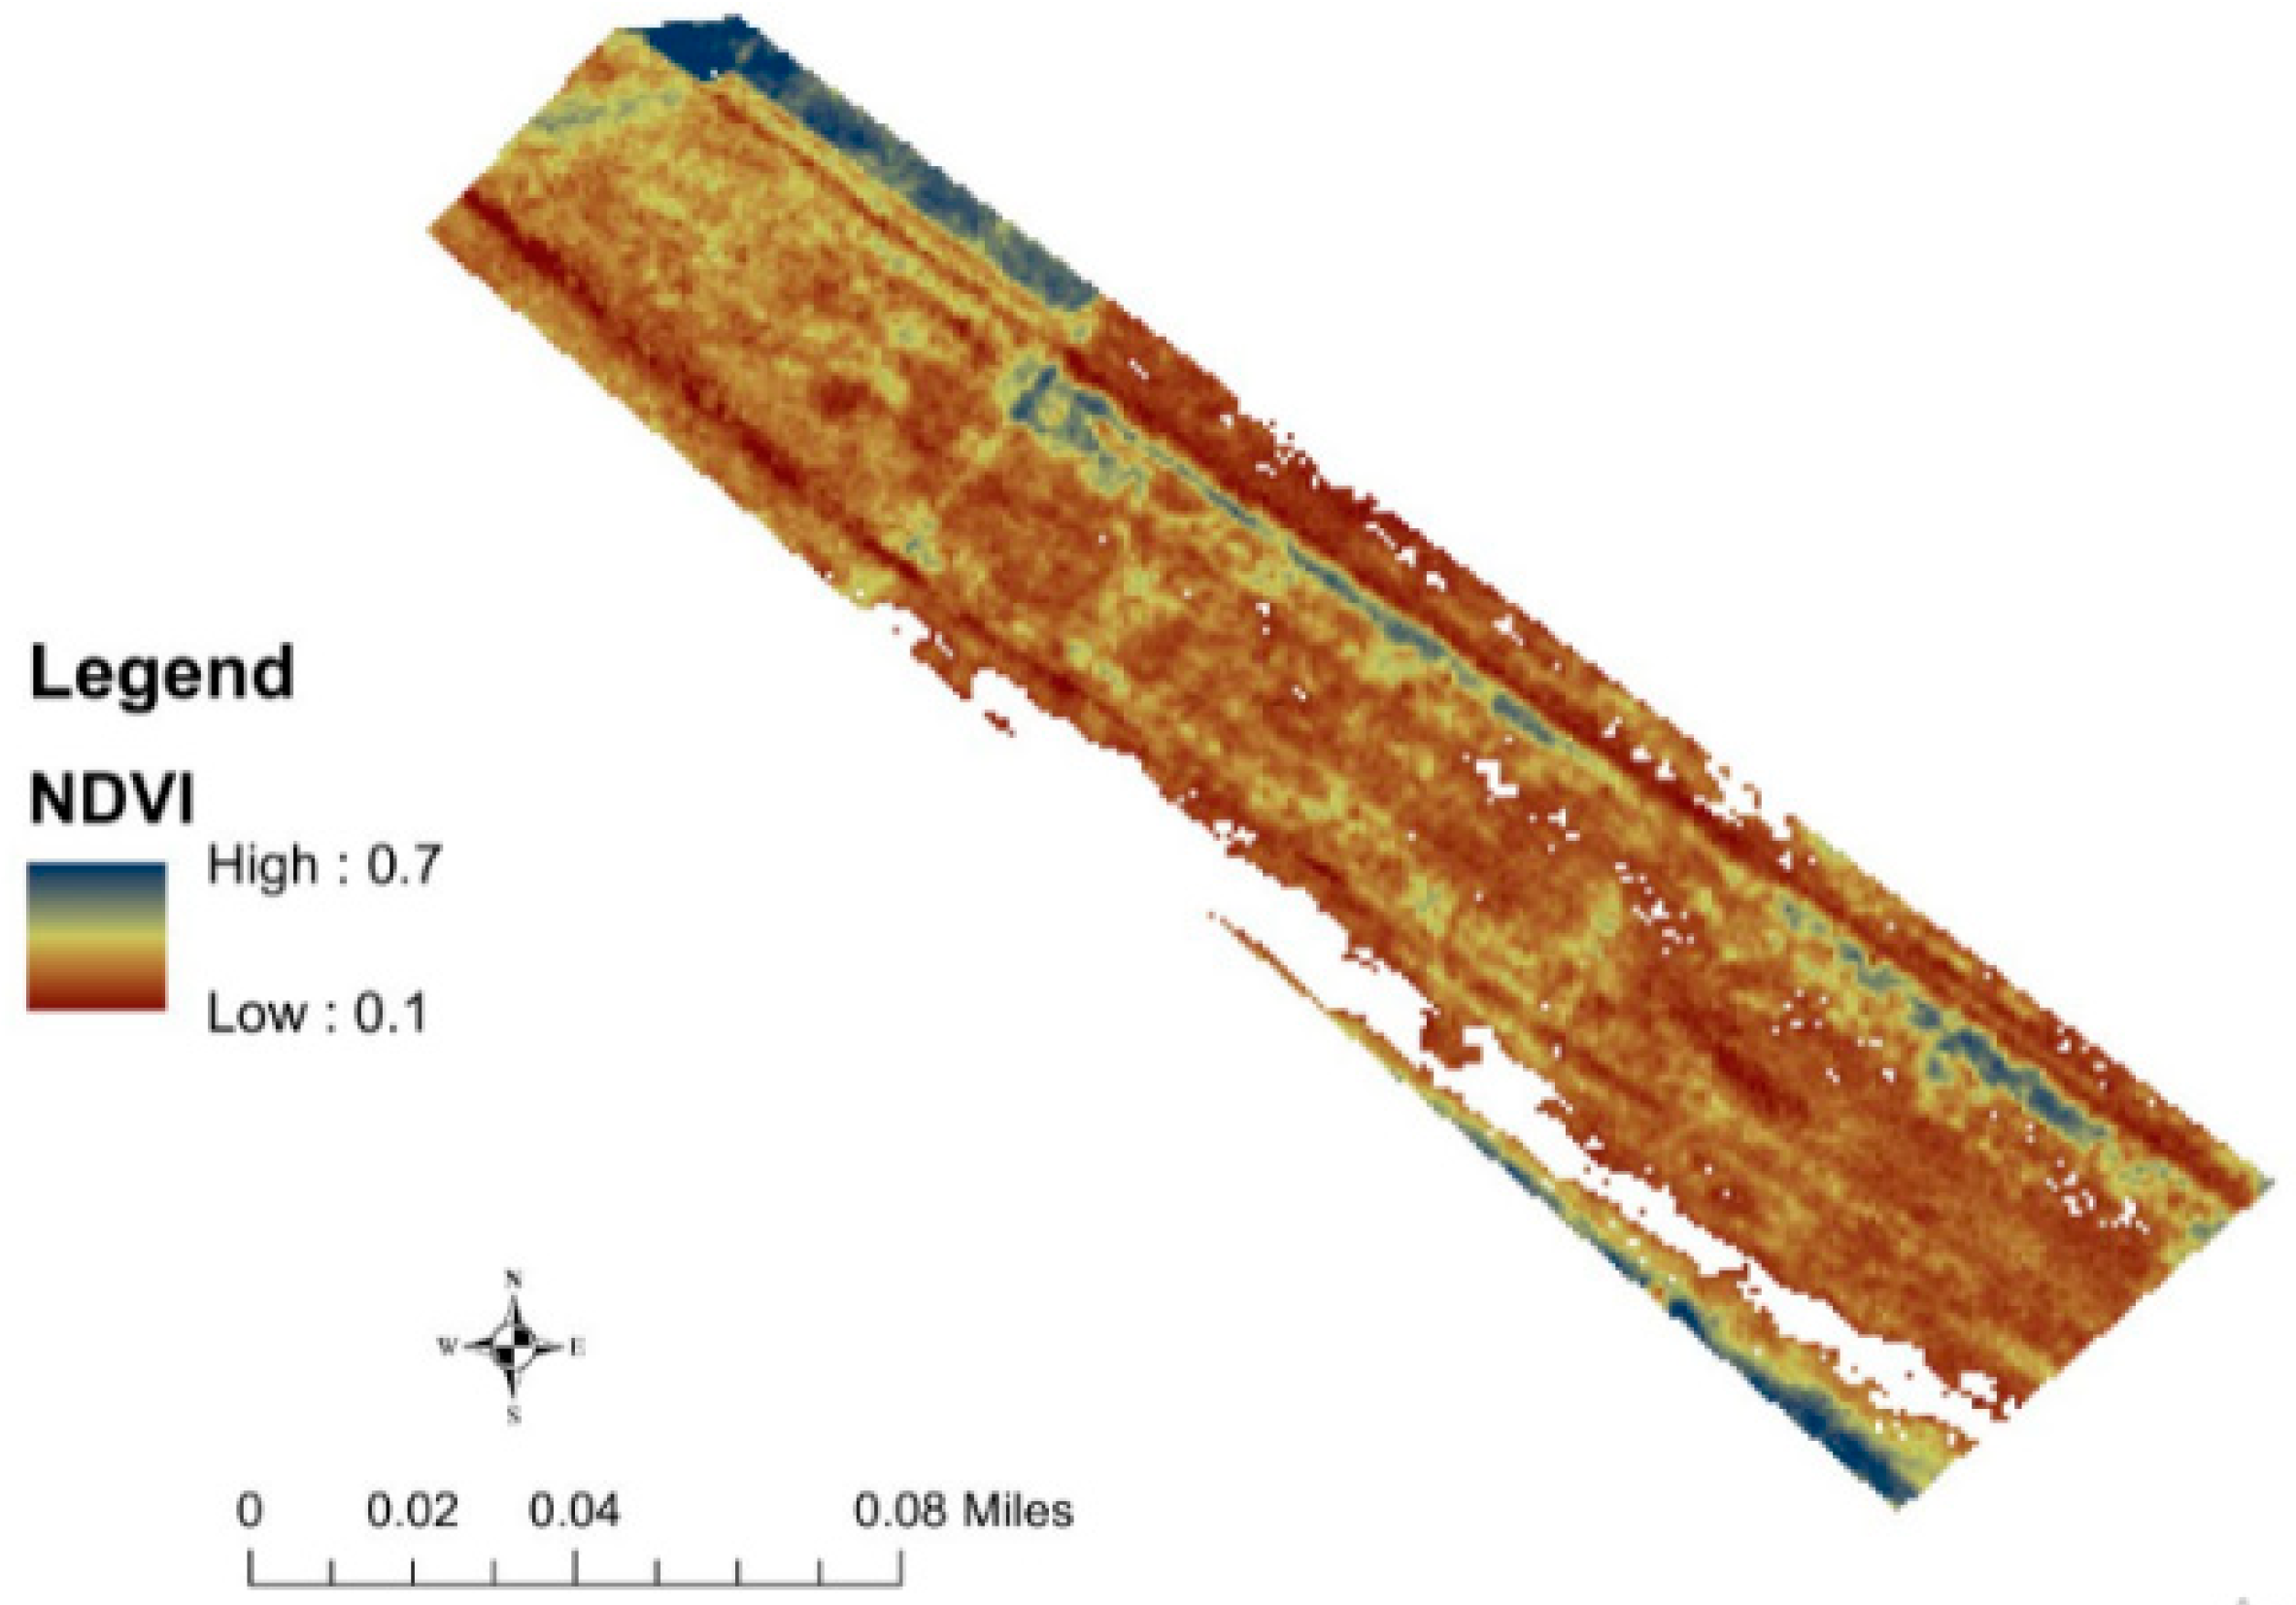
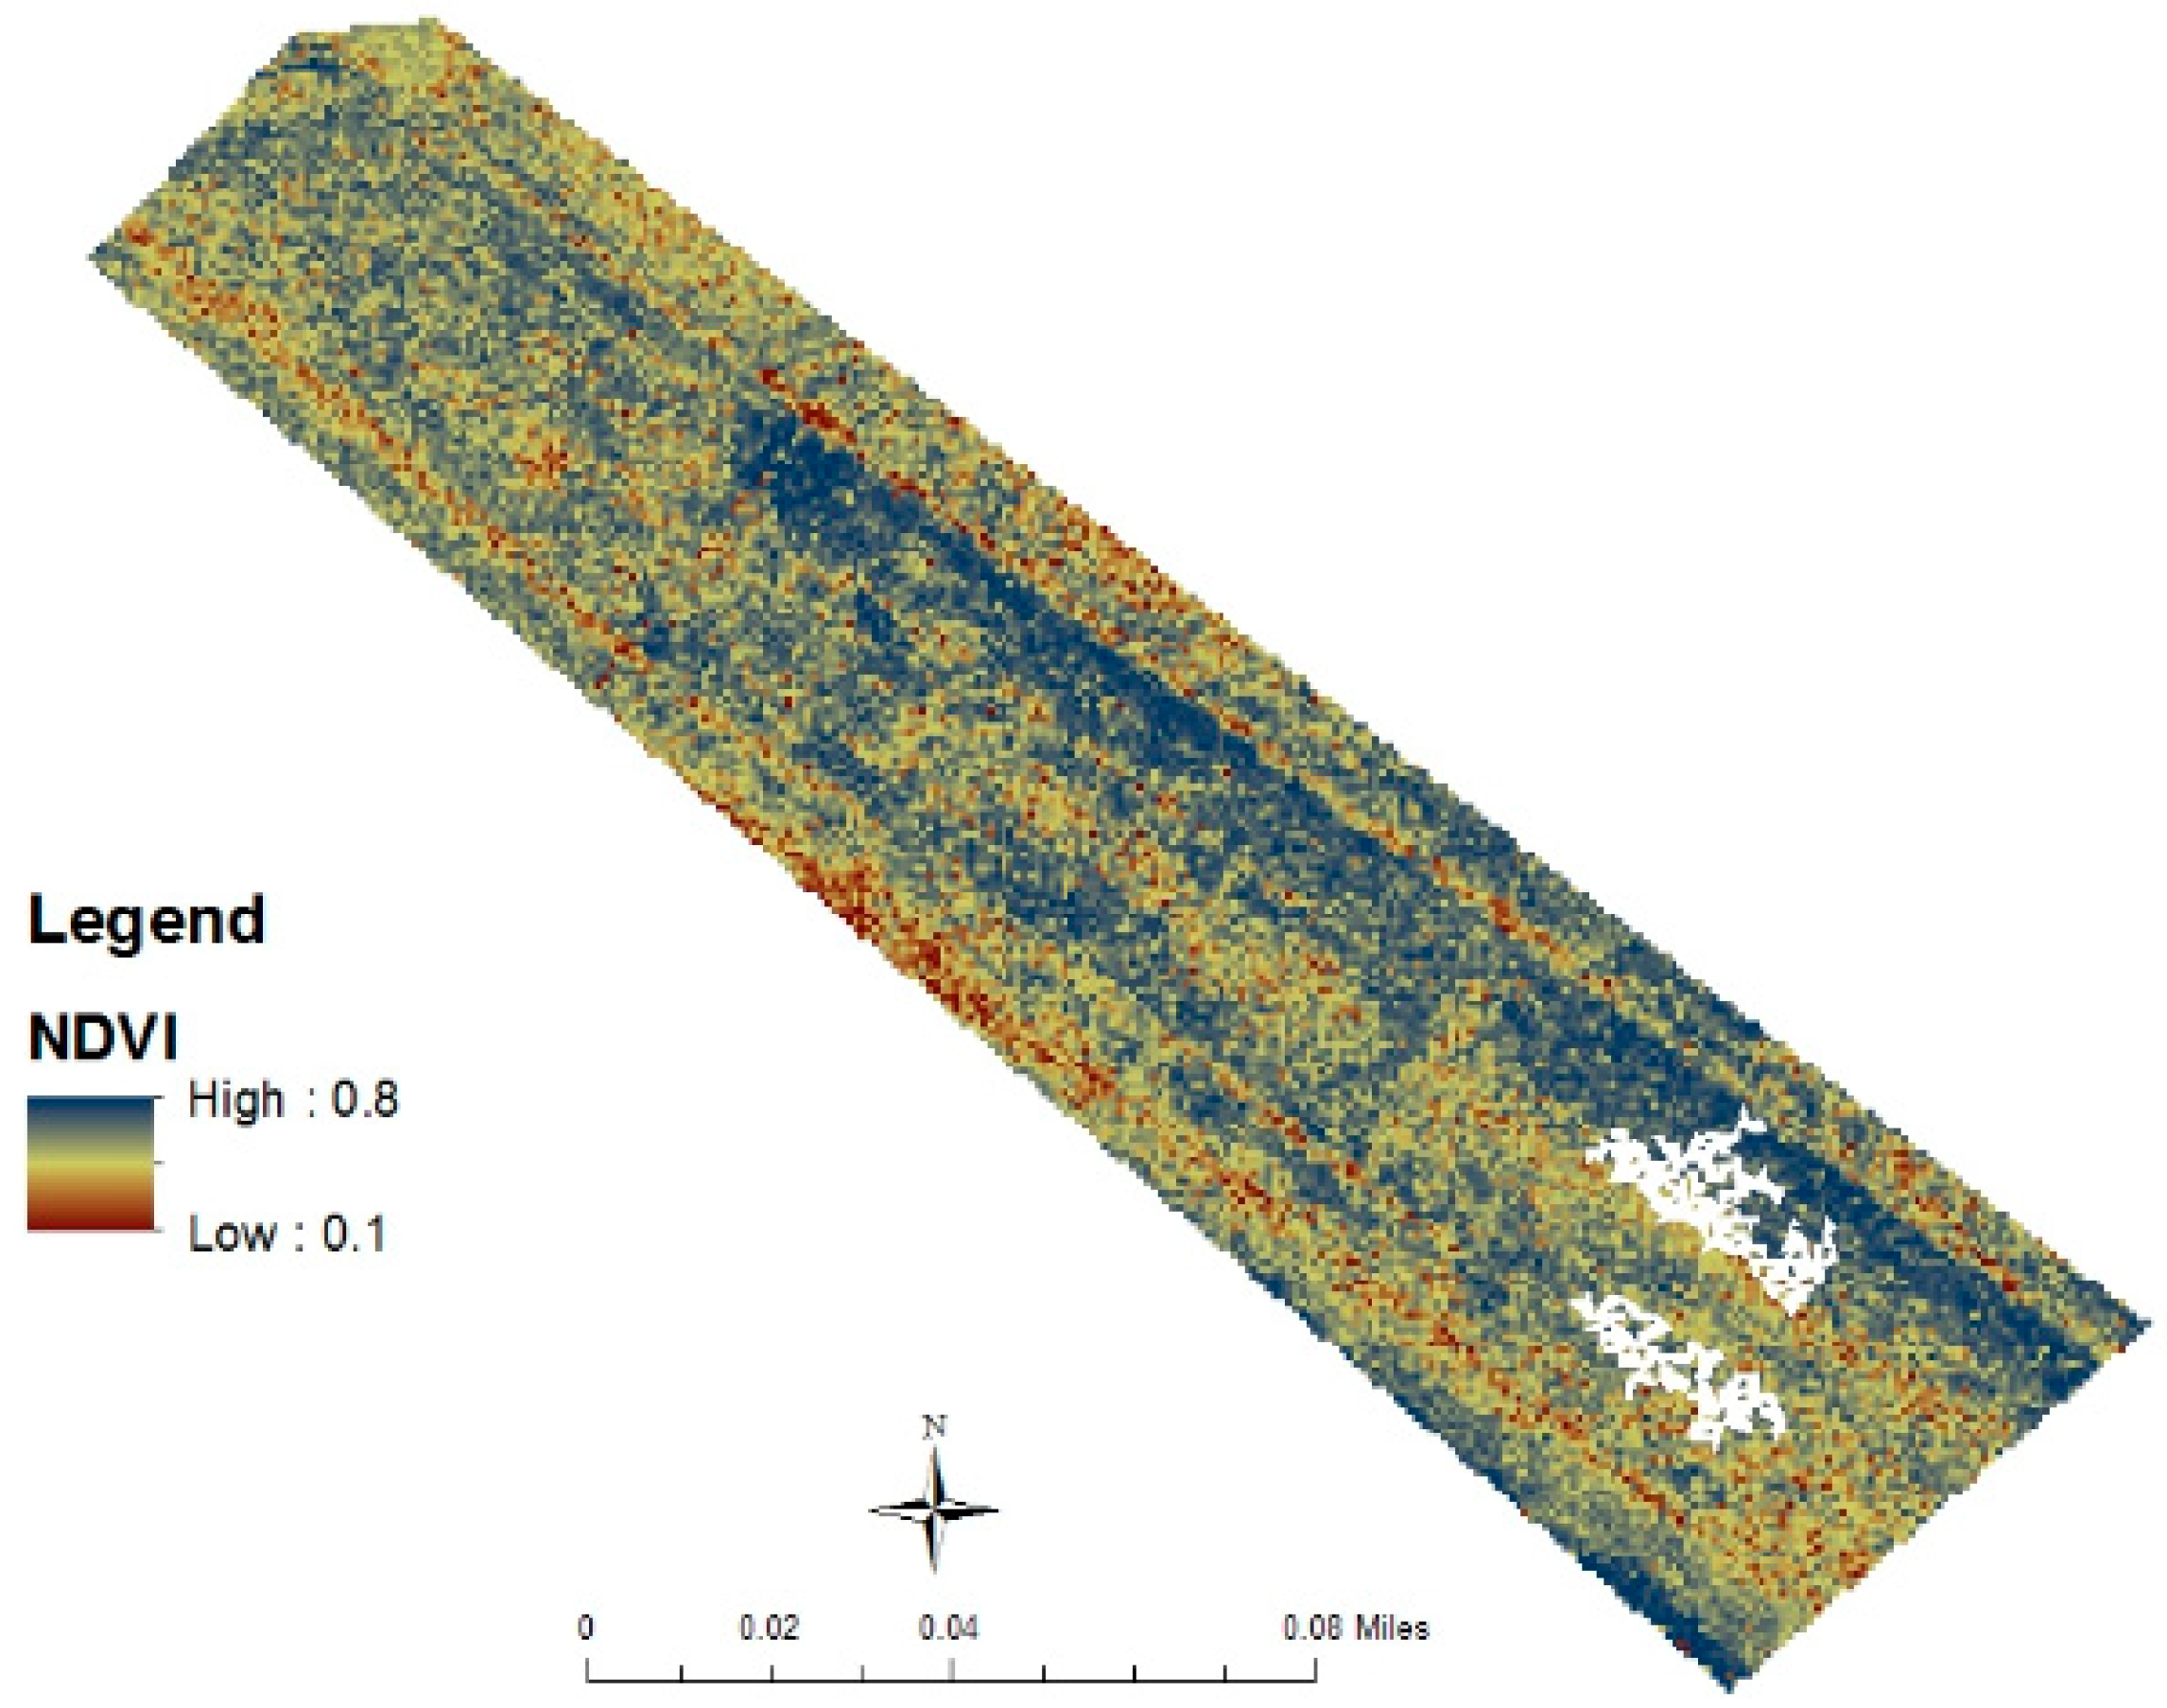
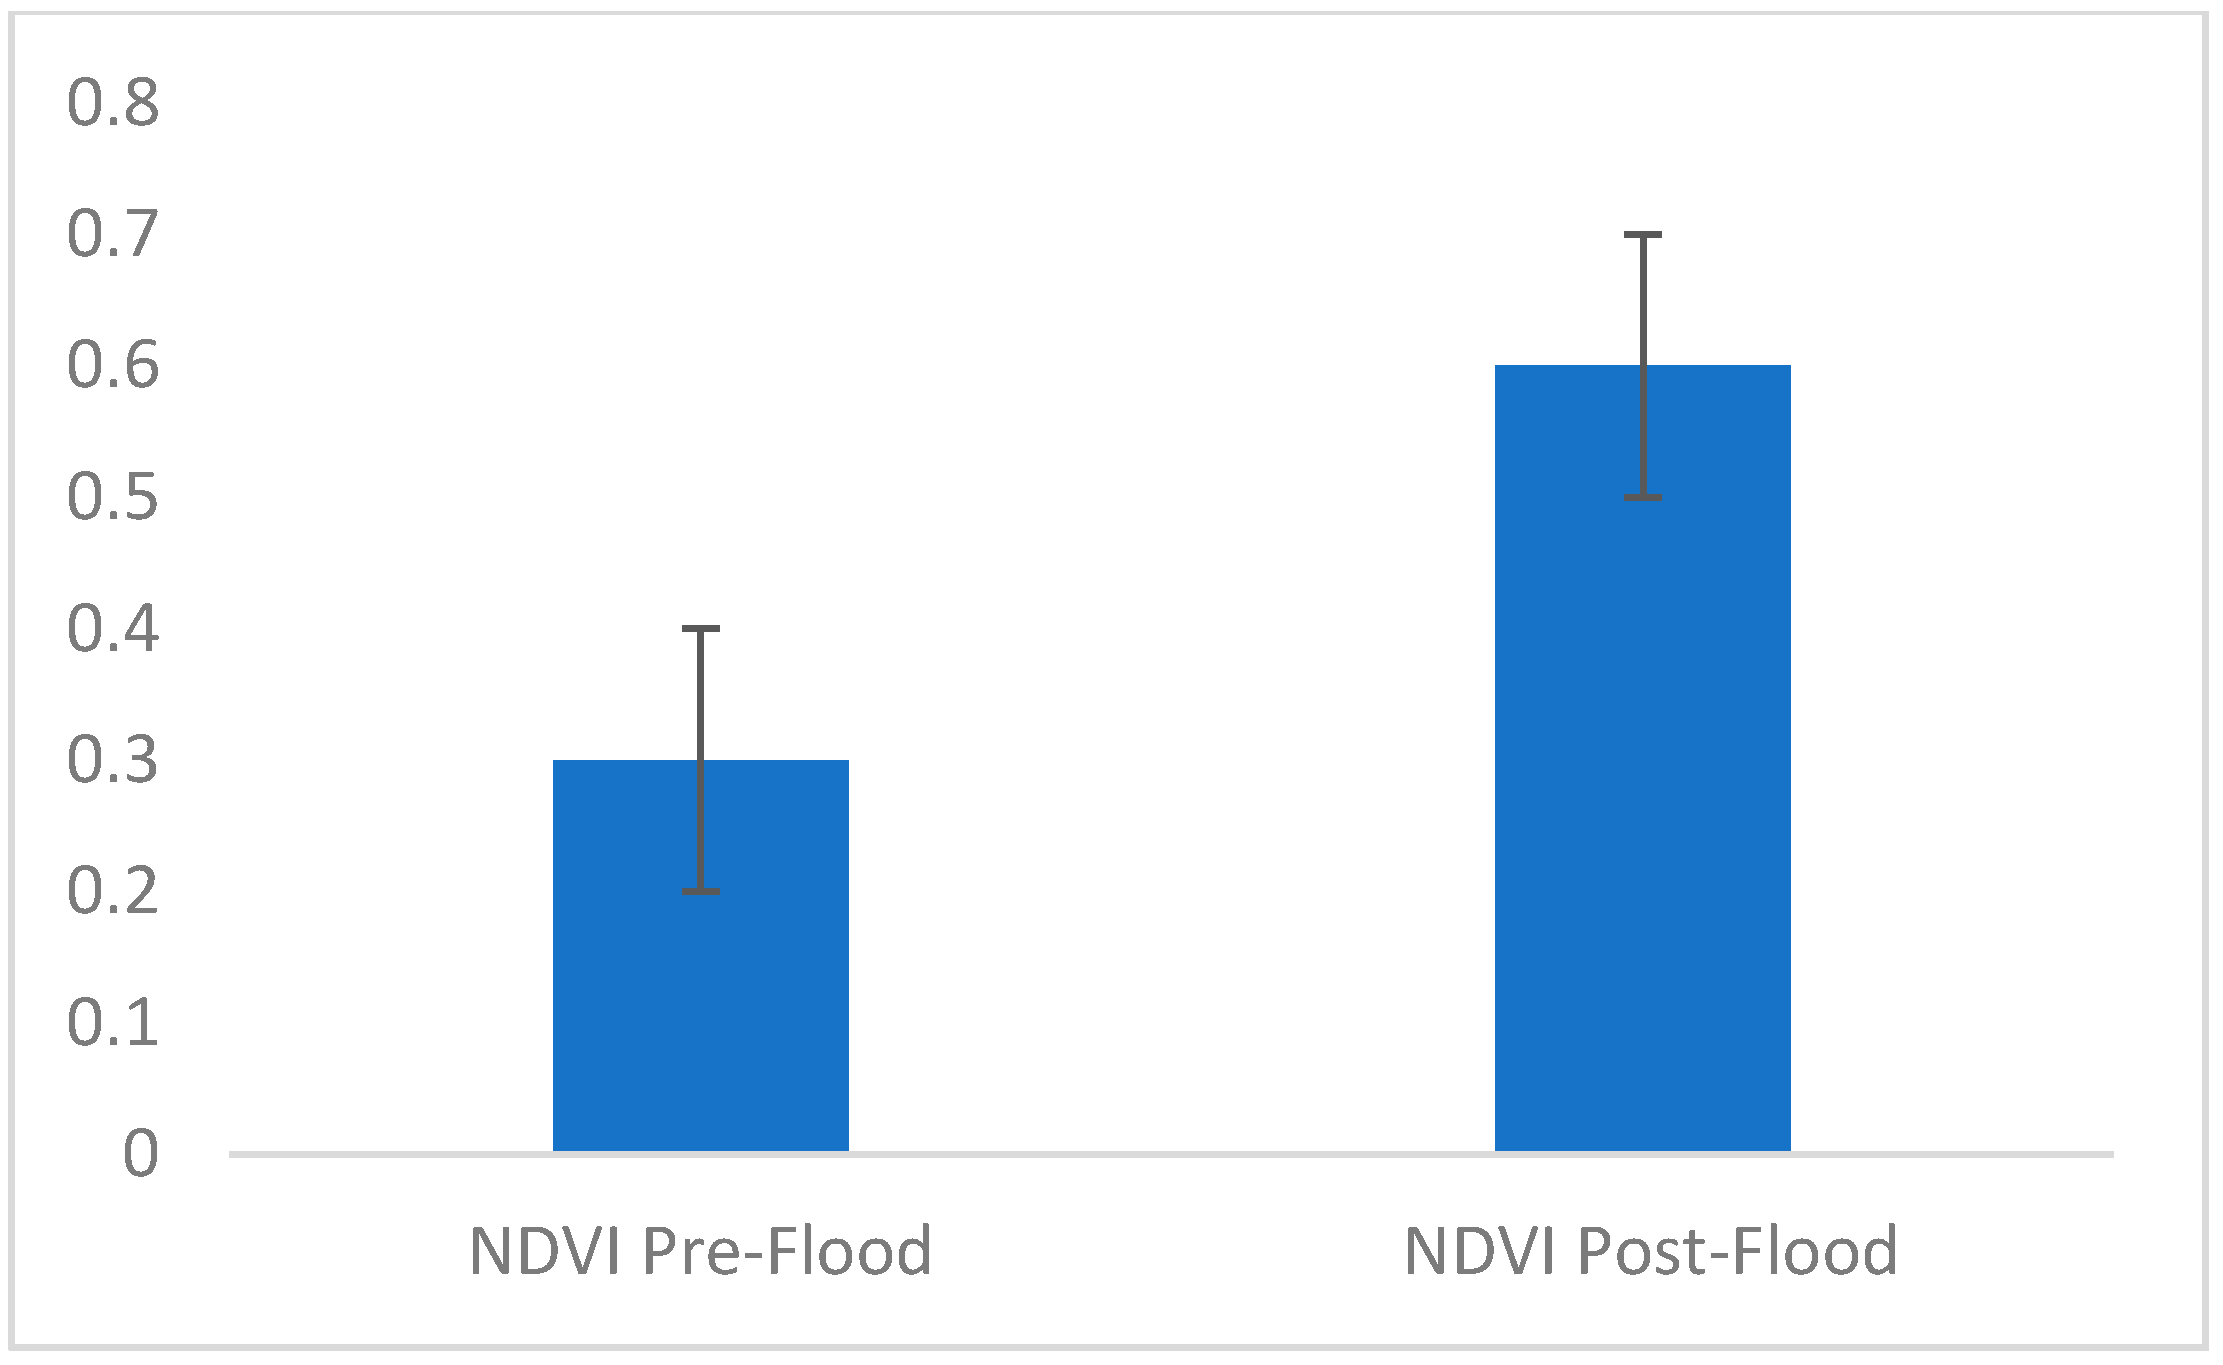
4.2. Pasture Quality

The NDVI values of the pasture in the study area ranged from 0.1 to 0.8 pre- and post-flooding (Figure 6 and Figure 7). The mean NDVI ± standard deviation (SD) of the pasture was about 0.3 ± 0.1 pre-flooding (Figure 8). The pasture mean NDVI ± SD was about 0.6 ± 0.1 post-flooding (Figure 8). The pasture mean NDVI increased by about 100% post-flooding. This implies the flooding that occurred in the study area likely improved pasture plant health and vigor. This is because flooding provides soil moisture needed for plant germination and growth. This finding is similar to a recent study that found flooding to increase plant germination and vegetation quality [39]. However, the seasons when the drone and WorldView-4 satellite images were captured may have also contributed to the change in pasture quality. For example, the cooler Fall condition pre-flooding likely caused dormancy in the pasture vegetation resulting in the lower NDVI values, whereas the warmer Spring condition post-flooding likely stimulated pasture vegetation growth and the higher NDVI values [41]. The different seasons of data collection were due to a lack of cloud-free high spatial resolution remotely sensed data for the study area of the same season. This is a limitation of this study. However, the remotely sensed data used in this study have successfully detected the grazing land cover change and pasture quality pre- and post-flooding at a finer scale. Further study will examine this pasture quality and cover at previous years and of the same seasons when no flooding occurred to suppose if the significant change in pasture quality and cover in this study can be attributed sorely to flooding or seasonal effects. Nonetheless, this study has provided a new account of grazing land cover change and pasture quality pre- and post-flooding event in sub-tropical environment. The high post-flooding pasture NDVI values found in this study are similar to the results of Sims and Colloff [42] that found a 19% increase in NDVI values of vegetation post-flooding in the semi-arid floodplain (Paroo River Wetlands) in Australia.
Although high spatial resolution drone and WorldView-4 satellite data have been used to map and monitor grazing land cover types and pasture quality in this study, there are some limitations in using these datasets. For example, the availability of cloud-free WorldView-4 satellite data is a limiting factor and with the recent WoldView-4 satellite malfunction in 2019, there is likely limited acquisition of WorldView-4 satellite data globally. Furthermore, although real-time drone data can be easily acquired, the flying of drones has altitude restrictions and is weather-dependent. Nonetheless, high spatial resolution drone and WorldView-4 satellite data can be used to map and monitor grazing land cover at a finer scale not likely detected using moderate spatial resolution remote sensing data.

5. Conclusions

The high spatial resolution drone and WorldView-4 satellite data used in this study have proven successful in mapping and monitoring grazing land cover change and pasture quality pre- and post-flooding. The grazing land cover classes were produced with overall mapping accuracy of about 96%. The pasture cover and quality were found to increase significantly post-flooding relative to pre-flooding. The seasonal changes in remotely sensed data acquisition likely contributed to the change in grazing land cover and pasture quality pre- and post-flooding. Furthermore, the flooding that covered about 75% of the study area likely also contributed to the increase in pasture cover and quality in the study area. However, further study is required to examine the grazing land cover and pasture quality in previous years when flooding did not occur to assume flooding is the main contributing factor to the change in pasture quality and land cover change. This is an area of further research.
However, as high spatial resolution drone and satellite data are increasingly becoming cheaper worldwide, it is relevant to utilize these datasets for mapping and monitoring in grazing environments to support land management.

Author Contributions

Conceptualization, C.E.A.; methodology, C.E.A.; validation, C.E.A. and E.O.A.; formal analysis, C.E.A.; writing—original draft preparation, C.E.A.; writing—review and editing, C.E.A. and S.D.; visualization, C.E.A. and S.D.; supervision, C.E.A.; project administration, C.E.A.; All authors have read and agreed to the published version of the manuscript.

Funding

This research received no external funding.

Institutional Review Board Statement

Not applicable.

Informed Consent Statement

Not applicable.

Acknowledgments

Many thanks to the United States Department of Agriculture (USDA) for supporting this project through the Evans Allen Funding Program.

Conflicts of Interest

The authors declare no conflict of interest.

References

  1. Imaz, J.A.; Giménez, D.O.; Grimoldi, A.A.; Striker, G.G. Ability to recover overrides the negative effects of flooding on growth of tropical grasses Chloris gayana and Panicum coloratum. Crop Pasture Sci. 2015, 66, 100–106. [Google Scholar] [CrossRef]
  2. Redfearn, D.; Beckman, B. Reclaiming Flood-Damaged Pastures and Forage Production; University of Nebraska–Lincoln, BEEF: Lincoln, NE, USA, 2019; Available online: https://beef.unl.edu/beefwatch/reclaiming-flood-damaged-pastures-and-forage-production (accessed on 16 November 2020).
  3. Striker, G.G.; Ploschuk, R.A. Recovery from short-term complete submergence in temperate pasture grasses. Crop Pasture Sci. 2018, 69, 745–753. [Google Scholar] [CrossRef]
  4. Hall, T.J. Pasture Recovery, Land Condition and Some Other Observations after the Monsoon Flooding, Chill Event in North-West Queensland in Jan–Mar 2019; Department of Agriculture and Fisheries, Queensland Government: George St. Brisbane, Queensland, Australia, 2020.
  5. Arabameri, A.; Pourghasemi, H.R. Spatial Modeling of Gully Erosion Using Linear and Quadratic Discriminant Analyses in GIS and R. In Spatial Modeling in GIS and R for Earth and Environmental Sciences; Pourghasemi, H.R., Gokceoglu, C., Eds.; Elsevier Inc.: Amsterdam, The Netherlands, 2019; pp. 299–321. [Google Scholar]
  6. Gessesse, A.A.; Melesse, A.M. Temporal relationships between time series CHIRPS-rainfall estimation and eMODIS-NDVI satellite images in Amhara Region, Ethiopia. In Extreme Hydrology and Climate Variability: Monitoring, Modelling, Adaptation and Mitigation; Melesse, A.M., Abtew, W., Senay, G., Eds.; Elsevier Inc.: Amsterdam, The Netherlands, 2019; pp. 81–92. [Google Scholar]
  7. Insua, J.R.; Utsumi, S.A.; Basso, B. Estimation of spatial and temporal variability of pasture growth and digestibility in grazing rotations coupling unmanned aerial vehicle (UAV) with crop simulation models. PLoS ONE 2019, 14, e0212773. [Google Scholar] [CrossRef] [Green Version]
  8. Michez, A.; Lejeune, P.; Bauwens, S.; Herinaina, A.A.L.; Blaise, Y.; Muñoz, E.C.; Lebeau, F.; Bindelle, J. Mapping and Monitoring of Biomass and Grazing in Pasture with an Unmanned Aerial System. Remote Sens. 2019, 11, 473. [Google Scholar] [CrossRef] [Green Version]
  9. Wiesmair, M.; Feilhauer, H.; Magiera, A.; Otte, A.; Waldhardt, R. Estimating Vegetation Cover from High-Resolution Satellite Data to Assess Grassland Degradation in the Georgian Caucasus. Mt. Res. Dev. 2016, 36, 56–65. [Google Scholar] [CrossRef] [Green Version]
  10. Ali, I.; Cawkwell, F.; Dwyer, E.; Barrett, B.; Green, S. Satellite remote sensing of grasslands: From observation to management. J. Plant Ecol. 2016, 9, 649–671. [Google Scholar] [CrossRef] [Green Version]
  11. Ramoelo, A.; Cho, M.A.; Mathieu, R.; Madonsela, S.; van de Kerchove, R.; Kaszta, Z.; Wolff, E. Monitoring grass nutrients and biomass as indicators of rangeland quality and quantity using random forest modelling and WorldView-2 data. Int. J. Appl. Earth Obs. Geoinf. 2015, 43, 43–54. [Google Scholar] [CrossRef]
  12. Falldorf, T.; Strand, O.; Panzacchi, M.; Tømmervik, H. Estimating lichen volume and reindeer winter pasture quality from Landsat imagery. Remote Sens. Environ. 2014, 140, 573–579. [Google Scholar] [CrossRef] [Green Version]
  13. Tsalyuk, M.; Kelly, M.; Koy, K.; Getz, W.M.; Butterfield, H.S. Monitoring the Impact of Grazing on Rangeland Conservation Easements Using MODIS Vegetation Indices. Rangel. Ecol. Manag. 2015, 68, 173–185. [Google Scholar] [CrossRef] [Green Version]
  14. Ndungu, L.; Oware, M.; Omondi, S.; Wahome, A.; Mugo, R.; Adams, E. Application of MODIS NDVI for Monitoring Kenyan Rangelands Through a Web Based Decision Support Tool. Front. Environ. Sci. 2019, 7, 187. [Google Scholar] [CrossRef] [Green Version]
  15. Theau, J.; Lauzier-Hudon, E.; Aube, L.; Devillers, N. Estimation of forage biomass and vegetation cover in grasslands using UAV imagery. PLoS ONE 2021, 16, e0245784. [Google Scholar] [CrossRef]
  16. Meshesha, D.T.; Ahmed, M.M.; Abdi, D.Y.; Haregeweyn, N. Prediction of grass biomass from satellite imagery in Somali regional state, eastern Ethiopia. Heliyon 2020, 6, e05272. [Google Scholar] [CrossRef] [PubMed]
  17. Zhang, X.; Chen, X.; Tian, M.; Fan, Y.; Ma, J.; Xing, D. An evaluation model for aboveground biomass based on hyperspectral data from field and TM8 in Khorchin grassland, China. PLoS ONE 2020, 15, e0223934. [Google Scholar] [CrossRef] [PubMed] [Green Version]
  18. Liu, S.; Cheng, F.; Dong, S.; Zhao, H.; Hou, X.; Wu, X. Spatiotemporal Dynamics of Grassland Aboveground Biomass on the Qinghai-Tibet Plateau Based on Validated MODIS NDVI; Scientific Reports; Springer Nature: Berlin/Heidelberg, Germany, 2017; Available online: www.nature.com/scientificreports (accessed on 12 December 2020).
  19. Al-Najjar, H.A.H.; Kalantar, B.; Pradhan, B.; Saeidi, V.; Halin, A.A.; Ueda, N.; Mansor, S. Land Cover Classification from fused DSM and UAV Images Using Convolutional Neural Networks. Remote Sens. 2019, 11, 1461. [Google Scholar] [CrossRef] [Green Version]
  20. Sandino, J.; Gonzalez, F.; Mengersen, K.; Gaston, K.J. UAVs and Machine Learning Revolutionising Invasive Grass and Vegetation Surveys in Remote Arid Lands. Sensors 2018, 18, 605. [Google Scholar] [CrossRef] [PubMed] [Green Version]
  21. Kawamura, K.; Lim, J.; Kurokawa, Y.; Obitsu, T.; Yayota, M.; Ogura, S. Monitoring Spatial Heterogeneity of Pasture within Paddock Scale using a Small Unmanned Aerial Vehicle (sUAV). JIFS 2017, 14, 61–66. [Google Scholar]
  22. Oliveira, R.A.; Näsi, R.; Niemeläinen, O.; Nyholm, L.; Alhonoja, K.; Kaivosoja, J.; Jauhiainen, L.; Viljanen, N.; Nezami, S.; Markelin, L.; et al. Machine learning estimators for the quantity and quality of grass swards used for silage production using drone-based imaging spectrometry and photogrammetry. Remote Sens. Environ. 2020, 246, 111830. [Google Scholar] [CrossRef]
  23. Barnetson, J.; Phinn, S.; Scarth, S. Estimating Plant Pasture Biomass and Quality from UAV Imaging across Queensland’s Rangelands. AgriEngineering 2020, 2, 35. [Google Scholar] [CrossRef]
  24. U.S. Census Bureau. TENNESSEE—Core Based Statistical Areas (CBSAs) and Counties; U.S. Department of Commerce Economics and Statistics Administration, U.S. Census Bureau: Jeffersonville, IN, USA, 2013. Available online: https://www2.census.gov/geo/maps/metroarea/stcbsa_pg/Feb2013/cbsa2013_TN.pdf (accessed on 15 December 2020).
  25. Hodges, J.A.; Norrell, R.J.; Sarah, M.H. Tennessee; Encyclopedia Britannica, Inc., 2018. Available online: https://www.britannica.com/place/Tennessee/additional-info#contributors (accessed on 25 November 2020).
  26. United States Climate Data. Climate Nashville Area—Tennessee; Your Weather Sevice-World Climate, 2018. Available online: https://www.usclimatedata.com/climate/nashville/tennessee/united-states/ustn0357 (accessed on 15 December 2020).
  27. Mitsch, W.J.; Gosselink, J.G.; Zhang, L.; Anderson, C.J. Wetland Ecosystems; Wiley: Hoboken, NJ, USA, 2009. [Google Scholar]
  28. USDA. Published Soil Surveys for Tennessee; United States Department of Agriculture, Natural Resources Conservation Service: Washington, DC, USA, 2021. Available online: https://www.nrcs.usda.gov/wps/portal/nrcs/surveylist/soils/survey/state/?stateId=TN (accessed on 10 March 2021).
  29. Meador, M.R. Tennessee wetland resources. In National Water Summary on Wetland Resources; Fretwell, J.D., Williams, J.S., Redman, P.J., Eds.; U.S. Geological Survey Water-Supply Paper 2425; 1996. Available online: https://pubs.er.usgs.gov/publication/wsp2425 (accessed on 14 February 2021).
  30. Mather, P.M.; Koch, M. Computer Processing of Remotely-Sensed Images: An Introduction, 4th ed.; John Wiley and Sons: Chichester, UK, 2011. [Google Scholar]
  31. Maxar. Absolute Radiometric Calibration: 2018v0; Maxar Technologies: Westminster, CO, USA, 2018. Available online: https://www.maxar.com/ (accessed on 14 October 2020).
  32. Breiman, L. Random forests—Random Features; Technical Report 567; Statistics Department, University of California: Berkeley, CA, USA, 1999; Available online: ftp//ftp.stat.berkeley.edu/pub/users/breiman (accessed on 10 January 2021).
  33. Belgiu, M.; Dragut, L. Random forest in remote sensing: A review of applications and future directions. ISPRS J. Photogramm. Remote Sens. 2016, 114, 24–31. [Google Scholar] [CrossRef]
  34. Fernández-Delgado, M.; Cernadas, E.; Barro, S.; Amorim, D. Do we need hundreds of classifiers to solve real world classification problems. J. Mach. Learn. Res. 2014, 15, 3133–3181. [Google Scholar]
  35. Sokolova, M.; Lapalme, G. A systematic analysis of performance measures for classification tasks. Inf. Process. Manag. 2009, 45, 427–437. [Google Scholar] [CrossRef]
  36. Shao, W.; Kawakami, R.; Yoshihashi, R.; You, S.; Kawase, H.; Naemura, T. Cattle detection and counting in UAV images based on convolutional neural networks. Int. J. Remote Sens. 2020, 41, 31–52. [Google Scholar] [CrossRef] [Green Version]
  37. Fan, J.; Zhang, W.; Amombo, E.; Hu, L.; Kjorven, J.O.; Chen, L. Mechanisms of Environmental Stress Tolerance in Turfgrass. Agronomy 2020, 10, 522. [Google Scholar] [CrossRef] [Green Version]
  38. Qiao, D.; Zhang, Y.; Xiong, X.; Li, M.; Cai, K.; Luo, H.; Zeng, B. Transcriptome analysis on responses of orchard grass (Dactylis glomerata L.) leaves to a short term flooding. Hereditas 2020, 157, 1–16. [Google Scholar] [CrossRef]
  39. Mansour, J.; Moien, J. Study effect of flood productivity on vegetation changes using field work and Landsat satellite images (Case study: Shandak of Sistan region). J. Appl. Rs. Gis. Technol. Nat. Resour. Sci. 2020, 10, 57–73. [Google Scholar]
  40. Montserud, R.A.; Leamans, R. Comparing global vegetation maps with kappa statistics. Ecol. Modeling 1992, 62, 275–293. [Google Scholar] [CrossRef]
  41. Zhou, X.; Geng, X.; Yin, G.; Hänninen, H.; Hao, F.; Zhang, X.; Fu, Y.H. Legacy effect of spring phenology on vegetation growth in temperate China. Agric. For. Meteorol. 2020, 281, 107845. [Google Scholar] [CrossRef]
  42. Sims, N.C.; Colloff, M.J. Remote sensing of vegetation responses to flooding of a semi-arid floodplain: Implications for monitoring ecological effects of environmental flows. Ecol. Indic. 2012, 18, 387–391. [Google Scholar] [CrossRef]
Figure 1. The location of the study area showing a drone aerial image of the grazing land area.
Land 10 00321 g001
Figure 2. Drone image of standing flood water occupying on average about 75% of the study area from 21st to the 26th of February 2019.
Land 10 00321 g002
Figure 3. A schematic representation of the methodology.
Land 10 00321 g003
Figure 4. Pre-flooding grazing land cover.
Land 10 00321 g004
Figure 5. Post-flooding grazing land cover.
Land 10 00321 g005
Figure 6. Pasture normalized difference vegetation index (NDVI) pre-flooding.
Land 10 00321 g006
Figure 7. Pasture NDVI post-flooding.
Land 10 00321 g007
Figure 8. Mean pasture NDVI pre- and post-flooding. Error bars represented standard deviation (SD) of the mean.
Land 10 00321 g008
Table 1. Error matrix table of post-flooding grazing land cover classes.
ClassesPastureBare GroundTotal
Reference
Pasture40040
Bare ground2810
Total42850
User
Accuracy (%)
Producer
Accuracy (%)
Overall
Accuracy (%)
Kappa F-Acore
Pasture10095
Bare ground80100
Overall, kappa, and
F-score
960.86 0.97
Publisher’s Note: MDPI stays neutral with regard to jurisdictional claims in published maps and institutional affiliations.

