
Evaluating the Impact of Large-Scale Agricultural Investments on Household Food Security Using an Endogenous Switching Regression Model


Department of Agricultural Economics, Extension and Rural Development, University of Pretoria, Pretoria 0028, South Africa
*
Author to whom correspondence should be addressed.
Land 2021, 10(3), 323; https://0-doi-org.brum.beds.ac.uk/10.3390/land10030323
Submission received: 5 February 2021
/
Revised: 26 February 2021
/
Accepted: 4 March 2021
/
Published: 20 March 2021
(This article belongs to the Special Issue Land Rush in Africa)
Abstract
:This study set out to estimate the effects of large-scale agricultural investments (LSAIs) on household food security in one community each in Kenya, Madagascar and Mozambique. An endogenous switching regression model was adopted to control for a possible selection bias due to unobserved factors. It was found that households with members employed by large-scale agricultural investment companies were more likely larger households headed by younger migrant males holding smaller plots and fewer livestock than non-engaged households. The endogenous switching regression results confirmed the presence of both a positive and negative selection bias. In general, the results showed that households with a member employed by an LSAI enjoyed better household food security, higher dietary diversity, better food consumption scores and more adequate household food provisioning. Households without employed members could also enjoy these benefits should the LSAIs employ their members. However, the seasonal nature and low wages paid by LSAI may only support the purchase of food and not facilitate savings and investments to significantly improve food security.
1. Introduction
The acquisition of large-scale agricultural land has increased since the global food and fuel price crisis of 2007/2008 [1]. Developed countries such as Europe and the United States of America have sought to acquire land in developing countries to produce cash crop and biofuels [2]. Countries with large populations and food security concerns such as China, South Korea and India have sought opportunities to balance domestic production risks and diversify food sources by producing food abroad [3]. Countries that have a shortage of agricultural land, such as the Gulf states are also looking for land elsewhere to produce food to fill their consumption needs [4]. These investments often focus on developing countries where land and water are abundant and production costs are lower [5].
Africa is the leading targeted continent for large-scale land acquisitions in the global south [4]. In most Sub-Saharan African countries, the purposes of land acquisitions are for producing food crop, biofuel, fiber crops and flower for export [6,7]. Studies identified the main drivers of LSAI such as food security initiatives, fuel security, climate change mitigation strategies, week land tenure system and contemporary needs for new areas of investment of global capital. Land acquisitions in these three countries (Kenya, Madagascar and Mozambique) have been increasing following the 2007/2008 global crisis [4].
There are two arguments on the impact of large-scale agricultural investment. Some researchers are concerned that large-scale agricultural investments could have adverse effects on the food security of local communities [6,7,8,9,10,11]. Others point out that such acquisitions could have positive spillover effects for local communities [12,13,14,15,16,17,18]. Employment by large companies may provide income and food security for subsistence agriculture households [12,19,20,21]. However, some studies have found that large-scale agricultural investments could bring mixed blessings [22,23,24,25,26,27,28,29,30,31,32,33,34]. Large-scale agricultural investments create job opportunity, improved infrastructure (including roads), increase production and access to farm inputs and technologies may have positive implications for development and food security [14,15,16,17,18]. However, negative social, economic and environmental impacts may negatively affect the livelihoods and health of the communities [7,8,9,10].
The impact of LSAIs is controversial among researchers, international agencies and activists [8]. Despite this interest, few attempts have investigated the impact of large-scale investments on the food security of households in developing countries Most available studies have focused on the impact of large-scale agricultural investments on household income [6,22]; production and productivity [13,23]; livelihoods of the households [6], land tenure and governance [22,23] and environmental aspects [6,13,29,30] rather than food security.
Available studies on the impact of land acquisition on households food security in Kenya, Madagascar and Mozambique have mainly used descriptive analysis and single measures of food security [6,10,21,23,27,35,36,37] (see Table 1). Most findings from these studies show that LSAIs created job opportunities, built infrastructure and enabled access to farm inputs and new technologies. Other studies show that LSAIs have had negative socio-economic and environmental impacts on communities such as conflict, migration, air and water pollution and reduced land and water access for smallholder farmers [6,13,23,29,30]. Table 1 presents a summary of relevant case studies that have examined the impact of large-scale agricultural investments in these three countries from the focus of this paper.
This paper explores the food security impacts of large-scale agricultural investments (LSAIs) in communities in Kenya, Madagascar and Mozambique. It adds to the limited empirical information on these impacts on food security.
2. Methodology
This study used secondary data from Kenya, Madagascar and Mozambique, collected by African Food, Agriculture, Land and Natural Resource Dynamics in the Context of Global Agro-food-energy System Changes (AFGROLAND) project. This section provides detailed information on the descriptions of the study areas, data collected, and data analysis methods.
2.1. Description of the Study Areas
The agriculture sector in these three countries is dominated by smallholder production (78 percent of the total agricultural production comes from smallholder sector in Kenya, 70 percent in Madagascar and 95 percent in Mozambique) [39]. Agriculture in Kenya contributes to 25 percent of gross domestic product (GDP), 65 percent of exports and employs 60 percent of the total labor force. In Madagascar, agriculture contributes to 17 percent of gross domestic product, 40 percent of export earnings and 60 percent of the total labor force and in Mozambique 24 percent of gross domestic product and 80 percent of the total labor force. While almost 80 percent of Kenya’s farming activities accomplished by women compared to 35 percent in Mozambique and very few in Madagascar. According to World Bank 2019 report, Kenya has the higher GDP per capital 1816 USD followed by Madagascar 523 and Mozambique 503 USD.
Only a few households in the three countries have certified land (land-titled) although the land tenure systems are significantly different in the three countries [40,41,42]. Most land in Kenya is under customary land tenure system and only 10 percent of land owned by the state. In Madagascar, land can be owned by the state, individuals or groups, individuals can register and get a land title from land administration system, but only seven percent of Madagascar’s land is titled. While, in Mozambique land and its associated resources are the property of the State, individuals have the right to use and benefit from the land known as Direito do Uso e Aproveitamento da Terra (DUAT). Kenya has a well-integrated economy with a comparatively mature commercial agriculture sector compared to Madagascar and Mozambique [42]. Agricultural land out of the total land was 48 percent in Kenya, 63 percent in Mozambique and 71 percent of the island in Madagascar. Since 2009, Mozambique has been hosting to more LSAIs than Kenya and Madagascar [4]. As of September 2020, the Land Matrix database recorded concluded deals in Kenya, covering 550,270 ha, compared to 1,366,677 ha in Madagascar and 2,992,821 ha in Mozambique [43].
Crops and livestock production vary across the three countries. Maize, potatoes and wheat are the main crops cultivated in Kenya; rice and cassava are the most common crops in Madagascar and maize, sorghum and beans in Mozambique [42]. In Kenya and Madagascar, cattle production is more dominant among smallholder farmers, while in Mozambique poultry is more common. According to the Global Hunger Index (GHI) 2019 report, the three countries have low Global Hunger Index scores [44]. Relatively, Kenya had better GHI (ranked 86th out of 117 countries) than Madagascar and Mozambique (ranked 114th and 96th, respectively).
2.2. Site and Sample Selection
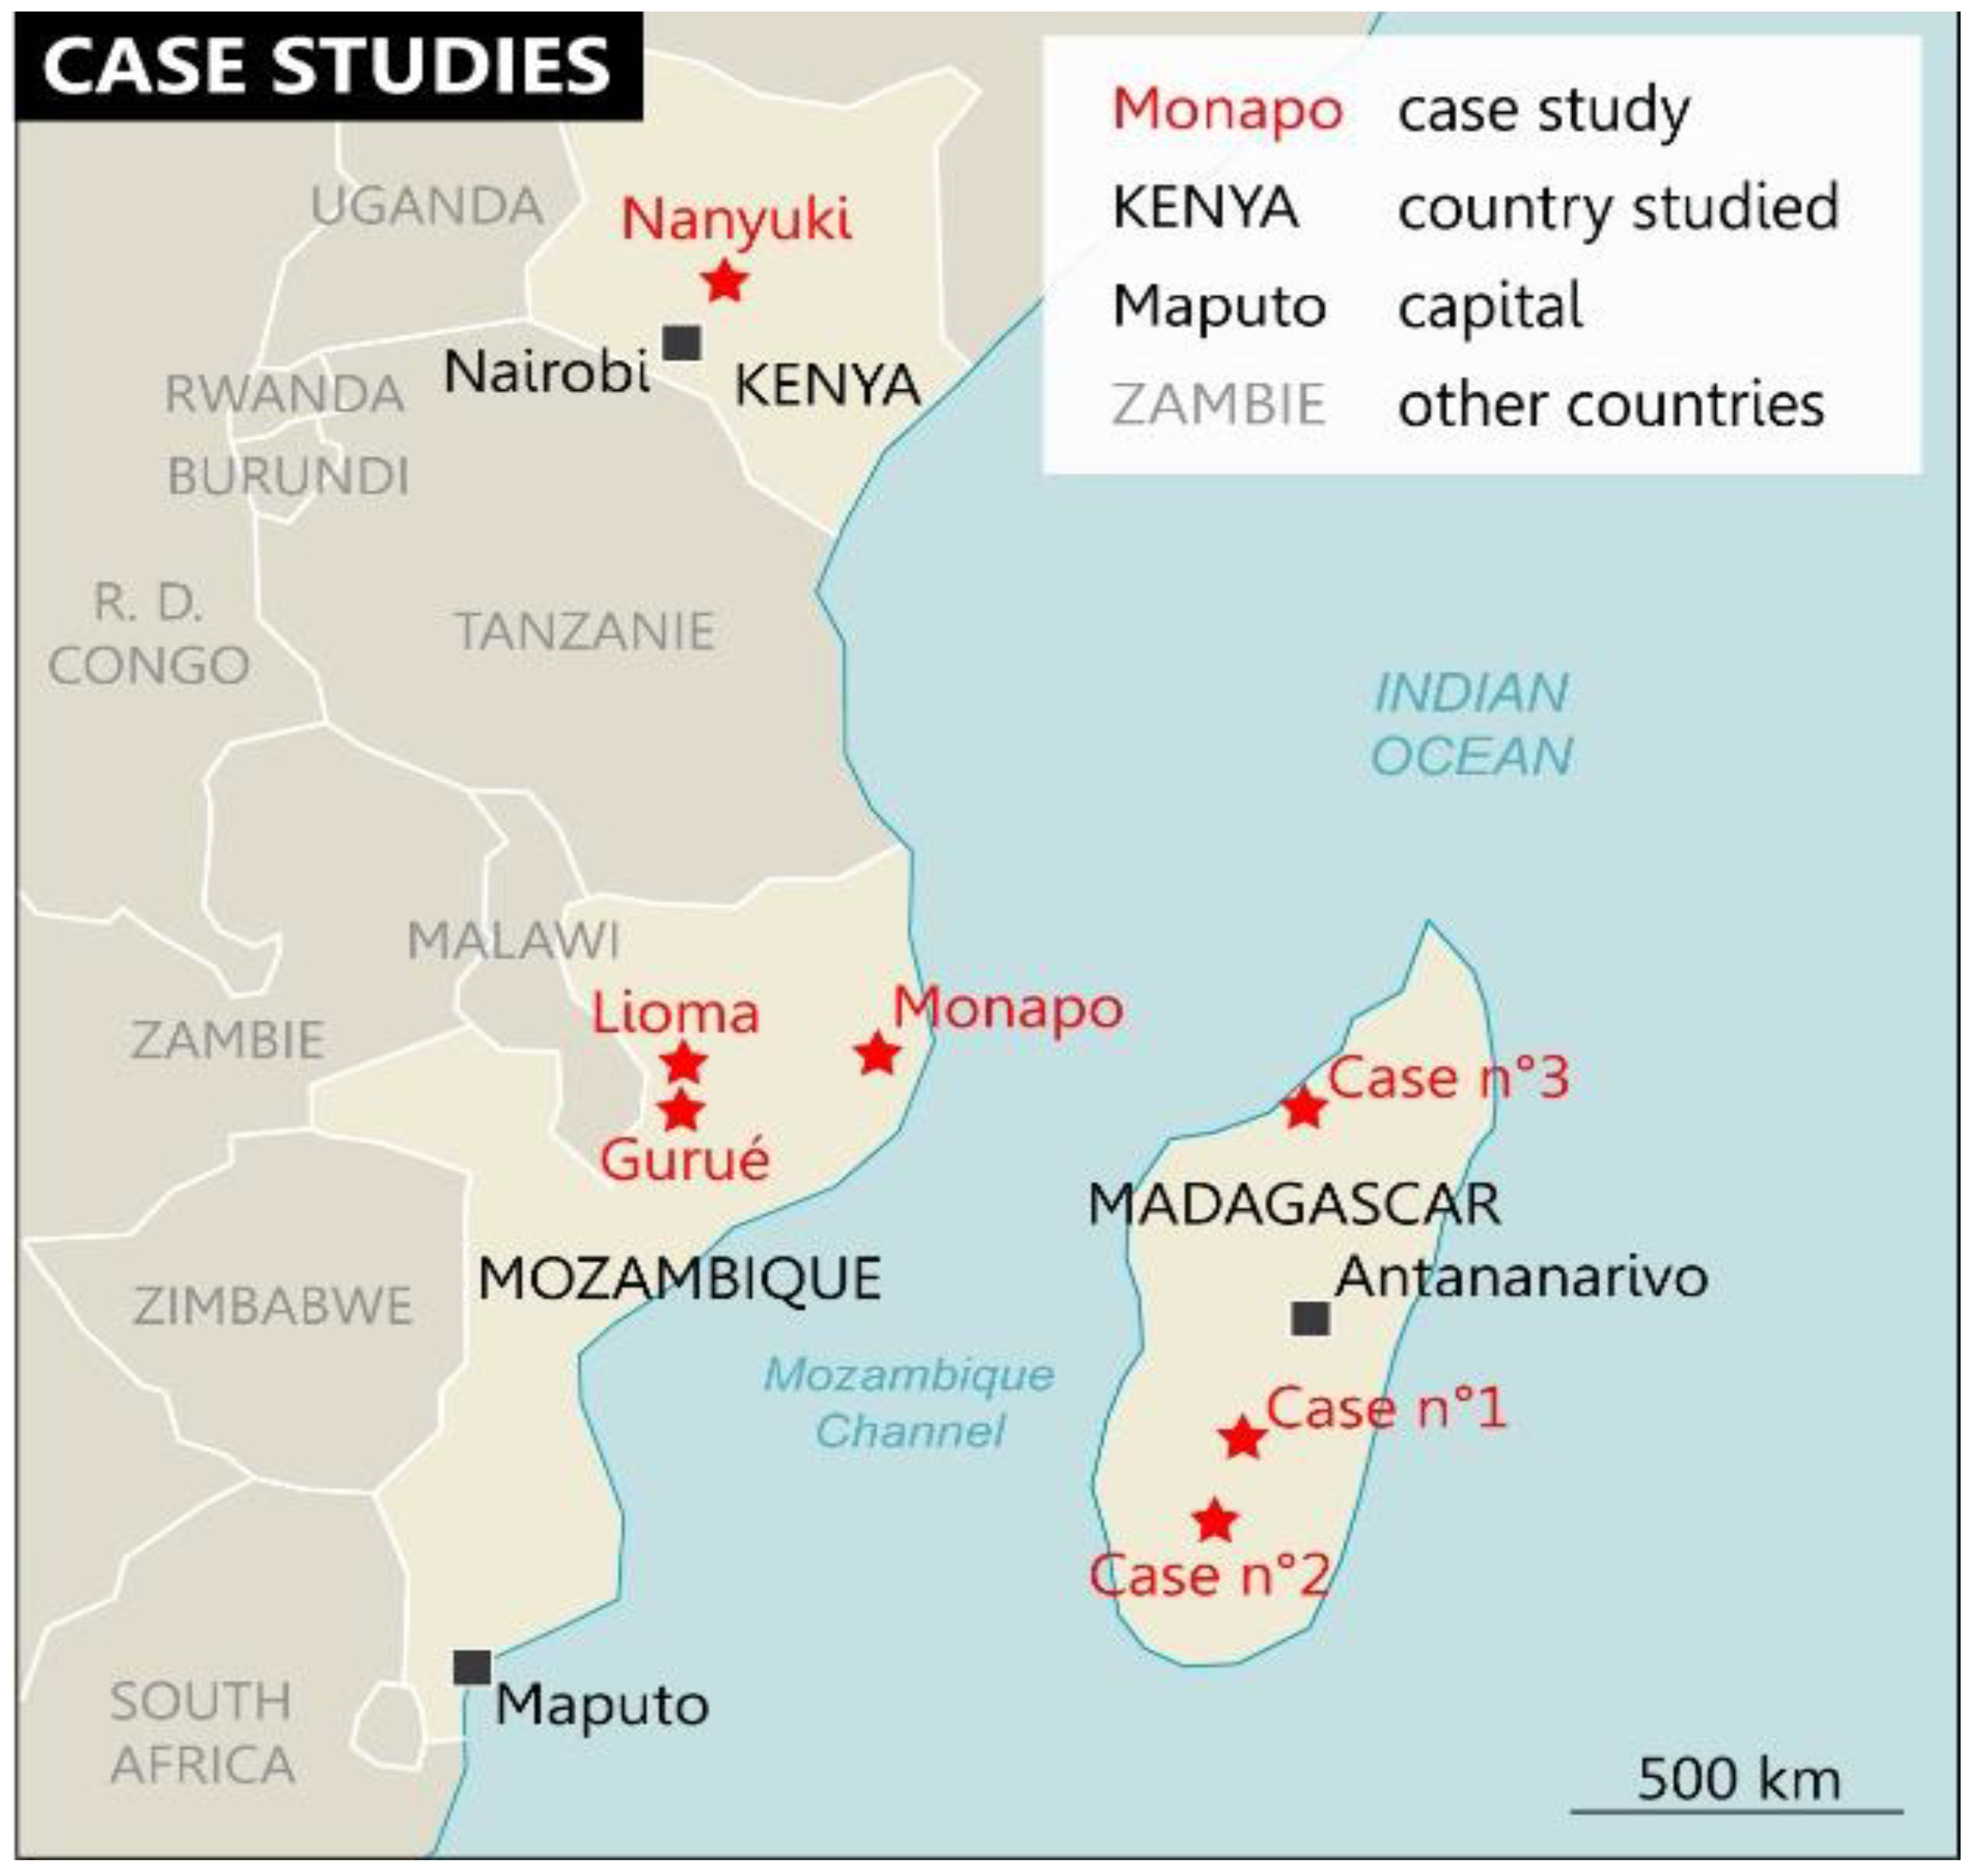
The AFGROLAND project selected the three countries (Kenya, Madagascar and Mozambique for two reasons. The main reason was these three countries were among the top destination of LSAIs in Africa and available studies on the impact of land acquisition on households food security in Kenya, Madagascar and Mozambique have mainly used descriptive analysis and single measures of food security compared to other targeted African countries such as Ethiopia. In each country, LSAI projects were purposively selected in the Nanyuki area from Kenya; Satrokala and Ambatofinandrahana from Madagascar and the Nacala Corridor of Mozambique (Monapo and Gurué districts) as shown in the figure below (Figure 1) [45,46,47]. The AFGROLAND project team selected these cases for the following reasons: (1) the level of development of the companies (most of the companies were 10–20 years old); (2) the area cultivated (i.e., greater than 200 ha, only two LSAI companies in Kenya were less than 200 ha); (3) the number of households potentially affected (through contracts, jobs or land losses); and (4) the willingness of the large company to work with the researchers.
2.3. Data and Variables
The data were collected using semi-structured questionnaires in Mozambique in 2016 and Kenya and Madagascar in 2017 [45,46,47]. Detailed information on household demographic characteristics, food and non-food expenditure and food security data were collected using a survey. The analysis was done from a total sample of 1296 households (i.e., three countries) as shown in the table below (Table 2).
Households were classified as employed where at least one member was employed by an LSAI and non-engaged where the companies did not employ members. A binary variable (1 for employed and 0 for non-engaged) was used for this classification. Variable names, description and expected sign are presented in the table below (Table 3).
2.4. Measuring Household Food Security
Household food security was measured using four different food security indicators: the household dietary diversity score (HDDS), food consumption score (FCS), the months of adequate household food provisioning (MAHFP) and food expenditure share. These internationally recognised tools and their recall periods are summarised in the table below (Table 4).
2.5. Analytical Framework
This study employed an endogenous switching regression model to examine the impact of large-scale agricultural investments on food security. The endogenous switching regression model was developed by Lee in 1982 [61], as a generalisation of Heckman’s selection correction approach [62]. An endogenous switching regression model accounts for the selection bias that may have occurred due to self-selection of employed households [63,64,65]. Selection bias could also arise from unobserved factors that potentially affect participation in employment in LSAIs.
An endogenous switching regression consists of two stages [65,66,67,68,69]. In the first stage, a probit model was used to identify the socio-economic factors that determined household employment in LSAIs. We estimated the selection equation as follows [70]:
where Zi* was a binary variable takes the value 1 if the household was engaged in employment and 0 otherwise; a was an intercept; Qi was a vector of exogenous variables influencing the participation decision; γ was a vector of coefficient and εi was the disturbance term with zero mean and a constant variance.
In the second stage of the endogenous switching regression model, a full information maximum likelihood (FIML) model was used to account for potential selection bias. The binary outcomes (the food security status of the households) conditional on being employed in LSAIs were represented as switching regimes as follows:
where Yi represented the outcomes variables (food security indicators) of household i for each regime (1 = for employed and 0 = non-engaged); Xi was a vector of determinant variables that affect household food security status. The variables in vectors X in Equations (2) and (3) may overlap with Q in Equation (1), but the approach requires that at least one variable in Q that does not appear in X. β and σ were parameters to be estimated, and u1i and u2i were independently and identically distributed error terms of the food security estimation equation. The Inverse Mills Ratio (IMR) of participation computed from the selection Equation (1) by included in Equations (2) and (3) to correct for selection bias in two-step estimation procedure (i.e., endogenous switching regression) as
Non-zero covariance between the error terms of the selection equation and the outcome equation that showed the presence of selection bias and the null hypothesis of the absence of a selection bias would be rejected.
The three error terms ε, u1i and u2i are assumed to follow a trivariate normal distribution with zero mean vector and covariance matrix [62] defined as:
The covariance between the error terms of the selection equation and outcome equation was denoted by (cov (ε, u) = ρ). Where ρ1e and ρ2e were the correlation coefficients between u1i and εi and between u2i and εi respectively. If ether ρ1e or ρ2e was significantly different from zero, the existence of selection bias would be confirmed. If ρ > 0, then there was negative selection bias, indicating that households that had below-average HDDS, FCS, MAHFP and household food expenditure shares were more likely to be employed in LSAIs. If ρ < 0, a positive selection bias would indicate that households with above-average HDDS, FCS, MAHFP and household food expenditure shares would more likely be employed in LSAIs.
Access to new technology and the land tenure system were used as instrumental variables in the selection model to address the endogeneity problem [70,71]. These affected household participation in employment but did not directly affect the food security status of the households. We selected the access to new technology as an instrument because some households may have decided to be employed in an LSAI to gain access to new technologies such as improved seeds, storage facilities, marketing facilities, pesticides and different types of machinery. The land tenure system may have affected household decision to participate in employment, mostly if the households were under customary and informal land tenure systems. Customary landholding lacked security of tenure to ensure agricultural investment and productive use of land. Customary laws are mostly not written or documented. The community leader or the chief’s can easily deal with investors without consulting the community [1,5]. Therefore, the probability of households losing their land rights and participating in employment may have been higher under customary tenure system than land-titled households.
This paper’s main interest was to estimate the average treatment effects, the change in the outcomes due to employed in an LSAI estimated as the difference between employed and non-engaged. The average treatment effect was represented by Yi (HDD, FCS, MAHFP and food expenditure share) as shown in Equations (5)–(8). The equations for the expected conditional and average treatment effects of employed and non-engaged groups were given as:
The equation for employment in an LSAI
The equation for employed, they decided to not to employ by large-scale agricultural investment:
The equation for non-engaged, they decided to engage in large-scale agricultural investment:
The equation for non-engaged, which did not employ by large-scale agricultural investment:
We calculated the heterogeneity effects using the expected outcomes described in Equations (5) to (8). The base heterogeneity for employed households (BH1) was calculated as the difference between Equations (5) and (7), while base heterogeneity for non-engaged households (BH2) was calculated as the difference between Equations (6) and (8). Finally, we were estimated the transitional heterogeneity (TH) (ATT-ATU) to understand if the impact of participation in LSAIs was larger or smaller for households that had members employed by LSAI (Table 5). Therefore, the expected change in the level of food security for employed households (the average treatment effect of treated households or ATT was given as:
ATT = (a) − (b)
Similarly, we estimated the expected change on non-engaged households as, the average treatment effect on the untreated households (ATU) given as:
ATU = (c) − (d)
3. Results and Discussion
This section presents and discusses the findings of the study in two sub-sections. The descriptive results are presented in the first sub-section, followed by the endogenous switching regression results in the second sub-section.
3.1. Descriptive Results
The descriptive statistics of the surveyed households and the explanatory variables that determined household participation in LSAIs are presented in Table 6. The mean comparison test provided an overview of the food security status of employed and non-engaged households. The mean values of HDDS, FCS, MAHFP and household food expenditure share of employed members in Kenya were higher than for households in Madagascar and Mozambique.
In all the three countries, households with employed members were male-headed. Overall, in Kenya and Mozambique, household size among households with employed members was higher than in Madagascar. In Madagascar, households in which LSAIs did not engage members owned more livestock. They had larger plot sizes than households with employed members and non-engaged households in Kenya and Mozambique. The Kenyan households were on average, further from a market than households in Madagascar and Mozambique. Kenyan households with LSAIs employed members had better access to irrigation than non-engaged households in the same area. In Madagascar, households with employed members were typically migrants from other villages. Overall, non-engaged households in Mozambique had greater access to other revenue sources than households with employed members and non-engaged households in the Kenyan and Madagascar sites. Mozambican households with members employed by LSAIs had lost their land rights than households with employed members and non-engaged households in Kenya and Madagascar (Table 6).
3.2. Endogenous Switching Regression Results
The first stage of the endogenous switching regression analysis (the selection model) estimated the household determinants with an employed member in an LSAI. Each country had different determinant factors. However, the distance from a market was a common determinant factor in the three countries. For instance, there were seven determinant factors for employment in an LSAI in Kenya (sex, age and marital status of the household head, livestock ownership, land size, distance from a market and distance from a road). In Madagascar, four determinant factors for employment in an LSAI were livestock ownership, distance from a market, migration status of the household head and the location dummy. In Mozambique, five variables (education status of the household head, distance from a market, households that lost their land rights, access to other sources of revenue and location dummy) were determinant factors for employment in an LSAI (Table 7).
The positive coefficient for the sex of the household head showed that the probability of employment of a household member in an LSAI was higher for male-headed households. The negative coefficients for the age of the household head, livestock holdings and land size indicated that older household heads with more livestock and larger land sizes were less likely to have a member employed in an LSAI. Households with larger land size may have chosen to continue farming rather than seek employment in an LSAI. Distance from a market was another determinant of employment in an LSAI. Households that were further away from a market were less likely to have a member employed by an LSAI (Table 7).
Having other sources of revenue other than farming was another important determinant of employment in an LSAI in Mozambique. Having lost land rights was also one of the positive determinants of employment in an LSAI in Mozambique. If the household lost their land rights because of the establishment of an LSAI, the probability of engagement in off-farm activities or employment was high (Table 7). Only a few numbers of households that lost their land rights in Kenya and Madagascar.
The estimated results of the three countries’ endogenous switching regression model are presented in Supplementary Materials Tables S1–S3. A selection bias was detected and represented by the significant correlation coefficients of the selection equations in Tables S1–S3. Therefore, for more robust estimation, instrumental variables such as access to new technology and land tenure system were added in the selection model. The statistically significant coefficients for the variables for access to new technology and land tenure system showed that the selected instruments were relevant and affected household participation decision.
The significant results of the likelihood ratio test (χ2), the sigma (σi) and correlation coefficients (ρi) indicated the existence of self-selection problems and suggested that the three equations are jointly dependent. The model specification controlled for this inferred endogeneity [62]. The findings revealed that employment might not have had the same impact if non-engaged households decided to engage in employment with the LSAI. The positive and statistically significant coefficients of ρie (HDDS and MAHFP) in Mozambique, indicating a negative selection bias (Table S3). Households with a below-average food security status (HDDS and MAHFP) were more likely to have a member employed in an LSAI. A likely negative selection bias was also found for one food security indicators (FCS) in Madagascar (Table S2). The negative and statistically significant coefficients of ρie (MAHFP and food expenditure share) in Kenya show that the existence of a positive selection bias; indicating more food secure households were more likely to have members employed by an LSAI (Tables S1–S3).
Table 8 presents the expected value of the food security indicators under observed and unobserved scenarios. The endogenous switching model for HDDS showed that, on average, being employed in an LSAI increased the HDDS (number of food items consumed) from 6.41 to 8.27 in Kenya, from 2.37 to 5.41 in Madagascar and from 2.16 to 4.09 in Mozambique. If households that were employed in an LSAI chose not to be employed, the number of food items consumed decreased by 1.86 points in Kenya, 3.04 points in Madagascar and 2.16 points Mozambique. In the case of non-engaged households, the HDDS were 5.98 in Kenya, 4.93 in Madagascar and 5.97 in Mozambique. When non-engaged households decided to be employed in an LSAI, the HDDS of household would have increased from 5.98 to 7.26 in Kenya, from 4.93 to 10.01 in Madagascar and decreased from 5.97 to 5.23 in Mozambique (Table 8).
The results for the FCS in both observed and unobserved scenarios are also presented in Table 8. Being employed by an LSAI increased the FCS from 72.34 to 82.42 in Kenya, from 38.93 to 47.76 in Madagascar and from 45.49 to 55.00 in Mozambique. This indicated that if households were employed by an LSAIs, the FCS would have increased by 10.08, 8.83 and 9.51 points in Kenya, Madagascar and Mozambique, respectively. When non-engaged households decided to be employed by an LSAI, the FCS would have increased from 57.55 to 75.40 in Kenya, from 38.78 to 43.34 in Madagascar, while it decreased from 53.08 to 43.18 in Mozambique (Table 8). The result of both FCS and HDDS of non-engaged households in Mozambique would not seem improve when they decided to be employed by LSAI. This may be because of households in Mozambique have small land holdings and livestock compared to in Kenya and Madagascar. The salary paid by an LSAI may not be enough to significantly improved the food security status of non-engaged in Mozambique.
On average, for all three countries, households had access to food for more than eight months of the year before the surveys. Households employed by an LSAI enjoyed adequate food for 10.5, 9.6 and 10.9 months in Kenya, Madagascar and Mozambique, respectively. If employed households decided not to be employed by an LSAI, the household’s access to food would decrease from 10.6 to 8.7 months in Kenya, from 9.6 to 9.5 months in Madagascar and from 10.9 to 8.2 months in Mozambique. Whereas if non-engaged households decided to be employed in an LSAI the MAHFP of non-engaged households would have increased from 9.8 to 9.9 months in Kenya, from 6.7 to 9.5 months in Madagascar and 10.3 to 10.9 months in Mozambique (Table 8).
The food expenditure share results of sampled households in the three countries are presented in Table 8. In general, most sampled households in Kenya had lower food expenditure shares than households in Madagascar and Mozambique. For households with employed members, the food expenditure shares were 34.39, 80.52 and 77.85 in Kenya, Madagascar and Mozambique, respectively. In comparison, the food expenditure share of non-engaged households were 42.25, 76.33 and 80.41 in Kenya, Madagascar and Mozambique, respectively. If employed households were no longer employed, the food expenditure share increased by 16.98 points in Kenya and by 6.71 points in Mozambique. This result validates Engel’s law that has stated that the expenditure on food falls as the household income increases [72]. However, in Madagascar, the food expenditure share decreased by 4.27 points; indicting employed households were less food secure than non-engaged in Madagascar based on the food expenditure share indicator results. If a member of non-engaged household was employed by an LSAI, the food expenditure share would increase by 22.58, 1.05, and 3.07 points in Kenya, Madagascar and Mozambique, respectively (Table 8). The three countries’ food expenditure share results indicated that if a member of non-engaged households was to be employed by an LSAI, the food security status of the households would not improve. These results were not consistence with Engel’s law. This might be because of most of LSAIs jobs being seasonal and low-paid and the households employed by LSAIs had low living standards [14]. Therefore, the rise in income might be used to fill the food consumption gap.
Some of the signs of the base heterogeneity effects were positive, and others were negative, signaling that employed households’ food security level may have been influenced by the unobservable impacts of participation in employment [70]. A positive base heterogeneity effects implied that employed households were more food secure than non-engaged households. In some cases, the sign of transitional heterogeneity effects were negative. For example, the transitional heterogeneity effects were −7.78 for FCS in Kenya; −2.04 for HDDS and −1.39 for the MAHFP in Madagascar, while in Mozambique there was no negative transitional heterogeneity effect. This indicated that the impact of employment on household food security (FCS, HDDS and MAHFP) would be higher for non-engaged households if a member was to be employed by an LSAI.
Finally, Table 9 presents a summary of the average treatment effects (ATT), which show the effect of LSAIs on the food security status of employed households. The positive sign of the ATT for the three food security indicators (HDDS, FCS and MAHFP) implied that households with employed members had higher food security than non-engaged households. The HDDS, FCS, and MAHFP indicators were consistently higher among households with members employed by an LSAIs in the three countries. This finding confirms other studies’ results that employment creation had an income and food security benefit [12,21,72,73,74,75]. The food expenditure shares also confirmed this among households with employed members in Kenya and Mozambique. The negative sign of the ATT for food expenditure shares in Kenya and Mozambique indicated that households with employed members had lower food expenditure shares (more food secure) than non-engaged households. This result validates the Engel’s laws and concurs with other literature that has confirmed the lower household food expenditure is, the more food secures a household is [72,73,74,75]. However, this was not the case in Madagascar where the food expenditure share had positive ATT implying that non-engaged households were more food secure than households with employed members (Table 9).
In general, the three food security indicator results (for HDDS, FCS and MAHFP) in Kenya and Madagascar showed that large-scale agricultural investments had an impact on household food security in household where a member was employed by an LSAI. In Mozambique, only the MAHFP results showed an impact on both household groups, while the HDDS and FCS results showed that large-scale agricultural investments only had an impact on households that had a member employed by an LSAI. Food expenditure share results were not consistence with other food security indicators in Kenya and Mozambique where the result showed that LSAI had an impact on households with a member employed by an LSAI. However, if a member of a non-engaged household was to be employed by an LSAI, the food security status of the household would not improve in all three countries. The variation among indicators might be because of different economic status of the countries and due to many jobs being seasonal and low-paid.
4. Conclusions
The available literature on the impact of large-scale agricultural investments on household food security is contentious. Still, very few published empirical studies of the impact on food security inform these discussions. This study estimated employment impacts by large-scale agricultural investments on household food security in Kenya, Madagascar and Mozambique. The study used four internationally recognised food security indicators (HDDS, FCS, MAHFP and food expenditure share) to capture food security’s multidimensional nature in the three countries. An endogenous switching regression model was used to control for a possible selection bias. The results showed that heterogeneity in the sample arose from unobserved factors and self-selection during participation in employment in an LSAI.
Different determinant factors for the participation of household members in LSAI employment were evident in each country. The employment of household members by an LSAI seemed to improve food security in the three communities. Employment appeared to smooth consumption, although employment may be seasonal. Besides controlling for the selection bias and estimated ATT and ATU, the endogenous switching regression detected transitional heterogeneity (TH). The findings of some of the food security indicators revealed that the expected impact of employment on household food security would be higher for non-engaged households than households that had a member employed in an LSAI. The descriptive and econometric model results confirmed that households with employed members were more food security than households without members employed in an LSAI.
In conclusion, large-scale agricultural investments that create job opportunities may help improve household food security status in the surrounding communities. Due to the lack of baseline data, this study only used one data point for each country. Therefore, to capture the seasonality nature of food security, we recommend further studies using panel data to study the impact of large-scale agricultural investments on households food security.
Supplementary Materials
The following are available online at https://0-www-mdpi-com.brum.beds.ac.uk/2073-445X/10/3/323/s1, Supplementary Tables S1–S3: Endogenous switching regression results of Kenya, Madagascar and Mozambique.
Author Contributions
Conceptualisation, W.F. and S.L.H.; methodology, W.F. and S.L.H.; formal analysis, W.F.; software, W.F.; investigation, W.F. and S.L.H.; writing original draft preparation, W.F.; writing review and editing, S.L.H.; visualisation, W.F. and S.L.H.; supervision, S.L.H.; project administration, S.L.H.; funding acquisition, S.L.H. All authors have read and agreed to the published version of the manuscript.
Funding
This research was funded by Agriculture, Food Security and Climate Change (FACCE-JPI) African Food, Agriculture, Land and Natural Resource Dynamics (AFGROLAND) project.
Acknowledgments
W.F. receives a postgraduate bursary from the Land Matrix Initiative.
Conflicts of Interest
The authors declare no conflict of interest. The funders had no role in the design of the study; analyses, or interpretation of data; in the writing of the manuscript, or in the decision to publish the results.
References
- Cotula, L.; Oya, C.; Codjoe, E.A.; Eid, A.; Kakraba-Ampeh, M.; Keeley, J.; Asare, R.O. Testing claims about large land deals in Africa: Findings from a multi-country study. J. Dev. Stud. 2014, 50, 903–925. [Google Scholar] [CrossRef] [Green Version]
- GRAIN. The Global Farmland Grab in 2016: How Big, How Bad? GRAIN: Barcelona, Spain, 2016. [Google Scholar]
- Shete, M.; Rutten, M. Impacts of large-scale farming on local communities’ food security and income levels: Empirical evidence from Oromia Region, Ethiopia. Land Use Pol. 2015, 47, 282–292. [Google Scholar] [CrossRef]
- Nolte, K.; Chamberlain, W.; Giger, M. International Land Deals for Agriculture: Fresh Insights from the Land Matrix: Analytical Report II; Land Matrix: Rome, Italy, 2016. [Google Scholar]
- Daniel, S.; Mittal, A. The Great Land Grab: Rush for World’s Farmland Threatens food Security for the Poor; The Oakland Institute: Oakland, CA, USA, 2009; p. 24. [Google Scholar]
- Aabø, E.; Kring, T. The political economy of large-scale agricultural land acquisitions: Implications for food security and livelihoods/employment creation in rural Mozambique. United Nations Dev. Programme Work. Pap. 2012, 4, 1–61. [Google Scholar]
- Ali, A.D.; Deininger, K.; Duponchel, M. Using national statistics to increase transparency of large land acquisition: Evidence from Ethiopia. World Dev. 2017, 93, 62–74. [Google Scholar] [CrossRef] [Green Version]
- Cotula, L. The New Enclosures? Polanyi, international investment law and the global land rush. Third World Q. 2013, 34, 1605–1629. [Google Scholar] [CrossRef]
- Lisk, F. ‘Land grabbing’or harnessing of development potential in agriculture? East Asia’s land-based investments in Africa. Pac. Rev. 2013, 26, 563–587. [Google Scholar] [CrossRef]
- Matondi, P.B.; Havnevik, K.J.; Atakilte, B. Introduction: Biofuels, Food Security and Land Grabbing in Africa; Zed Books: Stockholm, Sweden, 2011; pp. 1–19. [Google Scholar]
- Nolte, K.; Ostermeier, M. Labour market effects of large-scale agricultural investment: Conceptual considerations and estimated employment effects. World Dev. 2017, 98, 430–446. [Google Scholar] [CrossRef]
- Baumgartner, P.; Von Braun, J.; Abebaw, D.; Müller, M. Impacts of large-scale land investments on income, prices, and employment: Empirical analyses in Ethiopia. World Dev. 2015, 72, 175–190. [Google Scholar] [CrossRef]
- Di Matteo, F.; Schoneveld, G.C. Agricultural Investments in Mozambique: An Analysis of Investment Trends, Business Models and Social and Environmental Conduct; CIFOR: Bogor, Indonesia, 2016; Volume 201. [Google Scholar]
- Herrmann, R.T. Large-scale agricultural investments and smallholder welfare: A comparison of wage labor and outgrower channels in Tanzania. World Dev. 2017, 90, 294–310. [Google Scholar] [CrossRef]
- Herrmann, R.; Jumbe, C.; Bruentrup, M.; Osabuohien, E. Competition between biofuel feedstock and food production: Empirical evidence from sugarcane outgrower settings in Malawi. Biomass Bioenergy 2018, 114, 100–111. [Google Scholar] [CrossRef]
- Lay, J.; Nolte, K.; Sipangule, K. Large-Scale Farms and Smallholders: Evidence from Zambia; (No. 310). Working Papers; German Institute of Global and Area Studies (GIGA): Hamburg, Germany, 2018. [Google Scholar]
- Oberlack, C.; Tejada, L.; Messerli, P.; Rist, S.; Giger, M. Sustainable livelihoods in the global land rush? Archetypes of livelihood vulnerability and sustainability potentials. Global Environ. Chang. 2016, 41, 153–171. [Google Scholar] [CrossRef] [Green Version]
- Osabuohien, E.S.; Olokoyo, F.O.; Efobi, U.R.; Karakara, A.A.; Beecroft, I. Large-scale land investments and household livelihood in Nigeria: Empirical insights from quantitative analysis. In The Palgrave Handbook of Agricultural and Rural Development in Africa; Palgrave Macmillan: Cham, Switzerland, 2020; pp. 133–152. [Google Scholar]
- Deininger, K.; Xia, F. Quantifying spillover effects from large land-based investment: The case of Mozambique. World Dev. 2016, 87, 227–241. [Google Scholar] [CrossRef] [Green Version]
- Kleemann, L.; Thiele, R. Rural welfare implications of large-scale land acquisitions in Africa: A theoretical framework. Econ. Model. 2015, 51, 269–279. [Google Scholar] [CrossRef] [Green Version]
- Speller, W.R.; Mirza, H.; Giroud, A.; Salguero Huaman, J.; Dixie, G.; Okumura, A. The Impact of Larger-Scale Agricultural Investments on Local Communities: Updated Voices from The Field; World Bank: Washington, DC, USA, 2017. [Google Scholar]
- Burnod, P.; Rakotomalala, H.; Rasolofo, P.; Brès, A. Large-scale plantation and contract farming effects: Qualitative and quantitative assessment in Madagascar. In Proceedings of the LANDac International Conference on Land Governance for Equitable and Sustainable Development, Utrecht, The Netherlands, 8–10 July 2015; pp. 8–10. [Google Scholar]
- Garcia, A.K.; Baltissen, G.; Betsema, G.; Schuurman, J. Food Security and Land Governance Factsheet Kenya; LANDac: Utrecht, The Netherlands, 2015. [Google Scholar]
- Hakizimana, C.; Goldsmith, P.; Nunow, A.A.; Roba, A.W.; Biashara, J.K. Land and agricultural commercialisation in Meru County, Kenya: Evidence from three models. J. Peasant Stud. 2017, 44, 555–573. [Google Scholar] [CrossRef] [Green Version]
- Hall, R.; Scoones, I.; Tsikata, D. Plantations, outgrowers and commercial farming in Africa: Agricultural commercialisation and implications for agrarian change. J. Peasant Stud. 2017, 44, 515–537. [Google Scholar] [CrossRef] [Green Version]
- Muraoka, R.; Jin, S.; Jayne, T.S. Land access, land rental and food security: Evidence from Kenya. Land Use Pol. 2018, 70, 611–622. [Google Scholar] [CrossRef] [Green Version]
- Mutea, E.N.; Bottazzi, P.; Jacobi, J.; Kiteme, B.; Ifejika Speranza, C.; Rist, S. Livelihoods and Food Security among Rural Households in the North-Western Mount Kenya Region. Front. Sustain. Food Syst. 2019, 3, 98. [Google Scholar] [CrossRef] [Green Version]
- Üllenberg, A. Foreign Direct Investment (FDI) in Land in Madagascar; GTZ: Eschborn, Germany, 2009. [Google Scholar]
- Zaehringer, J.G.; Wambugu, G.; Kiteme, B.; Eckert, S. How do large-scale agricultural investments affect land use and the environment on the western slopes of Mount Kenya? Empirical evidence based on small-scale farmers’ perceptions and remote sensing. J. Environ. Man. 2018, 213, 79–89. [Google Scholar] [CrossRef] [PubMed] [Green Version]
- Zaehringer, J.G.; Atumane, A.; Berger, S.; Eckert, S. Large-scale agricultural investments trigger direct and indirect land use change: New evidence from the Nacala corridor, Mozambique. J. Land Use Sci. 2018, 13, 325–343. [Google Scholar] [CrossRef] [Green Version]
- Kibugi, R.; Mwathane, I.; Makathimo, M. Large Scale Land Acquisitions for Investment in Kenya: Is the Participation, and Benefits of Affected Local Communities Meaningful, and Equitable? A Case Study of the Situation in Lamu, Isiolo and Siaya Counties. Land Development and Governance Institute. 2016. Available online: http://hdl.handle.net/10625/56388 (accessed on 18 October 2020).
- Kibugi, R.; Wardell, D.A.; Segger MC, C.; Haywood, C.; Gift, R. Enabling Legal Frameworks for Sustainable Land-Use Investments in Tanzania: Legal Assessment Report; CIFOR: Bogor, Indonesia, 2015; Volume 191. [Google Scholar]
- Klopp, J.M.; Lumumba, O. Reform and counter-reform in Kenya’s land governance. Rev. African Polit. Econ. 2017, 44, 577–594. [Google Scholar] [CrossRef]
- Smalley, R. Plantations, Contract Farming and Commercial Farming Areas in Africa: A Comparative Review; Working Paper; PLAAS: Cape Town, South Africa, 2013. [Google Scholar]
- Fitawek, W.; Hendriks, S.; Reys, A.; Fossi, F. The effect of large-scale agricultural investments on household food security in Madagascar. Food Secur. 2020, 12, 1349–1365. [Google Scholar] [CrossRef]
- Bosch, C.; Zeller, M. The Impact of wage employment on Jatropha plantation on income and food security of rural households in Madagascar- a panel data analysis. Q. J. Int. Agric. 2013, 52, 119–140. [Google Scholar]
- Miggiano, L.; Taylor, M.; Mauro, A. Links between Land Tenure Security and Food Security; International Land Coalition: Rome, Italy, 2010. [Google Scholar]
- Giger, M.; Mutea, E.; Kiteme, B.; Eckert, S.; Anseeuw, W.; Zaehringer, J.G. Large agricultural investments in Kenya’s Nanyuki Area: Inventory and analysis of business models. Land Use Pol. 2020, 99, 104833. [Google Scholar] [CrossRef]
- D’Alessandro, S.P.; Caballero, J.; Lichte, J.; Simpkin, S. Kenya: Agricultural Sector Risk Assessment. Agriculture Global Practice Technical Assistance Paper; World Bank: Washington, DC, USA, 2015. [Google Scholar]
- Burnod, P.; Rakotomalala, H.; Saint-Macary, C.; Gubert, F. Responsible Land Governance: Towards an Evidence Based Approach in Madagascar; Annual World Bank Conference on Land and Poverty: Washington, DC, USA, 2017. [Google Scholar]
- Delcourt, L. Land policy in Madagascar overview, stakes, challenges and outlooks. Entraide et Fraternité1 and the Centre Tricontinental; Executive summary: Brussels, Belgium, 2018. [Google Scholar]
- Giger, M.; Oberlack, C.; Anseeuw, W.; Adelle, C.; Bourblanc, M.; Kiteme, B.; Burnod, P.; Eckert, S.; Fouilleux, E.; Hendriks, S.; et al. How and Why Large-Scale Agricultural Investments Induce Different Socio-Economic, Food Security, and Environmental Impacts: Evidence from Kenya, Madagascar, and Mozambique; Global Land Programm: Bern, Switzerland, 2019. [Google Scholar]
- The Land Matrix. Global Data. Available online: https://landmatrix.org/list/deals (accessed on 15 September 2020).
- Grebmer, K.V.; Bernstein, J.; Patterson, F.; Wiemers, M.; Chéilleachair, R.N.; Foley, C. Global Hunger Index: The Challenge of Hunger and Climate Change; International Food Policy Research Institute (IFPRI): Addis, Ethiopia, 2019. [Google Scholar]
- Reys, A.; African Food, Agriculture, Land and Natural Resource (AGROLAND). Mozambique Sample and Survey Method Report; CIRAD: Paris, France, 2016. [Google Scholar]
- Reys, A.; Burnod, P.; African Food, Agriculture, Land and Natural Resource (AGROLAND). Madagascar Sample and Survey Method Report; CIRAD: Paris, France, 2017. [Google Scholar]
- Reys, A.; Mutea, E.; African Food, Agriculture, Land and Natural Resource (AGROLAND). Kenya Sample and Survey Method Report; CIRAD: Paris, France, 2017. [Google Scholar]
- FANTA (Food and Nutrition Technical Assistance Project). Household Dietary Diversity Score (HDDS) for Measurement of Household Food Access: Indicator Guide (Version 2); FANTA: Washington DC, USA, 2006. [Google Scholar]
- FAO (Food and Agricultural Organization of the United Nations). Food Security; Policy Brief No. 2; FAO: Rome, Italy, 2006. [Google Scholar]
- Hendriks, S.L.; Van der Merwe, C.; Ngidi, M.S.; Manyamba, C.; Mbele, M.; McIntyre, A.M.; Ngwane, L. What are we measuring? Comparison of household food security indicators in the Eastern Cape Province, South Africa. Ecol. Food Nutr. 2016, 55, 141–162. [Google Scholar] [CrossRef] [PubMed] [Green Version]
- Hirvonen, K.; Taffesse, A.S.; Hassen, I.W. Seasonality and household diets in Ethiopia. Public Health Nutr. 2016, 19, 1723–1730. [Google Scholar] [CrossRef] [PubMed] [Green Version]
- Mekonnen, D.A.; Gerber, N. Aspirations and food security in rural Ethiopia. Food Secur. 2017, 9, 371–385. [Google Scholar] [CrossRef] [Green Version]
- Leroy, J.L.; Ruel, M.; Frongillo, E.A.; Harris, J.; Ballard, T.J. Measuring the food access dimension of food security: A critical review and mapping of indicators. Food Nutr. Bull. 2015, 36, 167–195. [Google Scholar] [CrossRef] [PubMed] [Green Version]
- WFP (World Food Programme). Vulnerability Analysis and Mapping. Food Consumption Analysis: Calculation and Use of the Food Consumption Score in Food Security Analysis; WFP: Rome, Italy, 2008. [Google Scholar]
- Africare. Guidance: How to Measure Months of Adequate Household Food Provisioning (MAHFP) Based on Participatory Rural Appraisals in Food Security Interventions. Afr. Food Secur. Rev. 2007, 1, 1–13. [Google Scholar]
- Bilinsky, P.; Swindale, A. Months of Adequate Household Food Provisioning (MAHFP) for Measurement of Household Food Access: Indicator Guide; Version 4; Food and Nutrition Technical Assistance II Project (FANTA): Washington, DC, USA, 2010. [Google Scholar]
- Vaitla, B.; Coates, J.; Maxwell, D. Comparing Household Food Consumption Indicators to Inform Acute Food Insecurity phase Classification; FHI: Washington, DC, USA, 2015. [Google Scholar]
- INDDEX Project. Data4Diets: Building Blocks for Diet-related Food Security Analysis; Tufts University: Boston, MA, USA, 2018. [Google Scholar]
- Lele, U.; Masters, W.A.; Kinabo, J.; Meenakshi, J.V.; Ramaswami, B.; Tagwireyi, J.; Goswami, S. Measuring food and nutrition security: An independent technical assessment and user’s guide for existing indicators. Food Secur. Inf. Netw. 2016, 177. Available online: https://sites.tufts.edu/willmasters/files/2016/06/FSIN-TWG_UsersGuide_12June2016.pdf (accessed on 4 February 2021).
- Rose, D. Assessing Food Security at the UN World Food Programme: Towards a Unified Approach; Design Phase Report; Food Security Analysis Service; WFP: Rome, Italy, 2012. [Google Scholar]
- Lee, L.F. Some approaches to the correction of selectivity bias. Rev. Econ. Stud. 1982, 49, 355–372. [Google Scholar] [CrossRef] [Green Version]
- Lokshin, M.; Sajaia, Z. Maximum likelihood estimation of endogenous switching regression models. Stata J. 2004, 4, 282–289. [Google Scholar] [CrossRef] [Green Version]
- Dutoit, L.C. Heckman’s Selection Model, Endogenous and Exogenous Switching Models, a Survey; University of Lausanne: Lausanne, Switzerland, 2007; Unpublished. [Google Scholar]
- Heckman, J.J. Sample selection bias as a specification error. Econom. J. Econom. Soc. 1979, 47, 153–161. [Google Scholar] [CrossRef]
- Malikov, E.; Sun, K.; Kumbhakar, S.C. Nonparametric estimates of the clean and dirty energy substitutability. Econ. Lett. 2018, 168, 118–122. [Google Scholar] [CrossRef] [Green Version]
- Kabunga, N.S.; Dubois, T.; Qaim, M. Yield effects of tissue culture bananas in Kenya: Accounting for selection bias and the role of complementary inputs. J. Agric. Econ. 2012, 63, 444–464. [Google Scholar] [CrossRef] [Green Version]
- Kassie, M.; Jaleta, M.; Mattei, A. Evaluating the impact of improved maise varieties on food security in Rural Tanzania: Evidence from a continuous treatment approach. Food Secur. 2014, 6, 217–230. [Google Scholar] [CrossRef]
- Lokshin, M. Maximum-Likelihood Estimation of Endogenous Switching Regression Models Michael; The World Bank: Washington, DC, USA; Stanford University: Stanford, CA, USA, 1977; pp. 1–8. [Google Scholar]
- Shiferaw, B.; Kassie, M.; Jaleta, M.; Yirga, C. Adoption of improved wheat varieties and impacts on household food security in Ethiopia. Food Policy 2014, 44, 272–284. [Google Scholar] [CrossRef]
- Di Falco, S.; Veronesi, M.; Yesuf, M. Does adaptation to climate change provide food security? A micro-perspective from Ethiopia. Am. J. Agric. Econ. 2011, 93, 829–846. [Google Scholar] [CrossRef] [Green Version]
- Abdulai, A.; Huffman, W. The adoption and impact of soil and water conservation technology: An endogenous switching regression application. Land Econ. 2014, 90, 26–43. [Google Scholar] [CrossRef]
- Mujenja, F.; Wonani, C. Long-Term Outcomes of Agricultural Investments: Lessons from Zambia; International Institute for Environment and Development: London, UK, 2012. [Google Scholar]
- Umeh, J.; Asogwa, B. Determinants of farm household food expenditure: Implications for food security in rural Nigeria. In International Conference on Ecology, Agriculture and Chemical Engineering; ICEACS: Phuket, Thailand, 2012; pp. 18–19. [Google Scholar]
- Smith, L.; Ali, S. Measuring Food Security Using Household Expenditure Surveys; International Food Policy Research Institute: Washington, DC, USA, 2007; Volume 3. [Google Scholar]
- Carletto, C.; Zezza, A.; Banerjee, R. Towards better measurement of household food security: Harmonizing indicators and the role of household surveys. Glob. Food Secur. 2013, 2, 30–40. [Google Scholar] [CrossRef]
Figure 1.
Study areas in the three countries. “Reprinted with permission from Reys [45,46,47]. 2021, Aurélien Reys.”


Table 1.
Overview of case studies on LSAIs conducted in the study areas.
| Purpose of the Study | Country | Method | Impacts | Source |
|---|---|---|---|---|
| The political economy of large-scale agricultural land acquisitions: Implications for food security and livelihoods in rural Mozambique | Mozambique | Descriptive analysis | The study stated that large-scale agricultural investment projects in the study areas built infrastructure and generated employment, but led to significant conflict and negative social, economic and environmental degradation. | Aabø and Kring, 2012 [6] |
| Large-scale plantation and contract farming effects: qualitative and quantitative assessment in Madagascar | Madagascar | Qualitative and quantitative assessment methods | The authors reported that large-scale plantations worsened poverty because the company paid low wages. The employment did not contribute significantly to the resilience efforts of households that lost their land. The company had a positive impact on contract farming by the remuneration of family labour, access to farm inputs and fewer land losses. | Burnod et al., 2015 [22] |
| An analysis of investment trends, business models and social and environmental impact conduct in Mozambique | Mozambique | Descriptive analysis | The paper’s findings showed that most of the investments in Mozambique targeted domestic food markets, which increased productivity and national food security. However, social and environmental land use conflicts rarely occurred. | Di Matteo and Schoneveld, 2016 [13] |
| The effect of large-scale agricultural investments on household food security in Madagascar | Madagascar | Qualitative and quantitative methods | The paper presented employed households were more food secure than other households. While contract farming households were more food insecure than other households, but higher diet diversity than employed. | Fitawek et al., 2020 [35] |
| Food security and land governance factsheet Kenya | Kenya | Review of literature | The researchers found that land rental markets were the most important means available to smallholder farmers to access additional land for cultivation and improved household food security. However, large-scale agricultural investments in biofuel production and the leasing out of agricultural land for export production affected local food production. | Garcia et al., 2015 [23] |
| Large agricultural investments in Kenya’s Nanyuki Area: Inventory and analysis of business models | Kenya | Both qualitative and quantitative approaches | The study showed that most of the recent investments took place relatively smaller land areas, unlike the large-scale land deals that often harm local communities. However, access to water is a highly relevant concern in the study area. | Giger et al., 2020 [38] |
| Land and agricultural commercialisation in Meru County, Kenya: evidence from three models | Kenya | Mixed-methods approach | They found both winners and losers in the three models. This was because the agrarian setting was undergoing change and influenced by both local and external factors; due to government policies and international export commodity prices. | Hakizimana et al., 2017 [24] |
| Livelihoods and food security among rural households in the North-Western Mount Kenya Region | Kenya | Qualitative and quantitative assessment methods | They found participation in large-scale agricultural investments (as wage workers or sub-contract farmers) did not significantly influence food security. | Mutea et al., 2019 [27] |
| How do large-scale agricultural investments affect land use and the environment on the western slopes of Mount Kenya? Empirical evidence based on small-scale farmers’ perceptions and remote sensing | Kenya | Qualitative and quantitative assessment methods | This study found that that LSAIs had both positive and negative impacts. Positive spillovers from LSAIs onto small-scale farmers’ land in the form of agricultural technologies and job opportunities. However, LSAIs have other environmental impacts, such as air and water pollution and decrease water availability for smallholder farmers. | Zaehringer et al., 2018a [29] |
| Large-scale agricultural investments trigger direct and indirect land-use change: New evidence from the Nacala corridor, Mozambique | Mozambique | Qualitative and quantitative assessment methods | The authors stated that large-scale agricultural investments had both positive and negative effects. However, the positive spillover effects could not compensate for the negative impacts. | Zaehringer et al., 2018b [30] |
Table 2.
Sample size.
| Country | Number of Households Interviewed | Employed Households | Non-Engaged Households |
|---|---|---|---|
| Kenya | 488 | 46 | 442 |
| Madagascar | 304 | 61 | 243 |
| Mozambique | 504 | 121 | 383 |
| Total sample | 1296 | 228 | 1068 |
Table 3.
Variable names, definitions and expected sign.
| Variable | Description | Expected Sign |
|---|---|---|
| Sex of the household head | If the sex of the household head male = 1, 0 for female | + |
| Age of the respondent | Age of the respondent (years) | − |
| Household size | Family size of the household | + |
| Education status of the household head | If the household head no schooling = 0, primary = 1, secondary = 2 & college/univ. = 3) | + |
| Marital status of the household head | Coded 1 if the household head married, otherwise 0 | − |
| Livestock holding | Livestock holdings in tropical livestock unit (TLU) | − |
| Land size | Land size (hectares) | − |
| Distance to market | Coded 1 if <30 min; 2 if the distance 30 min–1 h and 3 if the distance > 1 h | +/− |
| Distance to road | Coded 1 if <30 min; 2 if the distance 30 min–1 h and 3 if the distance > 1 h | +/− |
| Migration status of the household head | Coded 1 if the household is non-migrant and 0 if migrant | − |
| Access to irrigation | Coded 1 if the household had access to irrigation, 0 otherwise | +/− |
| Households that lost their land rights | Coded 1 if the household lost their land rights, 0 otherwise | + |
| Access to other sources of revenue | Coded 1 if the household have access to other sources of revenue, 0 otherwise | − |
| Access to new technology | Coded 1 if the household have access to new technology, 0 otherwise | + |
| Land tenure system | Coded 1 if it is customary; 2 informal and 3 for others | +/− |
| Location_dummy | Coded 1 if the household located in factual areas, 0 otherwise | + |
| Outcome variables | ||
| Household dietary diversity scores (HDDS) | Household dietary diversity scores | |
| Food consumption scores (FCS) | Food consumption scores | |
| Months of adequate household food provisioning (MAHFP) | Months of adequate household food provisioning | |
| Household food expenditure share | Food expenditure share |
Table 4.
Food security indicators used in the analysis.
| Indicator | Recall Period | Descriptions |
|---|---|---|
| Household Dietary Diversity Score (HDDS) | 24-h | HDDS is a measure of diet quality and quantity, capturing the number of food groups consumed in the last 24 h [48,49,50,51,52]. The HDDS is typically significantly correlated with caloric adequacy measures [50,51]. |
| Food Consumption Score (FCS) | 7-days | The FCS is a composite score that considers dietary diversity, food frequency and the relative nutritional importance of food groups [53,54]. The FCS is the sum of the frequency of consumption of food groups during the previous seven days and then weighted by a coefficient [50]. |
| Months of Adequate Household Food Provisioning (MAHFP) | 12-months | The MAHFP measures household food access and availability above the minimal level of the year. The indicator is the sum of the months of adequate provision [55,56,57]. |
| Food expenditure share | 30-days (1-month) | The share of total household expenditure spent on food was used as a proxy for income and was calculated by dividing the total food expenditure by the total household expenditure [58,59,60]. |
Table 5.
Conditional expectations, treatment, and heterogeneous effect.
| Sub-Samples | Decision Stage | Treatment Effects | |
|---|---|---|---|
| To Employed | Not to Employed (Non-Engaged) | ||
| Employed households | (a)E(Y1i/Ai = 1) | (b)E(Y2i/Ai = 1) | ATT |
| Non-engaged households | (c)E(Y1i/Ai = 0) | (d)E(Y2i/Ai = 0) | ATU |
| Heterogeneous effects | BH1 | BH2 | TH |
Note: (a) and (d) are observed outcomes; (b) and (c) are the hypothetical unobserved outcomes (expected situations). Ai = 1 if households employed by LSAI; Ai = 0 if households non-engaged with LSAI. Y1i & Y2i: food security indicators (HDDS, FCS, MAHFP and food exp. share) of employed and non-engaged. ATT & ATU: average treatment effect on treated and untreated. BHi: is the effect of base heterogeneity for households that employed (A = 1) and did non-engaged (A = 0). TH: Transitional heterogeneity = ATT–ATU.
Table 6.
Descriptive statistics of the samples.
| Variable | Kenya | Madagascar | Mozambique | ||||||
|---|---|---|---|---|---|---|---|---|---|
| Employed | Non-Engaged | Diff. | Employed | Non-Engaged | Diff. | Employed | Non-Engaged | Diff. | |
| Outcome variables | |||||||||
| HDDS | 8.27 (0.22) | 7.28 (0.06) | 0.98 *** | 4.95 (0.34) | 5.54 (0.17) | −0.59 | 6.20 (0.21) | 5.99 (0.10) | 0.21 |
| FCS | 82.29 (2.57) | 75.42 (0.79) | 6.87 *** | 48.19 (1.91) | 53.59 (123) | −5.41 ** | 55.00 (1.15) | 53.13 (0.72) | 1.87 |
| MAHFP | 10.35 (0.37) | 9.93 (0.10) | −0.41 | 9.54 (0.22) | 9.47 (0.10) | 0.07 | 10.31 (0.08) | 9.98 (0.18) | 0.34 ** |
| Food exp. share | 34.84 (2.76) | 42.39 (1.13) | −7.54 * | 66.05 (2.73) | 72.69 (1.49) | −6.64 ** | 77.85 (2.08) | 83.41 (0.86) | −5.56 *** |
| Explanatory variables | |||||||||
| Sex of the household head | 1.78 (0.06) | 1.58 (0.02) | 0.19 *** | 0.99 (0.05) | 0.85 (0.15) | 0.14 | 1.94 (0.02) | 1.87 (0.02) | 0.08 ** |
| Age of the household head | 36.37 (2.11) | 44.77 (0.94) | −8.40 *** | 39.13 (1.76) | 41.37 (1.94) | −1.94 | 40.12(1.21) | 39.99 (0.75) | 0.11 |
| Household size | 4.51 (0.21) | 4.07 (0.09) | 0.44 | 4.84 (0.35) | 6.12 (0.21) | −1.28 *** | 4.81 (0.18) | 4.80 (0.10) | 0.01 |
| Education status of the household | 2.01 (0.03) | 2.12 (0.09) | −0.02 | 1.52 (0.15) | 1.26 (0.06) | 0.26 * | 2.25 (0.07) | 2.26 (0.04) | −0.01 |
| Marital status of the hh head | 1.26 (0.06) | 1.35 (0.02) | −0.08 | 1.26 (0.09) | 1.16 (0.04) | 0.11 | 1.08 (0.02) | 1.15 (0.02) | −0.07 ** |
| Livestock holdings | 4.96 (1.34) | 2.57 (0.12) | 2.39 *** | 2.15 (1.36) | 14.29 (3.16) | −12.13 ** | 0.09 (0.05) | 0.10 (0.02) | −0.02 |
| Land size | 1.03 (0.14) | 1.29 (0.07) | −0.27 | 2.19 (0.91) | 7.94 (1.63) | −5.74 * | 2.22 (0.44) | 2.17 (0.11) | 0.05 |
| Distance from a market | 2.86 (0.07) | 1.82 (0.04) | 1.04 *** | 1.18 (0.05) | 2.04 (0.06) | −0.87 *** | 1.69 (0.06) | 2.08 (0.04) | −0.38 *** |
| Distance from a road | 2.39 (0.12) | 1.66 (0.03) | 0.72 *** | 2.93 (0.05) | 2.91 (0.02) | 0.02 | 2.62 (0.07) | 2.61(0.06) | 0.01 |
| Migration status of the household | 1.16 (0.05) | 1.15 (0.02) | 0.87 | 1.24 (0.06) | 1.68 (0.03) | −0.44 *** | 1.45 (0.05) | 1.53 (0.03) | −0.07 * |
| Access to irrigation | 2.00 (0.00) | 1.34 (0.02) | 0.67 *** | 0.36 (0.06) | 0.41 (0.03) | −0.05 | 1.02 (0.02) | 1.03 (0.01) | −0.03 |
| Households that lost their land rights | 1.06 (0.03) | 1.04 (0.01) | 0.02 | 0.05 (0.03) | 0.07 (0.02) | −0.02 | 1.25 (0.04) | 1.18 (0.02) | 0.08 * |
| Access to other sources of revenue | 1.12 (0.05) | 1.19 (0.02) | −0.07 | 0.00 (0.00) | 0.00 (0.00) | 0.00 | 1.21 (0.04) | 1.69 (0.02) | −0.48 *** |
| Observations | 46 | 442 | 61 | 243 | 121 | 383 | |||
Note: Standard errors appear in parentheses, and *** p < 0.01, ** p < 0.05, and * p < 0.1.
Table 7.
Determinants of participation in LSAIs.
| Variables | Kenya | Madagascar | Mozambique |
|---|---|---|---|
| Coeff | Coeff | Coeff | |
| (Std Err) | (Std Err) | (Std Err) | |
| Sex of the household head | 0.469 ** | 0.385 | 0.446 |
| −0.232 | −0.334 | −0.289 | |
| Age of the head | −0.022 *** | −0.002 | 0.003 |
| −0.008 | −0.008 | −0.005 | |
| Family size | 0.028 | −0.041 | 0.017 |
| −0.071 | −0.039 | −0.037 | |
| Education status of the head | 0.139 | 0.002 | −0.212 ** |
| −0.161 | −0.097 | −0.098 | |
| Marital status of the head | −0.571 ** | 0.316 | −0.139 |
| −0.295 | −0.323 | −0.189 | |
| Livestock owned (TLU) | −0.075 ** | −0.043 ** | 0.131 |
| −0.034 | −0.037 | −0.146 | |
| Land size | −0.239 ** | −0.004 | 0.005 |
| −0.127 | −0.008 | −0.021 | |
| Distance to market | −0.811 *** | −0.669 *** | −0.295 ** |
| −0.158 | −0.161 | −0.116 | |
| Distance to road | 0.419 *** | 0.146 | 0.199 * |
| −0.129 | −0.289 | −0.113 | |
| Migration status | −0.129 | −0.467 ** | 0.048 |
| −0.282 | −0.223 | −0.159 | |
| Households that lost their land rights | 0.145 | 0.282 | −0.188 ** |
| −0.495 | −0.433 | −0.178 | |
| Access to other source of revenue | −0.098 | 0.005 | −1.271 *** |
| −0.319 | −0.021 | −0.167 | |
| Location_Dum | −0.31 | 0.931 *** | 1.532 *** |
| −0.224 | −0.306 | −0.208 | |
| Access to new technology | 0.889 *** | −0.427 *** | 0.543 ** |
| −0.205 | −0.983 | −0.226 | |
| Land tenure system | −0.186 ** | −0.186 ** | 0.023 |
| −0.095 | −0.095 | −0.093 | |
| Constant | −4.333 | −0.586 | 0.3 |
| −1.412 | −1.118 | −1.062 | |
| Likelihood | −101 | −107.71 | −177.05 |
| Observations (N) | 488 | 304 | 504 |
Source: Own calculation from AGFROLAND data; Standard errors appear in parentheses; * p < 0.10, ** p < 0.05, *** p < 0.01.
Table 8.
Endogenous switching regression treatment effects.
| Outcome Variables | Household Type and Employment Effects | Kenya | Madagascar | Mozambique | ||||||
|---|---|---|---|---|---|---|---|---|---|---|
| Decision Stage | ATE | Decision Stage | ATE | Decision Stage | ATE | |||||
| To Employ | Not to Employ | To Employ | Not to Employ | To Employ | Not to Employ | |||||
| HDDS | Employed (ATT) | 8.27 | 6.41 | 1.86 *** | 5.41 | 2.37 | 3.04 *** | 6.24 | 4.09 | 2.16 *** |
| Non-engaged (ATU) | 7.26 | 5.98 | 1.28 *** | 10.01 | 4.93 | 5.08 *** | 5.23 | 5.97 | −0.74 | |
| Heterogeneous effects | 1.01 | 0.43 | 0.58 | −4.60 | −2.56 | −2.04 | 1.01 | −1.88 | 2.89 | |
| FCS | Employed (ATT) | 82.42 | 72.34 | 10.08 *** | 47.76 | 38.93 | 8.83 *** | 55.00 | 45.49 | 9.51 *** |
| Non-engaged (ATU) | 75.40 | 57.55 | 17.86 *** | 43.34 | 38.78 | 4.56 *** | 43.18 | 53.08 | −9.90 *** | |
| Heterogeneous effects | 7.02 | 14.79 | −7.78 | 4.42 | 0.15 | 4.27 | 11.82 | −7.59 | 19.42 | |
| MAHFP | Employed (ATT) | 10.56 | 8.67 | 1.90 *** | 9.57 | 9.49 | 0.08 | 10.98 | 8.23 | 2.75 *** |
| Non-engaged (ATU) | 9.89 | 9.82 | 0.07 | 9.47 | 6.72 | 2.75 *** | 10.89 | 10.31 | 0.58 | |
| Heterogeneous effects | 0.74 | −1.22 | 1.97 | −1.06 | 0.33 | −1.39 | −0.91 | −2.08 | 2.17 | |
| Food expenditure share | Employed (ATT) | 34.39 | 51.37 | −16.98 *** | 80.52 | 76.25 | 4.27 *** | 77.85 | 84.56 | −6.71 *** |
| Non-engaged (ATU) | 64.83 | 42.25 | 22.58 *** | 77.38 | 76.33 | 1.05 ** | 83.23 | 80.41 | −3.18 ** | |
| Heterogeneous effects | −30.44 | 9.12 | −39.56 | 3.14 | −0.08 | 3.22 | −2.38 | 1.15 | −3.53 | |
Note: ATE—average treatment effect; ATT—average treatment effect for treated. ATU—average treatment effect for untreated; ** p < 0.05, *** p < 0.01.
Table 9.
Comparing the results of the average treatment effects for treated (ATT).
| Outcome Variables | Country ATT | ||
|---|---|---|---|
| Kenya | Madagascar | Mozambique | |
| Household dietary diversity score | 1.86 *** | 3.04 *** | 2.16 *** |
| Food consumption score | 10.08 * | 8.83 *** | 9.51 *** |
| Month of adequate household food provision | 1.90 *** | 0.08 | 2.75 *** |
| Food expenditure share | −16.98 *** | 4.27 *** | −6.71 *** |
Note: ATT—average treatment effects for treated (ATT); * p < 0.10, *** p < 0.01.
Publisher’s Note: MDPI stays neutral with regard to jurisdictional claims in published maps and institutional affiliations. |
© 2021 by the authors. Licensee MDPI, Basel, Switzerland. This article is an open access article distributed under the terms and conditions of the Creative Commons Attribution (CC BY) license (http://creativecommons.org/licenses/by/4.0/).
Share and Cite
MDPI and ACS Style
Fitawek, W.; Hendriks, S.L. Evaluating the Impact of Large-Scale Agricultural Investments on Household Food Security Using an Endogenous Switching Regression Model. Land 2021, 10, 323. https://0-doi-org.brum.beds.ac.uk/10.3390/land10030323
AMA Style
Fitawek W, Hendriks SL. Evaluating the Impact of Large-Scale Agricultural Investments on Household Food Security Using an Endogenous Switching Regression Model. Land. 2021; 10(3):323. https://0-doi-org.brum.beds.ac.uk/10.3390/land10030323
Chicago/Turabian StyleFitawek, Wegayehu, and Sheryl L. Hendriks. 2021. "Evaluating the Impact of Large-Scale Agricultural Investments on Household Food Security Using an Endogenous Switching Regression Model" Land 10, no. 3: 323. https://0-doi-org.brum.beds.ac.uk/10.3390/land10030323
Note that from the first issue of 2016, this journal uses article numbers instead of page numbers. See further details here.