
Effect of Organic Fertilizer on Soil Bacteria in Maize Fields

1
Shanghai Academy of Environmental Sciences, Shanghai 200233, China
2
College of Environmental Science and Engineering, Donghua University, Shanghai 201600, China
*
Author to whom correspondence should be addressed.
Land 2021, 10(3), 328; https://0-doi-org.brum.beds.ac.uk/10.3390/land10030328
Submission received: 3 March 2021
/
Revised: 17 March 2021
/
Accepted: 18 March 2021
/
Published: 22 March 2021
(This article belongs to the Special Issue Dynamic of Natural Ecosystems under Anthropogenic Disturbances)
Abstract
:Soil microorganisms play an important role in agricultural ecosystems, but their response to organic fertilizer application has not been thoroughly elucidated. Thus, high-throughput sequencing was used to investigate the responses of soil bacterial to organic fertilizer amendment (composted from pig manure) in the field during the entire growth cycle of maize plants. Four treatments were studied: treatment with 2 kg·m−2 organic fertilizer application (OF_2), treatment with 4 kg·m−2 organic fertilizer application (OF_4), treatment with 6 kg·m−2 organic fertilizer application (OF_6), and a controlled treatment (CK) without fertilization. The results revealed that the bacterial richness in OF_2 was significantly lower than that of CK (p < 0.05). Soil eutrophication bacteria Bacteroidetes increased effectively in all fertilized soils, relative abundance in OF_2, OF_4, and OF_6 for the entire maize growth cycle was 68.00%, 71.40%, and 77.93% higher than that in CK, respectively. In addition, soil nitrobacteria (Nitrospirae, Nitrospira), were markedly decreased (p < 0.05) with fertilization amount. The relative abundance of the nitrogen-fixing genus Adhaeribacter in OF_6 was 209.28%, 72.8% and 35.66% higher than that in CK, OF_2 and OF_4 at mature stage. The pathogenic genus Flavolibacterium was significantly increased (p < 0.05) in fertilized soil at the seeding stage. The driving factor governing the variations of bacterial community in CK, OF_2, OF_4 and OF_6 were pH value, available phosphorus, available phosphorus, and chromium, respectively. The findings highlight that part of the soil functional or pathogenic bacteria population was susceptible to organic fertilizer application; and the driving factor of bacterial composition change was associated with the rate of fertilization. More targeted experiments are needed to enhance the understanding of functional bacteria and the synergistic effect of soil physicochemical property physical on soil bacteria.
1. Introduction
The rapid development of the livestock industry has produced a large amount of livestock waste [1]. For instance, the output of livestock waste in China in 2016 reached nearly 38.0 billion tons [2]. Animal manure can effectively improve soil fertility and crop productivity through input of large amounts of organic matter and soil nutrients [3,4]; hence, the application of organic fertilizer to fields has become an effective method for treating livestock wastes. However, since the composting process cannot completely remove heavy metals, soil heavy metals may increase with the application of composted organic livestock manure [5,6].
Agricultural soil is an environment enriched in microbes that are susceptible to environmental changes [7]. The changes of soil nutrients, heavy metals and pH after fertilization all significantly impact the biomass, composition and diversity of soil microbes. For instance, the sufficient nitrogen and carbon provided by organic fertilizer supplementation promotes the growth and reproduction of soil microbes [8] while the excess available phosphorus provided by fertilization reduces the diversity of soil microbial communities [9]. The changes of soil pH change the soil bacterial community composition, as the relative abundance of soil-dominant bacteria (such as Acidobacteria, Actinobacteria, and Bacteroidetes) varies with the range of soil pH [10]. Some heavy metals, such as Cr, As, Zn and Cd, negatively affect microbial biomass carbon content and microbial communities’ richness [11,12]. In addition, the pathogenic bacteria of animal manure may accumulate in the soil with fertilization [4,13], and then affect the indigenous microorganisms.
Soil microorganisms play an important role in field ecosystems by influencing soil quality and biogeochemical cycling [14]. In contrast, the soil microbial community’s ecological function could be reflected by diversity index, carbon source utilization by microbes, community composition, soil dominant In contrast, the soil microbial community’s ecological function could be reflected by diversity index, carbon source utilization by microbes, community composition, soil dominant microbes, etc. [15,16]. Various studies have shown that animal manure application significantly affects the microbial community in different agroecosystems. A short-term fertilization study [17] demonstrated that organic fertilization effectively promoted the reproduction of eutrophic microorganisms and a long-term (33 year) fertilization experiment in dry land has shown that pig manure greatly increased microbial diversity and abundance [18]. The response mechanism of these variations requires further investigation, furthermore, these studies were all only sampled once, and the analysis of soil microbes during the whole crop growth cycle needs to be investigated. Moreover, a fertilization study on paddy fields [4] indicated that microbial diversity significantly increased after application of pig manure. However, studies have also noted that excessive manure significantly reduces microbial diversity [19]. This discrepancy requires further investigation of the microbial responses to fertilizer application with different dosages.
This study hypothesized that soil bacteria in farmland changed differentially under different fertilization rates because of their different tolerance to nutrient and heavy metal accumulation. Thus, high-throughput sequencing was used to investigate the responses of soil bacteria to organic fertilizer amendment in the field during the entire growth cycle of maize plants. The aims of this research were to investigate: (1) how bacteria communities respond to different amounts of organic fertilizer application; (2) The differences in the soil microbial community in different stages of the maize growth cycle under different fertilization rates; and (3) the driving factors that govern bacterial community variations.
2. Materials and methods
2.1. Field Experimental Conditions
The experiment area of 0.03 km2, is within the Experimental Base of Farmland Soil Ecological Process in Zhongxing Town, Chongming Island (121°09′30″–121°54′00″ E, 31°27′00″–31°5l′15″ N), Shanghai, China [4]. The local climate is the typical subtropical oceanic monsoon climate of north Asia. It is mild and humid, with four distinct seasons, abundant rainfall (1049.3 mm/year on average), sufficient sunshine (frost-free period of 229 days), and an annual average temperature of 15.3 °C. The experimental base was built on the local farmland, with the same farming conditions and environment as the surrounding area.
2.2. Design of the Experiment
The organic fertilizer is made of pig manure taken from a local pig farm on Chongming Island, which is based on aerobic composition. The pig manure applied in the experiment contained 551 g·kg−2 of soil organic matter (SOM), 21.6 g·kg−2 of total nitrogen (TN), 2.05 g·kg−2 of total phosphorus (TK), 1.16 g·kg−2 of available nitrogen (AN), 0.57 g·kg−2 of the available phosphorus (AP), 12.7 g·kg−2 of available potassium (AK), 0.25 g·kg−2 of the cadmium (Cd), 0.157 g·kg−2 of the mercury (Hg), 0.14 g·kg−2 of the arsenic (As), 15.0 g·kg−2 of the lead (Pb),15.5 g·kg−2 of the chromium (Cr).
The study selected a common local crop, yellow maize, to be directly sowed in early April. The planting density was 5.25 plants per square meter [20]. Other cultivation and management measures were the same as for other maize. Four treatments were set up, including CK of unfertilized control and OF_2, OF_4 and OF_6 with organic fertilization of 2 kg, 4 kg and 6 kg per square meter, respectively. Each application was repeated three times. The difference of application amount was determined according to the government technical standard for livestock manure application on farmland (GB/T 25246-2010), which sets a limiting amount for maize fields.
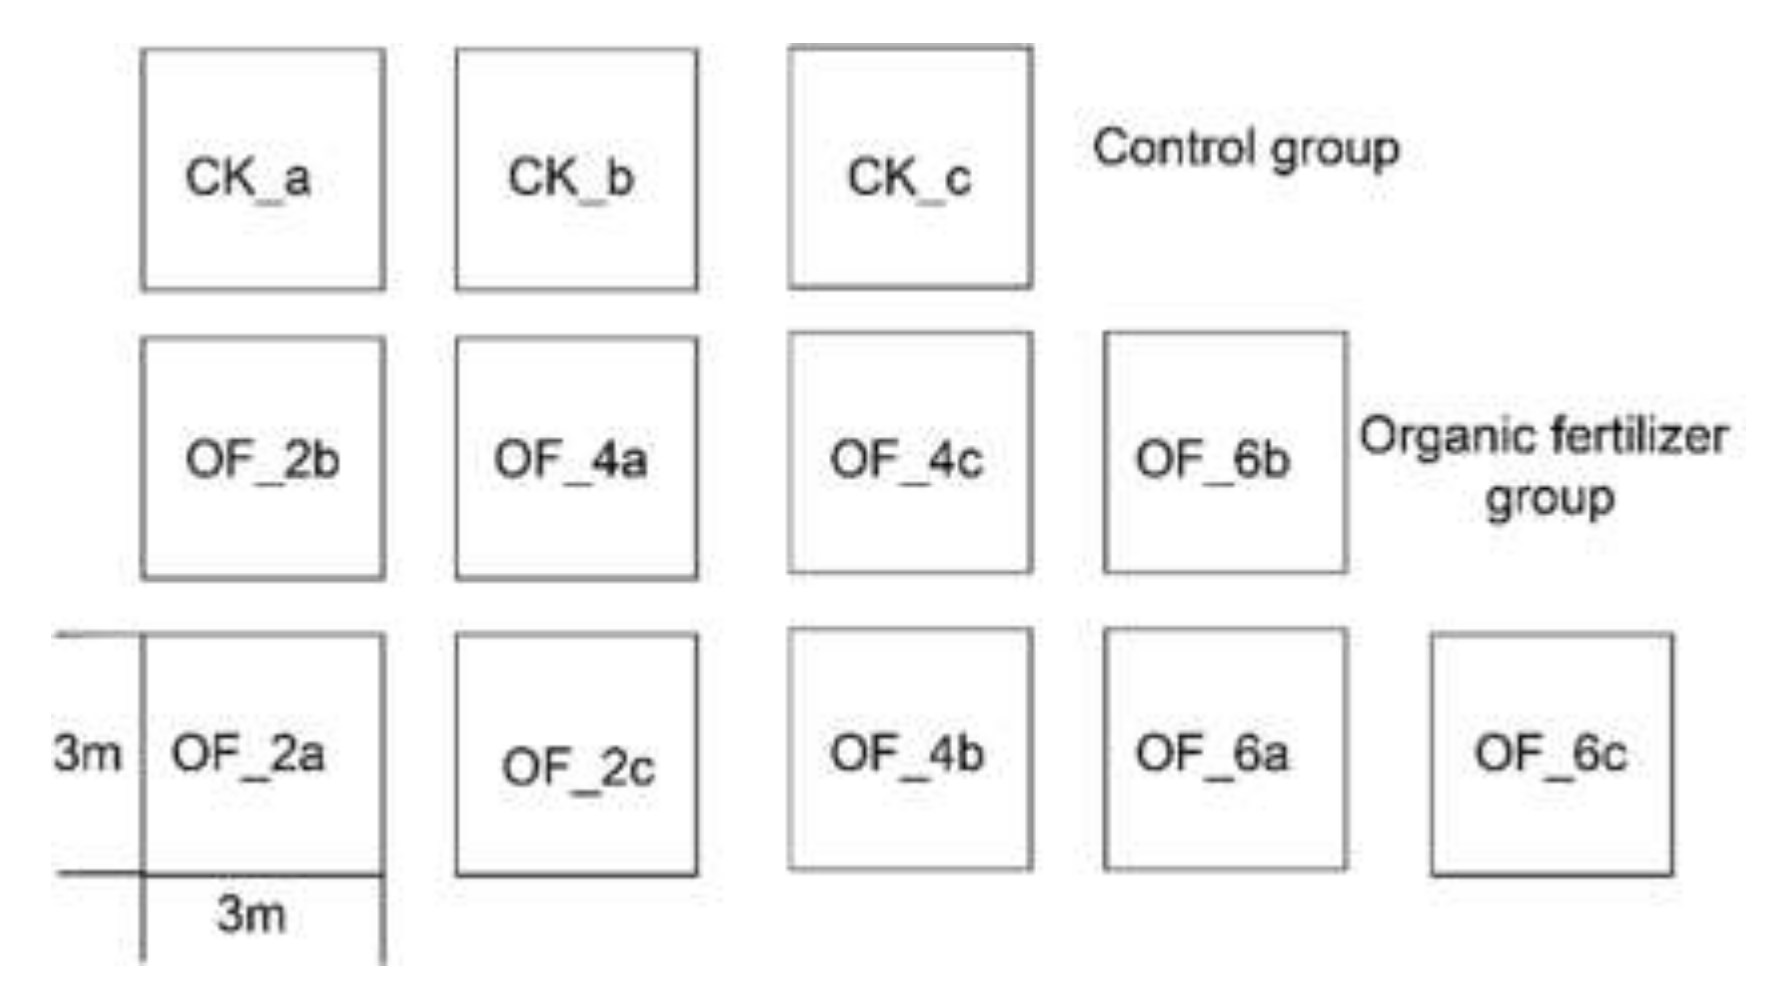
The experiment site was divided into 12 identical plots of 9 m2 (3×3 m), with an impermeable membrane of 0.5 mm thick in between. The membranes were buried 30 cm deep to prevent the plots from interfering with each other. Passages of 20 cm wide were also prepared for on-site monitoring and sampling (Figure 1).
2.3. Sampling and Analysis
2.3.1. Sample Collection
According to the growth life cycle of maize, a total of four soil samplings were set, which were in late April (seedling stage, VE), mid-May (three-leaf stage, V3), early July (filling stage, R2) and late August (mature stage, R5). A five-point sampling method was used to collect 500 g soil per plot at 0–20 cm deep. After removing debris, earthworms and plant residues, part of the sample was placed in a sterile centrifuge tube and stored in the −80 ℃ freezer for subsequent experimental analysis. The other part was placed in a sterile glass bottle and stored in a −4 ℃ refrigerator for physiochemical analysis within 7 days.
2.3.2. Analysis of Soil Physiochemical Index
The soil samples were sifted by 10-mesh and 100-mesh after grinding. The test methods of pH, SOM, TN, TP, TK and heavy metals including Pb, Cd, As, Hg and Cr are according to Li et al. [4]. The AN in the soil is determined by the alkaline hydrolysis diffusion method. The AP is extracted by 0.5 mol NaHCO3 (water-soil ratio is 20:1), and determined by molybdenum blue colorimetry. The AK was extracted by NH4OAc (water-soil ratio is 10:1) and determined by a flame photometry method [21].
2.3.3. Analysis of Community Structure
By high-throughput sequencing method, bacterial DNA was extracted from the sample using Fast DNA Spin Kit (MP Biomedicals, Santa Ana, CA, USA), and then the DNA concentration and purity was determined by NanoDrop 2000 UV-Vis spectrophotometer (Thermo Scientific, Wilmington, DE, USA). The DNA quality was tested by 1% agarose gel electrophoresis. The 16rRNA of the bacteria was PCR amplified by bacterial specific primers 338F (5’-ACTCCTACGGGAGGCAGCAG-3 ‘) and 806R (5’-GGACTACHVGGGTWTCTAAT-3’) of V3-V4 (392bp) hypervariable region, and tested by 2% agarose gel electrophoresis. Then the gel was cut, recovered and the library was established and sequenced on Illumina MiSeq platform [22] The DNA sequence quality was controlled with the Trimmomatic software, and spliced using FLASH software to obtain high-quality sequences, which were OUT clustered with UPARSE software under the condition of 97% similarity. The chimeras were removed using UCHIME, and all OTU sequences were finally flattened by a certain number of sequences for later analysis.
2.3.4. Analysis of Soil Respiration Rate
A PVC soil respiration base of 20 cm diameter and 12 cm high ring was buried under each plot at 10 cm deep after sowing. The upper end was 2 cm above the ground. To avoid experimental errors, the bases were placed in the gaps between the plants and avoided their roots. In order to eliminate the influence of plant photosynthesis and ground litter on the data, the plots were cleaned the day before each measurement without disturbing the surface soil. The soil respiration rate was measured in the field using the Automated Soil CO2 Flux System LI-8100 (LI-COR, Lincoln, NE, USA) at the same time of soil sampling, between 9 a.m. to 11 a.m. on sunny days.
2.4. Statistical Analysis
Microsoft Excel 2016 (Microsoft Corporation, Redmond, WA, USA) was used to calculate the mean and standard deviation of the original data. One-way ANOVA (SPSS V. 24, IBM, Armonk, NY, USA) was used to analyze the significance of differences in soil physiochemical factors, bacterial diversity index and significant analysis between groups. The Pearson method was used to analyze the correlation between environmental factors and bacteria [4].
3. Results and Discussion
3.1. Changes in Soil Environment Factors
3.1.1. Changes in Soil Nutrients
Organic fertilizer is enriched with organic matter and nutrients including potassium, phosphorus and nitrogen [23]. Thus, soil fertility was greatly improved by the organic fertilizer amendments applied in this study. For instance, in agreement with previous findings [3,4], the soil SOM, TN, TP, AP, AK was improved with the increase in the amount of organic fertilizer at the entire stage (Table 1), and AP concentration significantly improved with the increase of the amount of fertilizer in the last three stages (p < 0.05). In addition, soil pH decreased with the application amount of organic fertilizer, due to the fact that the soil accumulation of organic matter also increases humic acid colloids and thus the pH of the soil decreased [24].
3.1.2. Changes in Soil Heavy Metal
The concentrations of Cd and Pb were not significantly different among the groups during the different stages (Table 2). In addition, the concentration of Hg and As was increased by fertilization. At the mature stage, the concentration of Hg in OF, OF_2, and OF_6 was significantly higher than that in CK, which was 46.75%, 81.82% and 59.74%, respectively, and the concentration of As in OF_4 and OF_6 were significantly higher than that CK (p < 0.05), reaching 14.89% and 14.76%, respectively. However, the concentrations of Hg and As were not significantly different among the fertilized groups during different stages. The concentration of Cr in the fertilized groups was significantly higher than that of CK in the seedling stage (p < 0.05), however, in the last three stages, there was no clear difference in the concentration of Cr among the groups. Although soil heavy metal content had no obvious change with the increase of organic fertilizer, soil Hg and As in all fertilized soils increased significantly. Since heavy metal-additives (As, Cr, and others) are often added to animal feed, additives result in partial heavy metals residue still exists in organic fertilizer [25]. In addition, these heavy metals accumulate in soils when organic fertilizer application [5].
3.1.3. Changes in Soil Respiration Rate
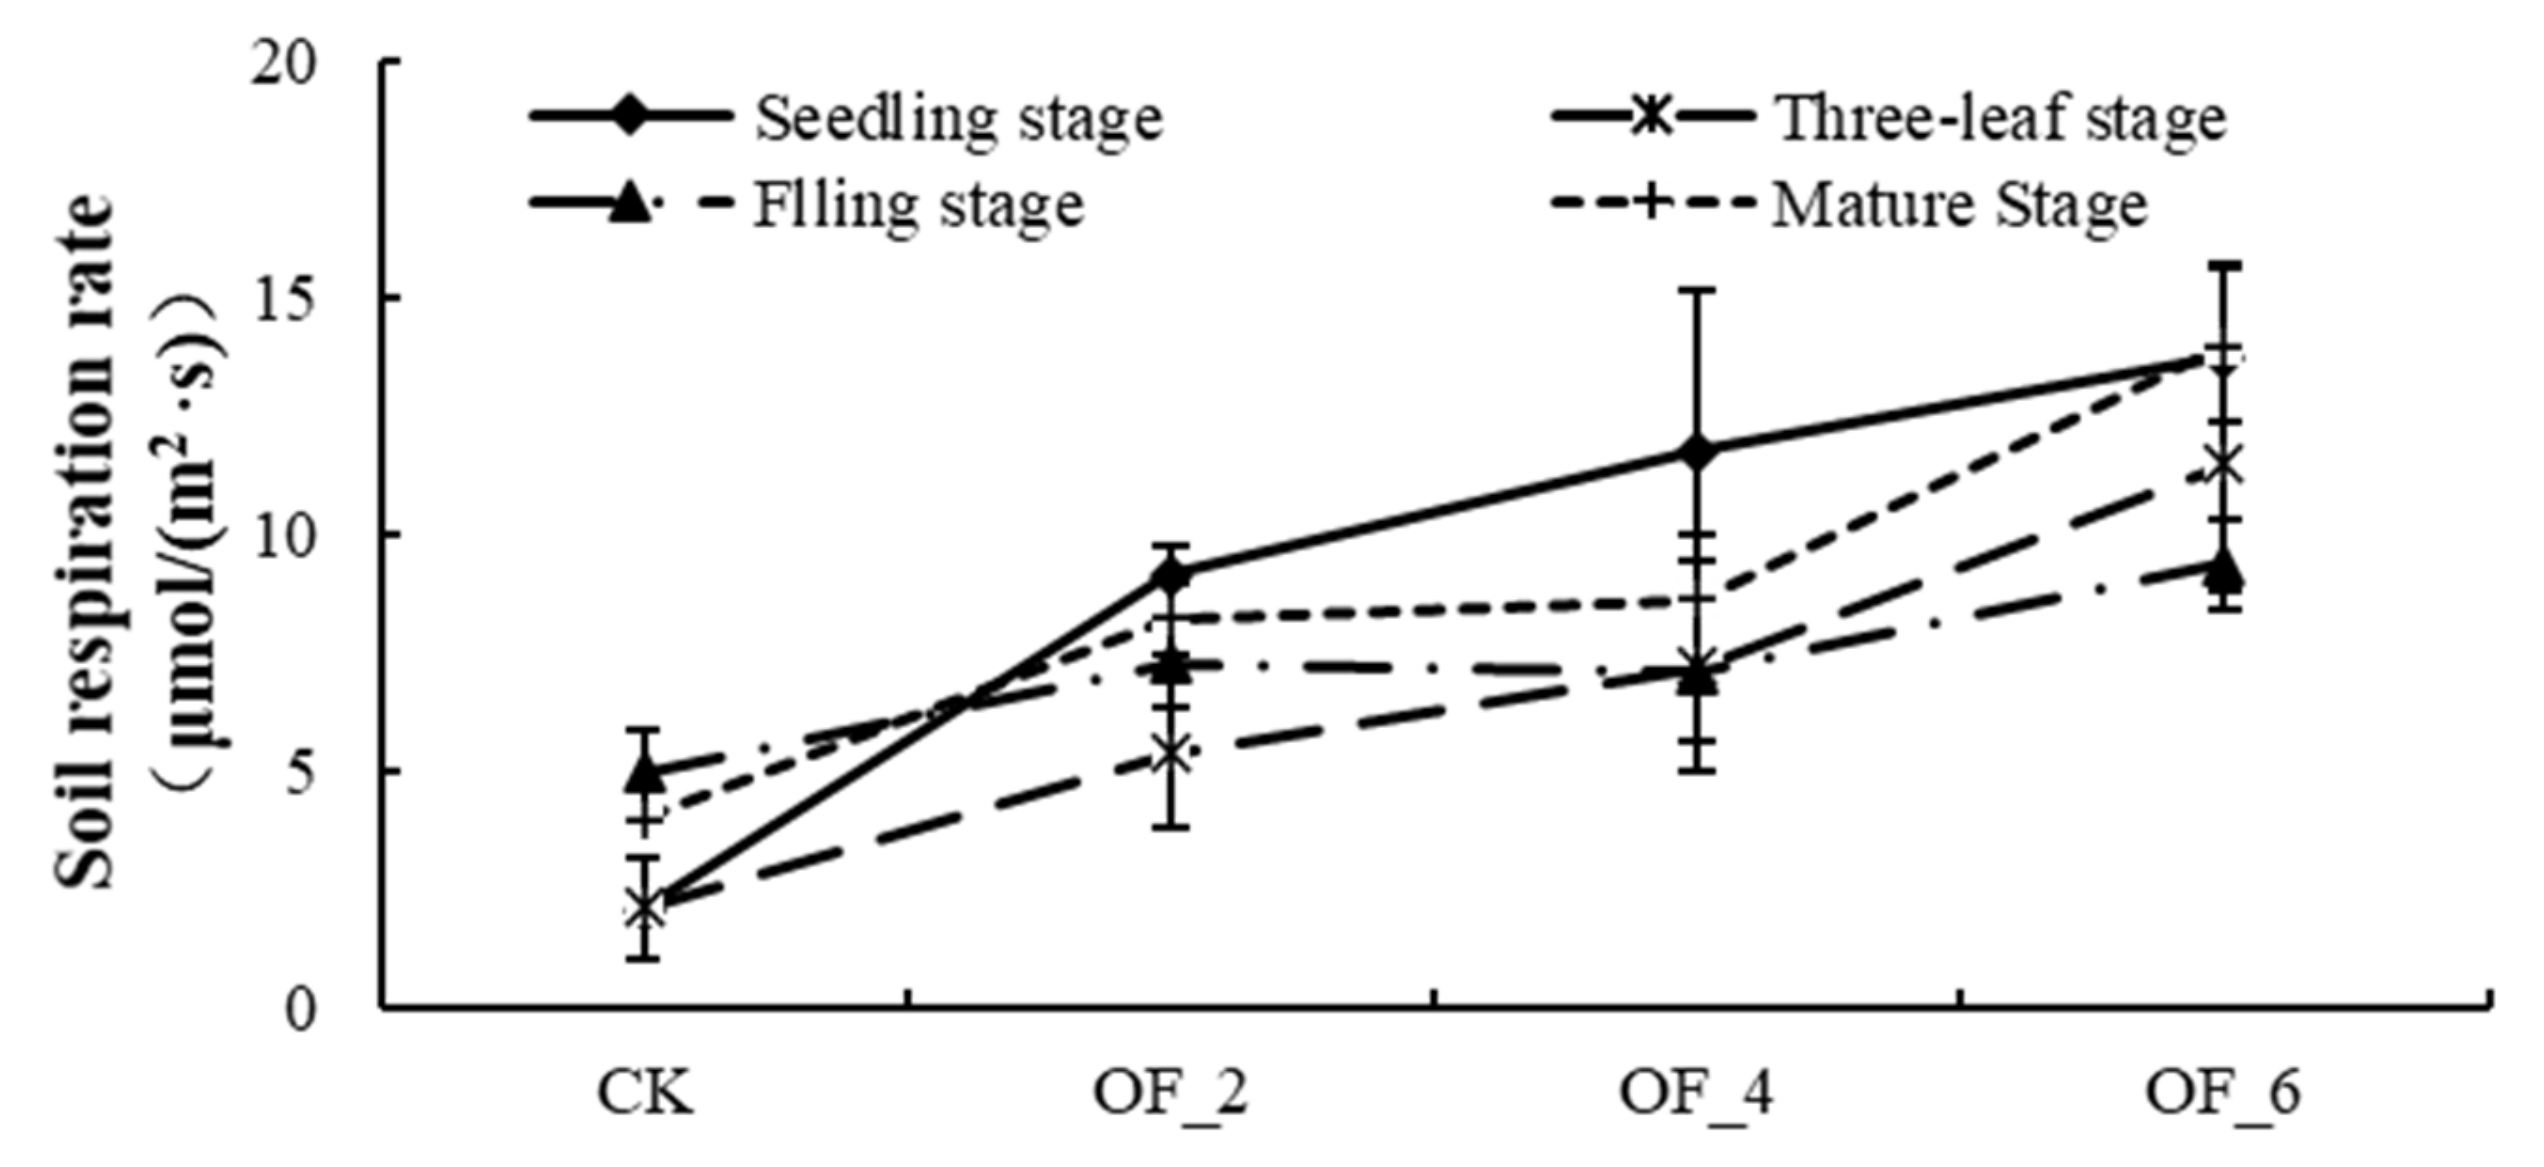
The soil respiration rate varied seasonally during the entire maize growth cycle. The trend among groups remained unchanged, showing a trend of decreasing first and then rising (Figure 2). Studies have indicated that the change in soil temperature and growth of maize roots both drive seasonal variations of soil respiration rate [26]. The soil respiration rate increased with the application amount of organic fertilizer, and the highest value at different stages appeared in OF_6, which was between 9.39–14.01 μmol·m−2·s−1. In addition, during the entire maize growth cycle, the respiratory rates of OF_6, OF_ 4 and OF_ 2 were significantly higher than those of CK (p < 0.5), the mean respiration rate of OF_6, OF_4 and OF_2 was 267.65%, 162.71% and 127.30% higher than that of CK. Organic fertilizer applications increased soil respiration rate, and the result was in accordance with previous research [27]. The soil respiration rate increased with increasing organic fertilizer rate, mainly attributable to that the increase in fertilizer application increased the input of exogenous nutrients [26]. In addition, the increase in soil respiration rate indicated that soil bacterial activity or crop root respiration increased.
3.2. Changes in Bacterial Diversity
Shannon-wiener index and Ace index were selected to represent the diversity and richness of soil bacterial communities (Table 3). There was no significant difference in Shannon index among treatment groups in different periods. The Ace index of OF_6 and CK were significantly higher than that of OF_2 at the seedling stage, three-leaf stage, and mature stage (p < 0.05), and those were siginificantly higher than that of OF_4 at the three-leaf stage (p < 0.05). Overall, there was no significant difference in the Ace index of CK and OF_6. In addition, the Ace index shows an upward trend with an increase in fertilizer application. The results showed that the application of organic fertilizer had very slight effect on soil bacterial diversity. A small amount of organic fertilizer reduced bacterial richness. However, with the increase of organic fertilizer application, it then increased. Nutrients in organic fertilizers are beneficial to the growth and reproduction of soil bacteria, thus improving the richness of bacteria [28]. However, heavy metals certainly inhibit microorganisms [6]. The main reasons for the decrease of bacterial richness in OF_2 and OF_4 was that inhibition of heavy metals to soil microorganism is more prominent when soil nutrients are low.
3.3. Changes in Soil Bacterial Community
3.3.1. Bacterial Community Changes at the Phylum Level
Dominant Phylum After Fertilization
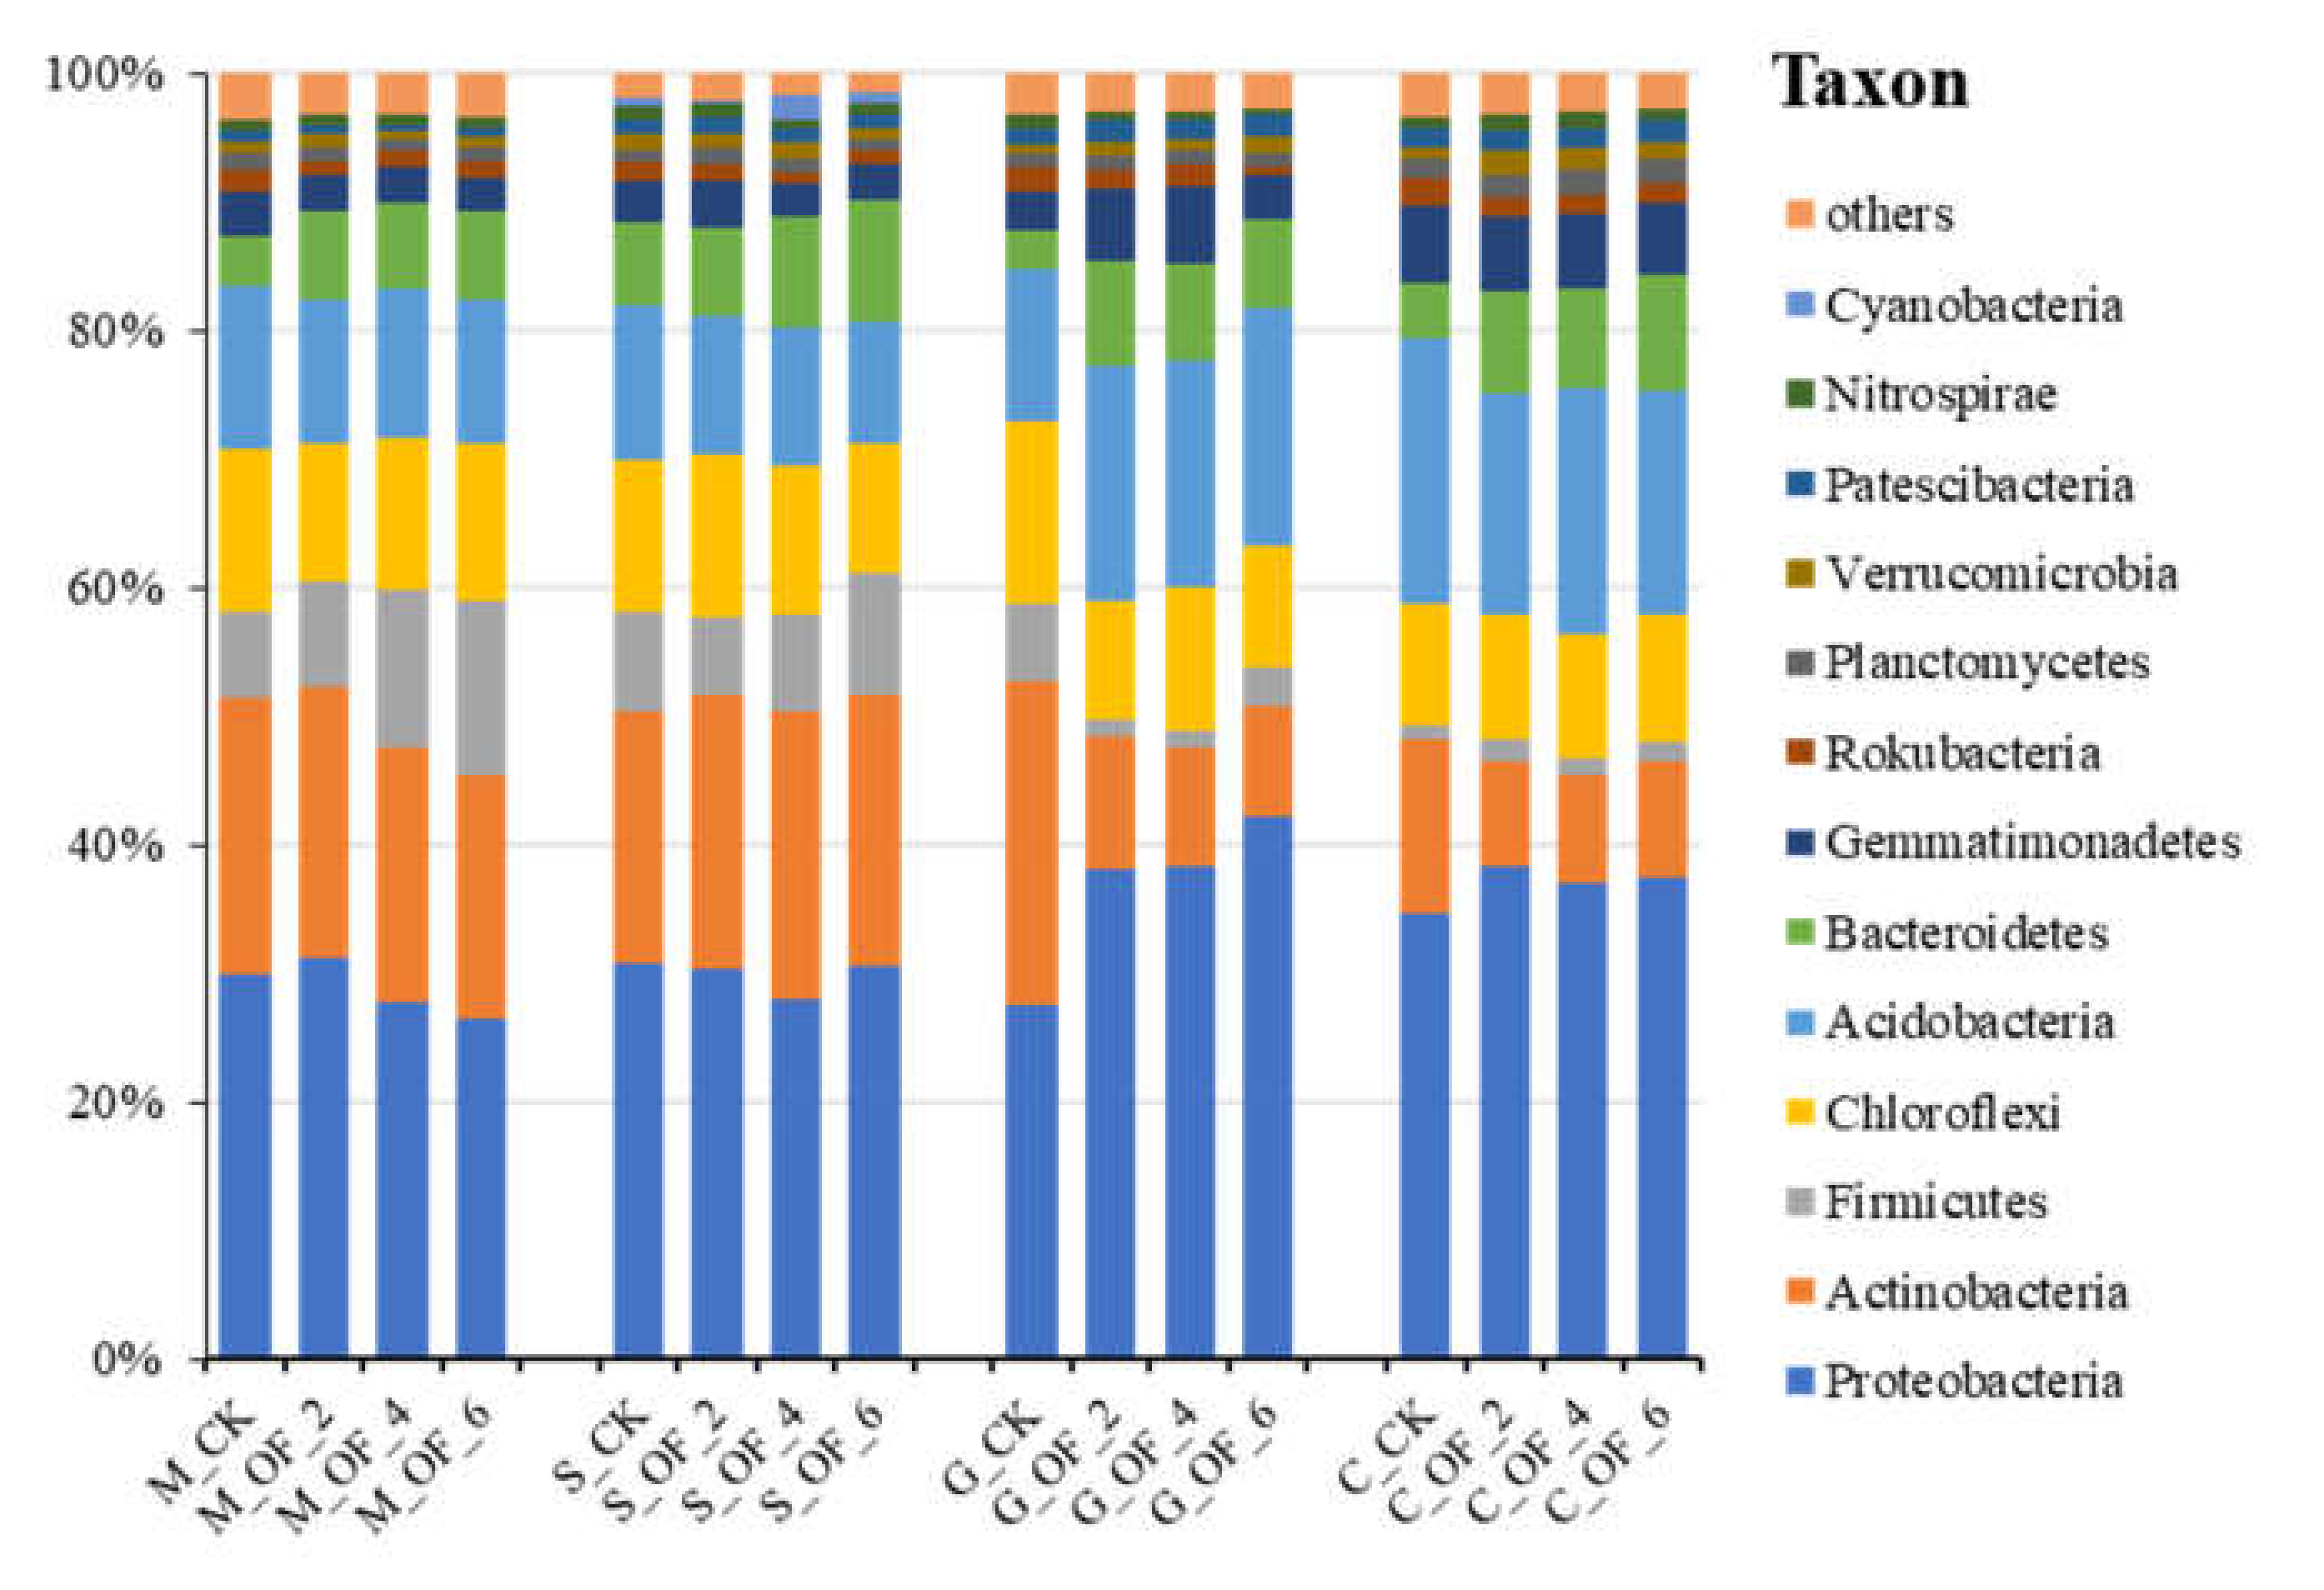
The dominant phyla in the soil are shown in Figure 3. In agreement with previous findings [4,29], the first dominant phylum in all samples was Proteobacteria, accounting for 26.70–42.04% of the total bacteria. At the seedling stage and the three-leaf stage, the second most dominant phylum in all groups was Actinobacteria, accounting for 19.22–22.05%; The second dominant phylum is different at the filling stage, it was Actinobacteria in CK, while treatment groups were Acidobacteria (accounting for 17.36–19.08%). However, at the mature stage, all groups had Acidobacteria as their dominant phylum, with a 17.45–20.48% proportion. High abundance of phyla in each group also includes Chloroflexi, Firmicutes, and Gemmatimonadetes, etc. The environment factor such as rainfall or temperature can affect the soil bacterial community [30]. The results showed that bacterial community in each group changed with the maize growth. This change occurs with or without the addition of an exogenous fertilizer. However, the addition of fertilizer can change the dominant soil bacteria in farmland.
Difference Analysis of the Bacterial Community
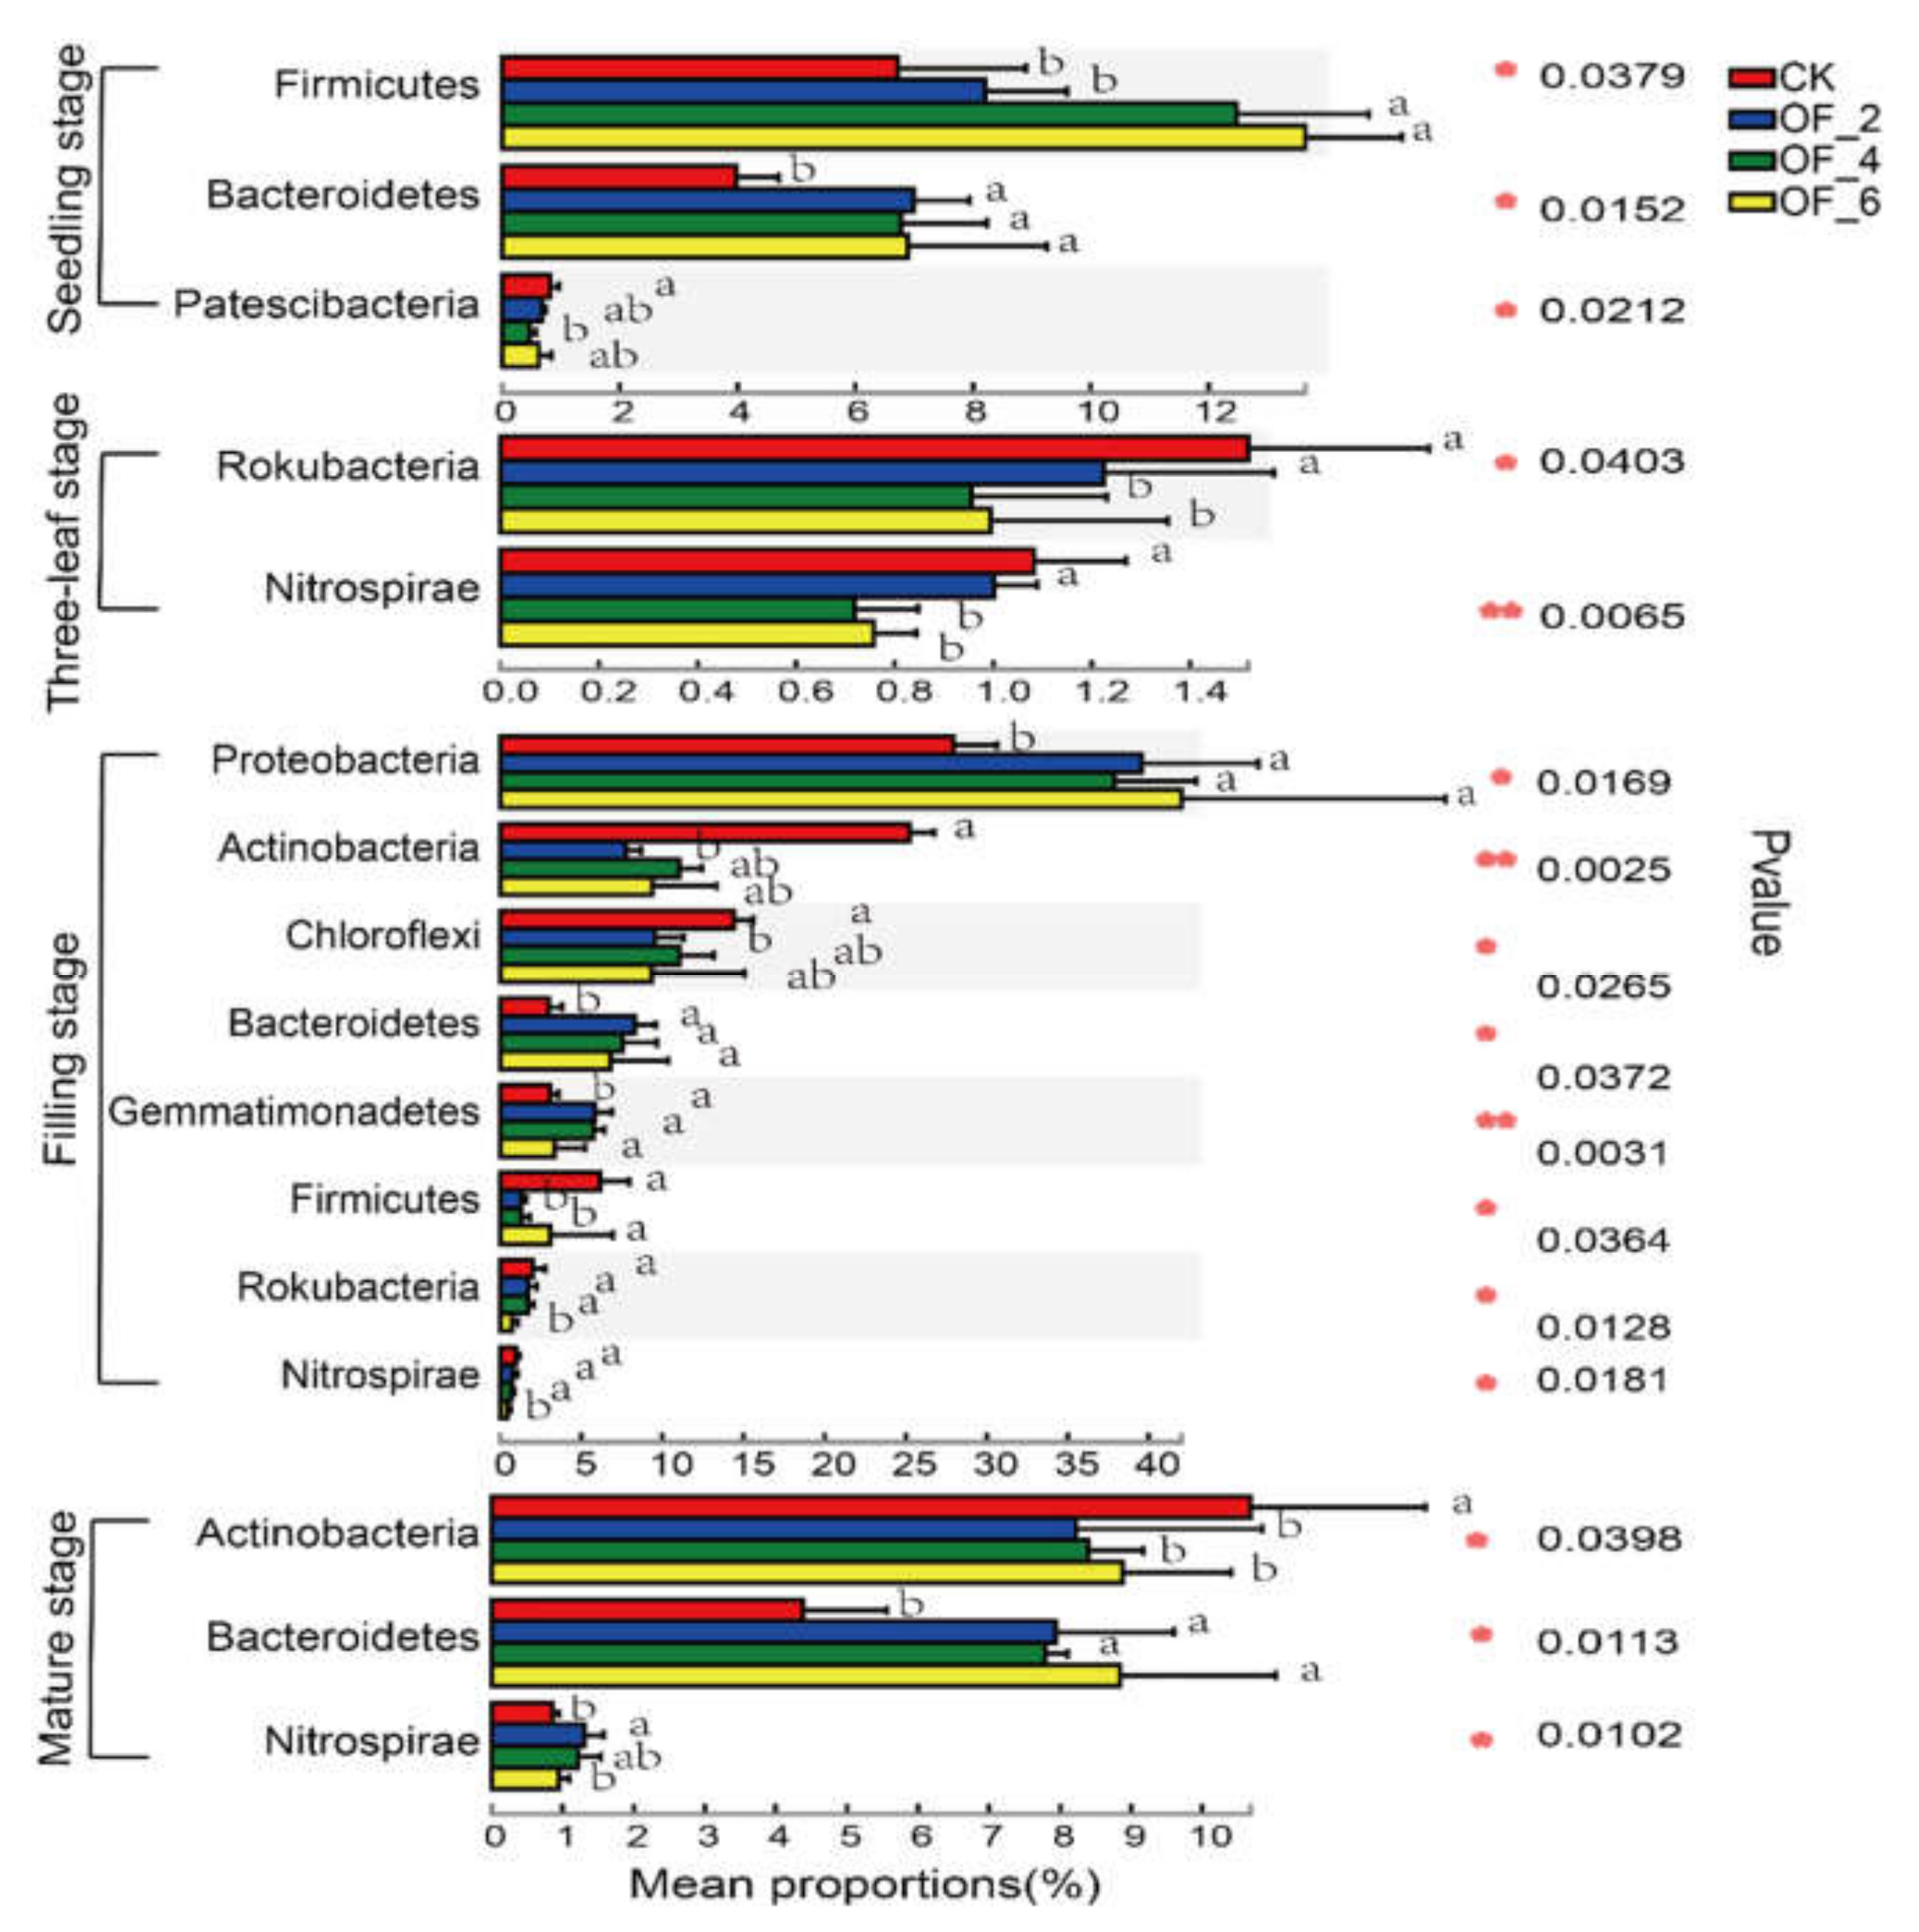
At the phylum level, there are significant differences between bacterial communities of each group (Figure 4), including Firmicutes, Bacteroidetes, Proteobacteria, Nitrospirae, Actinobacteria, and Rokubacteria (p < 0.05). The relative abundance of Firmicutes increased at the seedling stage with the increasing amount of fertilizer, in which OF_4 and OF_6 was significantly higher than CK and OF_2 (p < 0.05). The relative abundance of Bacteroidetes in fertilized groups was significantly higher than that in CK (p < 0.05), except for the three-leaf stage. In the entire cycle, the relative abundance of Bacteroidetes in OF_2, OF_4, and OF_6 was 68.00%, 71.40%, and 77.93% higher than that in CK, respectively. Both Firmicutes and Bacteroidetes are eutrophic bacteria [31,32]. The increases in soil nutrients after fertilizer application (Table 1) promoted their increase in relative abundance. There was no significant difference in the relative abundance of Actinobacteria from each treatment group at each stage. However, the relative abundance of Actinobacteria in treatment groups was lower than CK at the filling stage and was significantly lower than in CK at mature stage (p < 0.05). Actinobacteria are more abundant in soils with low organic carbon content [28,33]. The increase in soil organic matter after the organic fertilizer application of the main reason for the relative abundance decrease (Table 1).The relative abundance of Nitrospirae is decreased with increasing fertilization during the entire growth cycle. The relative abundance of Nitrospirae in OF_6 was significantly lower than that in CK and OF_2 at the three-leaf stage and filling stage (p < 0.05). Nitrospirae is involved in soil nitrification [34], the increase of TN and AN after fertilization may be the main reason for the decrease of its relative abundance [35].
3.3.2. Changes in Bacterial Community at Genus Level
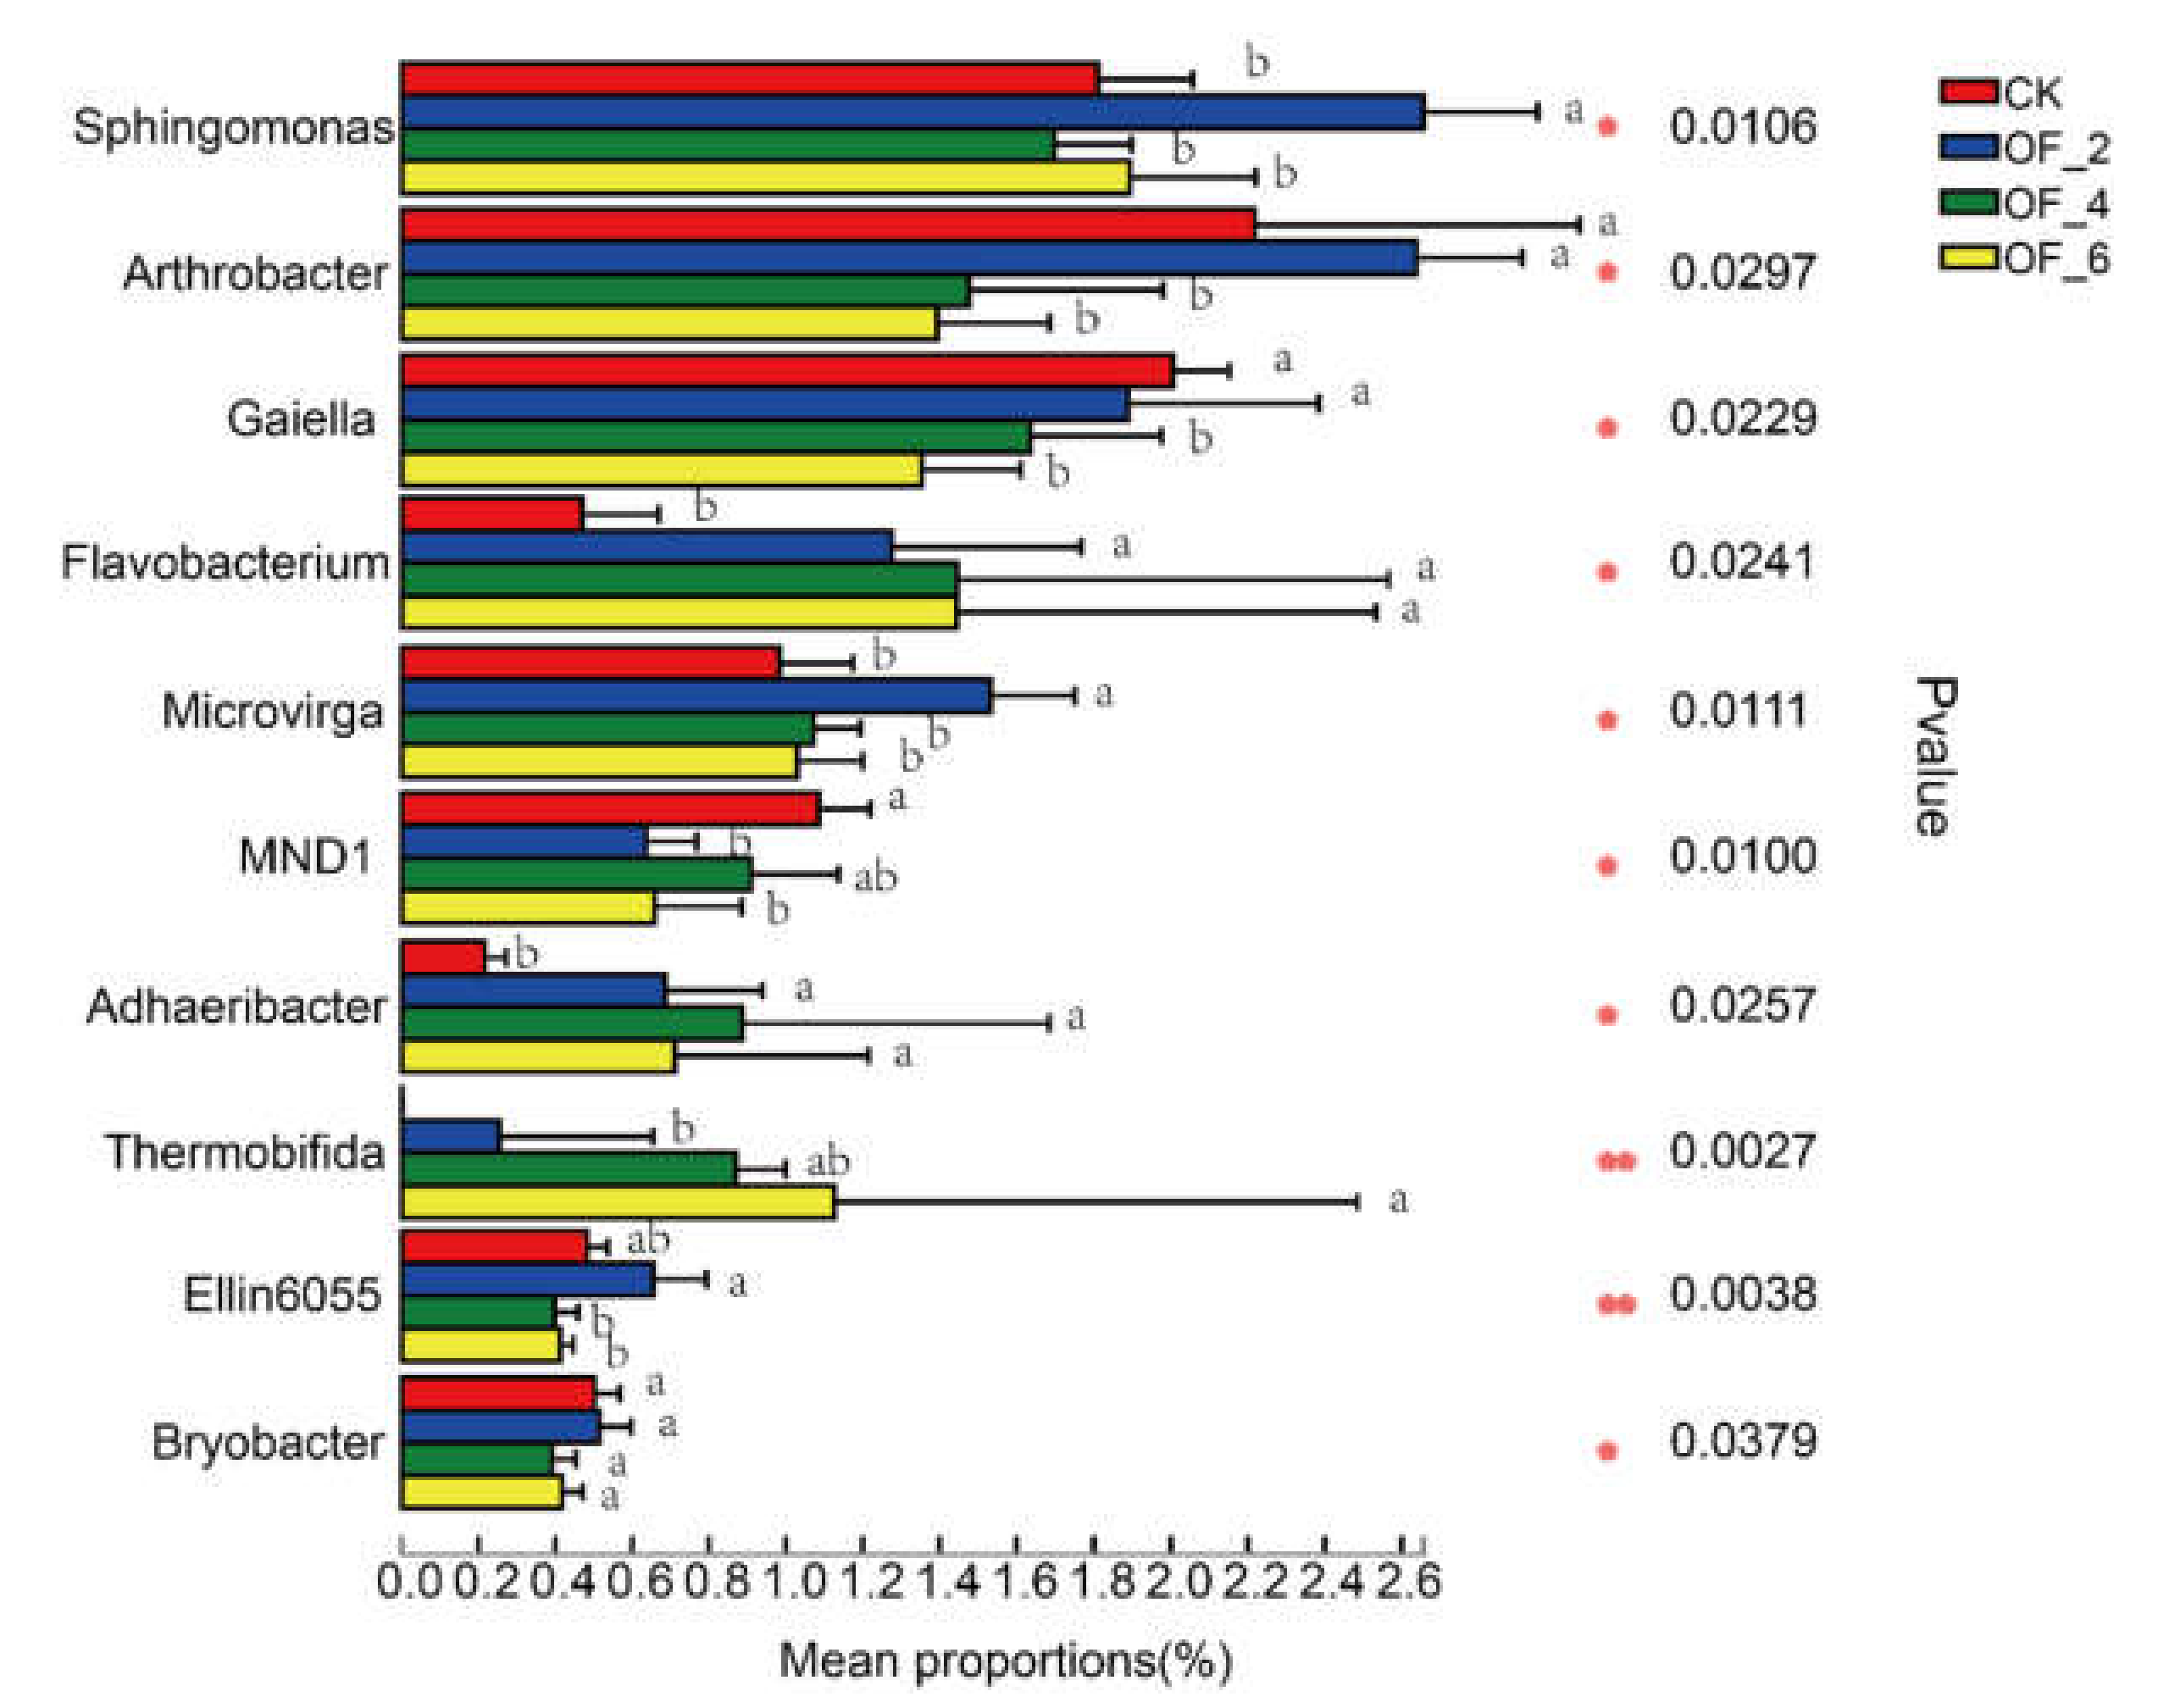
Seedling Stage
The genera with significant differences in relative abundance between groups are shown in Figure 5. The results showed that the relative abundances of some genera, including Thermobifida, Flavobacterium, Adhaeribacter, were significantly increased after the application of organic fertilizer (p < 0.05). Flavobacterium was reported as pathogenic bacteria, and the increase in its relative abundance may have adverse effects of soil health [4]. Besides, the relative abundance of Thermobifida increased with increasing fertilizer amount. which in OF_4 and OF_6 was 241.41% and 342.44% higher than that in OF_2, but was not detected in CK. Thermobifida is reportedly a thermophilic bacterium could be produced during the composting of animal waste [36], and possessing the ability to degrade plant fibers [37]. The result indicated that it enters the soil with organic fertilizer fertilization. Meanwhile, the relative abundances of Arthrobacter and Gaiella were significantly decreased after the application of organic fertilizer (p < 0.05). And the relative abundance of Gaiella decreased with increasing fertilizer amount, of which CK and OF_2 were significantly higher than that of OF_4 and OF_6.
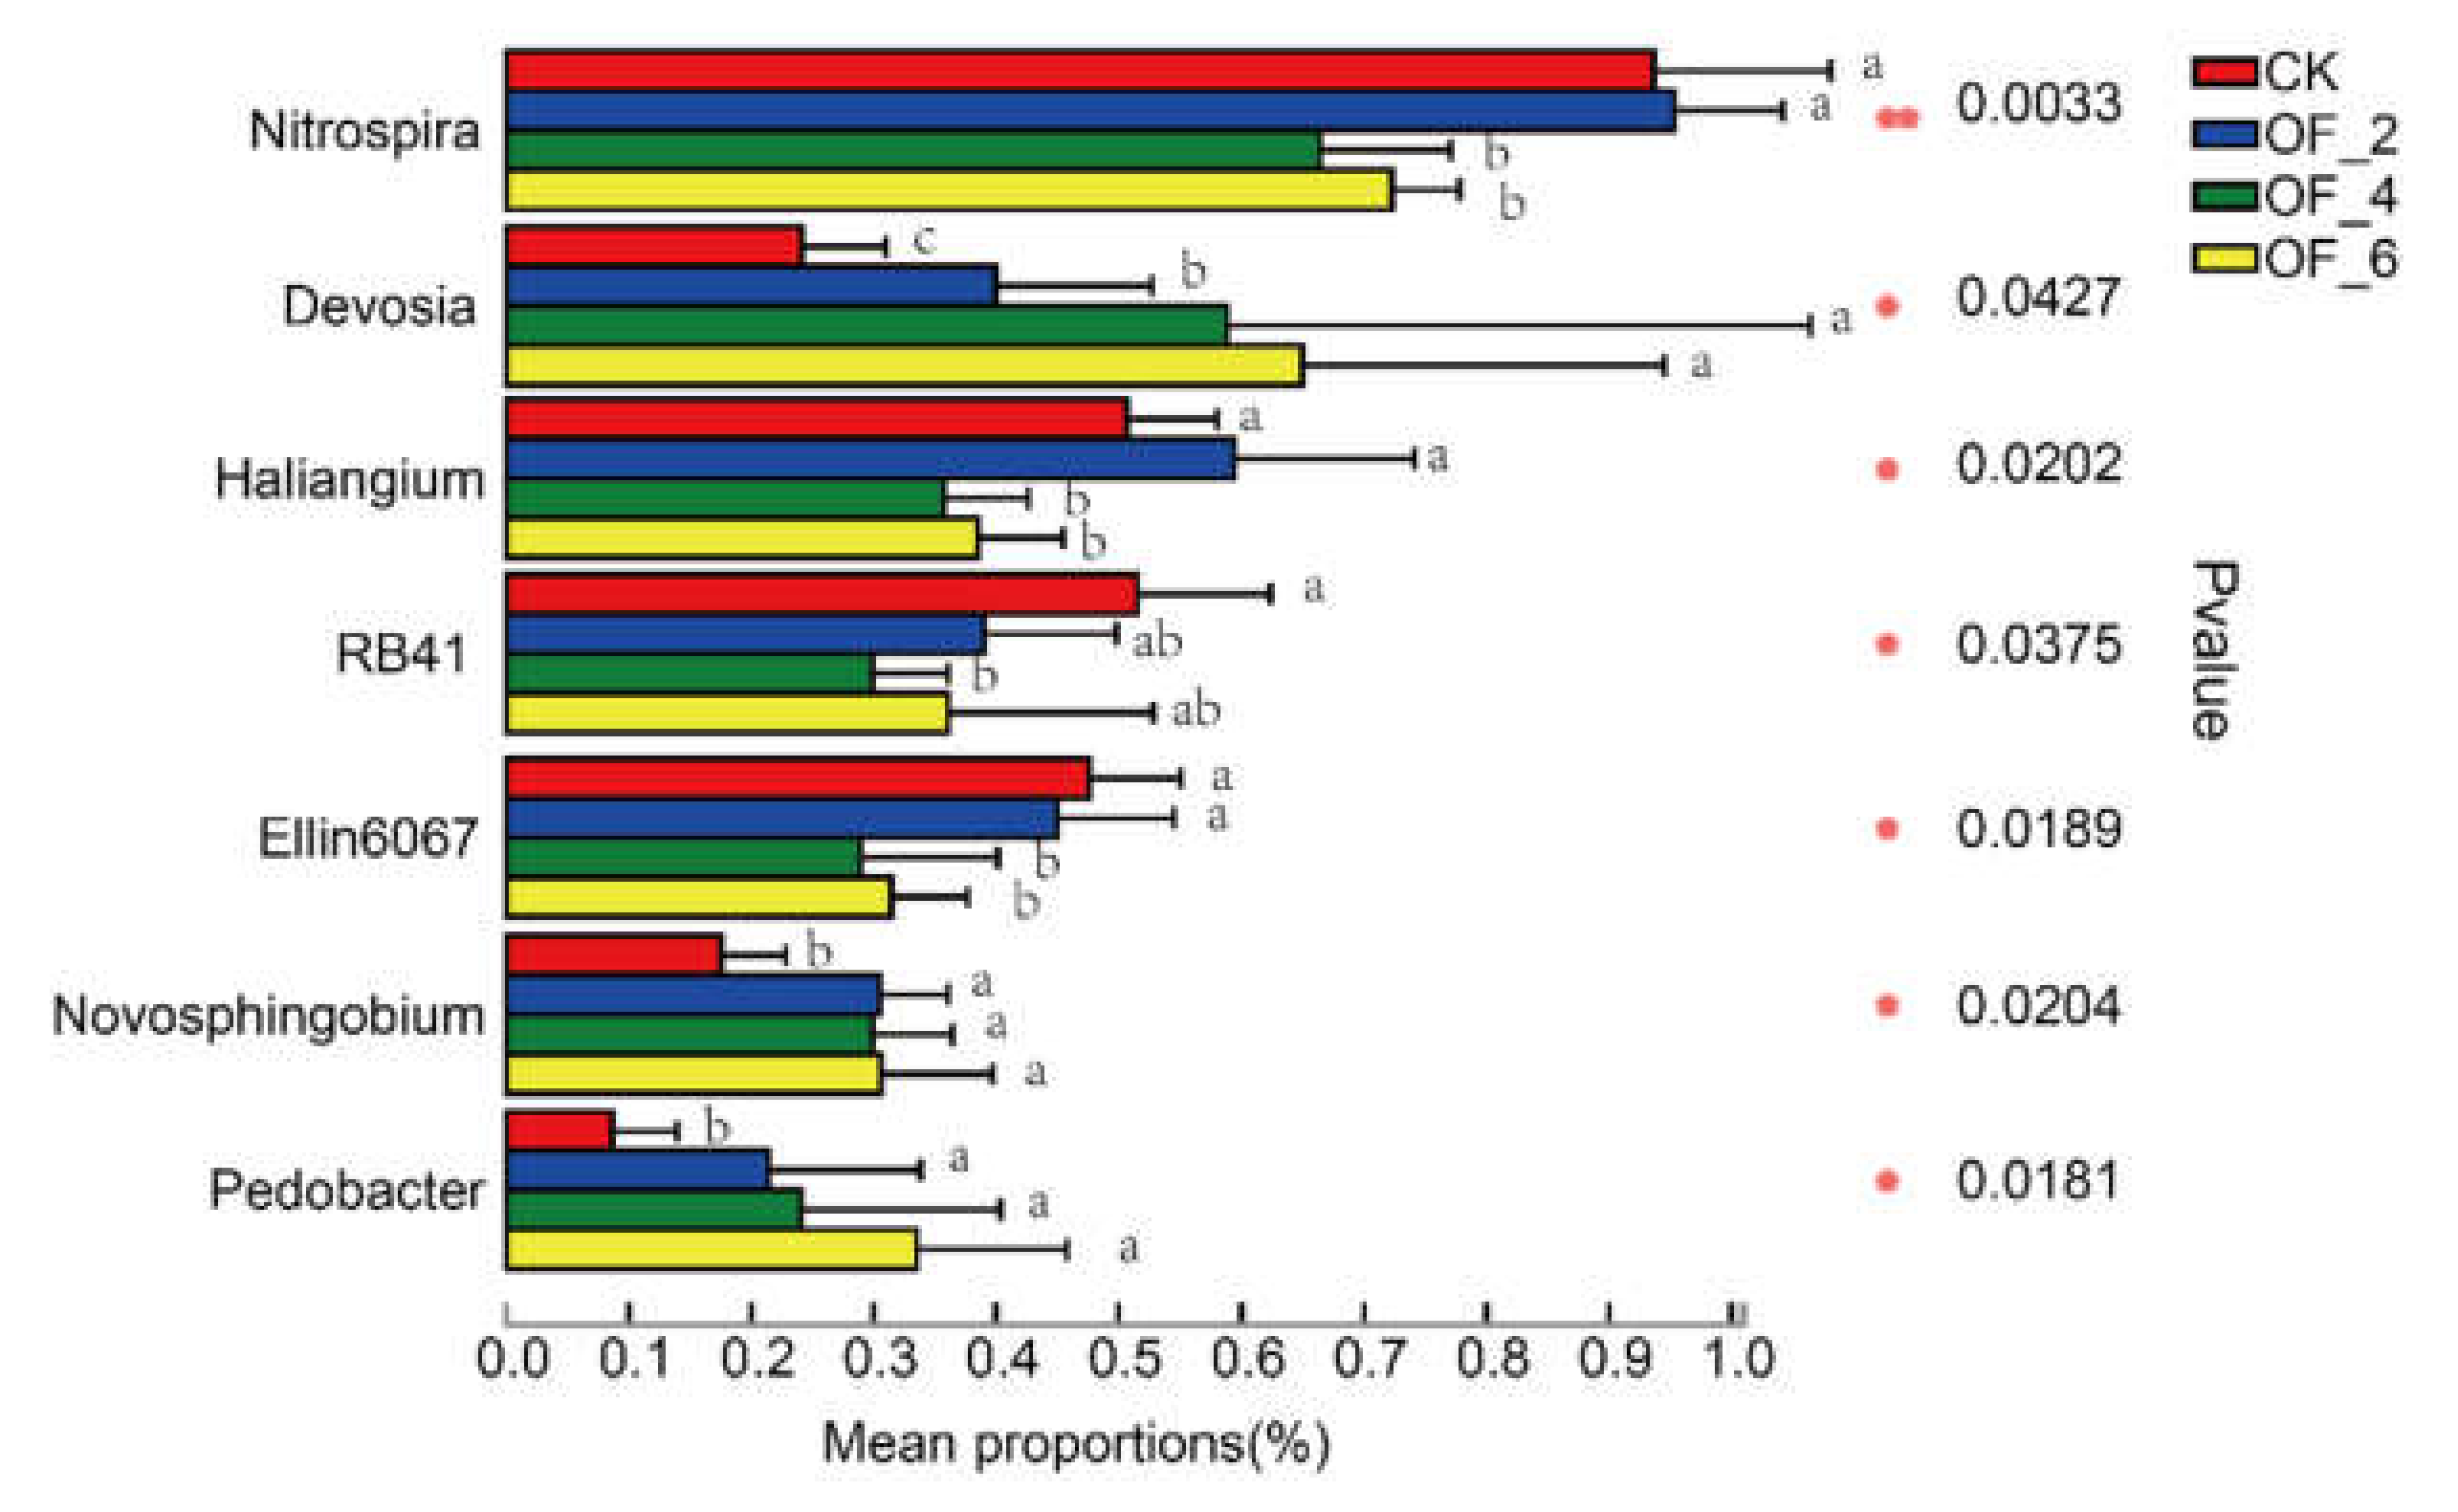
Three-Leaf Stage
The genera with significant differences in relative abundance between groups are shown in Figure 6. The relative abundance of Devosia, Pedobacter and Novosphingobium increased significantly in fertilized soil (p < 0.05). In addition, the relative abundance of Devosia increased with the fertilizer amount, which in OF_4 and OF_6 was 47.31% and 62.44% higher than that in OF_2, respectively. Studies prove that Devosia is a genus of bacteria involved in organic matter degradation [38]. Meanwhile, the relative abundances of Nitrospira, RB41, and Ellin6067 were obviously decreased in the soil with organic fertilizer application (p < 0.05). Nitrospira is known as the main genus of bacteria involved in nitrite oxidation [35], and the increase in nitrogen content after fertilization will reduce the abundance of Nitrospira [29].
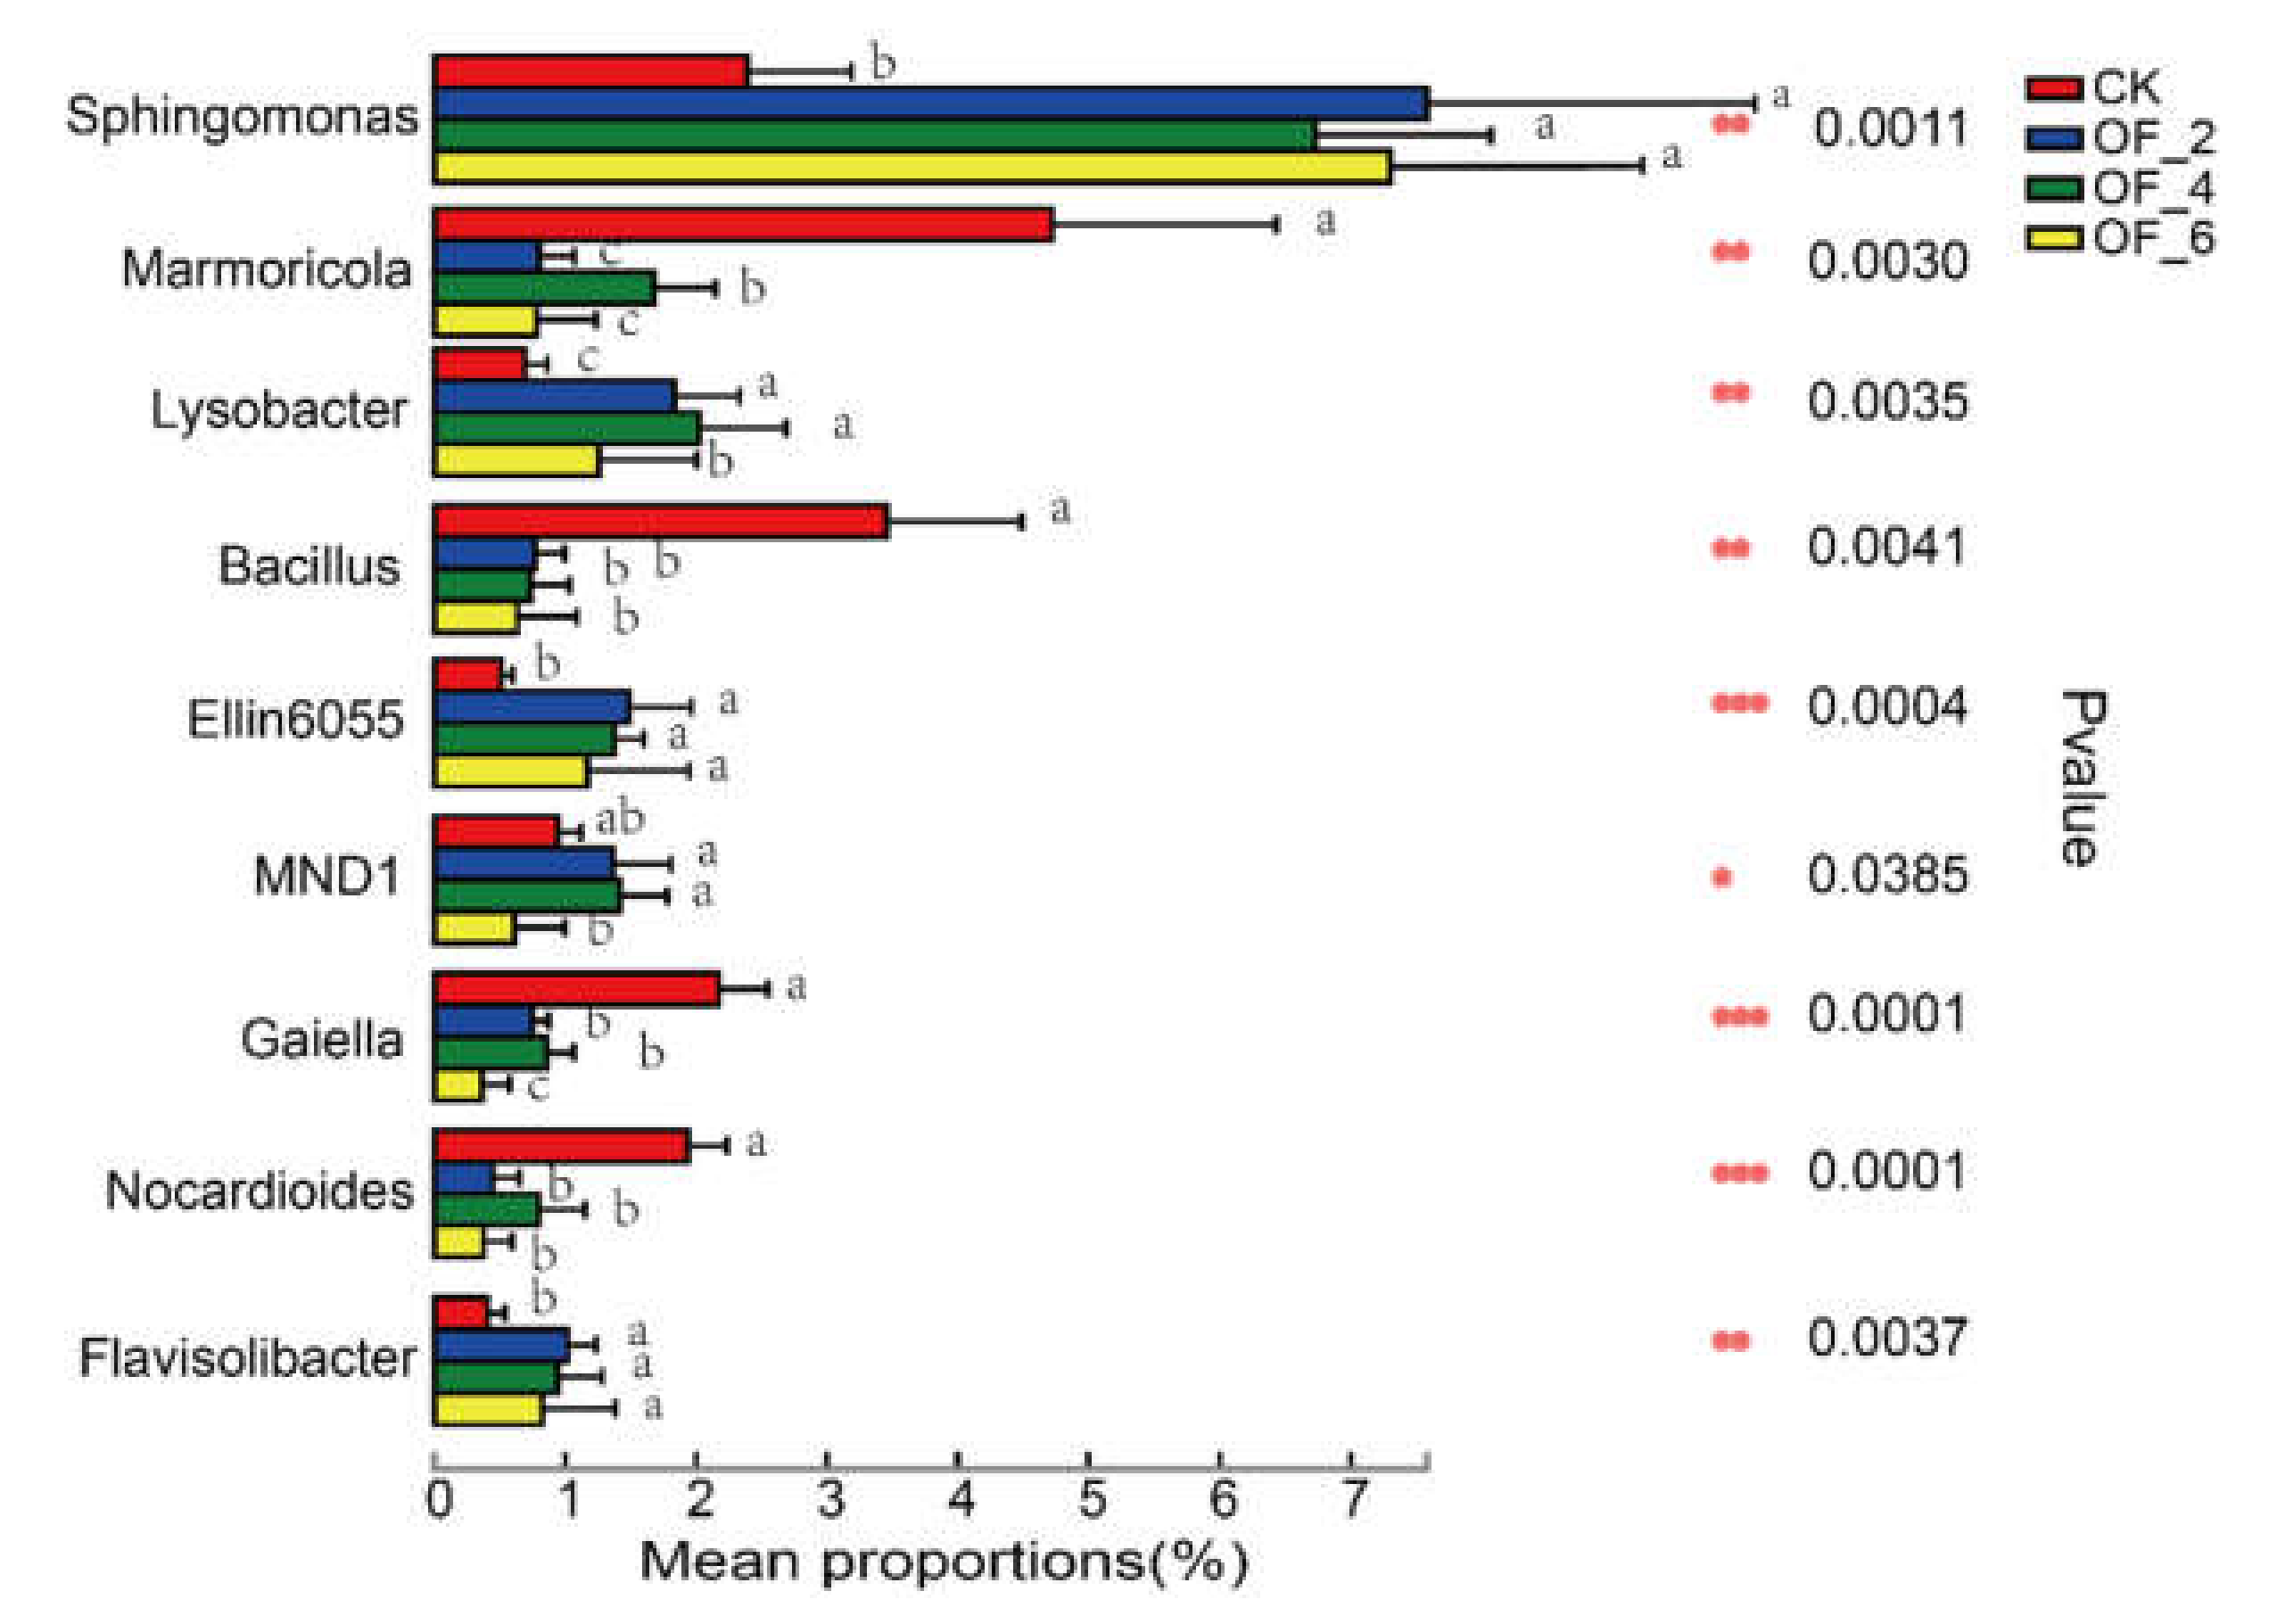
Filling Stage
The genera with significant differences in relative abundance between groups are shown in Figure 7. The relative abundance of Sphingomonas and Flavisolibacter increased significantly in fertilized soil (p < 0.05), but there was no significant difference in their relative abundances between fertilized groups. The relative abundance of Marmoricola, Bacillus, Gaiella, and Nocardioides all decreased significantly in fertilized soil (p < 0.05). Bacillus showed a huge decline in relative abundance in fertilized soil, its relative abundance in OF_2, OF_4, and OF_6 was 77.76%, 78.77%, and 81.66% lower than that in CK, respectively. The relative abundance of Gaiella in seedling stage also decreased in fertilized soil, showing a significant decrease with fertilizer amount (p < 0.05) (Figure 5). Studies show that Gaiella is sensitive to soil antibiotics [39], and animal manure application usually reduces its relative abundance [40].
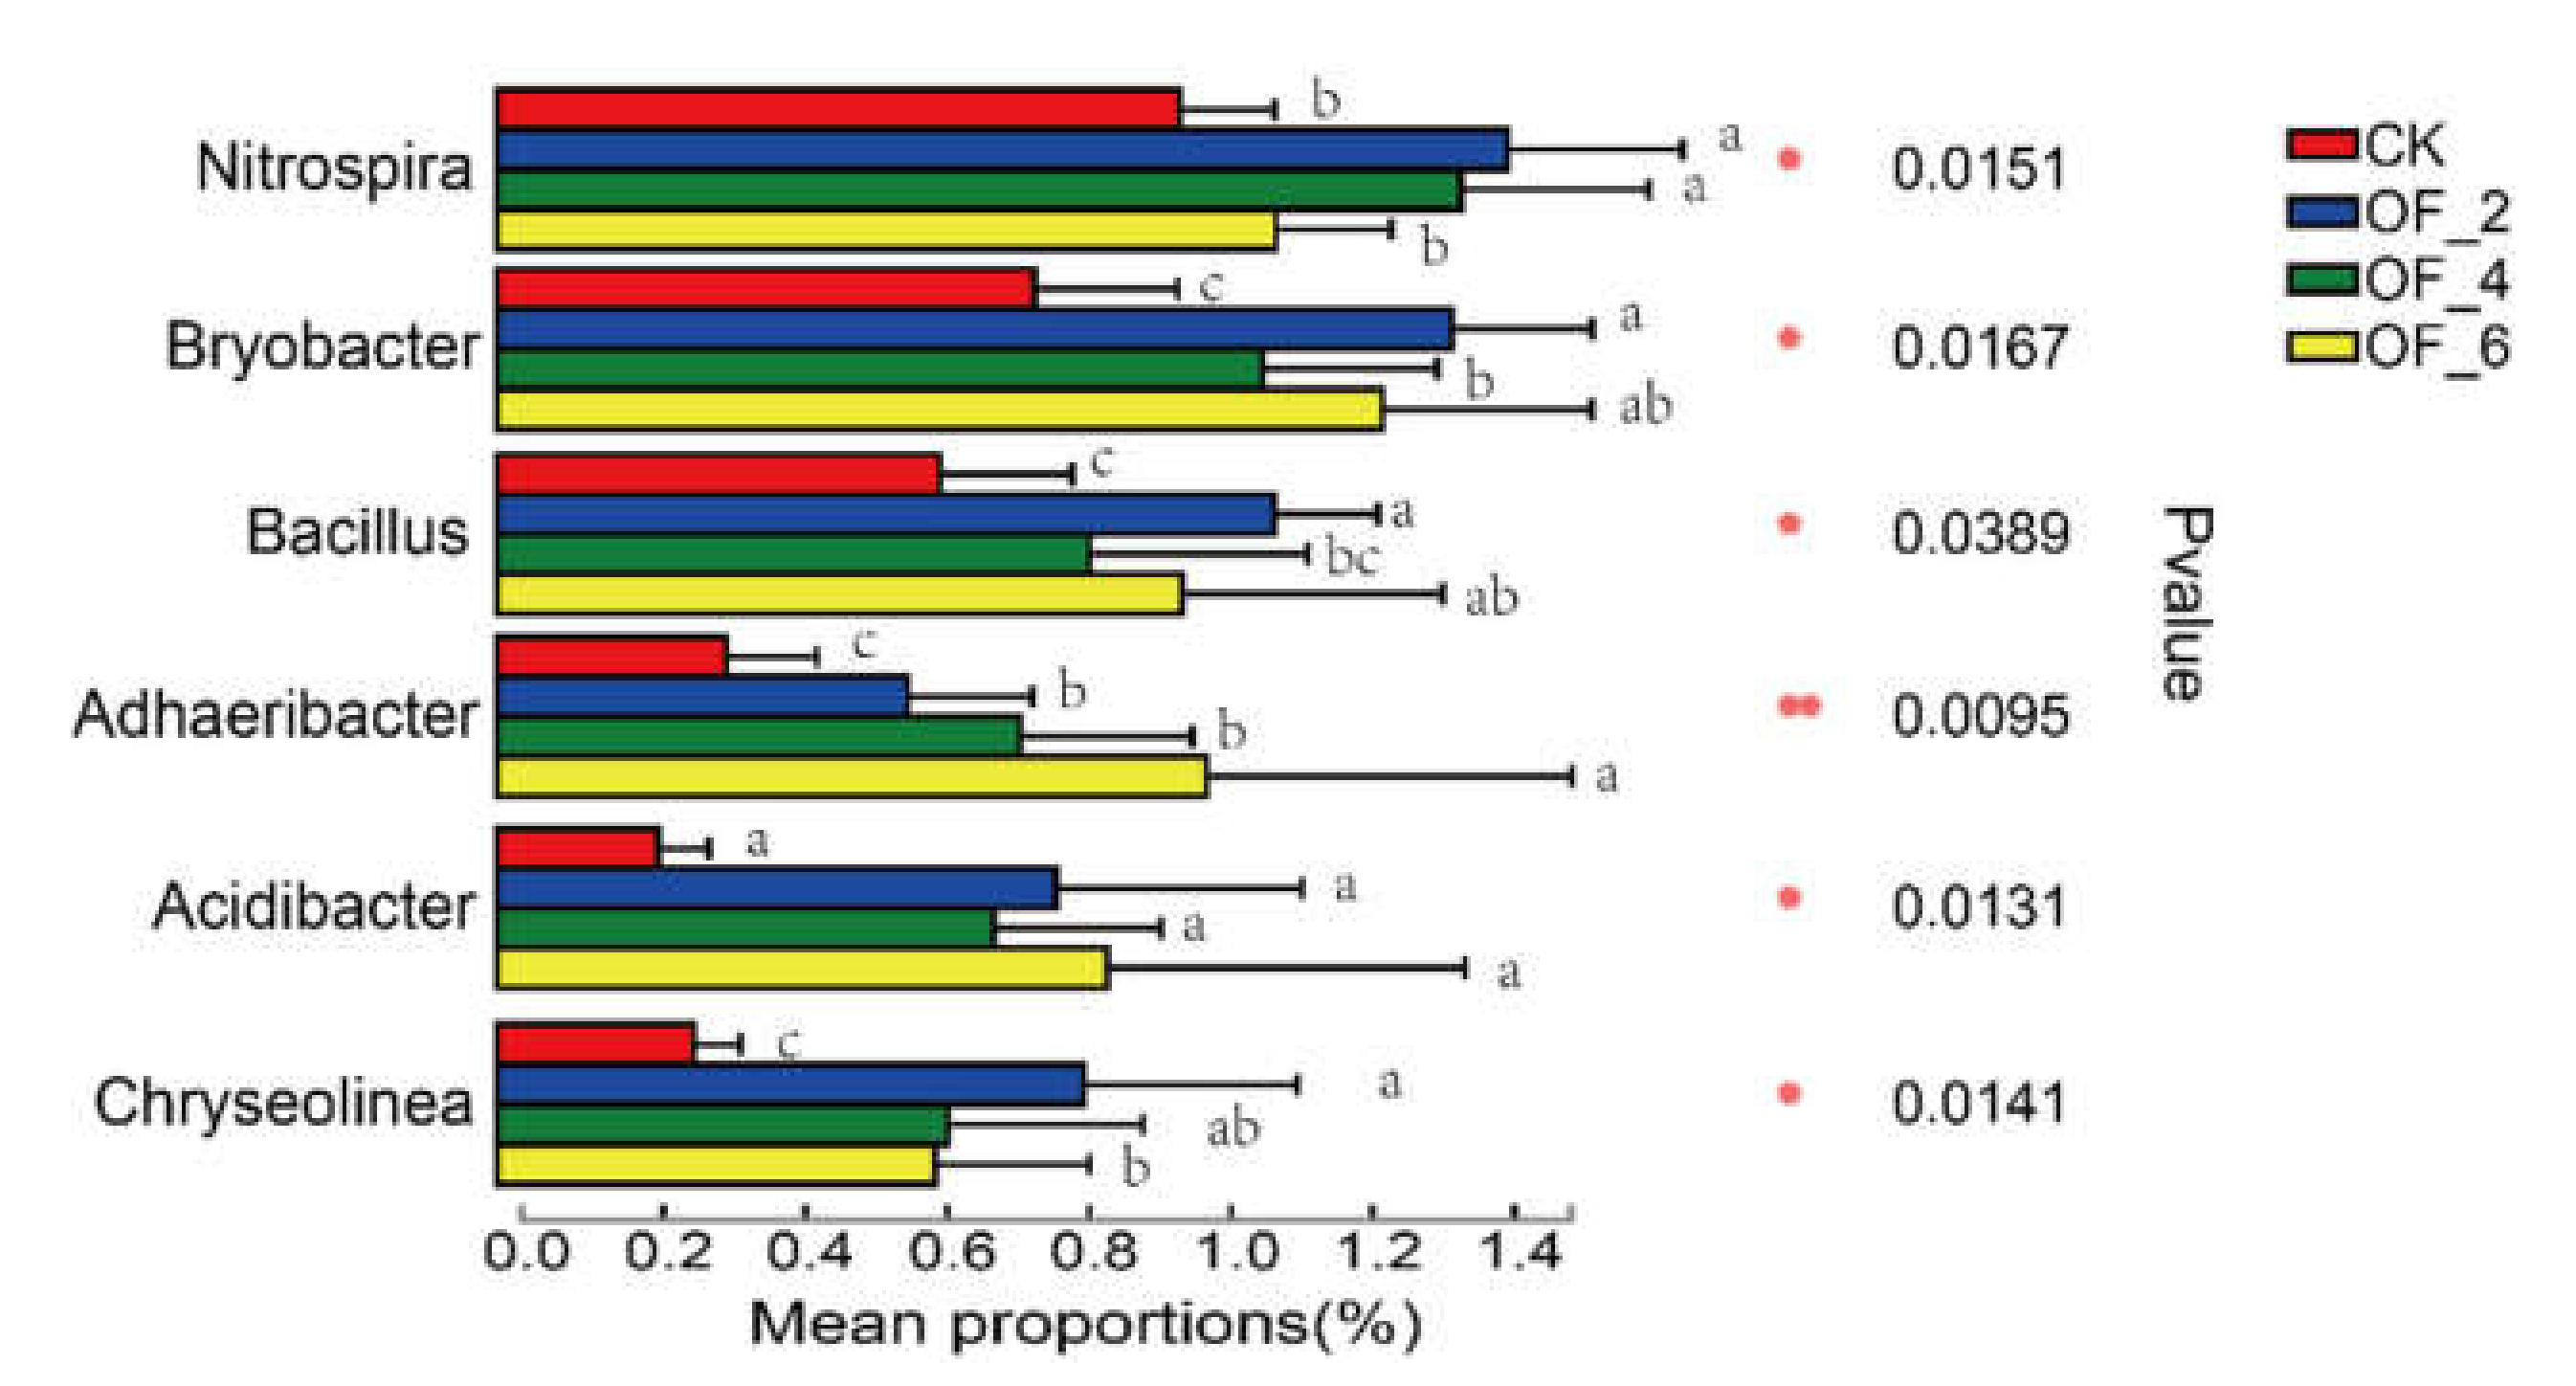
Mature Stage
The genera with significant differences in relative abundance between groups are shown in Figure 8. Similar to the seedling stage, Adhaeribacter increased in the relative abundance in fertilized soil at mature stage. In addition, the relative abundance of Adhaeribacte increased with fertilizer amount, which in OF_6 was 209.28%, 72.8% and 35.66% higher than that in CK, OF_2 and OF_4, respectively. Since Adhaeribacter has been regarded as a soil nitrogen-fixing bacterium [41], the increase of its relative abundance might improve the soil nitrogen-fixing potential. The relative abundances of Nitrospira, Bacillus, Byobacter, Acidibacter and Chyseolinea in fertilized soil were also significantly higher than those in CK, although the relative abundance of Nitrospira in fertilized soil was higher than that in CK, which was different from the situation in the three-leaf stage. The decrease of Nitrospira in relative abundance with fertilizer amount was the same as that in the three-leaf stage. The main reason for this is that soil nutrients can promote the growth of Nitrospira after fertilization, but soil nitrogen, increased with the fertilizer amount, inhibits the growth of Nitrospira [29].
3.3.3. Changes in the Composition of Bacterial Community
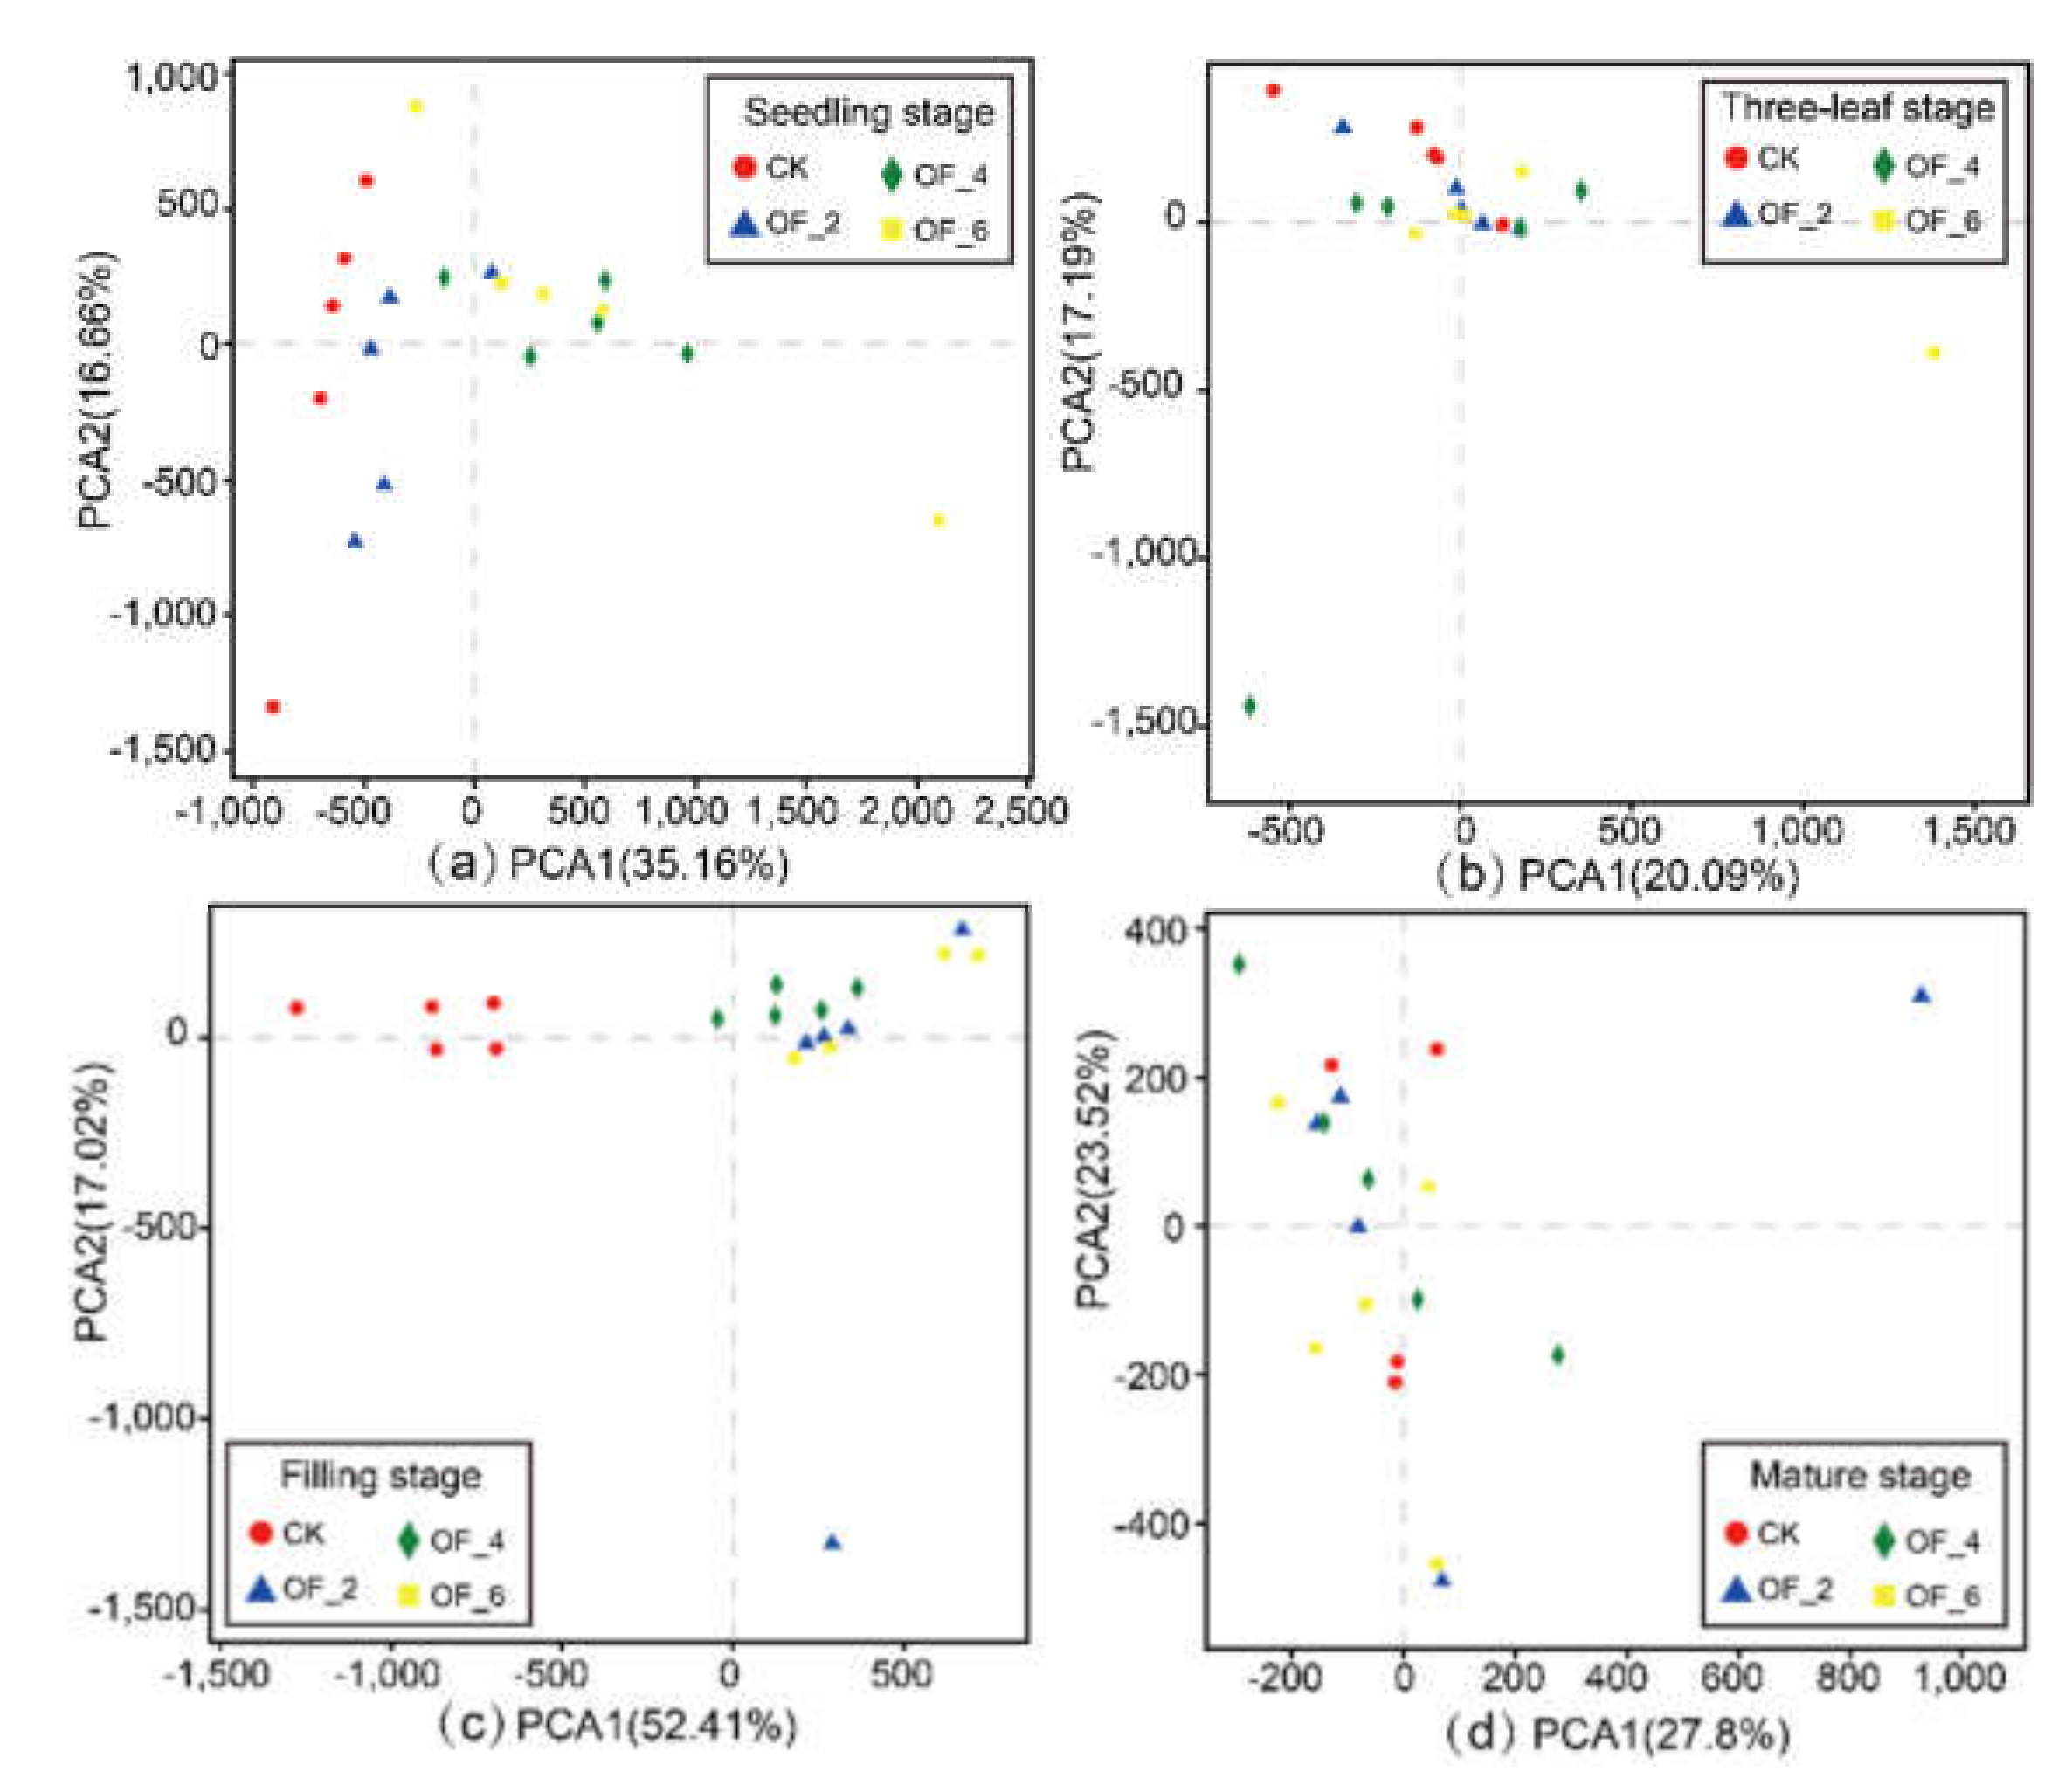
Principal component analysis (PCA) was selected to analyze the main composition of bacterial community in each group (Figure 9). The cluster of each group was highly distinct from each other at seedling, three-leaf and filling stage. Soil bacteria are susceptible to the addition of exogenous substances [42]. Fertilization, or increasing the amount of fertilizer would change the composition of soil bacterial community. The main reason for that change is that the nutrients and heavy metals added after fertilization stimulate or inhibit the growth and reproduction of different bacteria (Figure 4, Figure 5, Figure 6, Figure 7 and Figure 8), while at mature stage, the cluster of each group were not separated, indicating that fertilization can only affect the bacterial community structure in the short term.
3.4. Correlations between Soil Properties and the Community Structure
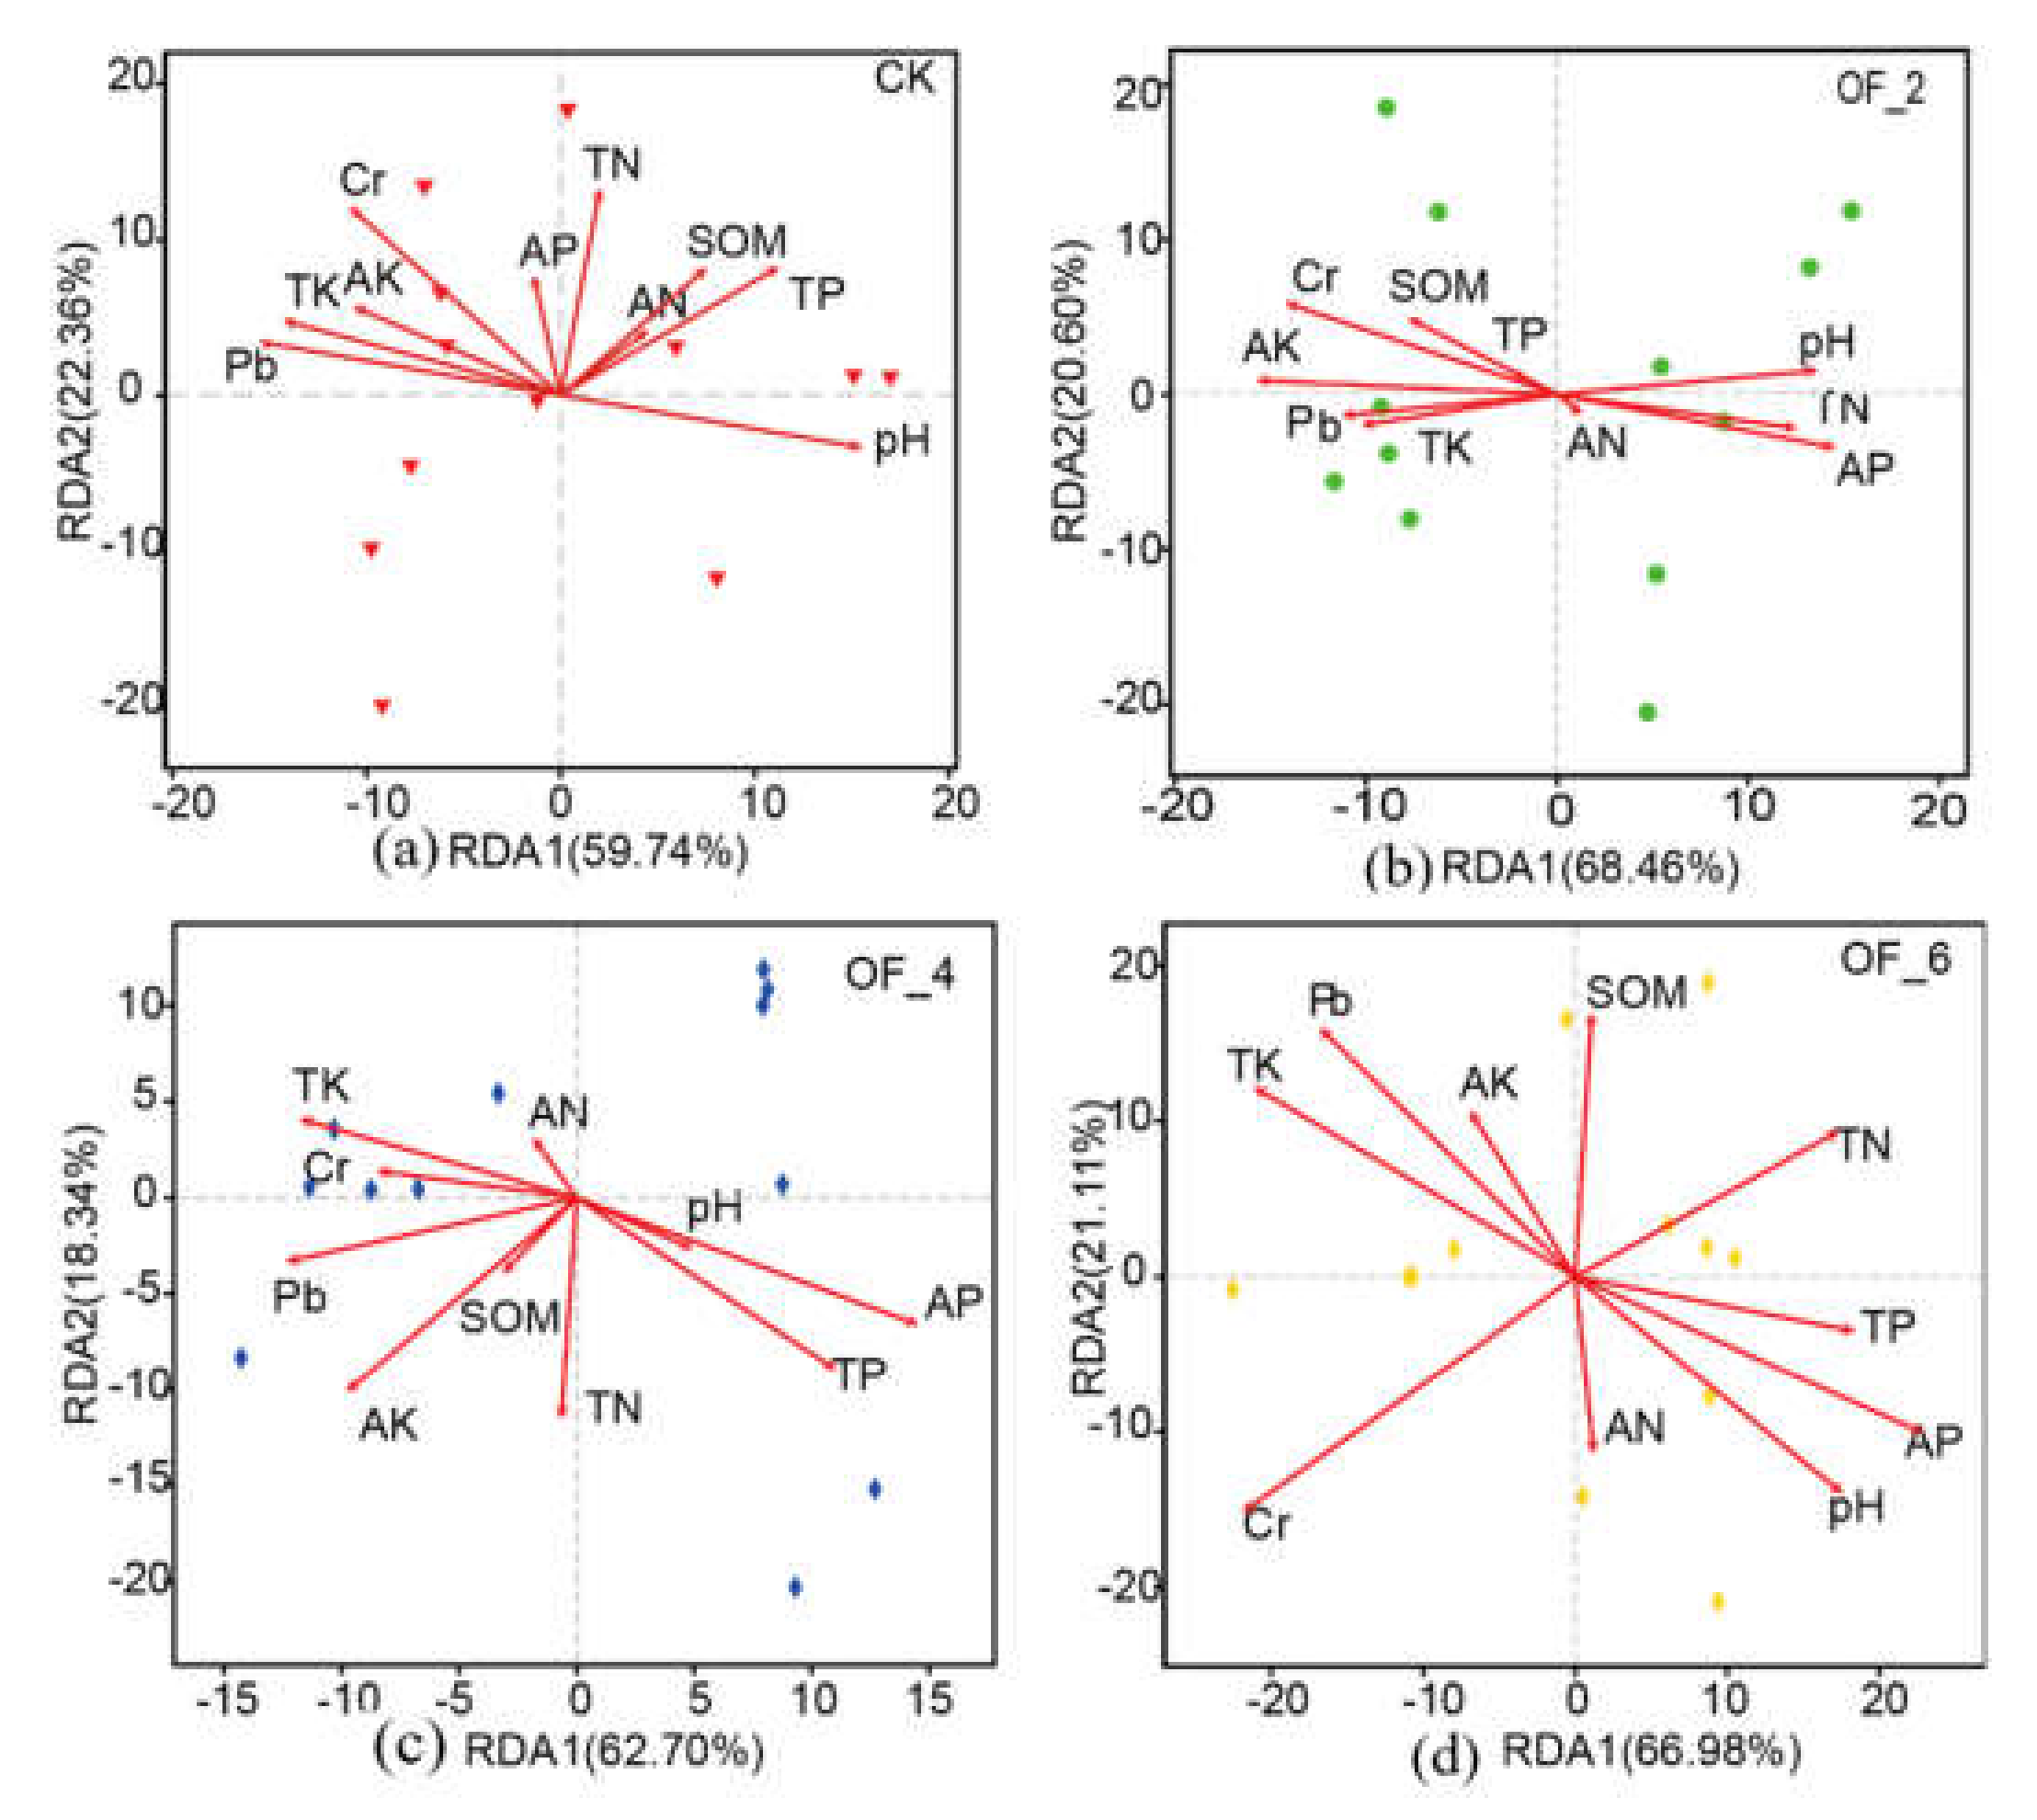
Ten soil physicochemical properties were selected to estimate the correlation between soil environmental factors and bacterial community composition (Figure 10). The bacterial community structure was largely correlated with pH, Cr, Pb, TK, AK, TP, AP, and SOM. In additoin, the driving factor of the bacterial community composition in CK was pH. However, the driving factor of the bacterial community composition in OF_2 and OF_4 was AP (R2 = 0.598 and 0.722, respectively), and that in OF_6 was Cr (R2 = 0.712). The results showed that pH is the most important factor affecting the bacteria composition in the soil undisturbed by organic fertilizer, which is consistent with other studies [10,43]. However, the driving factor of soil bacterial composition changed with the change of fertilizer amount.
4. Conclusions
This study demonstrated that the increase in the application amount of organic fertilizer effectively enhanced soil nutrients and soil respiration rate. Soil bacteria in farmland are susceptible to fertilization, the relative abundance of soil eutrophication bacteria (Firmicutes and Bacteroidetes) increased effectively in all fertilized soils, and the relative abundance of the pathogenic genus Flavolibacterium at the seeding stage also increased in fertilized soils. Increasing the amount of fertilizer was conducive to the growth of nitrogen-fixing bacteria Adhaeribacter, but unfavorable to the growth of nitrite-oxidizing bacteria Nitrospirae, Nitrospira and antibiotic-sensitive Gaiella bacteria. The results showed that the driving factor of bacterial composition was closely related to the fertilization rate. However, the response mechanism of soil bacteria to organic fertilizer application is complex and needs further study to explain it satisfactorily.
Author Contributions
Conceptualization, J.W. and S.H.; Data curation, C.Y. and P.L.; Formal analysis, J.W.; Funding acquisition, J.W.; Investigation, C.Y. and P.L.; Methodology, J.W. and C.S.; Project administration, C.S.; Resources, J.W., C.S. and M.W.; Software, C.Y. and P.L.; Supervision, S.H.; Validation, J.W., C.S. and M.W.; Visualization, J.W. and C.S.; Writing—original draft, J.W.; Writing—review & editing, M.W. and S.H. All authors have read and agreed to the published version of the manuscript.
Funding
This study was supported by the Science and Technology Commission Foundation of Shanghai (No. 20dz1204800), National Natural Science Foundation of China (No. 51979168), the Natural Science Foundation of Shanghai, China (No. 19ZR1443900) and Guangxi Key Laboratory of Water Engineering Materials and Structures (GXHRI-WEMS-2020-09).
Institutional Review Board Statement
Not applicable.
Informed Consent Statement
Not applicable.
Data Availability Statement
Not applicable.
Acknowledgments
We would like to thank the high-throughput sequencing support from Shanghai Majorbio Bio-pharm Technology Co., Ltd.
Conflicts of Interest
The authors declare no conflict of interest.
References
- Qiu, H.G.; Liao, S.P.; Jing, Y.; Luan, J. Regional differences and development tendency of livestock manure pollution in China. Environ. Sci. 2013, 34, 2766–2774. [Google Scholar]
- Shen, Y.; Zhao, L.; Meng, H.; Hou, H.; Fei, W.; Cheng, H.; Liu, H. Effect of aeration rate, moisture content and composting period on availability of copper and lead during pig manure composting. Waste Manag. Res. 2016, 34, 578. [Google Scholar] [CrossRef] [PubMed]
- Kim, Y.K.; Cho, Y.Y.; Oh, H.J.; Kang, H.J.; Jwa, C.S. Growth, Yield and Nutrient Uptake of Radish as Affected by Amount of Organic Fertilizer in a Volcanic Ash soil. Korean J. Org. Agric. 2015, 23, 829–846. [Google Scholar] [CrossRef]
- Li, P.; Wu, J.Q.; Sha, C.Y.; Ye, C.M.; Huang, S.F. Effects of manure and organic fertilizer application on soil microbial community diversity in paddy fields. Environ. Sci. 2020, 41, 4262–4272. [Google Scholar] [CrossRef]
- Pan, X.; Zhang, S.; Zhong, Q.; Gong, G.; Wang, G.; Guo, X.; Xu, X. Effects of soil chemical properties and fractions of Pb, Cd, and Zn on bacterial and fungal communities. Sci. Total Environ. 2020, 715, 136904. [Google Scholar] [CrossRef] [PubMed]
- Zhang, X.; Meng, H.; Shen, Y.S.; Li, J.; Song, L.S. Survey on heavy metal concentrations and maturity indices of organic fertilizer in China. Int. J. Agric. Biol. Eng. 2018, 11, 172–179. [Google Scholar] [CrossRef]
- Lu, D.; Lei, J.; Wei, Y.Y.; Shen, F.K.; Huang, Y.H.; Gu, M.H. Effect of microbial community and diversity index of paddy soil under short no-tillage and ridge tillage. Southwest China J. Agric. Sci. 2015, 28, 1670–1674. [Google Scholar] [CrossRef]
- Ren, F.L.; Zhang, X.B.; Sun, N.; Xu, M. A meta-analysis of manure application impact on soil microbial biomass across China’s croplands. Chin. Agric. Sci. 2018, 51, 119–128. [Google Scholar] [CrossRef]
- Giacometti, C.; Cavani, L.; Baldoni, G.; Ciavatta, C.; Kandeler, E. Microplate-scale fluorometric soil enzyme assays as tools to assess soil quality in a long-term agricultural field experiment. Appl. Soil Ecol. 2014, 75, 80–85. [Google Scholar] [CrossRef]
- Lauber, C.L.; Hamady, M.; Knight, R.; Fiere, N. Pyrosequencing-Based Assessment of Soil pH as a Predictor of Soil Bacterial Community Structure at the Continental Scale. Appl. Environ. Microbiol. 2009, 75, 5111–5120. [Google Scholar] [CrossRef] [PubMed] [Green Version]
- Ye, C.M.; Huang, S.F.; Sha, C.Y.; Wu, J.Q.; Cui, C.Z.; Su, J.H.; Ruan, J.J.; Tan, J.; Tang, H.; Xue, J.J. Changes of bacterial community in arable soil after short-term application of fresh manures and organic Fertilizer. Environ. Technol. 2020, 1–24. [Google Scholar] [CrossRef]
- Gong, W.J.; Niu, Z.F.; Wang, X.R.; Zhao, H.P. How the Soil Microbial Communities and Activities Respond to Long-Term Heavy Metal Contamination in Electroplating Contaminated Site. Microorganisms 2021, 9, 362. [Google Scholar] [CrossRef]
- Sui, Q.W.; Zhang, J.Y.; Wei, Y.S.; Chen, M.X.; Dong, H.M.; Xiong, J.H. Veterinary antibiotics use occurrence of antibiotic resistance pathogen and its antibiotic resistance genes in animal production: An overview. Asian J. Ecotoxicol. 2015, 10, 20–34. [Google Scholar] [CrossRef]
- Saleem, M.; Hu, J.; Jousset, A. More Than the Sum of Its Parts: Microbiome Biodiversity as a Driver of Plant Growth and Soil Health. Annu. Rev. Ecol. Evol. Syst. 2019, 50, 145–168. [Google Scholar] [CrossRef]
- Monard, C.; Vandenkoornhuyse, P.; Bot, B.; Binet, F. Relationship between bacterial diversity and function under biotic control: The soil pesticide degraders as a case study. ISME J. 2011, 5, 1048–1056. [Google Scholar] [CrossRef] [PubMed] [Green Version]
- Guo, Y.; Wang, Y.M.; Wu, P.; Peng, S. Influence of long-term manure application in paddy soil on the functional diversity of microbial community. Chin. J. Appl. Environ. Biol. 2019, 25, 593–602. [Google Scholar] [CrossRef]
- Xun, W.B.; Wu, X.; Huang, T.; Ran, W.; Li, D.C.; Shen, Q.R.; Li, Q.; Zhang, R.F. Swine manure and quicklime have different impacts on chemical properties and composition of bacterial communities of an acidic soil. Appl. Soil Ecol. 2016, 100, 38–44. [Google Scholar] [CrossRef]
- Luo, P.; Han, X.; Wang, Y.; Han, M.; Shi, H.; Liu, N.; Bai, H. Influence of long-term fertilization on soil microbial biomass, dehydrogenase activity, and bacterial and fungal community structure in a brown soil of northeast China. Ann. Microbiol. 2014, 65, 533–542. [Google Scholar] [CrossRef] [PubMed] [Green Version]
- Sun, J.; Zhang, Q.; Zhou, J.; Wei, Q. Pyrosequencing technology reveals the impact of different manure doses on the bacterial community in apple rhizosphere soil. Appl. Soil Ecol. 2014, 78, 28–36. [Google Scholar] [CrossRef]
- Zhang, J.; Dong, X.C.; Zhan, H.; Deng, D.L.; Luo, C.Y.; Zhang, C.H.; Qiu, H.Z. Effect of long-term nitrogen application on bacterial community structure of potato soil in semi-arid area. J. Gansu Agric. Univ. 2019, 54, 30–41. [Google Scholar] [CrossRef]
- Zhang, L.Q. Effect of Long-Term Rotation and Fertilization to Soil Fertility and Its Comprehensive Evaluation. Northwest A&F University, China. 2016. Available online: http://cdmd.cnki.com.cn/Article/CDMD-10712-1016175373.htm (accessed on 18 January 2021).
- Wang, Z.F.; Chen, J.; Dai, J.P.; Ahmat, G.; Wang, X.W.; Qin, X.Z.; Li, C.H.; Yang, X.P. Analysis on the diversity of bacterial flora during the natural decomposing process of corn straws by illumina miseq sequencing. Xinjiang Agric. Sci 2019, 56, 111–119. [Google Scholar] [CrossRef]
- Provolo, G.; Manuli, G.; Finzi, A.; Lucchini, G.; Riva, E.; Sacchiet, G. Effect of Pig and Cattle Slurry Application on Heavy Metal Composition of Maize Grown on Different Soils. Sustainability 2018, 10, 2684. [Google Scholar] [CrossRef] [Green Version]
- Chen, Y.L. The effects of different nitreon sources on pH and the nutrient availability in the rhizosphere of korean pine. J. Nanjing For. Univ. 2004, 28, 42–46. [Google Scholar] [CrossRef]
- Pan, X.; Han, Z.; Ben, W.W. Heavy Metal Contents in Pig Manure and Pig Feeds from Intensive Pig Farms in Shandong Province, China. J. Agric. Environ. Sci. 2013, 32, 160–165. [Google Scholar] [CrossRef]
- Wu, R.J.; Wang, Y.C.; Zhu, P.; He, M.; Huang, C.C.; Wang, L.G.; Zhang, F.L. Effects of long-term fertilization on soil respiration in spring maize field in the central part of northeast China. Plant Nutr. Fert. Sci. 2018, 24, 44–52. [Google Scholar] [CrossRef]
- Yan, J.X.; Zhang, Y.; Jiao, X.Y. Effect of Fertilization on Soil Respiration and Its Temperature Sensitivity in a Sorghum Field. Huan Jing Ke Xue 2019, 40, 5515–5523. [Google Scholar] [CrossRef]
- Calleja-Cervantes, M.E.; Menéndez, S.; Fernández-González, A.J.; Irigoyen, I.; Cibriáin-Sabalza, J.F.; Toro, N.; Aparicio-Tejo, P.M.; Fernández-López, M. Changes in soil nutrient content and bacterial community after 12 years of organic amendment application to a vineyard. Eur. J. Soil Sci. 2015, 66, 802–812. [Google Scholar] [CrossRef]
- Kumar, U.; Nayak, A.K.; Shahid, M.; Vadakattu, G.; Panneerselvam, P.; Mohanty, S.S.; Kaviraj, M.; Kumar, A.; Chatterjee, D.; Lal, B.; et al. Continuous application of inorganic and organic fertilizers over 47 years in paddy soil alters the bacterial community structure and its influence on rice production. Agric. Ecosyst. Environ. 2018, 262, 65–75. [Google Scholar] [CrossRef]
- Lipson, D.A. Relationships between temperature responses and bacterial community structure along seasonal and altitudinal gradients. FEMS Microbiol. Ecol. 2007, 59, 418–427. [Google Scholar] [CrossRef] [PubMed]
- Kulichevskaya, I.S.; Belova, S.E.; Kevbrin, V.V.; Dedyshet, S.N.; Zavarzinal, G.A. Analysis of the bacterial community developing in the course of Sphagnum moss decomposition. Microbiology 2007, 76, 621–629. [Google Scholar] [CrossRef]
- Davide, F.; Elke, S.; Guillaume, L.; Tesfaye, W.; Francois, B.; Thomas, R. Mineral vs. organic amendments: Microbial community structure, activity and abundance of agriculturally relevant microbes are driven by long-term fertilization strategies. Front. Microbiol. 2016, 7, 1446. [Google Scholar] [CrossRef] [Green Version]
- Tang, H.; Shi, X.X.; Wang, X.F.; Hao, H.; Zhang, X.M.; Zhang, L.P. Environmental Controls Over Actinobacteria Communities in Ecological Sensitive Yanshan Mountains Zone. Front. Microbiol. 2016, 7, 343. [Google Scholar] [CrossRef] [Green Version]
- Baker, B.J.; Sheik, C.S.; Taylor, C.A.; Jain, S.; Dick, G.J. Community transcriptomic assembly reveals microbes that contribute to deep-sea carbon and nitrogen cycling. ISME J. 2013, 7, 1962–1973. [Google Scholar] [CrossRef] [PubMed] [Green Version]
- Kong, Y.; Ling, N.; Xue, C.; Chen, H.; Ruan, Y.; Guo Jj Chen, Z.; Wang, M.; Shen, Q.R.; Guo, S.W. Long-term fertilization regimes change soil nitrification potential by impacting active autotrophic ammonia oxidizers and nitrite oxidizers as assessed by DNA stable isotope probing. Environ. Microbiol. 2019, 21, 1224–1240. [Google Scholar] [CrossRef]
- Cao, Y.; Chang, Z.Z.; Huang, H.Y.; Xu, Y.D.; Wu, H.S. Chemical and Biological Changes During Early Stage of Composting of Different Animal Wastes. J. Agric. Environ. Sci. 2015, 34, 2198–2207. [Google Scholar] [CrossRef]
- Kawai, F.; Thumarat, U.; Kitadokoro, K.; Waku, T.; Tada, T.; Tanaka, N.; Kawabata, T. Comparison of polyester-degrading cutinases from genus thermobifida. ACS Symp. Ser. 2013, 1144, 111–120. [Google Scholar] [CrossRef]
- Xu, L.P.; Jiang, Z.; Ge, Y.L.; Sun, H.W. Bacterial Community on the Corn Straw in Suihua Area of Heilongjiang Province by Illumina Miseq Sequencing. Sci. Technol. Food Ind. 2018, 39, 105–110. [Google Scholar] [CrossRef]
- Uddin, M.; Chen, J.; Qiao, X.; Tian, R.; Arafat, Y.; Yang, X.J. Bacterial community variations in paddy soils induced by application of veterinary antibiotics in plant-soil systems. Ecotoxicol. Environ. Saf. 2019, 167, 44–53. [Google Scholar] [CrossRef]
- Liu, P.; Jia, S.; He, X.; Zhang, X.; Ye, L. Different impacts of manure and chemical fertilizers on bacterial community structure and antibiotic resistance genes in arable soils. Chemosphere 2017, 188, 455–464. [Google Scholar] [CrossRef]
- Liang, Z.T.; Deng, J.Q.; Wang, Z.K.; Shen, Y.Z.; Wang, X.Z. Difference in soil bacterial community composition among three forage-crop rotations on the Longdong Loes Plateau. Acta Pratacul Turae Sinica 2017, 26, 180–191. [Google Scholar] [CrossRef]
- Wei, W.; Xu, Y.L.; Zhu, L.; Han, X.Z. Effect of long-team fertilization on soil microbial communities in farmland of black soil. Acta Pedol. Sin. 2013, 50, 372–380. [Google Scholar] [CrossRef]
- Ren, B.; Hu, Y.; Chen, B.; Zhang, Y.; Thiele, J.; Shi, R.; Liu, M.; Bu, R. Soil pH and plant diversity shape soil bacterial community structure in the active layer across the latitudinal gradients in continuous permafrost region of Northeastern China. Sci. Rep. 2018, 8. [Google Scholar] [CrossRef] [PubMed]
Figure 1.
Layout of the experimental site.

Figure 2.
Effect of organic fertilizer application rate on soil respiration rate.

Figure 3.
The relative abundance of bacterial level in different treated soil (phylum level). *M represents seedling stage, S represents three-leaf stage, G represents filling stage, C represents mature stage.
Figure 3.
The relative abundance of bacterial level in different treated soil (phylum level). *M represents seedling stage, S represents three-leaf stage, G represents filling stage, C represents mature stage.

Figure 4.
Bacteria with significant differences between different treated soils (phylum level).

Figure 5.
Bacteria with significant differences between different treated soil at the seedling stage (genus level).
Figure 5.
Bacteria with significant differences between different treated soil at the seedling stage (genus level).

Figure 6.
Bacteria with significant differences between different treated soil at the three-leaf stage (genus level).
Figure 6.
Bacteria with significant differences between different treated soil at the three-leaf stage (genus level).

Figure 7.
Bacteria with significant differences between different treated soil at the filling stage (genus level).
Figure 7.
Bacteria with significant differences between different treated soil at the filling stage (genus level).

Figure 8.
Bacteria with significant differences between treatment groups at the mature stage (genus level).
Figure 8.
Bacteria with significant differences between treatment groups at the mature stage (genus level).

Figure 9.
Principal component analysis of bacterial community during the entire maize growth cycle (OTU level). (a) seedling stage; (b) Three-leaf stage; (c) filling stage; (d) mature stage.
Figure 9.
Principal component analysis of bacterial community during the entire maize growth cycle (OTU level). (a) seedling stage; (b) Three-leaf stage; (c) filling stage; (d) mature stage.

Figure 10.
Correlations between soil properties and the community structure of soil bacterial as determined by redundancy analysis (RDA) during the entire maize growth cycle. (a) seedling stage; (b) Three-leaf stage; (c) filling stage; (d) mature stage.
Figure 10.
Correlations between soil properties and the community structure of soil bacterial as determined by redundancy analysis (RDA) during the entire maize growth cycle. (a) seedling stage; (b) Three-leaf stage; (c) filling stage; (d) mature stage.


Table 1.
Effect of organic fertilizer application rate on soil nutrients. Units: mg/kg.
| Time | Group | pH | SOM | TN | AN | TP | AP | TK | AK |
|---|---|---|---|---|---|---|---|---|---|
| Seedling stage | CK | 7.78 ± 0.074a | 16 ± 2b | 0.94 ± 0.11b | 0.20 ± 0.01a | 0.91 ± 0.26b | 64.5 ± 9.9b | 13.05 ± 2.60b | 87.2 ± 44.4b |
| OF_2 | 7.65 ± 0.065ab | 32 ± 9a | 1.05 ± 0.10b | 0.20 ± 0.02a | 1.10 ± 0.13a | 80.2 ± 18.3ab | 16.00 ± 2.43b | 129.0 ± 4.3b | |
| OF_4 | 7.56 ± 0.037b | 37 ± 2a | 1.33 ± 0.07a | 0.20 ± 0.02a | 1.16 ± 0.11a | 96.7 ± 29.0a | 17.60 ± 1.15ab | 182.7 ± 44.3a | |
| OF_6 | 7.52 ± 0.037b | 38 ± 8a | 1.41 ± 0.09a | 0.17 ± 0.02a | 1.24 ± 0.13a | 101.3 ± 13.6a | 20.77 ± 3.65a | 195.3 ± 15.6a | |
| Three-leaf stage | CK | 7.99 ± 0.238a | 16 ± 2a | 0.96 ± 0.05c | 96.00 ± 41.82a | 1.17 ± 0.10a | 131.7 ± 25.5b | 17.67 ± 1.42ab | 120.9 ± 29.9c |
| OF_2 | 8.07 ± 0.065a | 19 ± 0ab | 1.20 ± 0.07bc | 62.67 ± 14.34a | 0.83 ± 0.37a | 171.3 ± 45.2ab | 16.37 ± 0.17ab | 179.3 ± 17.8c | |
| OF_4 | 7.90 ± 0.037ab | 24 ± 4a | 1.36 ± 0.19ab | 87.00 ± 4.55a | 1.00 ± 0.42a | 214.3 ± 85.5a | 16.77 ± 0.05a | 253.3 ± 26.3b | |
| OF_6 | 7.78 ± 0.037b | 29 ± 2a | 1.73 ± 0.18a | 69.33 ± 12.26a | 1.48 ± 0.14a | 270.0 ± 53.6a | 16.63 ± 2.16a | 315.7 ± 36.4a | |
| Filling stage | CK | 8.06 ± 0.014a | 17 ± 2b | 1.30 ± 0.08ab | 73.00 ± 24.54a | 1.16 ± 0.06a | 130.7 ± 7.8ab | 16.50 ± 1.28a | 116.8 ± 31.1c |
| OF_2 | 7.80 ± 0.025a | 17 ± 3b | 1.19 ± 0.03b | 53.67 ± 9.74a | 1.13 ± 0.08a | 104.0 ± 19.1b | 17.10 ± 1.30a | 167.7 ± 12.3c | |
| OF_4 | 7.54 ± 0.232b | 23 ± 2ab | 1.44 ± 0.14ab | 57.33 ± 4.03a | 1.23 ± 0.13a | 147.3 ± 43.3ab | 16.57 ± 2.82a | 189.7 ± 31.9b | |
| OF_6 | 7.64 ± 0.033b | 25 ± 3a | 1.67 ± 0.09a | 83.33 ± 4.11a | 1.37 ± 0.17a | 210.0 ± 52.7a | 12.87 ± 2.61a | 251.7 ± 9.0a | |
| Mature stage | CK | 8.21 ± 0.059a | 17 ± 1c | 1.27 ± 0.05c | 65.33 ± 2.62b | 1.12 ± 0.06b | 61.3 ± 5.7b | 8.37 ± 0.06a | 87.3 ± 4.0d |
| OF_2 | 8.01 ± 0.021b | 21 ± 1b | 1.17 ± 0.08c | 89.33 ± 14.38a | 1.19 ± 0.10b | 70.0 ± 10.4b | 8.21 ± 0.24a | 183.0 ± 4.1c | |
| OF_4 | 7.92 ± 0.049b | 25 ± 1a | 1.42 ± 0.10b | 77.67 ± 7.04ab | 1.27 ± 0.09b | 92.0 ± 18.5b | 6.92 ± 0.38a | 212.3 ± 17.6b | |
| OF_6 | 7.80 ± 0.059c | 27 ± 1a | 1.63 ± 0.07a | 92.33 ± 3.40a | 1.52 ± 0.17a | 136.0 ± 18.8a | 6.90 ± 0.30a | 273.0 ± 8.0a |
*a, b, c represents the significant difference between groups during the same stage (p < 0.05).
Table 2.
Effect of organic fertilizer application rate on soil heavy metal. Units: mg/kg.
| Stage | Group | Cd | Hg | As | Pb | Cr |
|---|---|---|---|---|---|---|
| Seedling stage | CK | 0.14 ± 0.02a | 0.089 ± 0.005b | 7.13 ± 0.99b | 34.3 ± 5.1a | 42 ± 6c |
| OF_2 | 0.15 ± 0.00a | 0.111 ± 0.007ab | 10.11 ± 1.03ab | 37.1 ± 4.0a | 52 ± 7b | |
| OF_4 | 0.15 ± 0.00a | 0.109 ± 0.011b | 12.73 ± 3.32a | 36.7 ± 5.1a | 61 ± 6a | |
| OF_6 | 0.16 ± 0.01a | 0.137 ± 0.018a | 12.41 ± 0.69a | 36.2 ± 3.6a | 51 ± 11ab | |
| Three-leaf stage | CK | 0.12 ± 0.01a | 0.097 ± 0.006a | 5.29 ± 0.50a | 33.0 ± 8.3a | 78 ± 7a |
| OF_2 | 0.13 ± 0.00a | 0.101 ± 0.018a | 5.00 ± 0.08a | 32.8 ± 3.0a | 64 ± 5a | |
| OF_4 | 0.12 ± 0.01a | 0.104 ± 0.014a | 4.77 ± 0.52a | 33.7 ± 1.7a | 68 ± 11a | |
| OF_6 | 0.11 ± 0.04a | 0.119 ± 0.033a | 4.29 ± 0.10a | 23.9 ± 8.0a | 65 ± 9a | |
| Filling stage | CK | 0.14 ± 0.00a | 0.068 ± 0.011b | 8.59 ± 0.09a | 34.5 ± 2.2a | 52 ± 3a |
| OF_2 | 0.12 ± 0.00ab | 0.105 ± 0.012ab | 7.75 ± 0.24ab | 32.7 ± 2.7a | 23 ± 4b | |
| OF_4 | 0.08 ± 0.01b | 0.138 ± 0.027a | 6.85 ± 0.82b | 27.5 ± 8.3a | 25 ± 11b | |
| OF_6 | 0.10 ± 0.04ab | 0.152 ± 0.027a | 8.03 ± 0.72ab | 29.6 ± 5.3a | 42 ± 8a | |
| Mature stage | CK | 0.11 ± 0.01a | 0.077 ± 0.002b | 8.06 ± 0.10b | 26.9 ± 0.6a | 36 ± 4a |
| OF_2 | 0.14 ± 0.01a | 0.113 ± 0.004a | 8.89 ± 0.47ab | 24.9 ± 0.6a | 45 ± 6a | |
| OF_4 | 0.16 ± 0.01a | 0.140 ± 0.020a | 9.26 ± 0.51a | 24.8 ± 0.3a | 42 ± 8a | |
| OF_6 | 0.16 ± 0.03a | 0.123 ± 0.003a | 9.25 ± 0.39a | 24.9 ± 0.9a | 49 ± 2a |
*a, b, c represent the significant difference between groups during the same stage (p < 0.05).
Table 3.
Shannon index and Ace index of soil bacteria.
| Biodiversity Index | Growth Stage | CK | OF_2 | OF_4 | OF_6 |
|---|---|---|---|---|---|
| Shannon-wiener Index | Seedling stage | 6.8834 ± 0.1708a | 6.7949 ± 0.1653a | 6.8714 ± 0.0704a | 6.8443 ± 0.2595a |
| Three-leaf stage | 6.9041 ± 0.1727a | 6.9553 ± 0.0614a | 6.8343 ± 0.1597a | 6.8282 ± 0.1598a | |
| Filling stage | 6.7044 ± 0.1043a | 6.7042 ± 0.2088a | 6.8142 ± 0.0996a | 6.6102 ± 2.4029a | |
| Mature stage | 6.7641 ± 0.2794a | 6.8824 ± 0.1223a | 6.9137 ± 0.0630a | 6.8474 ± 0.1585a | |
| Ace Index | Seedling stage | 5689.60 ± 171.70a | 5192.00 ± 335.81b | 5494.70 ± 505.90ab | 5668.60 ± 340.41a |
| Three-leaf stage | 5224.80 ± 125.18a | 4859.10 ± 178.83b | 4883.50 ± 292.51b | 5140.00 ± 526.68a | |
| Filling stage | 4365.90 ± 301.31a | 4273.30 ± 396.61a | 4403.8 ± 408.54a | 4489.00 ± 1890.00a | |
| Mature stage | 4788.80 ± 452.24a | 4538.30 ± 257.23b | 4513.5 ± 331.62ab | 4721.3 ± 346.83a |
*a, b represents the significant difference between groups during the same stage (p < 0.05).
Publisher’s Note: MDPI stays neutral with regard to jurisdictional claims in published maps and institutional affiliations. |
© 2021 by the authors. Licensee MDPI, Basel, Switzerland. This article is an open access article distributed under the terms and conditions of the Creative Commons Attribution (CC BY) license (http://creativecommons.org/licenses/by/4.0/).
Share and Cite
MDPI and ACS Style
Wu, J.; Sha, C.; Wang, M.; Ye, C.; Li, P.; Huang, S. Effect of Organic Fertilizer on Soil Bacteria in Maize Fields. Land 2021, 10, 328. https://0-doi-org.brum.beds.ac.uk/10.3390/land10030328
AMA Style
Wu J, Sha C, Wang M, Ye C, Li P, Huang S. Effect of Organic Fertilizer on Soil Bacteria in Maize Fields. Land. 2021; 10(3):328. https://0-doi-org.brum.beds.ac.uk/10.3390/land10030328
Chicago/Turabian StyleWu, Jianqiang, Chenyan Sha, Min Wang, Chunmei Ye, Peng Li, and Shenfa Huang. 2021. "Effect of Organic Fertilizer on Soil Bacteria in Maize Fields" Land 10, no. 3: 328. https://0-doi-org.brum.beds.ac.uk/10.3390/land10030328
Note that from the first issue of 2016, this journal uses article numbers instead of page numbers. See further details here.