
Landscape Pattern Evolution and Its Response to Human Disturbance in a Newly Metropolitan Area: A Case Study in Jin-Yi Metropolitan Area


Abstract
:1. Introduction
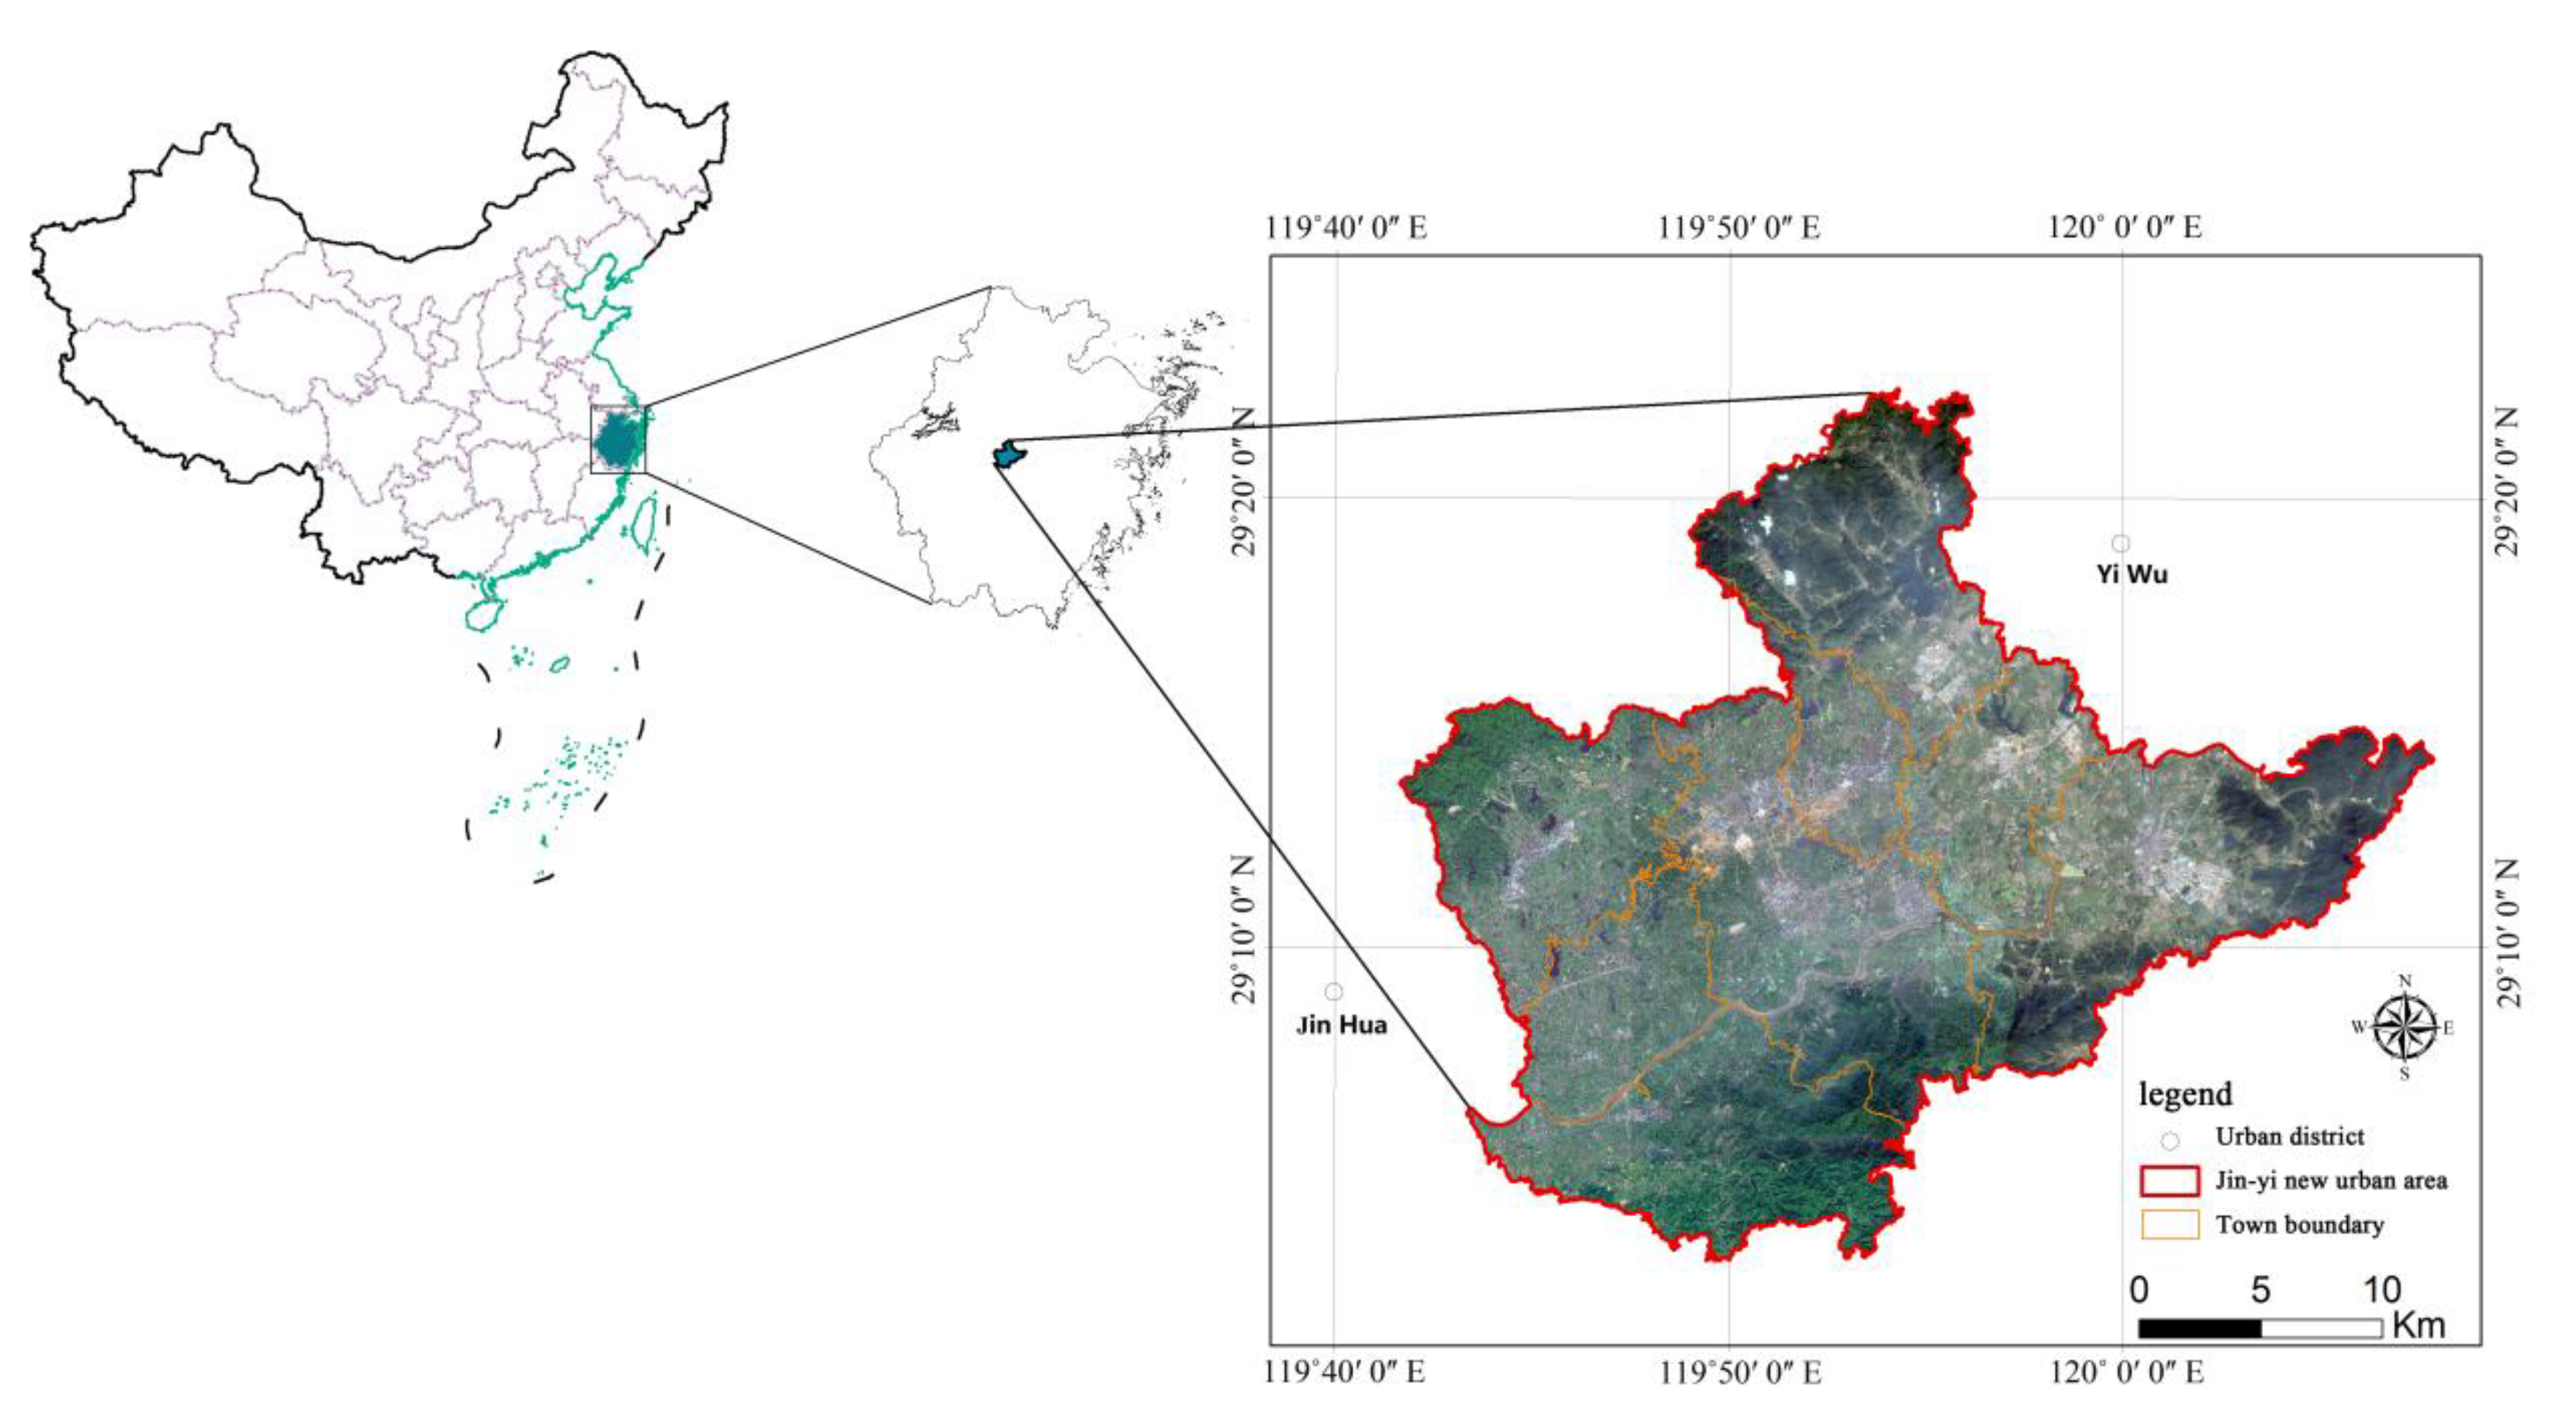
2. Research Area
3. Methods
3.1. Data Sources
3.2. Landscape Pattern Index
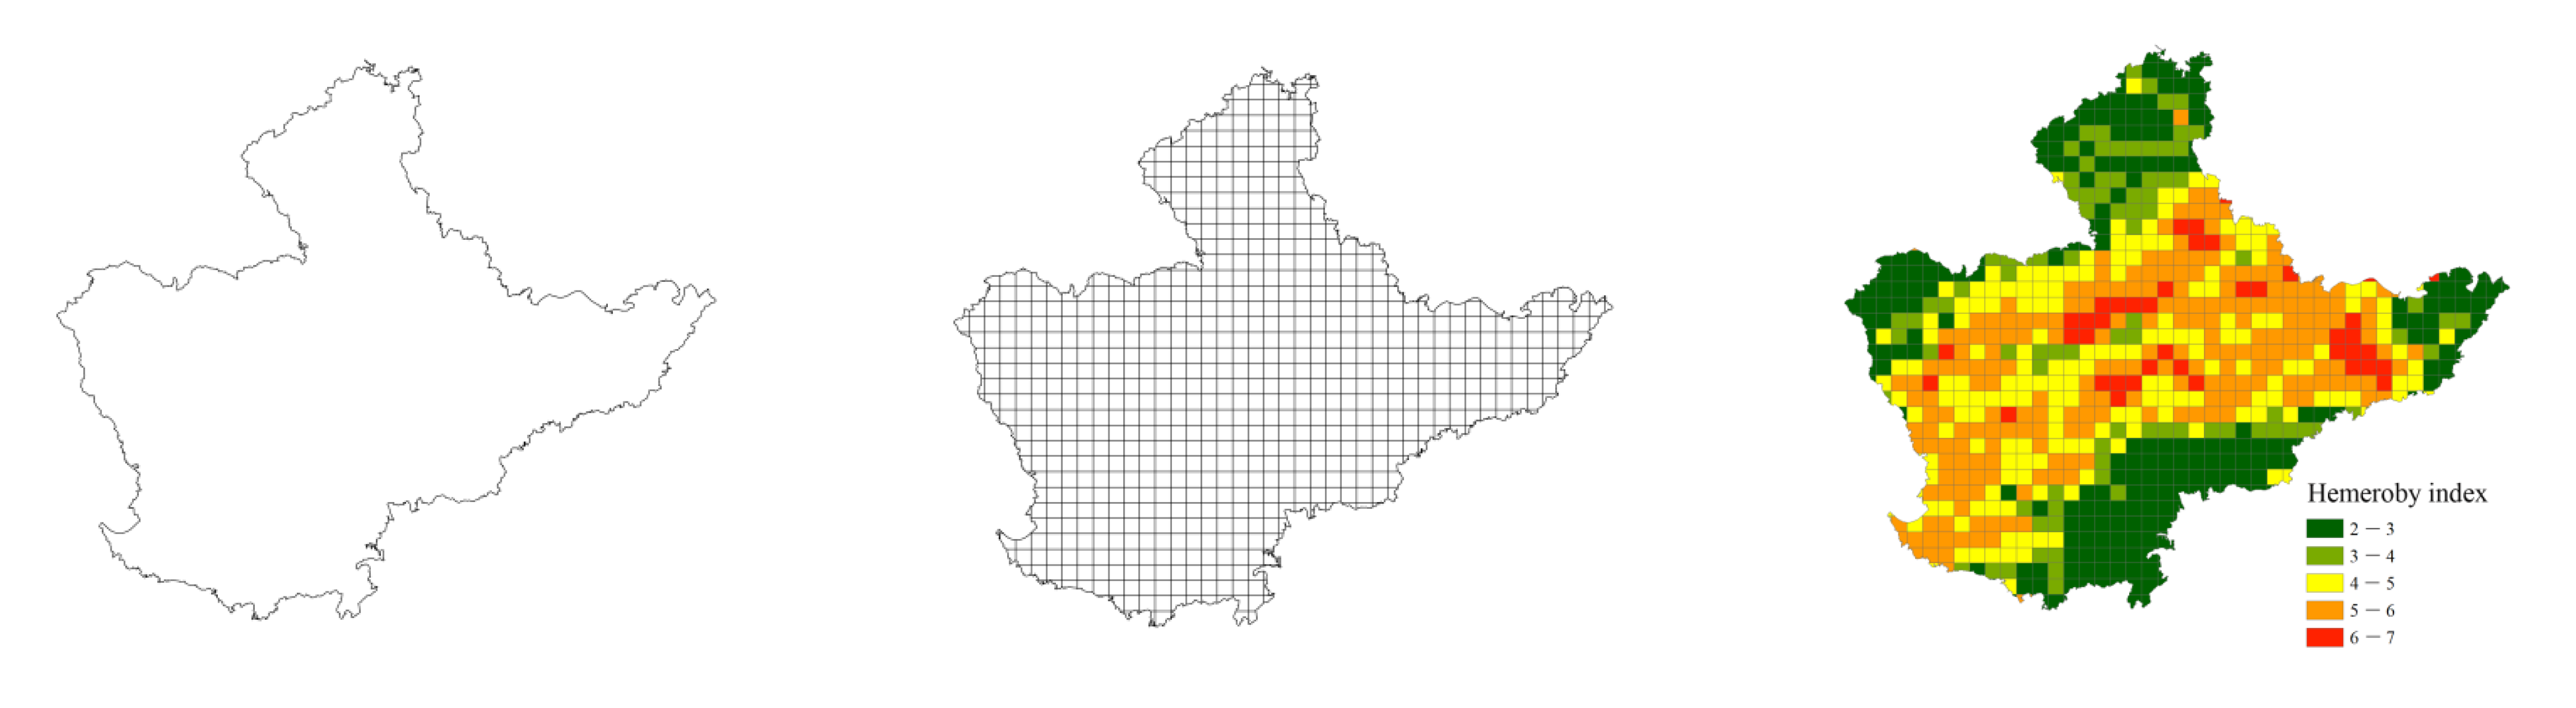
3.3. Calculation and Classification of Hemeroby
4. Results and Analysis
4.1. Analysis of Temporal and Spatial Variation of HI
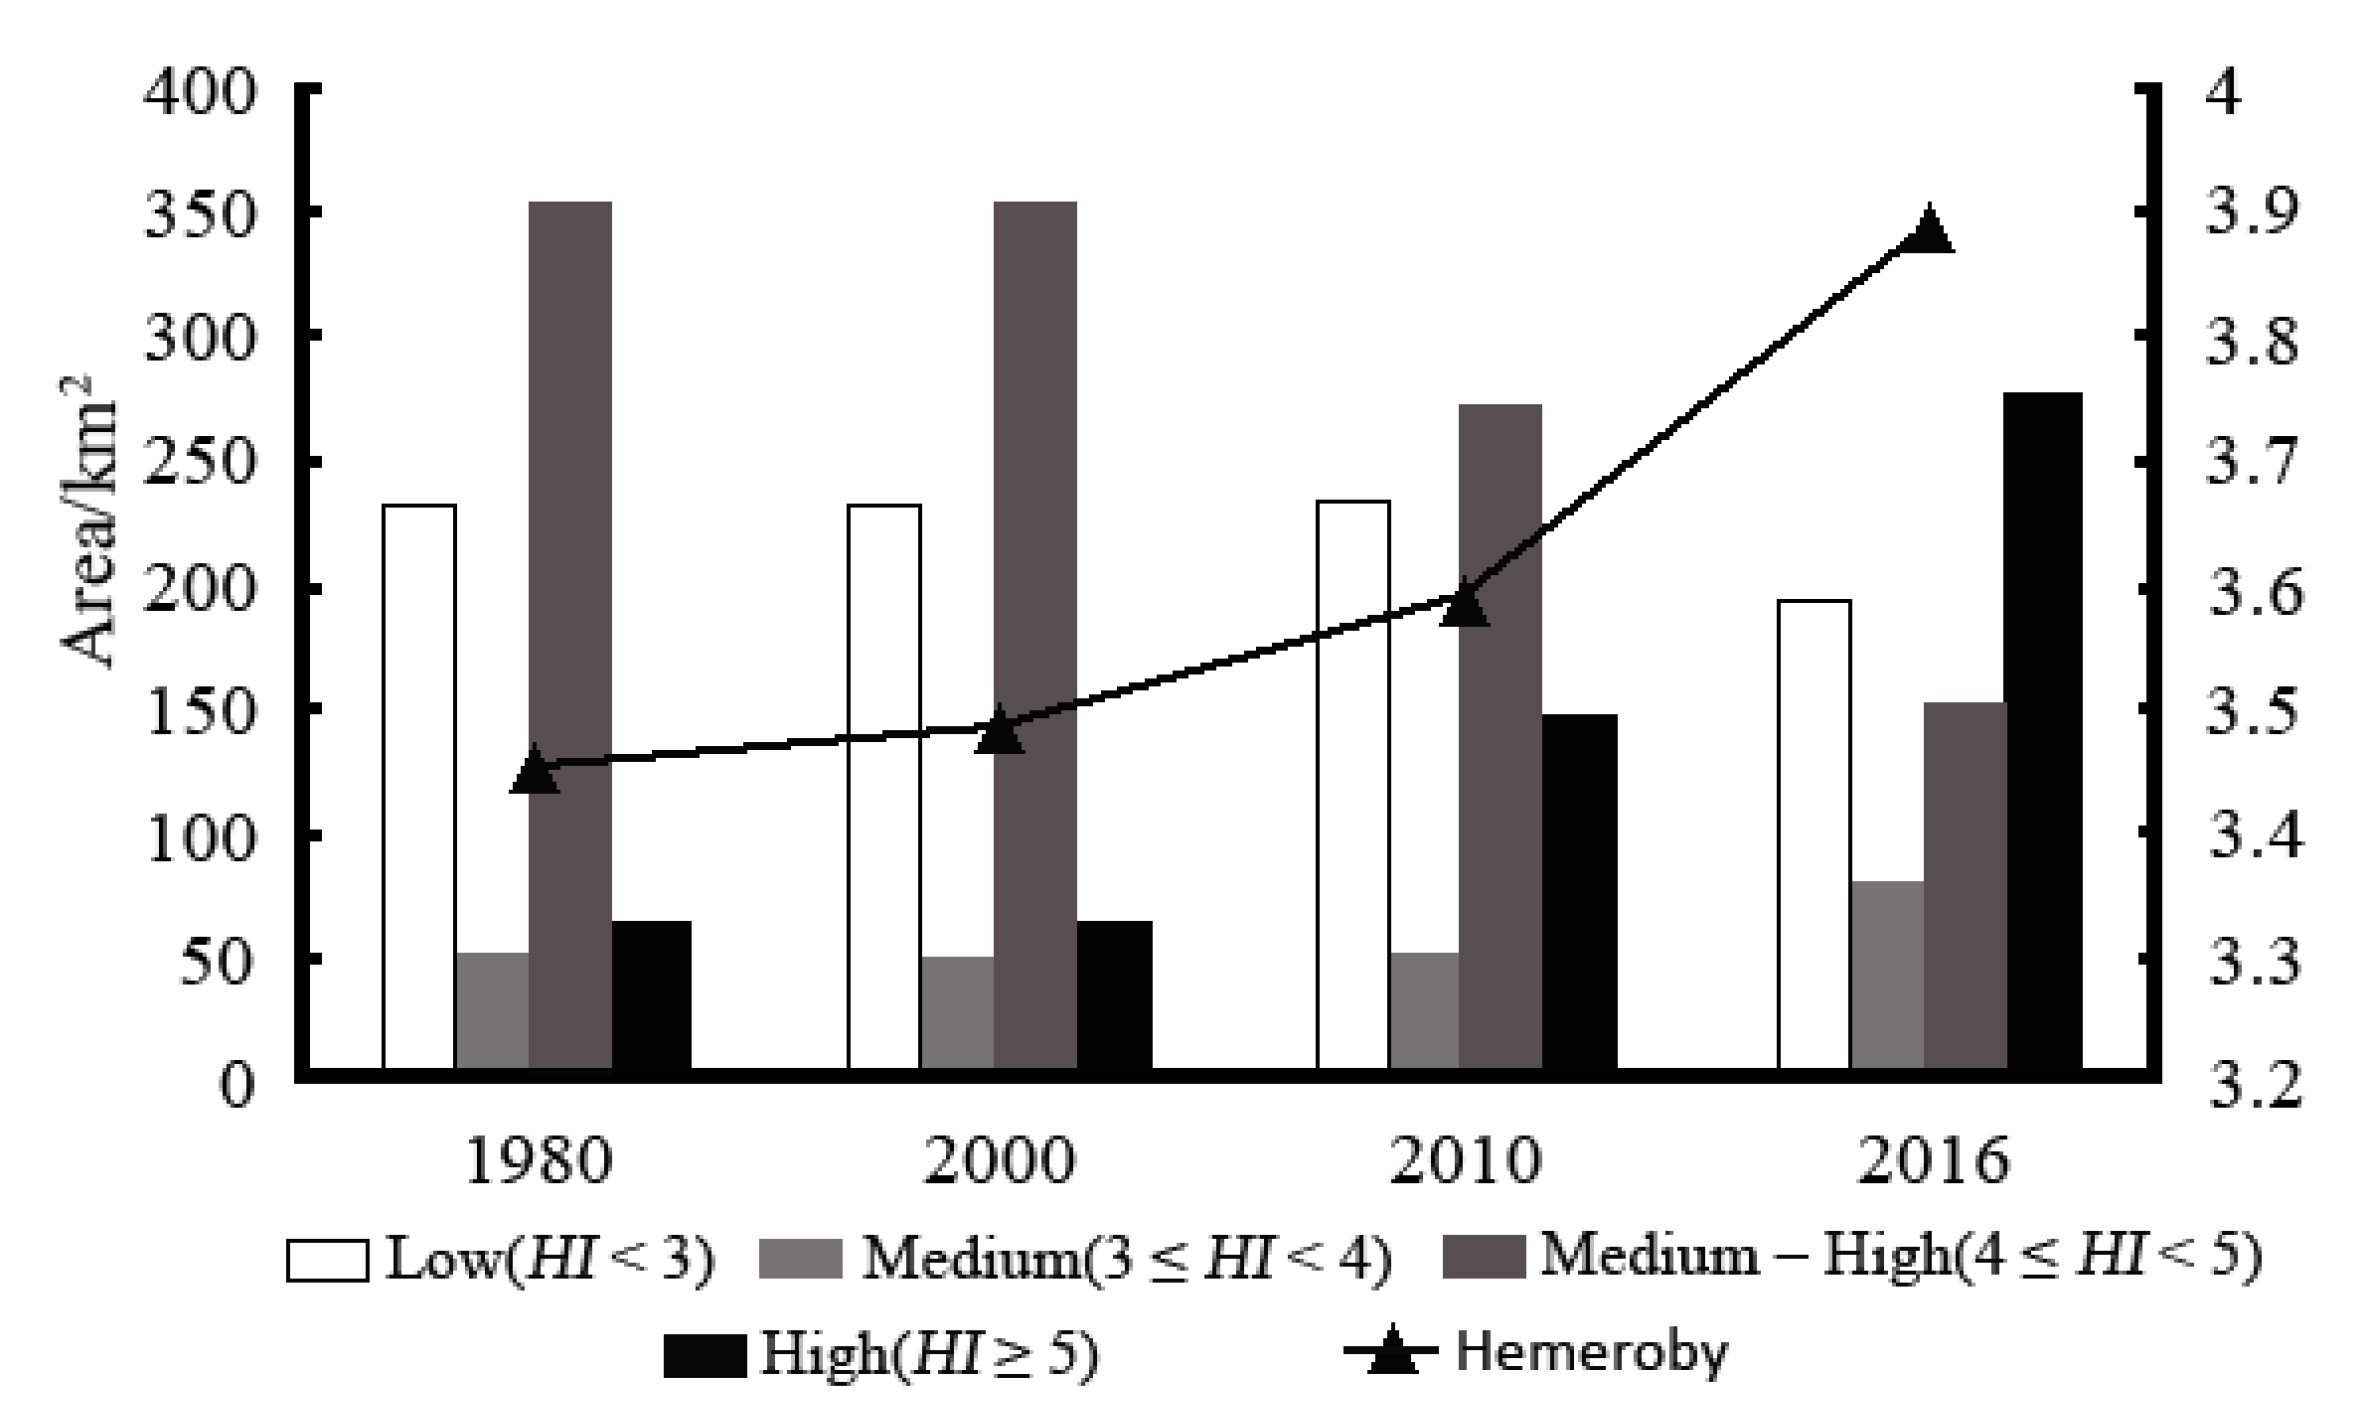
4.1.1. Temporal Variation of HI
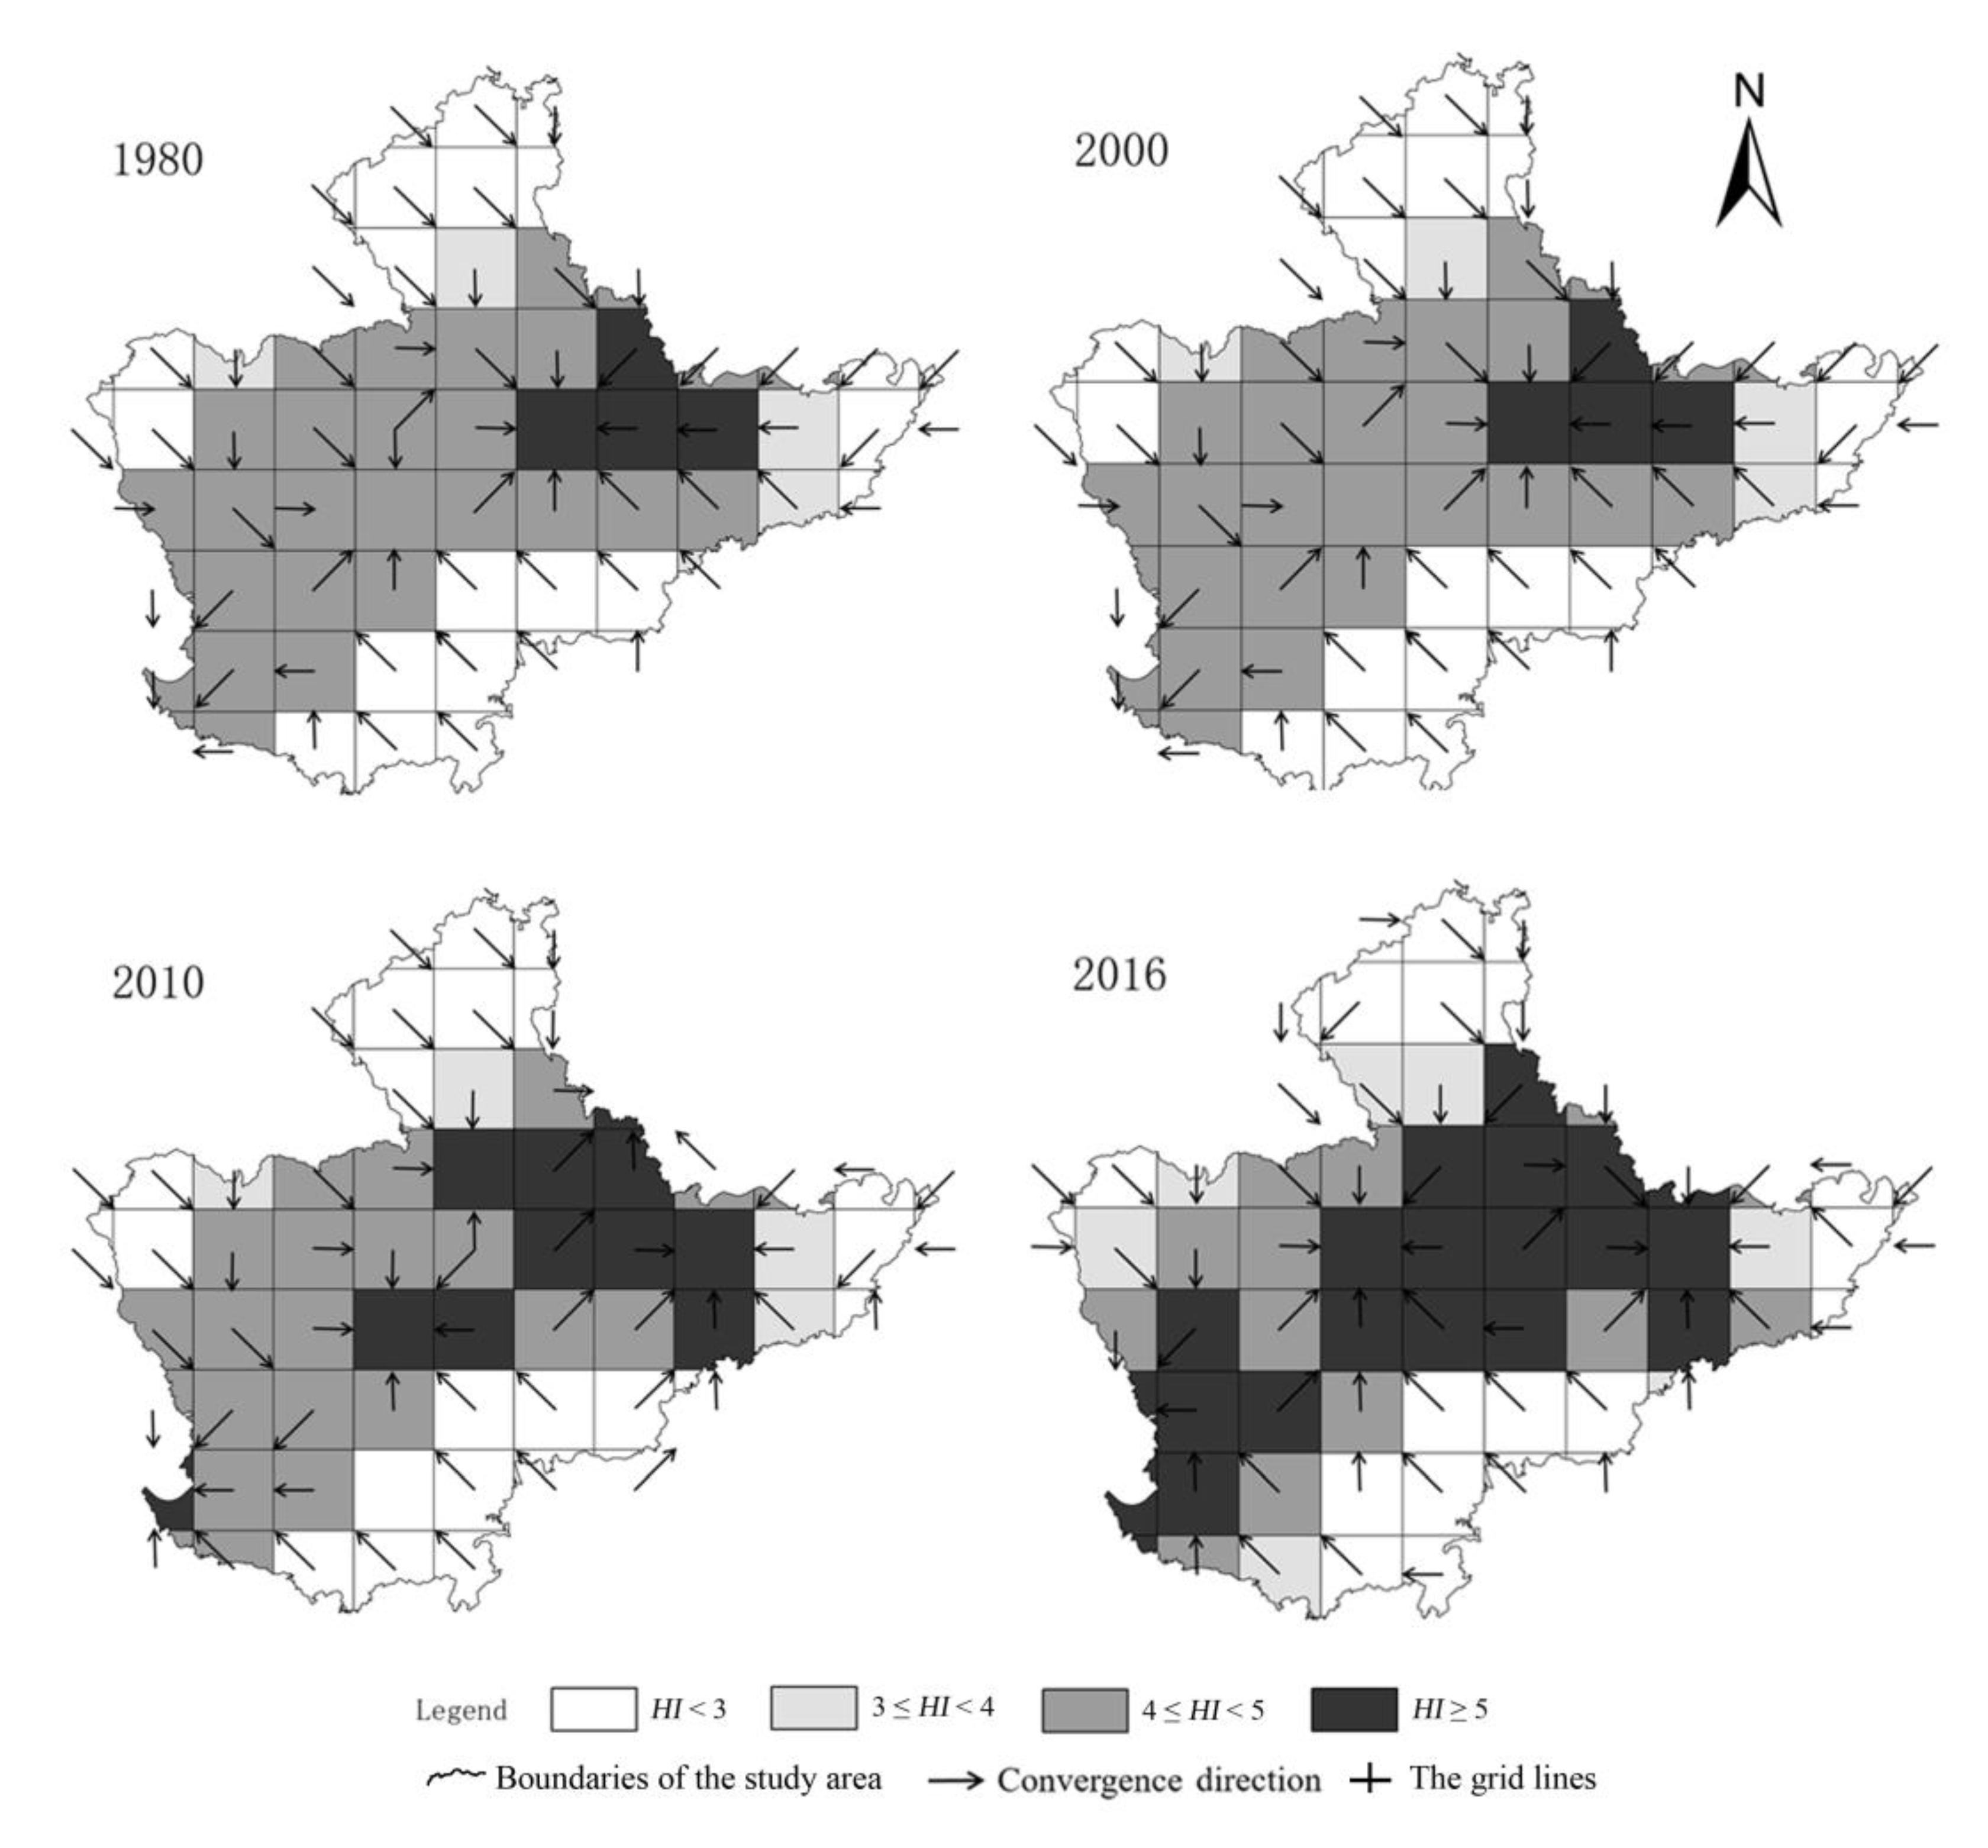
4.1.2. Temporal Variation of HI
4.2. Landscape Pattern Change
4.3. Correlation Analysis of Landscape Pattern Index and HI
4.3.1. Relationship between Square Pixel Index (SQP) and HI
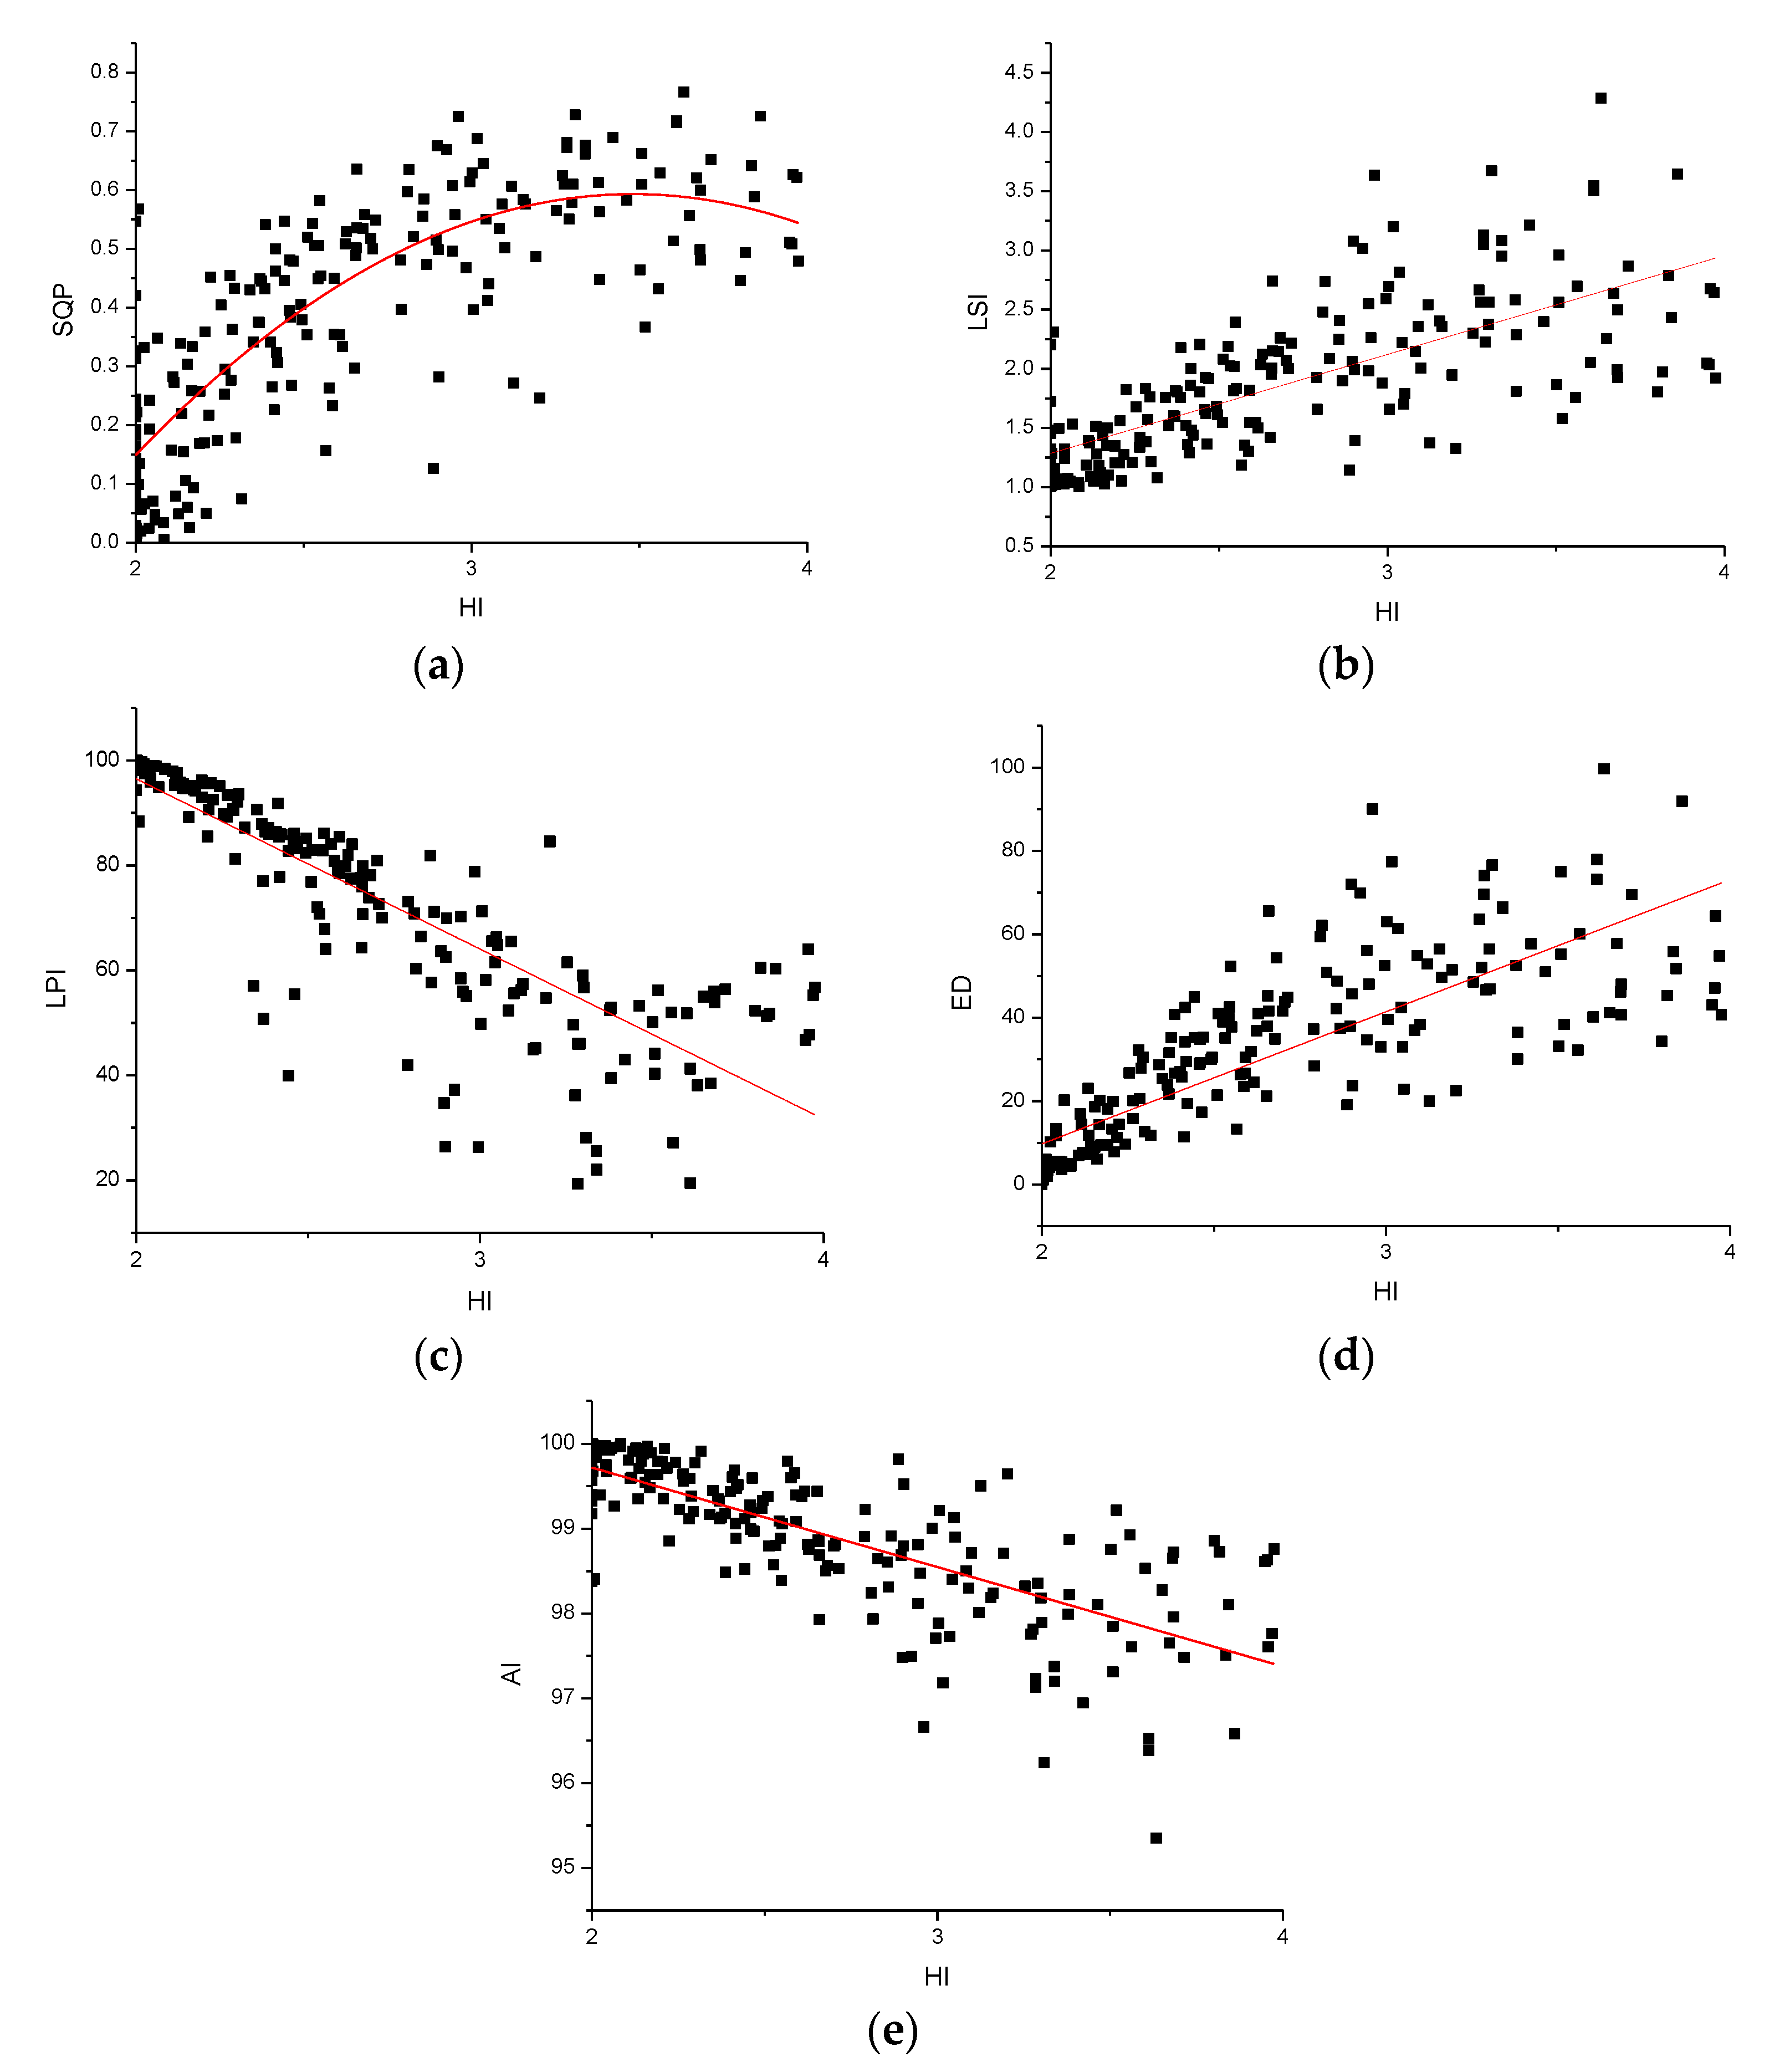
4.3.2. Correlation Analysis of Landscape Pattern Index and HI Based on Landscape Level
4.3.3. Correlation Analysis of Landscape Pattern Index and HI Based on Patch Level
5. Discussions
6. Conclusions
- (1)
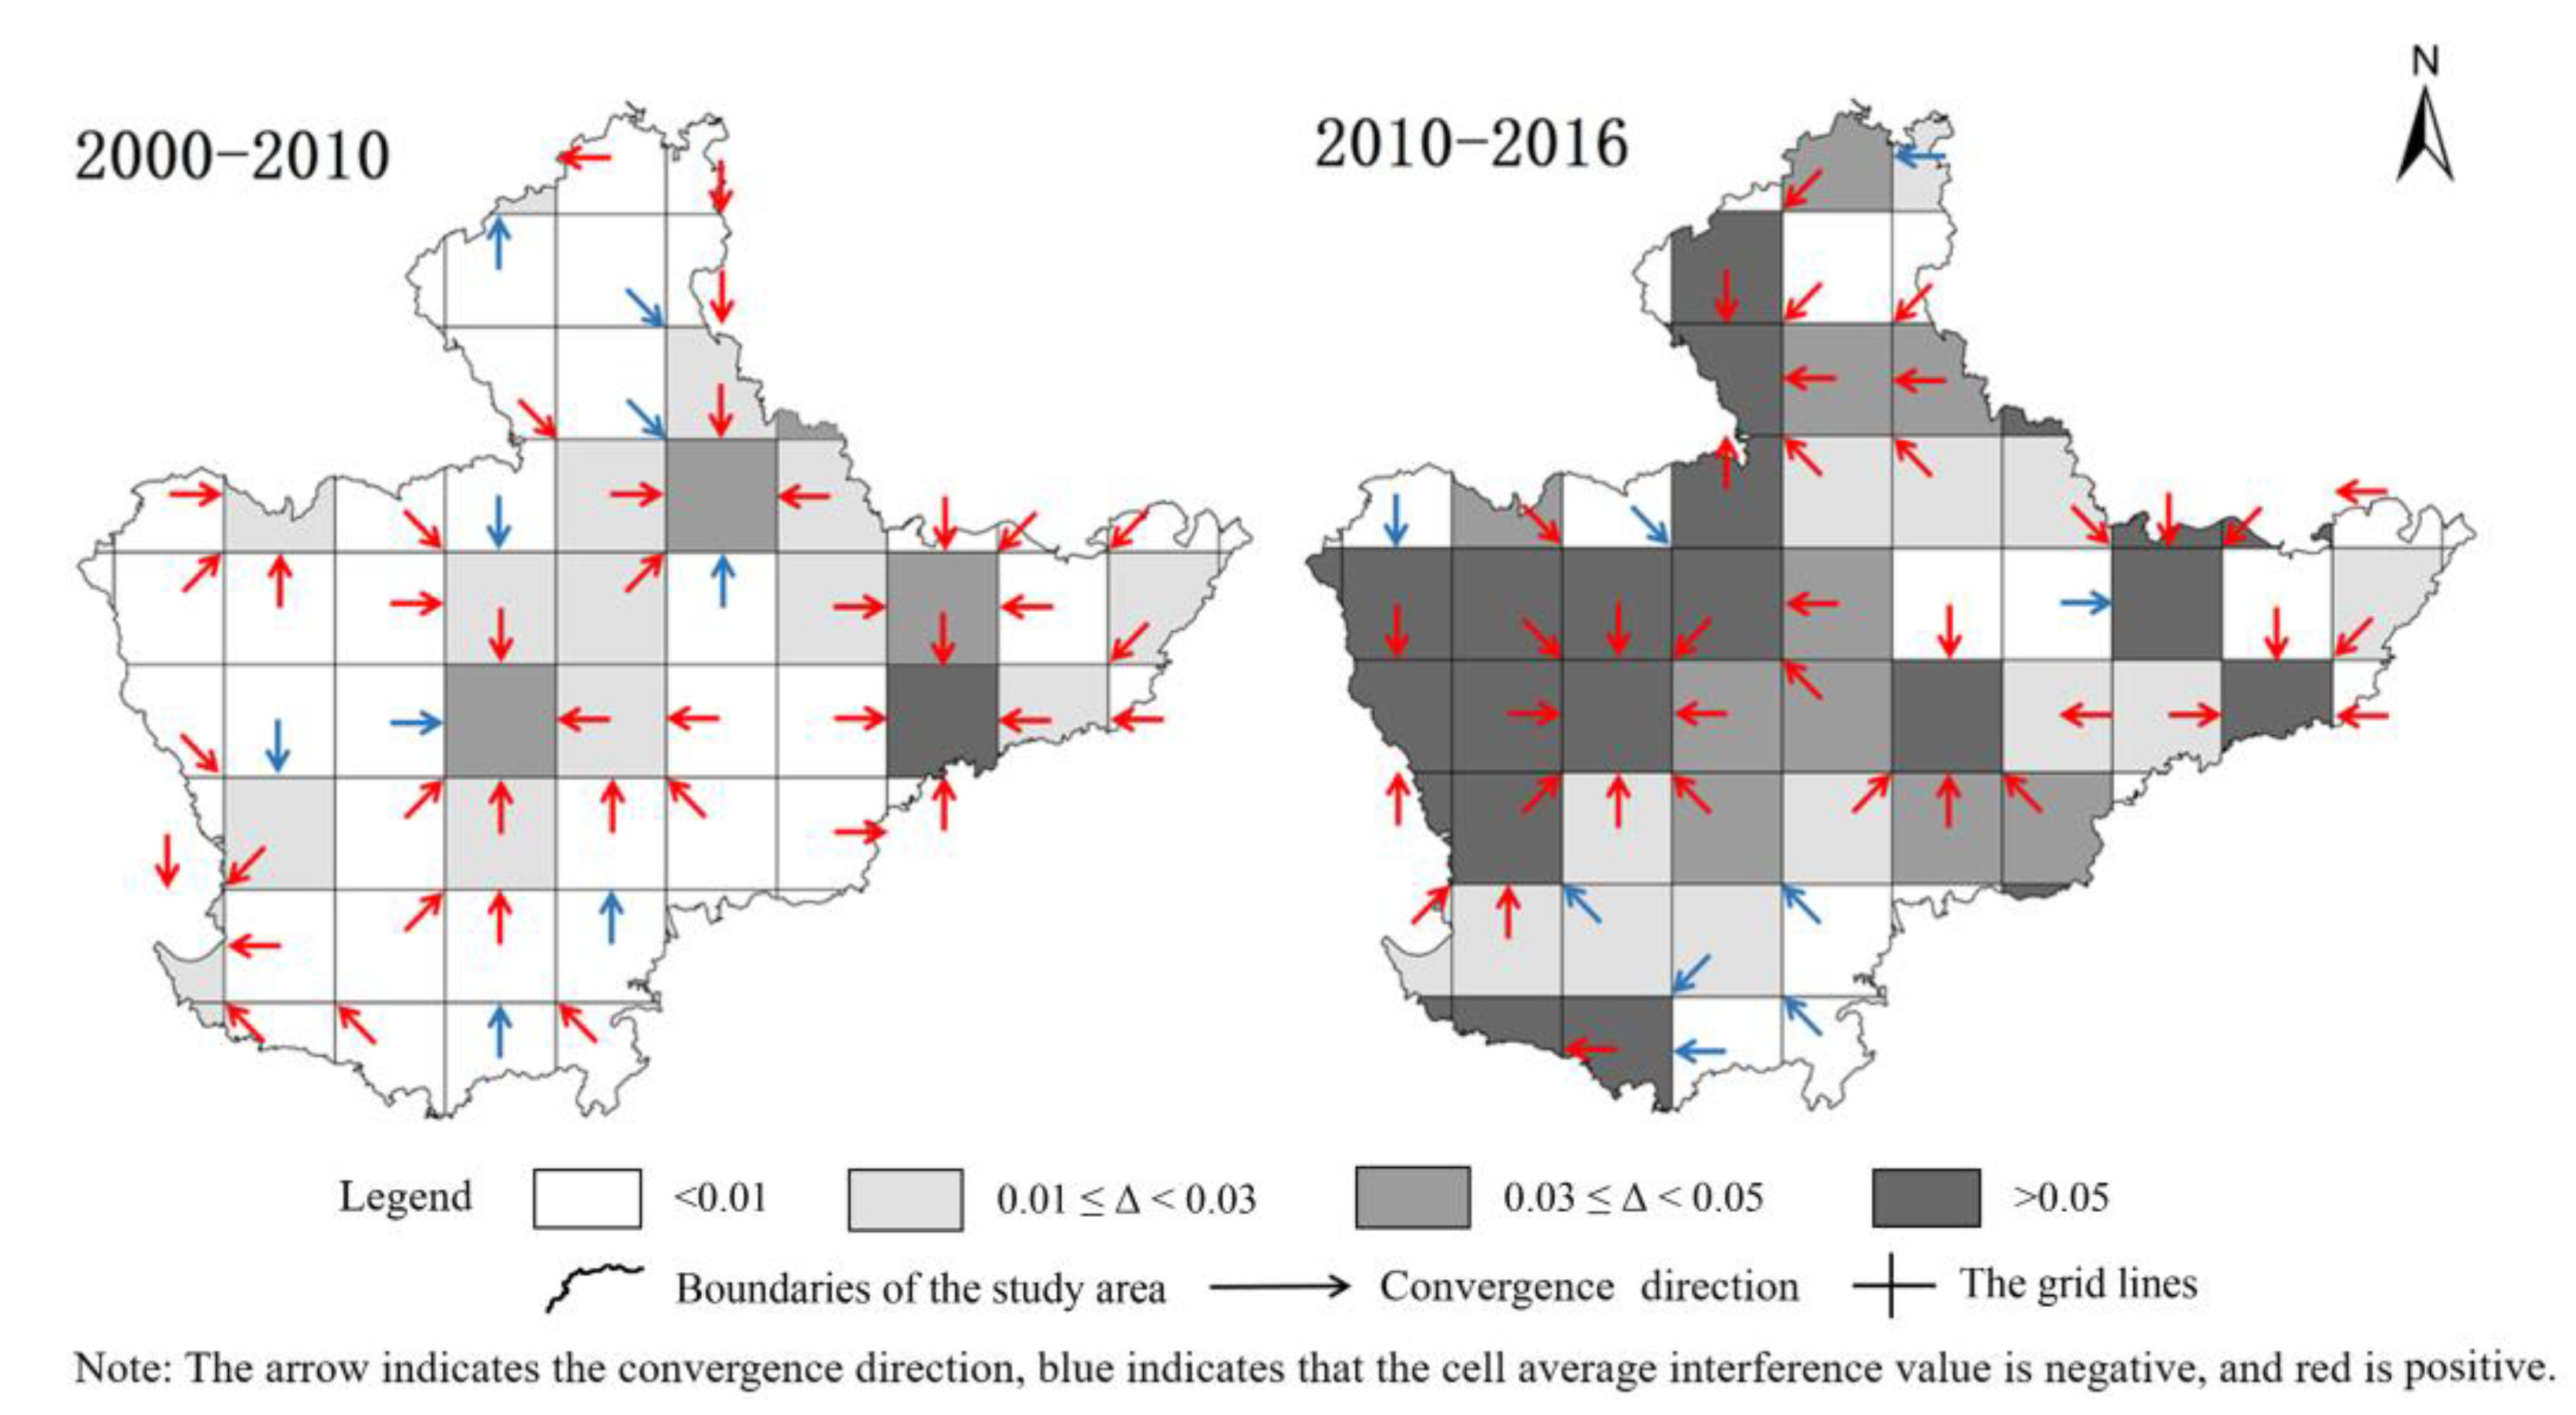
- The degree of human disturbance in the new area shows an upward trend, with a small increase from 1980 to 2010 and a significant increase after 2010. During 2010–2016, the annual average intensity of human disturbance increased significantly, the high value center of human activities in the east of the new area gradually moved to the west, while the southwest and the convergence point in Xiaoshun town gradually moved to the north, forming a trend of human activity intensity diffusion between Yiwu and Jinhua.
- (2)
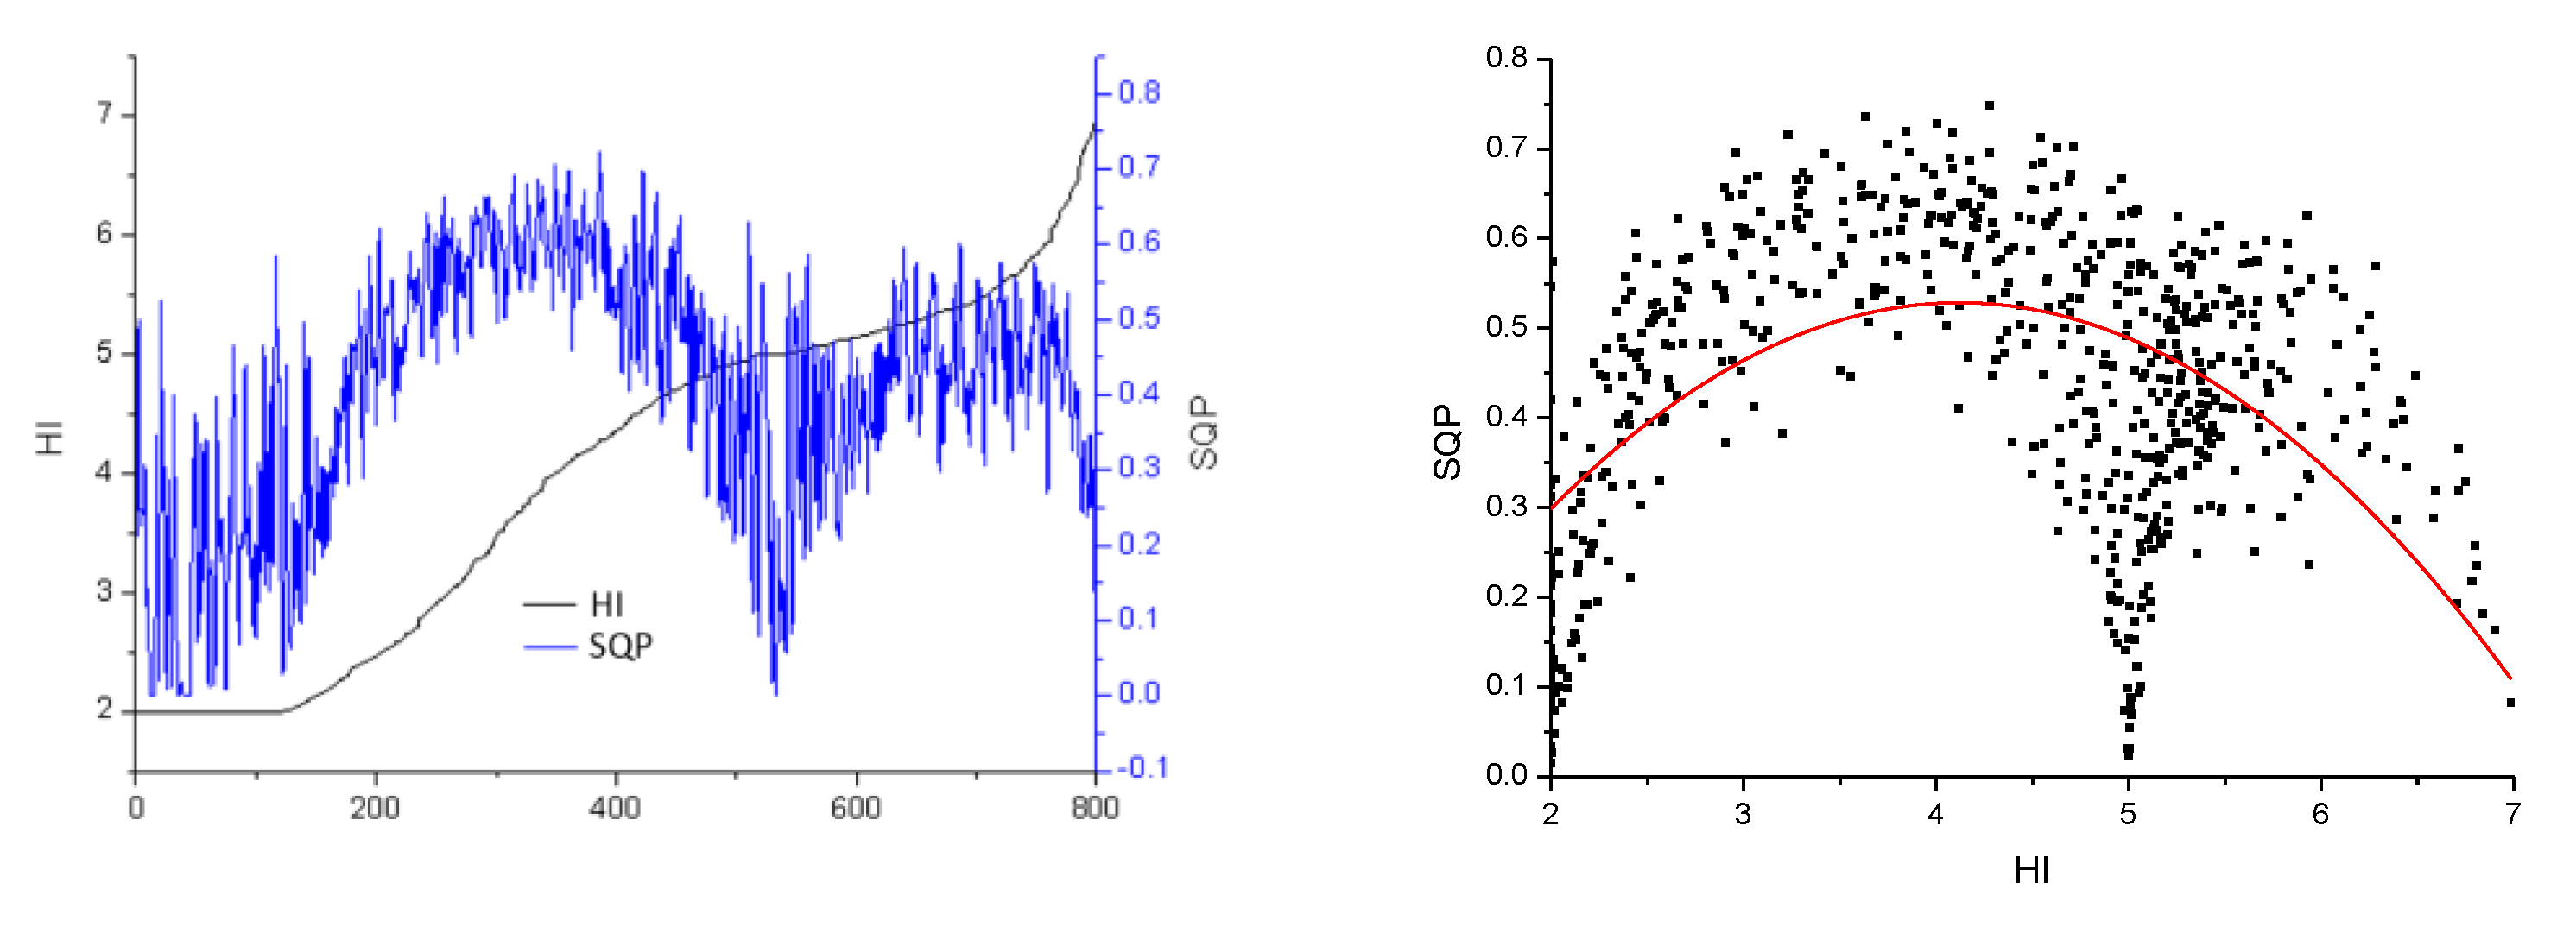
- There is a significant correlation between landscape morphology index and HI. Generally, with the continuous increase of the intensity of human activities, the surface morphology experiences the process of breaking, complicating and homogenizing first, that is, a simple (single)–complex–simple (single) development and change process. In the process of increasing human disturbance, there are obvious inflexion points in landscape pattern index. The trends of landscape pattern index changes on both sides of inflexion point are opposite.
- (3)
- There is a low disturbance stage and a high disturbance stage between human disturbance degree and landscape pattern index. There are obvious differences in the change trends of the two stages. There is a simple and obvious linear relationship in the low interference stage, and the relationship changes are complex in the high interference stage, but the linear relationship is not obvious.
Author Contributions
Funding
Institutional Review Board Statement
Informed Consent Statement
Data Availability Statement
Conflicts of Interest
References
- Heurtebise, J.Y. Sustainability and ecological civilization in the age of Anthropocene: An epistemological analysis of the psychosocial and “culturalist” interpretations of global environmental risks. Sustainability 2017, 9, 1331. [Google Scholar] [CrossRef] [Green Version]
- Xu, L.H.; Li, J.L.; Li, W.F. Progress in Impact of Human Activities on Coastal Resource and Environment. J. Nanjing Norm. Univ. 2014, 37, 124–131. [Google Scholar]
- Zeng, H.; Sui, D.Z.; Wu, B. Human disturbances on landscapes in protected areas: A case study of the Wolong Nature Reserve. Ecol. Res. 2005, 20, 487–496. [Google Scholar] [CrossRef]
- Peter, K.; Sean, W.; Robert, M.; Tim, B. Domesticated nature: Shaping landscapes and ecosystems for human welfare. Science 2007, 316, 1866–1869. [Google Scholar]
- Geri, F.; Amici, V.; Rocchini, D. Human activity impact on the heterogeneity of Mediterranean landscape. Appl. Geogr. 2010, 30, 370–379. [Google Scholar] [CrossRef]
- Whitmee, S.; Haines, A.; Beyrer, C. Safeguarding human health in the Anthropocene epoch: Report of The Rockefeller Foundation-Lancet Commission on planetary health. Lancet 2015, 386, 1973–2028. [Google Scholar] [CrossRef]
- Xie, X.F.; Wu, T.; Zhu, M.; Jiang, J.J.; Xu, Y.; Wang, X.H.; Pu, L.J. Comparison of random forest and multiple linear regression models for estimation of soil extracellular enzyme activities in agricultural reclaimed coastal saline land. Ecol. Indic. 2021, 120, 106925. [Google Scholar] [CrossRef]
- Pimm, S.L.; Lawton, J.H. Planning for biodiversity. Science 1998, 279, 2068–2069. [Google Scholar] [CrossRef] [Green Version]
- Sinha, R.K.; Sharma, A. Landscape level disturbance gradient analysis in daltonganj south forest division. J. Indian Soc. Remote Sens. 2006, 34, 233–243. [Google Scholar] [CrossRef]
- Xie, X.F.; Pu, L.J.; Zhu, M.; Meadows, M.; Sun, L.C.; Wu, T.; Bu, X.G.; Xu, Y. Differential effects of various reclamation treatments on soil characteristics: An experimental study of newly reclaimed tidal mudflats on the east China coast. Sci. Total Environ. 2021, 768, 144996. [Google Scholar] [CrossRef] [PubMed]
- Ning, J.; Liu, J.Y.; Zhao, G.S. Spatio-temporal characteristics of disturbance of landuse change on major ecosystem function zones in China. Chin. Geogr. Sci. 2015, 25, 523–536. [Google Scholar] [CrossRef]
- Li, H.L.; Peng, J.; Liu, Y.X.; Hu, Y.N. Urbanization impact on landscape patterns in Beijing City, China: A spatial heterogeneity perspective. Ecol. Indic. 2017, 82, 50–60. [Google Scholar] [CrossRef]
- Wu, T.; Zhao, D.Z.; Zhang, F.S.; Wei, B.Q. Changes of wetland landscape pattern in Dayang River Estuary based on high-resolution remote sensing image. Chin. J. Appl. Ecol. 2011, 22, 1833–1840. [Google Scholar]
- Beynen, P.V.; Townsend, K. A disturbance index for Karst environments. Environ. Manag. 2005, 36, 101–116. [Google Scholar] [CrossRef] [PubMed]
- Wang, L.Z.; Wehrly, K.; Breck, J.E.; Krafe, L.S. Landscape-based assessment of human disturbance for Michigan lakes. Environ. Manag. 2010, 46, 471–483. [Google Scholar] [CrossRef] [PubMed] [Green Version]
- Walz, U.; Stein, C. Indicators of hemeroby for the monitoring of landscapes in Germany. J. Nat. Conserv. 2014, 22, 279–289. [Google Scholar] [CrossRef]
- Roth, D.; Moreno-Sanchez, R.; Torres-Rojo, J.M.; Moreno-Sanchez, F. Estimation of human induced disturbance of the environment associated with 2002, 2008 and 2013 land use/cover patterns in Mexico. Appl. Geogr. 2016, 66, 22–34. [Google Scholar] [CrossRef]
- Xiao, D.N.; Li, X.Z. Landscape Ecology; Science Press: Beijing, China, 2010. [Google Scholar]
- Achard, F.; Malingreau, J.P. Determination of deforestation rates of the world’s humid tropical forests. Science 2002, 297, 999–1002. [Google Scholar] [CrossRef] [Green Version]
- Li, Y.Y.; Zhou, L.P.; Cui, H.T. Pollen indicators of human activity. Chin. Sci. Bull. 2008, 53, 91–102. [Google Scholar] [CrossRef] [Green Version]
- Grizzetti, B.; Lanzanova, D.; Liquete, C.; Reynaud, A.; Cardoso, A.C. Assessing water ecosystem services for water resource management. Environ. Sci. Policy 2016, 61, 194–203. [Google Scholar] [CrossRef]
- Caplat, P.; Lepart, J.; Marty, P. Landscape patterns and agriculture: Modeling the long–term effects of human practices on Pinus sylvestris spatial dynamics (Causse Mejean, France). Landsc. Ecol. 2006, 21, 657–670. [Google Scholar] [CrossRef]
- Tasser, E.; Sternbach, E.; Taaeinei, U. Biodiversity indicators for sustainability monitoring at municipality level: An example of implementation in an alpine region. Ecol. Indic. 2008, 8, 204–223. [Google Scholar] [CrossRef]
- Günlü, A.; Kadioğullari, A.I.; Keleş, S.; Başkent, E.Z. Spatiotemporal changes of landscape pattern in response to deforestation in Northeastern Turkey: A case study in Rize. Environ. Monit. Assess. 2009, 148, 127–137. [Google Scholar] [CrossRef]
- Sun, Y.G.; Zhao, D.Z.; Wu, T.; Wei, B.Q.; Gao, S.G.; Li, Y.; Cao, F.F. Temporal and spatial dynamic changes and landscape pattern response of Hemeroby in Dayang estuary of Liaoning Province, China. Acta Ecol. Sin. 2012, 32, 3645–3655. [Google Scholar]
- Huang, Y.X.; Yin, X.Q.; Ye, G.F.; Lin, J.M.; Huang, R.; Wang, N.; Wang, L.; Sun, Y. Spatio-temporal variation of landscape heterogeneity under influence of human activities in Xiamen City of China in recent decade. Chin. Geogr. Sci. 2013, 23, 227–236. [Google Scholar] [CrossRef]
- Brown, M.T.; Vivas, M.B. Landscape development intensity index. Environ. Monit. Assess. 2005, 101, 289–309. [Google Scholar] [CrossRef]
- Jalas, J. Hemerobe and hemerochore pflanzenarten. Einterminologischer reformversuch. Acta Soc. Pro. Fauna Flora Fenn. 1955, 72, 1–15. [Google Scholar]
- Li, M.; Norbert, K.; Yang, J. Hemeroby: A method to assess the naturalness of vegetation. Prog. Geogr. 2002, 21, 450–458. [Google Scholar]
- Liu, X.N.; Zhang, W.W.; Li, H. Research on Dynamics of Human Disturbance in Upper Streams of Miyun Reservoir Watershed Based on Land Use and Land Cover Change. J. Ecol. Rural Environ. 2016, 32, 951–957. [Google Scholar]
- Xiao, C.; Xie, X.F.; Wu, T. Dynamic changes of landscape pattern and hemeroby in Ximen Island wetland, Zhejiang Province, China. Chin. J. Appl. Ecol. 2014, 25, 3255–3262. [Google Scholar]
- Liu, F.Q.; Wu, T.; Jiang, G.J. Dynamic response of the coastline and coastal landscape patterns to Hemeroby: A case study along the south coast of Yingkou. Acta Ecol. Sin. 2017, 37, 7427–7437. [Google Scholar]
- Liu, Y.C.; Li, J.L.; Yuan, Q.X. Comparative research on the impact of human activities on changes in coastline and landscape in bay areas: A case study with Xiangshangang Bay, China and Tampa Bay, USA. Acta Geogr. Sin. 2016, 71, 86–103. [Google Scholar]
- Ian, S.E.; Derek, T.R.; Rebecca, C.R. A methodology for relating wetland configuration to human disturbance in Alberta. Landsc. Ecol. 2017, 32, 2059–2076. [Google Scholar]
- Gottero, E.; Cassatella, C. Landscape indicators for rural development policies. Application of a core set in the case study of Piedmont Region. Environ. Impact Assess. 2017, 65, 75–85. [Google Scholar] [CrossRef]
- Assumma, V.; Bottero, M.; Monaco, R. Landscape economic attractiveness: An integrated methodology for exploring the rural landscapes in Piedmont (Italy). Land 2019, 8, 105. [Google Scholar] [CrossRef] [Green Version]
- Wang, X.; Blanchet, F.G.; Koper, N. Measuring habitat fragmentation: An evaluation of landscape pattern metrics. Methods Ecol. Evol. 2014, 5, 634–646. [Google Scholar] [CrossRef]
- Szilassi, P.; Bata, T.; Szabo, S. The link between landscape pattern and vegetation naturalness on a regional scale. Ecol. Indic. 2017, 81, 252–259. [Google Scholar] [CrossRef] [Green Version]
- Fu, B.J.; Chen, M. Principles and Applications of Landscape Ecology; Science Press: Beijing, China, 2011. [Google Scholar]
- Sukopp, H. Dynamik und konstanz in der flora der bundesrepublik deutschland. Schr. Veg. 1976, 10, 9–26. [Google Scholar]
- Rüdisser, J.T.E.A. Distance to nature–A new biodiversity relevant environmental indicator set at the landscape level. Ecol. Indic. 2012, 15, 208–216. [Google Scholar] [CrossRef]
- Attiwill, P.M. The disturbance of forest ecosystems: The ecological basis for conservative management. For. Ecol. Manag. 1994, 63, 247–300. [Google Scholar] [CrossRef]
- Zhou, Y.K.; Ning, L.X.; Bai, X.L. Spatial and temporal changes of human disturbances and their effects on landscape patterns in the Jiangsu coastal zone, China. Ecol. Indic. 2018, 93, 111–122. [Google Scholar] [CrossRef]
- Zang, Z. The Bidirectional Coupling Relationship between Coastal Wetland Ecosystem and Regional Welfare: A Case Study in Yancheng; Nanjing University: Nanjing, China, 2018. [Google Scholar]
- Guo, S.Z.; Bai, H.Y.; Meng, Q. Landscape pattern changes of woodland and grassland and its driving forces in Qinling Mountains. Acta Ecol. Sin. 2020, 40, 130–140. [Google Scholar]
- Guo, S.Z.; Bai, H.Y.; Meng, Q. Landscape pattern change and its response to anthropogenic disturbance in the Qinling Mountains during 1980 to 2015. Chin. J. Appl. Ecol. 2018, 29, 4080–4088. [Google Scholar]
- Kang, M.Y. Urban Landscape Ecology and Environment; China Metrology Publishing House: Beijing, China, 1997. [Google Scholar]
- Meng, L.; Sun, Y.; Zhao, S. Comparing the spatial and temporal dynamics of urban expansion in Guangzhou and Shenzhen from 1975 to 2015: A case study of pioneer cities in China’s rapid urbanization. Land Use Policy 2020, 97, 104–753. [Google Scholar] [CrossRef]
- Fan, J. Frontier approach of the sustainable process and pattern of human-environment system. Acta Geogr. Sin. 2014, 69, 1060–1068. [Google Scholar]
- Li, Y.; Tang, Q. Review for the methodologies on man-land relationship and man-land areal system in China. Geogr. Res. 2018, 37, 1655–1670. [Google Scholar]


| Time | Data Type | Precision | Data Source |
|---|---|---|---|
| 1980–1882 | Land-Cover Types | 1:100,000 | Topographic map (1980) |
| 30 m | Landsat4-TM (1982) | ||
| 2000 | Land-Cover Types | 30 m | Landsat7-TM |
| 2010 | Land-Cover Types | 30 m | Landsat7-TM |
| 2016 | Land-Cover Types | 30 m | Landsat8-OLI |
| Degree of Hemeroby | CLC-Code and CLC-Class of the DLM-DE | Hemeroby Index (HI) | |
|---|---|---|---|
| 1. Ahemerobic—Almost no human impact | 332 Bare rocks | 1 | |
| 335 Glaciers and perpetual snow | 1 | ||
| 2. Oligohemerobic—Weak human impact | 311 Broad-leaved forest | 421 Salt marshes | 2 |
| 312 Coniferous forest (PNV) | 423 Intertidal flats | 2 | |
| 313 Mixed forest (PNV) | 521 Coastal lagoons | 2 | |
| 331 Beaches, dunes, sands | 522 Estuaries | 2 | |
| 411 Inland marshes | 523 Sea and ocean | 2 | |
| 412 Peat bogs | 2 | ||
| 3. Mesohemerobic—Moderate human impact | 312 Coniferous forest (not PNV) | 324 Transitional woodland-shrub | 3 |
| 313 Mixed forest (not PNV) | 333 Sparsely vegetated areas | 3 | |
| 321 Natural grasslands | 334 Burnt areas | 3 | |
| 322 Moors and heathland | 3 | ||
| 4. β-Euhemerobic—Moderate-strong human impact | 141 Green urban areas | 511 Water courses | 4 |
| 231 Pastures | 512 Water bodies | 4 | |
| 243 Land principally occupied by agriculture, with significant areas of natural vegetation | 4 | ||
| 5. α-Euhemerobic—Strong human impact | 142 Sport and leisure facilities | 211 Non-irrigated arable land | 5 |
| 221 Vineyards | 242 Complex cultivation patterns | 5 | |
| 222 Fruit trees and berry plantations | 5 | ||
| 6. Polyhemerobic—Very strong human impact | 112 Discontinuous urban fabric | 133 Construction sites | 6 |
| 131 Mineral extraction sites | 6 | ||
| 132 Dump sites | 6 | ||
| 7. Metahemerobic—Excessively strong human impacts–Biocoenosis destroyed | 111 Continuous urban fabric | 123 Port areas | 7 |
| 121 Industrial or commercial units | 124 Airports | 7 | |
| 122 Road and rail networks and associated land | 7 | ||
| Year | 1980 | 2000 | 2010 | 2016 | |
|---|---|---|---|---|---|
| Index | |||||
| PD | 1.115 | 1.612 | 1.719 | 1.409 | |
| SQP | 0.952 | 0.952 | 0.962 | 0.960 | |
| LPI | 40.435 | 40.322 | 33.608 | 34.628 | |
| ED | 26.992 | 26.977 | 35.250 | 33.773 | |
| CONTAG | 72.411 | 72.198 | 66.624 | 65.946 | |
| SHDI | 0.953 | 0.962 | 1.140 | 1.170 | |
| LSI | 20.687 | 20.676 | 26.136 | 25.163 | |
| AI | 95.828 | 95.831 | 94.600 | 94.826 | |
| AREA_MN | 98.849 | 98.015 | 64.706 | 72.507 | |
| FRAC_MN | 1.066 | 1.066 | 1.070 | 1.082 | |
| Hemeroby Index | Landscape Index | Fitting Equation | R-Square | |
|---|---|---|---|---|
| HI (1 ≤ HI < 4) | Landscape level | SQP | −0.2121 + 0.2368x | 0.630 ** |
| ED | −60.1083 + 35.3676x | 0.695 ** | ||
| LSI | −0.2299 + 0.8047x | 0.649 ** | ||
| LPI | 161.4853 − 32.608x | 0.794 ** | ||
| SHDI | −3.0661 + 2.1115x − 0.2764x2 | 0.853 ** | ||
| SHEI | −3.5843 + 2.5599x − 0.3696x2 | 0.868 ** | ||
| CONTAG | 289.665 − 136.845x + 19.6021x2 | 0.812 ** | ||
| patch type level | LSI | −0.3865 + 0.8360x | 0.542 ** | |
| AI | 102.0647 − 1.1726x | 0.579 ** | ||
| ED | −53.6422 + 31.6924x | 0.647 ** | ||
| SQP | −1.8602 + 1.4093x − 0.2024x2 | 0.655 ** | ||
| LPI | 161.3244 − 32.4197x | 0.735 ** | ||
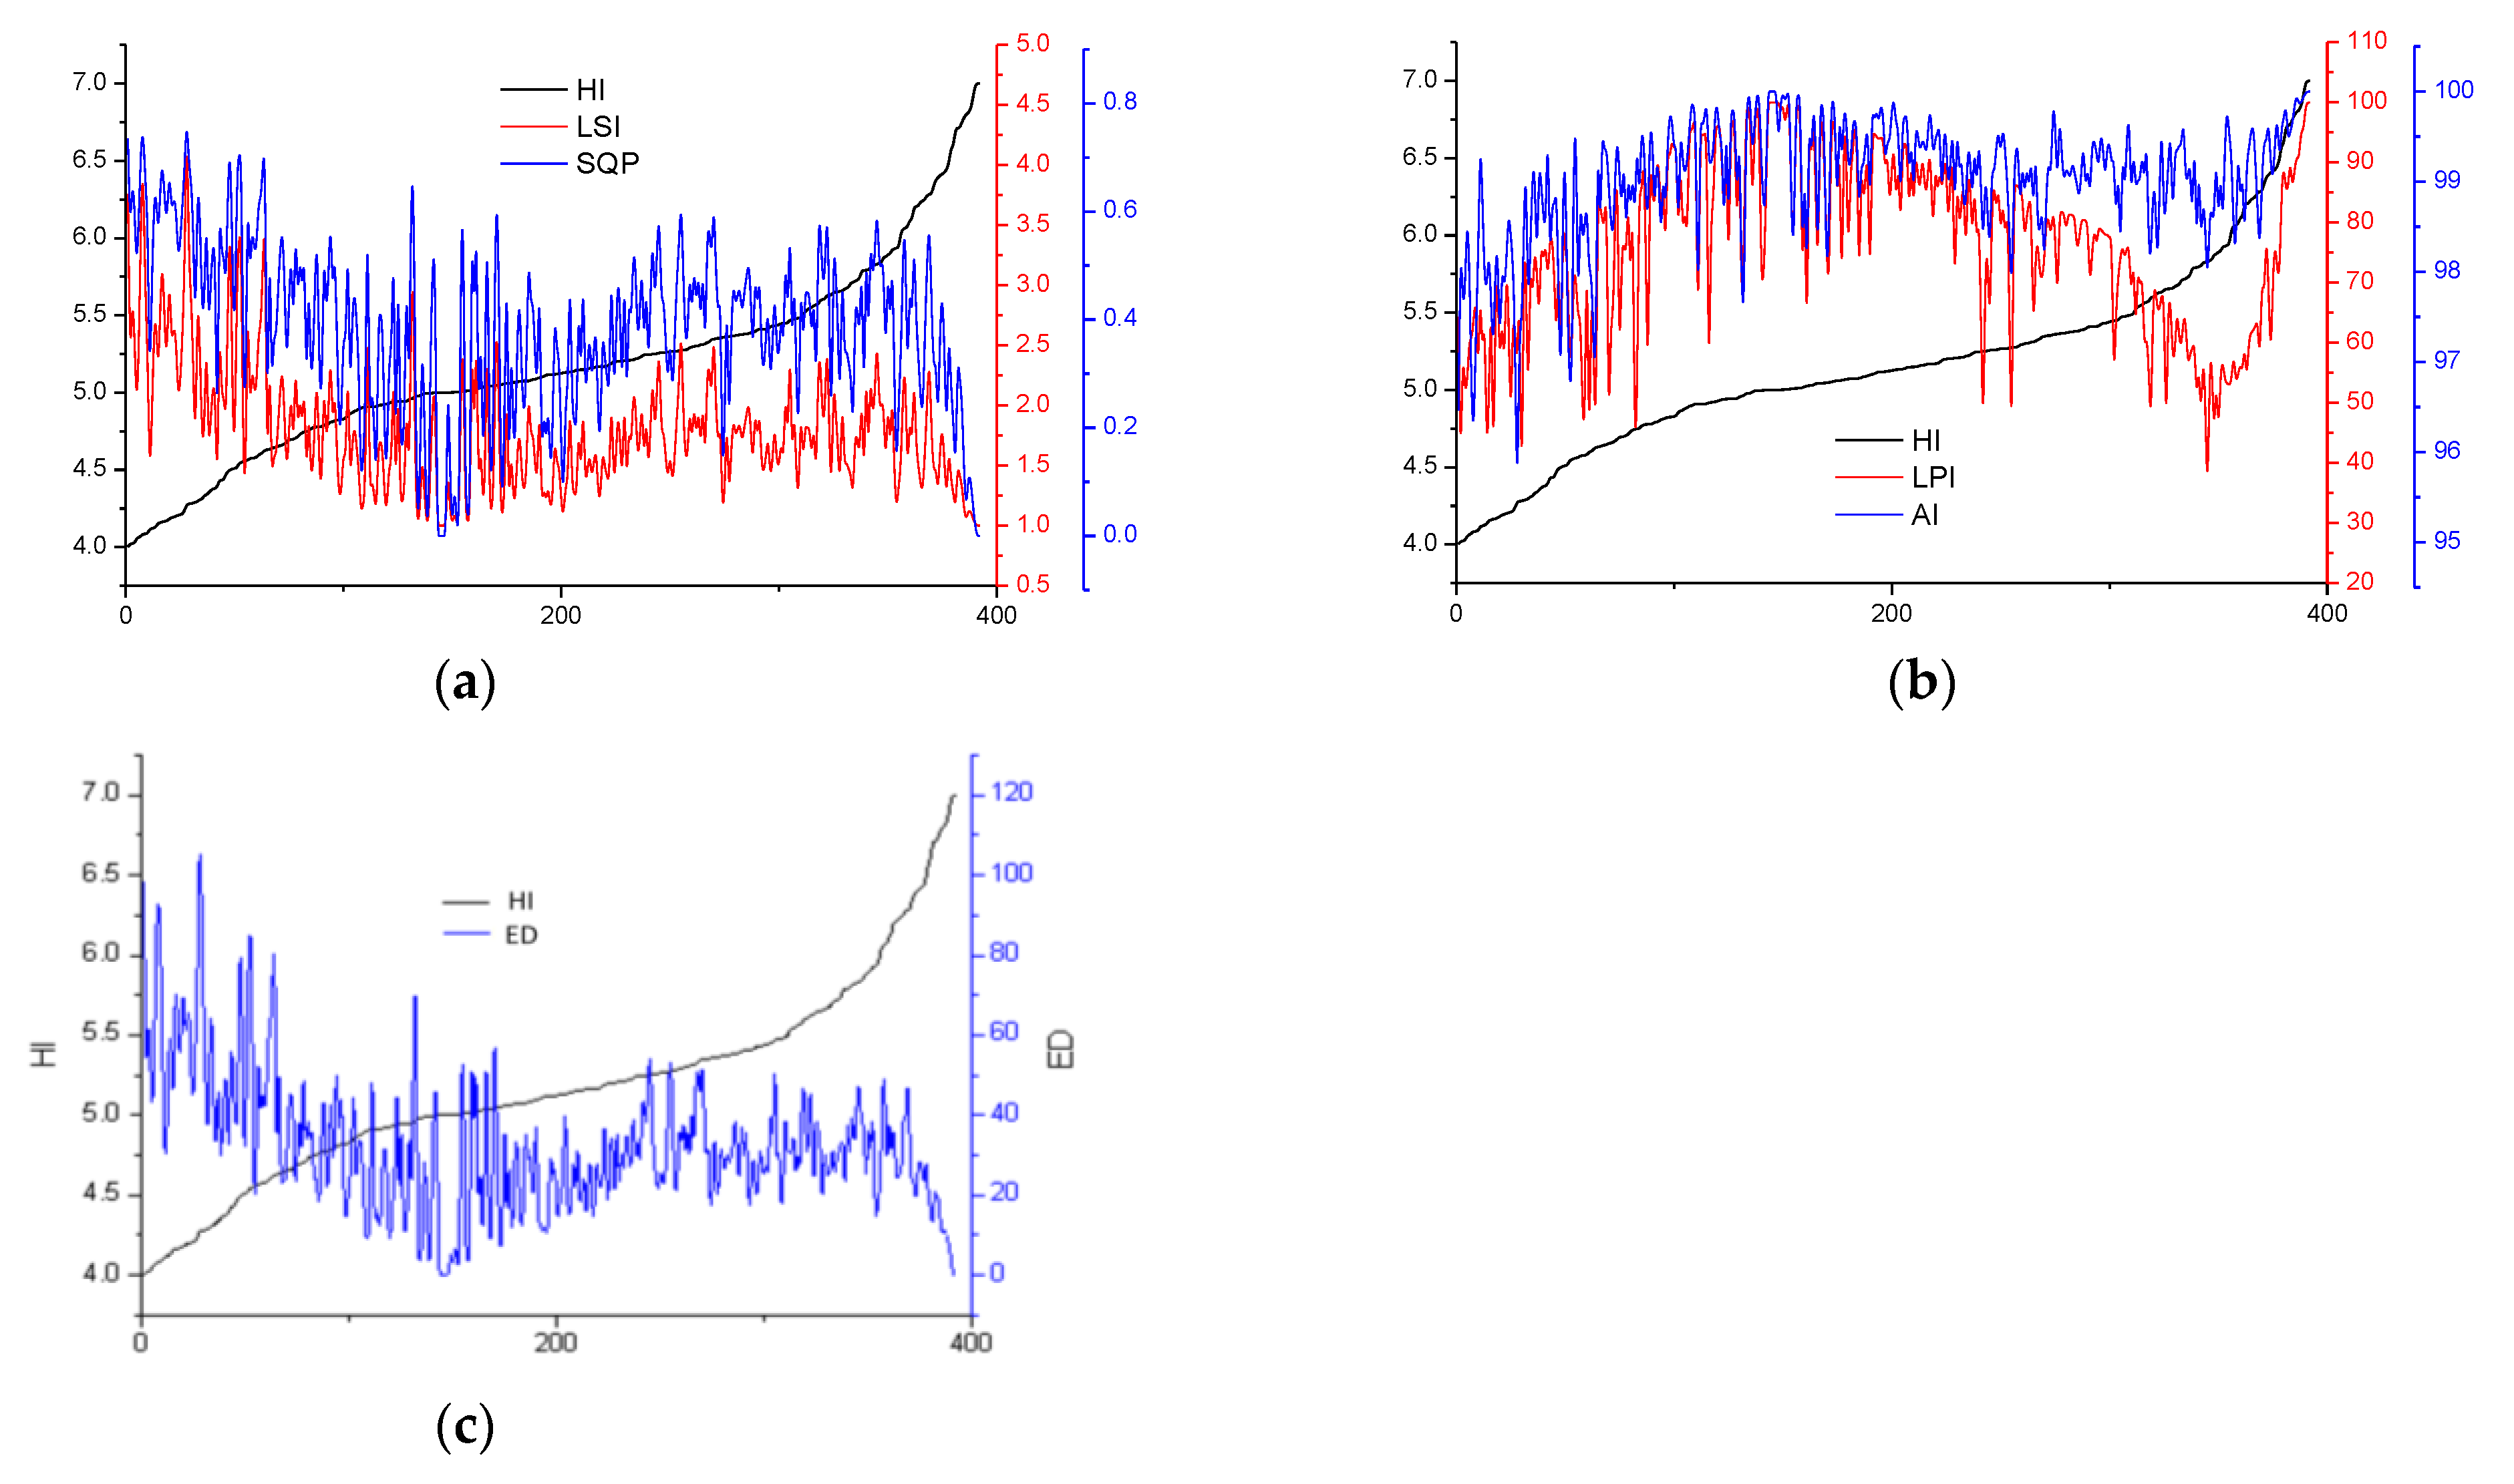
| Landscape Index | HI | Fitting Equation | R-Square |
|---|---|---|---|
| LPI | 4 ≤ HI < 5 | y = −98.5048 + 36.9464x | 0.363 ** |
| 5 ≤ HI < 6 | y = 318.4284 − 45.4748x | 0.544 ** | |
| 6 ≤ HI < 7 | y = −269.3026 + 53.04x | 0.886 ** | |
| ED | 4 ≤ HI < 5 | y = 259.8 − 46.646x | 0.323 ** |
| 5 ≤ HI < 6 | y = −56.976 + 16.4903x | 0.073 ** | |
| 6 ≤ HI < 7 | y = 253.586 − 35.4293x | 0.606 ** | |
| LSI | 4 ≤ HI < 5 | y = 7.5812 − 1.1818x | 0.333 ** |
| 5 ≤ HI < 6 | y = −0.5134 + 0.4308x | 0.073 ** | |
| 6 ≤ HI < 7 | y = 7.3397 − 0.8857x | 0.606 ** | |
| CONTAG | 4 ≤ HI < 5 | y = −44.1990 + 24.4526x | 0.342 ** |
| 5 ≤ HI < 6 | y = 263.2853 − 36.6256x | 0.524 ** | |
| 6 ≤ HI < 7 | y = −165.8786 + 35.7405x | 0.470 ** | |
| SHDI | 4 ≤ HI < 5 | y = 3.4913 − 0.6142x | 0.316 ** |
| 5 ≤ HI < 6 | y = −2.2920 + 0.5340x | 0.282 ** | |
| 6 ≤ HI < 7 | y = 4.9034 − 0.6774x | 0.901 ** | |
| SHEI | 4 ≤ HI < 5 | y = 2.4478 − 0.4139x | 0.326 ** |
| 5 ≤ HI < 6 | y = −3.0352 + 0.6745x | 0.545 ** | |
| 6 ≤ HI < 7 | y = 4.9022 − 0.6616x | 0.483 ** | |
| AI | 4 ≤ HI < 5 | y = 88.8632 + 2.0374x | 0.319 ** |
| 5 ≤ HI < 6 | y = 102.2016 − 0.6276x | 0.055 ** | |
| 6 ≤ HI < 7 | y = 90.0164 + 1.4124x | 0.486 ** | |
| SQP | 4 ≤ HI < 5 | y = 1.9029 − 0.3073x | 0.356 ** |
| 5 ≤ HI < 6 | y = −0.5390 + 0.1783x | 0.111 ** | |
| 6 ≤ HI < 7 | y = 2.6680 − 0.3573x | 0.692 ** |
Publisher’s Note: MDPI stays neutral with regard to jurisdictional claims in published maps and institutional affiliations. |
© 2021 by the authors. Licensee MDPI, Basel, Switzerland. This article is an open access article distributed under the terms and conditions of the Creative Commons Attribution (CC BY) license (https://creativecommons.org/licenses/by/4.0/).
Share and Cite
Wu, T.; Zha, P.; Yu, M.; Jiang, G.; Zhang, J.; You, Q.; Xie, X. Landscape Pattern Evolution and Its Response to Human Disturbance in a Newly Metropolitan Area: A Case Study in Jin-Yi Metropolitan Area. Land 2021, 10, 767. https://0-doi-org.brum.beds.ac.uk/10.3390/land10080767
Wu T, Zha P, Yu M, Jiang G, Zhang J, You Q, Xie X. Landscape Pattern Evolution and Its Response to Human Disturbance in a Newly Metropolitan Area: A Case Study in Jin-Yi Metropolitan Area. Land. 2021; 10(8):767. https://0-doi-org.brum.beds.ac.uk/10.3390/land10080767
Chicago/Turabian StyleWu, Tao, Peipei Zha, Mengjie Yu, Guojun Jiang, Jianzhen Zhang, Qinglong You, and Xuefeng Xie. 2021. "Landscape Pattern Evolution and Its Response to Human Disturbance in a Newly Metropolitan Area: A Case Study in Jin-Yi Metropolitan Area" Land 10, no. 8: 767. https://0-doi-org.brum.beds.ac.uk/10.3390/land10080767