
Effects of Grazer Exclusion on Carbon Cycling in Created Freshwater Wetlands


Thomas H. Gosnell School of Life Sciences, Rochester Institute of Technology, Rochester, NY 14623-5603, USA
*
Author to whom correspondence should be addressed.
Land 2021, 10(8), 805; https://0-doi-org.brum.beds.ac.uk/10.3390/land10080805
Submission received: 1 July 2021
/
Revised: 28 July 2021
/
Accepted: 30 July 2021
/
Published: 31 July 2021
(This article belongs to the Special Issue Celebrating 25 Years of World Wetlands Day)
Abstract
:Wetland ecosystems play a significant role in the global carbon cycle, and yet are increasingly threatened by human development and climate change. The continued loss of intact freshwater wetlands heightens the need for effective wetland creation and restoration. However, wetland structure and function are controlled by interacting abiotic and biotic factors, complicating efforts to replace ecosystem services associated with natural wetlands and making ecologically-driven management imperative. Increasing waterfowl populations pose a threat to the development and persistence of created wetlands, largely through intensive grazing that can shift vegetation community structure or limit desired plant establishment. This study capitalized on a long-term herbivore exclusion experiment to evaluate how herbivore management impacts carbon cycling and storage in a created wetland in Western New York, USA. Vegetation, above- and belowground biomass, soil carbon, carbon gas fluxes and decomposition rates were evaluated in control plots with free access by large grazers and in plots where grazers had been excluded for four years. Waterfowl were the dominant herbivore at the site. Grazing reduced peak growing season aboveground biomass by over , and during the summer, gross primary productivity doubled in grazer exclusion plots. The shift in plant productivity led to a increase in soil carbon after exclusion of grazers for five growing seasons, but no change in belowground biomass. Our results suggest that grazers may inhibit the development of soil carbon pools during the first decade following wetland creation, reducing the carbon sequestration potential and precluding functional equivalence with natural wetlands.
1. Introduction
Freshwater wetlands are among the most ecologically and economically valuable ecosystems in the world, providing ecosystem services such as habitat for migratory waterfowl [1], nutrient cycling [2,3], and carbon storage [4,5,6]. Urban and agricultural development is threatening wetlands, resulting in the need for restoration and creation to prevent loss of key ecosystem functions. Wetland ecosystems, however, are driven by complex interactions between biotic and abiotic factors, including hydrology, nutrient cycling, competition, and grazing, which influence ecosystem structure and function and pose challenges to successful restoration efforts (e.g., [7,8,9]). A greater understanding of the interplay among biotic and abiotic drivers of function, the trajectory of wetland development over time, and which management tools can be leveraged to maximize desired outcomes is required for more successful wetland restoration [10].
Emergent vegetation, such as Typha spp., is a key driver of carbon (C) cycling in freshwater wetlands [11,12]. Plants fix inorganic C from the atmosphere through photosynthesis, store organic C in above- and belowground biomass, and transfer carbon to sediments through decomposition and root exudation. Soil carbon is often stored for long periods of time due to anaerobic soil conditions [13,14]. High photosynthetic activity, coupled with anaerobic conditions, means that wetlands can be substantial carbon sinks [6,15,16]. However, the magnitude of soil carbon content is a key functional difference between natural and created wetlands, with an average shortcoming in soil C of relative to natural wetlands within two decades of creation in the United States [17]. Globally, created wetlands require more than 20 years to reach C levels of natural wetlands [9], and estimates of time to reach comparable C levels in the United States range from 30 to 300 years [18], with variation among wetland types [17]. This highlights the need to identify wetland creation and management approaches that accelerate soil development and carbon uptake and storage.
Herbivory has the potential to exacerbate plant and carbon cycling differences between created and natural wetlands. Hydrology plays a key role in this top-down dynamic in freshwater wetlands, with stable hydrologic regimes attracting waterfowl, in particular the Canada goose (Branta canadensis) and ducks (Anas spp.), to wetlands for nesting and feeding [19,20,21]. Created wetlands often feature deep standing water and young palatable vegetation, which offers desirable habitat for migratory waterfowl [22]. This, coupled with rising waterfowl populations [23], can cause created wetlands to be particularly vulnerable to intensive grazing [21]. Herbivory in wetlands can cause a top-down cascade that shifts ecosystem structure and function [24,25]. Although primary functional traits of wetlands are determined by physico-chemical factors, especially hydrology and nutrient availability, interaction between bottom-up and top-down factors may ultimately control plant community composition and biomass [26,27,28,29].
Excessive grazing by waterfowl in wetlands can cause a decrease in total plant cover [21,30], and also in plant biomass [29,31]. Preferential grazing, especially when heavy, may also shift plant community composition [21,32,33,34]. Often waterfowl target younger, more palatable plants, leading to a shift in plant species composition [35,36,37] and changes in the quality and quantity of plant litter. When intensive grazing reduces plant cover or changes plant species composition, net primary productivity (NPP) and organic carbon brought into and stored in soil may decrease [38,39,40,41]. In grasslands, grazing may also increase decomposition, by changing both litter quality and the soil environment [42]. In wetlands, plants also impact soil processes through oxygen transport into sediments [43,44], and therefore intensive grazing of emergent plants could further alter belowground carbon cycling by reducing aerobic microsites. While the impact of waterfowl on plant cover, biomass and species composition has been studied in freshwater wetlands, the impact on CO fluxes, net ecosystem exchange (NEE), and overall carbon storage is less well understood.
One of the key limitations to many studies on herbivore impacts in wetlands is that experiments often last only one or two seasons, limiting the ability to observe long-term changes in carbon cycling and storage. The current study utilizes a long-term herbivore exclosure experiment and builds upon Lodge and Tyler [21], who found that during the first 2 years of grazer exclusion, plant cover increased by and peak growing season plant diversity by in a permanently flooded wetland, suggesting that, in some cases, grazer management could be used to establish desired plant communities during wetland creation. This result raised the question of whether shifts in plant communities following grazer exclusion also promote the development of C stocks in created wetlands. The current study expands on the long-term grazer exclusion experiment by quantifying C pools and fluxes and addressing whether changes in plant cover following herbivore management result in long-term changes in wetland carbon cycling and storage. The overarching objective of this study was to better understand the impacts of grazers on carbon cycling, with the intent to help managers develop management practices that promote carbon sequestration in created wetlands. We hypothesized that a reduction in total plant biomass by grazers would lead to decreased photosynthetic carbon uptake (GPP), lower net ecosystem exchange (NEE), and ultimately decreased soil carbon storage.
2. Methods
2.1. Site Description
This experiment took place between June 2017 and the end of April 2019, using experimental plots established in 2014 by Lodge et al. [21,45]. Plots were located at High Acres Nature Area (HANA) in a series of natural and created wetlands in Western New York, USA (43°5 N, 77°23 W) owned and managed by Waste Management of New York, LLC. This study was conducted in a 1.87 ha shallow emergent marsh, the North Pool of the Western Wetland complex at HANA. The land was previously used as a gravel depository, but was abandoned in the 1960s, left to fallow, and converted to an emergent wetland in 2009. Prior to its use as a gravel depository, the site was used for agricultural purposes. The wetland is fed through the subsurface by the adjacent remnant quarry pond, and contains a culvert in the south end which controls water flow to the pond directly south of the area, allowing control of water levels and consistent standing water year-round [21]. Soils in the North Pool wetland have relatively low organic matter, soil nutrients (nitrate, ammonium and total phosphorus); dominant plant species include broadleaf arrowhead (Sagittaria latifolia), pickerelweed (Pontedaria cordata), and white pond lily (Nymphaea odorata) [21].
In June of 2014, sixteen pairs of plots were established at the site, with each pair consisting of a 1 m hardware mesh caged plot and an uncaged plot marked with poles (Figure 1). As described by Lodge et al. [21], plots were arranged randomly in four blocks of four pairs. A three-sided cage-control plot was also included in each block to ensure that the response variables were unaffected by the cages themselves. Because there was no cage effect over the first two years of the experiment, the cage controls were not used in this study.
2.2. Grazer Abundance
We quantified waterfowl abundance based on observations by trained researchers and volunteers from June 2017 through November 2018. Species, abundance, date, and time of day were recorded on every visit with the frequency of observations varying among seasons (n = 2 to 19; higher observations in summer and fall). Grazer point counts were converted to density in units of individuals per ha and compiled by season (winter, spring, summer, and fall). Evidence of other herbivores, including deer, muskrats, and beavers, was present, but individuals were rarely observed.
2.3. Vegetation Cover, Biomass and Elemental Composition
Vegetation surveys were conducted every six weeks between early June and August 2017 and May and August 2018. Surveys included estimation of total plant cover within the plot as well as stem counts for each species and total grazer damage [46,47]. Percent cover was estimated by at least two observers per plot. We quantified damage by estimating the total leaf area removed by large grazers, relative to the extant abundance of each species [34,48]. The stem height, leaf height, and leaf width were measured for five individuals of each species for use in aboveground biomass estimation. Water depth was measured in conjunction with all vegetation surveys by averaging three measurements per plot. We estimated aboveground biomass for the eight plant species that comprised > of total cover roughly every six weeks during the growing seasons of 2017 and 2018 using species-specific allometric equations. We selected representative culms growing outside of experimental plots at the peak of the growing season (June–July), cut individuals from the bottom of the stem at the soil surface and immediately measured stem height, leaf height, and leaf width. We determined the per stem dry mass after drying at 60 C and created regression curves based on the best-fit allometric relationship for each species (Supplemental Information, Table S1). Stem density and allometric characteristics measured during the vegetation surveys were used to calculate the total plot-level biomass for each species at each time point [48,49,50] and summed for each plot. We assessed C and nitrogen (N) composition of the five most abundant plant species from samples collected in August for use in the decomposition study (below). Plants were air-dried, ground to homogeneity using an electric coffee mill, and analyzed using a Perkin Elmer 2400 CHNS Elemental Analyzer. The total aboveground C in plant biomass was calculated for each species using the estimated biomass and measured C content and then summed for each plot.
A single soil core (6 cm diameter × 20 cm depth) was collected from each plot using an auger for the determination of belowground biomass and the elemental composition of roots and rhizomes. Cores were sieved (1 mm mesh) to remove soil particles, and roots and rhizomes were weighed after drying at 60 C [36]. The C and N composition was measured as above and the total biomass (to 20 cm) and tissue C content used to calculate total C in belowground biomass.
2.4. Soil Characteristics and Elemental Composition
In October 2018 we used a syringe corer (2.5 cm diameter × 10 cm depth) to collect samples in triplicate from each plot for bulk density and elemental composition. Bulk density was calculated based on the mass of the soil core after drying at 60 C and the initial core volume. Visible roots and rhizomes were removed and cores were then homogenized using a mortar and pestle and C and N content was measured as above. Bulk density and the C content were used to calculate areal soil C in the top 10 cm of soil.
2.5. Decomposition
We identified the dominant plant species based on the plant surveys and used these to measure decomposition using the litterbag method [48]. Four species were selected that in combination contributed at least 60% of the total cover: broadleaf cattail (Typha latifolia), broadleaf arrowhead (S. latifolia), pickerelweed P. cordata, and white pond lily (N. odorata). Specimens were collected from outside experimental plots at the end of August and air dried in the laboratory. We filled 20 × 20 cm square bags constructed from polyester screen (approximate mesh size 1 × 1 mm) with 10 g dry litter and placed four litterbags of each species into 12 plots (6 caged and 6 uncaged) in September 2018. Bags were collected after 30, 61, 181, and 211 days. The remaining material was rinsed thoroughly with tap water to remove soil, dried at 60 C, and weighed. The decomposition rate (k-value) of each species and treatment was calculated as the linear slope of the natural log of the percent original mass remaining versus days in the field [51,52].
2.6. Gas Fluxes
We measured CO fluxes using the static chamber method [53]. Measurements were made during the peak growing season (June–July) and at the beginning of plant senescence (late August–September) in both 2017 and 2018. We measured fluxes in two of the four experimental blocks (eight pairs of caged and uncaged plots). The chamber was constructed from a PVC frame that covered a 1 m area and was adjustable in height (1 to 1.7 m) depending on the height of the plant canopy. The top was fitted with a clear polycarbonate panel that covered roughly one-third of the area, and the remainder of the top and the sides were covered with clear polyethylene greenhouse film. The chamber fit over the permanently installed PVC corner posts used to mark the plot and during measurements the plastic film was rolled down into the water and secured at the sediment surface with a chain to prevent lateral exchange of water or gases. The polycarbonate top and clear plastic film used to construct the chamber allowed approximately 67% of photosynthetically active radiation to pass through. For dark measurements, we covered the chamber with an opaque tarp.
The polycarbonate top was fitted with a small radiative panel that attached to two gas tight bulkheads so that chilled water could be circulated continuously through the chamber while it was sealed. We continuously monitored temperature throughout the sampling periods both inside and outside the chamber, and maintained internal temperatures within 5 C of external temperature [53] by adjusting the chilled water circulation. Two additional bulkheads connected the inflow and outflow of an infrared gas analyzer (LI-820) and air was continuosly circulated from the chamber, through the analyzer and back to the chamber using a small air pump. We measured changes in headspace CO in both the light and the dark over approximately a 10 min period.
Fluxes were calculated from the slope of the first 5 min period after chamber closure and calculated based on the headspace of the chamber above the water. We estimated gross primary productivity (GPP) by subtracting the dark measurement (ecosystem respiration, ER) from the light measurement (net ecosystem exchange, NEE) for each plot. We estimated summer C budget values for GPP and ER from chamber fluxes, assuming a 24 h period for respiration and a 12 h period for photosynthesis. Because submerged plants may directly take up dissolved inorganic carbon (DIC) released from heterotrophs in the sediments and water column, which was not reflected in our measured changes of CO in the chamber headspace, we have likely underestimated overall ER and GPP.
2.7. Statistical Analyses
We performed all statistical analyses using the JMP Pro 14 statistical software. We evaluated each dataset for homogeneity of variance and normality prior to statistical analysis. Heterogeneity among blocks within each site was analyzed by including block as a random factor in analyses. For data that met the requirements of normality, we used a one-way ANOVA (belowground biomass and soil elemental composition) or for variables that had a seasonal component (GPP, ER, NEE, aboveground biomass, plant cover) or a species component (decomposition) a full-factorial two-way ANOVA with treatment and month or species as fixed factors. When significant interactions were identified, we used the Tukey post-hoc test to determine the differences among means. For data that could not be successfully transformed to meet the normality assumptions, including grazer density and grazer damage, we used a one-way Kruskal–Wallis test, followed by a Mann–Whitney U test to compare means. The relationship between peak growing season (July) aboveground biomass and carbon gas fluxes (GPP and ER) was assessed using simple linear regression of data from both treatments and years.
3. Results
3.1. Grazing Pressure
Waterfowl were consistently abundant in the North Pool site throughout the course of the study with Canada goose (Branta canadensis), mallard ducks (Anas platyrhynchos), and common gallinules (Gallinula galeata) as the most common species. Density ranged from 2 to 18 individuals ha d. Peak abundance occurred in summer 2017, which was higher than spring and summer 2018 (Supplemental Information, Figure S1).
3.2. Hydrologic Conditions
The North Pool wetland was consistently flooded, with water depths >8 cm throughout the time of this study, ranging to a maximum of 50 cm (Supplemental Information, Figure S2). The ability to control water flow out of the culvert situated at the southern end of the wetland meant that the regional drought experienced in 2017 had minimal impacts on water levels. Water depth was similar between the two years, with growing season averages ranging from 24 to 29 cm.
3.3. Vegetation
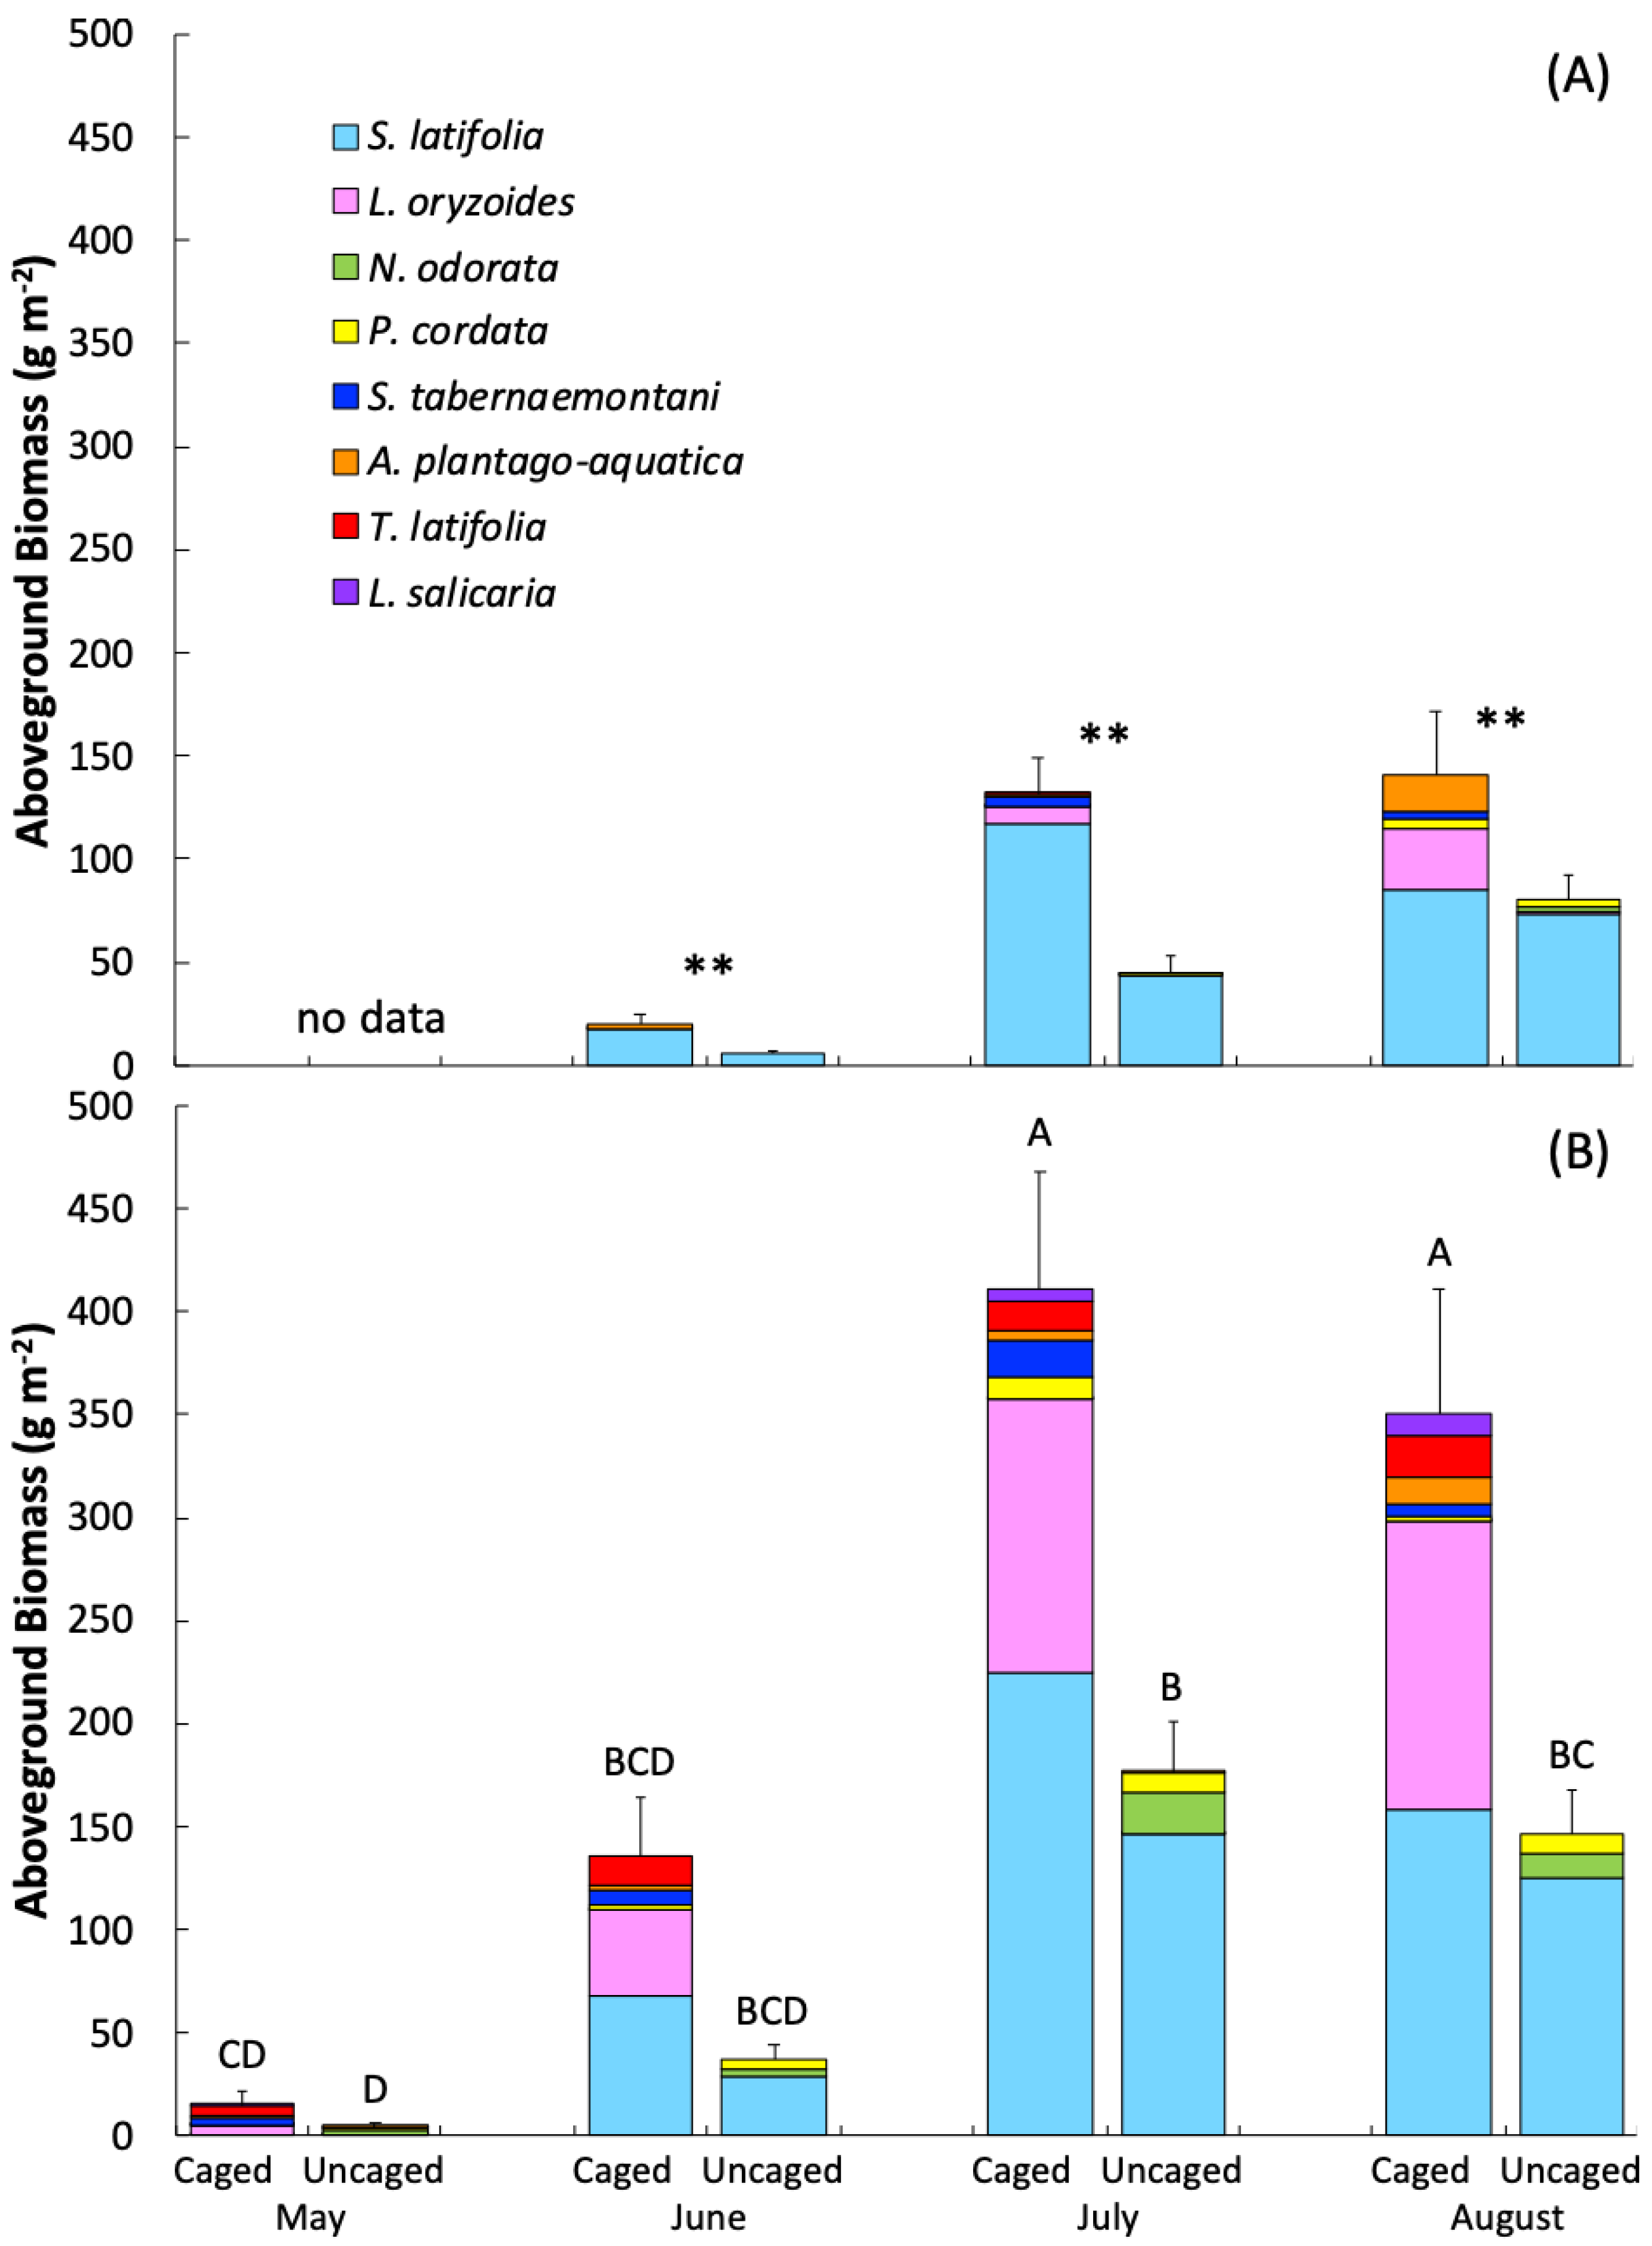
A total of 12 species were found in experimental plots, with distinct differences in composition and abundance across seasons and treatments (Figure 2). Aboveground biomass showed a predictable seasonal pattern, with biomass increasing from spring into summer and peaking in mid to late summer (Table 1, Figure 2). Aboveground biomass in 2017, which was unusually hot and dry, was lower across seasons and treatments than in 2018. The exclosure treatment resulted in a significant reduction in aboveground biomass in both 2017 and 2018, and in 2018 there was a significant interaction between treatment and month, with the effect of grazer exclusion on aboveground biomass increasing from spring into summer (Table 1). During the height of the growing season (July), aboveground biomass was 3-fold (2017) and 2-fold (2018) higher in caged plots than uncaged plots. In the 2017, both grazer treatment and season were highly significant (p < 0.0001), with no interaction. However, in 2018, there was a significant interaction between season and treatment (p = 0.003), with the difference between caged and uncaged treatments increasing over the course of the growing season. Similar seasonal and treatment patterns were seen for plant cover (Supplemental Information, Figure S3, Table S2). The species selected for biomass assessment in both years comprised greater than 90% of the overall cover.
The species composition of aboveground biomass shifted seasonally and between treatments (Figure 2). S. latifolia had the highest biomass across years and seasons, with the exception of spring 2018 when Leersia oryzoides, T. latifolia, Alisma plantago-aquatica were present but overall biomass was low. S. latifolia was particularly dominant in uncaged plots during the peak of the growing season, contributing >90% of the aboveground biomass in uncaged plots in 2017 and 75–85% of the biomass in uncaged plots in 2018. In 2018, N. odorata was also prominent in uncaged plots, contributing 11% of the peak growing season biomass, while being almost entirely absent from caged plots across both years. A larger number of species contributed to the aboveground biomass in caged plots, with S. latifolia contributing 50–90% of growing season biomass and L. oryzoides up to 40%, while being essentially absent (<0.05%) from uncaged areas. T. latifolia was present only in caged plots, and aside from May 2018, always low (<10%). P. cordata was present in both treatments across the growing season, but was a minor contributor to biomass. Additional species present in low abundance (<5% of total biomass) in caged plots included Schoenoplectus tabernaemontani, Scirpus sp., Echinochloa crus-galli, and Lythrum salicaria. Grazer damage was observed only for P. cordata, S. latifolia, and N. odorata. Of the species impacted by grazers, relative damage ranged from 17 to 25% (scaled to abundance) and there were no significant differences among species, although relative damage was highest for S. latifolia (Supplemental Information, Figure S4). We note, however, that these measurements do not take into account species completely excluded by grazers or those for which no measurement of grazer damage was assessed.
3.4. Soil and Belowground Biomass
Belowground plant biomass in the top 10 cm tended to be higher in caged plots (caged: 555 ± 127; uncaged: 338 ± 105 g m). However, there was no significant effect of grazing (F = 1.6 p = 0.2) and there was no difference in the C and N content between treatments (F < 0.02 p = 0.9, Table 2). Soil C increased from 5.06 ± 0.25% to 6.42 ± 0.23% in the absence of grazers (F = 12.3, p = 0.002, Table 2). Although not significant, this increase in %C was accompanied by increased %N (F = 2.8, p = 0.1), resulting in no change in soil C:N (Table 2). Soil bulk density was not different between treatments (caged: 0.34 ± 0.03, uncaged: 0.32 ± 0.03) and the higher C content of soils within caged plots yielded 34% higher C storage in the top 10 cm of soil when grazers were excluded (F = 6.4, p = 0.02).
3.5. Decomposition Rates
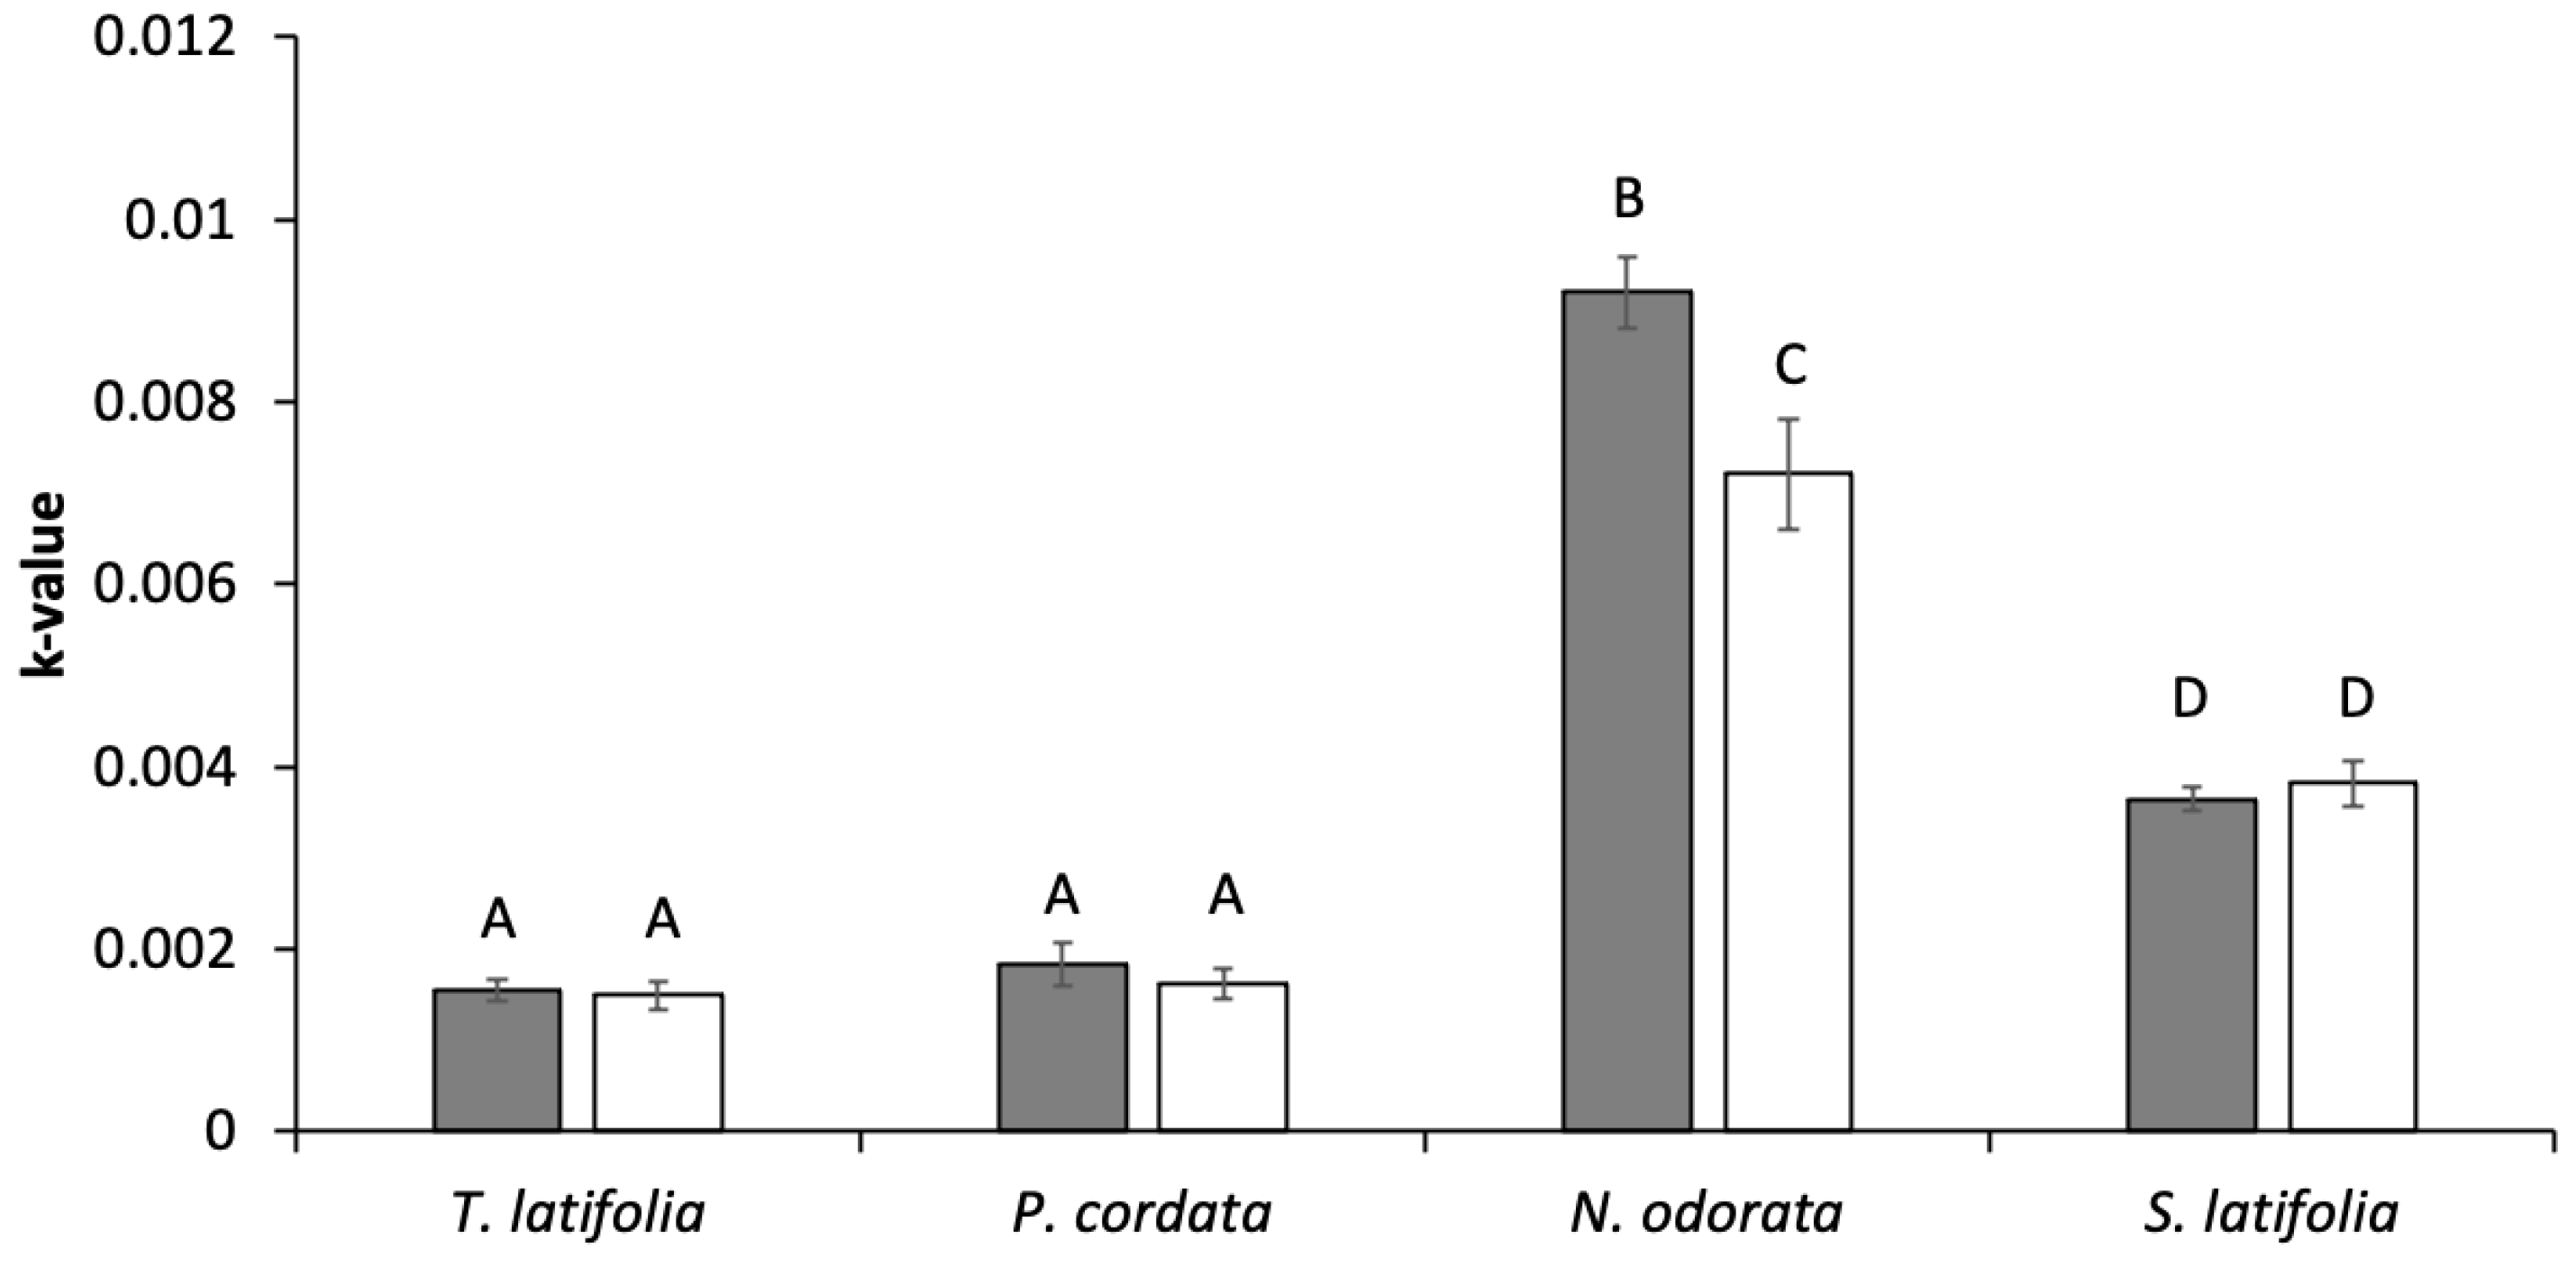
Decomposition rates varied significantly across species; N. odorata decomposed faster than T. latifolia, P. cordata and S. latifolia (F = 255, p < 0.001, Figure 3). Across all species measured, N. odorata was also the species with the lowest litter C:N (Table 2). Differences in these ratios were largely driven by species-specific differences in %N, with values ranging from a low of 1.3 ± 0.02% in P. cordata to 2.5 ± 0.01% in N. odorata (Table 2). Decomposition was greater in caged plots overall (F = 7.3, p = 0.01), but the significant interaction between species and treatment showed that the increase in decomposition when grazers were excluded only occurred for N. odorata (F = 6.5, p = 0.001, Figure 3).
3.6. Gas Fluxes
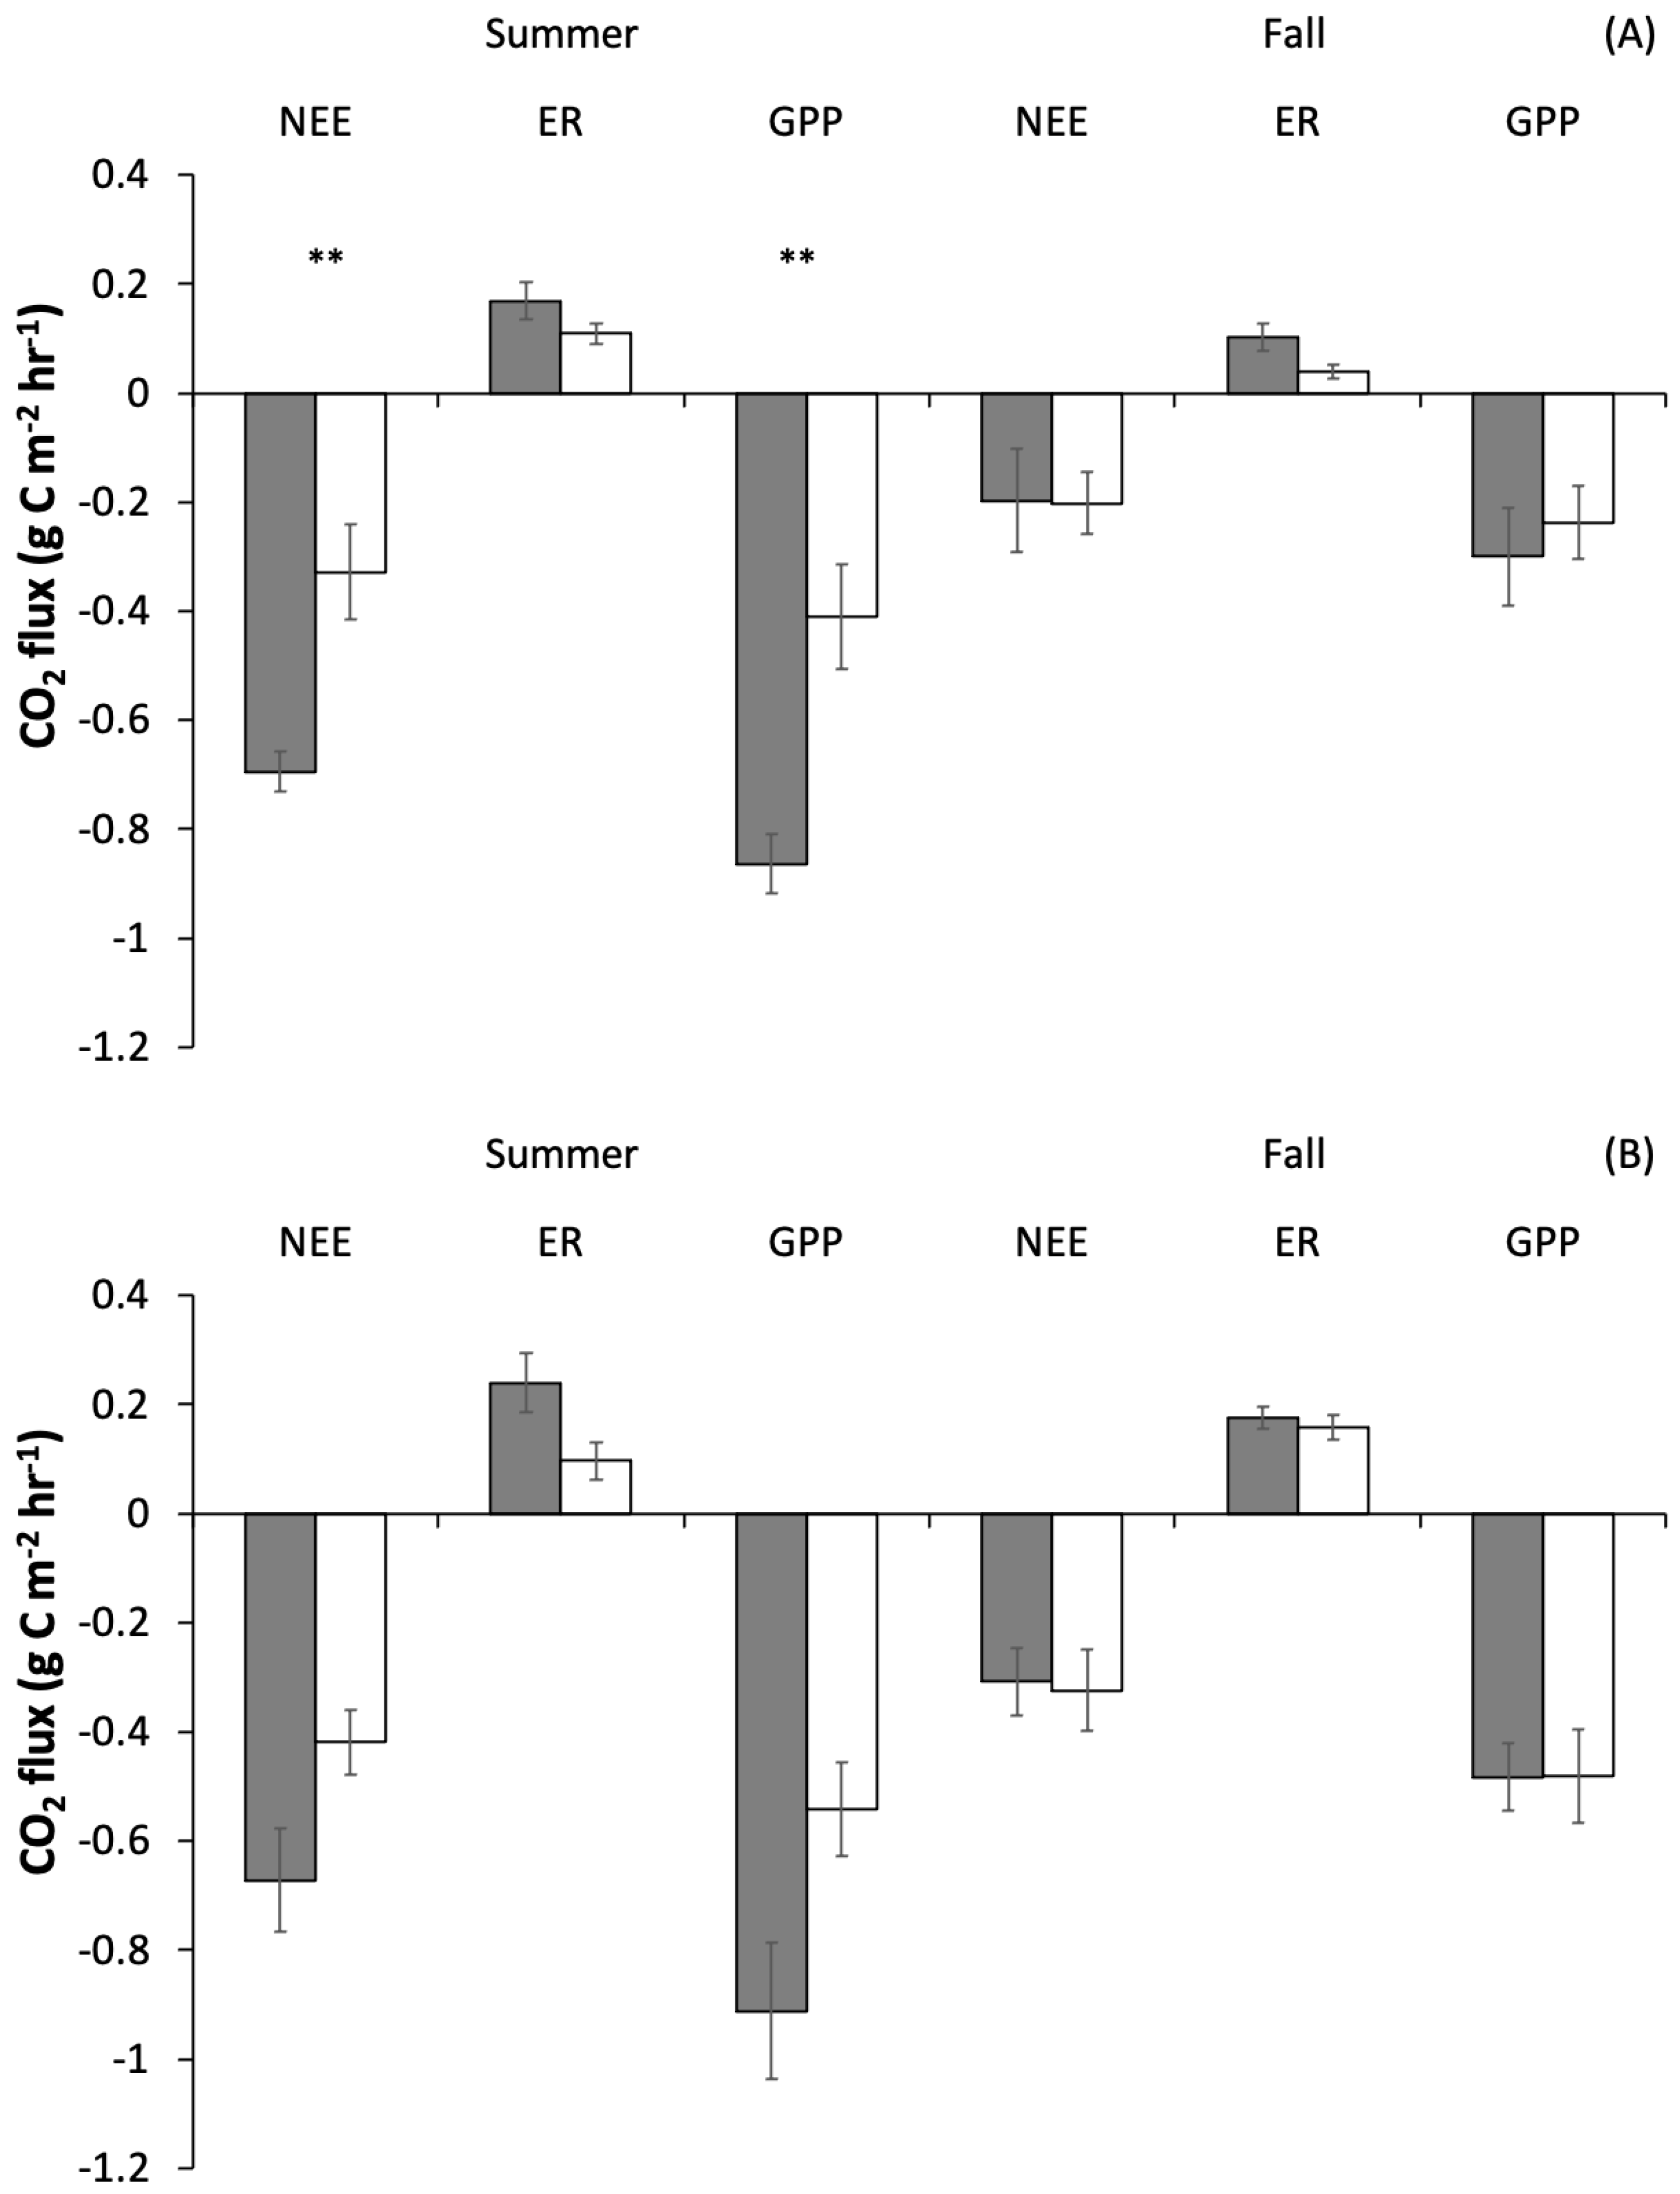
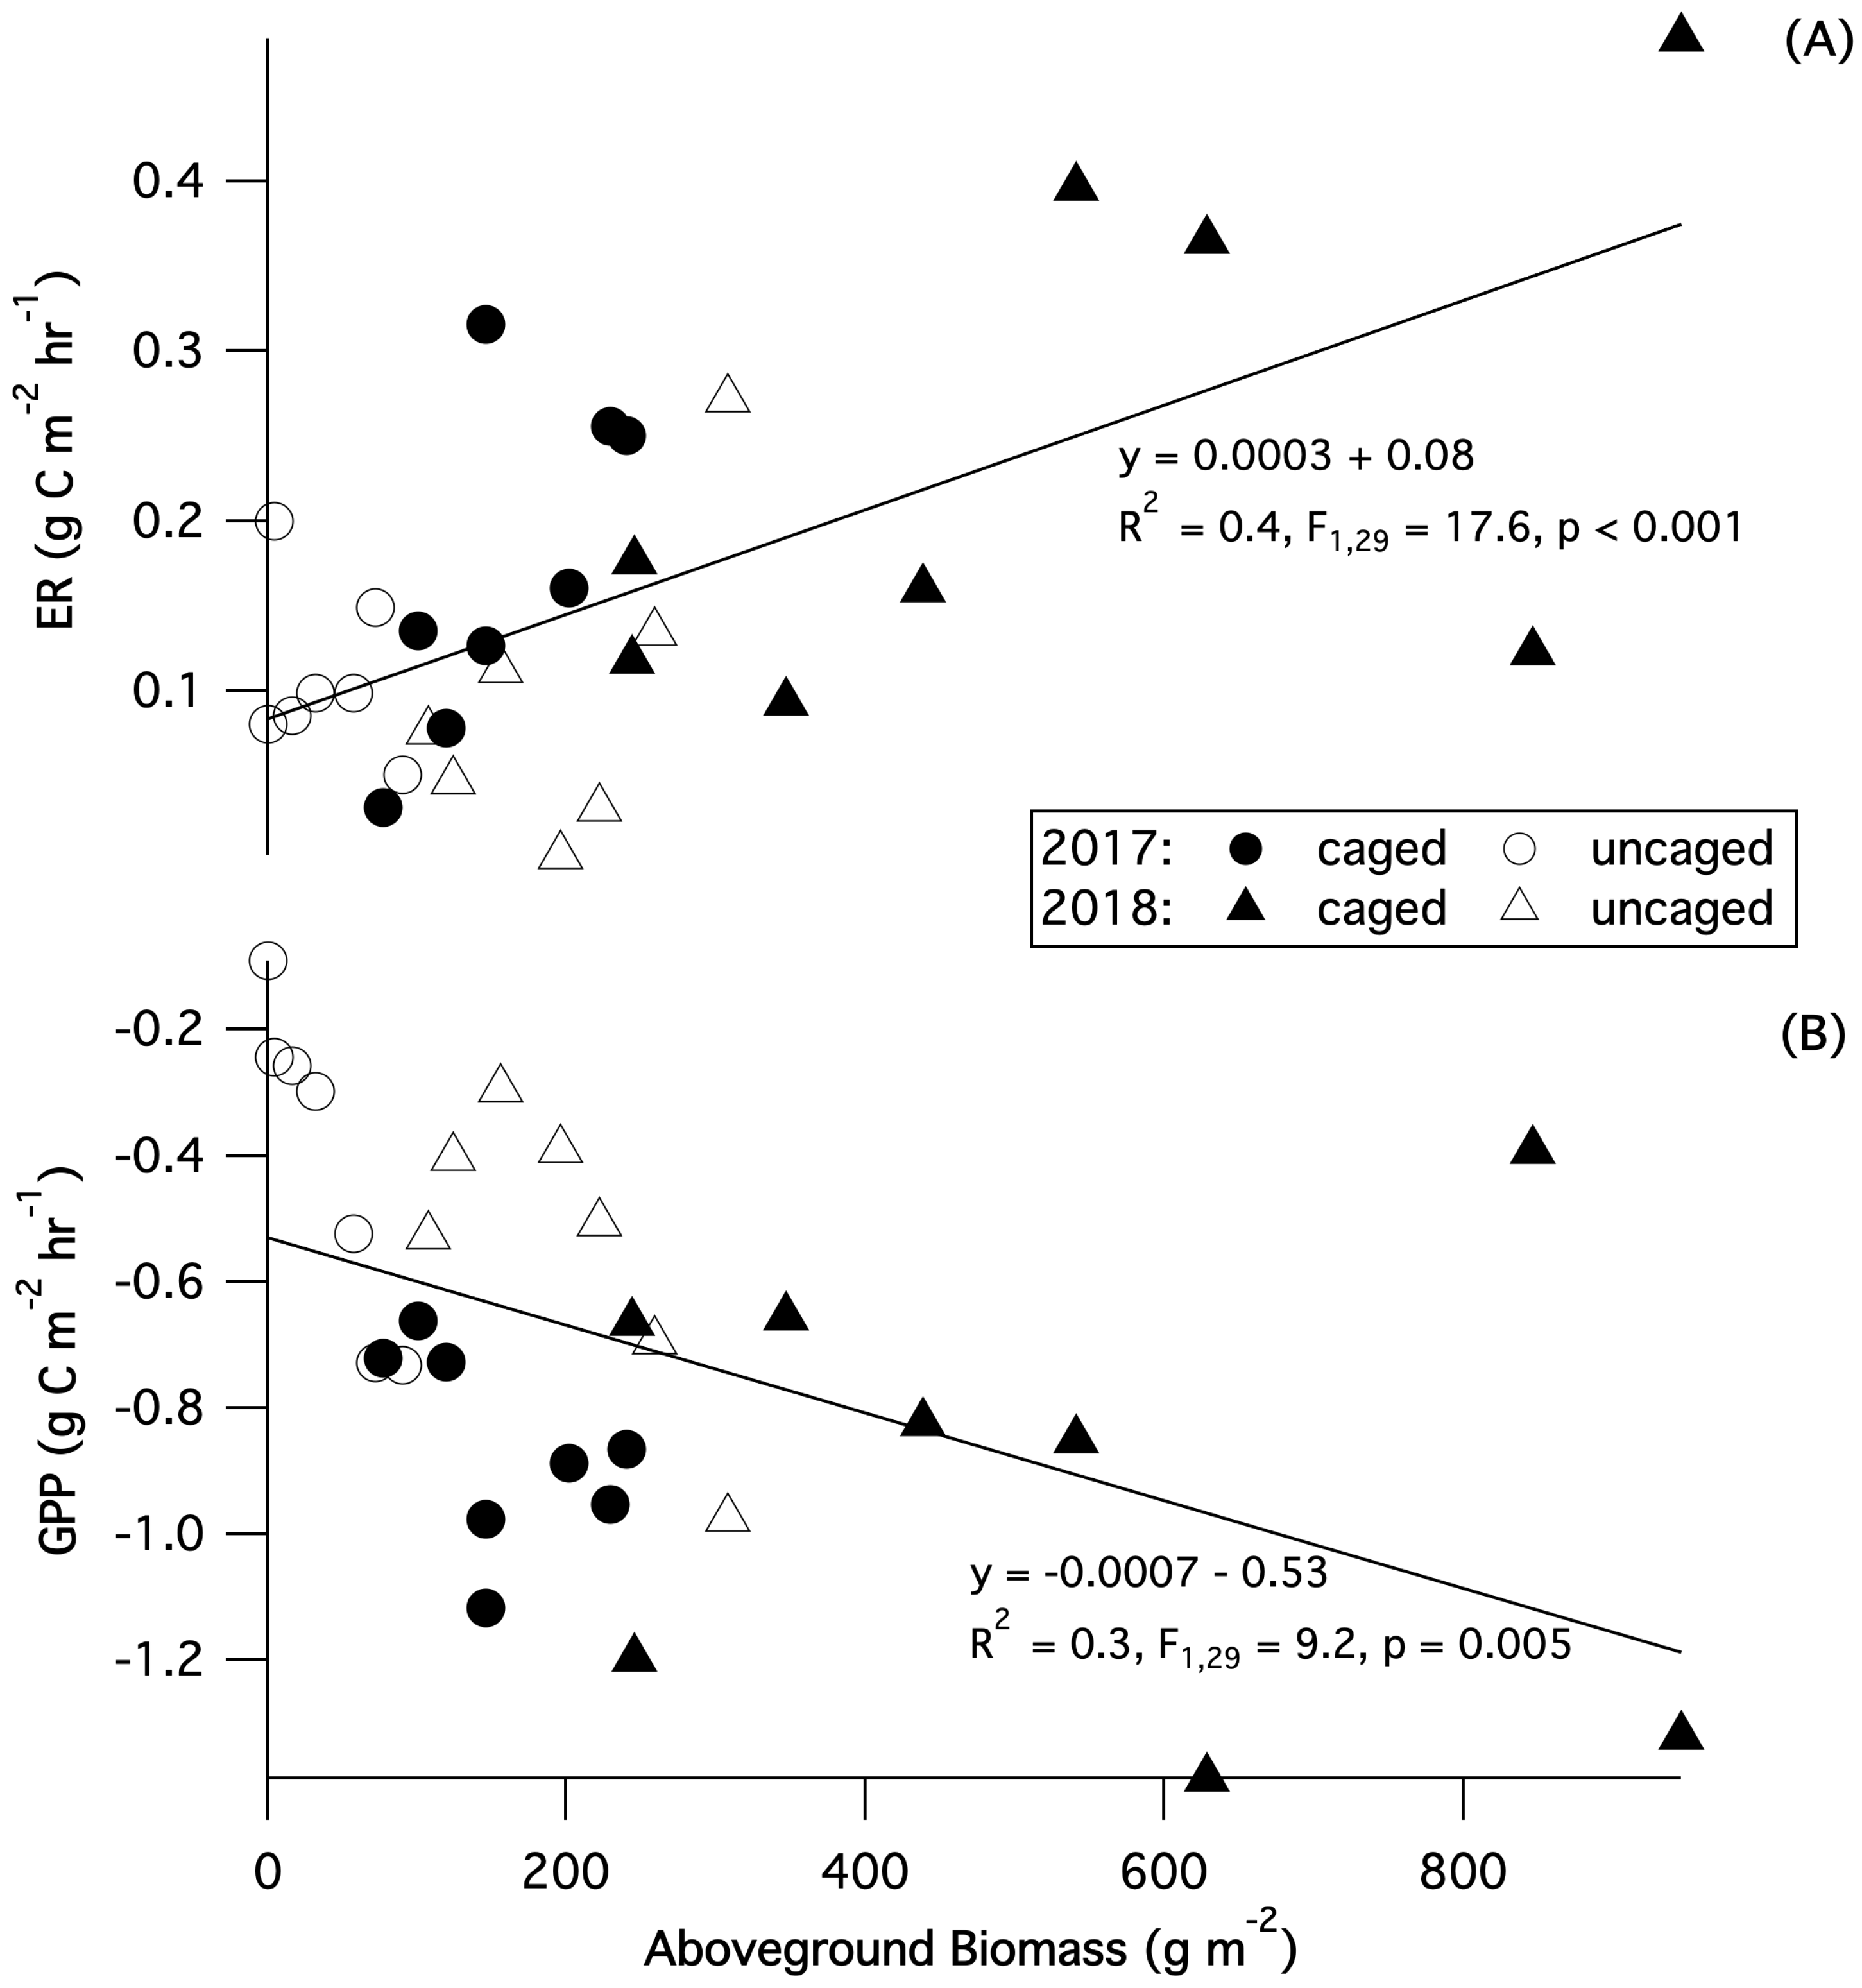
Carbon dioxide fluxes differed between summer and fall and were strongly influenced by grazing (Table 1, Figure 4). Across grazer treatments, there was significantly higher NEE in the summer compared to the fall in both years (2017: p = 0.0003; 2018: p = 0.003). There was also a significant interaction in 2017 between season and treatment for NEE (p = 0.01), with summertime net uptake in caged plots more than double that of uncaged plots, whereas fall values were similar across treatments. Across years, ER was significantly higher in caged plots (2017: p = 0.02; 2018: p = 0.03); and in 2017, it was significantly higher in the summer compared to the fall (p = 0.02), but showed no interaction between treatment and season in either year. GPP showed a clear interaction between season and treatment, with a significant interaction in 2017 and a strong trend towards an interaction in 2018 (2017: p = 0.02; 2018: p = 0.06), with higher primary productivity in caged plots during the summer. In summer 2017, when the grazer effect was greatest, caged plots fixed 55% more carbon than uncaged plots. Across years and treatments there was also a significant linear relationship between aboveground biomass and GPP and ER (GPP: R = 0.3, F = 9.2, p = 0.005, ER: R = 0.4, F = 17.6, p < 0.001), with higher aboveground biomass correlated with higher GPP and ER (Figure 5).
4. Discussion
Exclusion of herbivores had large impacts on the plant community and thereby carbon cycling and storage, with substantially lower biomass and gross productivity where grazers have access. While carbon losses in the form of ecosystem respiration and decomposition were also higher in the absence of grazers, higher rates of net ecosystem exchange and increased soil C content suggest that overall carbon sequestration is increased when herbivores are excluded. This points toward grazer management as a potential tool for establishing robust vegetation communities in created wetlands and for accelerating the accumulation of soil C, a characteristic that often differentiates created from natural wetlands [7,8,54].
Plant communities were impacted by grazers throughout the growing season, suggesting that exclusion of megaherbivores over multiple years has a persistent influence on the wetlands. Caged plots were more diverse and consistently had higher plant cover and aboveground biomass. When converted to units of carbon, using the average of 42.5% C in plant tissue measured at the site (Table 2), peak growing season aboveground biomass after five growing seasons of grazer exclusion was 175 g C m compared to 75 g C m in control plots (Figure 6). The two to three fold increase in aboveground biomass and vegetation cover in caged plots is greater than the 25–60% increase in aboveground biomass in riparian wetlands protected from grazers reported by Veen et al. [55] and the 50% increase in reed stem density observed by Dingemans et al. [33] when geese were excluded from wetland plots. Likewise, Mulder and Ruess [56] reported a significant decrease in aboveground biomass in their grazed treatments in salt marshes. The relative increase in cover in caged plots was greater than observed in earlier reported values from this experiment [21], suggesting that the impact of grazers is cumulative over time with continued access to young wetland sites. Further, the higher vegetation cover (but not biomass) in caged plots in spring 2018 suggests that the effects of grazer exclusion carry over year to year, and in created wetlands, which typically have young plant communities with lower stem density and belowground rhizomal development, limiting grazing may encourage the growth and establishment of stable and diverse plant communities [57].
Belowground biomass was higher than that measured by Lodge and Tyler [21], suggesting that as the wetland is maturing, belowground biomass is increasing and will likely continue to contribute carbon stocks to the soil. In contrast to aboveground biomass, belowground biomass was only slightly, and not significantly influenced by grazer access. Lodge and Tyler [21] previously observed significantly higher belowground biomass in these same caged plots, indicating that more intensive sampling may strengthen our observed trend. Unlike measurements of aboveground biomass, our measurements of belowground biomass only occurred once during the year (October), potentially missing some impacts of grazers on belowground processes. A more detailed sampling approach, including seasonal sampling and species-level identification of belowground biomass, would enable better linkages between aboveground responses to herbivory and belowground C storage.
Shifts in vegetation dominance when grazers were excluded were consistent with the grazing preferences of waterfowl at the site. In uncaged plots, semi-desirable species were frequently damaged by grazing, such as S. latifolia, resulting in lower biomass. In contrast, some plants in the caged plots were able to grow to maturity and may eventually become less palatable to grazers [58]. These species included L. oryzoides and T. latifolia, which were virtually absent in open plots. In 2018, we also observed the emergence of N. odorata in the open plots, suggesting that the removal of other palatable species allowed expansion of surface-covering lilies that may lead to further shifts in ecosystem structure. Bagchi and Richi [38] made similar observations in grasslands, reporting shifts in vegetation dominance consistent with grazer preferences, with a higher abundance of more palatable plants and higher diversity in ungrazed plots. In a review of the environmental impacts of expanding goose populations, a dominant grazer in our system, Buij et al. [59] found that grazers not only reduce overall plant biomass, but also reduce plant diversity and modify the habitat.
Growing season CO fluxes in our system were comparable to other created/restored temperate emergent wetlands, with our estimated daily summer net CO uptake for caged plots of −5.2 g C m d (Figure 6), falling within the range of August CO uptake rates (−8.5 to −2.3 g C m d) (California; [60]) and our hourly uptake rates of −0.7 g C m h (caged) and −0.3 g C m h (uncaged) bracketing growing season static chamber flux values of −0.45–0.55 g C m h (Ohio; [61]). Changes in ecosystem CO fluxes in response to grazing tracked patterns in aboveground biomass, with higher aboveground biomass correlated with higher rates of GPP and ER. Increases in growing season GPP in response to grazer exclusion was higher than that of ER, resulting in 25–100% higher summer net CO uptake in caged plots. Higher temporal resolution of flux measurements would provide additional insights into the seasonality of grazer impacts on CO fluxes and enable a more detailed assessment of shifts in carbon uptake in response to grazer exclusion. The relationship between CO fluxes and plant cover confirms the strong influence of plant biomass on CO uptake [62], suggesting that management that impacts the establishment and growth of vegetation communities can have large effects on carbon storage in these systems. Similar results were seen following grazer exclusion in alpine meadows [41] and high arctic wet meadows [40], where significantly lower carbon uptake in grazed plots was attributed to the substantial reduction in aboveground biomass.
Decomposition rates varied strongly with plant litter type, suggesting that one of the most significant impacts of grazers on carbon cycling may be through the combined impact on species composition and total plant production. Variations in decomposition rates across species generally tracked differences in C:N, where species with the lowest C:N (N. odorata: 19.8 ± 0.2) decomposed fastest and the species with highest C:N (P. cordata: 37.3 ± 0.6) decomposed slowest. T. latifolia was the exception, with both low C:N and slow decomposition. In our system, shifts in species composition following grazer exclusion (e.g., Figure 2) contribute to slower decomposition rates. While the species with similar decomposition rates (S. latifolia, P. cordata) were more similar in biomass between treatments, the fast decomposing species, N. odorata, contributed <0.3% of the aboveground biomass in caged plots (<1 g m in 2018) compared to 9% in uncaged plots at the end of the growing season (13 g m in 2018). In contrast, the slower decomposing T. latifolia was only found in caged plots, with about 6% of the end of season biomass. While L. oryzoides (40% of end of season biomass in caged plots only) was not used in our decomposition study, its high C:N (35.9 ± 3.3) suggests persistence within the system. T. latifolia and L. oryzoides together contributed an additional 160 g m of relatively refractory material to caged plots in 2018. These species composition shifts, coupled with higher litter inputs associated with high aboveground biomass in caged plots will cascade over time to enhance the accumulation of soil carbon in the absence of grazers.
Our results support findings that changes in decomposition in response to grazing can arise from both changes in plant communities and alterations in the soil environment [42]. Grazer exclusion promoted decomposition of the most labile species in our study (N. odorata), suggesting that changes in soil environment due to grazing has the largest impact on more labile plant litter. In wetland ecosystems, high plant biomass can accelerate decomposition through two mechanisms [63], root oxygen loss creating aerobic sediment microsites [43,44] and the priming of the rhizosphere through the release of labile carbon from roots [64], thus facilitating the breakdown of plant litter in caged plots. It is important to note that N. odorata was not found in any caged plots, thus its higher decomposition rate in the absence of grazers did not impact overall decomposition rates. An additional impact of grazers on decomposition is changes in plant chemistry in response to grazing [42,65], which was not considered in our study. Plant responses to grazer can result in either increased [42] or decreased [66] C:N, which could exacerbate or reduce the patterns in decomposition observed in this study and bears further investigation.
A meta-analysis of the impacts of large grazers on carbon storage found that while data are more limited for wetlands, the response to grazers is similar to terrestrial ecosystems and experience reductions in soil carbon under grazing [67]. Overall carbon storage in the soil was increased >30% by grazer exclusion and carbon stored in belowground biomass was increased by >60% (Figure 6). While many wetland grazing studies focus on the impacts of mammalian grazers such as nutria (Myocastor coypus; e.g., [68]) or livestock (e.g., [69]), waterfowl grazing has been shown to reduce carbon storage in arctic tundra by a similar amount (35%; [70]). This pattern is consistent with grazing studies conducted across a range of ecosystems (e.g., North American, prairie [71]; Mongolian steppes [72]; Himalayan grasslands [38]). We measured belowground biomass in the top 20 cm of soil and soil C in the top 10 cm, and therefore may have underestimated overall belowground biomass and soil C, missing some impacts of grazing on belowground processes. However, grazer studies in other systems have found that the largest effects of grazer presence are observed in the soil surface (e.g., [73]), and therefore measurements in deeper soil layers are unlikely to significantly change our results.
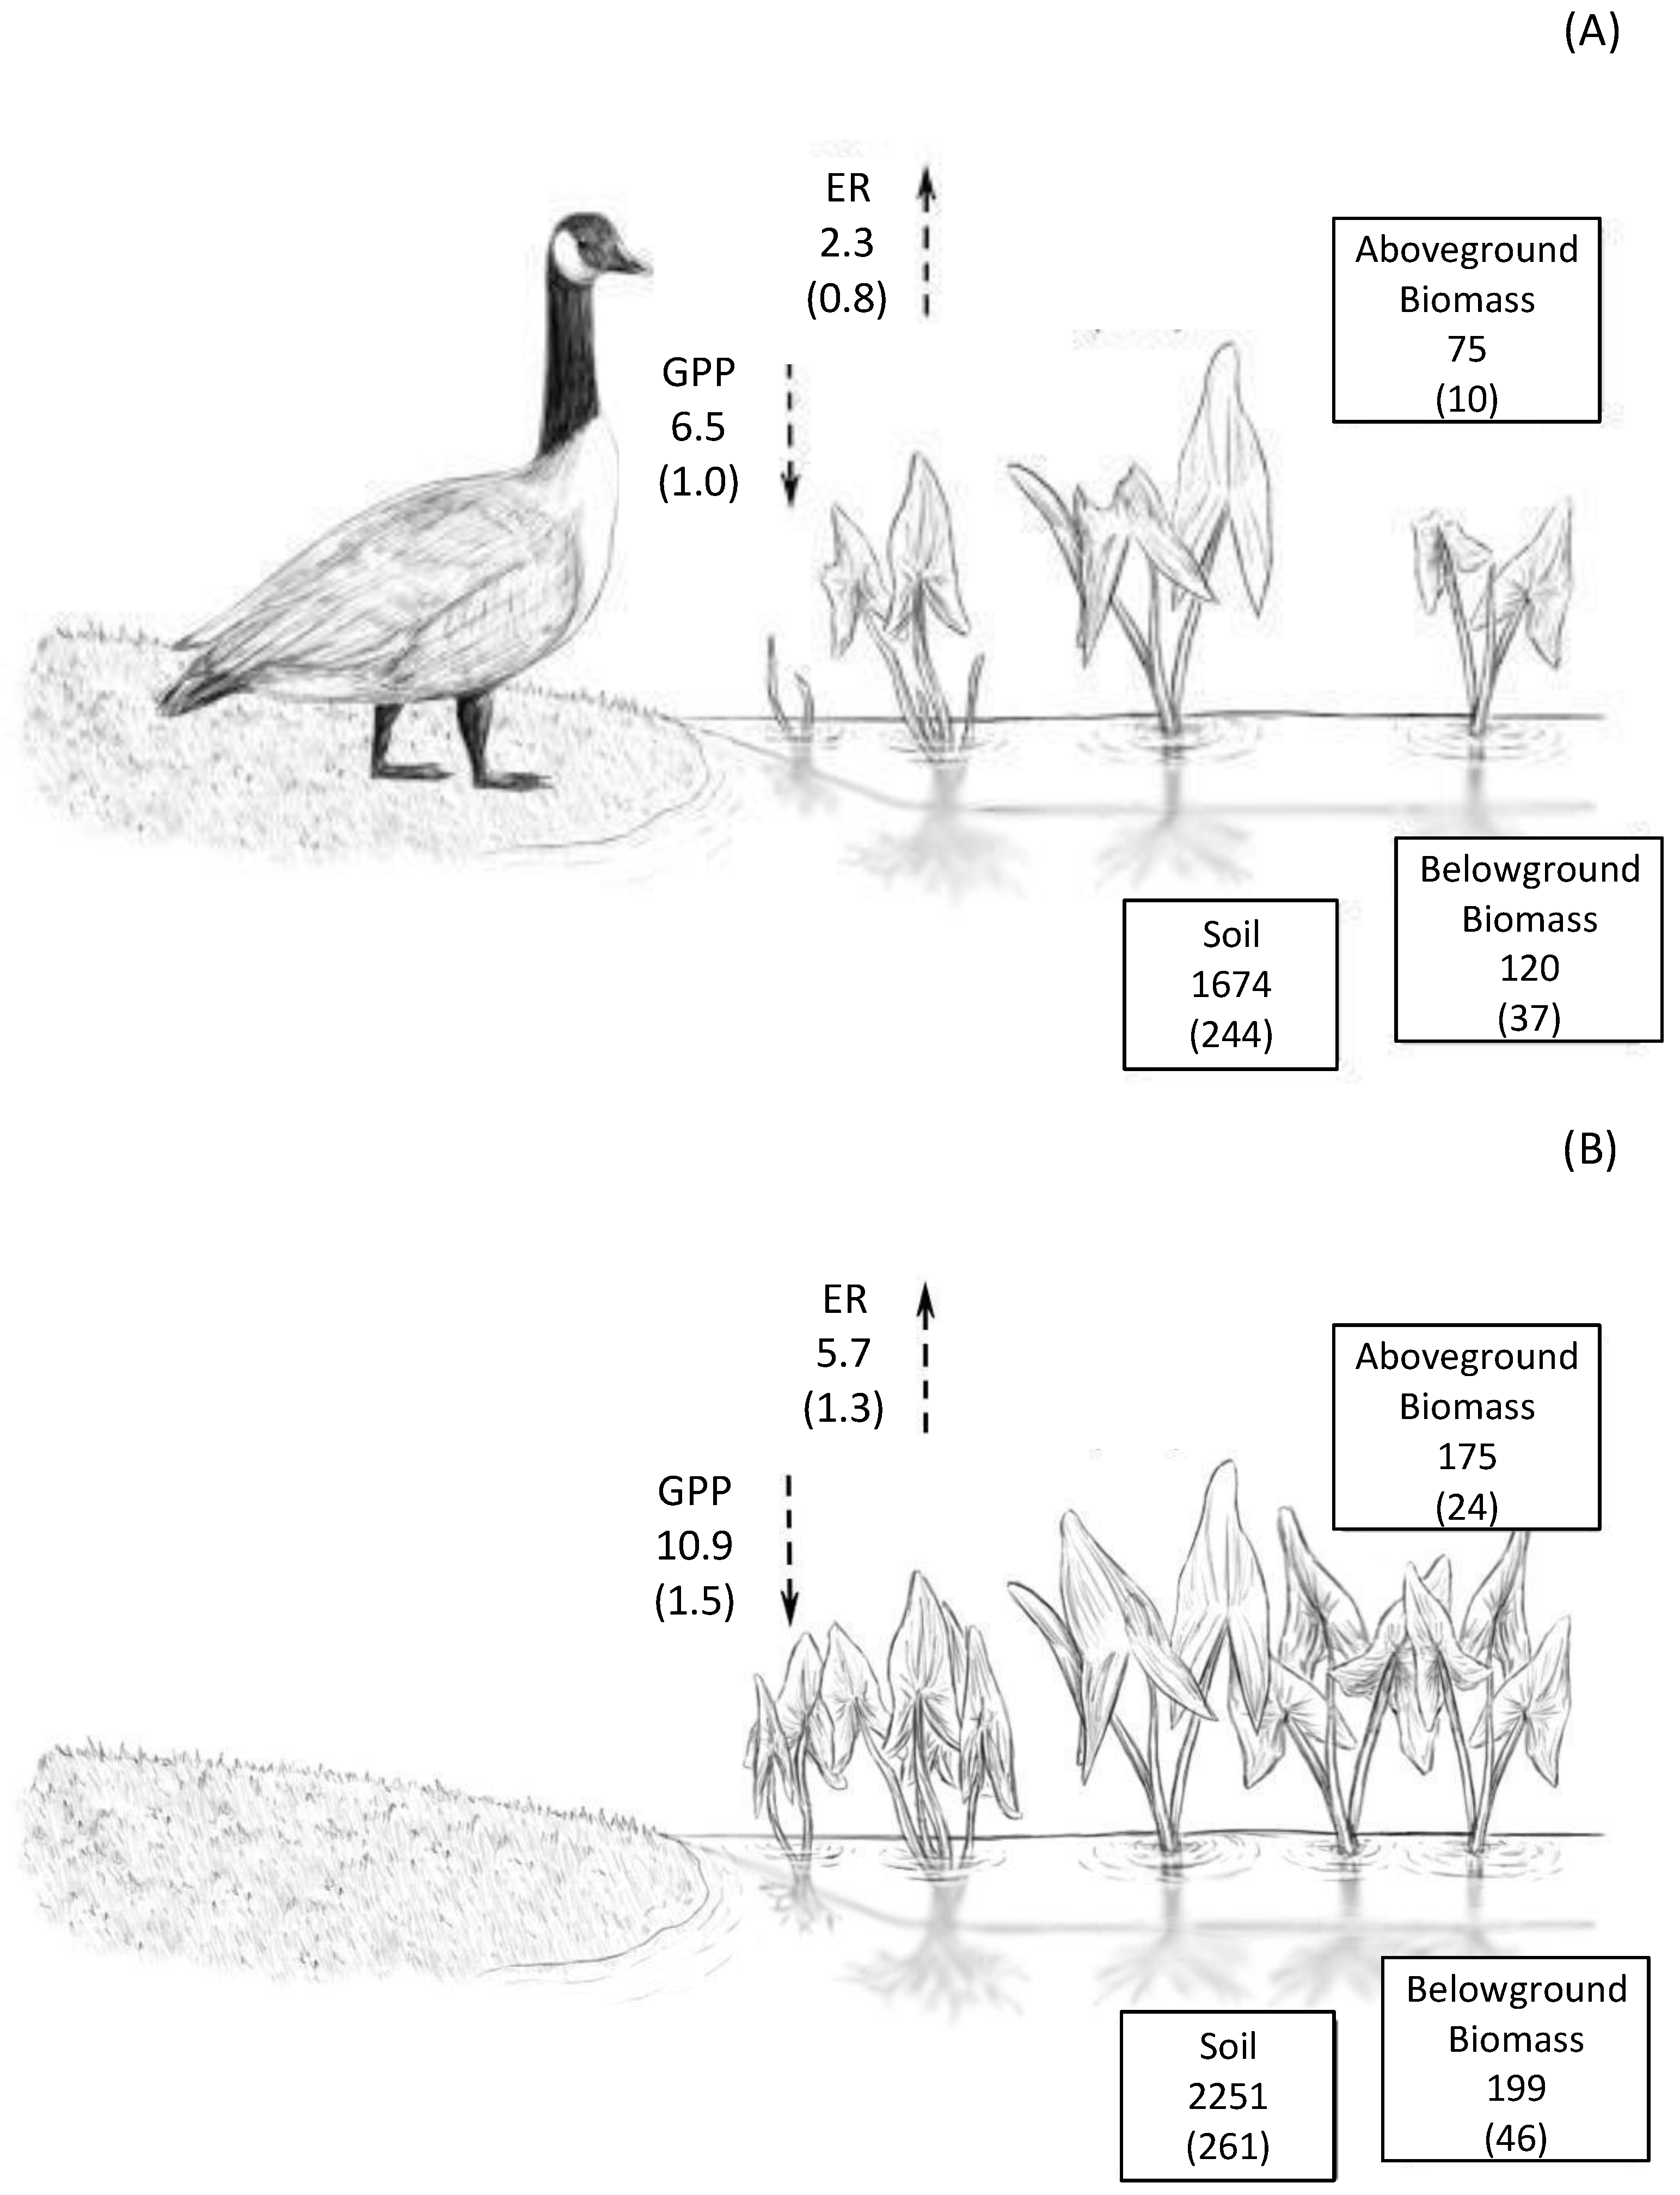
While most prior studies have evaluated the impact of grazing on mature systems, with perhaps greater resilience, the results here illustrate the strongly divergent trajectories of ecosystem development that may occur when grazing pressure is applied soon after construction of emergent freshwater wetlands and extended over several years. In this nascent created wetland, where hydrology supports high waterfowl populations, both carbon pools and carbon fluxes were significantly impacted by grazing (Figure 6). The substantially high C fluxes were in the absence of grazers - approximately 4 g C m d greater intake of atmospheric carbon into the wetland through gross photosynthesis-cascaded to an additional 750 g C m higher C in aboveground biomass, belowground biomass and soil pools after five growing seasons of grazer exclusion (Figure 6). Future trajectories may lead to slower development of emergent marsh structure, or transition to an alternate stable state dominated by submerged macrophytes. Thus, the impact of exclusion over longer time periods is worthy of future study to evaluate the persistence of these divergent trends in ecosystem development.
5. Conclusions
Grazing can significantly limit the carbon storage potential of created wetlands, underscoring the importance of managing waterfowl populations in newly created wetlands where vegetation communities are not fully established. As shifts in global climate alter behavior and migratory patterns of herbivorous waterfowl (e.g., [74]), a greater understanding of the interdependence between restoration planning and population dynamics of dominant species will be required. These results also highlight the need for frequent monitoring of not only plant populations and hydrology following wetland creation, but also the use (or overuse) of nascent systems by potentially damaging species. By limiting waterfowl numbers, and by extension grazing intensity, during the early stages of wetland development in created wetlands, a more stable and diverse plant community may form [35,36,37], maximizing potential C sequestration.
Supplementary Materials
The following are available online at https://0-www-mdpi-com.brum.beds.ac.uk/article/10.3390/land10080805/s1; Figure S1: Waterfowl observations June 2017 through November 2018; Figure S2: Water depth measured throughout the growing season (May–August) of 2017 to 2018; Figure S3: Vegetation cover during the 2017 and 2018 growing seasons; Figure S4: Grazer damage for each species normalized to species abundance; Table S1: Regression curves used to estimate aboveground biomass; Table S2: Results of analysis of variance on the effects and interactions of month (Mo), and treatment (Tr) for vegetation cover in 2017 and 2018.
Author Contributions
Conceptualization, A.C.T., C.K.M. and D.M.S.; methodology, A.C.T. and C.K.M.; formal analysis, A.C.T., C.K.M. and D.M.S.; investigation, D.M.S.; resources, A.C.T. and C.K.M.; writing—original draft preparation, D.M.S.; writing—review and editing, A.C.T. and C.K.M.; visualization, A.C.T., C.K.M. and D.M.S.; supervision, A.C.T. and C.K.M.; funding acquisition, A.C.T. and C.K.M. All authors have read and agreed to the published version of the manuscript.
Funding
This research was funded by Waste Management of New York and the Thomas H. Gosnell School of Life Sciences and the College of Science at the Rochester Institute of Technology.
Institutional Review Board Statement
Not applicable.
Informed Consent Statement
Not applicable.
Data Availability Statement
Not applicable.
Acknowledgments
We sincerely thank Waste Management of New York and the Thomas H. Gosnell School of Life Sciences and the College of Science at the Rochester Institute of Technology for funding this work. We are grateful to Bruce Cady for participating in grazer monitoring and to Kimberly Lodge for establishing the grazer experiment. We thank Ben Hamilton, Evan Squier, Michael McGowan, Briana Stringer, and Sydney VanWinkle for their assistance in the field and Nicole Fornof and Rebecca Zayatz for logistical support.
Conflicts of Interest
The authors declare no conflict of interest. The funders had no role in the design of the study; in the collection, analyses, or interpretation of data; in the writing of the manuscript, or in the decision to publish the results.
References
- Zedler, J.B.; Kercher, S. WETLAND RESOURCES: Status, Trends, Ecosystem Services, and Restorability. Annu. Rev. Environ. Resour. 2005, 30, 39–74. [Google Scholar] [CrossRef] [Green Version]
- Aerts, R.; Verhoeven, J.T.A.; Whigham, D.F. Plant-Mediated Controls On Nutrient Cycling in Temperate Fens and Bogs. Ecology 1999, 70, 2170–2181. [Google Scholar] [CrossRef]
- DeAngelis, D.L.; Bartell, S.M.; Brenkert, A.L. Effects of Nutrient Recycling and Food-Chain Length on Resilience. Am. Nat. 1989, 134, 778–805. [Google Scholar] [CrossRef]
- Costanza, R.; D’Arge, R.; de Groot, R.; Farber, S.; Grasso, M.; Hannon, B.; Limburg, K.; Naeem, S.; O’Neill, R.V.; Paruelo, J.; et al. The value of the world’s ecosystem services and natural capital. Nature 1997, 387, 253–260. [Google Scholar] [CrossRef]
- Chmura, G.L.; Anisfeld, S.C.; Cahoon, D.R.; Lynch, J.C. Global carbon sequestration in tidal, saline wetland soils. Glob. Biogeochem. Cycles 2003, 17, 1111. [Google Scholar] [CrossRef]
- Kayranli, B.; Scholz, M.; Mustafa, A.; Hedmark, Å. Carbon Storage and Fluxes within Freshwater Wetlands: A Critical Review. Wetlands 2010, 30, 111–124. [Google Scholar] [CrossRef]
- Campbell, D.A.; Cole, C.A.; Brooks, R.P. A comparison of created and natural wetlands in Pennsylvania, USA. Wetl. Ecol. Manag. 2002, 10, 41–49. [Google Scholar] [CrossRef]
- Fennessy, M.S.; Rokosch, A.; Mack, J.J. Patterns of plant decomposition and nutrient cycling in natural and created wetlands. Wetlands 2008, 28, 300–310. [Google Scholar] [CrossRef]
- Moreno-Mateos, D.; Power, M.E.; Comín, F.A.; Yockteng, R. Structural and functional loss in restored wetland ecosystems. PLoS Biol. 2012, 10, e1001247. [Google Scholar] [CrossRef] [PubMed] [Green Version]
- Moreno-Mateos, D.; Alberdi, A.; Morriën, E.; van der Putten, W.H.; Rodríguez-Uña, A.; Montoya, D. The long-term restoration of ecosystem complexity. Nat. Ecol. Evol. 2020, 4, 676–685. [Google Scholar] [CrossRef] [PubMed]
- Miller, R.L.; Fujii, R. Plant community, primary productivity, and environmental conditions following wetland re-establishment in the Sacramento-San Joaquin Delta, California. Wetl. Ecol. Manag. 2010, 18, 1–16. [Google Scholar] [CrossRef]
- Rothman, E.; Bouchard, V. Regulation of carbon processes by macrophyte species in a Great Lakes coastal wetland. Wetlands 2007, 27, 1134–1143. [Google Scholar] [CrossRef]
- Collins, M.E.; Kuehl, R. Organic Matter Accumulation and Organic Soils; Lewis Publishers: Boca Raton, FL, USA, 2000. [Google Scholar]
- Mitsch, W.; Gosselink, J. Wetlands; Wiley: New York, NY, USA, 2007. [Google Scholar]
- De Deyn, G.B.; Cornelissen, J.H.C.; Bardgett, R.D. Plant functional traits and soil carbon sequestration in contrasting biomes. Ecol. Lett. 2008, 11, 516–531. [Google Scholar] [CrossRef]
- Mitsch, W.J.; Bernal, B.; Nahlik, A.M.; Mander, Ü.; Zhang, L.; Anderson, C.J.; Jørgensen, S.E.; Brix, H. Wetlands, carbon, and climate change. Landsc. Ecol. 2013, 28, 583–597. [Google Scholar] [CrossRef]
- Yu, L.; Huang, Y.; Sun, F.; Sun, W. A synthesis of soil carbon and nitrogen recovery after wetland restoration and creation in the United States. Sci. Rep. 2017, 7, 1–9. [Google Scholar] [CrossRef] [PubMed] [Green Version]
- Hossler, K.; Bouchard, V. Soil development and establishment of carbon-based properties in created freshwater marshes. Ecol. Appl. 2010, 20, 539–553. [Google Scholar] [CrossRef] [PubMed]
- Murkin, H.R.; Murkin, E.J.; Ball, J.P. Avian Habitat Selection and Prairie Wetland Dynamics: A 10-Year Experiment. Ecol. Appl. 1997, 7, 1144–1159. [Google Scholar] [CrossRef]
- Lor, S.; Malecki, R.A. Breeding Ecology and Nesting Habitat Associations of Five Marsh Bird Species in Western New York. Waterbirds 2006, 29, 427–436. [Google Scholar] [CrossRef]
- Lodge, K.A.; Tyler, A.C. Divergent impact of grazing on plant communities of created wetlands with varying hydrology and antecedent land use. Wetl. Ecol. Manag. 2020, 28, 797–813. [Google Scholar] [CrossRef]
- Isola, C.R.; Colwell, M.A.; Taft, O.W.; Safran, R.J. Interspecific Differences in Habitat Use of Shorebirds and Waterfowl Foraging in Managed Wetlands of California’s San Joaquin Valley. Waterbirds 2000, 23, 196–203. [Google Scholar]
- Ankney, C.D. An embarrassment of riches: Too many geese. J. Wildl. Manag. 1996, 60, 217–223. [Google Scholar] [CrossRef]
- Lauridsen, T.L.; Jeppesen, E.; Andersen, F.Ø. Colonization of submerged macrophytes in shallow fish manipulated Lake Væng: Impact of sediment composition and waterfowl grazing. Aquat. Bot. 1993, 46, 1–15. [Google Scholar] [CrossRef]
- Smith III, T.J.; Odum, W.E. The effects of grazing by snow geese on coastal salt marshes. Ecology 1981, 62, 98–106. [Google Scholar] [CrossRef]
- Silliman, B.R.; Zieman, J.C. Top-down control of Spartina alterniflora production by periwinkle grazing in a Virginia salt marsh. Ecology 2001, 82, 2830–2845. [Google Scholar] [CrossRef]
- Silliman, B.R.; Bertness, M.D. A trophic cascade regulates salt marsh primary production. Proc. Natl. Acad. Sci. USA 2002, 99, 10500–10505. [Google Scholar] [CrossRef] [Green Version]
- Srivastava, D.S.; Jefferies, R. A positive feedback: Herbivory, plant growth, salinity, and the desertification of an Arctic salt-marsh. J. Ecol. 1996, 84, 31–42. [Google Scholar] [CrossRef]
- Smith, L.M.; Kadlec, J.A. Fire and herbivory in a Great Salt Lake marsh. Ecology 1985, 66, 259–265. [Google Scholar] [CrossRef]
- Jefferies, R.L.; Jano, A.P.; Abraham, K.F. A biotic agent promotes large-scale catastrophic change in the coastal marshes of Hudson Bay. J. Ecol. 2006, 94, 234–242. [Google Scholar] [CrossRef]
- Jefferies, R.L.; Rockwell, R.F. Foraging geese, vegetation loss and soil degradation in an Arctic salt marsh. Appl. Veg. Sci. 2002, 5, 7–16. [Google Scholar] [CrossRef]
- Ström, L.; Mastepanov, M.; Christensen, T.R. Species-specific Effects of Vascular Plants on Carbon Turnover and Methane Emissions from Wetlands. Biogeochemistry 2005, 75, 65–82. [Google Scholar] [CrossRef]
- Dingemans, B.J.J.; Bakker, E.S.; Bodelier, P.L.E. Aquatic herbivores facilitate the emission of methane from wetlands. Ecology 2011, 92, 1166–1173. [Google Scholar] [CrossRef]
- Winton, R.S.; Richardson, C.J. Top-down control of methane emission and nitrogen cycling by waterfowl. Ecology 2017, 98, 265–277. [Google Scholar] [CrossRef] [PubMed]
- Lubchenco, J. Littornia and Fucus: Effects of Herbivores, Substratum Heterogeneity, and Plant Escapes During Succession. Ecology 1983, 64, 1116–1123. [Google Scholar] [CrossRef]
- Elaine Evers, D.; Sasser, C.E.; Gosselink, J.G.; Fuller, D.A.; Visser, J.M. The impact of vertebrate herbivores on wetland vegetation in Atchafalaya Bay, Louisiana. Estuaries 1998, 21, 1–13. [Google Scholar] [CrossRef]
- Kennedy, M.A.; Heck, K.L.; Michot, T.C. Impacts of wintering redhead ducks (Aythya americana) on seagrasses in the northern Gulf of Mexico. J. Exp. Mar. Biol. Ecol. 2018, 506, 42–48. [Google Scholar] [CrossRef]
- Bagchi, S.; Ritchie, M.E. Introduced grazers can restrict potential soil carbon sequestration through impacts on plant community composition. Ecol. Lett. 2010, 13, 959–968. [Google Scholar] [CrossRef] [PubMed]
- Speed, J.D.; Woodin, S.; Tømmervik, H.; Van der Wal, R. Extrapolating herbivore-induced carbon loss across an arctic landscape. Polar Biol. 2010, 33, 789–797. [Google Scholar] [CrossRef]
- Sjögersten, S.; van der Wal, R.; Loonen, M.J.; Woodin, S.J. Recovery of ecosystem carbon fluxes and storage from herbivory. Biogeochemistry 2011, 106, 357–370. [Google Scholar] [CrossRef] [Green Version]
- Hirota, M.; Tang, Y.; Hu, Q.; Kato, T.; Hirata, S.; Mo, W.; Cao, G.; Mariko, S. The potential importance of grazing to the fluxes of carbon dioxide and methane in an alpine wetland on the Qinghai-Tibetan Plateau. Atmos. Environ. 2005, 39, 5255–5259. [Google Scholar] [CrossRef]
- Wang, Z.; Yuan, X.; Wang, D.; Zhang, Y.; Zhong, Z.; Guo, Q.; Feng, C. Large herbivores influence plant litter decomposition by altering soil properties and plant quality in a meadow steppe. Sci. Rep. 2018, 8, 1–12. [Google Scholar] [CrossRef]
- Colmer, T. Long-distance transport of gases in plants: A perspective on internal aeration and radial oxygen loss from roots. Plant Cell Environ. 2003, 26, 17–36. [Google Scholar] [CrossRef] [Green Version]
- Wolf, A.A.; Drake, B.G.; Erickson, J.E.; Megonigal, J.P. An oxygen-mediated positive feedback between elevated carbon dioxide and soil organic matter decomposition in a simulated anaerobic wetland. Glob. Chang. Biol. 2007, 13, 2036–2044. [Google Scholar] [CrossRef]
- Lodge, K.A. Hydrology, Nutrient Availability, and Herbivory Interacting to Control Ecosystem Functions and Services in Created Emergent Freshwater Wetlands. Master’s Thesis, Rochester Institute of Technology, ProQuest Dissertations Publishing, Rochester, NY, USA, 2017. [Google Scholar]
- Bakker, J.P. The impact of grazing on plant communities, plant populations and soil conditions on salt marshes. Vegetatio 1985, 62, 391–398. [Google Scholar] [CrossRef]
- Koh, H.S.; Ochs, C.A.; Yu, K. Hydrologic gradient and vegetation controls on CH4 and CO2 fluxes in a spring-fed forested wetland. Hydrobiologia 2009, 630, 271–286. [Google Scholar] [CrossRef]
- Brinson, M.M.; Lugo, A.E.; Brown, S. Primary Productivity, Decomposition and Consumer Activity in Freshwater Wetlands. Annu. Rev. Ecol. Syst. 1981, 12, 123–161. [Google Scholar] [CrossRef]
- Wang, H.; Chen, Z.X.; Zhang, X.Y.; Zhu, S.X.; Ge, Y.; Chang, S.X.; Zhang, C.B.; Huang, C.C.; Chang, J. Plant Species Richness Increased Belowground Plant Biomass and Substrate Nitrogen Removal in a Constructed Wetland. CLEAN Soil Air Water 2013, 41, 657–664. [Google Scholar] [CrossRef]
- Chen, J.; Wang, Q.; Li, M.; Liu, F.; Li, W. Does the different photosynthetic pathway of plants affect soil respiration in a subtropical wetland? Ecol. Evol. 2016, 6, 8010–8017. [Google Scholar] [CrossRef] [PubMed]
- Deghi, G.S.; Ewel, K.C.; Mitsch, W.J. Effects of Sewage Effluent Application on Litter Fall and Litter Decomposition in Cypress Swamps. J. Appl. Ecol. 1980, 17, 397–408. [Google Scholar] [CrossRef]
- Moorhead, D.L.; Currie, W.S.; Rastetter, E.B.; Parton, W.J.; Harmon, M.E. Climate and litter quality controls on decomposition: An analysis of modeling approaches. Glob. Biogeochem. Cycles 1999, 13, 575–589. [Google Scholar] [CrossRef] [Green Version]
- Carroll, P.; Crill, P. Carbon balance of a temperate poor fen. Glob. Biogeochem. Cycles 1997, 11, 349–356. [Google Scholar] [CrossRef]
- Hossler, K.; Bouchard, V.; Fennessy, M.S.; Frey, S.D.; Anemaet, E.; Herbert, E. No-net-loss not met for nutrient function in freshwater marshes: Recommendations for wetland mitigation policies. Ecosphere 2011, 2, 1–36. [Google Scholar] [CrossRef]
- Veen, G.; Sarneel, J.M.; Ravensbergen, L.; Huig, N.; van Paassen, J.; Rip, W.; Bakker, E.S. Aquatic grazers reduce the establishment and growth of riparian plants along an environmental gradient. Freshw. Biol. 2013, 58, 1794–1803. [Google Scholar] [CrossRef]
- Mulder, C.P.H.; Ruess, R.W. Effects of Herbivory on Arrowgrass: Interactions Between Geese, Neighboring Plants, and Abiotic Factors. Ecol. Monogr. 1998, 68, 275–293. [Google Scholar] [CrossRef]
- Myers, R.S.; Shaffer, G.P.; Llewellyn, D.W. Baldcypress (Taxodium distichum (L.) Rich.) restoration in southeast Louisiana: The relative effects of herbivory, flooding, competition, and macronutrients. Wetlands 1995, 15, 141–148. [Google Scholar] [CrossRef]
- Goranson, C.E.; Ho, C.K.; Pennings, S.C. Environmental gradients and herbivore feeding preferences in coastal salt marshes. Oecologia 2004, 140, 591–600. [Google Scholar] [CrossRef]
- Buij, R.; Melman, T.C.; Loonen, M.J.; Fox, A.D. Balancing ecosystem function, services and disservices resulting from expanding goose populations. Ambio 2017, 46, 301–318. [Google Scholar] [CrossRef] [PubMed] [Green Version]
- Anderson, F.E.; Bergamaschi, B.; Sturtevant, C.; Knox, S.; Hastings, L.; Windham-Myers, L.; Detto, M.; Hestir, E.L.; Drexler, J.; Miller, R.L.; et al. Variation of energy and carbon fluxes from a restored temperate freshwater wetland and implications for carbon market verification protocols. J. Geophys. Res. Biogeosci. 2016, 121, 777–795. [Google Scholar] [CrossRef]
- Altor, A.E.; Mitsch, W.J. Pulsing hydrology, methane emissions and carbon dioxide fluxes in created marshes: A 2-year ecosystem study. Wetlands 2008, 28, 423–438. [Google Scholar] [CrossRef]
- Valach, A.C.; Kasak, K.; Hemes, K.S.; Anthony, T.L.; Dronova, I.; Taddeo, S.; Silver, W.L.; Szutu, D.; Verfaillie, J.; Baldocchi, D.D. Productive wetlands restored for carbon sequestration quickly become net CO2 sinks with site-level factors driving uptake variability. PLoS ONE 2021, 16, e0248398. [Google Scholar] [CrossRef] [PubMed]
- Mueller, P.; Jensen, K.; Megonigal, J.P. Plants mediate soil organic matter decomposition in response to sea level rise. Glob. Chang. Biol. 2016, 22, 404–414. [Google Scholar] [CrossRef] [PubMed]
- Blagodatskaya, E.; Kuzyakov, Y. Mechanisms of real and apparent priming effects and their dependence on soil microbial biomass and community structure: Critical review. Biol. Fertil. Soils 2008, 45, 115–131. [Google Scholar] [CrossRef]
- Bardgett, R.D.; Wardle, D.A.; Yeates, G.W. Linking above-ground and below-ground interactions: How plant responses to foliar herbivory influence soil organisms. Soil Biol. Biochem. 1998, 30, 1867–1878. [Google Scholar] [CrossRef]
- He, M.; Zhou, G.; Yuan, T.; van Groenigen, K.J.; Shao, J.; Zhou, X. Grazing intensity significantly changes the C: N: P stoichiometry in grassland ecosystems. Glob. Ecol. Biogeogr. 2020, 29, 355–369. [Google Scholar] [CrossRef]
- Tanentzap, A.J.; Coomes, D.A. Carbon storage in terrestrial ecosystems: Do browsing and grazing herbivores matter? Biol. Rev. 2012, 87, 72–94. [Google Scholar] [CrossRef] [PubMed]
- Sasser, C.E.; Holm, G.O.; Evers-Hebert, E.; Shaffer, G.P. The nutria in Louisiana: A current and historical perspective. In Mississippi Delta Restoration; Springer: Berlin, Germany, 2018; pp. 39–60. [Google Scholar]
- Yu, O.; Chmura, G. Soil carbon may be maintained under grazing in a St Lawrence Estuary tidal marsh. Environ. Conserv. 2009, 36, 312–320. [Google Scholar] [CrossRef]
- Van Der WAL, R.; Sjögersten, S.; Woodin, S.J.; Cooper, E.J.; Jónsdóttir, I.S.; Kuijper, D.; Fox, T.A.; Huiskes, A. Spring feeding by pink-footed geese reduces carbon stocks and sink strength in tundra ecosystems. Glob. Chang. Biol. 2007, 13, 539–545. [Google Scholar] [CrossRef]
- Frank, A.B.; Tanaka, D.L.; Hofmann, L.; Follett, R.F. Soil carbon and nitrogen of Northern Great Plains grasslands as influenced by long-term grazing. Rangel. Ecol. Manag. J. Range Manag. Arch. 1995, 48, 470–474. [Google Scholar] [CrossRef]
- Cui, X.; Wang, Y.; Niu, H.; Wu, J.; Wang, S.; Schnug, E.; Rogasik, J.; Fleckenstein, J.; Tang, Y. Effect of long-term grazing on soil organic carbon content in semiarid steppes in Inner Mongolia. Ecol. Res. 2005, 20, 519–527. [Google Scholar] [CrossRef]
- Elschot, K.; Bakker, J.P.; Temmerman, S.; van de Koppel, J.; Bouma, T.J. Ecosystem engineering by large grazers enhances carbon stocks in a tidal salt marsh. Mar. Ecol. Prog. Ser. 2015, 537, 9–21. [Google Scholar] [CrossRef]
- Clermont, J.; Réale, D.; Giroux, J.F. Plasticity in laying dates of Canada Geese in response to spring phenology. Ibis 2018, 160, 597–607. [Google Scholar] [CrossRef]
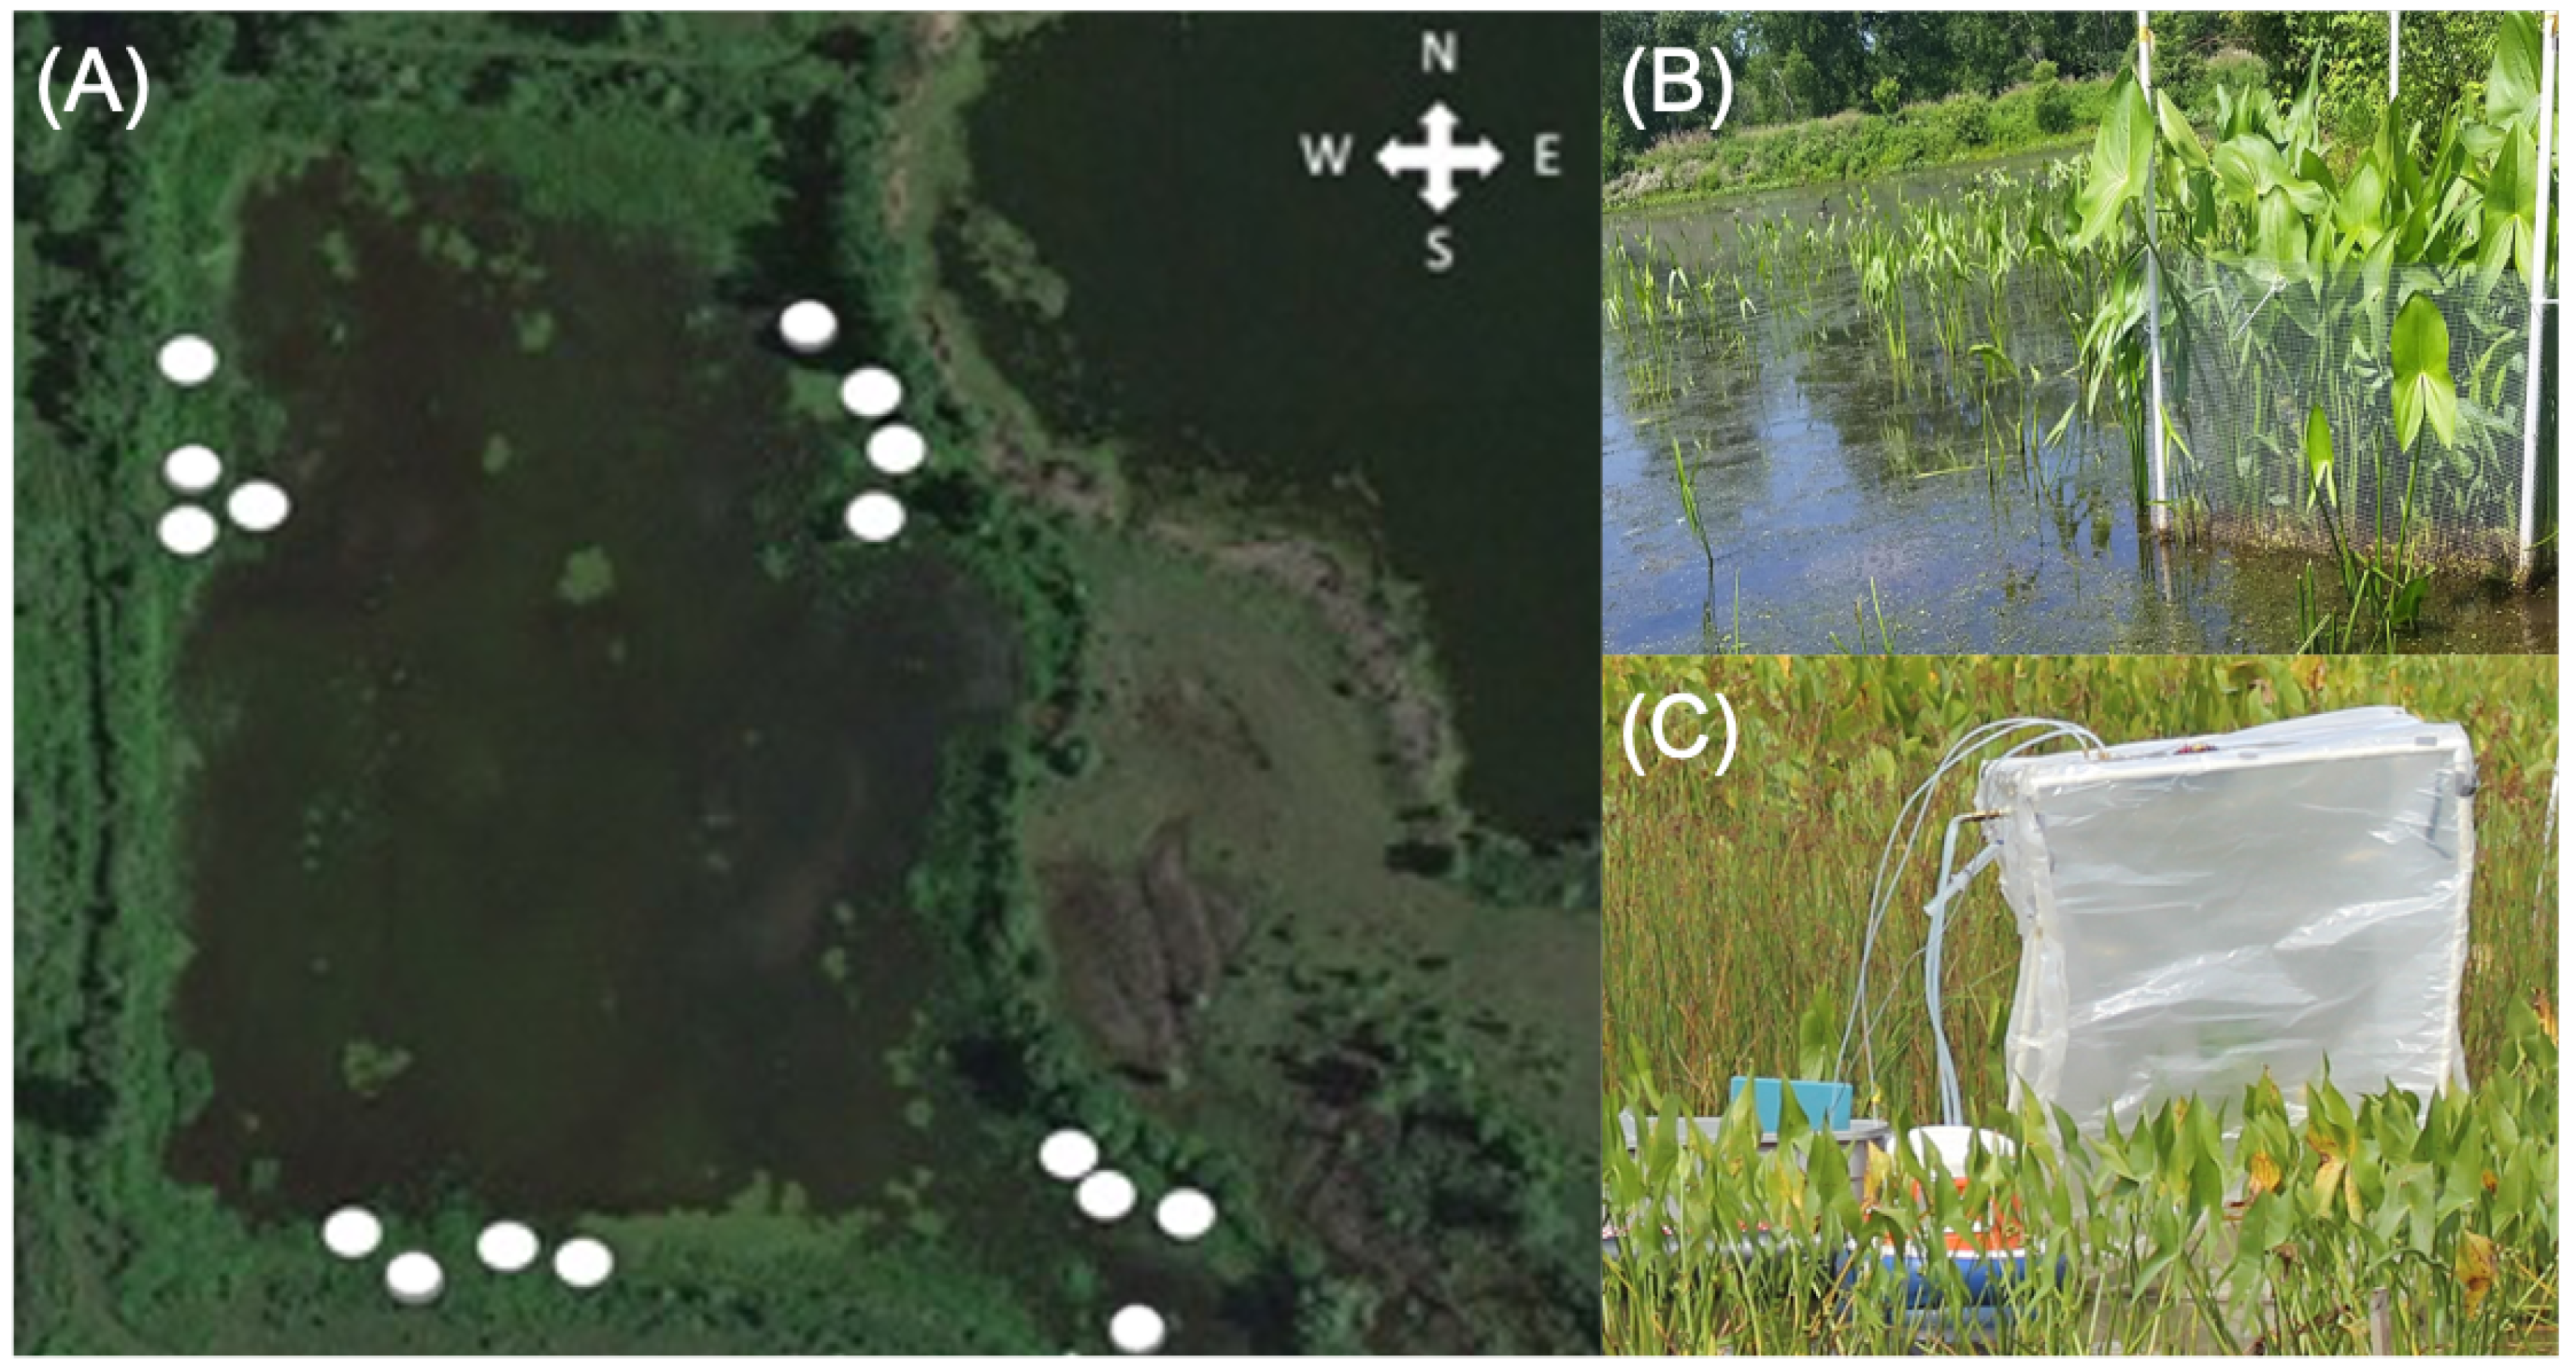
Figure 1.
Experimental design at the North Pool of the Western Wetland complex at High Acres Nature Area in Western New York. (A) The site was divided into four blocks and the white markers indication locations of pairs of caged and uncaged plots, (B) cages were 1 m and constructed of hardware cloth (photo credit: Kimberly Lodge), and (C) gas flux chambers were placed over the plots during measurements and were constructed from pvc pipe, clear polycarbonate sheeting and polyethylene greenhouse film that was rolled into the water and secured at the sediment surface (photo credit: Benjamin Hamilton.).

Figure 2.
Aboveground biomass of dominant species during the (A) 2017 and (B) 2018 growing season for caged and uncaged treatments. Biomass of minor species, with no value > 2% of the total biomass in any season were excluded. These species are: Potamogeton crispus, Echinochloa crus-galli, Polygonum persicaria, and Carex sp. Error bars are the standard error for the total biomass in each season and treatment (n = 16). Stars indicate significant differences between grazer treatments (** p < 0.001) for 2017 where no interaction between season and treatment was found. Unique letters above bars in 2018 indicate statistically distinct values for the interaction between grazer treatment and season (p < 0.01).

Figure 3.
Decomposition rate of the four dominant macrophytes in caged (grey) and uncaged (white) plots. There was a significant interaction between species and treatment, and letters indicate statistical differences between average k-values, p < 0.01.
Figure 3.
Decomposition rate of the four dominant macrophytes in caged (grey) and uncaged (white) plots. There was a significant interaction between species and treatment, and letters indicate statistical differences between average k-values, p < 0.01.

Figure 4.
Net ecosystem exchange (NEE), ecosystem respiration (ER) and gross primary production (GPP) in 2017 (A) and 2018 (B) for caged (grey) and uncaged (white) treatments. Summer measurements were taken in the period June–July, fall measurements were taken in the period August–September. Stars indicate significant differences between caged and uncaged plots (p < 0.05) within a season, where there was a significant interaction between season and treatment.

Figure 5.
Relationship between peak growing season (July) aboveground biomass and (A) ecosystem respiration (ER) and (B) gross primary production (GPP). Regression analysis includes data from all plots and years in which both biomass and gas fluxes were measured (n = 31).
Figure 5.
Relationship between peak growing season (July) aboveground biomass and (A) ecosystem respiration (ER) and (B) gross primary production (GPP). Regression analysis includes data from all plots and years in which both biomass and gas fluxes were measured (n = 31).

Figure 6.
Estimated peak growing season carbon budget with (A) and after 4 years without (B) grazing. Average values of each variable are listed with standard error in parentheses, with values taken from caged and uncaged plots during the peak of the growing season (July) following five growing seasons of grazer exclusion (2018). Carbon pools are denoted by boxes, with units of g C m; carbon fluxes are denoted by dashed arrows, with units of g C m day.


Table 1.
Results of analysis of variance examining the effect of date (May, June, July, August or summer, fall) and grazing treatment (caged, uncaged) on aboveground biomass, gross primary productivity (GPP), ecosystem respiration (ER) and net ecosystem exchange (NEE) measured in 2017 and 2018. Significant p-values are bolded.
| Variable | Date | Treatment | Dt × Tr | |||
|---|---|---|---|---|---|---|
| F | p | F | p | F | p | |
| Aboveground biomass 2017 | F = 20.5 | p < 0.0001 | F = 17.0 | p < 0.0001 | F = 2.6 | p = 0.08 |
| Aboveground biomass 2018 | F = 34.2 | p< 0.0001 | F = 35.7 | p< 0.0001 | F = 4.9 | p= 0.003 |
| GPP 2017 | F = 23.2 | p< 0.0001 | F = 11.6 | p= 0.002 | F = 6.5 | p= 0.02 |
| GPP 2018 | F = 7.7 | p= 0.01 | F = 4.0 | p = 0.06 | F = 3.9 | p = 0.06 |
| ER 2017 | F = 7.7 | p= 0.01 | F = 6.4 | p= 0.02 | F = 0.01 | p = 0.9 |
| ER 2018 | F = 0.003 | p = 0.95 | F = 5.1 | p= 0.03 | F = 3.1 | p = 0.09 |
| NEE 2017 | F = 17.4 | p= 0.0003 | F = 7.5 | p= 0.01 | F = 7.5 | p= 0.01 |
| NEE 2018 | F = 10.4 | p= 0.003 | F = 2.7 | p = 0.1 | F = 3.6 | p = 0.07 |
Table 2.
Elemental composition of dominant plant species at the study site and belowground biomass and soil from caged and uncaged plots, mean ± SE. Bold values indicate significant differences betwen caged an uncaged plots.
Table 2.
Elemental composition of dominant plant species at the study site and belowground biomass and soil from caged and uncaged plots, mean ± SE. Bold values indicate significant differences betwen caged an uncaged plots.
| Variable | %C | %N | C:N |
|---|---|---|---|
| Vegetation | |||
| S. latifolia | 42.0 ± 0.01 | 2.0 ± 0.05 | 24.9 ± 0.6 |
| N. odorata | 41.9 ± 0.23 | 2.5 ± 0.01 | 19.8 ± 0.2 |
| T. latifolia | 44.4 ± 0.14 | 2.1 ± 0.08 | 24.6 ± 0.8 |
| P. cordata | 41.2 ±0.07 | 1.3 ± 0.02 | 37.3 ± 0.6 |
| L. oryzoides | 43.1 ± 0.03 | 1.4 ± 0.13 | 35.9 ± 3.3 |
| Belowground biomass | |||
| Caged | 35.9 ± 1.66 | 1.6 ± 0.07 | 26.0 ± 1.3 |
| Uncaged | 35.5 ± 2.00 | 1.6 ± 0.14 | 25.7 ± 1.7 |
| Soil | |||
| Caged | 6.5 ± 0.33 | 0.5 ± 0.13 | 19.7 ± 0.7 |
| Uncaged | 5.1 ± 0.36 | 0.3 ± 0.02 | 20.8 ± 0.7 |
Publisher’s Note: MDPI stays neutral with regard to jurisdictional claims in published maps and institutional affiliations. |
© 2021 by the authors. Licensee MDPI, Basel, Switzerland. This article is an open access article distributed under the terms and conditions of the Creative Commons Attribution (CC BY) license (https://creativecommons.org/licenses/by/4.0/).
Share and Cite
MDPI and ACS Style
Spangler, D.M.; Tyler, A.C.; McCalley, C.K. Effects of Grazer Exclusion on Carbon Cycling in Created Freshwater Wetlands. Land 2021, 10, 805. https://0-doi-org.brum.beds.ac.uk/10.3390/land10080805
AMA Style
Spangler DM, Tyler AC, McCalley CK. Effects of Grazer Exclusion on Carbon Cycling in Created Freshwater Wetlands. Land. 2021; 10(8):805. https://0-doi-org.brum.beds.ac.uk/10.3390/land10080805
Chicago/Turabian StyleSpangler, Delanie M., Anna Christina Tyler, and Carmody K. McCalley. 2021. "Effects of Grazer Exclusion on Carbon Cycling in Created Freshwater Wetlands" Land 10, no. 8: 805. https://0-doi-org.brum.beds.ac.uk/10.3390/land10080805
Note that from the first issue of 2016, this journal uses article numbers instead of page numbers. See further details here.