Article

The Differentiation in Cultivated Land Quality between Modern Agricultural Areas and Traditional Agricultural Areas: Evidence from Northeast China

1
School of Public Administration and Law, Northeast Agricultural University, Harbin 150030, China
2
Land Remote Sensing Big Data Technology Innovation Center, Harbin 150030, China
3
School of Water Conservancy and Civil Engineering, Northeast Agricultural University, Harbin 150030, China
4
School of Public Administration, China University of Geosciences, Wuhan 430074, China
5
College of Resources and Environmental Economics, Inner Mongolia University of Finance and Economics, Hohhot 010070, China
*
Author to whom correspondence should be addressed.
These authors contributed equally to this work.
Submission received: 17 July 2021 / Revised: 7 August 2021 / Accepted: 10 August 2021 / Published: 11 August 2021

Abstract

:
Many studies of cultivated land use have focused on evaluating land quality. However, these studies rarely compare cultivated land quality (CLQ) between modern agricultural areas (MA) and traditional agricultural areas (TA). Thus, policymakers sometimes experience difficulties utilizing existing CLQ theories in CLQ improvement, especially in developing countries experiencing the transformation from traditional to modern agriculture. The objective of this study was to build a comprehensive hierarchical framework to compare the CLQ in MA and TA from the multidimensional perspectives of fertility, project, landscape, and ecology. An empirical analysis was conducted in Fujin City, Heilongjiang Province, Northeast China. The results showed that comprehensive CLQ in MA is better than that in TA, but individual cultivated land quality results are not the same as comprehensive quality. Specifically, project, landscape, and ecology quality in MA are better than in TA. However, fertility quality in MA is still worse. Moreover, the CLQ in MA tends to be more consistent in a small range, while the spatial pattern of CLQ in TA is disordered. We then argue that these results should be associated with different management modes and agrarian property systems between MA and TA. Based on our findings, four suggestions were generated to improve CLQ. Overall, this study provides a new comprehensive insight for understanding CLQ, and the framework, method, and findings of this study can help increase the effectiveness of CLQ improvements.

1. Introduction

The world is facing tremendous pressures related to food shortages and the achievement of the Sustainable Development Goal of Zero Hunger [1]. By 2020, 690 million people worldwide were suffering from hunger, and that number is expected to exceed 840 million by 2030 [2,3]. As the population grows unceasingly, at least 13 billion tons of extra food a year will feed an estimated 2 billion people by 2050 [4,5]. This massive demand for food is affecting cultivated land productivity and sustainable food production. Cultivated land quality (CLQ), an essential attribute of cultivated land associated with food production, is expected to have crucial impacts on regional food security [6,7,8,9]. Thus, to better protect food security, the improvement of CLQ has been increasingly advocated.
Different actionable measures have been developed to improve CLQ in hungry regions and food-starved cities, including the establishment of a sustainable food production system [10], the creation of a disaster-resistant cultivating method [11], adaptation to climate change of a cultivated land ecosystem [12], and the fertilization of soil [13,14]. The achievement of a high and stable yield in cultivated land successfully verifies the critical impacts of these activities on CLQ [15,16]. However, scholars are also making an effort to measure CLQ quantitatively. Constructing a comprehensive index system is a general approach that has been used to measure CLQ in previous studies and some international programs, such as FAO’s Land Evaluation Program [17,18,19], Land Evaluation and Site Assessment (LESA) [20,21,22], Land Quality Indicators (LQIs) [23,24], and Sustainable Land Use Management Program [25,26]. Furthermore, a theoretical framework for CLQ based on connotation or procedure has been introduced to clarify the index systems of CLQ from single or multiple dimensions [27,28,29,30,31]. Methodologically, an analytic hierarchy process (AHP) [32], principal component analysis (PCA) [33], and factor analysis (FA) [34] have been used to extract index rules [35,36]. Moreover, these methods have effectively evaluated CLQ in China and other countries where the cultivated land per capita was low [35,37].
However, challenges remain for developing countries when evaluating CLQ using these various index systems [38]. China, for example, has evaluated CLQ from different dimensions according to the government’s varied management goals [39]. Specifically, the land management department, agricultural ministry, and environmental authority have evaluated CLQ from the perspectives of land use, soil fertility, and land pollution, respectively [40,41,42]. These evaluation systems focused on identifying farmland productivity may be suitable for evaluating the relationship between yield and CLQ, but they have so far failed to take the nature, economy, and ecology conditions of cultivated land into consideration.
CLQ is usually a comprehensive concept that is considered a physical geo-socio-economic complex composed of climate, soil, parent material, topography, hydrology, vegetation, and human activities [3]. Many studies continue to argue that solely focusing on productivity in the absence of other factors (e.g., natural calamities) may not provide sustainable support for agriculture [43]. However, engineering measures can guarantee a high and stable yield from high-standard cultivated land regardless of drought and flood from a modernized agricultural standpoint [44,45]. Notably, to transform medium- and low-yield cultivated land into high-standard cultivated land, China has implemented a master plan for said high-standard cultivated land, and has promoted the protection of the quantity, quality, and ecology of cultivated land [46,47,48]. As of 2021, more than 53.33 million hectares of concentrated contiguous high-standard cultivated land with a sound ecology have been developed [49]. These achievements show that multiple departments’ cooperation is conducive to evaluating CLQ in a comprehensive manner. It is vital to evaluate CLQ from multidimensional perspectives to provide systematic knowledge for improving the CLQ of China.
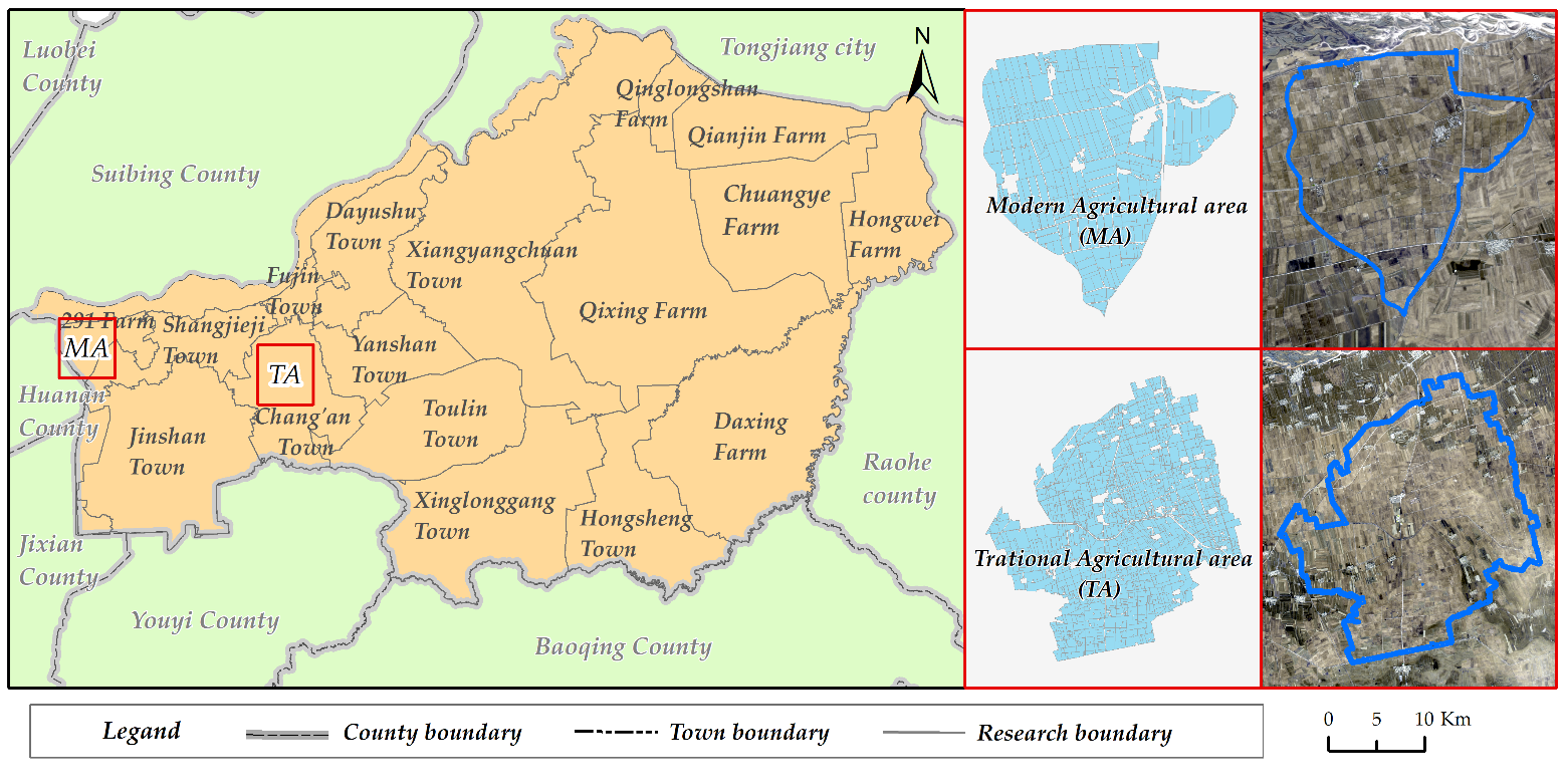
China’s grain production has exceeded 0.65 trillion kilograms since 2017. The top province for grain output in China is Heilongjiang province, which produced 11.3% of Chinese grain in 2020. Heilongjiang province possesses 12.5% of China’s high-standard cultivated land; however, it also contains two agricultural concepts, namely modern agricultural area (MA) and traditional agricultural area (TA) [50]. MA implements a management system with business enterprises in state-owned farms so that cultivated land ownership is managed and controlled by the state. TA, however, is characterized by a household responsibility system. Cultivated land ownership is collectively owned by villagers in this area. Cultivated land was used earlier in TA than in MA. However, agricultural management, landscape, and cultivated land-use behaviors vary between the two areas [51]. Generally, it is difficult for researchers to compare CLQ in relation to MA and TA due to different population qualities, environmental conditions, geographical locations, and social and economic factors. Fujin city, in Heilongjiang province in Northeast China, provides an ideal case to discern these differences and similarities. There are apparent differences in CLQ under different tillage conditions and agricultural management strategies in almost the same geographical environment. Comparing the differences between them can provide a direct reference for improving CLQ in the transformation to modernized agricultural practices.
Considering Fujin city as the study area, the objectives of this study were to construct a systematic CLQ evaluation system from a multidimensional perspective and compare the differences in CLQ between MA and TA so as to provide guidance and new information for the improvement of CLQ. This work thus aims to answer two questions: (1) What are the multidimensional characteristics of CLQ at the plot scale? (2) What are the CLQs in two adjacent areas (MA and TA) in the same exact physical geographical location, and how much of a difference does location make? We first introduce the theoretical framework and present the multidimensional indicator system for CLQ. Then, we present an evaluation method of CLQ that we will use to compare the two adjacent areas. We introduce the study area and describe the whole process of data processing. We then compare the difference by reporting the results of total values and individual values of CLQ. Following this, we discuss the reason for the proposed difference and provide suggestions for how to improve CLQ in these two areas. Finally, we present conclusions and expected directions for future studies.

2. Theoretical Framework of Cultivated Land Quality

2.1. Theoretical Framework

Cultivated land is a complex ecosystem formed by the interactions between humans and nature [4]. Natural factors include climate, terrain, and soil, and human factors include utilization, infrastructure, and property rights, all of which are essential components of cultivated land [52,53]. The natural elements determine the internal attributes of cultivated land, while the human elements can change these attributes [54]. Thus, the variation in natural and human elements of cultivated land systems creates different CLQ types [55,56]. Affected by physical, chemical, and biological processes, cultivated land has several functions, such as production, ecology, and landscape [57,58,59]. CLQ is then the primary attribute of cultivated land that reflects its comprehensive function [60]. Although many scholars have discussed CLQ from different perspectives, there is still no consensus regarding its concept [31,36,53,61]. Generally, CLQ has been defined as the ability to meet agricultural production’s sustainable output and quality safety [35,62]. Based on the fundamental characteristics of cultivated land elements, processes, and functions, this paper defines cultivated land quality as a form of comprehensive productivity that comprises four aspects: fertility quality, project quality, landscape quality, and ecological quality [48,62].
Practically speaking, cultivated land fertility quality refers to the potential productivity determined by soil physicochemical properties and soil nutrient elements [63]. Cultivated land project quality can adjust the suitability of cultivated land through changing infrastructure and ancillary facilities. Good land project quality can improve cultivated land and water resource relationships, preventing natural disasters such as drought, waterlogging, and salinization [64]. Thus, adjustable land project quality is essential for maximizing potential productivity and meeting the stable yield of agricultural production. Cultivated land landscape quality represents the spatial allocation of agricultural production by the morphology, distribution, and location of cultivated land patches [65]. Ecological quality refers to the internal and external environmental conditions of cultivated land [66]. Each individual CLQ reflects CLQ from different aspects, and there is a close relationship between each dimension. Cultivated land fertility quality is the basis of CLQ, which is the inherent attribute of cultivated land. Cultivated land project quality represents the external influence of human beings on cultivated land, but it is also closely related to the essential characteristics of cultivated land utilization. With the continuous expansion of the degree and scope of cultivated land resource utilization, the landscape quality and ecological quality of cultivated land are also critical dimensions that reflect CLQ. Therefore, this paper constructs a theoretical framework for CLQ to reveal its essential characteristics from comprehensive and fractal perspectives (Figure 1).

2.2. Indicator System

Combining FAO’s land evaluation guidelines, China’s regulations on CLQ, and previous studies, the paper constructs an index system. Specifically, we selected the evaluation indexes based on the principles of comprehensiveness, dominance, productivity, and accessibility through a literature summary and expert consultation.
This work used the analytic hierarchy method [32] to construct a multidimensional CLQ evaluation index system that includes three layers. The target layer is comprised of cultivated land quality. The criterion layer includes four individual qualities. Moreover, fertility quality contains six indexes: pH value, soil organic matter, total nitrogen, alkali-hydrolysable nitrogen, available phosphorus, and rapidly available potassium. Project quality has three indexes, namely field slope, road accessibility, and ditch density. In comparison, field regularity and concentrated contiguity constitute landscape quality. Ecology quality includes two indexes, namely forest network density and soil microbial biomass carbon. The indexes and their connotations are shown in Table 1.

3. Evaluation Method of Cultivated Land Quality

According to the aforementioned theoretical framework, CLQ collects multiple individual qualities of cultivated land. This section expresses mathematical formulas that are used to calculate the individual quality and comprehensive quality of cultivated land.

3.1. Calculation of Individual Quality Index of CLQ

The index comprehensive evaluation method is adopted to measure individual quality indexes of cultivated land, such as fertility quality, engineering quality, landscape quality, and ecological quality. The specific calculation formula is as follows:
C L I Q i = j = 1 m W j × P j
where CLIQi is the cultivated land individual quality index; Wj is the weight of cultivated land individual quality index; Pj is the value of cultivated land individual quality; and m is the number of individual cultivated land qualities. The higher values of the CLIQ indicator correspond to better quality.

3.2. Calculation of Comprehensive Index of Cultivated Land Quality

Fertility quality and engineering quality are taken as the primary qualities. Landscape quality and ecological quality are taken as restrictive qualities. In previous studies, these two parts were usually multiplied to calculate the comprehensive quality of cultivated land [32,53,59,62,67]. The specific calculation formula is as follows:
CLCQ = α × C L I Q f + β × C L I Q p × C L I Q l 100 × C L I Q e 100
where CLIQ is the cultivated land comprehensive quality index; CLIQf is the fertility quality index; CLIQp is the project quality index; CLIQl is the landscape quality index; CLIQe is the ecology quality index; and α and β are the weights of the fertility quality index and the project quality index, respectively. α(0.65) + β(0.35) = 1.

4. Materials and Data Sources

4.1. Research Area

Fujin City, the study area, is located in the hinterland of Sanjiang Plain, Heilongjiang Province, Northeastern China (46°45′–47°37′ N, 131°25′–133°26′ E). The terrain slopes gently from the Northwest to the Southeast, showing the geomorphic features of plain, low plain, low wetland, and overflowing hills. The elevation is 52 m–62 m. Songhua River, NaoLi River, and QiXing River are the central water systems for the territory. Fujin belongs to the temperate continental monsoon climate, with an average annual precipitation of 550 mm, an average annual sunshine duration of 2400 h, and an average annual frost-free period of about 144 d. Fujin city hasseven soil types and 18 soil subtypes. The soil condition of Fujin City is excellent, and soil fertility and soil organic matter are high. Moreover, the level of organic matter is above the national level I land standard, and the soil surface thickness is about 20–30 cm. The agricultural land in Fujin dominates dry land, while the reclamation land is comprised of paddy fields.
There are two different administrative subjects in Fujin City (Figure 2). Among these, Fujin Municipal People’s Government has jurisdiction over two districts and eleven towns (referred to as TA). By contrast, Jiansanjiang Administration Bureau has jurisdiction over one branch station and three state-owned farms (referred to as MA). Cultivated land in TA is collectively owned and operated by individual farmers, whereas cultivated land in MA is owned by the state and managed by various farms. Due to the significant difference between MA and TA, it is hypothesized that CLQ in these two areas should have different performances. Thus, to compare the CLQ between these two areas, we selected typical MA and TA in Fujin. The management modes and agricultural property systems were different in these two areas, while the physical conditions (e.g., soil types, climate condition, and hydrology) were the same.

4.2. Data Sources and Processing

The research data mainly include cultivated land spatial data, soil spatial data, project spatial data, geographical spatial data, and administrative division data. Cultivated land spatial data and administrative division data were obtained from the land-use change survey data of Fujin City Natural Resources Bureau in 2018. Soil spatial data, including pH value, organic matter, total nitrogen, alkali-hydrolysable nitrogen, available phosphorus, rapidly available potassium, and soil microbial biomass carbon, were obtained by sampling and spatial interpolation. In this study, 53 soil samples were collected in MA, and 57 samples were collected in TA. We tested the organic matter, total nitrogen, and soil microbial biomass carbon using an elemental analyzer. pH value, alkali hydrolysable-nitrogen, available phosphorus, and rapidly available potassium were tested using a potentiometric method, a brief diffusion method, 0.5 mol/LNaHCO3 solution, and a Flame photometric method, respectively. The descriptive statistics of the soil data are shown in Table 2. Moreover, the soil spatial information data were obtained through a Kriging interpolation of the Geo-statistical Analyst tool on the ArcGIS platform. Project spatial data (i.e., roads, ditches, shelterbelts, and cultivated land patches) were obtained through field investigation and visual interpretation. The accuracy of visual interpretation reached 95%. Geographical spatial data include DEM and slope. DEM was derived from the geographic information spatial data cloud (http://www.gscloud.cn, accessed on 14 March 2021), and its spatial resolution was 30 m. Slope data were extracted from DEM data through the slope function of the raster surface tool on the ArcGIS platform. Additionally, we identified 1318 evaluation units comprising cultivated land plots, including 491 units of MA and 827 units of TA.

4.3. Indicator Grading and Weight

The indicator scoring of CLQ was based on existing standard regulations in China, such as the “Agricultural Land Quality Grading Regulation” (GB/T 28407-2012) and the “Technical Regulations for Survey and Quality Evaluation of cultivated land” (NY/T 1634-2008). Specifically, the score of each index was determined comprehensively by its actual value. Moreover, the weights of indexes were calculated using the AHP method (Table 3).

5. Results and Analysis

5.1. The Difference of CLQ in MA and TA

Table 4 shows the mean, and coefficient of variation (CV) of CLQ in MA and TA. Generally, the more extensive CV means a more considerable variation in CLQ. All of the CVs of comprehensive and individual CLQs in MA were larger than in TA. This indicates that the variation in CLA in MA was less than that in TA. In other words, the CLQ of MA showed more significant homogenization.

5.2. The Difference in CLQ Spatial Distribution in MA and TA

5.2.1. Spatial Differences in Cultivated Land Comprehensive Quality (CLCQ)

According to the evaluation results, we divided the comprehensive index into four grades by the equal division method, namely excellent, advanced, medium, and low grades. The spatial pattern of CLCQ in MA and TA is shown in Figure 3. It was evident that the spatial distribution of CLCQ had aggregation characteristics in MA. Specifically, excellent grade CLCQ was mainly distributed in the Northeast and South MA. The medium grade and low-grade CLCQ were mainly distributed centrally and in the North, respectively. Nevertheless, most of the CLCQ in TA were at medium or low grades, and the spatial distribution of CLCQ was disordered. These spatial results indicate that the CLCQ of the MA is better than that of the TA. Furthermore, different management scales and modes should be the fundamental cause for the differentiation of the CLCQ spatial pattern between MA and TA. The MA has a more extensive management scale and a more centralized management mode; thus, CLCQ in MA tends to be more consistent in a small range. However, the smallholder model with different planting behaviors among villagers in TA might be an actual reason for the disordered CLCQ.

5.2.2. Spatial Differences in Cultivated Land Individual Quality (CLIQ)

As can be seen from Figure 4, the spatial pattern of CLIQ differed significantly between MA and TA. More precisely, the spatial pattern of fertility quality in MA could be divided into two parts—the Eastern part, with excellent and high grades, and the Western part, with lower and medium grades. Meanwhile, the spatial distribution of fertility quality in TA showed a decreasing trend from Northeast to Southwest. Moreover, the spatial patterns of project quality also showed a significant difference between MA and TA. Most of the cultivated land’s project quality in MA was excellent, but showed a significant spatial variation in TA. Although the cultivated land with excellent project quality also showed the aggregation characteristic in TA, the scale was much smaller than in MA. Regarding landscape quality, the grade of landscape quality in MA was primarily excellent and the spatial difference was slight; however, TA showed precisely the opposite spatial pattern. In addition, the spatial characteristic of ecological quality presented a substantial homogeneity in MA that dominated the excellent and advanced grades. However, the proportion of excellent grades related to ecological quality in TA was larger than in MA, albeit with significant spatial heterogeneity.

5.3. The Differences in Average CLQ between MA and TA

To compare the average CLQ between MA and TA, we calculated the average grades of CLQ. Grades 1, 2, 3, and 4 correspond to the aforementioned excellent, high, medium, and lower levels of CLQ, respectively. The lower grade equals higher values of CLQ indicators and therefore better quality. Table 4 shows the average grades of CLQ in MA and TA. The average comprehensive CLQ grade of MA was lower than that of TA, indicating that the CLQ of MA was better than that of TA. The results are similar to the individual quality of the project, landscape, and ecology. However, the average fertility quality grade of MA was 2.47, which was significantly larger than that of TA (Table 5).
Moreover, the analysis of area proportional to comprehensive CLQ in different grades also proves that the CLQ of MA is better than that of TA (Figure 5). Specifically, Figure 3 shows that the proportion of excellent and advanced grade cultivated land in MA exceeded 30% and 40%, respectively. However, the proportion of advanced grade cultivated land in TA was only 21.68%, while excellent was lower than 2%.

5.4. Relationship Analysis of Individual Cultivated Land Qualities

The results of the Pearson correlation coefficient show that the fertility quality has a negative correlation with the project, landscape, and ecology qualities in TA, indicating that the improvement in these qualities has negative impacts on fertility (Table 6). However, the opposite result was found in MA. This significant difference between MA and TA could be caused by the unreasonable land consolidation conducted in TA. Specifically, most of the land consolidation projects conducted in TA were concentrated on the improvement of farming conditions, and the protection of soil was often neglected. Thus, the land consolidation project conducted in TA can improve project, landscape, and ecology qualities but interferes with the surface soil of cultivated land. Moreover, the Pearson correlation coefficient among other individual qualities is positive, indicating a mutual interaction between different individual qualities. Thus, it is necessary to evaluate the CLQ from a multidimensional perspective.

6. Discussion

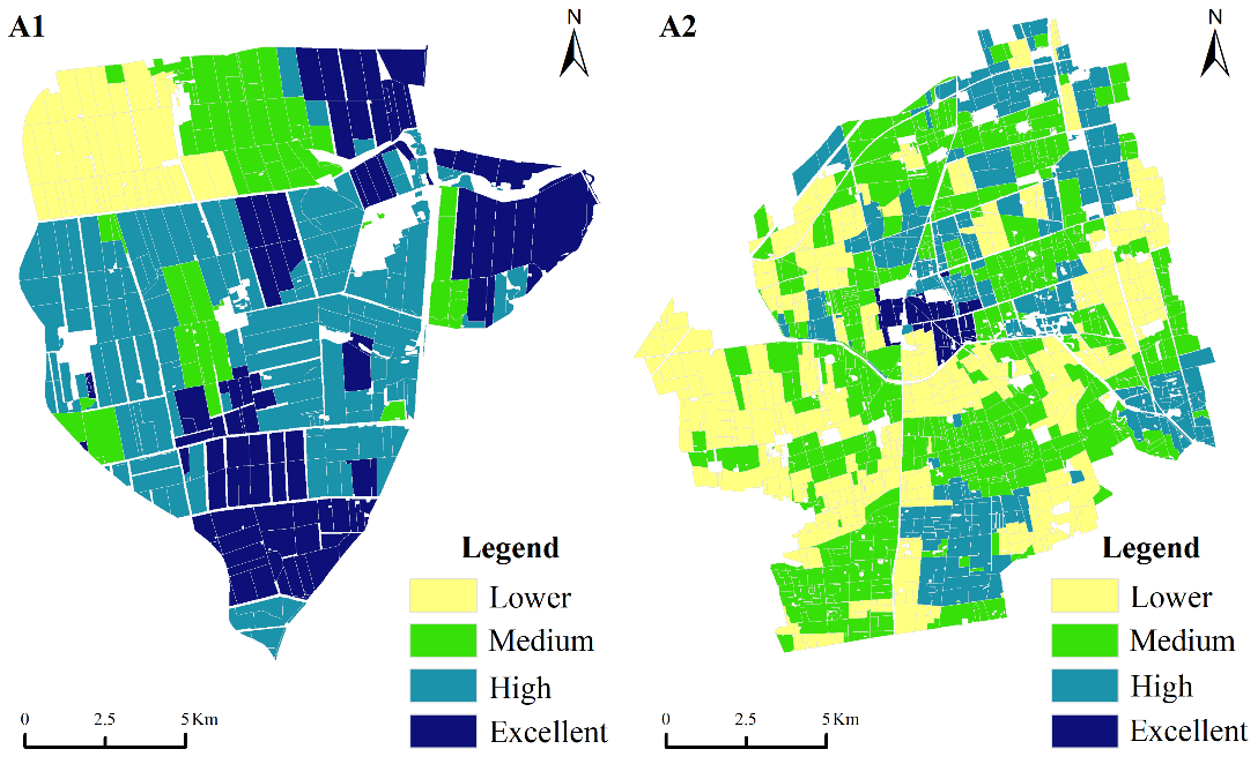
This paper built a hierarchical evaluation system for understanding CLQ from a multidimensional perspective. The framework was applied to typical MA and TA in Fujin City, Heilongjiang Province. The results were similar to the actual situation in these two areas, proving the framework’s effectiveness. According to the evaluation results, we found that the comprehensive CLQ in MA is better than that in TA, but cultivated land individual quality results are not the same as comprehensive quality (see Table 3). The results are consistent with previous studies. For example, Li’s study [51] found that MA has better comprehensive benefits than TA, while not all sub-benefits are the same. Modern management could improve CLQ, which is evident in the same natural environment between MA and TA, at least in theory. Perfect engineering construction, reasonable cultivated land distribution, and an adjustable ecosystem are also expected to benefit grain yield improvements (see Table 5). Consistently, project quality, landscape quality, and ecological quality were better in MA than in TA (see Table 4). In summary, a comprehensive CLQ evaluation using the provided framework produced reliable results in Fujin city.
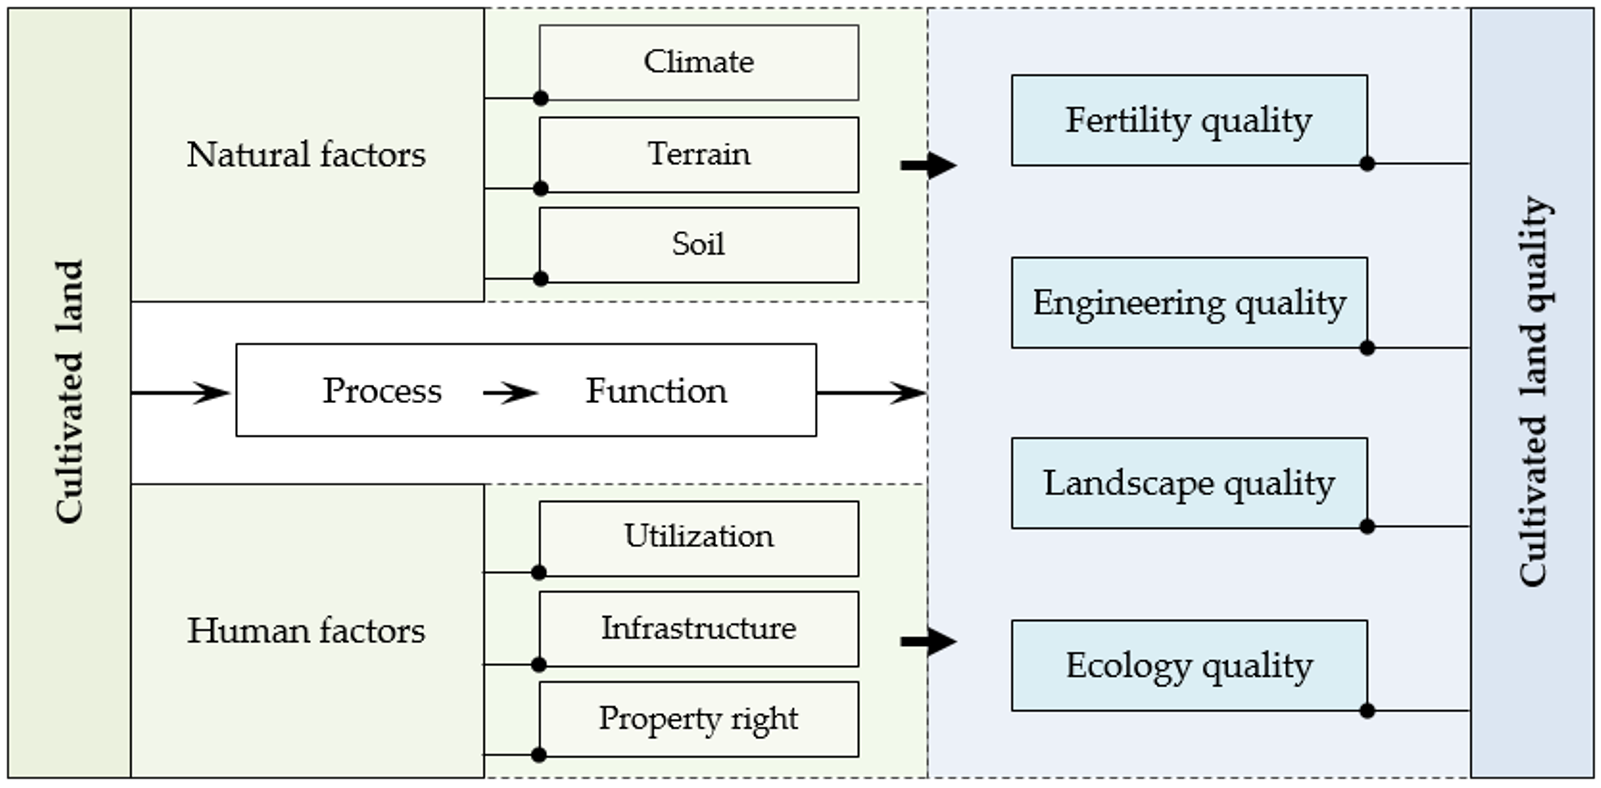
Moreover, multidimensional indicators implicate the interactive relationship between the natural environment and human activities (see Figure 1). This interaction will continue to take place after cultivated land is strongly disturbed. In addition, cultivated land quality also varies by the intensity of cultivated land use. Zhen and Yadav’s studies [54,
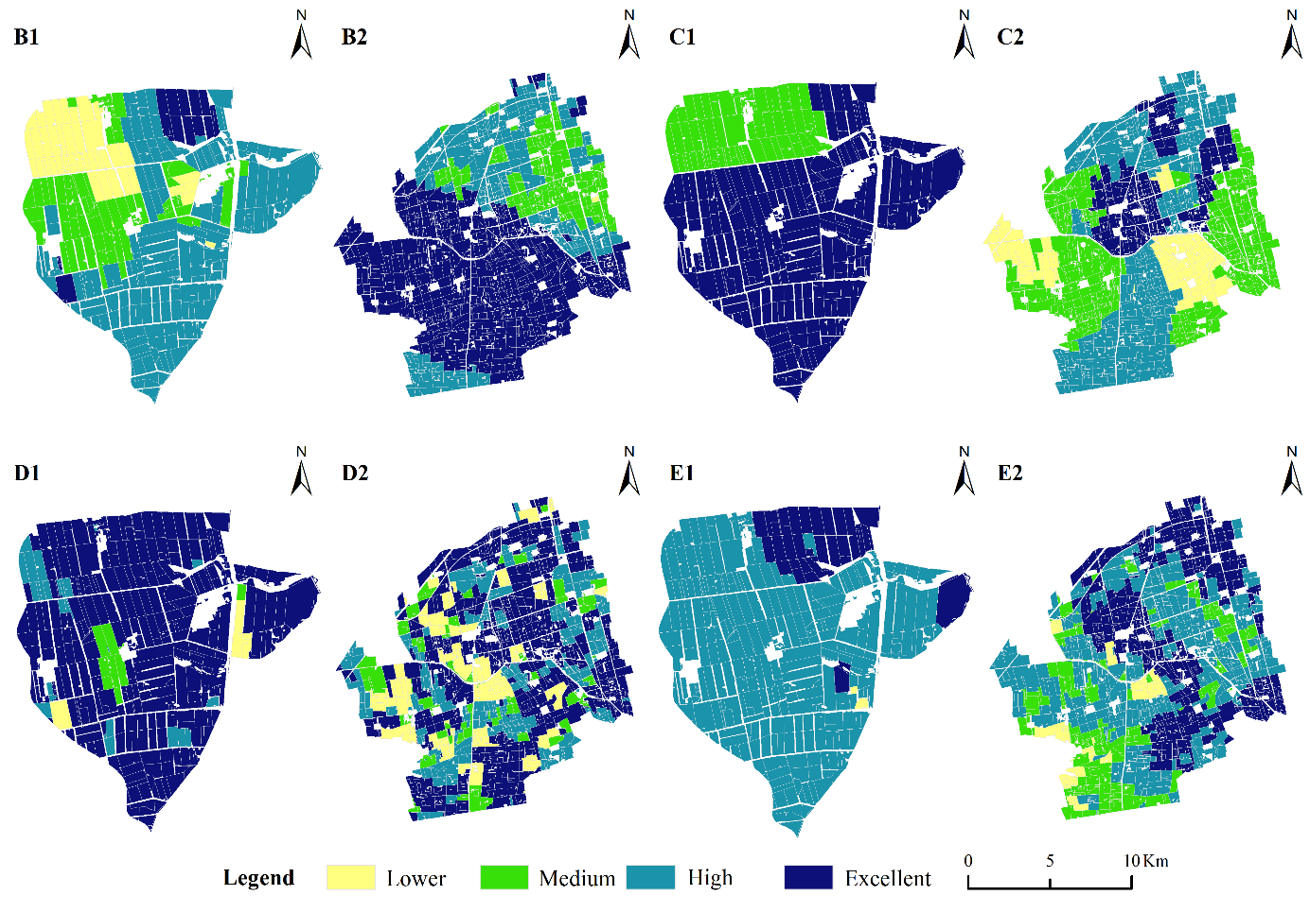
58] have shown that excessive and intensive use will deplete soil fertility, and our study provides new evidence for this fact. Specifically, we found that the fertility quality in MA was worse than that in TA (see Figure 4B1,B2); meanwhile, ecology quality in MA was better than in TA (see Figure 4E1,E2). This point is associated with higher intensity and single cropping patterns in MA, which may affect biological diversity and lead to the homogenization of ecological quality. We found that MA has advantages in project and landscape quality, which might be associated with the modernized land consolidation in MA (see Figure 4C1,C2,D1,D2). Many land consolidation projects conducted in MA make cultivated land more regular, road networks run smoothly, and irrigation and drainage facilities more abundant. These might also be the main reasons why the grade of CLQ in MA tends to be the same from a landscape perspective.
It is widely accepted that an agrarian property system is considered to have significant impacts on cultivated land use. The cultivated land in MA is contracted to paid business workers for no more than five years, while cultivated land in TA is given to villagers without compensation for a 30-year contract period. Previous studies have shown that the different agrarian property systems between MA and TA could create different cultivated land benefits. Our study further illustrated that the agrarian property systems could also affect CLQ. With gradual advancements in agricultural modernization, and the continuous expansion of the connotation of the concept of cultivated land quality, relevant scholars have gradually realized that the title is also an essential part of cultivated land quality and an essential factor affecting it [68,69]. Qian et al. [70] found that the instability of land rights will affect farmers’ farmland quality protection and reduce the behavior of soil organic fertilizer and straw for improving the quality of cultivated land. The results showed that the CLQ of MA was lower than TA. High engineering quality and landscape quality of cultivated land in MA is a fundamental reason for its higher comprehensive quality than TA. The relative stability of land rights in TA makes its fertility quality higher. Therefore, based on the property rights of MA and TA, appropriate cultivated land use and protection measures play a positive role in improving CLQ and the sustainable use of cultivated land resources.
For the reasons above, the CLQ of MA and TA shows a significant difference. We realized that different and common problems need to be addressed between the MA and TA to improve CLQ. Thus, this paper advocates four strategies to improve CLQ: (1) We should strengthen land consolidation and support facility construction to solve cultivated land fragmentation and enhance disaster prevention and mitigation of cultivated land, especially in towns and villages of TA. (2) We must strengthen soil fertility maintenance in agricultural production and reduce human interference with soil to ensure the sustainable use of cultivated land. (3) We should develop the ecological environment of cultivated land, especially in TA, to improve CLQ. (4) We must carry out a multidimensional cultivated land quality survey to gather more detailed information on CLQ.
This paper reveals the essential characteristics of cultivated land quality in typical MA and TA in Northeast China, and shows a positive significance for the rational use of cultivated land resources. Cultivated land from four dimensions was analyzed in this research, but the evaluation index of cultivated land quality lacked biological indicators. Therefore, future evaluations of cultivated land quality should be combined with the essential characteristics of a given region to select the relevant biological indicators to more objectively reflect the quality of said cultivated land. Meanwhile, it should also be the focus of future research to objectively reveal the obstacle factors related to cultivated land quality and then formulate a regulation mode for MA and TA according to local conditions.

7. Conclusions

Understanding the difference in CLQ between MA and TA is crucial for improving CLQ in developing countries experiencing the transformation from traditional to modern agriculture. This paper first built a comprehensive hierarchical framework to evaluate CLQ from the multidimensional perspectives of fertility, project, landscape, and ecology. Then, a systematical comparison of CLQ between MA and TA was conducted. The multidimensional evaluation framework has proved to be practical in reflecting CLQ. The findings of this study showed that CLQ in MA is comprehensively better than in TA, but results of cultivated land individual quality are not the same. Specifically, the project, landscape, and ecology quality in MA are better than in TA. However, the fertility quality in MA is worse. The CLQ in MA tends to be more consistent in the small range, while the spatial pattern of CLQ in TA is disordered. These results indicate that modern management could improve CLQ, but the higher intensity and single cropping patterns in MA could negatively impact CLQ. Based on the findings of this study, we promote four strategies to improve CLQ. Overall, this study provides a new comprehensive insight to understand CLQ. Conclusions of the research are also beneficial for policymakers to improve CLQ more efficiently.

Author Contributions

Conceptualization, Q.L.; methodology, X.S.; validation, Q.L., W.G. and S.Q.; formal analysis, W.G.; investigation, Q.L., A.Y. and S.Q.; resources, Q.L.; data curation, W.C.; Writing—Original draft preparation, W.G. and X.S.; Writing—Review and Editing, Q.L. and S.Q.; visualization, X.S.; supervision, Q.L. and X.S.; project administration, Q.L.; funding acquisition, Q.L. and W.C. All authors have read and agreed to the published version of the manuscript.

Funding

This research was funded by National Natural Science Foundation of China, grant number 41901208, Youth Innovative Talents Training Program of Regular Higher Education Institutions of Heilongjiang Province, grant number UNPYSCT-2020117, Opening Fund of Key Laboratory of Research on Rule of Law, grant number CUGFZ-2002. National Natural Science Foundation of China, grant number 42061069, and Research Foundation of Education Bureau of Inner Mongolia, grant number NJYT-19-B29.

Institutional Review Board Statement

Not applicable.

Informed Consent Statement

Informed consent was obtained from all subjects involved in the study.

Data Availability Statement

The data presented in this study are available on request from the corresponding author. The data are not publicly available due to privacy or other restrictions.

Acknowledgments

We thank Guoming Du and Jinqi Wu for their detailed and helpful reviews of an early draft of the manuscript. We also express gratitude to professionals of the Northeast Agricultural University who participated in the research and survey.

Conflicts of Interest

The authors declare no conflict of interest.

References

  1. Fonseca, L.M.; Domingues, J.P.; Dima, A.M. Mapping the sustainable development goals relationships. Sustainability 2020, 12, 3359. [Google Scholar] [CrossRef] [Green Version]
  2. FAO; IFAD; UNICEF; WFP; WHO. The State of Food Security and Nutrition in the World 2020. Transforming Food Systems for Affordable Healthy Diets; FAO: Rome, Italy, 2020. [Google Scholar] [CrossRef]
  3. Tsalis, T.A.; Malamateniou, K.E.; Koulouriotis, D.; Nikolaou, I.E. New challenges for corporate sustainability reporting: United Nations’ 2030 Agenda for sustainable development and the sustainable development goals. Corp. Soc. Responsib. Environ. Manag. 2020, 27, 1617–1629. [Google Scholar] [CrossRef]
  4. Da Cunha Dias, T.A.; Lora EE, S.; Maya DM, Y.; del Olmo, O.A. Global potential assessment of available land for bioenergy projects in 2050 within food security limits. Land Use Policy 2021, 105, 105346. [Google Scholar] [CrossRef]
  5. Qu, S.; Hu, S.; Li, W.; Wang, H.; Zhang, C.; Li, Q. Interaction between urban land expansion and land use policy: An analysis using the DPSIR framework. Land Use Policy 2020, 99, 104856. [Google Scholar] [CrossRef]
  6. Kong, X.B. China must protect high-quality arable land. Nature 2014, 506, 7. [Google Scholar] [CrossRef] [PubMed]
  7. Li, J.M.; Li, Z.H. Physical limitations and challenges to Grain Security in China. Food Secur. 2014, 6, 159–167. [Google Scholar] [CrossRef]
  8. Qu, S.; Hu, S.; Li, Q. Stages and spatial patterns of urban built-up land transition in China. Acta Geogr. Sin. 2020, 75, 1539–1553. [Google Scholar] [CrossRef]
  9. Wu, Y.; Shan, L.; Guo, Z.; Peng, Y. Cultivated land protection policies in China facing 2030: Dynamic balance system versus basic farmland zoning. Habitat Int. 2017, 69, 126–138. [Google Scholar] [CrossRef]
  10. Herrero, M.; Thornton, P.K.; Mason-D’Croz, D.; Palmer, J.; Benton, T.G.; Bodirsky, B.L.; Bogard, J.R.; Hall, A.; Lee, B.; Nyborg, K.; et al. Innovation can accelerate the transition towards a sustainable food system. Nat. Food 2020, 1, 266–272. [Google Scholar] [CrossRef]
  11. Han, H.; Feng, G.; Deng, G. Research on the Evaluation of Agricultural Disaster Resistance in Henan Province Based on GIS Technology. E3S Web Conf. 2020, 189, 1013–1019. [Google Scholar] [CrossRef]
  12. Webbm, N.P.; Marshall, N.A.; Stringe, L.C.; Reed, M.S.; Chappell, A.; Herrick, J.E. Land degradation and climate change: Building climate resilience in agriculture. Front. Ecol. Environ. 2017, 15, 450–459. [Google Scholar] [CrossRef]
  13. Šimanský, V.; Juriga, M.; Jonczak, J.; Łukasz, U.; Stępień, W. How relationships between soil organic matter parameters and soil structure characteristics are affected by the long-term fertilization of a sandy soil. Geoderma 2019, 342, 75–84. [Google Scholar] [CrossRef]
  14. Yu, H.; Ling, N.; Wang, T.; Zhu, C.; Wang, Y.; Wang, S.; Gao, Q. Responses of soil biological traits and bacterial communities to nitrogen fertilization mediate maize yields across three soil types. Soil Tillage Res. 2019, 185, 61–69. [Google Scholar] [CrossRef]
  15. Qu, Y.; Jiang, G.H.; Li, Z.; Tian, Y.; Wei, S. Understanding rural land use transition and regional consolidation implications in China. Land Use Policy 2018, 82, 742–753. [Google Scholar] [CrossRef]
  16. Du, X.; Zhang, X.; Jin, X. Assessing the effectiveness of land consolidation for improving agricultural productivity in China. Land Use Policy 2018, 70, 360–367. [Google Scholar] [CrossRef]
  17. FAO. A Framework for Land Evaluation; Soils Bulletin: Rome, Italy, 1976. [Google Scholar]
  18. Bodaghabadi, M.B.; Martinez-Casasnovas, J.A.; Khakili, P.; Masihabadi, M.H.; Gandomkar, A. Assessment of the FAO traditional land evaluation methods, A case study: Iranian Land Classification method. Soil Use Manag. 2015, 31, 384–396. [Google Scholar] [CrossRef] [Green Version]
  19. Rossiter, D.G. A theoretical framework for land evaluation. Geoderma 1996, 72, 165–190. [Google Scholar] [CrossRef]
  20. Steiner, F.; Dunford, R.; Dosdall, N. The use of the agricultural land evaluation and site assessment system in the United States. Landsc. Urban Plan. 1987, 14, 183–199. [Google Scholar] [CrossRef]
  21. Steiner, F. Agricultural land evaluation and site assessment in the United States: An introduction. Environ. Manag. 1987, 11, 375–377. [Google Scholar] [CrossRef]
  22. Qian, F.; Wang, W.; Wang, Q.; Lal, R. Implementing land evaluation and site assessment (LESA system) in farmland protection: A case-study in northeastern China. Land Degrad. Dev. 2021, 32, 2437–2452. [Google Scholar] [CrossRef]
  23. Pieri, C.; Dumanski, J.; Hamblin, A.; Young, A. Land Quality Indicators; World Bank Discussion Papers: Washington, DC, USA, 1995; p. 315. [Google Scholar]
  24. Dumanski, J.; Pieri, C. Land quality indicators: Research plan. Agric. Ecosyst. Environ. 2000, 81, 93–102. [Google Scholar] [CrossRef]
  25. FAO. An International Framework for Evaluating Sustainable Land Management; World Soil Resources Report; FAO: Rome, Italy, 1993. [Google Scholar]
  26. Izakovičová, Z.; Špulerová, J.; Petrovič, F. Integrated approach to sustainable land use management. Environments 2018, 5, 37. [Google Scholar] [CrossRef] [Green Version]
  27. Van Diepen, C.A.; Van Keulen, H.; Wolf, J.; Berkhout, J.A.A. Land evaluation: From intuition to quantification. Adv. Soil Sci. 1991, 15, 139–204. [Google Scholar] [CrossRef]
  28. Bunemann, E.K.; Bongiorno, G.; Bai, Z.G.; Creamer, R.E.; Deyn, G.D.; de Goede, R.; Fleskens, L.; Geissen, V.; Kuyper, T.W.; Mader, P.; et al. Soil quality-A critical review. Soil Biol. Biochem. 2018, 120, 105–125. [Google Scholar] [CrossRef]
  29. Katalin, J.; Szabolcs, C.; Balázs, M.; Márta, L. Interpretation of soil quality indicators for land suitability assessment-A multivariate approach for Central European arable soils. Ecol. Indic. 2019, 99, 261–272. [Google Scholar] [CrossRef]
  30. Liu, Y.S.; Zhang, Y.Y.; Guo, L.Y. Towards realistic assessment of cultivated land quality in an ecologically fragile environment: A satellite imagery-based approach. Appl. Geogr. 2010, 30, 271–281. [Google Scholar] [CrossRef]
  31. Du, G.; Liu, Y.; Yu, F.; Liu, M.; Zheng, H. Evolution of concepts of cultivated land quality and recognition. Trans. Chin. Soc. Agric. Eng. 2016, 32, 243–249, (In Chinese with English Abstract). [Google Scholar] [CrossRef]
  32. Veisi, H.; Liaghati, H.; Alipour, A. Developing an ethics-based approach to indicators of sustainable agriculture using analytic hierarchy process (AHP). Ecol. Indic. 2016, 60, 644–654. [Google Scholar] [CrossRef]
  33. Xie, L.W.; Zhong, J.; Chen, F.F.; Cao, F.X.; Li, J.J.; Wu, L.C. Evaluation of soil fertility in the succession of karst rocky desertification using principal component analysis. Solid Earth 2015, 6, 515–524. [Google Scholar] [CrossRef] [Green Version]
  34. Shukla, M.K.; Lal, R.; Ebinger, M. Determining soil quality indicators by factor analysis. Soil Tillage Res. 2006, 87, 194–204. [Google Scholar] [CrossRef]
  35. Tan, Y.; Chen, H.; Lian, K.; Yu, Z. Comprehensive Evaluation of Cultivated Land Quality at County Scale: A Case Study of Shengzhou, Zhejiang Province, China. Int. J. Environ. Res. Public Health 2020, 17, 1169. [Google Scholar] [CrossRef] [Green Version]
  36. Shi, Y.Y.; Duan, W.K.; Fleskens, L.; Li, M.; Hao, J.M. Study on evaluation of regional cultivated land quality based on resource-asset-capital attributes and its spatial mechanism. Appl. Geogr. 2020, 125, 102284. [Google Scholar] [CrossRef]
  37. Lai, Z.; Chen, M.; Liu, T. Changes in and prospects for cultivated land use since the reform and opening up in China. Land Use Policy 2020, 97, 104781. [Google Scholar] [CrossRef]
  38. Chichilnisky, G. What is sustainable development? Land Econ. 1997, 73, 467–491. [Google Scholar] [CrossRef]
  39. Mukhopadhyay, K.; Thomassin, P.J.; Zhang, J. Food security in China at 2050: A global CGE exercise. J. Econ. Struct. 2018, 7, 1. [Google Scholar] [CrossRef]
  40. Wang, J.; Lin, Y.; Glendinning, A.; Xu, Y. Land-use changes and land policies evolution in China’s urbanization processes. Land Use Policy 2018, 75, 375–387. [Google Scholar] [CrossRef]
  41. Lu, H.; Xie, H.; Lv, T.; Yao, G. Determinants of cultivated land recuperation in ecologically damaged areas in China. Land Use Policy 2019, 81, 160–166. [Google Scholar] [CrossRef]
  42. Li, T.; Liu, Y.; Lin, S.; Liu, Y.; Xie, Y. Soil pollution management in china: A brief introduction. Sustainability 2019, 11, 556. [Google Scholar] [CrossRef] [Green Version]
  43. Ventrella, D.; Giglio, L.; Charfeddine, M.; Lopez, R.; Castellini, M.; Sollitto, D.; Castrignanò, A.; Fornaro, F. Climate change impact on crop rotations of winter durum wheat and tomato in southern Italy: Yield analysis and soil fertility. Ital. J. Agron. 2012, 7, e15. [Google Scholar] [CrossRef] [Green Version]
  44. Jiang, G.; Zhang, R.; Ma, W.; Zhou, D.; Wang, X.; He, X. Cultivated land productivity potential improvement in land consolidation schemes in Shenyang, China: Assessment and policy implications. Land Use Policy 2017, 68, 80–88. [Google Scholar] [CrossRef]
  45. Tang, X.; Pan, Y.; Liu, Y. Analysis and demonstration of investment implementation model and paths for China’s cultivated land consolidation. Appl. Geogr. 2017, 82, 24–34. [Google Scholar] [CrossRef]
  46. Li, H.; Song, W. Expansion of rural settlements on high-quality arable land in Tongzhou District in Beijing, China. Sustainability 2019, 11, 5153. [Google Scholar] [CrossRef] [Green Version]
  47. Zhou, J.; Cao, X. What is the policy improvement of China’s land consolidation? Evidence from completed land consolidation projects in Shaanxi Province. Land Use Policy 2020, 99, 104847. [Google Scholar] [CrossRef]
  48. Song, W.; Wu, K.; Zhao, H.; Zhao, R.; Li, T. Arrangement of high-standard basic farmland construction based on village-region cultivated land quality uniformity. Chin. Geogr. Sci. 2019, 29, 325–340. [Google Scholar] [CrossRef] [Green Version]
  49. Ministry of Agriculture and Rural Affairs of the People’s Republic of China. How to Protect the Farmland of Food Production? 2021. Available online: http://www.moa.gov.cn/xw/zwdt/202104/t20210424_6366511.htm (accessed on 12 May 2021).
  50. Pan, T.; Zhang, C.; Kuang, W.; De Maeyer, P.; Kurban, A.; Hamdi, R.; Du, G. Time tracking of different cropping patterns using Landsat images under different agricultural systems during 1990–2050 in Cold China. Remote Sens. 2018, 10, 2011. [Google Scholar] [CrossRef] [Green Version]
  51. Li, Q.; Hu, S.; Du, G.; Zhang, C.; Liu, Y. Cultivated land use benefits under state and collective agrarian property regimes in China. Sustainability 2018, 10, 7. [Google Scholar] [CrossRef] [Green Version]
  52. Liu, L.; Zhou, D.; Chang, X.; Lin, Z. A new grading system for evaluating China’s cultivated land quality. Land Degrad. Dev. 2020, 31, 1482–1501. [Google Scholar] [CrossRef]
  53. Sun, X.B.; Kong, X.B.; Zhang, Q.P.; Wen, L.Y.; Liao, Y.B. Evaluation of inherent quality and dynamic quality of cultivated land based on comprehensive characteristics of indexes. Trans. Chin. Soc. Agric. Eng. 2020, 36, 254–265. [Google Scholar] [CrossRef]
  54. Zhen, L.; Zoebisch, M.A.; Chen, G.; Feng, Z. Sustainability of farmers’ soil fertility management practices: A case study in the North China Plain. J. Environ. Manag. 2006, 79, 409–419. [Google Scholar] [CrossRef]
  55. Li, M.; Wang, Y.K.; Fu, B.; Xu, P.; Dai, E.F.; Tian, C.S. Cropland disturbance intensity: Plot-scale measurements, multilevel determinants and applications in rural environmental protection. Ecol. Indic. 2018, 88, 393–401. [Google Scholar] [CrossRef]
  56. Zhu, M.; Liu, S.; Xia, Z.; Wang, G.; Hu, Y.; Liu, Z. Crop Growth Stage GPP-Driven Spectral Model for Evaluation of Cultivated Land Quality Using GA-BPNN. Agriculture 2020, 10, 318. [Google Scholar] [CrossRef]
  57. Zhao, C.; Zhou, Y.; Jiang, J.H.; Xiao, P.N.; Wu, H. Spatial characteristics of cultivated land quality accounting for ecological environmental condition: A case study in hilly area of northern Hubei province, China. Sci. Total Environ. 2021, 774, 145765. [Google Scholar] [CrossRef]
  58. Yadav, S.K.; Soni, R. Integrated Soil Fertility Management [M]//Soil Fertility Management for Sustainable Development; Springer: Singapore, 2019; pp. 71–80. [Google Scholar] [CrossRef]
  59. Song, X.; Huang, Y.; Wu, Z.; Ouyang, Z. Does cultivated land function transition occur in China? J. Geogr. Sci. 2015, 25, 817–835. [Google Scholar] [CrossRef]
  60. Jiang, G.; Wang, M.; Qu, Y.; Zhou, D.; Ma, W. Towards cultivated land multifunction assessment in China: Applying the “influencing factors-functions-products-demands” integrated framework. Land Use Policy 2020, 99, 104982. [Google Scholar] [CrossRef]
  61. Zhao, R.; Wu, K.; Li, X.; Gao, N.; Yu, M. Discussion on the Unified Survey and Evaluation of Cultivated Land Quality at County Scale for China’s 3rd National Land Survey: A Case Study of Wen County, Henan Province. Sustainability 2021, 13, 2513. [Google Scholar] [CrossRef]
  62. Deng, X.; Huang, J.; Rozelle, S.; Uchida, E. Cultivated land conversion and potential agricultural productivity in China. Land Use Policy 2006, 23, 372–384. [Google Scholar] [CrossRef]
  63. Stellacci, A.M.; Castellini, M.; Diacono, M.; Rossi, R.; Gattullo, C.E. Assessment of Soil Quality under Different Soil Management Strategies: Combined Use of Statistical Approaches to Select the Most Informative Soil Physico-Chemical Indicators. Appl. Sci. 2021, 11, 5099. [Google Scholar] [CrossRef]
  64. He, M.; Wang, Y.; Tong, Y.; Zhao, Y.; Qiang, X.; Song, Y.; Wang, L.; Song, Y.; Wang, G.; He, C. Evaluation of the environmental effects of intensive land consolidation: A field-based case study of the Chinese Loess Plateau. Land Use Policy 2020, 94, 104523. [Google Scholar] [CrossRef]
  65. Liang, X.; Li, Y. Identification of spatial coupling between cultivated land functional transformation and settlements in Three Gorges Reservoir Area, China. Habitat Int. 2020, 104, 102236. [Google Scholar] [CrossRef]
  66. Ministry of Land and Resources of the People’s Republic of China. Rules for Quality Grading of Agricultural Land (GB/T 28407-2012); Standards Press of China: Beijing, China, 2012.
  67. Ministry of Agriculture of the People’s Republic of China. Technical Specification for Soil Fertility Investigation and Quality Evaluation of Cultivated Land (NY/T 1634-2008); China Agriculture Press: Beijing, China, 2008. [Google Scholar]
  68. Myyra, S.; Pietola, K.; Markku, Y.H. Exploring long-term land improvements under land tenure insecurity. Agric. Syst. 2007, 92, 63–75. [Google Scholar] [CrossRef] [Green Version]
  69. Lyu, K.Y.; Chen, K.; Zhang, H.Z. Relationship between land tenure and soil quality: Evidence from China’s soil fertility analysis. Land Use Policy 2019, 80, 345–361. [Google Scholar] [CrossRef]
  70. Qian, L.; Feng, Y.; Lu, H. Impact of land tenure stability on farmer’s cultivated land quality protection behavior: Analysis based on adjustment effect of the new round land certification. J. Nanjing Agric. Univ. Soc. Sci. Ed. 2021, 21, 104–115. [Google Scholar] [CrossRef]
Figure 1. Theoretical framework for cultivated land quality.
Land 10 00842 g001
Figure 2. Locations of modern agricultural area and traditional agricultural area in Fujin city.
Land 10 00842 g002
Figure 3. (A1) is the spatial distribution of cultivated land comprehensive quality in the modern agricultural area. (A2) is the spatial distribution of cultivated land comprehensive quality in the traditional agricultural area.
Land 10 00842 g003
Figure 4. Relationship analysis of cultivated land individual qualities: B, C, D, and E represent the fertility quality, project quality, landscape quality, and ecology quality, respectively. Specifically, (B1) is the spatial distribution of fertility quality in the modern agricultural area. (B2) is spatial distribution of fertility quality in traditional agricultural area. (C1) is the spatial distribution of project quality in the modern agricultural area. (C2) is the spatial distribution of project quality in the traditional agricultural area. (D1) is the spatial distribution of landscape quality in the modern agricultural area. (D2) is the spatial distribution of landscape quality in the traditional agricultural area. (E1) is the spatial distribution of ecology quality in the modern agricultural area. (E2) is the spatial distribution of ecology quality in the traditional agricultural area.
Land 10 00842 g004
Figure 5. Area proportion of cultivated land in the comprehensive quality in different grades.
Land 10 00842 g005
Table 1. Evaluation index system for cultivated land quality.
Target LayerCriterion LayersIndex LayersConnotation
Cultivated land qualityFertility qualitypH valueThese indexes were adopted to represent the chemical properties and nutrients of the soil that are important for crop growth.
soil organic matter
total nitrogen
Alkali-hydrolysable nitrogen
available phosphorus
rapidly available potassium
Engineering qualityfield slopeThese indexes represent physical environment, including surface drainage and irrigation, transportation convenience, and agricultural production efficiency, all of which have a significant impact on cultivated land use.
road accessibility
ditch density
Landscape qualityregularity of plotsThese indexes represent the patch shape and spatial distribution of cultivated land, both of which reflect the scale of cultivated land use.
cultivated land connectivity
Ecology qualityforest network densityThese indexes represent the biological properties of the soil and the ecological state of cultivated land, both of which reflect the sustainable use of cultivated land.
soil microbial biomass carbon
Table 2. Descriptive statistics of the soil data in MA and TA.
Soil DataCollected TechniquesMATA
MeanSDMinMaxMeanSDMinMax
pH valuepotentiometric method6.200.834.307.696.080.704.647.51
organic matterelemental analyzer24.9910.895.8060.9741.2015.2413.6283.03
total nitrogenelemental analyzer2.620.921.315.482.400.841.044.44
Alkali-hydrolysable nitrogenbrief diffusion method112.4333.7754.88188.16121.2833.2062.72250.88
available phosphorusextracted by 0.5mol/L NaHCO3 solution38.7728.955.52128.1532.6619.717.73126.68
rapidly available potassiumflame photometric method211.1775.7680.37386.97265.0969.8174.46413.36
soil microbial biomass carbonelemental analyzer43.0818.7810.00105.1123.898.847.9048.16
Soil samples5357
Table 3. Classification and weights of cultivated land quality evaluation index.
Criterion LayersIndex LayersIndexes ScoringWeight
10090807060504030
Fertility qualitypH value6.0~7.95.5~6.0, or 7.9~8.55.0~5.5, or 8.5~9.0 4.5~5.0 ≤4.5, or 9.0~9.5>9.50.211
soil organic matter>4040~3030~2020~1010~6≤6 0.387
total nitrogen>21.5~21~1.50.75~10.5~0.75<0.5 0.117
alkali-hydrolysable nitrogen≥160 130–160 100–130 <100 0.107
available phosphorus>4020~4010~205~103~5<3 0.087
rapidly available potassium>200150~200 s100~15050~10030~50<30 0.091
Engineering qualityfield slope≤22~55~8 8~15 15~250.423
road accessibility>80 >60~80 >40~60 ≤40 0.205
ditch densityfully meetingbasic meeting usually meeting no irrigation condition 0.372
Landscape qualityregularity of plotsbest regular cultivated land morphology, SHAPE ≤ 2more regular cultivated land morphology, 2 < SHAPE ≤ 4 more disorganized cultivated land morphology, 4 < SHAPE ≤ 6 most disorganized cultivated land morphology, SHAPE > 6 0.423
cultivated land connectivity>1000500~100100~50050~100 <50 0.577
Ecology qualityforest network density>100 50~100 <50 0.493
soil microbial biomass carbon>348.25 229.94~348.25 <229.94 0.507
Table 4. The CV of CLQ in MA and TA.
Criterion LayersMATA
MeanCVMeanCV
Fertility quality13.070.1115.70.13
Project quality31.880.1325.090.14
Landscape quality31.910.0629.870.11
Ecology quality13.710.0313.560.07
Comprehensive quality90.570.0684.230.06
Table 5. The average CLQ in MA and TA.
AreaFertility QualityProject QualityLandscape QualityEcology QualityComprehensive Quality
MA2.471.651.201.902.09
TA1.543.321.871.943.09
Table 6. The Pearson coefficient of CLQ in modern agricultural areas (MA) and traditional agricultural areas (MA).
CLQMATA
Fertility QualityProject QualityLandscape QualityEcology QualityFertility QualityProject QualityLandscape QualityEcology Quality
Fertility quality1 1
Project quality0.264 **1 −0.396 **1
Landscape quality0.121 *0.0161 −0.164 **0.070 **1
Ecology quality0.224 **−0.257 **0.133 **1−0.149 **0.234 **0.336 **1
* and ** indicate significant levels at p < 0.05, p < 0.01, respectively.
Publisher’s Note: MDPI stays neutral with regard to jurisdictional claims in published maps and institutional affiliations.

