Article

Linking Morphological Spatial Pattern Analysis and Circuit Theory to Identify Ecological Security Pattern in the Loess Plateau: Taking Shuozhou City as an Example

1
School of Land Science and Technology, China University of Geosciences, Beijing 100083, China
2
Key Laboratory of Land Consolidation and Rehabilitation, The Ministry of Land and Resources, Beijing 100035, China
*
Author to whom correspondence should be addressed.
Submission received: 1 August 2021 / Revised: 21 August 2021 / Accepted: 25 August 2021 / Published: 28 August 2021
(This article belongs to the Topic Climate Change and Environmental Sustainability)

Abstract

:
Located in an ecologically fragile area in China’s eastern part of the Loess Plateau, Shuozhou City has faced environmental challenges imposed by frequent urban expansion and mining activities in recent years. As ecological security patterns (ESP) identification and optimization are significant to regional biodiversity and ecosystem services, this study combined morphological spatial pattern analysis (MSPA) and circuit theory to construct and optimize regional ESP. Results show the number and area of ecological sources in the study area decreased from 21 to 20 between 2010 and 2017. The total area of ecological sources fell from 1923.35 km2 to 1869.37 km2, with their proportion in the study area dropped from 18.14% to 17.64%. From 2010 to 2017, the number of obstacles increases from 63 to 80, mainly consisting of farmland, unused land, transportation land, and construction land. The area of obstacles reached 10.17 km2 in 2017. A framework of “one protection area, two regulation areas, and three restoration areas” is proposed to optimize the ESP of the study zone. This study explored a combination of ESP analysis tools and focused on improving regional ecosystem service and biodiversity. It will support local urban planning and provide a reference for similar studies in resource-based cities.

1. Introduction

With the development of science and technology and population growth, large-scale urbanization has occurred worldwide in the past few decades, which has also exacerbated many environmental problems such as global warming, vegetation destruction, the sharp decline in biodiversity, and disorder of biogeochemical cycles [1,2,3]. According to United Nations projections, more than 66% of the world’s population will live in cities, posing a challenge to a stable and sustainable human society-natural coupling ecological security [4]. The rapid increase in urban population and area of artificially disturbed land has led to the damage of regional environment and the degradation of ecosystem services and the loss of the original stable and sustainable landscape pattern [4,5]. It is necessary to address the threat to the ecological environment brought by urban expansion and other human activities such as coal mining, and ensure landscape connectivity and ecological security [2,5,6].
Regarded as an efficient tool to guarantee regional ecosystem security, the concept of ecological security pattern (ESP) refers to the landscape’s elements essential to the health and sustainability of ecological processes [1,6,7,8]. ESP mainly consists of ecological sources, corridors, and important ecological components that characterize regional ecosystem integrity and health [6,9]. In a narrow sense, ESP is a visual objective of ecosystem-based management [7]. Generally, ESP has vital ecological significance for ecosystem services and biodiversity by focusing on ecological processes and functions [10,11]. Some countries, such as China, have incorporated the ESP concept into their policy-making process [7]. Furthermore, the construction and optimization of ESPs can balance economic development and regional protection, promote ecosystem services, and maintain regional biodiversity [2,9,11].
As integrated use of ecological analysis tools proved to be effective in contributing planning process, the integrative method of MSPA and circuit theory is an innovative path in ESP research [1,8,12]. The “source-corridor” combination method to identify and construct the ESP constitutes the preliminary mainstream construction paradigm of the ESP [1,13]. While some researchers directly choose forest patches or conservation areas as ecological sources, a growing number of studies applied landscape metrics and graph theory into their research to reduce subjective interferences and improve functional connectivity [1,5,14]. Among these connectivity models are the minimum cumulative resistance (MCR) model, morphological spatial pattern analysis (MSPA), circuit theory, matrix theory, and agent or individual-based modeling [1,5,15]. Ecological sources identification is a crucial starting part of ESP analysis. Although many ecological sources identification studies applied evaluation based on ecosystem services, MSPA has been increasingly involved in this field [16]. MSPA approach is designed to use binary graphs when processing recognition. It only relies on land-use data to identify core ecological patches and emphasizes the structural connection [1]. Except for being used to assess ecological connectivity of green infrastructure, MSPA can also map the ecological land patches while has no limitation on scale or type of image based on geometric concepts [16,17]. Ecological corridors assessment can be conducted by different models. Although the MCR model based on graph theory has been widely used to identify ecological corridors in an ESP, it has obvious disadvantages in revealing the differences in the ecological potential of different ecological sources. It ignores the random walking characteristics of species [2,8]. Instead, ecological corridors can be identified in circuit theory by assigning physical quantities new ecological connotations such as current, conductivity, and voltage [1,2,18]. Circuit theory considers ecological resistance value as the impedance value, and ecological flow represents random walk current [19,20]. In brief, the MSPA mainly focuses on landscape structural analysis, while the circuit theory primarily focuses on functional connectively. However, not many studies in ESP have applied the MSPA approach or circuit theory despite their advantages above. ESP identification should consider both structural and functional connectivity and might be helpful to promote the practical utility of ecology methods for urban spatial planning [1,5]. Specifically, small steppingstones (ecological obstacles) identified in circuit theory significantly impact on promoting landscape connectivity [1].
Regarding ESP optimization, scholars mainly focus on goals such as increasing landscape connectivity, increasing ecological source functions (ecosystem services), protecting and restoring steppingstones (obstacles) and maintaining biodiversity [1,7,8]. The protection of narrow ecological corridors and steppingstones is proposed to keep the ecosystem healthy [1,21]. Meanwhile, planners are suggested to balance the expansion of urban and the protection of habitats to maintain biodiversity [5]. In coal mining cities, regulation zones are proposed to facilitate natural protection and resource exploitation as areas of high ecological resistance coefficient are primarily located near coal mines [8]. As splitting green urban zones into different classes would be helpful to distinguish different supplies of different ecosystem service better, proper urban spatial optimization based on ESP analysis is essential to ensure the ecological processes continuity and ecosystem services flow [5,8]. ESP optimization focusing on the reconfiguration of land-use/land cover (LUCC) to maximize urban ecosystem services while long-term planning can adopt model reveal the optimal solutions and nature-based solutions addressing sustainability challenges. Studies have shown LUCC caused mass ecosystem service value (ESV) loss, especially during urban expansion, which is highly related to ecological problems [22,23,24]. In China, with rapid urbanization expansion, improving ESV and maintaining biodiversity based on LUCC is the core content and the primary significance of ESP optimization in this study [25]. Optimization of land-use structure has been proved to be worth considering by land managers and city planners, while well-regarded ecosystem assessment standards usually lack spatial details [25,26].
For decades, mining activity and urban expansion have been causing severe ecological problems in China’s resource-based cities [8]. Located in eastern Loess Plateau, Shuozhou City is one of China’s most important coal mining bases, the same as Ordos City and Yulin City [27]. The quality of the local ecosystem is considered to have an essential impact on the ecological environment of the surrounding area. Hence, it is vital to stabilize the local ecological environment and promote sustainable urban development. Carrying out an analysis of the ESP for Shuozhou City will help improve the safety and stability of the local ecosystem services and provide a robust ecological barrier for the soil conservation area of the Loess Plateau and the water conservation area in the north of Beijing-Tianjin-Hebei. Therefore, this study combined the MSPA approach and circuit theory to conduct an ESP analysis of Suzhou City. Questions explored are as below: (1) How to quantitatively analyze and determine the ecological source/areas of Shuozhou City in different years from the perspective of structure and process, (2) how to combine MSPA model and circuit theory to construct ESP in the study area, and (3) how to optimize the ESP in the study area based on ecological sources, corridors, and obstacles. This study will helps to improve the landscape connectivity and ESV of the study area and provide reference for ESP analysis in similar areas.

2. Materials and Methods

2.1. Study Area

Located in the northwestern part of Shanxi Province and east of China’s Loess Plateau, Shuozhou City covers an area of 10,600 km2, accounting for 6.8% of the land area of Shanxi Province (Figure 1). It consists of one county-level city, two districts, and three counties. The annual average rainfall is 420 mm, and the evaporation is large and unevenly distributed; the yearly average temperature is 5.5 °C. The landform of Shuozhou City is divided into mountains, hills, and plains, mainly composed of three ecosystems: farmland, shrubland, and grassland. The mountain area is 2678 km2, the hill area is 3682 km2, and the plain area is 4204 km2, accounting for 25.35%, 34.85%, and 39.80% of the city’s area, respectively.
Shuozhou City represents a batch of emerging coal mining towns in central and northern China [28]. Among the six counties and districts in the city, only Ying county has no mining conditions. In comparison the other five counties and districts are large coal producing counties, among which Shuocheng District, Pinglu District, Shanyin County, and Huairen City are national key coal-producing bases. Opencast mining is the foremost coal mining approach in Shuozhou City, with the Pingshuo mine (one of the largest opencast coal mines in China) located in the southwest of the city [28]. Ecological restoration in the Pingshuo mine’s adjacent area was initiated in 1988, and most reclaimed land is used for forest and farmland [29]. Overall, this study area is a specific ecologically fragile area on the Loess Plateau in northern China. According to the Ministry of Environmental Protection of the PRC, Shuozhou City mainly consists of three ecosystems: farmland, shrubland, and grassland. The importance of environmental protection in this area is ranked as extremely high [30]. It is adjacent to the soil conservation area of the Loess Plateau and the water conservation area in the north of Beijing-Tianjin-Hebei, an important ecological function area in China [31]. The agricultural land in Shuozhou City is mainly medium and low-yield land, with a large proportion of low-yield land. There are also problems of soil desertification and salinization. The soil fertility of farmland is low, and the nutrient content is lower than other places of the Shanxi province. Regional ecological problems are mainly as bellows: soil desertification and soil erosion caused by natural and human activities, soil salinization concentrated in the Sanggan River Basin, and low utilization efficiency of natural reserves such as saline-alkali land.

2.2. Data Sources

The research data mainly includes land-use data for the three phases of 2010, 2015, and 2017 and digital elevation model (DEM) data has a resolution of 30 m (Table 1). Use ENVI 5.2 software to preprocess the fourth-phase remote sensing images such as radiation calibration, atmospheric correction, and splicing, and extract the normalized vegetation index, temperature vegetation drought index, and impervious surface coefficient. With land-use data collected from Shuozhou City government and online remote sensing data, the land-use data was classified into forest land, wetland, grassland, orchard, farmland, unused land, transportation land, construction land (including urban land, rural residential area) and mining land. With the help of a Google image map, live images of ecological obstacles on the map are captured and displayed.

2.3. Identify ESP

The paradigm of constructing an ecological security pattern is to develop a vital stereotype of a comprehensive network including ecological sources, corridors, and key nodes. The model consists of three steps. First of all, identify ecological sources based on land-use data and the MSPA approach. Subsequently, constitute a resistance surface by setting different land-use types as essential resistance factors. The third step is to extract ecological corridors and obstacles based on circuit theory and multiple software modules. Lastly, ESP of the study area is identified, and optimization suggestions is proposed. Figure 2 shows the framework of the ESP identification process in this study.

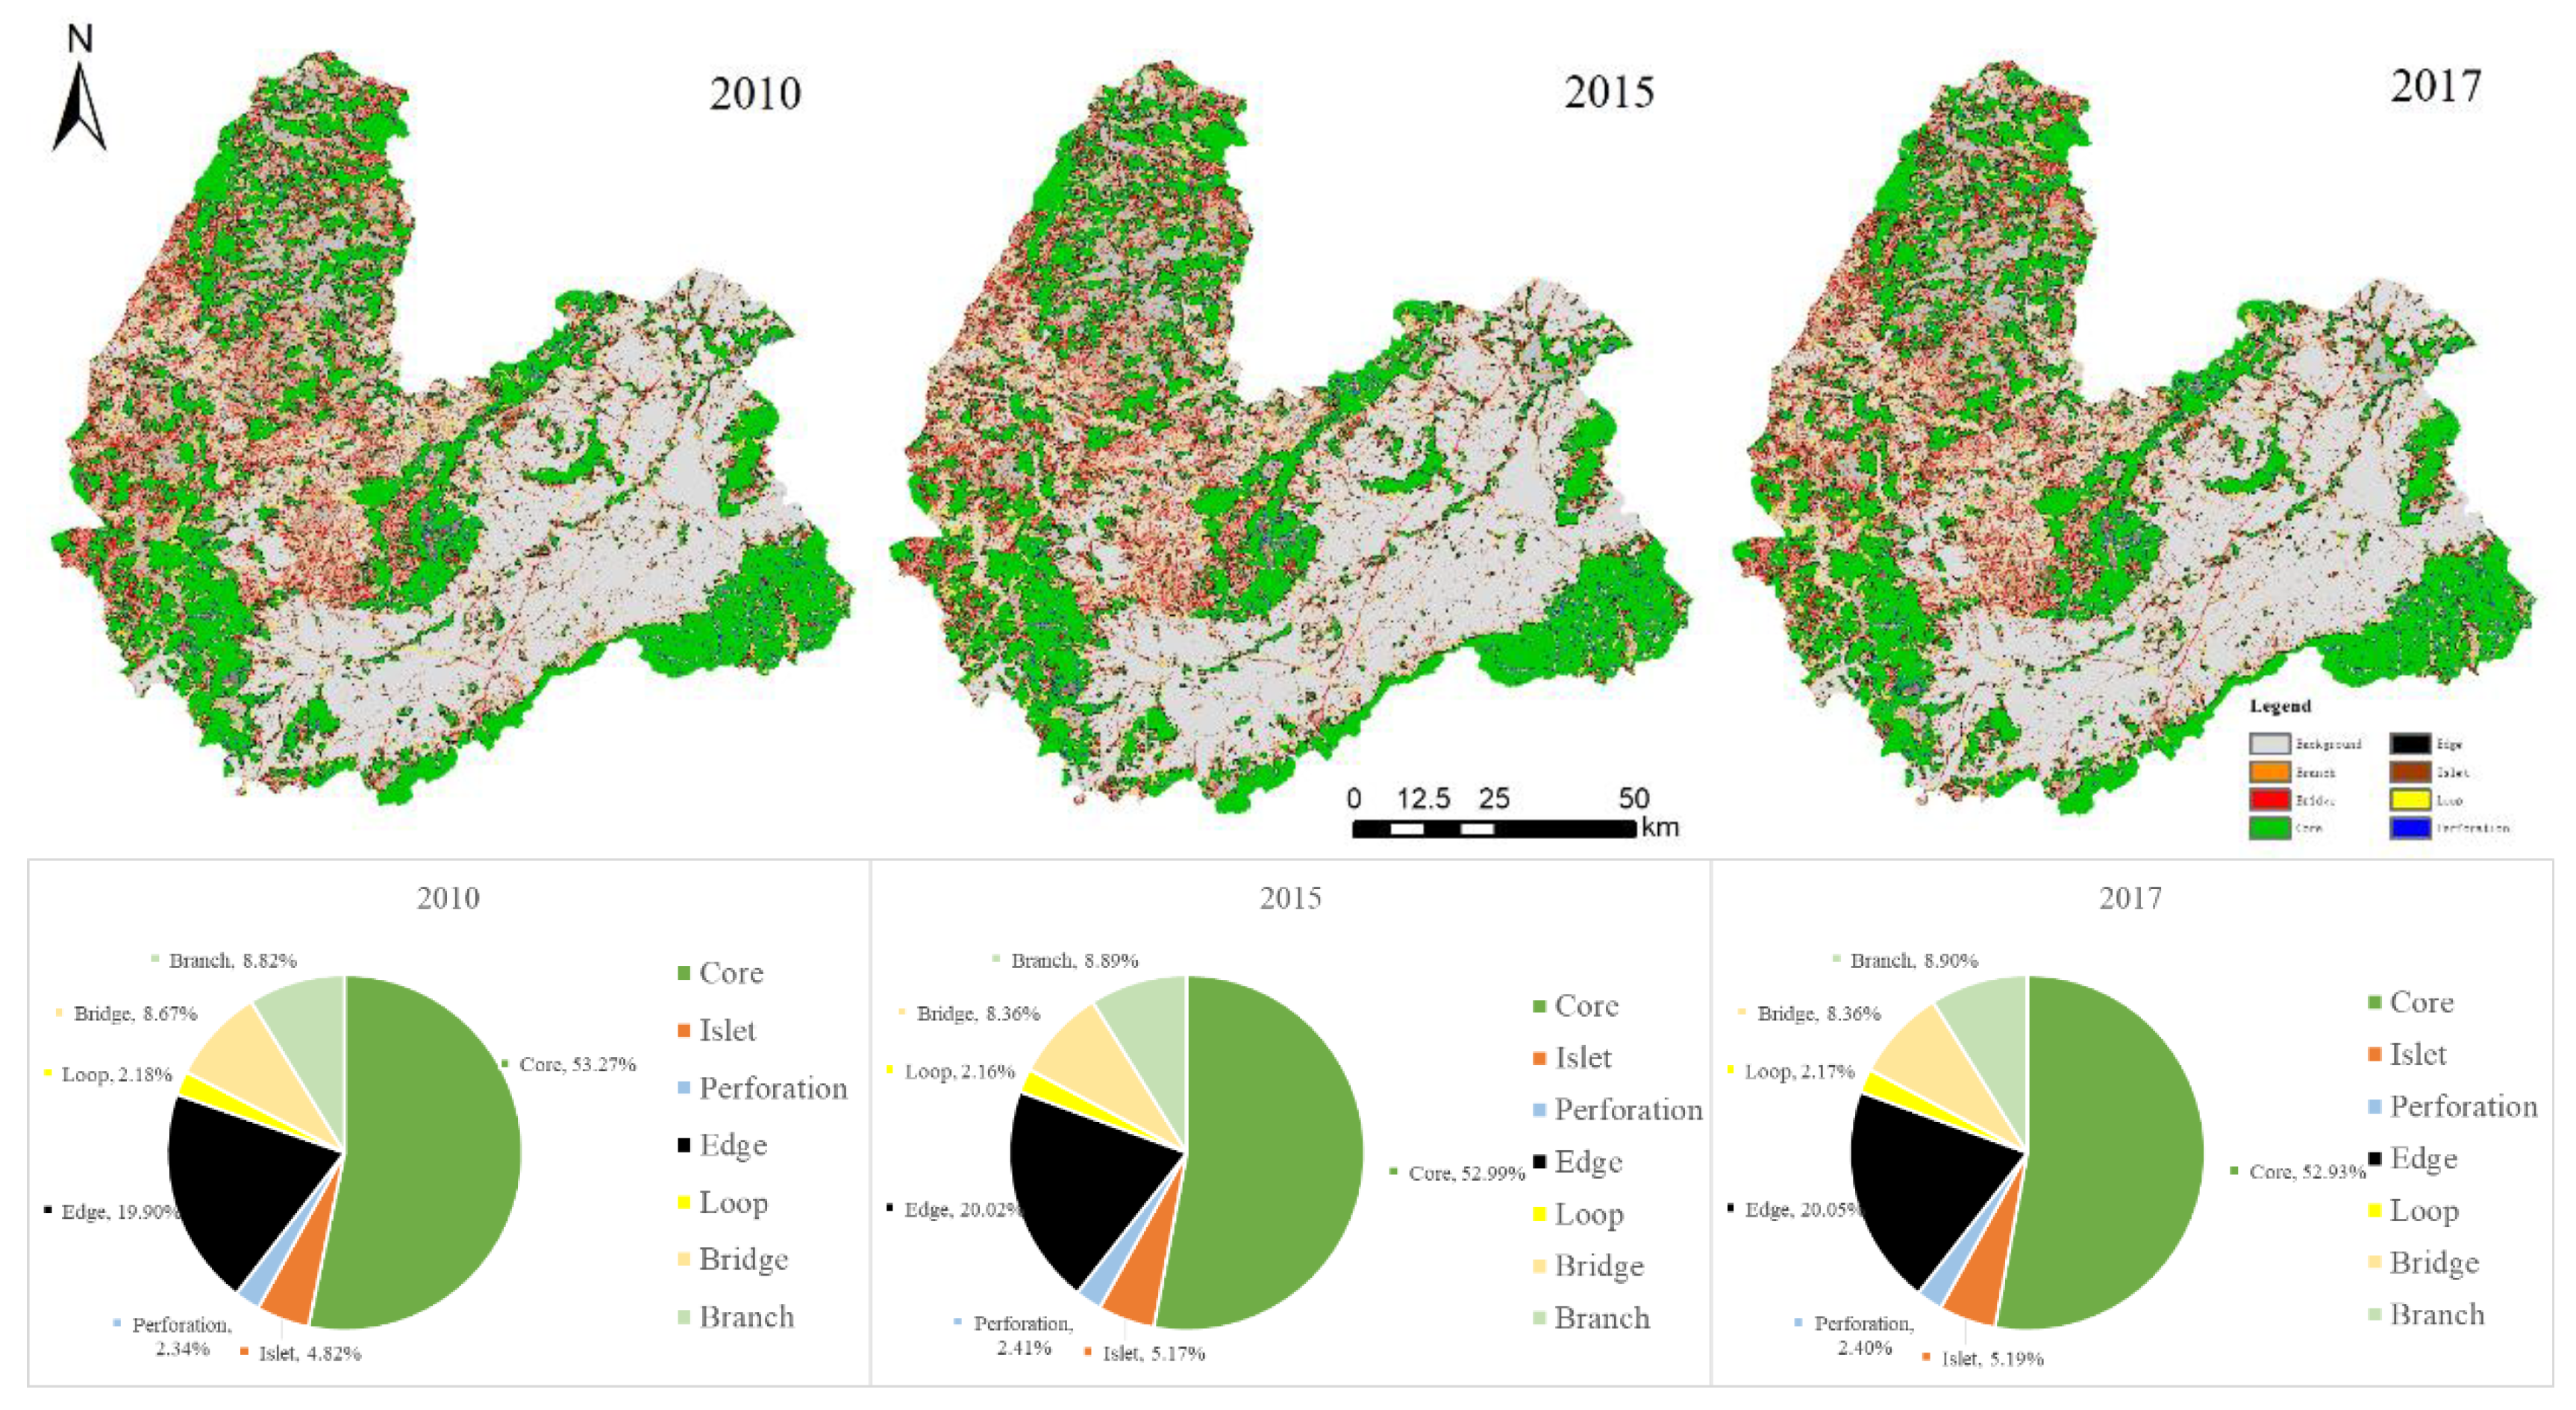
2.3.1. MSPA Pattern Analysis

The MSPA method can extract seven pattern classes at the pixel level, each of which has its own ecological meaning (Table 2). Using the MSPA method, the raster data of the current land-use needs to be binarized first, and the new layer generated only includes foreground data and background data. Through GUIDOS (Graphic User Interface for the Description of image Objects and their Shapes) software, geometric analysis is conducted on the spatial form of the foreground data [1]. Depending on the land-use type data collected, this study set forest land, grassland, orchard, wetland, and water area as the foreground data and other land-use types as the background data for MSPA [2]. As edge width represents the size of the edge effect produced by the patch and will decide cell numbers identified as core patch, the edge width is set to the default value of 90 m during the pre-process of MSPA [16]. Considering the study area is relatively large, a cell scale of 90 m × 90 m is defined as the main ecological element in the study area. After data accuracy requirements are satisfied, MSPA patterns analysis is conducted with the help of GUIDOS software [1].

2.3.2. dPC Analysis Using Conefor 2.6

The probability of connectivity (PC) and the important values of the patches (dPCs) are vital to analysis in identifying ecological sources [8,10]. As landscape connectivity affects the degree of migration and movement of organisms between different patches, landscape connectivity is of great significance to ecological processes, biodiversity protection, and the balance of ecosystems [32,33]. Landscape connectivity can be divided into structural connectivity and functional connectivity [1,8]. Structural connectivity represents the physical landscape connectivity, which reflects the continuity of the landscape on a spatial scale. Regional connectivity of ecological processes is characterized by functional connectivity. Meaning the migration ability of different organisms to different landscapes, functional connectivity is more complicated to evaluate and is usually extended.
Conefor 2.6 is mainly a landscape connectivity recognition software developed by Santiago Saura and Josep Torne [34,35]. The software can calculate the degree of patch connectivity and identify core patches vital to ecological connectivity. The commonly used indicators are the overall connectivity index (IIC), the possible connectivity index (PC), and the patch importance index (dPC). This paper mainly selects the patch importance index (dPC) to evaluate the importance of the core area and determines the ecological source of study area by sorting the size of the patch importance index. The specific formula is shown in Formula (1).
dPC = PC PC remove PC × 100 %
dPC demonstrates the importance of plaques, and the possible connectivity index of a particular patch is demonstrated by PC. The PC value is greater than or equal to 0 and less than or equal to 1. When the PC value grows, the connectivity of the patch is also improved. PC removal represents the possible connectivity index after removing the patch.

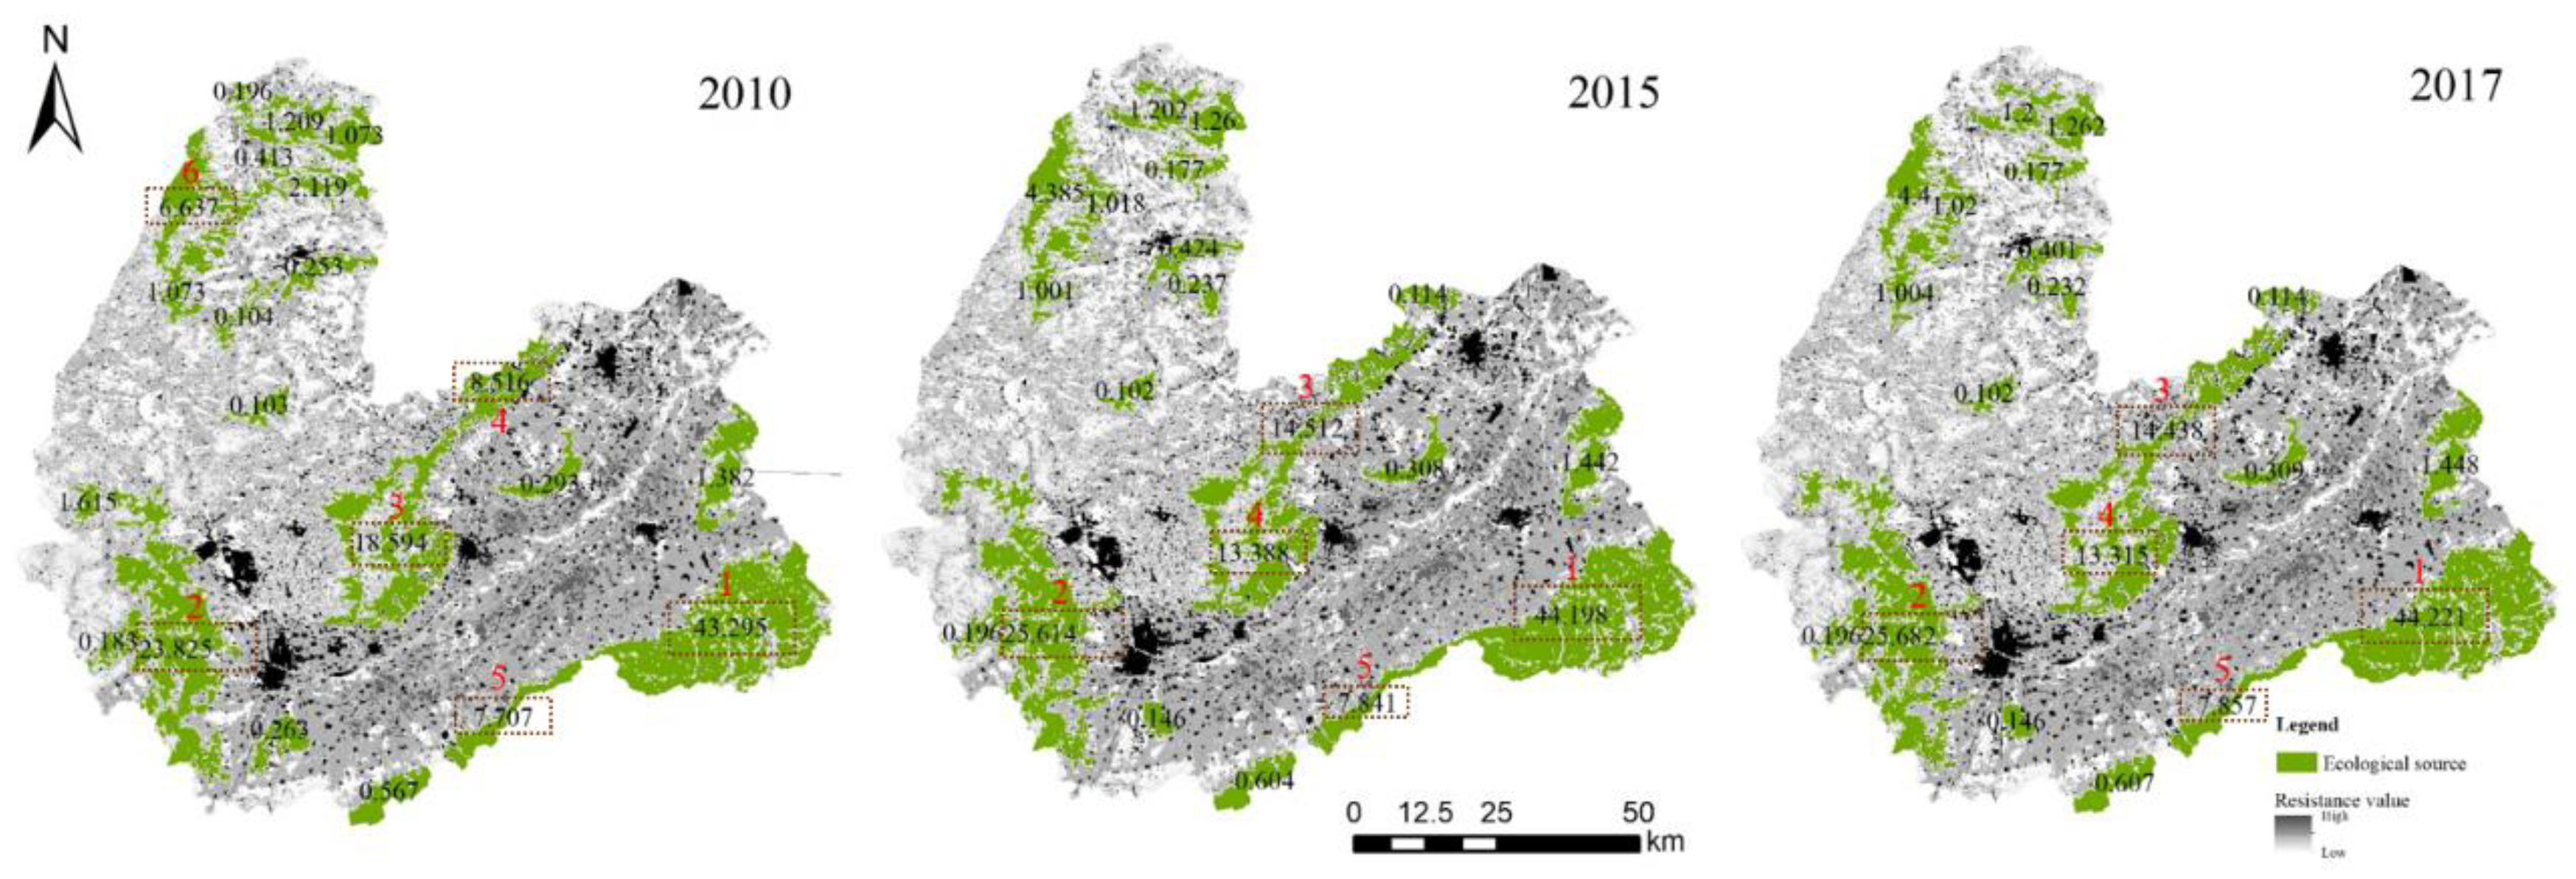
2.3.3. Resistive Surface Construction and Ecological Corridor Identification

In-circuit theory, the landscape is abstracted into units with different resistance values, reflecting the degree of a hindrance to the movement of species or energy in various landscape patches. Land-use types are widely applied in ecological resistance surfaces construction. Different land-use types can directly reflect the types of ecosystems and are the essential resistance factors of ecological resistance surfaces [36]. Concerning the research of Peng Jian et al. [37], the resistance value of each land-use type in the study area is set to 1~300: forest land is 1, the wetland is 5, grassland is 10, the orchard is 20, farmland is 50, unused land is 100, transportation land is 150, construction land is 200, and mining land is 300. Due to the difference in biophysical characteristics of the same land-use, the degree of obstacles formed is different, according to the normalized difference vegetation index (NDVI), temperature vegetation dryness index (TVDI), and waterproof surface coefficient. Impervious surface area (ISA) and DEM elevation data are used to correct the resistance value. First, the study area’s construction land and non-construction land (including forest land, grassland, orchard, wetland, farmland, water area, and other land types) are revised separately. Considering the impact of elevation differences on species movement and gene exchanges, DEM data was used for both construction land and non-construction land for correction. The normalized vegetation index reflects the vegetation coverage status and the quality of the habitat [38]; the temperature vegetation drought index can indicate the surface water content; the higher the value, the lower the surface water content [39,40]. The average annual evaporation of the study area is much greater than the precipitation. The surface water content is the main limiting factor for vegetation growth. Therefore, TVDI and NDVI are selected to correct the resistance value of non-construction land. The impervious surface index ISA is the proportion of waterproof materials in the pixel that reflects human activities intensity [41]. Use an impervious index to correct construction land resistance value. This paper constructs the resistance value formulas of different land types:
R = Cf × R i
In Formula (2): Ri represents the resistance value of ground category i; Cf is the correction coefficient, which is composed of TVDI, NDVI, ISA, and DEM. The calculation formula is as follows:
Cf = 1 / 2 f + 1 / 2 DEM
Use the Linkage Mapper tool on the ArcGIS 10.2 platform to extract the corridors with the least resistance to connecting ecological sources. The calculation steps are: create a weighted cost distance surface by calculating the cost weighted distance (CWD) from each pixel on the resistance surface to the nearest source; calculate the least cost path (LCP) in the direction of the ecological corridor; finally, set the cutoff Distance (this article put the cutoff distance to 5000) to generate galleries.

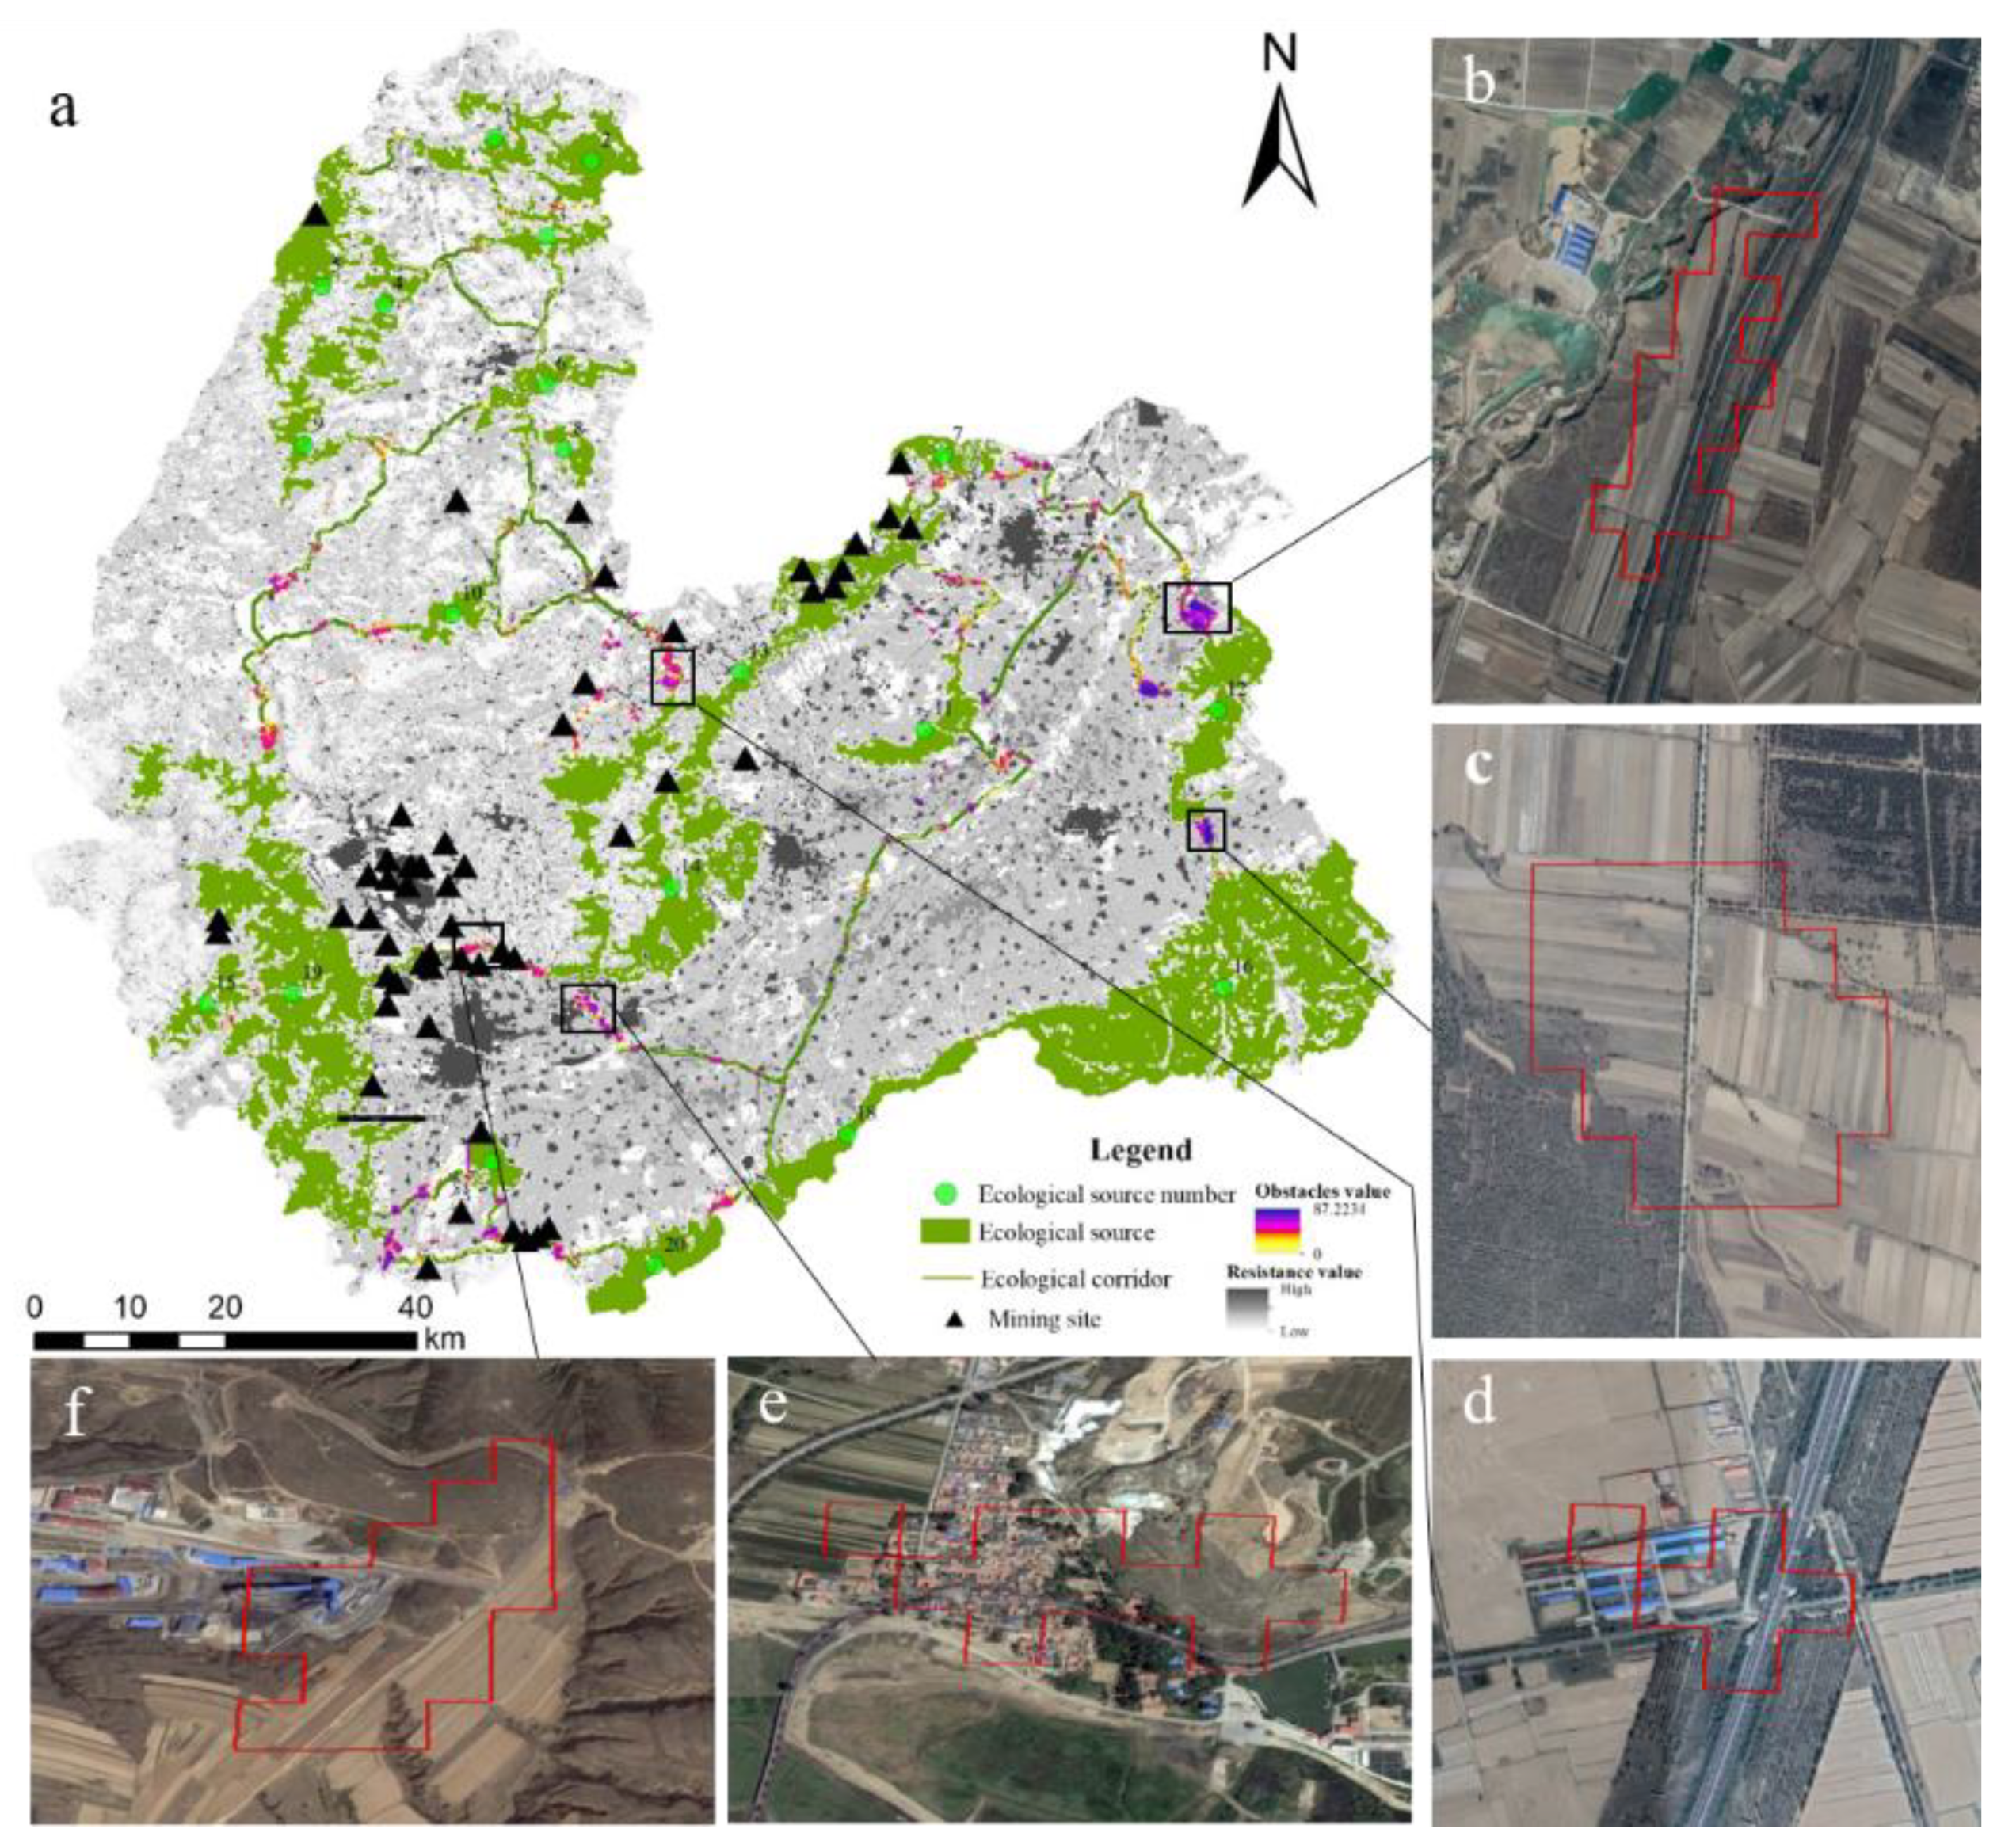
2.3.4. Obstacles Identification and Ecological Zoning

This indicates the area where the resistance to the movement of the species is more excellent between the source areas. The key point of restoration in this paper is the obstacle point located in the ecological corridor in 2017. After the restoration, the connectivity between the source areas can be greatly improved. By setting the search radius of the moving window, use the Barrier Mapper tool to identify obstacles. The experiment of adjusting the search radius shows that when the radius is less than 200 m, some obstacles are not recognized; the position of obstacles greater than 200 m remains unchanged, so this paper sets the search radius to 200 m. The ratio of the difference ΔLCD to the search radius D before and after the pixel resistance value is changed (ΔLCD/D, that is, the improvement per meter) is used to characterize connectivity improvement after the obstacle is removed. When the ratio increases, the degree of connectivity between the source areas also increases. After the obstacles are identified, they are superimposed with the current land-use map to analyze their current uses and formulate restoration strategies based on their spatial distribution. The systematic restoration of industrial and mining land should be continuously promoted from part to the whole, from meeting the necessary needs of ecological safety to improving conditions, forming a distribution of point, line, and surface restoration projects. Therefore, taking the urgency, completeness, and integrity of the system restoration as the goal, the key restoration points are set as the first-level restoration area. Except for the critical issues in 2017, the ecological corridors are selected as the second-level restoration area. The corridors that disappeared in 2000–2017 is designated as a three-level repair area.

3. Results

To fully demonstrate characteristics of ecological structure and function in the study area, this section consists of three parts. Land-use patterns, MSPA patterns, ecological sources, ecological corridors, and obstacles are established in sequence. ESP identification and optimization are explored, focusing on obstacles restoration and environmental zoning.

3.1. Ecological Distribution Characteristics

Figure 3 and Figure 4 show the spatial distribution and area changes of land-use types from 2010 to 2017. During this period, grassland, woodland, farmland, orchard, wetland, industrial and mining land, and unused land decreased. The decreasing rate was orchard (−5.39%) and unused land (−3.02%), industrial and mining land (−1.9%), grassland (−0.92%), woodland (−0.68%), wetland (−0.49%), and farmland (−0.19%). At the same time, from 2010 to 2017, the residential areas and transportation land area increased, with the area of residential areas increasing by 10.19% and the area of transportation land increasing by 8.54%. The growth of residential areas and transportation land is the most stable and significant. The expansion edge is mainly located in the residential area of Shuocheng District in the southwest. The expansion area of traffic land is mainly located between the residential areas of the counties, urban areas, and other areas—the traffic arteries of the city.
MSPA patterns distribution of study area from 2010 to 2017 is shown in Figure 5. As listed above, this study regards forest land, grassland, orchard, wetland, and water as the prospect analysis land categories of MSPA. The core area accounts for 52.93% of the foreground area. As structural corridors in the landscape, bridges account for about 8.36% of the total area of the foreground data. Both edges and perforations are affected by edge effects; these regions account for 20.05% and 2.40% of the foreground data area, respectively. The branch is the interruption of the corridor connection, accounting for 8.90% of the foreground data area. Islets are isolated patches, accounting for approximately 5.19% of the foreground data area. Loop is conducive to species migration in the same patch, accounting for 2.17% of the prospect data area [1].
From 2010 to 2017, the number and area of Shuozhou City’s ecological sources declined, and the ecological sources within the city were unevenly distributed. Figure 6 shows the ecological sources and resistance surface in 2010, 2015, and 2017. Results show that Shuozhou City had 21 ecological sources in 2010, 20 ecological sources in 2015, and 20 ecological sources in 2017. Among them, the ecological sources with dPC > 5 were 6, 5, and 5 in 2010, 2015, and 2017, respectively. These ecological sources with dPC > 5 are large-scale ecological patches. Nanshan Nature Reserve in Yingxian County in the southeast, Zijin Mountain Nature Reserve in Shuozhou City in the southwest, Sanggan River Reserve the north-central and northwest. These ecological sources are distributed in blocks or strips in the study area’s outer suburbs and central area, such as the southeast, southwest, north-central, northwestern areas, and central-western and central-eastern parts of the hinterland of the study area. The ecological source is scarce in the other regions, and space is scattered, which significantly affects the local ecological connectivity. The total area of the three phases of ecological source areas are 1923.35 km2, 1873.93 km2, and 1869.37 km2, respectively, accounting for 18.14%, 17.68%, and 17.64% of the total area. Focusing on 2017, the ecological sources marked by the red numbers 1 and 2 and 5 have remained stable. Still, the ecological source 3 increased significantly from 83.20 km2 in 2010 to 176.12 km2 with an increase of 111.68%. On the other hand, ecological source 4 decreased significantly with its area changing from 255.99 km2 to 157.63 km2 in 2017, dropping 38.42% in 7 years.

3.2. Ecological Corridors and Obstacles Identification

From 2010 to 2017, the number of ecological corridors in Shuozhou City decreased slightly, and the total length of the least costly path and the area of ecological corridors increased (Figure 7). The number of ecological corridors in 2010 was 34, and the number of ecological corridors in 2015 was 33. The total length of the minimum cost path increased from 555.95 km to 605.62 km, increasing 8.93%. It shows that the ecological source area of the study area saw a decline in landscape connectivity from 2010 to 2017, and the area with a significant decrease in connectivity was mainly located in Youyu County in the northern part of the study area. The scope of ecological source area decreased, and the length of ecological corridors increased. The area of potential ecological corridor restoration has increased. From 2010 to 2017, the areas of ecological corridors (corridor currents) in Shuozhou City were 567.63 km2, 697.22 km2, and 700.61 km2, respectively, accounting for 5.36%, 6.58%, and 6.61% of the total area of Shuozhou City. From 2010 to 2017, the area of ecological corridors in Shuozhou City increased by 23.43%. It is found that the land-use types in the potential ecological corridor area in Shuozhou City in 2017 are mainly: woodland (65.45%), grassland (18.98%), farmland (9.03%), wetland (4.77%), the proportions of unused land, construction land, mining land, and transportation land are all less than 1%.
From 2010 to 2017, the number of obstacles in the study area increased, mainly distributed around residential areas, industrial and mining land, and transportation. The Barrier Mapper tool identified obstacles in the three phases of study areas as 63 in 2010, 69 in 2015, and 80 in 2017. The total area of obstacles in 2010–2017 was 7.88 km2, 8.48 km2, and 10.17 km2. Among them, the obstacles on the corridor are 44 in 2010, 46 in 2015, and 54 in 2017. The total area of the obstacles on the corridor is 4.31 km2, 5.01 km2, and 6.10 km2, respectively; most of them are located in the middle south area of Shuozhou City. Results show that land-use types in the obstacles are mainly farmland, unused land, transportation land, and construction land. In 2010, the proportion of farmland in the obstacles of Shuozhou City reached 72.84%, and the proportion of unused land reached 11.29%. In 2017, the proportion of farmland in the obstacles of Shuozhou City further increased to 80.88%, the proportion of unused land was 6.85%, and that of transportation land. The ratio is 4.27%, and construction land accounts for 4.15%. These blocks of human activity destroys local habitats’ quality, and contiguous areas of unused land, transportation land, and construction land have separated the habitat.

3.3. ESP Identification and Optimization

Obstacle point analysis provides a visual representation of key elements that impact ecological connectivity and provides key information for ESP optimization [1]. Through the Barrier Mapper tool, 80 obstacles were identified in 2017, with an area of 10.17 km2, of which 54 obstacles were located on the corridor, with an area of 6.1 km2 (Figure 8). The land-use types of obstacles are mainly farmland, unused land, transportation land, and construction land. Obstacles in 2017 are distributed primarily on the eastern suburbs, the mining area in the north-central area, and the residential and mining areas in the south. These areas also have a certain amount of ecological corridors, but they are usually narrow. Therefore, repairing obstacles and even obstacles on ecological corridors is of great value to the overall landscape connectivity [1,8]. Obstacles with high ecological resistance coefficients are mainly distributed in farmland, residential areas, or around these areas [8]. As mentioned above, between 2010 and 2017, the residential regions in Shuozhou City increased by 10.19%, and the area of transportation land increased by 8.54%. Figure 8e,f show real-life photos of residential areas at obstacles. Such areas have a negative effect on the ESP. Therefore, the key to protecting and repairing such obstacles is to scientifically plan residential area expansion activities [2]. Timely ecological restoration of abandoned land in residential areas while strengthening vegetation restoration ensures connectivity between source areas. At the same time, transportation land increasing is highly related to the process of urban development. The negative effect of transportation land on the connectivity of the landscape pattern is worthy of attention, and their live pictures are shown as in Figure 8b–d.
Based on ESP identified above, it is suggested to establish a framework of “one protection area, two regulation areas, and three restorations area” to optimize the ESP of the study area (Figure 9) [8]. The ecological sources are unevenly distributed in the study area, the ecological corridors are tight and narrow, and the intensity of human construction disturbance is relatively high. First of all, setting a protection area of the ecological sources area is vital. According to the research results, the study area has 20 ecological sources in 2017, with an area of 1869.37 km2, accounting for 17.64% of Shuozhou City. It is an important part of the ESP locally. Secondly, it regulates and supervises construction areas dominated by residential areas and transportation land and mining areas dominated by coal mines. The area is 549.79 km2 and contains 53 mines. Regulation on construction land and mines can reduce the conflict and promote the long-term stability of the ESP. Additionally, limiting the uncontrolled growth of construction land will maximize urban ecosystem services [42]. Finally, delimit the three-level ecological restoration areas of Shuozhou City. It is suggested to set the obstacles as the first-level ecological protection and restoration area with an area of 10.17 km2. The potential ecological corridor area in 2017 is proposed to be the secondary ecological protection and restoration area, which includes 33 ecological corridors and an area of 700.61 km2. The ecological corridor area of 159.40 km2 that disappeared from 2010 to 2017 is advised to be set as a tertiary ecological protection and restoration area because it has an excellent ecological endowment before being destroyed and can improve landscape connectivity. Land-use types in different restoration areas are shown in Table 3. In summary, the role and significance of zoning an optimized ESP are to ensure the ecosystem services of ecological sources, limit the disruption of ecological connectivity by urban expansion and resource exploitation, and the decline and loss of ecosystem services [5,8,24]. Through the comprehensive optimization of points, lines, and planes (such as restoration of obstacles and ecological corridors, and protection of ecological sources), optimized ESP will improve ecological connectivity of the study area, promote regional ecosystem services, and maintain biodiversity by facilitating species migration across the whole area [1,9,42].

4. Discussion

4.1. Distribution Characteristics of Ecological Sources

Ecological sources are the cornerstone of the ESP and core patches that provide ecosystem service [1,2,3]. Expansion of construction land and long-term mining activities has a major impact on the disturbance of natural ecosystems, primarily distributed in the ecological source area. Landscape characteristics also have a significant impact. For example, ecosystems in Shuohzou City have to face the harsh challenges of high cold and drought. The factors above have caused Shuozhou City’s ecosystem vulnerability. Therefore, identifying key ecological sources to protect is of great significance in protecting different ecosystems. The Sanggan River Basin, Nanshan Provincial Nature Reserve, and Zijinshan Provincial Nature Reserve are essential ecological barriers and oases in the study area. Long-term protection of these areas requires scientific planning by local government to active ecological conservation and restoration measures. Source 1 contains Yingxian Nanshan Provincial Nature Reserve and Yingxian Town Ziliang Provincial wetland parks, the former is a provincial forest ecological reserve in Shanxi, providing essential places for wildlife and water conservation, and the latter, as wetland parks, provide habitats for migrating waterfowl and play an essential role in maintaining ecological security. Source 2 is the Zijinshan Provincial Nature Reserve in Shuozhou City, which plays a vital role as an ecological barrier to the severe land disturbances caused by mining and urban expansion in the east of the mining area, and to guarantee the sustainability of the ecosystem and optimize the ecology at the edge of urban growth. The environment provides essential value. Sources 3 and 4 are the Sanggan River Provincial Reserve in Shanxi. It is a nature reserve that mainly protects poplars, Pinus sylvestris, Pinus tabulaeformis plantations, and wild animals, migrating waterfowl, and their habitats. It is a wetland in Shanxi Province. The largest nature reserve in the area retains various ecological systems, which have the unique value of protecting the natural background, storing species, maintaining the value of natural aesthetics, and cultivating natural aesthetics. Source 5 as mainly consists of forest is located on the southern outskirts of the study area, which plays a vital role in constructing the “Southwestern Baili Ecological Corridor” in Shuozhou City. It is worth noting that the importance of ecological source patches in Youyu County, the northernmost part of Shuozhou City, declined between 2010 and 2017. The increase in the distance has served as a warning to the ESP of the region and the study area as a whole [1].

4.2. Multi-Year ESP Characteristics of Shuozhou City

The evaluation results show hidden dangers in the overall ESP, and the spatial distribution of ecological sources is unbalanced. While ecosystems and ecosystem services are pretty vulnerable to human activities, land-use change (mostly related to infrastructural development in the urban expansion process) is regarded as having a tremendous impact on ecosystem services [26,43]. For example, study shows that the global loss of ESV caused by land-use changes from 1997 to 2011 was 4.3–20.2 trillion USD per year [44]. Back to this research, the overall regional connectivity is poor, and the east–west faults are serious, increasing the resistance to the migration of biological species. The interference of the infrastructural development in urban expansion and coal mining aggravates the loss of ESV in the whole city area. The increase of construction land and the development of agricultural lands, such as farmland, also makes the habitat in the study area more fragmented and the connectivity further decreased, as shown in Table 3. The analysis of obstacles and ecological corridors shows that from 2010 to 2017, the fragmentation of ecological sources in Youyu County in the north of Shuozhou City has increased, and the weighted cost path has increased. However, the ecological corridors in the north are still dense and can be targeted. In this area, measures such as afforestation and water and soil conservation will be increased to control and reduce the frequency and intensity of human activities (such as urban expansion, transportation construction, and mining development, etc.). Shanyin County in the central part of Shuozhou City and Ying County in the east and central part of Shuozhou City have scarce ecological sources and a small number of ecological corridors. Identifying obstacles in the area and prioritizing ecological protection and restoration zoning will play a key role in improving the landscape connectivity of the area. At the same time, Yingxian County in the southeast of Shuozhou City, Shuocheng District in the southwest, the central and northern Shanyin County, and the northwestern part of Huairen City has a large number of ecological source areas. It is imperative. Based on the Chinese government’s ecological restoration strategy, an integrated management model of mountains, water, forests, fields, lakes, and grasses can be constructed, and the coupling between ecological processes can be analyzed in-depth, which will help optimize the local ESP and promote the sustainable development of both urban and environment [45].

4.3. Strategy of ESP Optimization in Shuozhou City

Characterized by vast amounts of coal resources and a fragile arid environment, Shuozhou City faces twin ecological challenges of urban expansion and coal mining [8]. As described earlier, it is proposed to establish a framework of regional ecological protection, regulation, and restoration areas, i.e., one protected area (ecological sources), two key regulation areas (construction area and mining area), and three key restoration areas (obstacles, ecological corridors, and disappearing ecological corridors) to optimize the ESP in the study area. Considering the arid and cold climate conditions and previous experience, forest and grassland ecosystems are the priority options for ecological conservation and restoration in Shuozhou City. Monitoring and protecting of water and lake ecosystems are essential, as they undertake important water conservation and biodiversity maintenance functions. Considering the small proportion of water area in the identified ecological corridors and obstacles, their restoration level is relatively low. Unused land is the prominent place where soil erosion occurs. The protection and restoration of unused land need to be planned and implemented scientifically based on ecological studies.
Specifically, it is suggested putting efforts on farmland protection, grassland conservation, woodland nurturing, and wetland protection in the first-level restoration area. In the secondary restoration area, the protection and preservation of ecological land are still strengthened. The landscape connectivity between the unused farmland, forest land, and grassland, the restoration of damaged land, and the water and soil conservation are also emphasized. The tertiary protection and restoration area reflect the invasion and destruction of ecological corridors by land-used for transportation and residential areas. The proportion of traffic land in the tertiary restoration area increased from 1.02% to 2.15% from 2010 to 2017. The increase was 110.78%; the ratio of residential areas increased from 0.35% to 1.65%, increasing 371.43%. Meanwhile, although the area of industrial and mining land in the ecological protection and restoration area is small, from spatial distribution, the amount of obstacles around industrial and mining land and ecological restoration areas is relatively large. Restoration measures such as mine wasteland restoration and vegetation restoration on both sides of the road based on strengthening the habitat management and protection are vital to reinforce ecological restoration conservation and landscape connectivity [46]. Furthermore, the protection and optimization of environment based on different ecological restoration projects can enhance the regional ecological security and maximize ESV as it is well-known resource-based cities’ mining and ecological restoration are simultaneous [8,24].

5. Conclusions

Habitats close to urban sprawl edge and human activity areas are facing the challenge of fragmentation, shrinkage and functional degradation, while habitats near ecological sources normally have a more stable situation and healthy ecosystem service function. Based on ESP identification and optimization, this study focus on improving ecological connectivity and structure function of the study area. It is suggested to prioritize the protection and restoration of ecological sources, ecological corridors, and obstacles. Specifically, this study proposes different levels of restoration strategies [37,47], and the research conclusions are as follows: From 2010 to 2017, ecological sources dropped from 21 to 20, and the total area dropped from 1923.35 km2 to 1869.37 km2 in 2017. Additionally, the number of ecological corridors has decreased from 34 to 33 in almost one decade. Obstacles of the study area also increased from 63 to 80 since 2010. This paper proposed an optimized ESP by zoning “one protection area, two regulation areas, and three restorations areas.” Firstly, prioritize protecting 20 ecological source areas, with a total area of 1869.37 km2, accounting for 17.64% of the whole city. Secondly, construction land is suggested to be under supervision and management with an area of 549.79 km2 and contains 53 mines. Finally, the primary restoration area is the obstacles according to the priority of protection and restoration. It counts for an area of 10.17 km2. The secondary restoration area is the 2017 ecological corridor with an area of 700.61 km2. The tertiary restoration area is the disappearance of the 2000–2017 potential ecological corridor with an area of 159.40 km2. This study on identifying and optimizing the ESP of resource-based cities based on the MSPA method and circuit theory can be a valuable reference for urban planners and similar resource-based cities such as Ordos City and Yulin City [1,2,27].
This study aims to explore the landscape connectivity and ecological function of the study area by combining MSPA and circuit theory [1]. Nevertheless, there is still room for adjustment in different application scenarios of the MSPA approach despite it provides a new method for landscape analysis. The establishment of a comprehensive ecological source identification system will also make up for the limitations of MSPA in in situ identification [18]. Circuit theory may ignore some details of the actual movement characteristics such as biological migration may be affected by human buildings such as houses and roads. Furthermore, this study did not conduct mainstream ecosystem service analysis and quantitative evaluation of optimized ESP’s ecosystem service value. This will be the focus of subsequent research to complete this study and better support local ecological conservation decisions.

Author Contributions

Formal analysis, R.Y. and Z.B.; investigation, R.Y.; methodology, R.Y. and Z.S.; writing—original draft, R.Y.; writing—review and editing, R.Y. and Z.B. All authors have read and agreed to the published version of the manuscript.

Funding

This research was funded supported by National Science Foundation of China (41571508).

Institutional Review Board Statement

Not applicable.

Informed Consent Statement

Not applicable.

Data Availability Statement

Data is available for use upon request.

Acknowledgments

We appreciate Jiyuan Cheng and Huihui Wang, for their skillful assistance in laboratory and field work, and Mingjie Qian for the support in the field work.

Conflicts of Interest

The authors declare no conflict of interest.

References

  1. An, Y.; Liu, S.; Sun, Y.; Shi, F.; Beazley, R. Construction and optimization of an ecological network based on morphological spatial pattern analysis and circuit theory. Landsc. Ecol. 2021, 36, 2059–2076. [Google Scholar] [CrossRef]
  2. Peng, J.; Yang, Y.; Liu, Y.; Hu, Y.; Du, Y.; Meersmans, J.; Qiu, S. Linking ecosystem services and circuit theory to identify ecological security patterns. Sci. Total. Environ. 2018, 644, 781–790. [Google Scholar] [CrossRef] [Green Version]
  3. Wang, C.; Yu, C.; Chen, T.; Feng, Z.; Hu, Y.; Wu, K. Can the establishment of ecological security patterns improve ecological protection? An example of Nanchang, China. Sci. Total. Environ. 2020, 740, 140051. [Google Scholar] [CrossRef]
  4. Nathwani, J.; Lu, X.; Wu, C.; Fu, G.; Qin, X. Quantifying security and resilience of Chinese coastal urban ecosystems. Sci. Total. Environ. 2019, 672, 51–60. [Google Scholar] [CrossRef]
  5. Almenar, J.B.; Bolowich, A.; Elliot, T.; Geneletti, D.; Sonnemann, G.; Rugani, B. Assessing habitat loss, fragmentation and ecological connectivity in Luxembourg to support spatial planning. Landsc. Urban Plan. 2019, 189, 335–351. [Google Scholar] [CrossRef]
  6. Su, Y.; Chen, X.; Liao, J.; Zhang, H.; Wang, C.; Ye, Y.; Wang, Y. Modeling the optimal ecological security pattern for guiding the urban constructed land expansions. Urban For. Urban Green. 2016, 19, 35–46. [Google Scholar] [CrossRef]
  7. Peng, J.; Pan, Y.; Liu, Y.; Zhao, H.; Wang, Y. Linking ecological degradation risk to identify ecological security patterns in a rapidly urbanizing landscape. Habitat Int. 2018, 71, 110–124. [Google Scholar] [CrossRef]
  8. Li, S.; Xiao, W.; Zhao, Y.; Lv, X. Incorporating ecological risk index in the multi-process MCRE model to optimize the ecological security pattern in a semi-arid area with intensive coal mining: A case study in northern China. J. Clean. Prod. 2020, 247, 119143. [Google Scholar] [CrossRef]
  9. Yu, K. Security patterns and surface model in landscape ecological planning. Landsc. Urban Plan. 1996, 36, 1–17. [Google Scholar] [CrossRef]
  10. Estrada-Carmona, N.; Martínez-Salinas, A.; De Clerck, F.A.J.; Vílchez-Mendoza, S.; Garbach, K. Managing the farmscape for connectivity increases conservation value for tropical bird species with different forest-dependencies. J. Environ. Manag. 2019, 250, 109504. [Google Scholar] [CrossRef] [PubMed]
  11. Kattel, G.R.; Elkadi, H.; Meikle, H. Developing a complementary framework for urban ecology. Urban For. Urban Green. 2013, 12, 498–508. [Google Scholar] [CrossRef] [Green Version]
  12. Almenar, J.B.; Elliot, T.; Rugani, B.; Philippe, B.; Gutiérrez, T.N.; Sonnemann, G.; Geneletti, D. Nexus between nature-based solutions, ecosystem services and urban challenges. Land Use Policy 2021, 100, 104898. [Google Scholar] [CrossRef]
  13. Aminzadeh, B.; Khansefid, M. A case study of urban ecological networks and a sustainable city: Tehran’s metropolitan area. Urban Ecosyst. 2010, 13, 23–36. [Google Scholar] [CrossRef]
  14. Epps, C.W.; Mutayoba, B.M.; Gwin, L.; Brashares, J.S. An empirical evaluation of the African elephant as a focal species for connectivity planning in East Africa. Divers. Distrib. 2011, 17, 603–612. [Google Scholar] [CrossRef]
  15. Kool, J.T.; Moilanen, A.; Treml, E. Population connectivity: Recent advances and new perspectives. Landsc. Ecol. 2013, 28, 165–185. [Google Scholar] [CrossRef]
  16. Soille, P.; Vogt, P. Morphological segmentation of binary patterns. Pattern Recognit. Lett. 2009, 30, 456–459. [Google Scholar] [CrossRef]
  17. Wickham, J.D.; Riitters, K.H.; Wade, T.G.; Vogt, P. A national assessment of green infrastructure and change for the conterminous United States using morphological image processing. Landsc. Urban Plan. 2010, 94, 186–195. [Google Scholar] [CrossRef]
  18. Li, J.; Xu, J.; Chu, J. The Construction of a Regional Ecological Security Pattern Based on Circuit Theory. Sustainability 2019, 11, 6343. [Google Scholar] [CrossRef] [Green Version]
  19. Carroll, C.; Roberts, D.R.; Michalak, J.; Lawler, J.J.; Nielsen, S.E.; Stralberg, D.; Hamann, A.; McRae, B.H.; Wang, T. Scale-dependent complementarity of climatic velocity and environmental diversity for identifying priority areas for conservation under climate change. Glob. Chang. Biol. 2017, 23, 4508–4520. [Google Scholar] [CrossRef]
  20. Proctor, M.F.; Nielsen, S.E.; Kasworm, W.F.; Servheen, C.; Radandt, T.G.; MacHutchon, A.G.; Boyce, M.S. Grizzly bear connectivity mapping in the Canada-United States trans-border region. J. Wildl. Manag. 2015, 79, 544–558. [Google Scholar] [CrossRef]
  21. Pittiglio, C.; Skidmore, A.K.; Van Gils, H.A.M.J.; McCall, M.; Prins, H.H.T. Smallholder Farms as Stepping Stone Corridors for Crop-Raiding Elephant in Northern Tanzania: Integration of Bayesian Expert System and Network Simulator. Ambio 2013, 43, 149–161. [Google Scholar] [CrossRef] [Green Version]
  22. Kreuter, U.P.; Harris, H.G.; Matlock, M.D.; Lacey, R. Change in ecosystem service values in the San Antonio area, Texas. Ecol. Econ. 2001, 39, 333–346. [Google Scholar] [CrossRef]
  23. Matteucci, S.D.; Morello, J. Environmental consequences of exurban expansion in an agricultural area: The case of the Argentinian Pampas ecoregion. Urban Ecosyst. 2009, 12, 287–310. [Google Scholar] [CrossRef]
  24. Wang, W.; Guo, H.; Chuai, X.; Dai, C.; Lai, L.; Zhang, M. The impact of land use change on the temporospatial variations of ecosystems services value in China and an optimized land use solution. Environ. Sci. Policy 2014, 44, 62–72. [Google Scholar] [CrossRef]
  25. Elliot, T.; Almenar, J.B.; Rugani, B. Modelling the relationships between urban land cover change and local climate regulation to estimate urban heat island effect. Urban For. Urban Green. 2020, 50, 126650. [Google Scholar] [CrossRef]
  26. Xue, M.; Ma, S. Optimized Land-Use Scheme Based on Ecosystem Service Value: Case Study of Taiyuan, China. J. Urban Plan. Dev. 2018, 144, 04018016. [Google Scholar] [CrossRef]
  27. Woodworth, M.D. Ordos Municipality: A market-era resource boomtown. Cities 2015, 43, 115–132. [Google Scholar] [CrossRef]
  28. Yuan, Y.; Zhao, Z.; Niu, S.; Li, X.; Wang, Y.; Bai, Z. Reclamation promotes the succession of the soil and vegetation in opencast coal mine: A case study from Robinia pseudoacacia reclaimed forests, Pingshuo mine, China. Catena 2018, 165, 72–79. [Google Scholar] [CrossRef]
  29. Yuan, Y.; Zhao, Z.; Zhang, P.; Chen, L.; Hu, T.; Niu, S.; Bai, Z. Soil organic carbon and nitrogen pools in reclaimed mine soils under forest and cropland ecosystems in the Loess Plateau, China. Ecol. Eng. 2017, 102, 137–144. [Google Scholar] [CrossRef]
  30. China, M.O.E.A. National Ecological Function Regionalization (Revised Version). 2015. Available online: http://www.mee.gov.cn/gkml/hbb/bgg/201511/t20151126_317777.htm (accessed on 25 June 2021).
  31. Feng, Y.; Wang, J.; Bai, Z.; Reading, L. Effects of surface coal mining and land reclamation on soil properties: A review. Earth-Sci. Rev. 2019, 191, 12–25. [Google Scholar] [CrossRef]
  32. Shaikh, F.; Ji, Q.; Fan, Y. An ecological network analysis of the structure, development and sustainability of China’s natural gas supply system security. Ecol. Indic. 2017, 73, 235–246. [Google Scholar] [CrossRef]
  33. Gao, J.; Du, F.; Zuo, L.; Jiang, Y. Integrating ecosystem services and rocky desertification into identification of karst ecological security pattern. Landsc. Ecol. 2021, 36, 2113–2133. [Google Scholar] [CrossRef]
  34. Baranyi, G.; Saura, S.; Podani, J.; Jordán, F. Contribution of habitat patches to network connectivity: Redundancy and uniqueness of topological indices. Ecol. Indic. 2011, 11, 1301–1310. [Google Scholar] [CrossRef]
  35. Rubio, L.; Saura, S. Assessing the importance of individual habitat patches as irreplaceable connecting elements: An analysis of simulated and real landscape data. Ecol. Complex. 2012, 11, 28–37. [Google Scholar] [CrossRef]
  36. Ye, Y.; Su, Y.; Zhang, H.-O.; Liu, K.; Wu, Q. Construction of an ecological resistance surface model and its application in urban expansion simulations. J. Geogr. Sci. 2015, 25, 211–224. [Google Scholar] [CrossRef]
  37. Peng, J.; Jia, J.L.; Hu, Y.N.; Tian, L.; Li, H.L. Construction of ESP in the agro-pastoral ecotone based on surface humid index: A case study of Hangjin Banner, Inner Mongolia Autonomous Region, China. Chin. J. Appl. Ecol. 2018, 29, 1990–1998. (In Chinese) [Google Scholar]
  38. Zhao, L.; Dai, A.; Dong, B. Changes in global vegetation activity and its driving factors during 1982–2013. Agric. For. Meteorol. 2018, 249, 198–209. [Google Scholar] [CrossRef]
  39. Chen, B.; Zhang, X.; Hua, K.; Xu, K. Application study of temperature vegetation drought index (TVDI) in grassland drought monitoring. Arid. Land Geogr. 2013, 36, 930–937. [Google Scholar]
  40. Sandholt, I.; Rasmussen, K.; Andersen, J. A simple interpretation of the surface temperature/vegetation index space for assessment of surface moisture status. Remote. Sens. Environ. 2002, 79, 213–224. [Google Scholar] [CrossRef]
  41. Liu, Z.H.; Wang, Y.L.; Peng, J.; Xie, M.M.; Li, Y. Using ISA to analyze the spatial pattern of urban land cover change: A case study in Shenzhen. Acta Geogr. Sin. 2011, 66, 961–971. [Google Scholar]
  42. Elliot, T.; Bertrand, A.; Almenar, J.B.; Petucco, C.; Proença, V.; Rugani, B. Spatial optimisation of urban ecosystem services through integrated participatory and multi-objective integer linear programming. Ecol. Model. 2019, 409, 108774. [Google Scholar] [CrossRef]
  43. Delphin, S.; Escobedo, F.; Abd-Elrahman, A.; Cropper, W. Urbanization as a land use change driver of forest ecosystem services. Land Use Policy 2016, 54, 188–199. [Google Scholar] [CrossRef] [Green Version]
  44. Costanza, R.; De Groot, R.; Sutton, P.; Van Der Ploeg, S.; Anderson, S.J.; Kubiszewski, I.; Farber, S.; Turner, R.K. Changes in the global value of ecosystem services. Glob. Environ. Chang. 2014, 26, 152–158. [Google Scholar] [CrossRef]
  45. Fan, F.; Liu, Y.; Chen, J.; Dong, J. Scenario-based ecological security patterns to indicate landscape sustainability: A case study on the Qinghai-Tibet Plateau. Landsc. Ecol. 2021, 36, 2175–2188. [Google Scholar] [CrossRef]
  46. Kang, J.; Zhang, X.; Zhu, X.; Zhang, B. Ecological security pattern: A new idea for balancing regional development and ecological protection. A case study of the Jiaodong Peninsula, China. Glob. Ecol. Conserv. 2021, 26, e01472. [Google Scholar] [CrossRef]
  47. Fu, Y.; Shi, X.; He, J.; Yuan, Y.; Qu, L. Identification and optimization strategy of county ecological security pattern: A case study in the Loess Plateau, China. Ecol. Indic. 2020, 112, 106030. [Google Scholar] [CrossRef]
Figure 1. The spatial location of the study area.
Land 10 00907 g001
Figure 2. Framework for identifying ESP.
Land 10 00907 g002
Figure 3. Land-use type distribution from 2010 to 2017.
Land 10 00907 g003
Figure 4. Percentage change of land-use type area from 2010 to 2017.
Land 10 00907 g004
Figure 5. Distribution and proportion of pattern classes based on MSPA.
Land 10 00907 g005
Figure 6. Ecological sources and resistance surface from 2010 to 2017. Black numbers as their dPC values represent the core patches’ importance, while the red number represents the dPC rank, and the dPC value is greater than 5.
Land 10 00907 g006
Figure 7. Ecological corridors and current distribution in corridors from 2010 to 2017. The black number is the ecological source number.
Land 10 00907 g007
Figure 8. (a) Partial details of corridors and obstacles. Subfigures (bf) are subfigures showing a real view of the obstacles.
Land 10 00907 g008
Figure 9. Ecological protection and restoration zoning.
Land 10 00907 g009
Table 1. Data sources and description.
Data TypeData TimeData AccuracyData Sources
Landsat 5 TM remote sensing image2010/8,
2015/7,
2017/8
30 m, cloud cover is less than 5%USGS (United States Geological Survey, https://earthexplorer.usgs.gov/, accessed on 1 June 2021)
Google Earth map2020/9Level 12Google Earth
Land-use data2010, 2015, 2017Vector dataResource and Environmental Science Data Center of Chinese Academy of Sciences (http://www.resdc.cn, accessed on 1 June 2021), Shuozhou City Government
Digital elevation model201030 mGeo-spatial data cloud (http://www.gscloud.cn/, accessed on 1 June 2021)
Study area boundary data1989Vector dataNational Basic Geographic Information Center, Shuozhou City Government
Table 2. MSPA pattern classes definition [1,16].
Pattern ClassEcological Meaning
Core IsletLarge habitat patches can serve as source areas while also provide habitats or migration places for wildlife.
PerforationSmall patches weakly connected, providing places for species to spread and communicate and promoting matter and energy flow.
EdgeA transition area between the core patch and the non-green landscape area: the edge of the internal patch having edge effects.
BridgeA transition zone between the core patch and the non-green landscape area; has an edge effect protecting the ecological process of the core area.
LoopConnects corridors inside the same core area to provide access to species diffusion and energy exchange within the core patch.
BranchOnly one side is connected to an edge, bridge, loop, or perforation.
Table 3. Proportion of land-use type area in tertiary ecological restoration zones in 2010 and 2017.
Land Type20102017
Primary
Restoration Area (%)
Secondary
Restoration Area (%)
Tertiary
Restoration Area (%)
Primary
Restoration Area (%)
Secondary
Restoration Area (%)
Tertiary
Restoration Area (%)
Forest Land3.6866.4951.661.9065.4550.42
Wetland1.274.024.270.904.774.02
Grassland0.8918.770.090.9718.9820.84
Orchard0.000.0521.260.000.030.09
Farmland72.849.0319.0980.889.0319.32
Unused land11.290.370.856.850.381.16
Transportation land5.840.701.024.270.742.15
Construction land4.190.430.354.150.481.65
Mining land0.000.141.400.080.140.35
Publisher’s Note: MDPI stays neutral with regard to jurisdictional claims in published maps and institutional affiliations.

