
Which Polish Cities Sprawl the Most


Department of Land Management and Landscape Architecture, Faculty of Environmental Engineering and Land Surveying, University of Agriculture in Krakow, 253c Balicka Street, 30-149 Krakow, Poland
*
Author to whom correspondence should be addressed.
Land 2021, 10(12), 1291; https://0-doi-org.brum.beds.ac.uk/10.3390/land10121291
Submission received: 26 October 2021
/
Revised: 22 November 2021
/
Accepted: 23 November 2021
/
Published: 25 November 2021
(This article belongs to the Special Issue Rural Land Management Interaction with Urbanization)
Abstract
:Spatial transformations stemming from urban sprawl are evident not only in the USA or Western Europe but also in Central and Eastern Europe, including Poland. Urban sprawl materialises mostly in land-cover and land-use change involving an increase in the proportion of urbanised areas and discontinuous urban fabric in the total area. The paper’s objective was to identify the degree of urban sprawl based on the area of discontinuous urban fabric. The spatial analysis was aimed at finding differences in land-cover ratios by individual urbanised land categories. The analysed data for 2006, 2012, and 2018 were retrieved from the Urban Atlas. The method employed was NUASI (normalised Urban Atlas sprawl indicator). A series of computations revealed that urban sprawl is found in Poland as well. Changes caused by the increase in the discontinuous urban fabric in the total urban fabric were the most pronounced from 2006 to 2012. From 2012 to 2018, the pace of the increase stabilised, but its dynamics declined. The study demonstrated a strong spatial variability of the indicator. Urban sprawl was found to be the most intense in southern and southeastern Poland.
1. Introduction
Suburbanisation dominates the development of most global cities today [1,2]. Klausen and Røe [3] even claim that ‘the world is increasingly urban, and the urban world is increasingly suburban’. The term suburbanisation has come to be used to refer to the development of a city beyond its administrative boundaries [4,5]. It is also defined as a centrifugal diffusion phenomenon of urban agglomeration, which leads to the development of the suburbs [6]. Symptoms of suburbanisation grew in Poland in the early nineteen nineties after the country abandoned a command economy, including central spatial planning, in 1989 and moved towards the free market and local-authority-based spatial planning. The second wave of suburbanisation in Poland from 2006 to 2012 could have been driven by the membership of Poland in the European Union.
In demographic terms, suburbanisation is most often recognised as a process leading to a significant increase in the population on the urban agglomeration fringe compared to the number of residents in the city core (CC) [7,8,9]. This specific process is often referred to as a preliminary stage or residential-area suburbanisation because people tend to choose fringes rather than the core to live at this point [10]. The next stage of suburbanisation caused by the increasing distance to commerce and the workplace is economic changes. Businesses and services move from the CC to suburban areas (economic suburbanisation, commerce suburbanisation) [11,12]. As a result, the core grows depopulated and bereft of its previous functions, which move outside city limits [13,14]. Furthermore, suburbanisation poses a challenge for transport in suburban areas that is the direst in the best-accessible places [15].
Demographic and economic transformations are entwined with spatial and functional changes. These shifts are manifested in changed suburban land cover and use, mostly in increasingly urbanised, mainly residential, areas in the land-cover and -use structure. It comes at the expense of open-space areas, usually agricultural land. Such spatial policy bolsters land-management and -use chaos, particularly regarding the situation of new buildings [13]. Wilkosz-Mamcarczyk, Olczak, and Prus [16] pointed out that Polish rural areas adjacent to most large cities are often spatially chaotic. Majewska et al. [17] compared Polish suburban building arrangements to a badly played Tetris game and Grochowski [18] to scattered confetti. The urban planning chaos contributes to the Tetris-like development regardless of soil fertility and lost agricultural resources. Urban pressure fosters an increase in farmland value [19]. Urban pressure may seem like a bargain for farmers in the short term. They can sell peripheral parcels of their holdings. Real estate developers pay high prices for land to build monofunctional residential neighbourhoods. Spatial planning that is focused solely on profit may have poor social consequences and cause spatial problems.
These processes drive urban sprawl, which is a particularly adverse effect of suburbanisation transformations. There is no common consensus on the definition of ‘sprawl’ [20,21,22,23]. The definition adopted by each researcher depends on the research perspective [20]. According to Wassmer [24], Earle Draper of the Tennessee Valley Authority first used the term’ sprawl’ at a national conference of planners in 1937. Draper referred to sprawl as an ugly and uneconomic change of the countryside. Urban sprawl is related to low-density, dispersed, or discontinuous (‘leapfrog’) growth of urban fabric and isolation of land uses accompanied by a series of environmental and socioeconomic issues [25,26,27]. Researchers [22,28,29,30] claim that urban sprawl is a process related to chaotic, dynamic, and uncontrolled changes in the spatial structure of suburban areas, believed to be caused mainly by insufficient urban planning regulations. Harvey and Clark [31], as well as Abidin, Zamani, and Aliman [32] claimed that this phenomenon manifests itself in the development of low-density buildings, ribbon development, or the leapfrog characteristic. Chettry and Surawar [33] reported that scattered development should also be considered an urban sprawl type. The Polish spatial planning system still lacks tools for coordinating spatial changes in suburban zones. It is particularly harmful because researchers increasingly often speak of urbanised space or functional zones rather than cities because the boundaries between the city and its surroundings grow fuzzy and hard to define with evident spatial characteristics [34,35]. Therefore, researchers [32,33] point out that the traditional division of urban areas into central and suburban is no longer valid. Metropolitan or functional areas do not exist as independent administrative units in Poland, and the boundaries of metropolitan areas in Poland have not been universally defined. Usually, they consist of the core city and a large number of smaller municipalities in the surroundings of the city.
The urban edge is a mix of urban and rural functions and land-use types. Agricultural land on the urban edge is more prone to land abandonment [36], but simultaneously, an increase in suburban population entails growing demand for fresh food products. At the same time, access to food is reduced due to the residential monofunction of suburban areas and large distances to commerce hubs requiring travel by car. For this reason, it seems reasonable to preserve, at least partially, the agricultural function of suburbs and control spatial transformations caused by urban sprawl (such as the increased proportion of discontinuous urban fabric), as a loss of agricultural land to land-use changes such as sprawl may lead to food insecurity [37,38,39] in functional urban areas (FUA). Urban phenomena, including sprawl, are often discussed separately from rural phenomena [40], disregarding the fact that these are two connected systems. As Cegielska et al. [41] pointed out, the most significant changes in land use and land cover affected agricultural land, with was reduced significantly in Poland in the last decades.
The inadequate definition of urban sprawl [2] renders the results of research on the topic ambiguous. Urban sprawl and suburbanisation can be identified and measured from different perspectives depending on the purpose of the study. Researchers [21,42] point out changes in urban spatial structures in time as the key factor. Galster et al. [42] determined eight dimensions that characterise sprawl: density, continuity, concentration, clustering, centrality, nuclearity, mixed-use types, and proximity. They then proposed a synthetic index for urban sprawl measurement. Similar attributes of sprawl were distinguished by Torrens [43]. Angel et al. [21] further developed Galster’s method and presented metrics for the relative measure of sprawl using satellite imagery and population data. Satellite imagery is a common tool for exploring sprawl [44,45,46,47], similarly to population data, or in some cases even social-media data [44]. A combination of Corine Land Cover (CLC) and military maps was used to determine how early sprawl was observed in Budapest [48]. Schwarz [49], as well as Arribas et al. [50], used CLC spatial data and Urban Atlas demographic data to characterise the spatial structures of major European cities. CLC was also used to measure sprawl in Polish cities [50].
Polish suburbanisation discourse is dominated by research on its socioeconomic aspect [8,51,52,53,54,55]. Most publications are based on data from public statistical resources (the Local Data Bank of the Polish Central Statistical Office) [1,56,57]. There is not much research on the spatial dimension of urban sprawl in the main metropolitan areas in Poland. Studies on the spatial quality of urban sprawl often are local in scope and focus on determining the number and location of new housing [58] or development density [59,60]. An interesting study of the spatial context of urbanisation was made by Solon [61] in the Warsaw metropolitan area between 1950 and 1990. Solon [61] used several landscape metrics (spatial share, mean patch size, patch size coefficient of variance, mean shape index, mean nearest neighbour distance, mean proximity index, and the interspersion and juxtaposition index) to describe changes in the spatial structure of the landscape. He proved that, in the vicinity of the centre of Warsaw, and in the neighbourhood of the transport routes, built-up areas were characterised by strongly fragmented, irregular shapes. Similar conclusions on changing the peri-urban landscape by transforming the agricultural land into discontinuous urban fabric for suburbs were drawn by Solecka, Sylla, and Świąder [62] for Wrocław. Authors used CLC data, cadastral data, and transactions data to investigate the dynamics of farmland conversion into suburban areas, as well as the actual and predicted state of suburbanisation. More extensive research on the spatial characteristics of urban sprawl in Poland was conducted by Lityński [13] and Cieślak, Biłozor, and Szuniewicz [50]. Lityński [13] used a modified method, which was originally presented by Galster et al. [42]. The proposed method was based on morphological indicators and the land-use mix indicator, and the research area covered the main Polish FUAs. Cieślak, Białozor, and Szuniewicz [50] proposed an overgrowth of urbanisation (OU) index that was based on aggregated CLC data. Their research involved 71 Polish cities with the status of county capitals.
Petrescu [63] applied his original NUASI (normalised Urban Atlas sprawl indicator) in Romania. The metric considers the total urbanised areas and the proportion of discontinuous urban fabric to the total built-up area.
The objective of the present paper was to identify spatial manifestations of suburbanisation in the functional areas of voivodeship capitals in Poland. Poland is divided into 16 provinces known as voivodeships. For the purposes of the study, spatial transformations caused by suburbanisation are defined as land-cover changes. The temporal range of the research is 2006, 2012, and 2018 due to input data accessibility (Urban Atlas data). We employed the NUASI indicator as proposed by Petrescu (2019) to investigate the spatial aspect of suburbanisation. The coefficient reflects the degree of urban sprawl based on the area of discontinuous urban fabric compared to the total urbanised area. In this study, we attempt to answer the question of which Polish cities sprawl the most. The answer will be founded on the assumption that the increase in discontinuous urban fabric is the spatial manifestation of urban sprawl. Therefore, we checked which urban fabric dominated urbanised areas and investigated urban fabric changes in each FUA.
As research gaps and possible contributions of this paper, we have identified: (1) few studies have been conducted on spatial aspects of suburbanisation in the main Polish metropolitan areas, and no study has yet fully discussed the discontinuous urban fabric in these areas and its variability in individual FUAs, and (2) most of the previous studies focused on one case study (3); most research in Poland is based on public statistics, with the spatial-data approach neglected.
2. Materials and Methods
2.1. Study Area
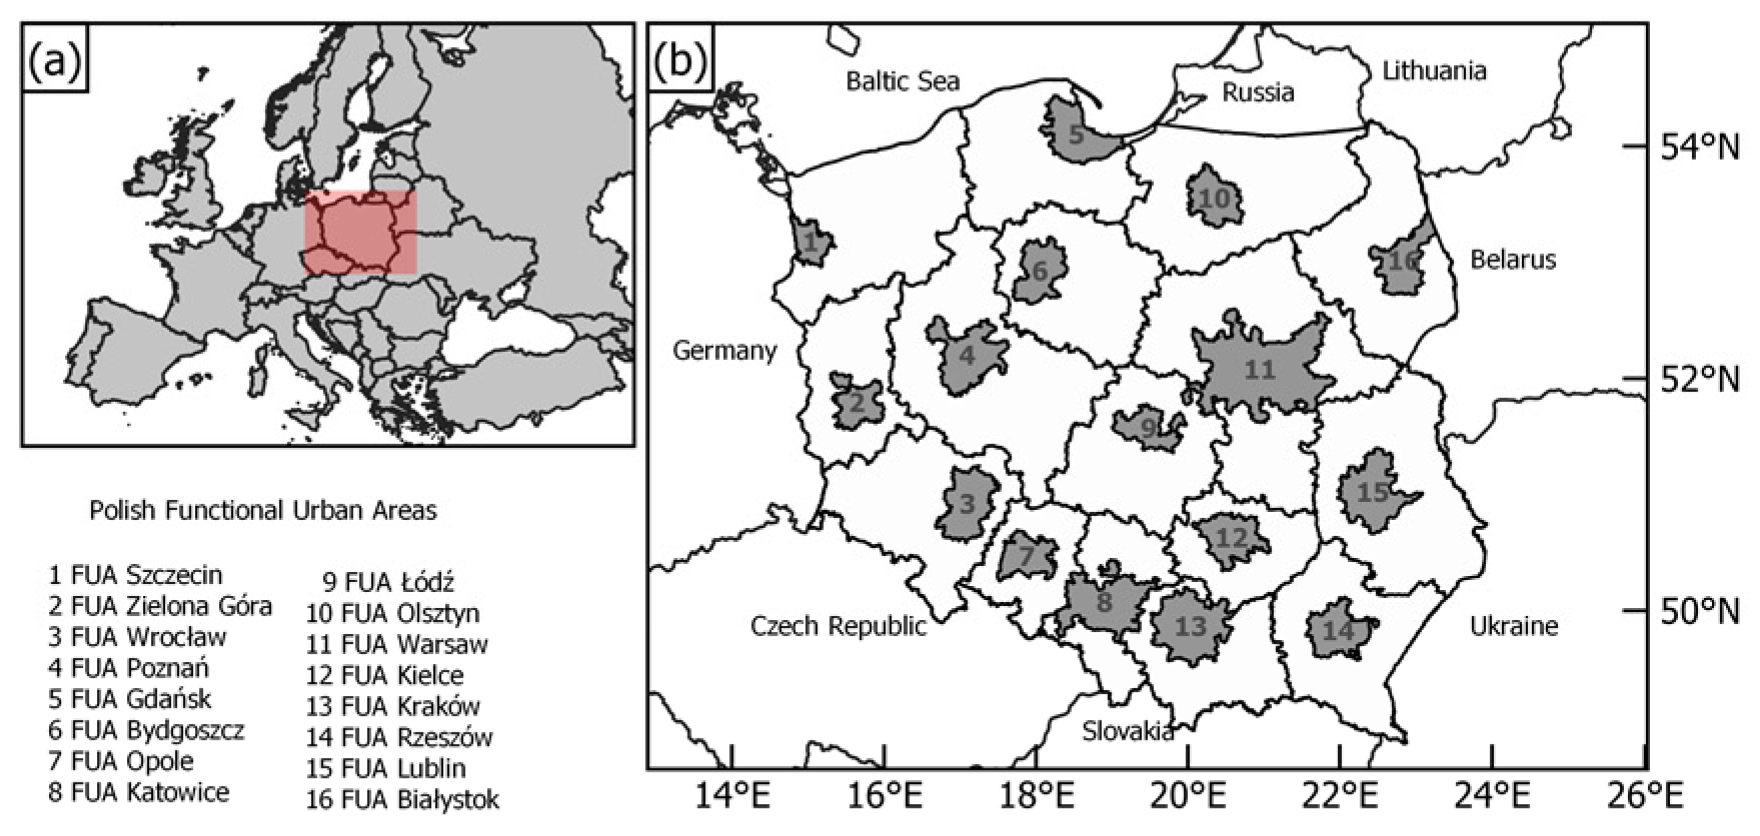
In Poland, dynamic changes in land use and cover related to suburbanisation take place mostly in the suburban zones of large capitals of voivodeships. There are no nationwide documents that would consider the FUA spatial policy as a functional whole. The concept closest to the spatial range of FUA is regions (voivodeships). Still, obligatory spatial development plans for voivodeships are region-specific and do not exceed the administrative boundaries of voivodeships. Meanwhile, FUAs spread and coagulate into functionally coherent units, disregarding administrative boundaries. It means that FUAs are usually only parts of regions and that municipalities that constitute FUAs can be located in various municipalities (such as for Warsaw, Kraków, and Katowice) and may be covered by different spatial development plans. Therefore, there is still room for coordinated urban planning on the voivodeship level. Zooming in on the municipality level, note that every municipality operates within its administrative boundaries, and there is no obligation to coordinate spatial policies with adjacent municipalities that also form the same FUA. Therefore, the number of municipalities comprising a FUA also matters when a joint spatial policy is considered. Therefore, the study involved all 16 capitals of Polish voivodeships with their FUAs (Figure 1). The study area amounts to about 45 thousand km2. Most FUAs consist of more than ten municipalities; only the FUAs of Zielona Góra and Szczecin have fewer municipalities. The number of municipalities does not necessarily correspond to the area of a FUA, which is evident for Wrocław or Łódź (Table 1).
2.2. Data and Analysis
The work employed a dataset from the Urban Atlas (UA) available on Copernicus [64]. The service is coordinated by the European Environment Agency (EEA), which provides land-cover and land-use information at the European, national, and local levels. The 2006 Urban Atlas covered 319 urban areas in the European Union. Its second iteration in 2012 grew to 800 urban areas, a number retained in the latest 2018 edition. Initially, the UA project identified 21 land-cover and -use categories in 2006, with six more added for 2012 and 2018. The additional categories improve the detail level of the basic ones used in the project’s first phase. The changed categories do not affect the NUASI. The study focuses on urbanised areas, while the modified land-cover categories are agricultural, forest, and seminatural areas. The project involved UA data for 2006, 2012, and 2018 for all functional urban areas of the capitals of Polish voivodeships.
The method of calculating NUASI was proposed by Petrescu [63]. The first step was to reclassify 14 land-cover categories in urbanised areas available in the UA using their urban fabric characteristics and density. Three land-cover and -use groups were created: C1, C2, and C3. The grouping principles are provided in Table 2.
The second step was to aggregate the surfaces of all areas in groups C1, C2, and C3. The computations were performed using the Group Stats plugin for QGIS 3.14 separately for all the years and for all investigated FUAs. The third step involved the calculation of the NUASI [63], that is, a ratio between the area of C2, and the aggregate areas of groups C1, C2, and C3.
C1—continuous urban fabric characteristic of cities, very compact building positioning;
C2—discontinuous urban fabric for which suburbanisation can be a reason for growth;
C3—other types of artificial surfaces: any type of areas used by people for purposes other than agriculture, excluding sports facilities, parks, green squares, etc.
Its value indicates the proportion of the investigated area that is covered with the discontinuous urban fabric. The NUASI is always below 1. The results are summarised in tables.
3. Results
The results are presented in tables starting from C1, going through 2006, 2012, and 2018 to C3. The degree of C1 classes coverage reflecting continuous urban fabric for research years are shown in Table 3. The largest such developed area was in the FUA of Warsaw. The proportion of continuous urban fabric in the FUA of Warsaw was 3.66% of its total area in 2006, and it increased to 3.72% in 2018. The FUA with the smallest C1 area was Zielona Góra. Even though it was not the smallest FUA investigated here, its continuous urban fabric area proportion was the lowest: 0.52% in 2006 and 0.49% in 2018 of the total FUA’s area.
The C1 cover has grown by 2012 in most of the FUAs (Table 3). The increase of C1 between 2006 and 2012 was highest in the FUA of Warsaw, where C1 cover was 31,554 ha in 2006 and grew by 450 ha in six years. The C1 growth rate for 2006–2012 is between 0.1% and 2% in most of the analysed FUAs. However, it decreased in the FUAs of Kielce, Zielona Góra, and Kraków. In Kielce, the reduction was 15.5% or 225 ha; in Zielona Góra it was 5.5%. The FUA of Kraków also lost some C1 area, but merely 0.21%. The largest increase in the proportion of C1 was in the FUA of Warsaw and Szczecin.
Between 2018 and 2012 one of the visible changes took place in Kielce, where the continuous urban fabric area shrank in the past. In 2018, it grew by a mere 0.80%, and the aggregate loss for 12 years was 15%. The FUA of Warsaw also went through a less marked increase: merely 1.4% in 2012 and as little as 0.12% in 2018. The biggest rise was noted in FUA of Wrocław and FUA of Białystok. In FUA of Białystok, it was relatively stable and amounted to 1.3% in the first period and 2.3% six years later. In the FUA of Wrocław, the change was more significant, from 0.98% in the first period to 3.77% in the second period. As a result, only the FUA of Kielce and the FUA of Zielona Góra experienced a negative change in C1 land cover over the 12 years.
The data for C2 cover (Table 4) show areas where the most dominant cover was discontinuous urban fabric. The FUA of Warsaw had the largest area of C2 cover, but the difference was not as pronounced as in the previous group (Table 3), where the result for FUA of Warsaw was several times higher than in other FUAs. The C2 group covered a much greater area of FUAs than the C1 group. The total C2 area for all FUAs was 246,189 ha, whereas the area of C1 was three times smaller, 82,238 ha. The highest share of C2 in total urban area of 9.77% was observed in the FUA of Rzeszów in 2006. The FUA of Kraków had the second highest share of 9.38% in that year. Both Rzeszów and Kraków had the highest shares of C2 in both 2012 and 2018. The lowest share of C2 in 2006, 2012, and 2018 was in Olsztyn, Zielona Góra, and Białystok (approx. 3%).
In 2012, the C2 cover increased in all the investigated FUAs. The change over the six years was the greatest among all the groups. The most evident expansion of 2281 ha was in the FUA of Gdańsk. The largest growth in all FUAs was for discontinuous very low-density urban fabric. The smallest rise of C2 cover was in the FUA of Łódź, where the growth rate amounted to 5.47%. The mean increase in the growth rate of discontinuous urban fabric in the capitals of voivodeships was 12%. The total area of C2 in all the FUAs was 273 thousand hectares in 2012 (246 thousand in 2006). Between 20012 and 2018 the growth rate was significantly lower, with the exception of the FUA of Łódź, where the growth rate was 6.71% for 2012–2018 and 5.47% for 2006–2012.
The most marked change was noted from 2006 to 2012. The growth was much slower from 2012 to 2018. The growth rate was highest in the FUA of Gdańsk over the twelve years; the accumulated value of the growth rate in Gdańsk was 36.55%.
Details of the C3 cover in 2006, 2012, and 2018 are shown in Table 5. Individual types of artificial surfaces in the FUAs differed significantly. Some of the analysed FUAs did not include fast-transit roads, airports, or access to the sea or other sea routes, so they cannot have ports or associated areas, that form C3 group. The FUAs of Lublin, Bialystok, Zielona Góra, and Szczecin did not have airports or group 12,400 areas. Similarly, ports, category 12,300, can only be found in the FUA for Szczecin, Gdańsk, Wrocław, and Warsaw. The largest C3 area was found in the largest investigated FUA, as was the case earlier. In relative terms, the largest such developed area was the FUA of Katowice. The functional urban area of Katowice is one of the most urbanised areas because of industrial zones, mineral extraction sites, and factories.
Over the six-year period between 2006 and 2012, only one area stands out among all the expanding FUAs, Olsztyn. Its built-up area decreased by 3.4%, which is opposite to the other FUAs. The reason for such a small change was the reduction in mineral extraction sites by 240 ha, similar to construction sites, which shrunk by about 90 ha in six years. Land-cover classes under C3 grew in all of the investigated FUAs in 2018 with the exception of the FUA of Rzeszów, where the area shrunk by 0.5% or 35 ha from 2012. The functional urban area of Rzeszów grew in terms of all land-cover categories except for the last one, that is, construction sites. This category grew smaller by 880 ha in six years.
We calculated the NUASI for each year (2006, 2012, and 2018) and for all functional areas of the capitals of Polish voivodeships from UA land-use and -cover data (Table 6). The proportion of discontinuous urban fabric grew in most analysed FUAs. It varied from 0.47% (the FUAs of Łódź and FUA of Kraków) to 4.86% (the FUA of Gdańsk).
The analysis of C2 cover and NUASI changes in the FUAs of Rzeszów and Kielce demonstrated that discontinuous urban fabric did not always grow. In the FUA of Kielce, the value of the NUASI decreases by about 0.20% in six years on average. The change was not due to the slower dispersion of developments, which grew by 1813 ha in 12 years. One of its causes was new C3 areas that grew by 23.8% from 2006 to 2018 (1730 ha). Therefore, the proportion of discontinuous urban fabric to all the groups dwindled.
The NUASI for the FUA of Rzeszów dropped 1.1% over 12 years. Discontinuous urban fabric on FUA of Rzeszów amounted to 73% of the entire urbanised area (sum of C1, C2, C3). Data for the first period show that Rzeszów’s fabric was significantly discontinuous already in 2006. Over the twelve analysed years, the proportion of discontinuous urban fabric declined, making room for other urbanised land-cover types. Therefore, the discontinuous urban fabric did not grow from 2006 to 2018, as did the other categories. The decrease in the NUASI in the FUAs of Rzeszów and Kielce was caused by the increase in the area of C3.
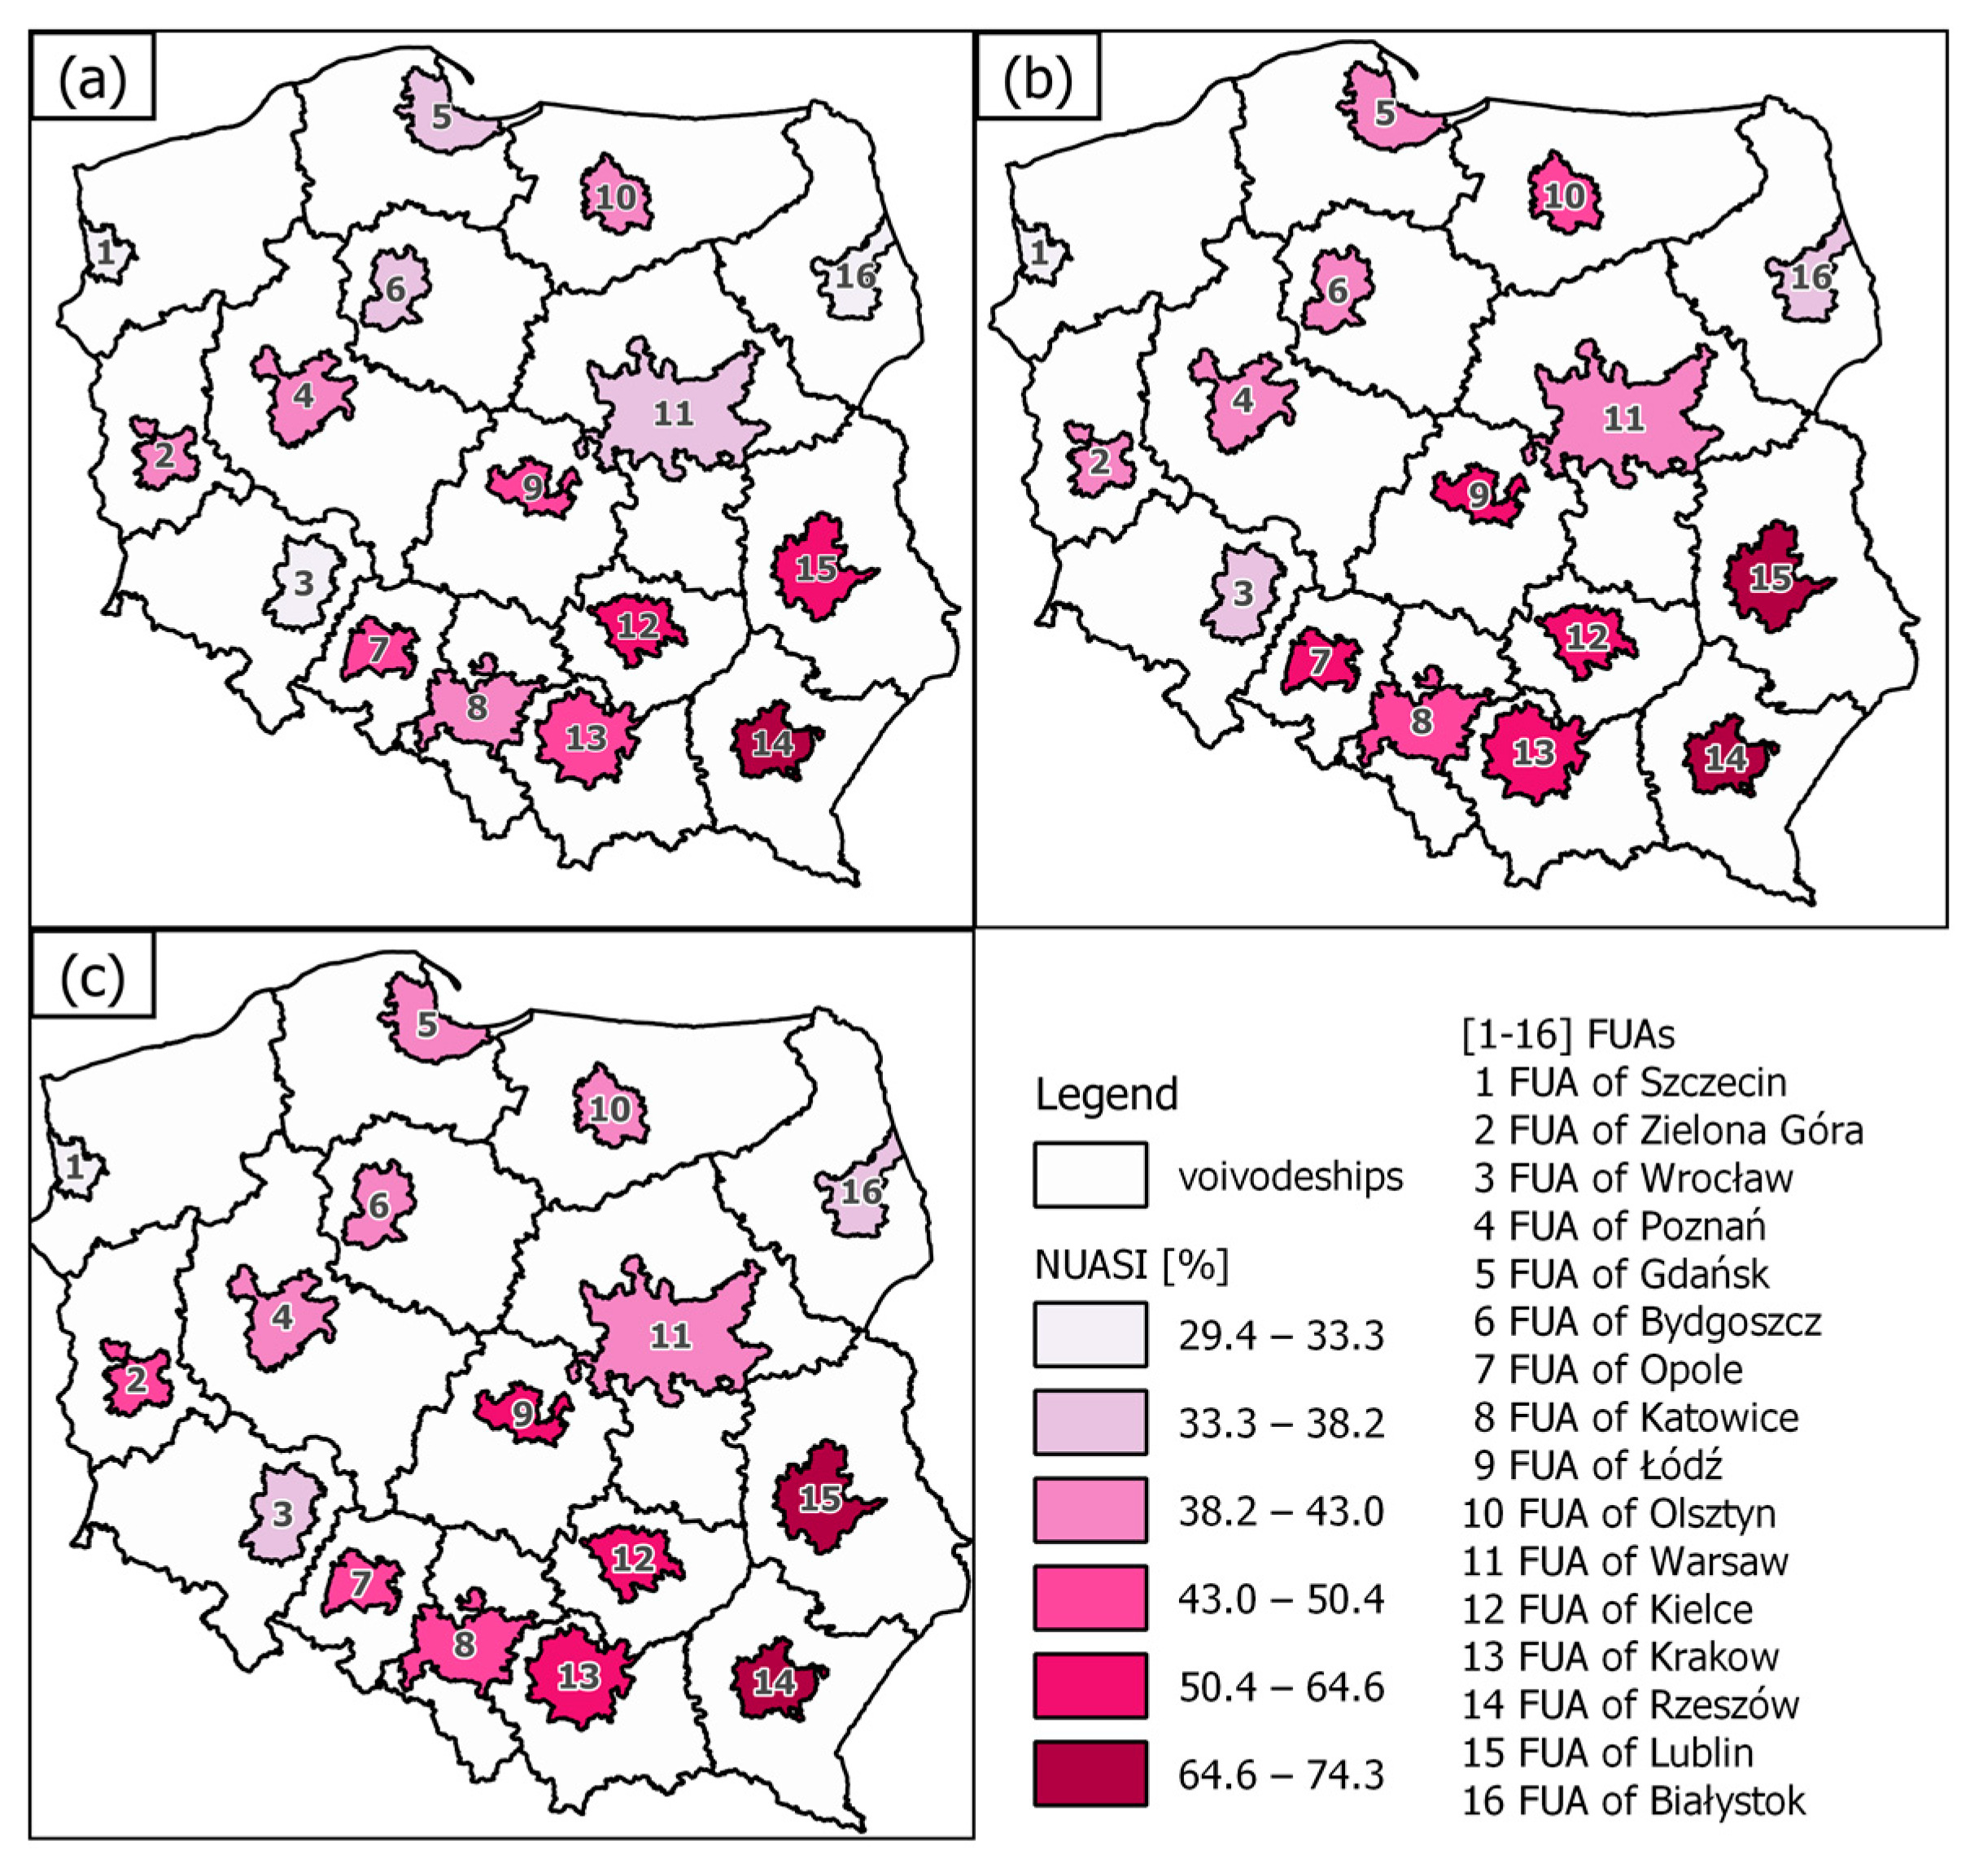
All the analysed FUAs were covered in discontinuous urban fabric. The proportion of discontinuous urban fabric (C2) in the urbanised areas of individual FUAs is shown in choropleth maps (Figure 2). The greatest share of C2 cover in the total urbanised area in all the years was found in southeastern Poland with the FUAs of Rzeszów, Lublin, Kielce, and Kraków. The FUA of Rzeszów has the largest share of discontinuous urban fabric from among the investigated FUAs. The values of the NUASI for the FUA of Rzeszów exceeded 72% in every year. It was followed by the FUA of Lublin (above 64% in each year), the FUA of Kielce (over 57% in each year), and the FUA of Kraków (over 50% in each year). The situation in northwestern Poland was the opposite. In the last investigated year, the FUA of Szczecin was covered with 1.8% continuous urban fabric (C1). Discontinuous urban fabric was 4%, and the C3 group covered 6.5%. In terms of proportions in urbanised area, C1 covered 15%; C2 was 33%, and C3 was 52%. Szczecin is the only functional urban area with the share of discontinuous urban fabric in urban areas below 33%. Most of the cities range from 40 to 50%, including the largest FUA, Warsaw.
We proved that urban fabric grew the fastest from 2006 to 2012, which is demonstrated by NUASI changes (Figure 3). In most of the studied areas, the second period from 2012 to 2018 was a time of slower inflation of discontinuous urban fabric, which is demonstrated by a nearly two-time-lower value of the NUASI indicator. The described tendency is especially present in the FUA of Olsztyn, where NUASI change between 2018 and 2012 was −1.94%, but between 2012 and 2006, it was 3.45%.
All urban sprawl types proposed by Harvey and Clark [31] are present in Polish FUAs, i.e., low-density sprawl and ribbon development, as well as leapfrog development. As noticed by Sýkora and Stanilov [65], there are two main models of the spatial development of suburbia in post-socialist countries. In the first one, suburban buildings are concentrated in a relatively limited number of nodes of varying volumes in which housing, workplaces, and services are mixed. These nodes of suburban development are usually anchored in the historical structure of the village. The second pattern of suburban development takes the form of scattered development, with a large number of clusters, many of which are monofunctional (mostly residential). We combined the spatial distribution of built-up areas (C1 + C2 + C3), boundaries of urban core, and main roads to show the types of urban sprawl present in Poland. Although all types of urban sprawl are present in all Polish FUAs, there are regional features that are worth highlighting. The least-concentrated areas are located in the southern part of Poland (Figure 4a–c). Especially in the FUA of Krakow and the FUA of Rzeszów, there are examples of scattered development. In the FUA of Rzeszów, as well as the FUA of Kielce, the development of new buildings, mainly residential ones, is located on a continuous row along the main road (Figure 4b,c). A trend of edge development is strongly visible in central Poland (Figure 4d,e). In the FUA of Wrocław, there are many examples of leapfrog development. In northern Poland, the dispersion of buildings is not as advanced as in southern Poland. The development of new buildings is based on previously existing villages (Figure 4g,h).
4. Discussion
The primary assumption in this paper was that the spatial manifestation of urban sprawl was an increase in the proportion of discontinuous urban fabric to the total urbanised area [26,66] reflected in the NUASI. The NUASI takes into account the entire urbanised area, but it also considers its ratio to the area of the discontinuous urban fabric. This study helps determine which urban fabric expands the most. The present study demonstrated that the fastest-growing type of urban fabric was discontinuous urban fabric, which was the dominant type of urban fabric in all the years in the FUAs of Rzeszów, Lublin, Kielce, Kraków, and Łódź. Therefore, urban sprawl takes place in all of the functional areas of the capitals of Polish voivodeships. Still, a difference between northern and southern Poland was identified. The highest values of the NUASI for the years of interest were found in the FUAs in southern and southeastern Poland. Polish agricultural holdings are among the smallest in Europe [67]. The parcels are small, and their shapes are often problematic [68]. The issue is evident in the agricultural land of southern Poland, where fragmentation is the worst [69]. Therefore, it seems justified to claim that the significant proportion of discontinuous urban fabric in urbanised areas of southern Poland is aggravated by historical fragmentation of agricultural holdings, significantly elongated (band-like) parcels [68], and an insufficient land consolidation effort. Such an unfavourable and dysfunctional development of urbanised areas could be aided by sound spatial planning. Many authors emphasised the inefficiency of the spatial planning system in Poland and the failure to implement regulations [70,71,72,73,74,75]. Too often the development of urbanised areas depends on individual administrative decisions instead of comprehensive spatial development plans. All of this results in a positive-feedback situation. Fragmentation and small sizes of farms, as well as small sizes of agricultural parcels, make it easier to sell land and convert it into non-agricultural and non-forest use, which fosters urban sprawl. On the other hand, urban sprawl may reinforce the existent adverse spatial structure by developing small parcels instead of their consolidation, planning of infrastructure, and division for sale [68].
As Nuissl and Rink [76] highlighted, suburbanisation in post-socialist countries differed from suburbanisation in Western Europe. While in Western Europe, suburbanisation took place in an environment of strong population and economic growth, in post-socialist countries, there was stagnation in population and economic transformation. Kajdanek [77] claimed that the most important difference between suburbanisation in Poland and in Western Europe was the scale and the size of suburban area. In Poland, suburban areas developed a short distance from the central city and were not that extensive. Similar conclusions were reached by Solon [61] in his research on the suburban area of Warsaw. Solon [61] noticed that the strong influence of the city ends at a distance of 4–6 km from the centre and transportation routes. Polish researchers [78,79] agree that Polish suburban areas are characterised by chaotic development and the irrationality of spatial systems, as well as the high consumption of space due to the large dispersion of buildings [11]. Urban sprawl in Poland displays similar features to those observed by Repaská, Vilinová, and Šolcová [80] in the suburbs of Nitra. These features are: small residential plots, dense built-up areas, cul-de-sacs, and private roads.
It is difficult to compare the results of various studies due to the diversity of methods and input data. Cieślak et al. [50] investigated urban sprawl in the capitals of Polish districts using aggregate urbanised areas based on CLC data. In our opinion, the highly fragmented suburban development reduces the usefulness of CLC data for research on urban sprawl in Poland. The legitimacy of the use of CLC data in the urban sprawl measurement is also questioned by Solecka et al. [62], who proved that almost half of housing plots are located outside of the area classified as discontinuous urban fabric by CLC in the research of the suburban area of Wroclaw. Moreover we believe the use of aggregate urbanised areas delineated with arbitrary aggregation parameters have the potential of excluding areas with discontinuous urban fabric (leapfrog development) from studies on urban sprawl. Therefore, we selected all urbanised areas for the present study, with a particular focus on the discontinuous urban fabric. Other studies [53,60] analysed only the area of one city or one FUA, as usually the data used for such research are high-resolution data, and the studies are usually very detailed. We could analyse all the largest Polish cities simultaneously thanks to the use of Urban Atlas data.
The selection of input data determines the selection of the study area. We employed Urban Atlas data in our research as they are more accurate than CLC data. The advantage of CLC data over Urban Atlas data is that they cover all of Poland, which makes them adequate for analysing any study area. Thus, the first limitation of our method is the scope of the data. The research is possible only for FUAs but not for the entire country. The second limitation is the inability to measure NUASI for other time periods than those related to Urban Atlas data. However, the use of national survey datasets for the calculation of NUASI may be considered for the further research.
The issue of the study area is linked to the problem of precise delimitation (the determination or assumption of boundaries of the area affected by urban sprawl). Lityński [13] delineated areas under urban sprawl using a set of variables in accordance with the literature, excluding polycentric agglomerations for simplicity’s sake. Cieślak [50] selected district cities and municipalities adjacent to them as areas potentially affected by urban sprawl. In the present study, we selected all of the FUAs of the capitals of Polish voivodeships. This way, the results can be compared across the country and to other European countries. The comparison should involve cities that are regional capitals. Note that the policy for identifying FUAs with population density and travel-to-work flows is consistent with the principles for identifying areas potentially under urban sprawl.
We demonstrated that urban fabric grew the fastest from 2006 to 2012, which is consistent with results by Cieślak et al. [50]. Still, the present study demonstrates that discontinuous urban fabric expanded the most rapidly among all urban fabric types. The period from 2012 to 2018 was a time of slower inflation of discontinuous urban fabric. It still grew in relation to the total developed land, but the increase was nearly two times smaller than from 2006 to 2012. Cieślak at al. [50] also noticed the slower expansion of urban fabric in general from 2012 to 2018.
According to Small [81], the public and policymakers compare urban sprawl to a sickness that is embodied in harmful signs but cannot be fully comprehended and prevented and the root causes of which remain unknown. In addition, the literature shows that urban expansion is quicker than urban population growth [82]. It is also visible in Polish local development plans, in which extensive areas are designated as built-up areas [70,83]. Sprawl should be viewed from the broader perspective of agricultural land loss, as new developments often invade space designated for agricultural use. It can disrupt food security [84,85] and cause problems with food availability [86]. Therefore, function mix is important in spatial planning so that residents have access to services and food. Growing food close to the city improves the health of its inhabitants and opens the possibility of creating direct channels that may increase profitability [87]. Therefore, urban agriculture could be a remedy for food insecurity and facilitate the development of resilient and empowered communities, improvement of health, and the reuse of abandoned properties [88]. The reduction of the necessity to use cars to satisfy basic needs can also help with the obesity epidemics [89].
The primary result of the present study is the NUASI values, which indicate the proportion of discontinuous urban fabric for each FUA. The NUASI was calculated for the entire FUAs here. However, thanks to the design of the indicator and the nature of the Urban Atlas input data, it is possible to calculate the NUASI for the city core, suburban zone, and individual municipalities within FUAs. It could be the next research step.
Values of the NUASI could help devise national and regional spatial policies. Moreover, NUASI for individual municipalities could help define local spatial policies. Urban Atlas data are provided every six years. One can verify whether implemented spatial policies to limit urban sprawl work by calculating the indicator regularly. Should the NUASI for the latest data be high, the effort would be fruitless.
Some studies show that the increase in population is not as dynamic as the increase in urbanised areas [50,70,82,83]. Therefore, it would be reasonable to regularly compare the pace of changes in the proportion of discontinuous urban fabric in total urbanised areas with demographic processes in the investigated space. Such monitoring is advisable on the national and regional levels (based on changes in the NUASI in individual FUAs) and on the local level (NUASI for individual municipalities).
5. Conclusions
Suburbanisation is highly dynamic. Areas around cities witness violent spatial transformations. The changes vary in nature and intensity depending on local conditions. The spatial dimension of suburbanisation is increasingly apparent, not only in the United States or Western Europe but also in Poland. It is embodied mostly in land-cover and land-use change involving an increase in the proportion of urbanised areas and discontinuous urban fabric in the total area of developed land. The spatial analysis was aimed at finding differences in land-cover ratios by individual urbanised land categories. It was based on open-access Urban Atlas data. The employed method was the NUASI. The study involved 16 capitals of voivodeships in Poland with their commute zones, referred to as functional urban areas.
A series of calculations confirmed the urban sprawl tendency identified in the literature. Additionally, the values of the NUASI reflected the course and pace of changes in individual urban land-cover types. The results show that discontinuous urban fabric underwent the largest increase in developed land from 2006 to 2018. Discontinuous urban fabric expanded the most from among all of the analysed land cover groups, particularly in the first investigated period from 2006 to 2012. The value of the NUASI for each city was high and varied from 31% to 74%. The summary of the values for the FUAs of Kielce and Rzeszów indicates that discontinuous urban fabric can relatively shrink. However, it is not due to the cessation of development scattering. The primary cause of this change is the occurrence of new areas with an artificial surface and compaction of the existing discontinuous urban fabric. The study shows that urban sprawl is the most intense in southern and southeastern Poland.
An excessive proportion of discontinuous urban fabric in the entire developed area has no benefits. It mainly generates costs of management or transport and contributes to the loss of open areas for potential agricultural production. It is necessary to improve spatial planning so that individual land-cover groups grow in accordance with planned targets with the proper functional mix to prevent adverse repercussions of urban sprawl. It is important that the C1 and C3 land-cover groups be relatively greater. The extensive continuous urban fabric and such land-cover types as transit roads, airports, or railways are characteristic of developed cities. The high share of C1 land can also demonstrate the effective implementation of compact city principles, which has often been discussed as the antithesis of urban sprawl or decentralisation.
The NUASI can easily indicate changes in urban sprawl. It has no inherent restrictions. The indicators can be applied to a single FUA in a selected year or a series of measurements to build comprehensive summaries to reflect the sprawl of discontinuous urban fabric over the years. Furthermore, the indicator can be applied to any European city identified as a functional urban area in the Urban Atlas.
Our results can be useful for policymakers and decision-makers to show the complexity of dynamic changes in the urban fabric. Such knowledge is necessary to develop tailored spatial planning documents that could prevent the excessive loss of agricultural land and show where sprawl is the most advanced.
Author Contributions
Conceptualization, R.-C.R., C.B. and S.A.; Formal analysis, R.-C.R. and S.A.; Methodology, R.-C.R. and S.A.; Visualization, R.-C.R.; Writing—original draft, R.-C.R. and C.B.; Writing—review & editing, R.-C.R. and C.B. All authors have read and agreed to the published version of the manuscript.
Funding
This research was funded by the National Science Centre, Poland, under project no. 2016/21/D/HS4/00264 and by the project “Cultural heritage of small homelands” no. PPI/APM/2018/1/00010/U/01, financed by the Polish National Agency for Academic Exchange as a part of the International Academic Partnerships.
Data Availability Statement
Publicly available datasets were analyzed in this study. This data can be requested here available online: https://land.copernicus.eu/local/urban-atlas (accessed on 19 October 2021).
Conflicts of Interest
The funders had no role in the design of the study; in the collection, analyses, or interpretation of data; in the writing of the manuscript, or in the decision to publish the results.
References
- Harańczyk, A. Procesy suburbanizacji w Krakowskim Obszarze Funkcjonalnym. Stud. Miej. 2015, 18, 85–102. [Google Scholar] [CrossRef]
- Bhatta, B. Analysis of Urban Growth and Sprawl from Remote Sensing Data; Springer: Kolkata, India, 2010; ISBN 9783642052989. [Google Scholar]
- Klausen, J.E.; Røe, P.G. Governance and Change on the Urban Fringe. Urban Res. Pract. Spec. Issue 2012, 5, 1–5. [Google Scholar] [CrossRef]
- Harasimowicz, A. Suburbanizacja a rola obszarów otaczających miasto–ujecie teoretyczne. Stud. Miej. 2018, 29, 115–130. [Google Scholar] [CrossRef]
- Stelmaszewska, N. Konsekwencje suburbanizacji dla miast i stref podmiejskich w świetle literatury krajowej i zagranicznej. Urban Dev. Issues 2020, 66, 25–34. [Google Scholar] [CrossRef]
- Milles, E. An Aggregative Model of Resource Allocation in a Metropolitan Area. Am. Econ. Rev. 1967, 57, 197–210. [Google Scholar]
- Żelechowski, M. Możliwości wykorzystania statystycznych metod klasyfikacji danych w badaniach natężenia suburbanizacji. Rozw. Reg. Polityka Reg. 2015, 139-148. [Google Scholar] [CrossRef] [Green Version]
- Szymańska, W.; Michalski, T. Population Changes in Former Voivodeship Cities in Poland in the Context of Suburbanization Processes and Loss of the Administrative Function. Environ. Socio Econ. Stud. 2019, 7, 66–78. [Google Scholar] [CrossRef] [Green Version]
- Glaeser, E.L.; Kahn, M.E. Sprawl and urban growth. In Handbook of Regional and Urban Economics; Elsevier: Amsterdam, The Netherlands, 2004; Volume 4, pp. 2481–2527. [Google Scholar]
- Idczak, P.; Mrozik, K. Suburbanizacja w wybranych gminach wiejskich Bydgosko-Toruńskiego Obszaru Metropolitalnego. Stud. Pract. WNEiZ 2015, 42, 183–194. [Google Scholar] [CrossRef]
- Litwińska, E. Zjawisko urban sprawl–jeden z wymiarów współczesnych procesów urbanizacji. In Współczesne Kierunki i Wymiary Procesów Urbanizacji; Słodczyk, J., Śmigielska, M., Eds.; Wydawnictwo Uniwersytetu Opolskiego: Opole, Poland, 2008; ISBN 978-83-7395-314-7. [Google Scholar]
- Mieszkowski, P.; Mills, E.S. The Causes of Metropolitan Suburbanization. J. Econ. Perspect. 1993, 7, 135–147. [Google Scholar] [CrossRef] [Green Version]
- Lityński, P. The Intensity of Urban Sprawl in Poland. Int. J. Geo Inf. 2021, 10, 95. [Google Scholar] [CrossRef]
- Hlavácek, P.; Kopácek, M.; Horácková, L. Impact of Suburbanisation on Sustainable Development of Settlements in Suburban Spaces: Smart and New Solutions. Sustainability 2019, 11, 7182. [Google Scholar] [CrossRef] [Green Version]
- Piątkowski, K. Suburbanizacja jako wyzwanie dla rozwoju transportu w miejskim obszarze funkcjonalnym Bydgoszczy i Torunia. Rozw. Reg. Polityka Reg. 2019, 47, 141–154. [Google Scholar] [CrossRef]
- Wilkosz-Mamcarczyk, M.; Olczak, B.; Prus, B. Urban features in rural landscape: A case study of the municipality of Skawina. Sustainability 2020, 12, 4638. [Google Scholar] [CrossRef]
- Majewska, A.; Denis, M.; Krupowicz, W. Urbanization chaos of suburban small cities in Poland: ‘tetris development’. Land 2020, 9, 461. [Google Scholar] [CrossRef]
- Grochowski, M. Metropolizacja a kształtowanie ładu przestrzennego układów zurbanizowanych. Maz. Stud. Reg. 2011, 6, 167–172. [Google Scholar]
- Livanis, G.; Moss, C.B.; Breneman, V.E.; Nehring, R.F. Urban Sprawl and Farmland Prices. Am. J. Agric. Econ. 2006, 88, 915–929. [Google Scholar] [CrossRef]
- Barnes, K.; Morgan, J.; Roberge, M.; Lowe, S. Sprawl Development: Its Patterns, Consequences, and Measurement; Owson University: Towson, MD, USA, 2001. [Google Scholar]
- Angel, S.; Parent, J.; Civco, D. Urban sprawl metrics: An analysis of global urban expansion using GIS. In Proceedings of the ASPRS 2007 Annual Conference, Tampa, FL, USA, 7–11 May 2007; Volume 7, pp. 22–33. [Google Scholar]
- Arribas-Bel, D.; Nijkamp, P.; Scholten, H. Multidimensional urban sprawl in Europe: A self-organizing map approach. Comput. Environ. Urban Syst. 2011, 35, 263–275. [Google Scholar] [CrossRef] [Green Version]
- Gerten, C.; Fina, S.; Rusche, K. The Sprawling Planet: Simplifying the Measurement of Global Urbanization Trends. Front. Environ. Sci. 2019, 7, 1–20. [Google Scholar] [CrossRef]
- Wassmer, R.W. Fiscalisation of land use, urban growth boundaries and non-central retail sprawl in the western United States. Urban Stud. 2002, 39, 1307–1327. [Google Scholar] [CrossRef]
- Hai, N.N. Research on Urban Sprawl Trends and Landscape Change in Pleiku City, Gia Lai Province. Vietnam J. Hydrometeorol. 2019, 2, 37–47. [Google Scholar] [CrossRef]
- Colsaet, A.; Laurans, Y.; Levrel, H. What drives land take and urban land expansion? A systematic review. Land Use Policy 2018, 79, 339–349. [Google Scholar] [CrossRef]
- Johnson, M.P. Environmental impacts of urban sprawl: A survey of the literature and proposed research agenda. Environ. Plan. A 2001, 33, 717–735. [Google Scholar] [CrossRef] [Green Version]
- Lagarias, A.; Sayas, J. Is there a common typology of urban sprawl in Mediterranean cities? Rev. D’économie Rég. Urbaine 2019, 4, 813. [Google Scholar] [CrossRef]
- Landscape Gesellschaft für Geo-Kommunikation. Lexikon der Geowissenschaften; Spektrum Akademischer Verlag: Heidelberg, Germany, 2002. [Google Scholar]
- Śleszyńnski, P.; Kowalewski, A.; Markowski, T.; Legutko-Kobus, P.; Nowak, M. The contemporary economic costs of spatial chaos: Evidence from Poland. Land 2020, 9, 214. [Google Scholar] [CrossRef]
- Harvey, R.; Wallace, C. The Nature of Economics of Urban Sprawl. Land Econ. 1965, 41, 1–9. [Google Scholar] [CrossRef]
- Abidin, S.N.; Zamani, N.A.; Aliman, S. A computerised tool based on cellular automata and modified game of life for urban growth region analysis. In Proceedings of the 4th International Conference on Soft Computing in Data Science, Bangkok, Thailand, 15–16 August 2018; ISBN 978-981-287-935-6. [Google Scholar]
- Chettry, V.; Surawar, M. Urban sprawl assessment in Raipur and Bhubaneswar urban agglomerations from 1991 to 2018 using geoinformatics. Arab. J. Geosci. 2020, 13, 667. [Google Scholar] [CrossRef]
- Sepioł, J. Przestrzeń Życia Polaków; Architektura-Murator and SARP: Warszawa, Poland, 2014. [Google Scholar]
- Nechyba, T.J.; Walsh, R.P. Urban sprawl. J. Econ. Perspect. 2004, 18, 177–200. [Google Scholar] [CrossRef] [Green Version]
- Sroka, W.; Pölling, B.; Wojewodzic, T.; Strus, M.; Stolarczyk, P.; Podlinska, O. Determinants of farmland abandonment in selected metropolitan areas of Poland: A spatial analysis on the basis of regression trees and interviews with experts. Sustainability 2019, 11, 3071. [Google Scholar] [CrossRef] [Green Version]
- Shi, K.; Chen, Y.; Yu, B.; Xu, T.; Li, L.; Huang, C.; Liu, R.; Chen, Z.; Wu, J. Urban expansion and agricultural land loss in China: A multiscale perspective. Sustainability 2016, 8, 790. [Google Scholar] [CrossRef] [Green Version]
- Zdruli, P. Land resources of the Mediterranean: Status, pressures, trends and impacts on future regional development. Land Degrad. Dev. 2014, 25, 373–384. [Google Scholar] [CrossRef]
- Czesak, B.; Różycka-Czas, R.; Salata, T.; Dixon-Gough, R.; Hernik, J. Determining the intangible: Detecting land abandonment at local scale. Remote Sens. 2021, 13, 1166. [Google Scholar] [CrossRef]
- Abu Hatab, A.; Cavinato, M.E.R.; Lindemer, A.; Lagerkvist, C.J. Urban sprawl, food security and agricultural systems in developing countries: A systematic review of the literature. Cities 2019, 94, 129–142. [Google Scholar] [CrossRef]
- Cegielska, K.; Noszczyk, T.; Kukulska, A.; Szylar, M.; Hernik, J.; Dixon-Gough, R.; Jombach, S.; Valánszki, I.; Filepné Kovács, K. Land use and land cover changes in post-socialist countries: Some observations from Hungary and Poland. Land Use Policy 2018, 78, 1–18. [Google Scholar] [CrossRef]
- Galster, G.; Hanson, R.; Ratcliffe, M.R.; Wolman, H.; Coleman, S.; Freihage, J. Wrestling sprawl to the ground: Defining and measuring an elusive concept. Hous. Policy Debate 2001, 12, 681–717. [Google Scholar] [CrossRef]
- Torrens, P.M. A Toolkit for Measuring Sprawl. Appl. Spat. Anal. Policy 2008, 1, 5–36. [Google Scholar] [CrossRef] [Green Version]
- Shao, Z.; Sumari, N.S.; Portnov, A.; Ujoh, F.; Musakwa, W.; Mandela, P.J. Urban sprawl and its impact on sustainable urban development: A combination of remote sensing and social media data. Geo Spat. Inf. Sci. 2021, 24, 241–255. [Google Scholar] [CrossRef]
- Hasnine, M.; Rukhsana. An Analysis of Urban Sprawl and Prediction of Future Urban Town in Urban Area of Developing Nation: Case Study in India. J. Indian Soc. Remote Sens. 2020, 48, 909–920. [Google Scholar] [CrossRef]
- Das, S.; Angadi, D.P. Assessment of urban sprawl using landscape metrics and Shannon’s entropy model approach in town level of Barrackpore sub-divisional region, India. Model. Earth Syst. Environ. 2021, 7, 1071–1095. [Google Scholar] [CrossRef]
- Biney, E.; Boakye, E. Urban sprawl and its impact on land use land cover dynamics of Sekondi-Takoradi metropolitan assembly, Ghana. Environ. Chall. 2021, 4, 100168. [Google Scholar] [CrossRef]
- Kovács, Z.; Farkas, Z.J.; Egedy, T.; Kondor, A.C.; Szabó, B.; Lennert, J.; Baka, D.; Kohán, B. Urban sprawl and land conversion in post-socialist cities: The case of metropolitan Budapest. Cities 2019, 92, 71–81. [Google Scholar] [CrossRef]
- Schwarz, N. Urban form revisited-Selecting indicators for characterising European cities. Landsc. Urban Plan. 2010, 96, 29–47. [Google Scholar] [CrossRef]
- Cieślak, I.; Biłozor, A.; Szuniewicz, K. The use of the CORINE Land Cover (CLC) database for analyzing urban sprawl. Remote Sens. 2020, 12, 282. [Google Scholar] [CrossRef] [Green Version]
- Kurek, S.; Gałka, J.; Wójtowicz, M. Wpływ Suburbanizacji na Przemiany Wybranych Struktur Demograficznych i Powiązań Funkcjonalno-Przestrzennych w Krakowskim Obszarze Metropolitalnym; Wyd. Nauk. UP: Krakow, Poland, 2014; ISBN 9788372719232. [Google Scholar]
- Szukalski, P. Suburbanizacja obszarów wielkomiejskich w Polsce. Demogragia Gerontol. Społeczna-Biuletym Inf. 2015, 4, 1–4. [Google Scholar]
- Masik, G. Suburbanizacja demograficzna i przestrzenna na Obszarze Metropolitalnym Gdańsk-Gdynia-Sopot (Demographic and spatial suburbanization in the Gdańsk-Gdynia-Sopot Metropolitan Area). Stud. Obsz. Wiej. 2018, 50, 155–170. [Google Scholar] [CrossRef]
- Krzysztofik, R.; Kantor-Pietraga, I.; Runge, A.; Spórna, T. Is the suburbanisation stage always important in the transformation of large urban agglomerations? The case of the Katowice conurbation. Geogr. Pol. 2017, 90, 5–24. [Google Scholar] [CrossRef]
- Gałka, J.; Warych-Juras, A. Regionalne uwarunkowania suburbanizacji w Polsce. Stud. Miej. 2011, 3, 147–157. [Google Scholar]
- Mrozik, K.; Waszczuk, M. Przestrzenne aspekty suburbanizacji w wybranych gminach wiejskich Białostockiego Obszaru Funkcjonalnego (Spatial aspects of suburbanization in selected rural communes of the Białystok Functional Urban Area). Stud. Obsz. Wiej. 2019, 55, 53–68. [Google Scholar] [CrossRef]
- Degórska, B. Urbanizacja przestrzenna terenów wiejskich na obszarze metropolitalnym Warszawy. Kontekst ekologiczno-krajobrazowy. Pr. Geogr. PAN IGiPZ 2017, 262, 1–179. [Google Scholar]
- Koman, W. Suburbanizacja wewnętrzna Zabrza. Stud. Miej. 2017, 26, 151–164. [Google Scholar] [CrossRef]
- Serafin, P. Zmiany w użytkowaniu gruntów oraz gęstość zabudowy na styku miasto–obszar wiejski jako przejawy suburbanizacji Nowego Sącza/Changes in land use and the housing density on the city–rural area border as a result of the suburbanization processes of Nowy Są. Pr. Nauk. Uniw. Ekon. Wrocławiu 2017, 467, 102–112. [Google Scholar] [CrossRef]
- Degórska, B. Spatial growth of urbanised land within the Warsaw metropolitan area in the first decade of the 21st century. Geogr. Pol. 2012, 85, 77–95. [Google Scholar] [CrossRef] [Green Version]
- Solon, J. Spatial context of urbanization: Landscape pattern and changes between 1950 and 1990 in the Warsaw metropolitan area, Poland. Landsc. Urban Plan. 2009, 93, 250–261. [Google Scholar] [CrossRef] [Green Version]
- Solecka, I.; Sylla, M.; Świąder, M. Urban Sprawl Impact on Farmland Conversion in Suburban Area of Wroclaw, Poland. IOP Conf. Ser. Mater. Sci. Eng. 2017, 245, 072002. [Google Scholar] [CrossRef]
- Petrescu, F. Urban Sprawl from Urban Atlas Data: Romanian Case Study Management Research and Practice. Manag. Res. Pract. 2019, 11, 21–30. [Google Scholar]
- EEA. EC Urban Atlas. Available online: https://land.copernicus.eu/local/urban-atlas (accessed on 1 January 2021).
- Sýkora, L.; Stanilov, K. The Challenge of Postsocialist Suburbanization. In Confronting Suburbanization: Urban Decentralization in Central and Eastern Europe; Wiley: Hoboken, NJ, USA, 2014; pp. 1–32. [Google Scholar]
- Hasse, J.E.; Lathrop, R.G. Land resource impact indicators of urban sprawl. Appl. Geogr. 2003, 23, 159–175. [Google Scholar] [CrossRef]
- Kobryń, A.; Tekień, T. Potrzeby i możliwości w zakresie prac scaleniowych w powiecie monieckim. Village Agric. 2016, 3, 145–162. [Google Scholar] [CrossRef]
- Kusiak, J. Revitalizing urban revitalization in Poland: Towards a new agenda for research and practice. Urban Dev. Issues 2019, 63, 17–23. [Google Scholar] [CrossRef] [Green Version]
- Nowakowski, T. Ogłoszenie Prezesa Agencji Restrukturyzacji I Modernizacji Rolnictwa z dnia 16 Września 2020 r. w Sprawie Wielkości średniej Powierzchni Gruntów Rolnych w Gospodarstwie Rolnym w Poszczególnych Województwach oraz Średniej Powierzchni Gruntów Rolnych w Gosp. Available online: https://modr.pl/obrot-ziemia/strona/srednia-powierzchnia-gospodarstwa-dane-z-16-wrzesnia-2020-r (accessed on 2 January 2021).
- Anioł, W. Bezplanowość i nieład w polskiej przestrzeni–uwarunkowania polityczno-prawne, historyczne i kulturowe. Stud. Polityki Publicznej 2019, 1, 9–37. [Google Scholar] [CrossRef] [Green Version]
- Brzeziński, C. Spatial Planning System as a Barrier to the Realization of Urban Component of Cohesion Policy in Poland. In Prace Naukowe Uniwersytetu Ekonomicznego we Wrocławiu Gospodarka Lokalna w Teorii i Praktyce; Brol, R., Raszkowski, A., Sztando, A., Eds.; Wydawnictwo Uniwersytetu Ekonomicznego we Wrocławiu: Wrocław, Poland, 2015; pp. 110–118. ISBN 9788376955094. [Google Scholar]
- Śleszyński, P.; Nowak, M.; Sudra, P.; Załęczna, M.; Blaszke, M. Economic consequences of adopting local spatial development plans for the spatial management system: The case of poland. Land 2021, 10, 112. [Google Scholar] [CrossRef]
- Kafka, K. Urban Planners in Poland. Practicing the urban planning profession in Poland and other European countries. Czas. Tech. 2018, 5, 39–51. [Google Scholar] [CrossRef]
- Niedziałkowski, K.; Beunen, R. The risky business of planning reform—The evolution of local spatial planning in Poland. Land Use Policy 2019, 85, 11–20. [Google Scholar] [CrossRef]
- Gorzym-Wilkowski, W.A. Spatial Planning as a Tool for Sustainable Development. Polish Realities. Barom. Reg. 2017, 15, 75–85. [Google Scholar]
- Nuissl, H.; Rink, D. The ‘production’ of urban sprawl in eastern Germany as a phenomenon of post-socialist transformation. Cities 2005, 22, 123–143. [Google Scholar] [CrossRef]
- Kajdanek, K. Suburbanizacja w Polsce-pejzaż społeczno-przestrzenny. Przegląd Socjol. 2003, 60, 302–320. [Google Scholar]
- Zuziak, Z. Strefa podmiejska w architekturze miasta. In Problem Suburbanizacji. Biblioteka Urbanisty; Lorens, P., Ed.; Urbanista: Warszawa, Poland, 2005; pp. 17–32. [Google Scholar]
- Magdalena Mierzejewska, L.W. Chaos w zagospodarowaniu przestrzennym stref podmiejskich jako efekt braku zintegrowanego systemu planowania (na przykładzie strefy podmiejskieh Poznania). Probl. Rozw. Miast 2012, 9, 40–52. [Google Scholar]
- Repaská, G.; Vilinová, K.; Šolcová, L. Trends in Development of Residential Areas in Suburban Zone of the City of Nitra (Slovakia). Eur. Countrys. 2017, 9, 287–301. [Google Scholar] [CrossRef] [Green Version]
- Small, K. Urban Sprawl: A Non-Diagnosos of Real Problems. In Metropolitan Development Patterns: 2000 Annual Roundtable; LeRoyer, A., Ed.; The National Academies of Sciences, Engineering, and Medicine: Washington, DC, USA, 2000; ISBN 1558441433. [Google Scholar]
- Elmqvist, T.; Goodness, J.; Marcotullio, P.J.; Parnell, S.; Sendstad, M.; Wilkinson, C.; Fragkias, M.; Güneralp, B.; McDonald, R.I.; Schewenius, M.; et al. Urbanization, Biodiversity and Ecosystem Services: Challenges and Opportunities: A Global Assessment; Springer Nature: Basingstoke, UK, 2013; pp. 1–755. [Google Scholar] [CrossRef] [Green Version]
- Zachariasz, I. Prawne Uwarunkowania Efektywności Planów zagospodarowania Przestrzennego w Polsce; Zarządzanie Publiczne, UEK: Krakow, Poland, 2013; Volume 23, pp. 5–16. [Google Scholar] [CrossRef]
- D’Amour, C.B.; Reitsma, F.; Baiocchi, G.; Barthel, S.; Güneralp, B.; Erb, K.H.; Haberl, H.; Creutzig, F.; Seto, K.C. Future urban land expansion and implications for global croplands. Proc. Natl. Acad. Sci. USA 2017, 114, 8939–8944. [Google Scholar] [CrossRef] [PubMed] [Green Version]
- Szabo, S. Urbanisation and Food Insecurity Risks: Assessing the Role of Human Development. Oxf. Dev. Stud. 2016, 44, 28–48. [Google Scholar] [CrossRef] [Green Version]
- Hamidi, S. Urban sprawl and the emergence of food deserts in the USA. Urban Stud. 2020, 57, 1660–1675. [Google Scholar] [CrossRef]
- Grebitus, C.; Chenarides, L.; Muenich, R.; Mahalov, A. Consumers’ Perception of Urban Farming—An Exploratory Study. Front. Sustain. Food Syst. 2020, 4, 1–13. [Google Scholar] [CrossRef]
- Hodgson, K.; Campbell, M.C.; Bailkey, M. Urban Agriculture: Growing Healthy, Sustainable Places; American Planning Association Planning Advisory Service: Chicago, IL, USA, 2011. [Google Scholar]
- Zhao, Z.; Kaestner, R. Effects of urban sprawl on obesity. J. Health Econ. 2010, 29, 779–787. [Google Scholar] [CrossRef] [PubMed]
Figure 1.
Study area; (a) Poland on the map of Europe; (b) the investigated Functional Urban Areas in Poland.
Figure 1.
Study area; (a) Poland on the map of Europe; (b) the investigated Functional Urban Areas in Poland.

Figure 2.
The NUASI in 2006 (a), 2012 (b), and 2018 (c).

Figure 3.
The NUASI changes between 2018 and 2012, as well as 2012 and 2006.

Figure 4.
Examples of regional variation of urban sprawl forms: (a) scattered development in the FUA of Krakow (a) and in the FUA of Rzeszów (b), ribbon development in the FUA of Kielce (c), edge expansion in the FUA of Warsaw (d) and in the FUA of Poznań (e), leap frog development in the FUA of Wrocław (f), development based on previously existing villages in the FUA of Szczecin (g) and in the FUA of Olszyn (h).


Table 1.
Investigated FUAs, numbers of municipalities, and area of FUAs.
| FUA Name | Number of Municipalities | Area [ha] |
|---|---|---|
| Warsaw | 90 | 861,390.09 |
| Katowice | 60 | 394,543.00 |
| Kraków | 44 | 375,796.35 |
| Lublin | 33 | 322,253.81 |
| Rzeszów | 28 | 233,851.62 |
| Poznań | 26 | 309,207.12 |
| Gdańsk | 24 | 263,396.68 |
| Kielce | 20 | 224,323.09 |
| Wrocław | 19 | 264,820.90 |
| Łódź | 17 | 169,527.27 |
| Opole | 15 | 176,558.25 |
| Białystok | 13 | 223,635.64 |
| Bydgoszcz | 12 | 210,024.78 |
| Olsztyn | 10 | 202,358.10 |
| Zielona Góra | 9 | 169,533.28 |
| Szczecin | 7 | 112,898.14 |
Table 2.
Principles for generalising land-cover classes. Source: Petrescu [64].
Table 2.
Principles for generalising land-cover classes. Source: Petrescu [64].
| Urban Atlas Code | Land-Cover Class | Group |
|---|---|---|
| 11100 | Continuous urban fabric | C1 |
| 11210 | Discontinuous dense urban fabric | C2 |
| 11220 | Discontinuous medium density urban fabric | |
| 11230 | Discontinuous low density urban fabric | |
| 11240 | Discontinuous very low density urban fabric | |
| 11300 | Isolated structures | |
| 12100 | Industrial, commercial, public, military, and private units | C3 |
| 12210 | Fast transit roads and associated land | |
| 12220 | Other roads and associated land | |
| 12230 | Railways and associated land | |
| 12300 | Port areas | |
| 12400 | Airports | |
| 13100 | Mineral extraction and dump sites | |
| 13300 | Construction sites |
Table 3.
C1 area [ha] in each investigated area in 2006, 2012, and 2018.
| C1 | Growth Rate | ||||||
|---|---|---|---|---|---|---|---|
| FUA | Area [ha] | 2006 | 2012 | 2018 | 2012–2006 | 2018–2012 | 2018–2006 |
| Warsaw | 861,390.09 | 31,554.36 | 32,004.83 | 32,044.62 | 1.43 | 0.12 | 1.55 |
| % | 3.66 | 3.71 | 3.72 | ||||
| Katowice | 394,543.00 | 7485.93 | 7558,76 | 7560.66 | 0.97 | 0.03 | 1.00 |
| % | 1.90 | 1.92 | 1.92 | ||||
| Kraków | 375,796.35 | 5138.66 | 5127.65 | 5248.31 | −0.21 | 2.35 | 2.13 |
| % | 1.37 | 1.36 | 1.40 | ||||
| Lublin | 322,253.81 | 2682.34 | 2722.24 | 2754.51 | 1.49 | 1.19 | 2.69 |
| % | 0.83 | 0.84 | 0.85 | ||||
| Rzeszów | 233,851.62 | 1418.65 | 1434.35 | 1458.53 | 1.11 | 1.69 | 2.81 |
| % | 0.61 | 0.61 | 0.62 | ||||
| Poznań | 309,207.12 | 5097.77 | 5102.78 | 5191.53 | 0.10 | 1.74 | 1.84 |
| % | 1.65 | 1.65 | 1.68 | ||||
| Gdańsk | 263,396.68 | 5612.64 | 5696.61 | 5647.88 | 1.50 | −0.86 | 0.63 |
| % | 2.13 | 2.16 | 2.14 | ||||
| Kielce | 224,323.09 | 1453.37 | 1226.45 | 1236.03 | −15.61 | 0.78 | −14.95 |
| % | 0.65 | 0.55 | 0.55 | ||||
| Wrocław | 264,820.90 | 6243.20 | 6304.10 | 6541.92 | 0.98 | 3.77 | 4.78 |
| % | 2.36 | 2.38 | 2.47 | ||||
| Łódź | 169,527.27 | 2733.46 | 2748.18 | 2754.51 | 0.54 | 0.23 | 0.77 |
| % | 1.61 | 1.62 | 1.62 | ||||
| Opole | 176,558.25 | 1026.81 | 1033.36 | 1034.78 | 0.64 | 0.14 | 0.78 |
| % | 0.58 | 0.59 | 0.59 | ||||
| Białystok | 223,635.64 | 4999.65 | 5064.62 | 5182.60 | 1.30 | 2.33 | 3.66 |
| % | 2.24 | 2.26 | 2.32 | ||||
| Bydgoszcz | 210,024.78 | 2685.52 | 2714.36 | 2746.94 | 1.07 | 1.20 | 2.29 |
| % | 1.28 | 1.29 | 1.31 | ||||
| Olsztyn | 202,358.10 | 1430.13 | 1450.24 | 1448.36 | 1.41 | −0.13 | 1.27 |
| % | 0.71 | 0.72 | 0.72 | ||||
| Zielona Góra | 169,533.28 | 882.63 | 834.14 | 835.84 | −5.49 | 0.20 | −5.30 |
| % | 0.52 | 0.49 | 0.49 | ||||
| Szczecin | 112,898.14 | 1998.38 | 2038.79 | 2047.78 | 2.02 | 0.44 | 2.47 |
| % | 1.77 | 1.81 | 1.81 | ||||
Table 4.
C2 area [ha] in each investigated area in 2006, 2012, and 2018.
| C2 | Growth Rate | ||||||
|---|---|---|---|---|---|---|---|
| FUA | Area [ha] | 2006 | 2012 | 2018 | 2012–2006 | 2018–2012 | 2018–2006 |
| Warsaw | 861,390.09 | 42,642.41 | 48,430.37 | 50,627.06 | 13.57 | 4.54 | 18.72 |
| % | 4.95 | 5.62 | 5.88 | ||||
| Katowice | 394,543.00 | 31,795.14 | 33,786.02 | 35,302.17 | 6.26 | 4.49 | 11.03 |
| % | 8.06 | 8.56 | 8.95 | ||||
| Kraków | 375,796.35 | 35,234.81 | 38,121.47 | 40,127.61 | 8.19 | 5.26 | 13.89 |
| % | 9.38 | 10.14 | 10.68 | ||||
| Lublin | 322,253.81 | 20,752.50 | 24,540.03 | 25,288.12 | 18.25 | 3.05 | 21.86 |
| % | 6.44 | 7.62 | 7.85 | ||||
| Rzeszów | 233,851.62 | 22,846.35 | 24,290.48 | 25,005.01 | 6.32 | 2.94 | 9.45 |
| % | 9.77 | 10.39 | 10.69 | ||||
| Poznań | 309,207.12 | 14,276.26 | 15,901.54 | 17,109.61 | 11.38 | 7.60 | 19.85 |
| % | 4.62 | 5.14 | 5.53 | ||||
| Gdańsk | 263,396.68 | 12,185.59 | 14,466.47 | 166,391.31 | 18.72 | 15.02 | 36.55 |
| % | 4.63 | 5.49 | 6.32 | ||||
| Kielce | 224,323.09 | 11,946.32 | 13,182.47 | 13,760.25 | 10.35 | 4.38 | 15.18 |
| % | 5.33 | 5.88 | 6.13 | ||||
| Wrocław | 264,820.90 | 9761.00 | 11,190.34 | 12,185.39 | 14.64 | 8.89 | 24.84 |
| % | 3.69 | 4.23 | 4.60 | ||||
| Łódź | 169,527.27 | 14,267.05 | 15,047.93 | 16,057.08 | 5.47 | 6.71 | 12.55 |
| % | 8.42 | 8.88 | 9.47 | ||||
| Opole | 176,558.25 | 6509.15 | 7177.61 | 7263.93 | 10.27 | 1.20 | 11.60 |
| % | 3.69 | 4.07 | 4.11 | ||||
| Białystok | 223,635.64 | 5768.20 | 6454.53 | 7109.57 | 11.90 | 10.15 | 23.25 |
| % | 2.58 | 2.89 | 3.18 | ||||
| Bydgoszcz | 210,024.78 | 6413.44 | 7473.44 | 8128.04 | 16.53 | 8.76 | 26.73 |
| % | 3.05 | 3.56 | 3.87 | ||||
| Olsztyn | 202,358.10 | 4428.24 | 4982.56 | 5427.17 | 12.52 | 8.92 | 22.56 |
| % | 2.19 | 2.46 | 2.68 | ||||
| Zielona Góra | 169,533.28 | 3760.58 | 4372.13 | 4664.81 | 16.26 | 6.69 | 24.04 |
| % | 2.22 | 2.58 | 2.75 | ||||
| Szczecin | 112,898.14 | 3602.70 | 4224.49 | 4606.06 | 17.26 | 9.03 | 27.85 |
| % | 3.19 | 3.74 | 4.08 | ||||
Table 5.
C3 area [ha] in each investigated area in 2006, 2012, and 2018.
| C3 | Growth Rates | ||||||
|---|---|---|---|---|---|---|---|
| FUA | Area [ha] | 2006 | 2012 | 2018 | 2012–2006 | 2018–2012 | 2018–2006 |
| Warsaw | 861,390.09 | 37,461.85 | 40,804.55 | 42,547.39 | 8.92 | 4.27 | 13.58 |
| % | 4.35 | 4.74 | 4.94 | ||||
| Katowice | 394,543.00 | 34,716.85 | 36,271.69 | 37,615.46 | 4.48 | 3.70 | 8.35 |
| % | 8.80 | 9.19 | 9.53 | ||||
| Kraków | 375,796.35 | 17,147.86 | 18,300.40 | 19.011.87 | 6.74 | 3.87 | 10.87 |
| % | 4,56 | 4,87 | 5,06 | ||||
| Lublin | 322,253.81 | 8696.71 | 10,631.47 | 10,796.28 | 22.25 | 1.55 | 24.14 |
| % | 2.70 | 3.30 | 3.35 | ||||
| Rzeszów | 233,851.62 | 6488.28 | 7735.46 | 7700.47 | 19.22 | −0.45 | 18.68 |
| % | 2.77 | 3.31 | 3.29 | ||||
| Poznań | 309,207.12 | 15,714.85 | 17,352.80 | 20,095.13 | 10.42 | 15.80 | 27.87 |
| % | 5.08 | 5.61 | 6.50 | ||||
| Gdańsk | 263,396.68 | 15,158.32 | 16,567.59 | 17,144.67 | 9.30 | 3.48 | 13.10 |
| % | 5.75 | 6.29 | 6.51 | ||||
| Kielce | 224,323.09 | 7271.92 | 8531.43 | 9002.57 | 17.32 | 5.52 | 23.80 |
| % | 3.24 | 3.80 | 4.01 | ||||
| Wrocław | 264,820.90 | 13,340.03 | 14,353.67 | 15,026.10 | 7.60 | 4.68 | 12.64 |
| % | 5.04 | 5.42 | 5.67 | ||||
| Łódź | 169,527.27 | 11,333.22 | 11,956.47 | 12,782.06 | 5.50 | 6.90 | 12.78 |
| % | 6.69 | 7.05 | 7.54 | ||||
| Opole | 176,558.25 | 5580.94 | 5836.90 | 6219.20 | 4.59 | 6.55 | 11.44 |
| % | 3.16 | 3.31 | 3.52 | ||||
| Białystok | 223,635.64 | 6911.20 | 7707.43 | 8555.84 | 11.52 | 11.01 | 23.80 |
| % | 3.09 | 3.45 | 3.83 | ||||
| Bydgoszcz | 210,024.78 | 8055.47 | 8490.64 | 9642.28 | 5.40 | 13.56 | 19.70 |
| % | 3.84 | 4.04 | 4.59 | ||||
| Olsztyn | 202,358.10 | 5132.24 | 4957.59 | 6108.44 | −3.40 | 23.21 | 19.02 |
| % | 2.54 | 2.45 | 3.02 | ||||
| Zielona Góra | 169,533.28 | 4685.97 | 5056.16 | 5172.52 | 7.90 | 2.30 | 10.38 |
| % | 2.76 | 2.98 | 3.05 | ||||
| Szczecin | 112,898.14 | 6642.79 | 7140.21 | 7339.50 | 7.49 | 2.79 | 10.49 |
| % | 5.88 | 6.32 | 6.50 |
Table 6.
NUASI [%] for 2006, 2012, and 2018 and changes from 2006 to 2018 for all FUAs.
| Warsaw | Katowice | Kraków | Lublin | Poznań | Wrocław | |
|---|---|---|---|---|---|---|
| NUASI 2006 | 38.19 | 42.97 | 50.35 | 64.59 | 40.69 | 33.26 |
| NUASI 2012 | 39.95 | 43.53 | 50.58 | 64.76 | 41.46 | 35.14 |
| NUASI 2018 | 40.43 | 43.87 | 50.82 | 65.17 | 41.69 | 36.10 |
| change 2018–2006 | 2.24 | 0.90 | 0.47 | 0.59 | 1.00 | 2.84 |
| Rzeszów | Białystok | Bydgoszcz | Olsztyn | Opole | Zielona Góra | |
| NUASI 2006 | 74.29 | 32.63 | 37.39 | 40.29 | 49.62 | 40.57 |
| NUASI 2012 | 72.59 | 33.57 | 40.01 | 43.74 | 51.09 | 42.60 |
| NUASI 2018 | 73.19 | 34.10 | 39.62 | 41.80 | 50.03 | 43.71 |
| change 2018–2006 | −1.10 | 1.47 | 2.23 | 1.51 | 0.41 | 3.14 |
| Gdańsk | Kielce | Łódź | Szczecin | |||
| NUASI 2006 | 36.97 | 57.79 | 50.35 | 29.42 | ||
| NUASI 2012 | 39.39 | 57.46 | 50.58 | 31.52 | ||
| NUASI 2018 | 41.83 | 57.34 | 50.82 | 32.92 | ||
| change 2018–2006 | 4.86 | −0.45 | 0.47 | 3.49 |
Publisher’s Note: MDPI stays neutral with regard to jurisdictional claims in published maps and institutional affiliations. |
© 2021 by the authors. Licensee MDPI, Basel, Switzerland. This article is an open access article distributed under the terms and conditions of the Creative Commons Attribution (CC BY) license (https://creativecommons.org/licenses/by/4.0/).
Share and Cite
MDPI and ACS Style
Renata, R.-C.; Barbara, C.; Andrzej, S. Which Polish Cities Sprawl the Most. Land 2021, 10, 1291. https://0-doi-org.brum.beds.ac.uk/10.3390/land10121291
AMA Style
Renata R-C, Barbara C, Andrzej S. Which Polish Cities Sprawl the Most. Land. 2021; 10(12):1291. https://0-doi-org.brum.beds.ac.uk/10.3390/land10121291
Chicago/Turabian StyleRenata, Różycka-Czas, Czesak Barbara, and Staszel Andrzej. 2021. "Which Polish Cities Sprawl the Most" Land 10, no. 12: 1291. https://0-doi-org.brum.beds.ac.uk/10.3390/land10121291
Note that from the first issue of 2016, this journal uses article numbers instead of page numbers. See further details here.