
Assessment of Contamination Management Caused by Copper and Zinc Cations Leaching and Their Impact on the Hydraulic Properties of a Sandy and a Loamy Clay Soil


Abstract
:1. Introduction
2. Materials and Methods
3. Results
4. Discussion
5. Conclusions
Author Contributions
Funding
Informed Consent Statement
Data Availability Statement
Conflicts of Interest
References
- Rousseva, S.; Kercheva, M.; Shishkov, T.; Lair, G.J.; Nikolaidis, N.P.; Moraetis, D.; Krám, P.; Bernasconi, S.M.; Blum, W.E.H.; Menon, M.; et al. Chapter Two: Soil water characteristics of European SoilTrEC critical zone observatories. In Advances in Agronomy; Elsevier: Amsterdam, The Netherlands, 2017; Volume 142, pp. 29–72. [Google Scholar]
- Wanniarachchi, D.; Cheema, M.; Thomas, R.; Kavanagh, V.; Galagedara, L. Impact of soil amendments on the hydraulic conductivity of boreal agricultural podzols. Agriculture 2019, 9, 133. [Google Scholar] [CrossRef] [Green Version]
- Li, Z.; Liu, H.; Zhao, W.; Yang, Q.; Yang, R.; Liu, J. Estimation of evapotranspiration and other soil water budget components in an irrigated agricultural field of a desert oasis, using soil moisture easurements. Hydrol. Earth Syst. Sci. 2018, 1–17. [Google Scholar] [CrossRef] [Green Version]
- Sihag, P.; Esmaeilbeiki, F.; Singh, B.; Ebtehaj, I.; Bonakdari, H. Modeling unsaturated hydraulic conductivity by hybrid soft computing techniques. Soft Comput. 2019, 23, 12897–12910. [Google Scholar] [CrossRef]
- Guellouz, L.; Askri, B.; Jaffré, J.; Bouhlila, R. Estimation of the soil hydraulic properties from field data by solving an inverse problem. Sci. Rep. 2020, 10, 9359. [Google Scholar] [CrossRef]
- Gallage, C.; Kodikara, J.; Uchimura, T. Laboratory measurement of hydraulic conductivity functions of two unsaturated sandy soils during drying and wetting processes. Soils Found. 2013, 53, 417–430. [Google Scholar] [CrossRef] [Green Version]
- Ali, A.; Biggs, A.J.W.; Marchuk, A.; Bennett, J.M. Effect of irrigation water pH on saturated hydraulic conductivity and electrokinetic properties of acidic, neutral, and alkaline soils. Soil Sci. Soc. Am. J. 2019, 83, 1672–1682. [Google Scholar] [CrossRef]
- Singh, B.; Sihag, P.; Parsaie, A.; Angelaki, A. Comparative analysis of artificial intelligence techniques for the prediction of infiltration process. Geol. Ecol. Landsc. 2020, 5, 109–118. [Google Scholar] [CrossRef]
- Wang, X.; Zhao, Y.; Liu, H.; Xiao, W.; Chen, S. Evaluating the water holding capacity of multilayer soil profiles using hydrus-1d and multi-criteria decision analysis. Water 2020, 12, 773. [Google Scholar] [CrossRef]
- Angelaki, A.; Sakellariou-Makrantonaki, M.; Tzimopoulos, C. Theoretical and experimental research of cumulative infiltration. Transp. Porous Media 2013, 100, 247–257. [Google Scholar] [CrossRef]
- Sihag, P.; Singh, B.; Sepah Vand, A.; Mehdipour, V. Modeling the infiltration process with soft computing techniques. ISH J. Hydraul. Eng. 2018, 26, 138–152. [Google Scholar] [CrossRef]
- Vand, A.S.; Sihag, P.; Singh, B.; Zand, M. Comparative evaluation of infiltration models. KSCE J. Civ. Eng. 2018, 22, 4173–4184. [Google Scholar] [CrossRef]
- Pandey, P.K.; Pandey, V. Estimation of infiltration rate from readily available soil properties (RASPs) in fallow cultivated land. Sustain. Water Resour. Manag. 2019, 5, 921–934. [Google Scholar] [CrossRef]
- Poulovassilis, A.; Elmaloglou, S.; Kerkides, P.; Argyrokastritis, I. A variable sorptivity infiltration equation. Water Resour. Manag. 1989, 3, 287–298. [Google Scholar] [CrossRef]
- Argyrokastritis, I.; Kerkides, P. A note to the variable sorptivity infiltration equation. Water Resour. Manag. 2003, 17, 133–145. [Google Scholar] [CrossRef]
- Evangelides, C.; Arampatzis, G.; Tzimopoulos, C. Estimation of soil moisture profile and diffusivity using simple laboratory procedures. Soil Sci. 2010, 175, 118–127. [Google Scholar] [CrossRef]
- Angelaki, A.; Sihag, P.; Sakellariou-Makrantonaki, M.; Tzimopoulos, C. The effect of sorptivity on cumulative infiltration. Water Sci. Technol. Water Supply 2021, 21, 606–614. [Google Scholar] [CrossRef]
- Rahmati, M.; Vanderborght, J.; Simunek, J.; Vrugt, J.A.; Moret-Fernandez, D.; Latorre, B.; Lassabatere, L.; Vereecken, H. Soil hydraulic properties estimation from one-dimensional infiltration experiments using characteristic time concept. Vadose Zone J. 2020, 19, e20068. [Google Scholar] [CrossRef]
- Poulovassilis, A.; Argyrokastritis, I. A new approach for studying vertical infiltration. Soil Res. 2020, 58, 509–518. [Google Scholar] [CrossRef]
- Green, W.H.; Al, E. Studies of soil physics: The flow of air and water through soils. J. Agric. Sci. 1911, 4, 11–24. [Google Scholar]
- Richards, A.L. Capillary conduction of liquids through porous medium. Physics 1931, 1, 318–333. [Google Scholar] [CrossRef]
- Parlange, J.Y.; Barry, D.A.; Haverkamp, R. Explicit infiltration equations and the Lambert W-function. Adv. Water Resour. 2002, 25, 1119–1124. [Google Scholar] [CrossRef] [Green Version]
- Wang, K.; Yang, X.; Liu, X.; Liu, C. A simple analytical infiltration model for short-duration rainfall. J. Hydrol. 2017, 555, 141–154. [Google Scholar] [CrossRef]
- Chen, S.; Mao, X.; Wang, C. A modified green-ampt model and parameter determination for water infiltration in fine-textured soil with coarse interlayer. Water 2019, 11, 787. [Google Scholar] [CrossRef] [Green Version]
- Liu, Z.-Z.; Yan, Z.-X.; Qiu, Z.-H.; Wang, X.-G.; Li, J.-W. Stability analysis of an unsaturated soil slope considering rainfall infiltration based on the Green-Ampt model. J. Mt. Sci. 2020, 17, 2577–2590. [Google Scholar] [CrossRef]
- Tzimopoulos, C.; Papaevangelou, G.; Papadopoulos, K.; Evangelidis, C. New explicit form of green and ampt model for cumulative infiltration estimation. Res. J. Environ. Sci. 2019, 14, 30–41. [Google Scholar] [CrossRef]
- Sparks, D.L. Toxic metals in the environment: The role of surfaces. Elements 2005, 1, 193–197. [Google Scholar] [CrossRef]
- Kabata-Pendias, A. Trace Elements in Soils and Plants: Fourth Edition; CRC Press; Taylor and Francis Group: Ann Arbor, MI, USA, 2011; ISBN 9781420093704. [Google Scholar]
- Liu, L.; Li, W.; Song, W.; Guo, M. Remediation techniques for heavy metal-contaminated soils: Principles and applicability. Sci. Total Environ. 2018, 633, 206–219. [Google Scholar] [CrossRef]
- Alloway, B.J. Heavy Metals in Soils: Trace Metals and Metalloids in Soils and Their Bioavailability, 3rd ed.; Alloway, B.J., Ed.; Blackie Academic and Professional: London, UK, 2013; ISBN 9789400744691. [Google Scholar]
- Berkowitz, B.; Dror, I.; Yaron, B. Sorption, retention, and release of contaminants. In Contaminant Geochemistry: Transport and Fate in the Subsurface Environment; Berkowitz, B., Dror, I., Yaron, B., Eds.; Springer: Heidelberg/Berlin, Germany, 2008; pp. 93–126. [Google Scholar]
- Golia, E.E.; Dimirkou, A.; Floras, S.A. Spatial monitoring of arsenic and heavy metals in the Almyros area, Central Greece. Statistical approach for assessing the sources of contamination. Environ. Monit. Assess. 2015, 187, 399–412. [Google Scholar] [CrossRef]
- Oorts, K. Copper. In Heavy Metals in Soils. Environmental Pollution; Springer: Dordrecht, The Netherlands, 2013; pp. 367–394. [Google Scholar]
- Khanam, R.; Kumar, A.; Nayak, A.K.; Shahid, M.; Tripathi, R.; Vijayakumar, S.; Bhaduri, D.; Kumar, U.; Mohanty, S.; Panneerselvam, P.; et al. Metal(loid)s (As, Hg, Se, Pb and Cd) in paddy soil: Bioavailability and potential risk to human health. Sci. Total Environ. 2020, 699, 134330. [Google Scholar] [CrossRef]
- Bourazanis, G.; Katsileros, A.; Kosmas, C.; Kerkides, P. The effect of treated municipal wastewater and fresh water on saturated hydraulic conductivity of a clay-loamy soil. Water Resour. Manag. 2016, 30, 2867–2880. [Google Scholar] [CrossRef]
- Markiewicz-Patkowska, J.; Hursthouse, A.; Przybyla-Kij, H. The interaction of heavy metals with urban soils: Sorption behaviour of Cd, Cu, Cr, Pb and Zn with a typical mixed brownfield deposit. Environ. Int. 2005, 31, 513–521. [Google Scholar] [CrossRef] [PubMed]
- Nartowska, E.; Kozlowski, T.; Gawdzik, J. Assessment of the influence of copper and zinc on the microstructural parameters and hydraulic conductivity of bentonites on the basis of SEM tests. Heliyon 2019, 5, e02142. [Google Scholar] [CrossRef] [PubMed] [Green Version]
- Kozlowski, T.; Walaszczyk, L.; Kurpias-Warianek, K. Application of SEM to analysis of permeability coefficient of cohesive soils. Arch. Hydro-Eng. Environ. Mech. 2011, 58, 47–64. [Google Scholar] [CrossRef]
- Baghernejad, M.; Javaheri, F.; Moosavi, A.A. Adsorption isotherms of copper and zinc in clay minerals of calcareous soils and their effects on X-ray diffraction. Arch. Agron. Soil Sci. 2015, 61, 1061–1077. [Google Scholar] [CrossRef]
- Kypritidou, Z.; Argyraki, A. Geochemical interactions in the trace element–soil–clay system of treated contaminated soils by Fe-rich clays. Environ. Geochem. Health 2020, 43, 2483–2503. [Google Scholar] [CrossRef]
- Xie, S.; Wen, Z.; Zhan, H.; Jin, M. An Experimental Study on the Adsorption and Desorption of Cu(II) in Silty Clay. Geofluids 2018, 2018, 3610921. [Google Scholar] [CrossRef]
- Cui, H.; Ma, K.; Fan, Y.; Peng, X.; Mao, J.; Zhou, D.; Zhang, Z.; Zhou, J. Stability and heavy metal distribution of soil aggregates affected by application of apatite, lime, and charcoal. Environ. Sci. Pollut. Res. 2016, 23, 10808–10817. [Google Scholar] [CrossRef]
- Gao, X.; Gu, Y.; Xie, T.; Zhen, G.; Huang, S.; Zhao, Y. Characterization and environmental risk assessment of heavy metals in construction and demolition wastes from five sources (chemical, metallurgical and light industries, and residential and recycled aggregates). Environ. Sci. Pollut. Res. 2015, 22, 9332–9344. [Google Scholar] [CrossRef] [Green Version]
- Xiao, R.; Zhang, M.; Yao, X.; Ma, Z.; Yu, F.; Bai, J. Heavy metal distribution in different soil aggregate size classes from restored brackish marsh, oil exploitation zone, and tidal mud flat of the Yellow River Delta. J. Soils Sediments 2016, 16, 821–830. [Google Scholar] [CrossRef]
- Deng, A.; Wang, L.; Chen, F.; Li, Z.; Liu, W.; Liu, Y. Soil aggregate-associated heavy metals subjected to different types of land use in subtropical China. Glob. Ecol. Conserv. 2018, 16, e00465. [Google Scholar] [CrossRef]
- Defera, J.; Wogi, L.; Mishra, B.B. Assessment of physicochemical properties of soil under different land use types at Wuy Gose Sub-Watershed, North Shoa Zone of Oromia Region, Ethiopia. Int. J. Agric. Biol. Sci. 2019, 34–58. [Google Scholar]
- Nartowska, E. The effects of potentially toxic metals (copper and zinc) on selected physical and physico-chemical properties of bentonites. Heliyon 2019, 5, e02563. [Google Scholar] [CrossRef] [PubMed] [Green Version]
- Williams, S. Official Method of Analysis, 14th ed.; Association of Official Chemists, Inc.: Arlington, VA, USA, 1984; Volume 6, ISBN 9788578110796. [Google Scholar]
- Page, A.L. Methods of soil analysis-Part 2: Chemical and Microbiological properties. (2nd edition). Am. Soc. Agron. Inc. Publ. Madison USA 1982, 9, 421–422. [Google Scholar]
- ISO/DIS 11466; Environment Soil Quality. ISO Standards Compendium. International Organization for Standardization: Geneva, Switzerland, 1994.
- Golia, E.E.; Tsiropoulos, N.G.; Dimirkou, A.; Mitsios, I. Distribution of heavy metals of agricultural soils of central Greece using the modified BCR sequential extraction method. Int. J. Environ. Anal. Chem. 2007, 87, 1053–1063. [Google Scholar] [CrossRef]
- Van der Lee, J.J.; Temminghoff, F.; Houba, V.J.G.; Novozamsky, I. Background corrections in the determination of Cd and Pb by flame AAS in plant and soil samples with high Fe levels. Appl. Spectrosc. 1987, 41, 388–390. [Google Scholar] [CrossRef]
- Lajunen, L.H.G. Spectrochemical analysis by atomic absorption and emission. In Analytica Chimica Acta; The Royal Society Chemistry: Cambridge, UK, 1992. [Google Scholar]
- ASTM D5084-10 Standard test methods for measurement of hydraulic conductivity of saturated porous materials using a flexible wall permeameter. Annu. B ASTM Stamd. 2010, 1–23. [CrossRef]
- Sakellariou-Makrantonaki, M.; Angelaki, A.; Evangelides, C.; Bota, V.; Tsianou, E.; Floros, N. Experimental determination of hydraulic conductivity at unsaturated soil column. Proc. Procedia Eng. 2016, 162, 83–90. [Google Scholar] [CrossRef] [Green Version]
- Volk, J.; Yerokun, O. Effect of application of increasing concentrations of contaminated water on the different fractions of Cu and Co in sandy loam and clay loam soils. Agriculture 2016, 6, 64. [Google Scholar] [CrossRef] [Green Version]
- Golia, E.E.; Tsiropoulos, G.N.; Füleky, G.; Floras, S.; Vleioras, S. Pollution assessment of potentially toxic elements in soils of different taxonomy orders in central Greece. Environ. Monit. Assess. 2019, 191, 106. [Google Scholar] [CrossRef]
- Lasota, J.; Blonska, E.; Lyszczarz, S.; Tibbett, M. Forest humus type governs heavy metal accumulation in specific organic matter fractions. Water. Air. Soil Pollut. 2020, 231, 80. [Google Scholar] [CrossRef] [Green Version]
- Bronick, C.J.; Lal, R. Soil structure and management: A review. Geoderma 2005, 124, 3–22. [Google Scholar] [CrossRef]
- Li, Z.; Huang, B.; Huang, J.; Chen, G.; Zhang, C.; Nie, X.; Luo, N.; Yao, H.; Ma, W.; Zeng, G. Influence of removal of organic matter and iron and manganese oxides on cadmium adsorption by red paddy soil aggregates. RSC Adv. 2015, 5, 90588–90595. [Google Scholar] [CrossRef]
- Liu, Y.; Liu, W.; Wu, L.; Liu, C.; Wang, L.; Chen, F.; Li, Z. Soil aggregate-associated organic carbon dynamics subjected to different types of land use: Evidence from 13C natural abundance. Ecol. Eng. 2018, 122, 295–302. [Google Scholar] [CrossRef]
- Selker, J.S.; Assouline, S. An explicit, parsimonious, and accurate estimate for ponded infiltration into soils using the Green and Ampt approach. Water Resour. Res. 2017, 53, 7481–7487. [Google Scholar] [CrossRef]


| S | LC | |
|---|---|---|
| pH | 7.4 ± 0.38 * | 7.6 ± 0.4 |
| Organic C (%) | 0.3 ± 0.1 | 5.1 ± 0.3 |
| Clay (%) | 13 ± 0.9 | 58 ± 0.9 |
| Sand (%) | 61 ± 0.9 | 17 ± 0.8 |
| Bulk density ρb (g·cm−3) | 1.60 ± 0.12 | 1.32 ± 0.10 |
| Total Cu (mg/kg dry soil) | ND ** | ND |
| Total Zn (mg/kg dry soil) | ND | ND |
| S | LC | |
|---|---|---|
| % Average Increase at Cumulative Infiltration | % Average Increase at Cumulative Infiltration | |
| initial-after Cu 200 | 1.100 ± 0.005 | 12.900 ± 0.008 |
| initial-after Cu 400 | 1.100 ± 0.014 | 35.500 ± 0.006 |
| after Cu 400-after Cu 200 | 0.100 ± 0.005 | 19.900 ± 0.050 |
| initial-after Zn 200 | 0.700 ± 0.029 | 12.300 ± 0.008 |
| initial-after Zn 400 | 0.700 ± 0.014 | 15.500 ± 0.013 |
| after Zn 400-after Zn 200 | 0.040 ± 0.013 | 3.100 ± 0.097 |
| S | LC | |||||
|---|---|---|---|---|---|---|
| Ks (cm/min) | dI/dt (cm/min) | mse (Ks-dI/dt) | Ks (cm/min) | dI/dt (cm/min) | mse (Ks-dI/dt) | |
| Initial | 0.820 ± 0.006 | 0.800 ± 0.003 | 0.0004 | 0.049 ± 0.010 | 0.050 ± 0.010 | 0.000001 |
| After Cu 200 | 0.890 ± 0.011 | 0.880 ± 0.017 | 0.0001 | 0.090 ± 0.011 | 0.100 ± 0.005 | 0.000100 |
| After Cu 400 | 0.890 ± 0.011 | 0.880 ± 0.011 | 0.0001 | 0.108 ± 0.005 | 0.120 ± 0.008 | 00.00025 |
| After Zn 200 | 0.820 ± 0.012 | 0.830 ± 0.006 | 0.0001 | 0.070 ± 0.014 | 0.075 ± 0.013 | 0.000025 |
| After Zn 400 | 0.820 ± 0.009 | 0.830 ± 0.012 | 0.0001 | 0.072 ± 0.007 | 0.077 ± 0.007 | 0.000025 |
| mse (initial-after Cu 200) | 0.0049 | 0.0064 | 0.0017 | 0.0025 | ||
| mse (initial-after Cu 400) | 0.0049 | 0.0064 | 0.0004 | 0.0006 | ||
| mse (initial-after Zn 200) | 0.0000 | 0.0009 | 0.0035 | 0.0049 | ||
| mse (initial-after Zn 400) | 0.0000 | 0.0009 | 0.0005 | 0.0007 | ||
| % increase (after Cu 400-after Cu 200) | 0.0 | 0.0 | 20.0 ± 1.0 | 20.0 ± 1.0 | ||
| % increase (after Zn 400-after Zn 200) | 0.0 | 0.0 | 3.0 ± 0.6 | 2.7 ± 0.5 | ||
| S | LC | |
|---|---|---|
| S (cm/min1/2) | S (cm/min1/2) | |
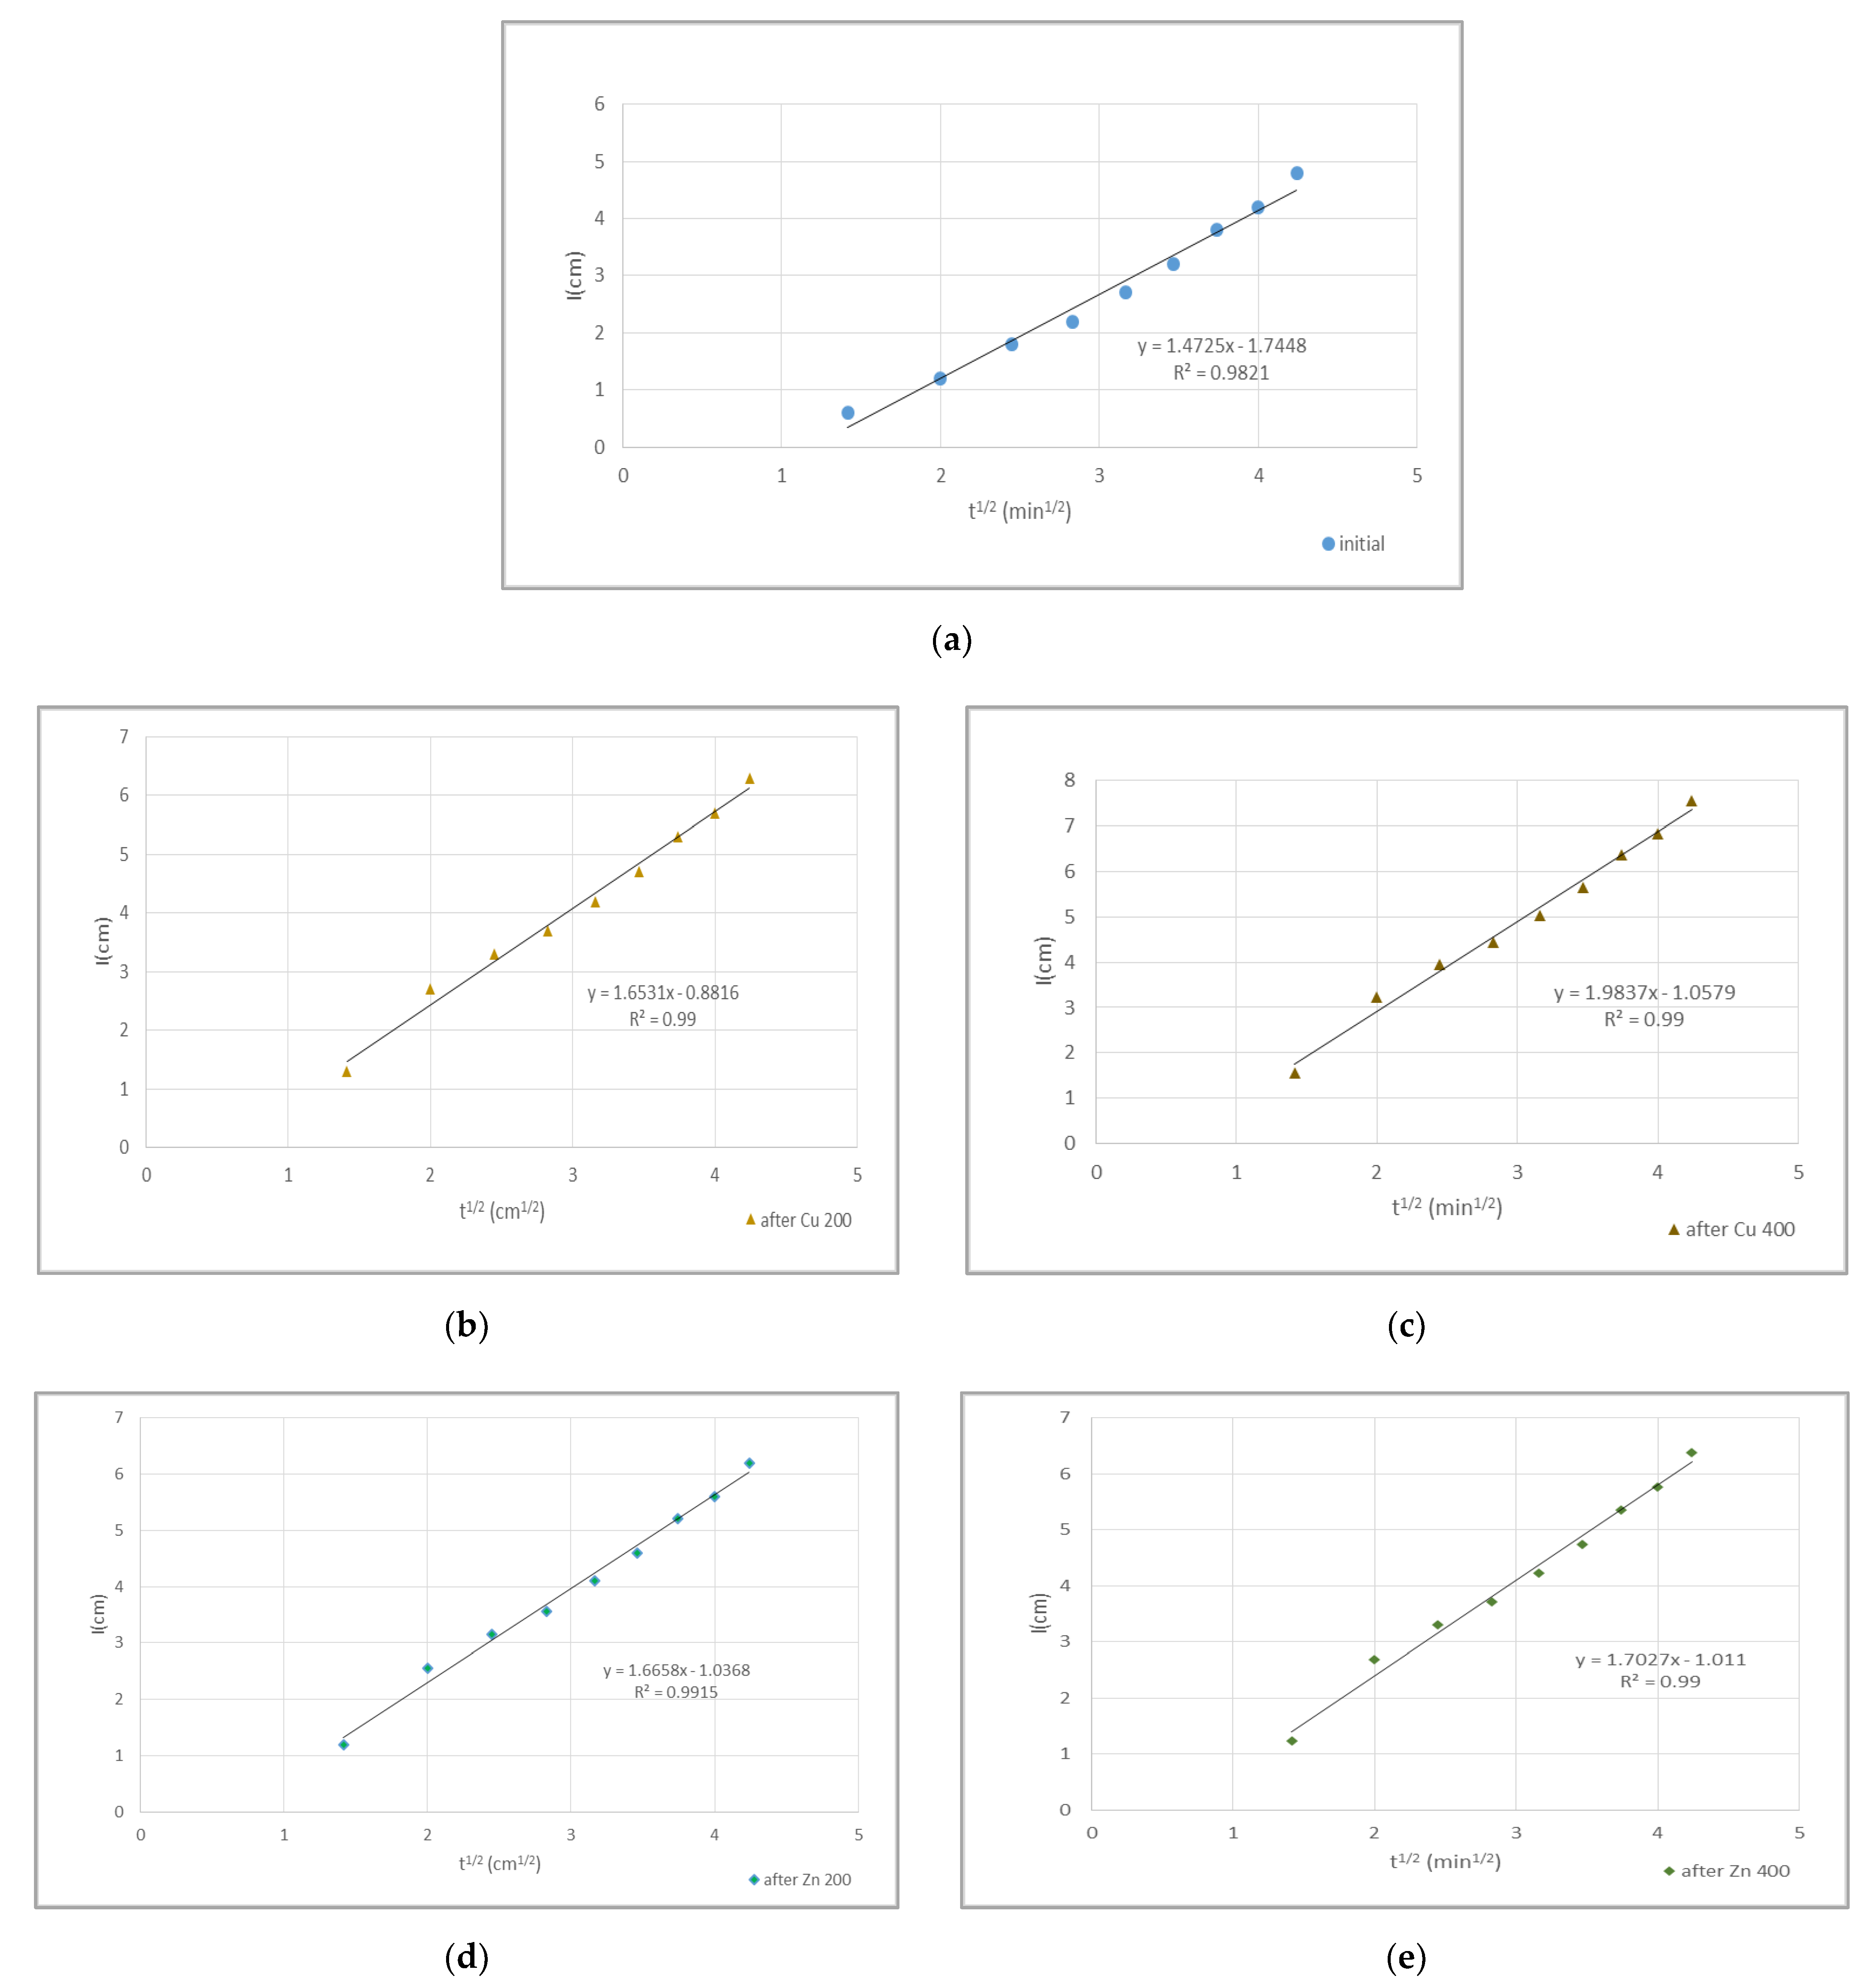
| Initial | 4.6754 ± 0.0001 | 1.4725 ± 0.0007 |
| After Cu 200 | 4.6315 ± 0.0002 | 1.6531 ± 0.0003 |
| After Cu 400 | 4.6315 ± 0.0003 | 1.9837 ± 0.0005 |
| After Zn 200 | 4.6136 ± 0.0001 | 1.6658 ± 0.0001 |
| After Zn 400 | 4.6136 ± 0.0001 | 1.7027 ± 0.0002 |
| mse (initial-after Cu 200) | 0.0019 | 0.0326 |
| mse (initial-after Cu 400) | 0.0019 | 0.2613 |
| mse (initial-after Zn 200) | 0.0038 | 0.0374 |
| mse (initial-after Zn 400) | 0.0038 | 0.0530 |
| % increase (after Cu 400-after Cu 200) | 0.0 | 20.0 ± 1.0 |
| % increase (after Zn 400-after Zn 200) | 0.0 | 2.2 ± 0.3 |
| S | LC | |||
|---|---|---|---|---|
| Relative mse (G&A-exper. Points) | Relative mse (P-exper. Points) | Relative mse (G&A-exper. Points) | Relative mse (P-exper. Points) | |
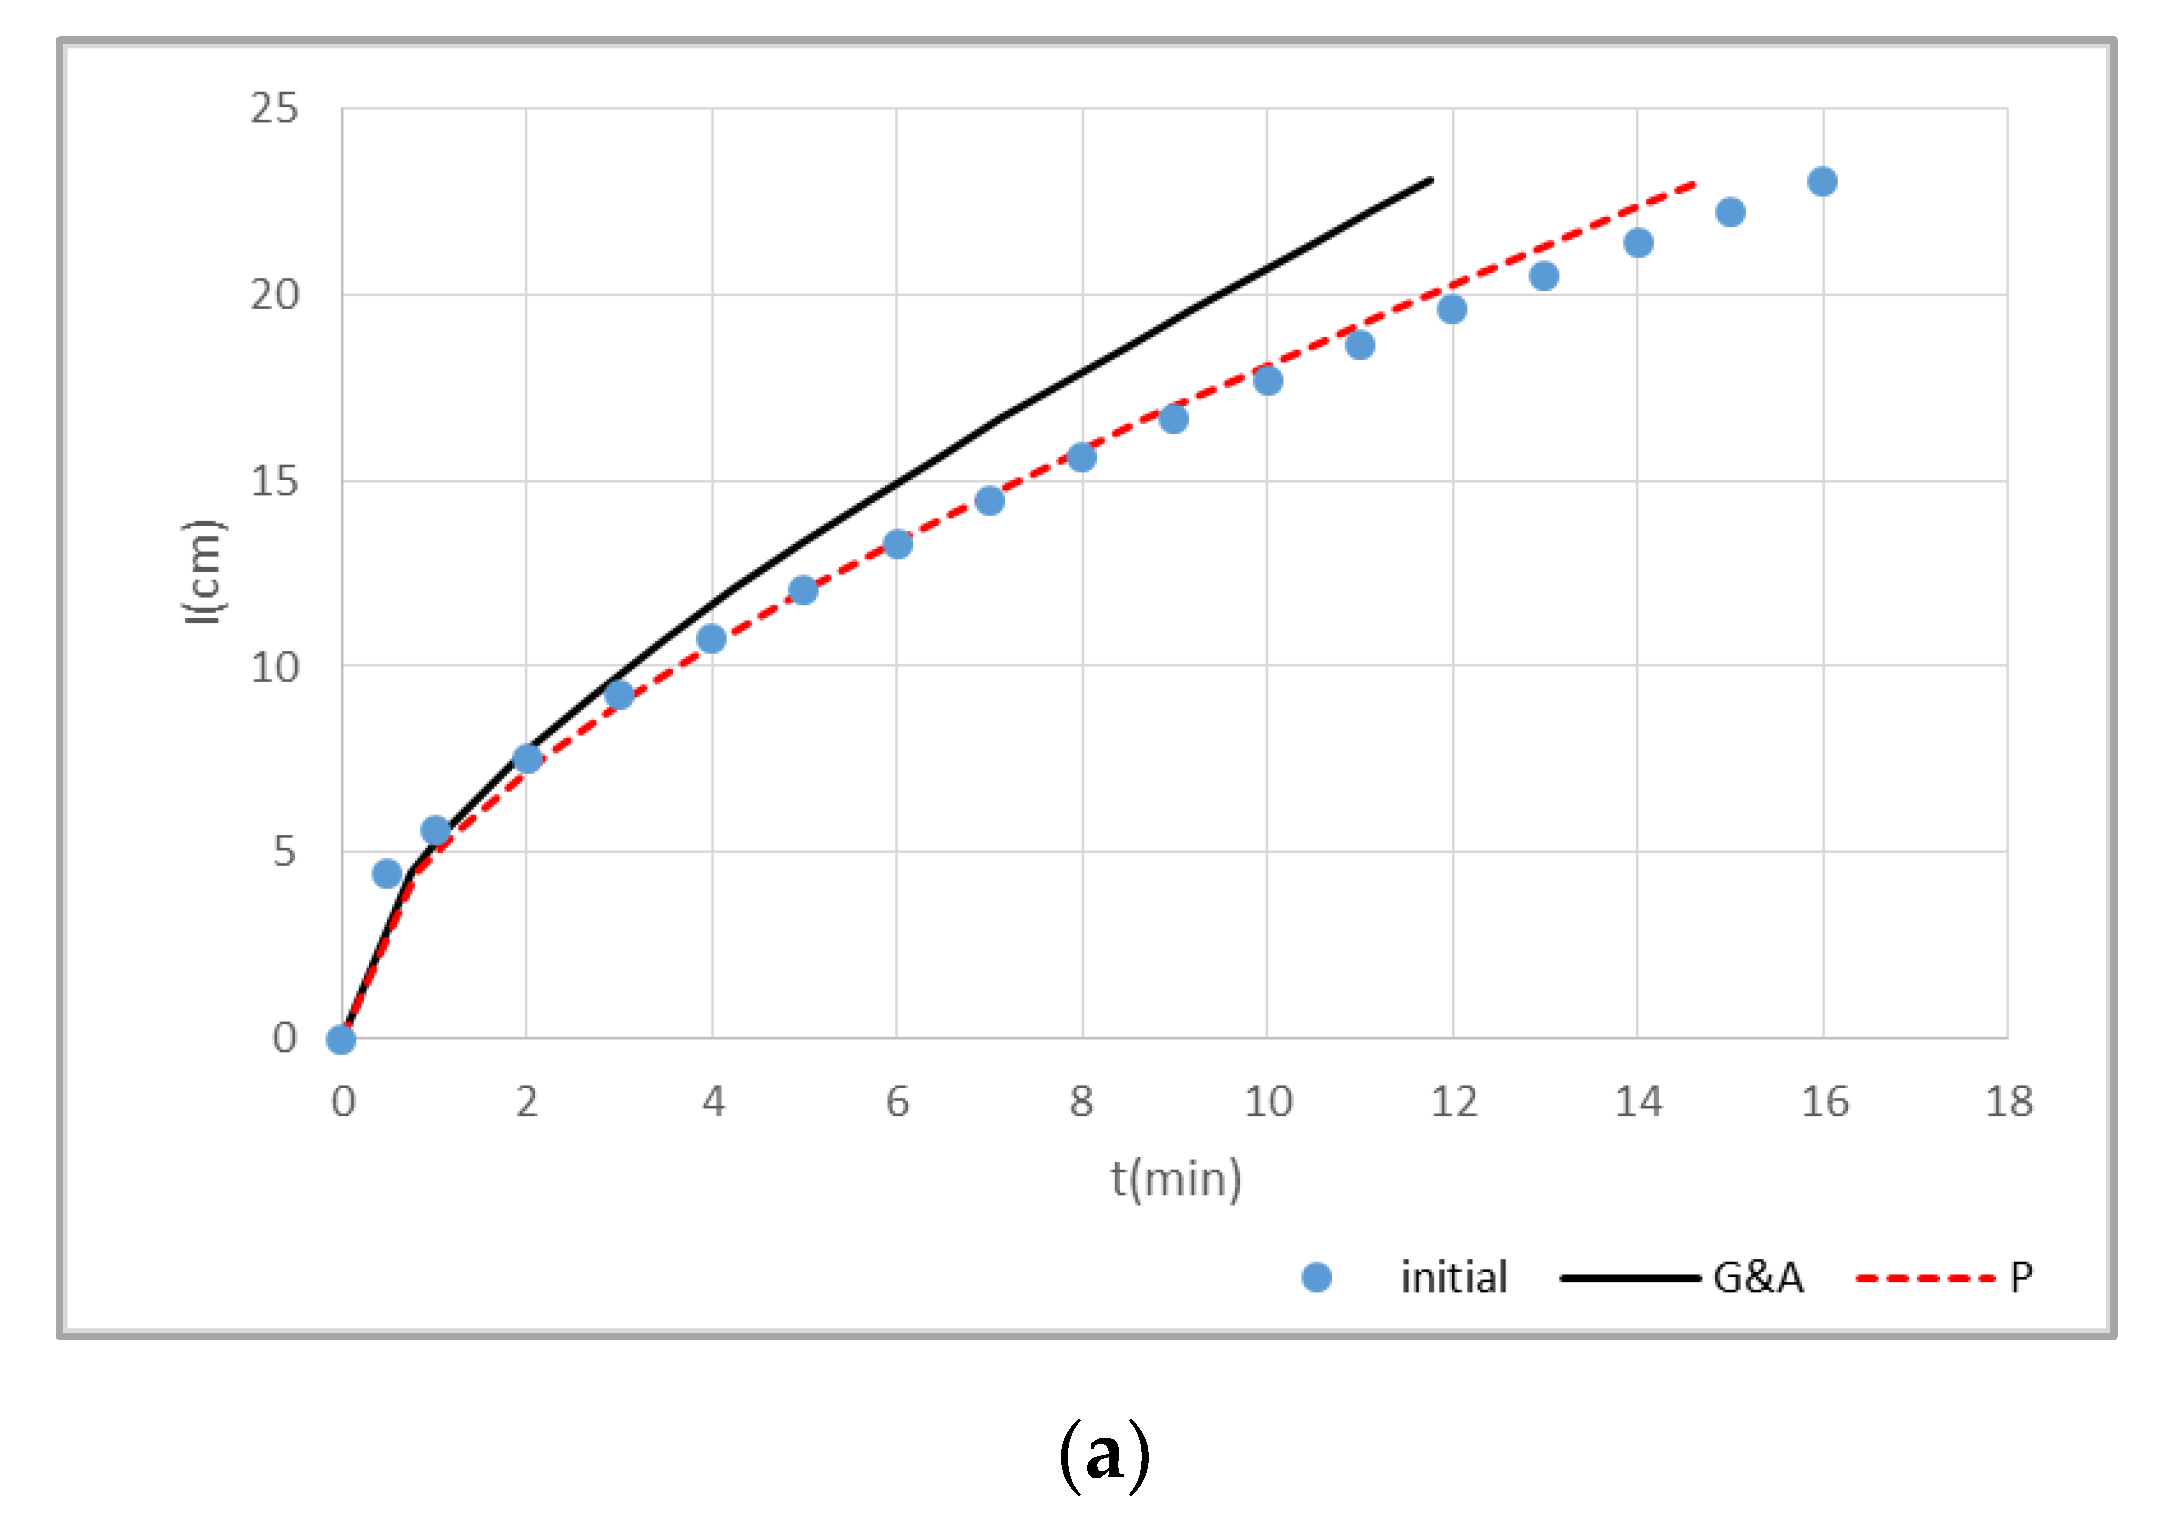
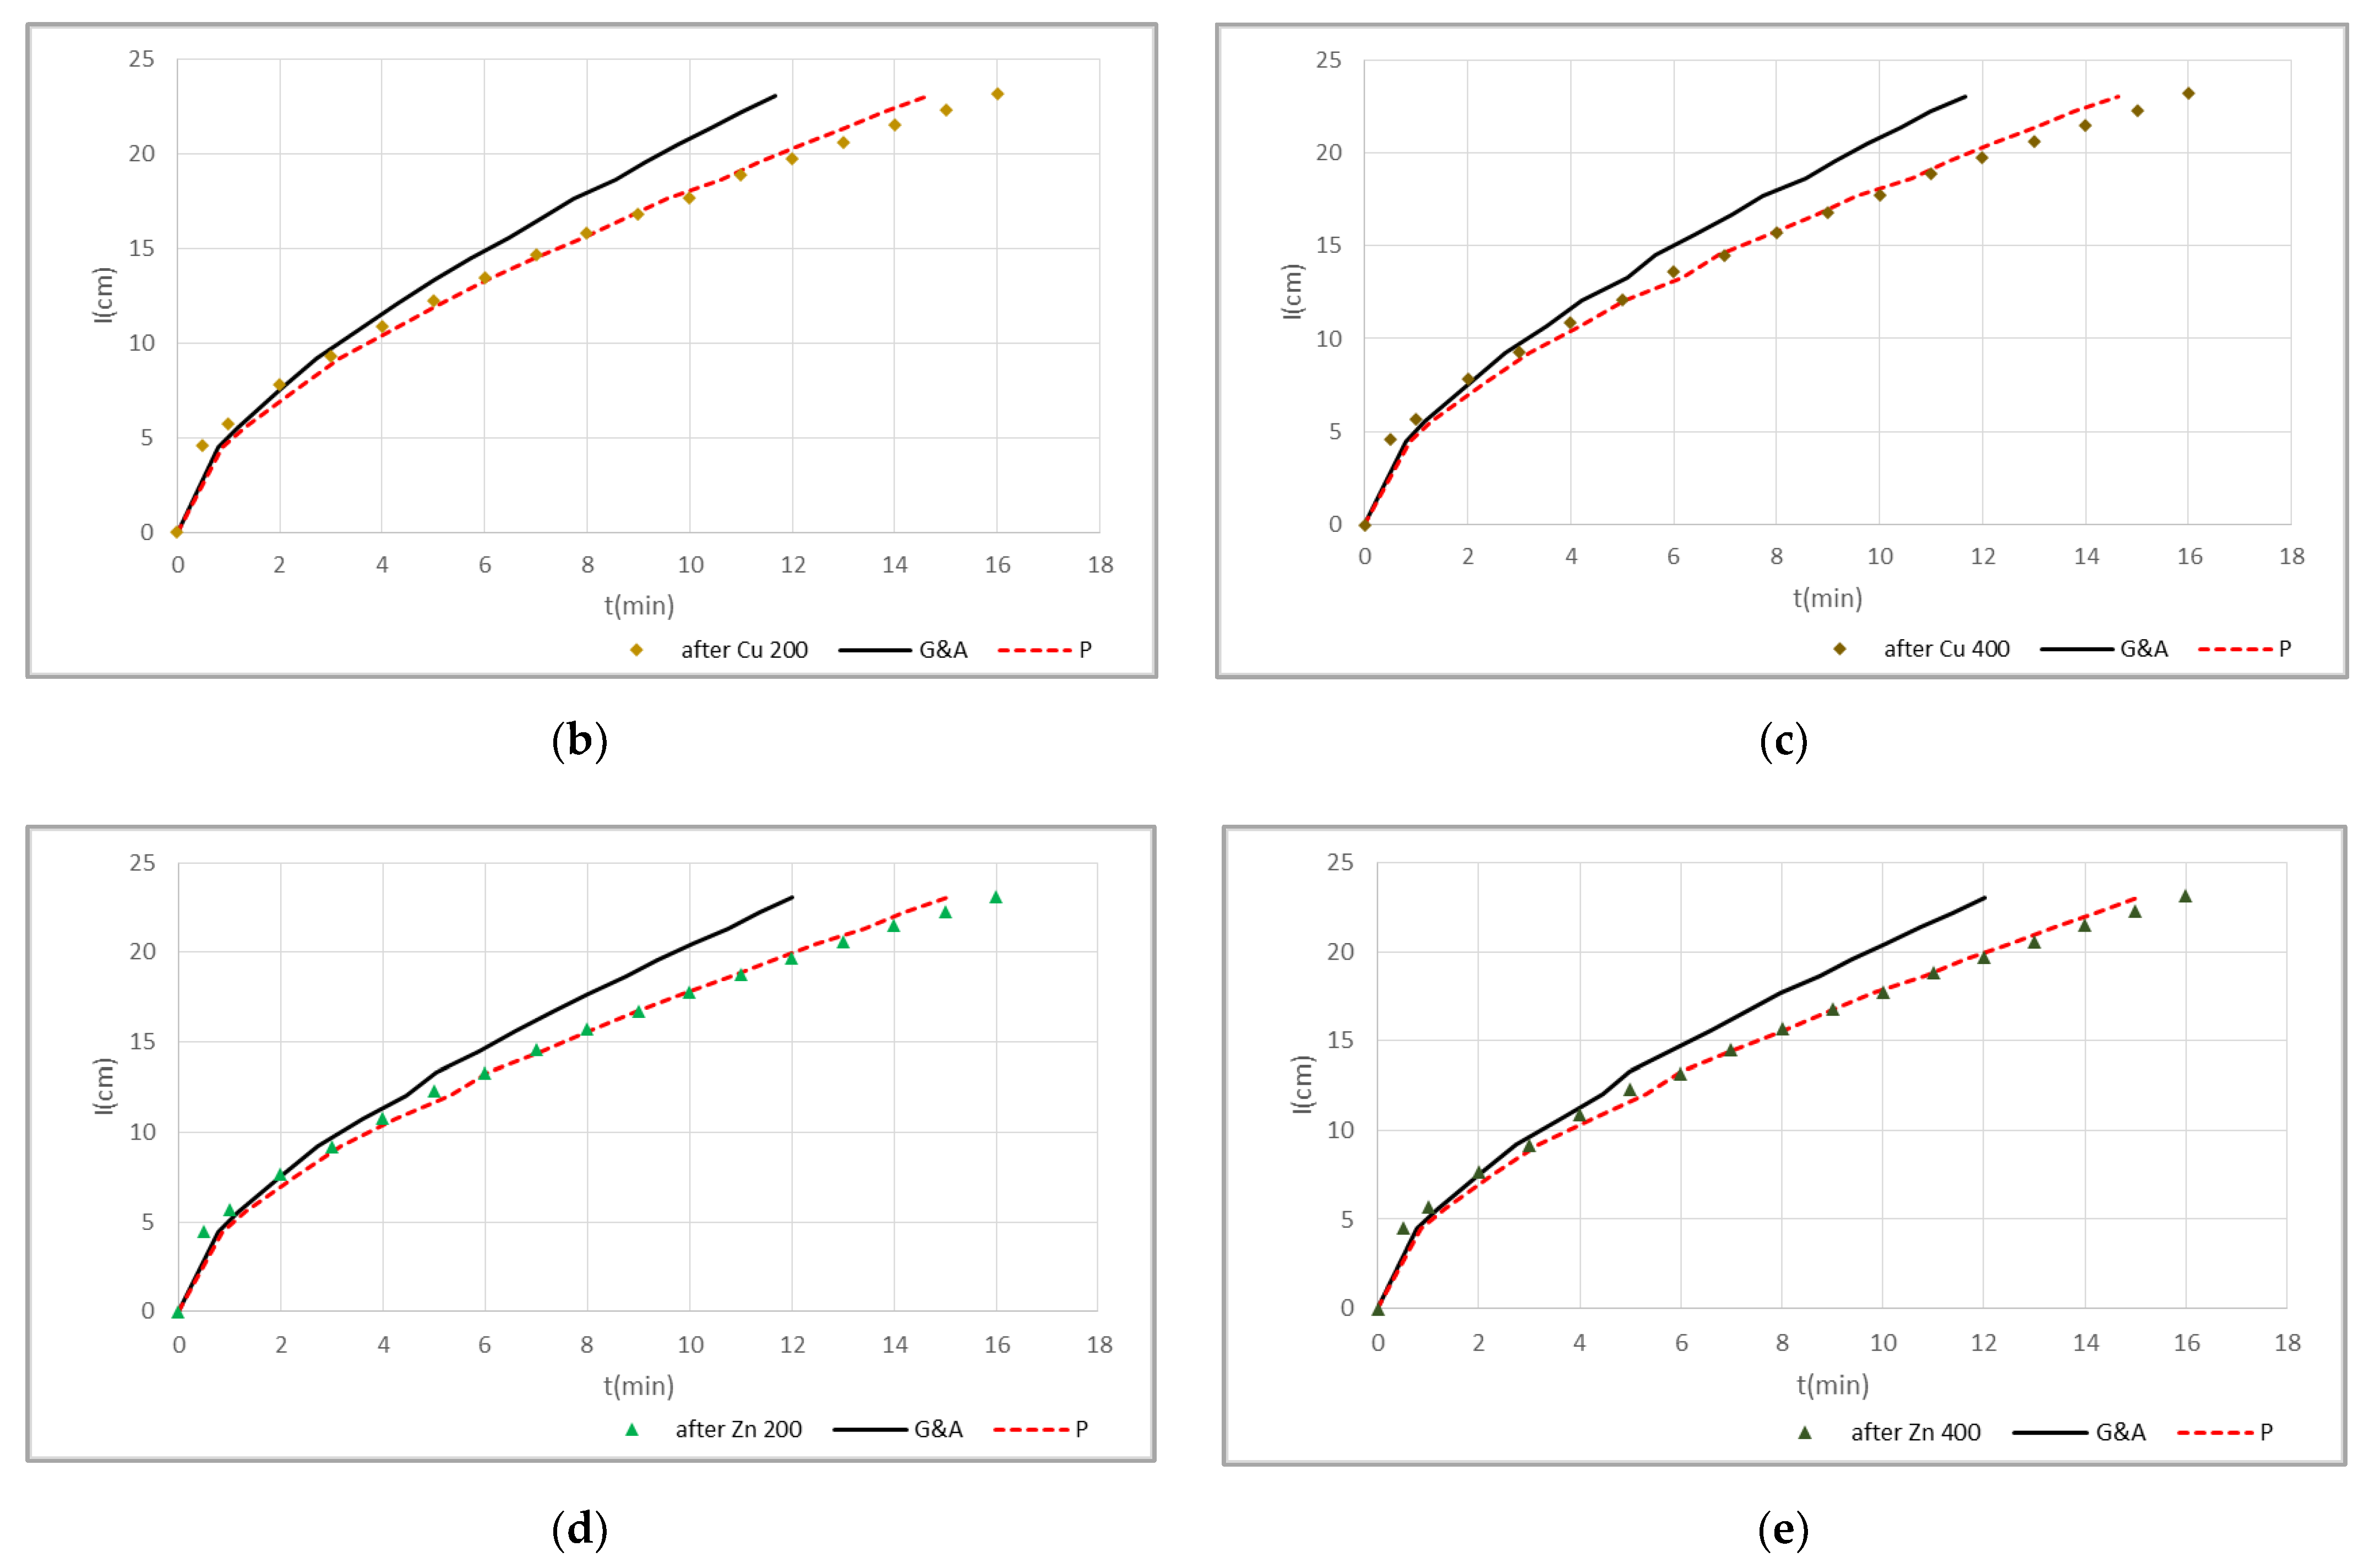
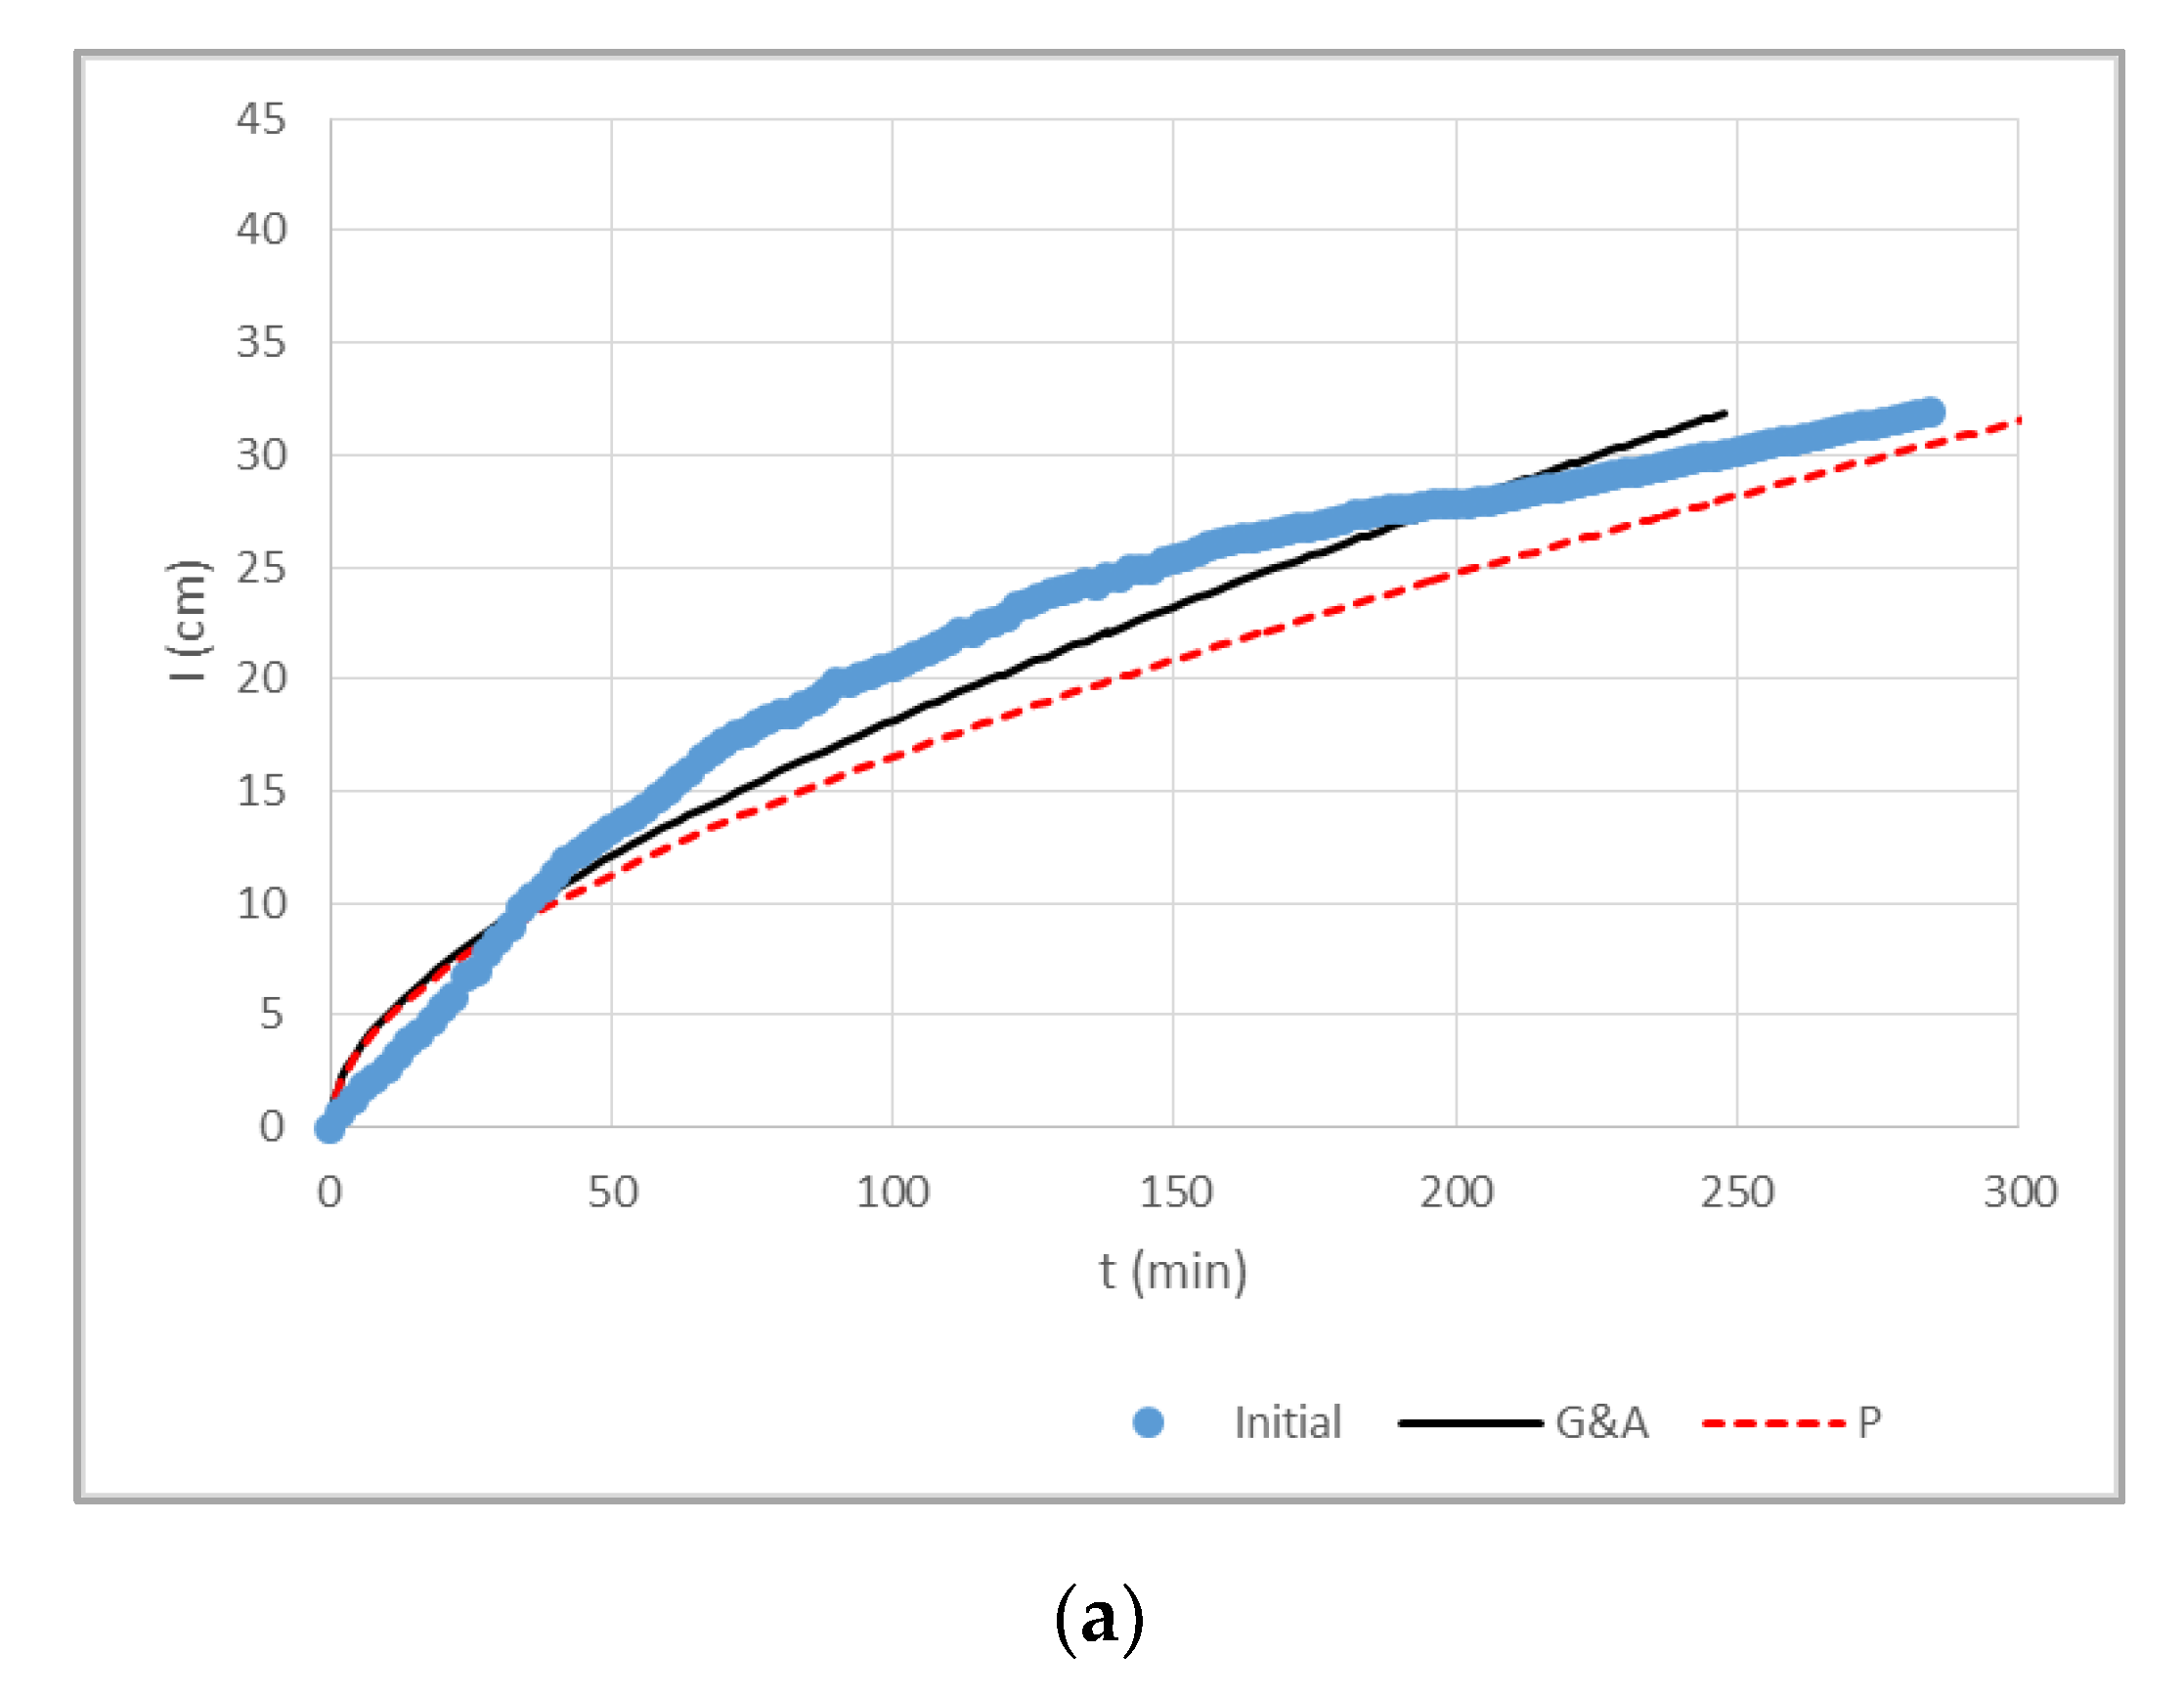
| Initial | 0.05 | 0.03 | 0.10 | 0.14 |
| After Cu 200 | 0.06 | 0.04 | 0.06 | 0.05 |
| After Cu 400 | 0.06 | 0.04 | 0.03 | 0.03 |
| After Zn 200 | 0.05 | 0.04 | 0.07 | 0.05 |
| After Zn 400 | 0.05 | 0.04 | 0.04 | 0.04 |
Publisher’s Note: MDPI stays neutral with regard to jurisdictional claims in published maps and institutional affiliations. |
© 2022 by the authors. Licensee MDPI, Basel, Switzerland. This article is an open access article distributed under the terms and conditions of the Creative Commons Attribution (CC BY) license (https://creativecommons.org/licenses/by/4.0/).
Share and Cite
Angelaki, A.; Dionysidis, A.; Sihag, P.; Golia, E.E. Assessment of Contamination Management Caused by Copper and Zinc Cations Leaching and Their Impact on the Hydraulic Properties of a Sandy and a Loamy Clay Soil. Land 2022, 11, 290. https://0-doi-org.brum.beds.ac.uk/10.3390/land11020290
Angelaki A, Dionysidis A, Sihag P, Golia EE. Assessment of Contamination Management Caused by Copper and Zinc Cations Leaching and Their Impact on the Hydraulic Properties of a Sandy and a Loamy Clay Soil. Land. 2022; 11(2):290. https://0-doi-org.brum.beds.ac.uk/10.3390/land11020290
Chicago/Turabian StyleAngelaki, Anastasia, Alkiviadis Dionysidis, Parveen Sihag, and Evangelia E. Golia. 2022. "Assessment of Contamination Management Caused by Copper and Zinc Cations Leaching and Their Impact on the Hydraulic Properties of a Sandy and a Loamy Clay Soil" Land 11, no. 2: 290. https://0-doi-org.brum.beds.ac.uk/10.3390/land11020290