Article

Soil Organic Carbon Isotope Tracing in Sorghum under Ambient CO2 and Free-Air CO2 Enrichment (FACE)

1
Laboratory of Tree-Ring Research, University of Arizona, Tucson, AZ 85721, USA
2
Department of Botany, University of Wyoming, Laramie, WY 82071, USA
3
The Geospatial Center, Delta State University, Cleveland, MS 38732, USA
4
U.S. Department of Agriculture-Agricultural Research Service, U.S. Arid-Land Agricultural Research Center, Maricopa, AZ 85138, USA
5
U.S. Department of Agriculture-Agricultural Research Service, Phoenix, AZ 85044, USA
6
Department of Plant Sciences, University of Arizona, Tucson, AZ 85721, USA
7
Department of Soil, Water and Environmental Science, University of Arizona, Tucson, AZ 85721, USA
8
Natural Resource Ecology Laboratory, Colorado State University, Fort Collins, CO 80523, USA
9
School of Plant and Environmental Sciences, Virginia Tech, Blacksburg, VA 24061, USA
10
College of Science, Engineering and Technology, Grand Canyon University, Phoenix, AZ 85019, USA
*
Author to whom correspondence should be addressed.
Deceased.
Submission received: 1 January 2022 / Revised: 8 February 2022 / Accepted: 15 February 2022 / Published: 18 February 2022

Abstract

:
As atmospheric carbon dioxide concentrations, [CO2Air], continue their uncontrolled rise, the capacity of soils to accumulate or retain carbon is uncertain. Free-air CO2 enrichment (FACE) experiments have been conducted to better understand the plant, soil and ecosystem response to elevated [CO2], frequently employing commercial CO2 that imparts a distinct isotopic signal to the system for tracing carbon. We conducted a FACE experiment in 1998 and 1999, whereby sorghum (C4 photosynthetic pathway) was grown in four replicates of four treatments using a split-strip plot design: (i) ambient CO2/ample water (365 μmol mol−1, “Control–Wet”), (ii) ambient CO2/water stress (“Control–Dry”), (iii) CO2-enriched (560 μmol mol−1, “FACE–Wet”), and (iv) CO2-enriched/water stressed (“FACE–Dry”). The stable-carbon isotope composition of the added CO2 (in FACE treatments) was close to that of free atmosphere background values, so the subsequent similar 13C-enriched carbon signal photosynthetically fixed by C4 sorghum plants could be used to trace the fate of carbon in both FACE and control treatments. Measurement of soil organic carbon content (SOC (%) = gC/gdry soil × 100%) and δ13C at three depths (0–15, 15–30, and 30–60 cm) were made on soils from the beginning and end of the two experimental growing seasons. A progressive ca. 0.5‰–1.0‰ δ13C increase in the upper soil SOC in all treatments over the course of the experiment indicated common entry of new sorghum carbon into the SOC pools. The 0–15 cm SOC in FACE treatments was 13C-enriched relative to the Control by ca. 1‰, and according to isotopic mass balance, the fraction of the new sorghum-derived SOC in the Control–Wet treatment at the end of the second season was 8.4%, 14.2% in FACE–Wet, 6.5% in Control–Dry, and 14.2% in FACE–Dry. The net SOC enhancement resulting from CO2 enrichment was therefore 5.8% (or 2.9% y−1 of experiment) under ample water and 7.7% (3.8% y−1 of experiment) under limited water, which matches the pattern of greater aboveground biomass increase with elevated [CO2Air] under the Dry treatment, but no parallel isotopic shifts were found in deeper soils. However, these increased fractions of new carbon in SOC at the end of the experiment do not necessarily mean an increase in total SOC content, because gravimetric measurements of SOC did not reveal a significant increase under elevated [CO2Air], at least within the limits of SOC-content error bars. Thus, new carbon gains might be offset by pre-experiment carbon losses. The results demonstrate successful isotopic tracing of carbon from plants to soils in this sorghum FACE experiment showing differences between FACE and Control treatments, which suggest more dynamic cycling of SOC under elevated [CO2Air] than in the Control treatment.

1. Introduction

Current atmospheric CO2 concentration [CO2Air] is at ca. 420 μmol mol−1, and depending on mitigation interventions, rising [CO2Air] may reach or exceed 550 μmol mol−1 by the end of the century [1]. Interest in the potential effects of such future elevated [CO2Air] on various plants and ecosystems prompted a wave of free-air CO2 enrichment (FACE) experiments beginning near the end of the 20th century [2,3,4,5,6], among which included sorghum experiments in 1998 and 1999 at Maricopa, Arizona. An extensive range of measurements and data collection during the experiments focused on plants, soils, water, and microclimate, including soil organic carbon (SOC) because soils are one of the principal compartments in terrestrial ecosystems where significant amounts of carbon may potentially accumulate over long time scales. On one hand, soil management strategies might help mitigate rising [CO2Air] and greenhouse warming [7]. On the other hand, if alterations to ecosystems under future environmental conditions promote net loss of carbon from soils, fluxes from this large carbon pool could accelerate the rise in [CO2Air].
Carbon isotope tracers intrinsic to the FACE experiments were exploited to address carbon cycling in soils under elevated [CO2Air]. The commercial CO2 used to elevate [CO2Air] in many FACE experiments is derived as a petroleum byproduct and has an isotopic composition depleted in 13C relative to the background air. Consequently, the plants grown under elevated [CO2Air] acquire this tracer, and carbon inputs from the isotopically labeled plants to the soils can be revealed by shifts in the stable-carbon isotope composition of SOC that pre-experimentally was in approximate equilibrium for years to centuries with plants growing under background [CO2Air]. The larger the difference between the carbon isotopic composition of the plants and soils, the greater the potential for success in quantifying fluxes. This tracer signal has now been used in many FACE studies [8,9,10,11,12,13] and even some chamber studies [14,15].
Unfortunately, similarly strong isotope labeling in the corresponding control plots is uncommon in these experiments such that comparing the difference in results from the elevated and control [CO2Air] treatments is not straightforward. Attempts have been made to overcome this problem by using (1) small subplots containing soils transferred from other sites whose carbon isotopic composition was derived from a long history of C4-plant growth [10,16], (2) small subplots within control plots exposed to pulsed pure 13CO2 tracer [10], and (3) the small but quantifiable isotopic difference between the carbon in control plants and that in the local soil organic carbon [11]. However, none of these are ideal solutions to overcome the lack of a carbon isotope tracer signal in the control [CO2Air] plots similar to that in enriched plots.
In contrast to the above experiments, the isotopic composition of the commercial CO2 in the sorghum FACE experiment was not the primary tracer in the experiment. We specifically sought a commercial source for the CO2 enrichment whose δ13C value (δ13C in ‰ = [Rsample/Rstandard − 1] × 1000, where R = 13C/12C) was as close to that of background air CO2 as possible, thereby promoting the natural δ13C tracer inherent in the C4 sorghum plants in all treatments. Different photosynthetic carbon-fixation pathways result in C3 plants having a 13C-depleted δ13C of ca. −25‰ to −28‰, whereas C4 plants have a relatively 13C-enriched δ13C of ca. −10‰ to −14‰. These isotopic differences were first exploited in agricultural systems undergoing a shift from C3 to C4 cultivation or vice versa to reveal soil carbon dynamics [17,18,19]. At our Arizona site, the natural C4 plant isotopic composition is much more 13C enriched than the soil organic carbon present in the local soils. Ours was the first FACE study in which nearly equivalent, robust and uniform isotopic tracers were present in all treatments, enabling near-optimal conditions to judge the relative differences under the two [CO2Air] levels. This capability was particularly important because, in principle, the C4 carbon-fixation pathway cannot achieve the increase in photosynthetic rates under high CO2 that C3 plants attain [20,21]. Therefore, any increases in sorghum productivity under CO2 enrichment, which might be conveyed to SOC, were likely to be small and perhaps more a consequence of water-use efficiency advantages [22,23,24,25,26,27]. Only two other FACE experiments since ours have been conducted on a C4 crop (maize) in Urbana, Illinois [28], and Braunschweig, Germany [29], and as far as we are aware, neither included the detailed isotopic tracing we have done.
Our first objective was to collect air, plant, and soil samples over the course of the 1998 and 1999 sorghum FACE experiments to characterize the state of their stable-carbon isotope system. Our second objective was to use the isotopic values, especially temporal shifts in soil carbon isotope values, to calculate the isotope mass balance fraction of SOC resulting from the excess “new” carbon added to soils under the elevated [CO2Air] treatments relative to that added to the SOC in the control.
We hypothesized that the isotopic methods would be sufficiently sensitive to detect small differences in SOC content between elevated [CO2Air] and control treatments by isotope mass balance. If the inputs of new carbon are large enough, we would also expect an increase in the gravimetrically determined total SOC content. Furthermore, measurements on sorghum biomass [24] showed that under elevated [CO2Air], the differential increase in biomass yield in the low-water treatment was greater than in the ample-water treatment, so the changes in SOC would be expected to follow this pattern.

2. Methods

Successive FACE experiments were conducted in the 1998 and 1999 growing seasons with grain sorghum [Sorghum bicolor (L.) Möench], a C4 crop, at the University of Arizona Maricopa Agricultural Center (MAC), Maricopa, Arizona, U.S.A. Details on some plant and soil responses found in other research efforts during the Maricopa FACE sorghum experiments can be found in Refs. [24,25,27,30,31,32]. Sorghum was grown in 4 replicates of 4 treatments, using a split-strip plot design within a laser-leveled 12-ha field: ambient CO2/ample water (ca. 365 μmol mol−1 CO2 = “Control–Wet”); ambient CO2/water stress (“Control–Dry”); CO2-enriched/ample water (ca. 560 μmol mol−1 CO2 = “FACE–Wet”); and CO2-enriched/water stressed (“FACE–Dry”). The sorghum was planted in soils classified as Trix clay loam (fine-loamy, mixed (calcareous), hyperthermic Typic Torrifluvents [33,34]). After planting, plenum rings constructed from 0.305 m inside-diameter PVC pipe were installed around the circumference of each 25 m diameter circular plot. In the four elevated [CO2Air] plots, air and commercial CO2 were mixed in this pipe and injected through holes in vertical standpipes onto the plots to maintain CO2 concentrations at a canopy level at an average of 190–200 μmol mol−1 above the background concentrations measured in the corresponding Control plots. Based on the performance of the same equipment used in the Maricopa cotton FACE experiments, the CO2 control/distribution system is very good at maintaining a mean [CO2Air] target level at the center of the rings over the growing season, with a 1 min average concentration measurement within 10% of the target concentration 90% of the time [35]. Identical systems with air blowers were installed in the Control plots to avoid inducing differences related to air movement [36]. Details of this FACE methodology and technology are available in several references [37,38,39].
Wet treatments received flood irrigation when 30% of the available soil water in the rooted zone was lost by evapotranspiration and percolation [25,27]. The total amounts of irrigation plus rain applied during 1998 were 1218 and 474 mm to the Wet and Dry plots, respectively. The 1218 mm applied to the Wet plots was probably in excess of evapotranspiration, and percolation below the root zone was estimated (methodology of [40]) at 226 mm. In 1999, the amounts of irrigation plus rain were 1047 and 491 mm for Wet and Dry, respectively.
The field was laser leveled in 1998 and disked in two directions prior to 8 April. Planting took place on 15–16 July in relatively dry soil in north–south rows spaced 0.76 m (30 inches) apart. FACE treatment started on 31 July, when ca. 50% of the seedlings had emerged. Final grain harvest was conducted on 21 December. The sorghum stubble was chopped on 12 January 1999, disked into the soil on 29 January, and disked a second time on 3 February. The field was re-leveled on 3 March 1999, and sorghum was planted on 14–15 June 1999. There was ca. 50% emergence on 1 July, and the FACE treatment commenced on 2 July. Final grain harvest was conducted on 26 October 1999. The field was fallow between the two experimental growing seasons, but prior to the start of the 1998 FACE experiment, a sorghum crop had been grown on the land in the summer–fall of 1997, followed by a barley cover crop in the winter–spring, which was harvested for hay before maturity at the beginning of April 1998. The details of seed planting, irrigation, phenological development, harvest, and application of insecticides, herbicides, fertilizers, are given in Ref. [24].
Soil samples were collected with bucket augers at the beginning and end of the 1998 and 1999 experiments. The first set of samples was obtained on 20–21 July 1998, after planting but prior to plant emergence. The samples included soils from depths of 0–15, 15–30 and 30–60 cm, taken at quadrant positions 5–6 m from the center of each of the 8 rings. For each depth, there were two “between row” soil samples from each of the four replicated treatments. Each sample was placed in a paper bag and subsequently air-dried. After harvest, an equivalent set of samples was collected ca. three weeks after grain harvest on 12 January 1999. Prior to the second growing season, we sampled soils on 18–19 June 1999, after planting but before emergence. We sampled a final complete set of soils from comparable field positions on 7 November 1999, 12 days after grain harvest.
These soils were initially sieved to remove rock grains and plant fragments larger than 1 mm. Inorganic carbonates were dissolved with 1N HCl, and floating plant fragments were skimmed from the surface of the mixture. A concentrated NaCl solution (ρ ≈ 1.2 g cm−3) was subsequently used to float persisting plant fragments, which were likewise skimmed. Soils were then rinsed, dried and pulverized with a mortar and pestle. These carbonate-free soils were examined at 20× magnification and remaining recognizable plant fragments were manually removed. Thus, SOC and isotopic measurements were made on mineral-associated organic matter with some fine particulate organic matter [41]. Splits of 100–200 mg of soil sample with CuO powder and Ag foil were combusted (900 °C for 2 h, 650 °C for 2 h) in evacuated, sealed quartz tubes (after [42]). The CO2 resulting from combustion was cryogenically separated, its carbon yield (mg C) was determined manometrically, and its δ13C was analyzed via mass spectrometry (see below).
Air samples were collected with 2 and 3 L evacuated flasks ca. every 2 weeks of each growing season from the center of Control and FACE plots primarily in replicates 1 and 2, but occasionally in replicates 3 and 4. Sometimes, the air was drawn directly from the plot into the flasks, whereas on other occasions, an integrated sample was obtained by pumping air for 10 min into a 10 L mylar balloon and taking the flask sample from well-mixed air within the balloon. CO2 was isolated from the flasks by cryogenic trapping on a laboratory vacuum line system. The purified CO2 was analyzed on a Finnigan-MAT Delta-S® mass spectrometer to determine δ13C with respect to the internationally accepted VPDB (Vienna-PDB) reference standard [43,44]. Commercial tank CO2 samples were also taken ca. biweekly with 10 mL evacuated vials and similarly processed and analyzed to determine the composition of the commercial source.
The plant tissues analyzed here were obtained from a representative bulk sample of leaves and stems from multiple plants taken at the end of each season from the final harvest area of each field plot (the “stover” sample in [24]). Plant samples at the end of the 1998 FACE experiment were collected on 22 December, and those from the 1999 experiment were collected on 27 October. Subsequently, ca. 4 mg of each sample was combusted at 800 °C in a recirculating microcombustion system in the presence of excess O2, and the CO2 was isolated cryogenically and analyzed via mass spectrometry.
Comparisons among treatment results for the same period were done with one-way ANOVA or Student t-tests. Comparisons of treatment results over successive time periods were made with a repeated measures ANOVA. The algorithms to calculate plant carbon isotope discrimination are detailed in Results and Discussion, Section 3.3, and the isotopic mass balance algorithm used to determine the fractions of new and pre-experiment carbon in the SOC at the end of the experiment is described in Results and Discussion, Section 3.4.

3. Results and Discussion

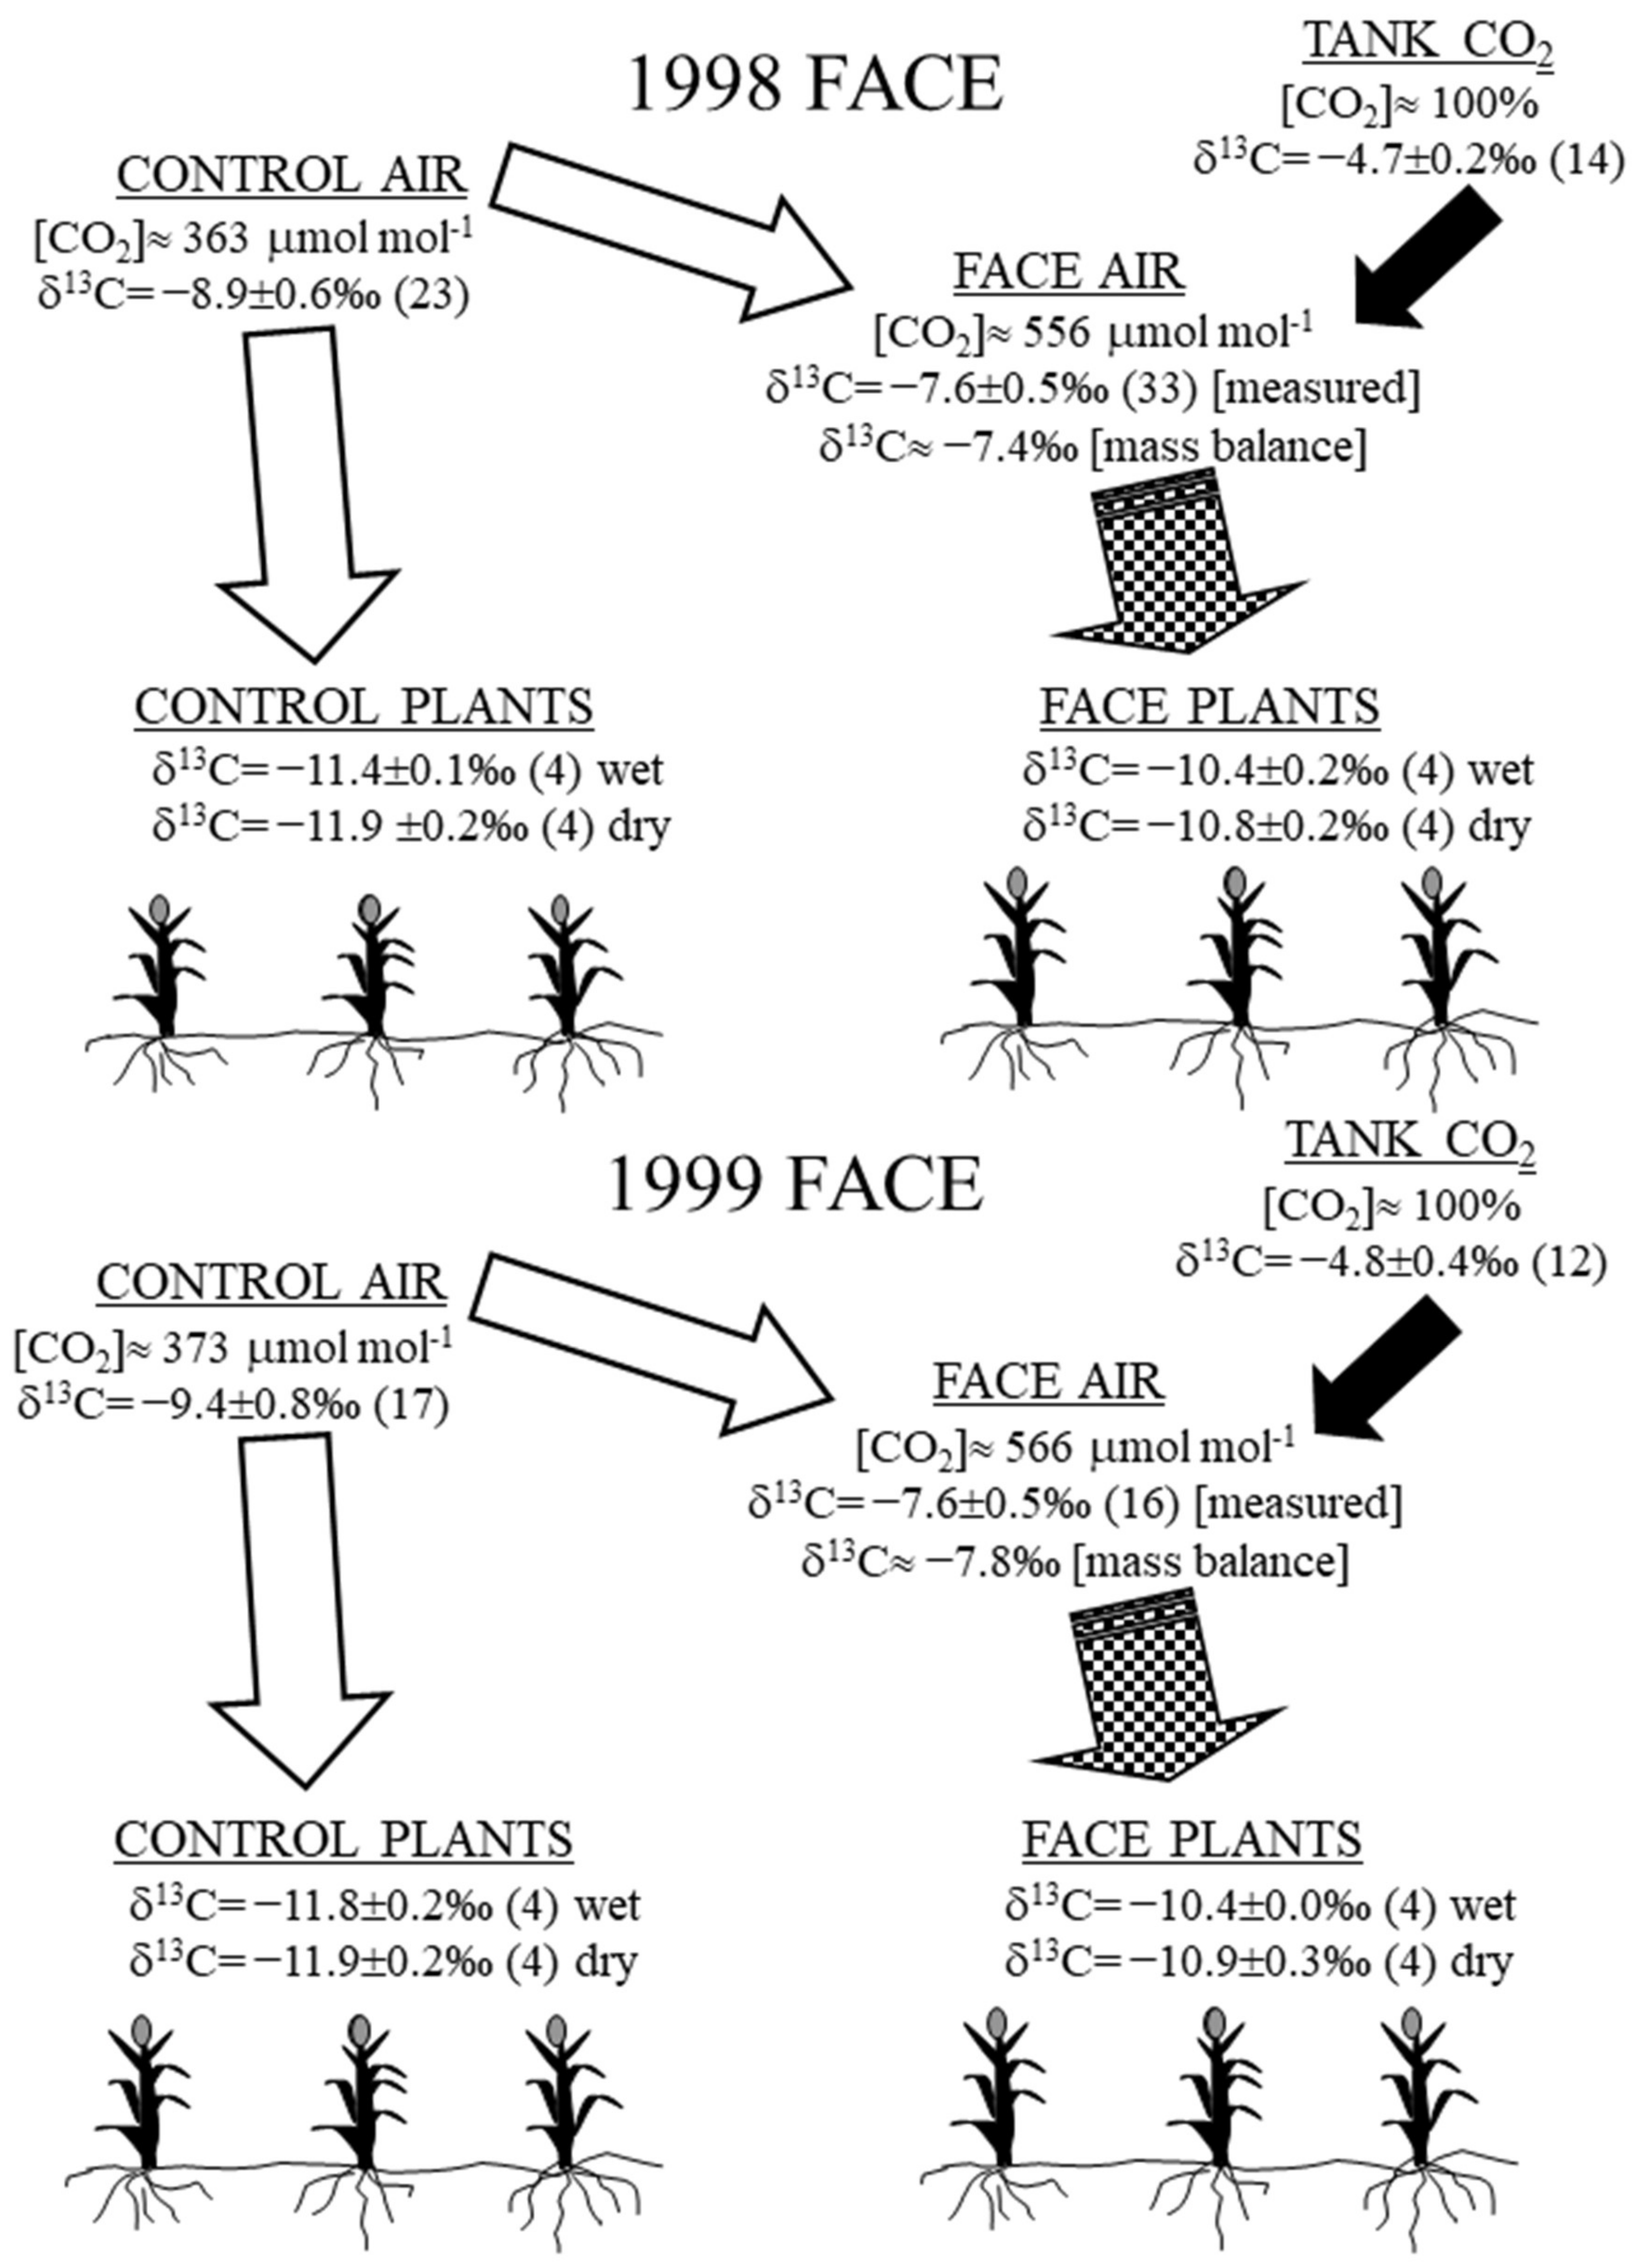
3.1. Air Isotopic Composition

The average δ13C of the commercial CO2 delivered via trucks to the field storage tank measured a consistent −4.7‰ and −4.8‰ within the 1998 and 1999 experimental seasons, respectively (“Tank” CO2 in Figure 1). This CO2 had a geological origin and was extracted from wells in southwestern Colorado. Its δ13C values were substantially 13C enriched by 4.2‰ to 4.6‰, relative to the background air that averaged −8.9‰ and −9.4‰ in the 1998 and 1999 experiments, respectively (Figure 1). However, because the two were mixed to produce the elevated FACE [CO2Air] concentrations, the air in the FACE plots (−7.6‰ average measured in both seasons, Figure 1) was only ca. 1.5‰ to 1.9‰ more 13C enriched than the background air to which the Control plot plants were exposed. The very similar values (Figure 1) of δ13C in our measured FACE air samples (−7.6‰ in both years) and the isotope mass balance values (−7.4‰ and −7.8‰ in 1998 and 1999, respectively) calculated from δ13C of air in Control and from the tank gas demonstrate the effectiveness of the FACE control/distribution system in achieving the reported [CO2Air] target in the FACE plots.

3.2. Plant Isotopic Composition

The average whole-tissue δ13C values of the sorghum plants under both CO2 treatments were typical of C4 plants, −10‰ to −12‰ (Figure 1). With the exception of the 1999 Control plants, under the same CO2 treatment (FACE or Control, Figure 1), the mean δ13C of plants sampled from the Wet treatment plots was significantly more 13C-enriched (t-test, p < 0.05) than those from the Dry treatment plots.
In all cases (Figure 1), under the same watering regime (Wet or Dry) the FACE plants were 13C enriched relative to the Control plants (t-test, p < 0.01). This result is not necessarily indicative of a treatment effect because the air above the FACE plots was 13C enriched from added commercial CO2 ca. 1.5‰ compared to the Control. Discrimination (∆) is a better means of determining isotopic differences between the Wet and Dry treatments because it removes the influence of different air δ13C:
∆ = (δ13Cair − δ13Cplant)/(1 + δ13Cplant/1000)
Comparing discrimination between CO2 treatments (Table 1), FACE and Control were significantly different (FACE higher) under both Wet and Dry treatments in 1999 and under the Wet treatment in 1998 (t-test, p < 0.05). This pattern of greater discrimination under elevated [CO2Air] suggests decreased water-use efficiency (WUE) under elevated [CO2Air]. Both the soil water content measurements of Conley et al. [27] and the energy balance measurements of Triggs et al. [26] showed an increase in WUE in our experiment. However, in the Dry treatment, WUE increased because of more biomass and yield produced for the same amount of water, whereas in the ample water (“Wet”) treatment, WUE increased due to savings of water for about the same amount of growth. Williams et al. [31] did not find a difference in discrimination between sorghum FACE and Control leaves collected ca. 80–100 days before maturity under the Wet treatment, and in fact, found evidence of shifting discrimination under all treatments in the first 80 days of the experiment largely related to changes in bundle sheath leakiness (“φ”) and ratio of internal to atmospheric CO2 concentrations (pi/pa). Other studies [45] have also identified potential problems inferring water-use efficiency from isotope discrimination in C4 plants, such as sorghum, under drought stress.

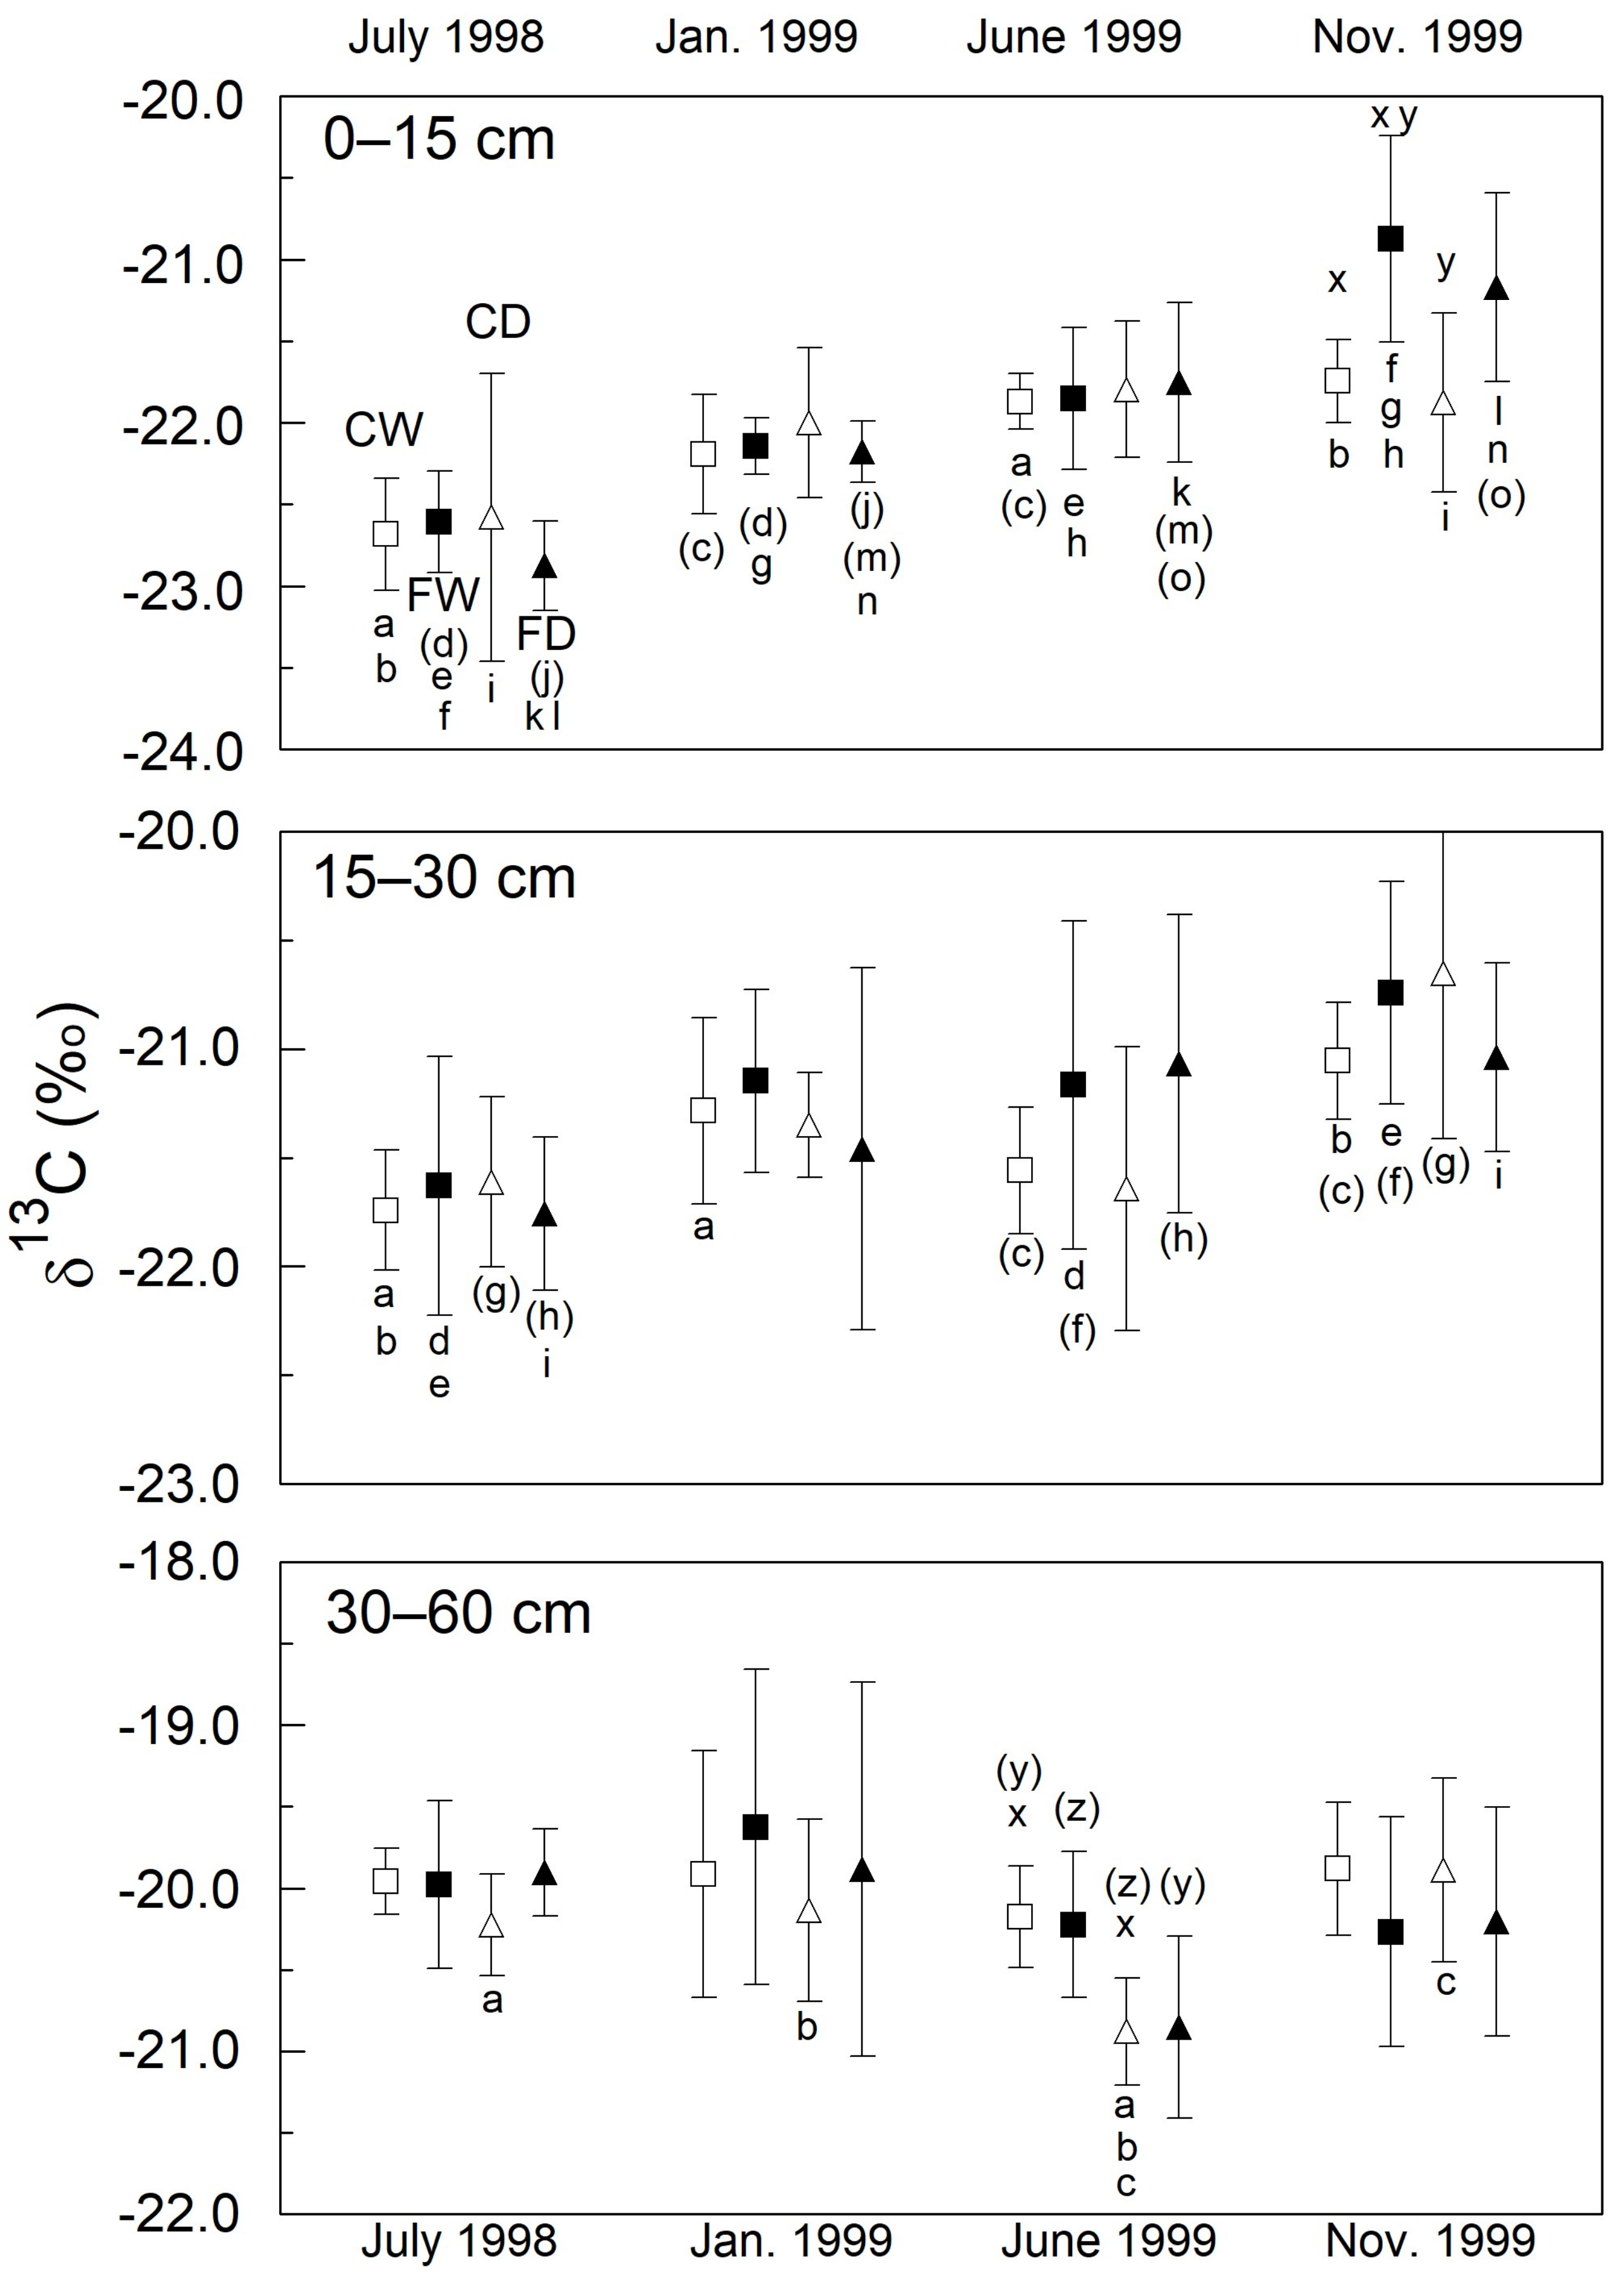
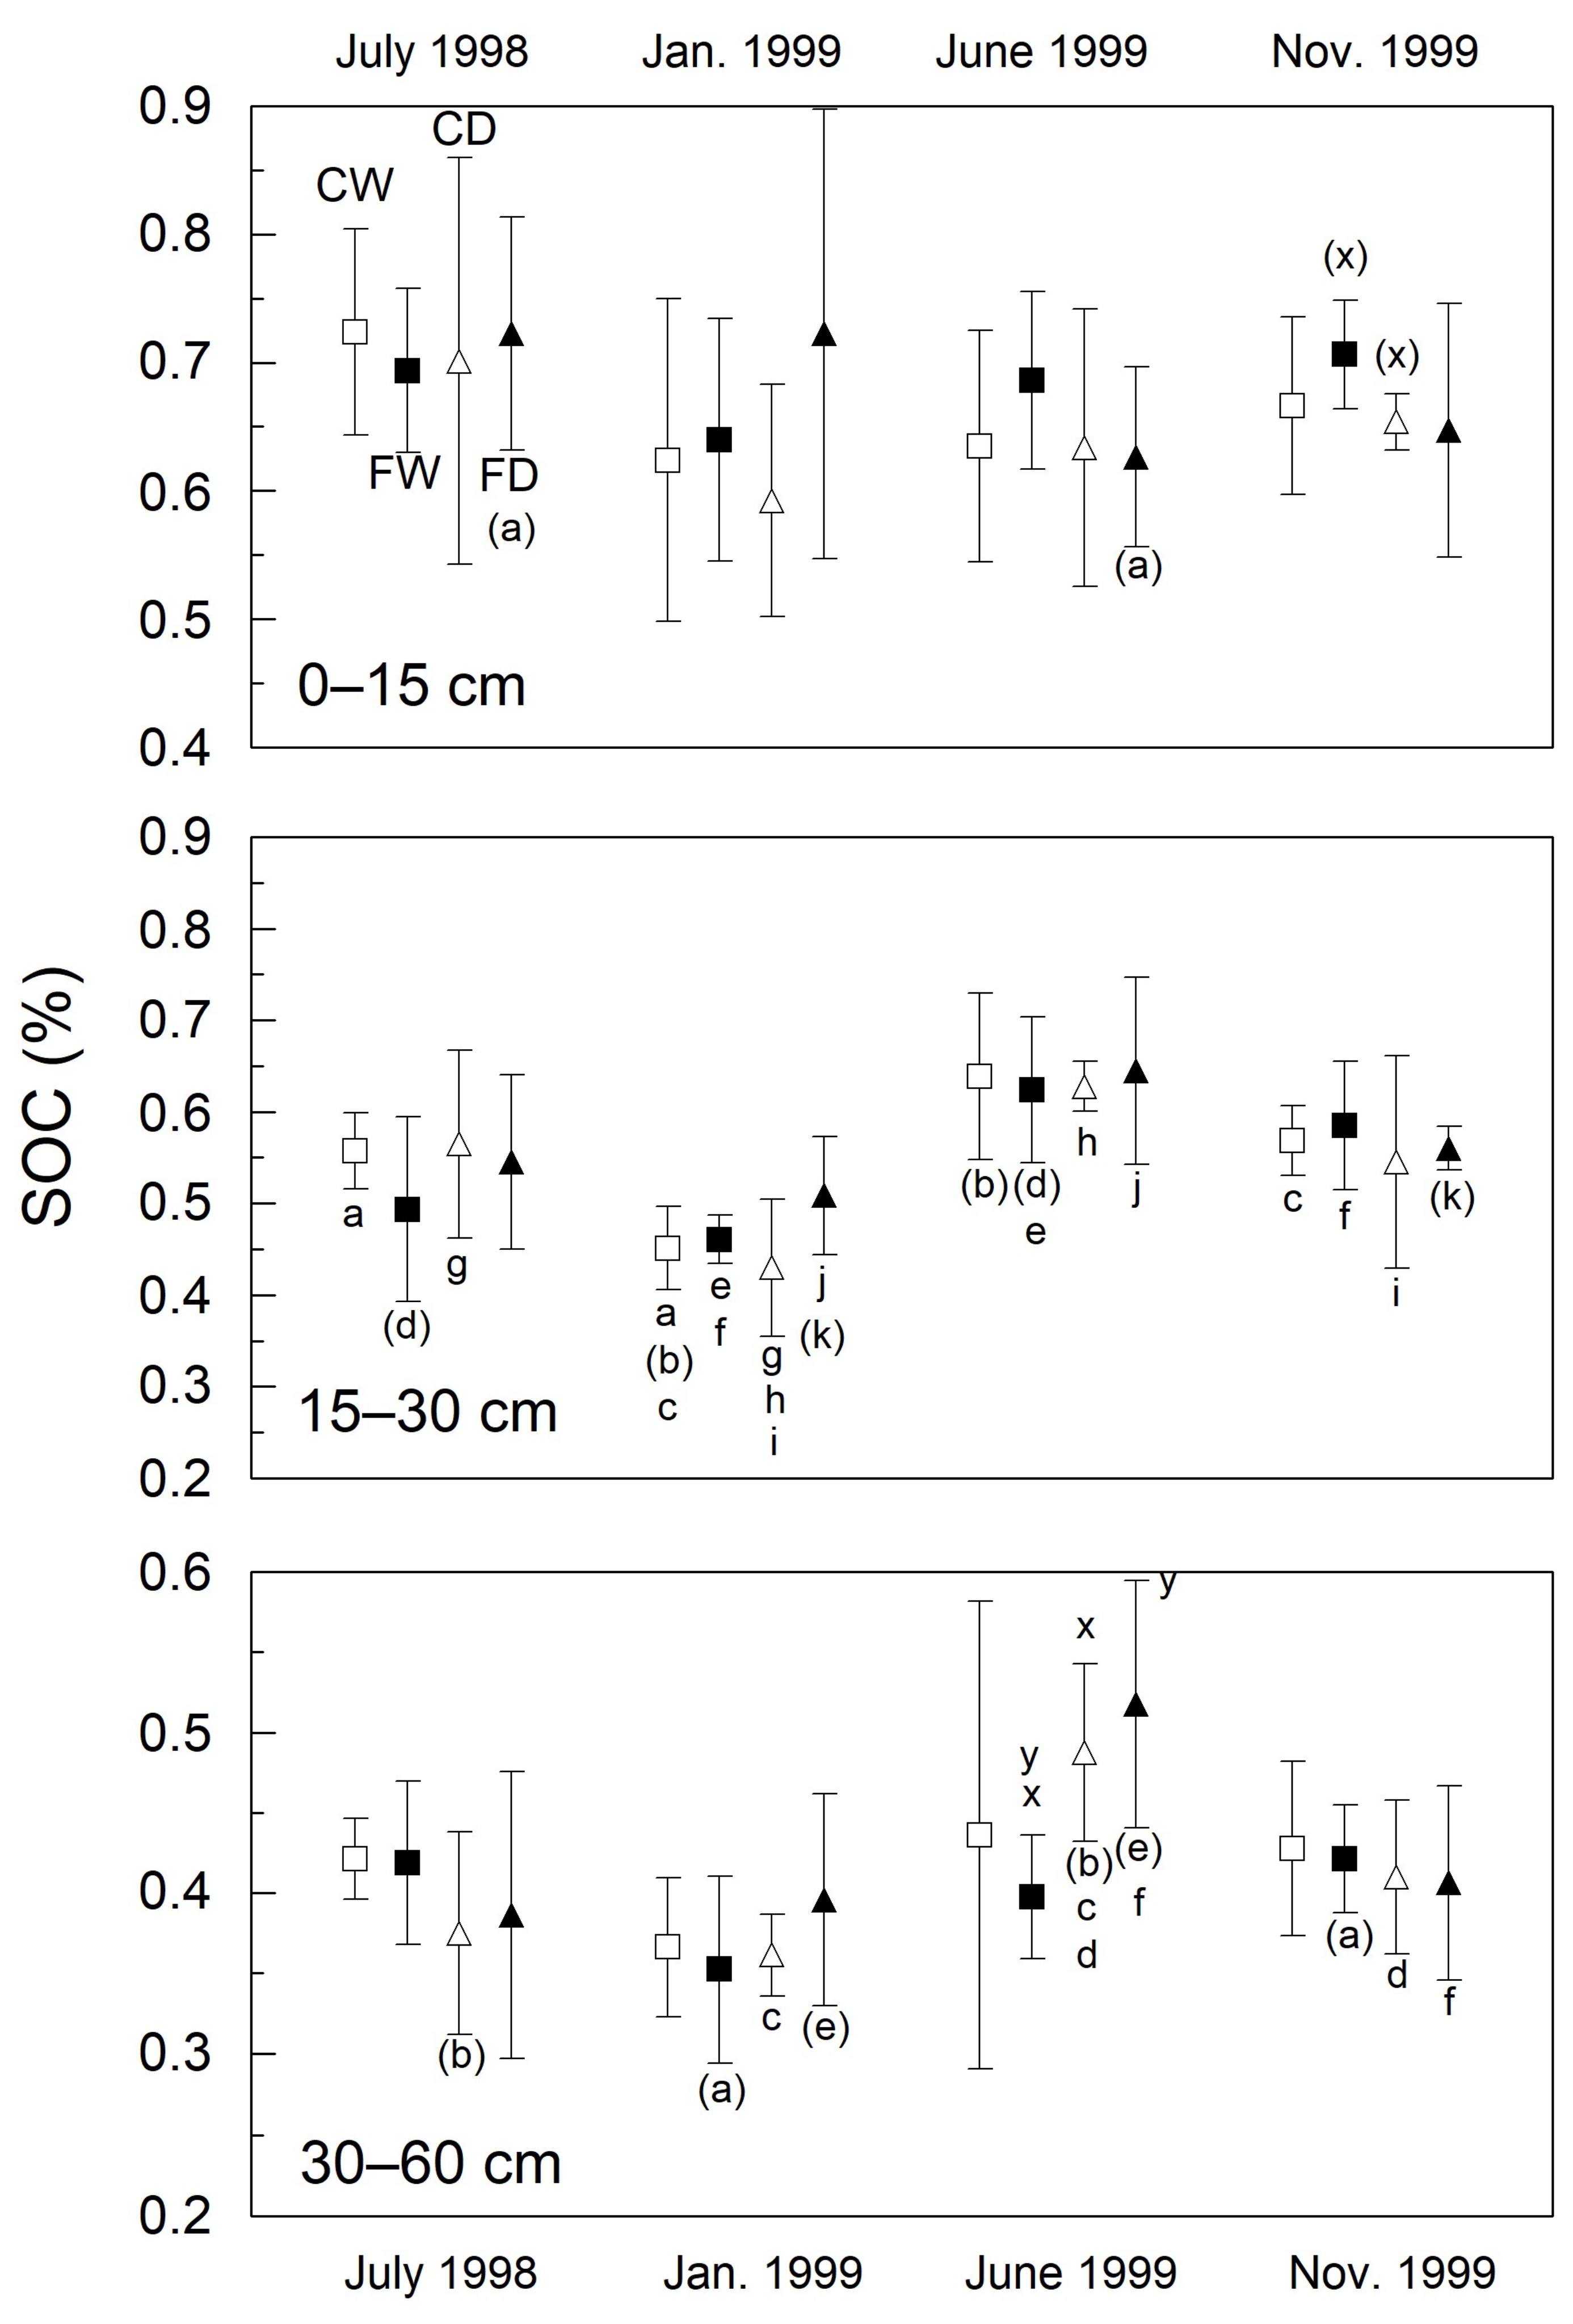
3.3. Soil Organic Carbon (%)

The δ13C values of the SOC for all treatments and 3 depth intervals are presented in Figure 2. The baseline isotopic values at the beginning of the FACE experiments (July 1998) are indicative of homogeneity within each depth interval across the field over the positions of all experimental plots, similar to that demonstrated following the field treatment (disking, plowing, and leveling) just prior to the 1995–1996 Maricopa FACE wheat experiments [46]. The isotopic composition in July 1998 shows a trend of progressive 13C enrichment of ca. 2‰ with depth in all plot positions from the surface layer down to 30–60 cm. This follows the isotopic pattern at a depth seen in prior FACE cotton and wheat experiments in the adjacent agricultural field to the south [8,9,10]. The pattern is consistent with the deep-layer composition that is more concordant with carbon from native vegetation comprising primarily plants utilizing CAM and C4 carbon fixation pathways, whereas surface layers were more 13C depleted because of the frequent cultivation of C3 plants (e.g., cotton and wheat) over several prior decades. The deep 30–60 cm soil layer showed greater δ13C stability over the 2-year experiment, compared to the upper two soil intervals that exhibited an increasing trend in δ13C. This shift is seen over all treatments, with evidence of the shift even after the first experimental season, suggesting rapid entry of 13C-enriched sorghum organic matter into the SOC pools represented in our pretreatment methods.
An isotopic difference among treatments in the 0–15 cm interval was not expressed until the final sampling date, when the FACE–Wet treatment was significantly 13C-enriched relative to the Control. Likewise, the FACE–Dry treatment tended to have enriched δ13C relative to its corresponding Control. This indicates the entry of more new carbon to SOC pools under FACE than Control [CO2Air] treatments, but it required two years of experiment before it was discernible in our SOC fractions. In the earlier FACE wheat experiments at Maricopa, an SOC isotopic signal began to emerge at the beginning of the second year of the experiments [9,10]. This isotope pattern also seems to be present in June 1999 for sorghum FACE SOC at 15–30 cm (prior to the second experimental season), with FACE δ13C tending to be 13C enriched relative to the Control, but it was not expressed any further by the end of the second experiment (November 1999). At 30–60 cm, anomalous significant δ13C differences existed in June 1999 between Wet and Dry treatments, with Dry treatments being more negative, but they did not persist to the end of the experiment in November 1999. Very limited precipitation associated with the dry 1998–1999 La Niña winter, combined with little water from the previous year’s experiment, may have resulted in the lower transformation of carbon via microbial activity in the deepest soils.
The SOC content data also confirm homogeneity at all depths over the location of the experimental plots at the beginning of the experiment in July 1998 (Figure 3). However, larger error bars at times in surface soils, especially in January 1999, allude to greater spatial variability near the surface than deeper in the soils. The SOC content at 30–60 cm was ca. 0.3% less than that of the surface sampling layers. Trends over the 2-year experiment are less apparent in the SOC (Figure 3) than in δ13C (Figure 2), although visual scrutiny hints at a trend of SOC decreasing in January 1999, increasing in June 1999 and perhaps decreasing in November 1999, particularly pronounced in the two deepest sampling layers as evidenced by more frequent significant differences among dates for each treatment. In part, initial cultivation may have generally promoted some SOC loss that was then regained to varying degrees at different depths as new plant matter was decomposed between the end of the first experimental season and the beginning of the second.
At 30–60 cm, the Dry treatments in June 1999 tended toward lower δ13C and higher SOC than the Wet treatments (Figure 3), perhaps signaling an anomalous flush of pre-experiment SOC input into these soils, but a mechanism is not apparent if this is not some random event. However, differences in SOC content between FACE and Control [CO2Air] treatments under Wet or Dry conditions were not manifested on any of the dates for any of the soil layers (Figure 3). This general lack of differences in gravimetrically determined SOC among CO2 treatments on any given date suggests no change in total SOC of any of the soils, or that these measurements are not precise and sensitive enough to identify small changes related to elevated [CO2Air] effects. The inability of gravimetric measurements to detect changes in SOC (Figure 3) while significant differences were detected in δ13C supports the value in the quantitative application of isotopic methods to more thoroughly explore SOC.

3.4. Isotopic Estimation of Carbon Input

The isotopic shifts between the beginning of the first experimental season and the end of the second may be used to estimate the fraction of new C present in SOC per the following basic isotope mixing model:
δ13CFACE or Control soil = finput × (δ13Cinput) + fsoil original × (δ13Csoil original)
where finput = fraction of new carbon in the current SOC pool, fsoil original = fraction of pre-experiment carbon in the current SOC pool. In order to solve for finput, finput + fsoil original ≅ 1 and δ13Cinput = δ13Cplant. The assumption that δ13Cinput = δ13Cplant is probably acceptable, although we have measured an aboveground “whole-plant” δ13C value that is representative of most of the field stubble that may be reworked into the soil, but we do not have δ13C values for root tissue, and exudates contributed during the experiment. Typically, however, the δ13C value of root biomass is not different than that of aboveground tissues in C4 plants [47].
The mixing model was used to calculate the fraction of “new” sorghum-derived SOC from the experiment, finput (Table 2). This model was applied to the 0–15 and 15–30 cm depths using the 1998–1999 mean δ13Cplant values of each treatment as δ13Cinput for which the November 1999 δ13C values were different from those in July 1998. For example, at 0–15 cm for Control–Wet, δ13Csoil original = −22.7‰ in July 1998, δ13C Control soil = −21.8‰ in November 1999, δ13Cplant = −11.6‰, and the fraction of new SOC present from the experiment was 8.4% (f = 0.084). The input fractions calculated for the other treatments were 14.2% for FACE–Wet, 6.5% for Control–Dry, and 14.2% for FACE–Dry treatments. These inputs of new SOC were thus quite large under both CO2 treatments, with the net effect of CO2 being 5.8% (14.2% − 8.4%; 2.9% per year of experiment) increased SOC fraction under Wet treatment and 7.7% (14.2% − 6.5%; 3.8% per year of experiment) increased SOC fraction under Dry treatment (Table 2). The larger apparent net increase under Dry at 0–15 cm conforms, in part, to the results of Conley et al. [27], Triggs et al. [26], and Wall et al. [48] who found that the increase in water-use efficiency of FACE C4 sorghum under elevated [CO2Air] was greater under Dry conditions. Likewise, the percentage increase in aboveground sorghum biomass associated with CO2 treatment was greater under Dry than Wet treatments (+15% and +3%, respectively) [24], which might also explain the new SOC inputs being greater under Dry conditions. However, the actual total biomass under Dry conditions was 35–40% lower than under Wet treatment [24], so a real difference between the 5.8% fraction new C for Wet and 7.7% for Dry seems less likely, even if increased root: shoot ratios are favored under increased drought conditions. Even so, a large fraction of new C appears to have been input into the FACE soils under both Wet and Dry conditions.
Without any loss of pre-experiment SOC, the addition of 14% new C to total SOC in FACE–Wet 0–15 cm soils, for example, would produce an increase in the mean SOC content from 0.7% in July 1998 to 0.8% in November 1999. This latter value is close to being detectible in the gravimetric measurement of SOC content because it is near the mean + 2 standard error (S.E.) (upper 95% confidence limit, i.e., an SOC content of 0.8%) of the actual November 1999 mean SOC content (0.7 ± 0.4%) (Figure 3). This suggests if 14% new SOC was added, at least some pre-experiment SOC must have been lost to prevent any increase in total SOC from being detected gravimetrically. However, the similar, if not indistinguishable, differences in the new-C fraction between FACE and Control in both the Dry treatment (7.7%) and Wet treatment (5.8%) would argue for similar losses of pre-experiment C and do not support a “priming” effect [49,50] of elevated [CO2Air], leading to more decomposition of older SOC, which we observed in our prior FACE wheat experiments [51].
Our results may be considered in the context of other observations. The crop planted on the field in the summer before this FACE experiment was also sorghum. It is therefore possible that some portion of the rise in SOC δ13C in the upper soil over the 2-year FACE experiment might have been contributed from the microbial decomposition of those crop residues and their subsequent incorporation into SOC pools. At the beginning of the sorghum FACE experiment, however, the SOC δ13C was ca. the same (−23‰) as observed in the Control plots throughout the previous FACE wheat experiment in an adjacent field [10]. The impact of inputs to SOC pools from the 13C-depleted C3 barley crop grown in the spring immediately prior to the experiment was not apparent in our results, but might have partially counteracted the effects of sorghum inputs and slowed the rise in δ13C of SOC. Nevertheless, inputs of pre-experiment sorghum and barley plant matter would have been identical in all treatments, so the final isotopic difference between FACE and Control SOC on November 1999 in the 0–15 cm soils should reflect the FACE treatment-based carbon inputs from the experiment. We also do not have any measurements of the soil microbial community under different treatments, and there is some evidence that altered soil microbial communities can influence carbon losses [52].
Other previous Maricopa FACE sorghum measurements also bear on SOC processes beyond the scope of this paper. The soil-respired CO2 flux from the soil surface was measured biweekly in both years of the sorghum FACE experiment in two of the Wet-treatment replicates [53]. Soil respiration in the FACE treatments averaged over the 2-year experiment was about 13% greater than the Controls. Soil CO2 concentrations at depth (in situ) were also measured biweekly in two replicate Wet treatments [54]. Under the Wet treatment, the concentration of soil CO2 at the 15 cm depth averaged over the 2-year experiment tended to be ca. 18% greater in FACE compared to Control treatments. The greater in situ soil CO2 concentration (“soil CO2”) and CO2 flux from the soil to air (“soil respired CO2”) under FACE treatments compared to Control treatments indicate more activity of some combination of root metabolism and SOC heterotrophic decomposition. Partitioning of soil CO2 and soil-respired CO2 using their δ13C composition suggests that the flux of CO2 out of the soils in FACE plots is composed of 90% CO2 from root respiration and decomposition of “new” SOC from the FACE crops and 10% pre-experimental SOC–CO2 derived from decomposition [53]. Enhancement of soil respiration under elevated [CO2Air] may thus be dominated by root respiration and the decomposition of new organic inputs, consistent with differences in aboveground biomass measured by Ottman et al. [24]. The soil CO2 results, however, cannot be related exactly to the SOC results, because the soil CO2 likely contains contributions from the decomposition of plant fragments that would have been removed in the processing of SOC for isotopic and SOC-content analyses in this study.
Cheng et al. [54] addressed the fate of different carbon pools in the soils of the sorghum FACE experiments using another method. They fractionated (partitioned) carbon in SOC pools using hot 6N HCl hydrolysis digestion, whereby carbon in the supernatant fraction is inferred to generally represent the more labile SOC carbon pool, and carbon in the residue fraction represents the more recalcitrant SOC carbon pool. At the end of the second year of the FACE experiment, 53% and 47% of SOC in the FACE treatment were found in the recalcitrant and labile carbon pools, respectively, whereas SOC in the Control treatment had a lower portion of carbon in the recalcitrant pool (46%) and more in the labile pool (54%). This suggests that elevated [CO2Air] may have favored the transformation of more carbon into longer-term SOC storage. Isotopic tracing, by Cheng et al. [54], was used to distinguish pre-experiment and new carbon in the system and suggested that new sorghum input contributed ca. 2–3 times more carbon to the FACE-treatment recalcitrant pool than to the Control recalcitrant pool in the upper soil. Furthermore, pre-experiment C in the recalcitrant pool was also higher under elevated [CO2Air] (FACE) than under ambient CO2 (Control) indicating that elevated [CO2Air] may have reduced the loss of pre-experiment C in the recalcitrant pool.

4. Conclusions

Carbon isotope tracing in the elevated [CO2Air] plots reveals that 14% new SOC was present in the total SOC of the 0–15 cm layer in both Wet and Dry treatments at the end of the Maricopa sorghum FACE experiment. At 7% y−1 of experiment, this sorghum datum is larger than the similarly estimated 3% y−1 of experiment for cotton under ample water/fertilizer conditions over 3 years of experimentation (1989–1991) [8], and 3% y−1 of experiment found over two 2 years of experiment (1993 and 1994) with wheat under ample water/fertilizer conditions [9,10]. Similarly, carbon isotope tracing in 0–15 cm soils of the Control plots show ca. 6–8% new SOC, on average, present in the SOC of the Wet and Dry plots. The sorghum Control input of 3–4% y−1 of experiment is similar in magnitude to the 2–3% y−1 of experiment determined using a pulsed isotopic tracer in the Control plots of the 1996–1997 wheat FACE experiments [10], the only other experiment for which such data were obtained for the Control treatments. Subtracting the isotopically estimated new carbon fraction of SOC in the sorghum Control plots from inputs to the FACE plots, there were net increases of ca. 6% and 8% in the fraction of new SOC present in the Wet and Dry treatments, respectively, under elevated [CO2Air] over the 2-year experiment.
Because the isotopically estimated new SOC fractions do not exceed the upper error limits of direct SOC measurements, it is likely that although large fractions of new sorghum-derived SOC were present at the end of the experiment, some pre-experimental SOC was also lost to maintain the near-constant SOC%. The large new-C fractions (14%) in SOC estimated isotopically from the C4 sorghum crop contributions (without adjustment for possible losses) exceeded those new-C fractions in SOC from previous FACE crop experiments with C3 plants that showed a greater positive response of biomass yield under elevated [CO2Air] (global summary of yields in FACE experiments including Maricopa in [4]). This might be a consequence of different proportioning of new SOC inputs and pre-experiment SOC losses among the experiments, or perhaps a greater role of rhizodeposition of carbon from the sorghum plant compared to the C3 plant.
The results from this study track the flow of new carbon into the analyzed soil carbon pool, but we cannot exclude that a similar amount of pre-experiment SOC might have been lost during the experiment. Despite such potential losses, the high fraction of new C present in the SOC of surface soils under both elevated and ambient [CO2Air] in Wet and Dry treatments indicates rapid cycling in sorghum SOC pools. Knowing these rates of input may help in devising means to increase the SOC or to reduce losses in agricultural systems to better promote carbon sequestration. The results of another study on the Maricopa FACE sorghum experiment soils indicate an increase in the recalcitrant C component of SOC under elevated [CO2Air], adding further potential for C sequestration even if the total SOC is not increasing in the sorghum soils.

Author Contributions

All authors were variously involved with planning, funding and execution of this experiment, field collections and observations, laboratory analysis, and data analysis and writing. All authors have read and agreed to the published version of the manuscript.

Funding

This research was supported by Interagency Agreement No. DE-AI03-97ER62461 between the Department of Energy, Office of Biological and Environmental Research, Environmental Sciences Division and the US Department of Agriculture (USDA), Agricultural Research Service (B.A. Kimball, PI); by Grant No. 97-35109-5065 from the USDA, Competitive Grants Program to the University of Arizona (S.W. Leavitt, M. Ottman, A.D. Matthias, T.L. Thompson, D.G. Williams and R.L. Roth, PIs); and by the USDA Agricultural Research Service. It is part of the DOE/NSF/NASA/USDA/EPA Joint Program on Terrestrial Ecology and Global Change (TECO III).

Institutional Review Board Statement

Not applicable.

Informed Consent Statement

Not applicable.

Data Availability Statement

Data are being made available at The University of Arizona ReData Research Data Repository, https://0-doi-org.brum.beds.ac.uk/10.25422/azu.data.19216809.

Acknowledgments

We thank Nicole Ricketts, Vada Maryol, William Peterson, Linah Ababneh, Steve Acquafreda, Deborah Hemming, Carrie O’Brien, Miko Peru, Wm. Ed Wright, Troy Farrington and Jim Burns for their assistance in the field and in the laboratory. We also acknowledge the assistance of Robert Roth and his staff at the Maricopa Agricultural Center, University of Arizona. This work contributes to the Global Change Terrestrial Ecosystem (GCTE) Core Research Program, which is part of the International Geosphere-Biosphere Program (IGBP). Portions of the FACE apparatus were furnished by Brookhaven National Laboratory, and we are grateful to Keith Lewin, John Nagy, and George Hendrey for assisting in installation and consulting about the use of each apparatus.

Conflicts of Interest

The authors declare no conflict of interest.

Ethics Statement

This paper has not been previously published nor is it currently under consideration for publication elsewhere.

References

  1. Arias, P.A.; Bellouin, N.; Coppola, E.; Jones, R.G.; Krinner, G.; Marotzke, J.; Naik, V.; Palmer, M.D.; Plattner, G.-K.; Rogelj, J.; et al. Technical summary. In Climate Change 2021: The Physical Science Basis. Contribution of Working Group I to the Sixth Assessment Report of the Intergovernmental Panel on Climate Change; Masson-Delmotte, V., Zhai, P., Pirani, A., Connors, S.L., Péan, C., Berger, S., Caud, N., Chen, Y., Goldfarb, L., Gomis, M.I., et al., Eds.; Cambridge University Press: Cambridge, UK, 2021; Available online: https://www.ipcc.ch/report/ar6/wg1/downloads/report/IPCC_AR6_WGI_TS.pdf (accessed on 23 January 2022).
  2. Ainsworth, E.A.; Long, S.P. What have we learned from 15 years of free-air CO2 enrichment (FACE)? A meta-analytic review of the responses of photosynthesis, canopy properties and plant production to rising CO2. New Phytol. 2004, 165, 351–372. [Google Scholar] [CrossRef] [PubMed]
  3. Ainsworth, E.A.; Long, S.P. 30 years of free-air carbon dioxide enrichment (FACE): What have we learned about future crop productivity and its potential for adaptation? Glob. Chang. Biol. 2021, 27, 27–49. [Google Scholar] [CrossRef] [PubMed]
  4. Kimball, B.; Kobayashi, K.; Bindi, M. Responses of agricultural crops to free-air CO2 enrichment. Adv. Agron. 2002, 77, 293–368. [Google Scholar]
  5. Kimball, B. Crop responses to elevated CO2 and interactions with H2O, N, and temperature. Curr. Opin. Plant Biol. 2016, 31, 36–43. [Google Scholar] [CrossRef] [PubMed]
  6. U.S. DOE. U.S. Department of Energy Free-Air CO2 Enrichment Experiments: FACE Results, Lessons, and Legacy; DOE/SC–0202; U.S. Department of Energy Office of Science: Washington, DC, USA, 2020. [Google Scholar] [CrossRef]
  7. Shukla, P.R.; Skea, J.; Calvo Buendia, E.; Masson-Delmotte, V.; Pörtner, H.-O.; Roberts, D.C.; Zhai, P.; Slade, R.; Connors, S.; van Diemen, R.; et al. Climate Change and Land: An IPCC Special Report on Climate Change, Desertification, Land Degradation, Sustainable Land Management, Food security, and Greenhouse Gas Fluxes in Terrestrial Ecosystems; The Intergovernmental Panel on Climate Change (IPCC): Geneva, Switzerland, 2019; Available online: https://www.ipcc.ch/site/assets/uploads/2019/11/SRCCL-Full-Report-Compiled-191128.pdf (accessed on 26 December 2021).
  8. Leavitt, S.W.; Paul, E.A.; Kimball, B.A.; Hendrey, G.R.; Mauney, J.R.; Rauschkolb, R.; Rogers, H.H., Jr.; Lewin, K.F.; Nagy, J.; Pinter, P.J., Jr.; et al. Carbon isotope dynamics of CO2-enriched FACE cotton and soils. Agric. For. Meteorol. 1994, 70, 87–101. [Google Scholar] [CrossRef]
  9. Leavitt, S.W.; Paul, E.A.; Galadima, A.; Nakayama, F.S.; Danzer, S.R.; Johnson, H.; Kimball, B.A. Carbon isotopes and carbon turnover in cotton and wheat FACE experiments. Plant Soil 1996, 187, 147–155. [Google Scholar] [CrossRef]
  10. Leavitt, S.W.; Pendall, E.; Paul, E.A.; Brooks, T.; Kimball, B.A.; Pinter, P.J., Jr.; Johnson, H.B.; Matthias, A.; Wall, G.W.; LaMorte, R.L. Stable-carbon isotopes and soil organic carbon in wheat under CO2 enrichment. New Phytol. 2001, 150, 305–314. [Google Scholar] [CrossRef]
  11. Nitschelm, J.J.; Luscher, A.; Hartwig, U.A.; Van Kessel, C. Using stable isotopes to determine soil carbon input differences under ambient and elevated atmospheric CO2 conditions. Glob. Chang. Biol. 1997, 3, 411–416. [Google Scholar] [CrossRef]
  12. Van Kessel, C.; Horwath, W.R.; Hartwig, U.; Harris, D.; Luscher, A. Net soil carbon input under ambient and elevated CO2 concentrations: Isotopic evidence after 4 years. Glob. Chang. Biol. 2000, 6, 435–444. [Google Scholar] [CrossRef]
  13. Schlesinger, W.H.; Lichter, J. Limited carbon storage in soil and litter of experimental forest plots under increased atmospheric CO2. Nature 2001, 411, 466–469. [Google Scholar] [CrossRef]
  14. Hungate, B.A.; Holland, E.A.; Jackson, R.B.; Chapin, F.S., III; Mooney, H.A.; Field, C.B. The fate of carbon under carbon dioxide enrichment. Nature 1997, 388, 576–579. [Google Scholar] [CrossRef]
  15. Torbert, H.A.; Rogers, H.H.; Prior, S.A.; Schlesinger, W.H.; Runion, G.B. Effects of elevated atmospheric CO2 in agro-ecosystems on soil carbon storage. Glob. Chang. Biol. 1997, 3, 513–521. [Google Scholar] [CrossRef] [Green Version]
  16. Ineson, P.; Cortufo, M.F.; Bol, R.; Harkness, D.D.; Blum, H. Quantification of soil carbon inputs under elevated CO2: C3 plants in a C4 soil. Plant Soil 1996, 187, 345–350. [Google Scholar] [CrossRef]
  17. Balesdent, J.; Balabane, M. Maize root-derived soil organic carbon estimated by natural 13C abundance. Soil Biol. Biochem. 1992, 24, 97–101. [Google Scholar] [CrossRef]
  18. Balesdent, J.; Mariotti, A.; Guillet, B. Natural 13C abundance as a tracer for studies of soil organic matter. Soil Biol. Biochem. 1987, 19, 25–30. [Google Scholar] [CrossRef]
  19. Balesdent, J.; Wagner, G.H.; Mariotti, A. Soil organic matter turnover in long-term field experiments as revealed by carbon-13 natural abundance. Soil Sci. Soc. Am. J. 1988, 52, 118–124. [Google Scholar] [CrossRef]
  20. Tissue, D.T.; Griffin, K.L.; Thomas, R.B.; Strain, B. Effects of low and elevated CO2 on C3 and C4 annuals II: Photosynthesis and leaf biochemistry. Oecologia 1995, 101, 21–28. [Google Scholar] [CrossRef]
  21. Poorter, H.; Roument, C.; Campbell, B.D. Interspecific variation in the growth response of plants to elevated CO2: A search for functional types. In Carbon Dioxide, Populations, and Communities; Körner, C., Bazzaz, F.A., Eds.; Academic Press: San Diego, CA, USA, 1996; pp. 375–411. [Google Scholar]
  22. Owensby, C.E.; Coyne, P.I.; Ham, J.M.; Auen, L.A.; Knapp, A.K. Biomass production in a tallgrass prairie system exposed to ambient and elevated CO2. Ecol. Appl. 1993, 3, 644–653. [Google Scholar] [CrossRef] [Green Version]
  23. Hamerlynck, E.P.; McAllister, C.A.; Knapp, A.K.; Ham, J.M.; Owensby, C.E. Photosynthetic gas exchange and water relation responses of three tallgrass prairie species to elevated carbon dioxide and moderate drought. Int. J. Plant Sci. 1997, 158, 608–616. [Google Scholar] [CrossRef]
  24. Ottman, M.J.; Kimball, B.A.; Pinter, P.J., Jr.; Wall, G.W.; Vanderlip, R.L.; Leavitt, S.W.; LaMorte, R.L.; Matthias, A.D.; Brooks, T.J. Elevated increases sorghum biomass under drought conditions. New Phytol. 2001, 150, 261–273. [Google Scholar] [CrossRef]
  25. Wall, G.W.; Kimball, B. Biological databases derived from Free-air carbon dioxide enrichment experiments. In Design and Execution of Experiments on CO2 Enrichment; Schulze, E.-D., Mooney, H.A., Eds.; Ecosystem Research Report 6; Commission of the European Communities: Brussels, Belgium, 1993; pp. 329–351. [Google Scholar]
  26. Triggs, J.M.; Kimball, B.A.; Pinter, P.J., Jr.; Wall, G.W.; Conley, M.M.; Brooks, T.J.; LaMorte, R.L.; Adam, N.R.; Ottman, M.J.; Matthias, A.D.; et al. Free-air carbon dioxide enrichment effects on energy balance and evapotranspiration of sorghum. Agric. For. Meteorol. 2004, 124, 63–79. [Google Scholar] [CrossRef]
  27. Conley, M.M.; Kimball, B.A.; Brooks, T.J.; Pinter, P.J.; Hunsaker, D.J.; Wall, G.W.; Adam, N.R.; LaMorte, R.L.; Matthias, A.D.; Thompson, T.L.; et al. CO2 enrichment increases water-use efficiency in sorghum. New Phytol. 2001, 151, 407–412. [Google Scholar] [CrossRef] [Green Version]
  28. Hussain, M.Z.; van Loocke, A.; Siebers, M.H.; Ruiz-Vera, U.M.; Markelz, R.J.C.; Leakey, A.D.B.; Ort, D.R.; Bernacchi, C.J. Future carbon dioxide concentration decreases canopy evapotranspiration and soil water depletion by field-grown maize. Glob. Chang. Biol. 2013, 19, 1572–1584. [Google Scholar] [CrossRef] [PubMed]
  29. Manderscheid, R.; Erbs, M.; Weigel, H.-J. Interactive effects of free-air CO2 enrichment and drought stress on maize growth. Eur. J. Agron. 2014, 52, 11–21. [Google Scholar] [CrossRef]
  30. Cousins, A.B.; Adam, N.R.; Wall, G.W.; Kimball, B.A.; Pinter, P.J., Jr.; Leavitt, S.W.; LaMorte, R.L.; Matthias, A.D.; Ottman, M.J.; Thompson, T.L.; et al. Reduced photorespiration and increased energy-use efficiency in young CO2-enriched sorghum leaves. New Phytol. 2001, 150, 275–284. [Google Scholar] [CrossRef]
  31. Williams, D.G.; Gempko, V.; Fravolini, A.; Leavitt, S.W.; Wall, G.W.; Kimball, B.A.; Pinter, P.J., Jr.; LaMorte, R.L.; Ottman, M. Carbon isotope discrimination by Sorghum bicolor under CO2 enrichment and drought. New Phytol. 2001, 150, 285–293. [Google Scholar] [CrossRef] [Green Version]
  32. Kimball, B.A.; Ottman, M.J.; Pinter, P.J., Jr.; Wall, G.W.; Leavitt, S.W.; Cheng, L.; Conley, M.M.; LaMorte, R.L.; Triggs, J.M.; Gleadow, R. Data from the Arizona FACE (Free-Air CO2 Enrichment) experiments on sorghum at ample and limiting levels of water. Open Data J. Agric. Res. 2021, 7, 1–10. [Google Scholar]
  33. Post, D.F.; Mack, C.; Camp, P.D.; Suliman, A.S. Mapping and characterization of the soils on the University of Arizona Maricopa Agricultural Center. Hydrol. Water Resour. Ariz. 1988, 18, 49–60. [Google Scholar]
  34. Kimball, B.A.; LaMorte, R.L.; Peresta, G.J.; Mauney, J.R.; Lewin, K.F.; Hendrey, G.R. Appendices: Weather, soils, cultural practices, and cotton growth data from the 1989 FACE experiment in IBSNAT format. CRC Crit. Rev. Plant Sci. 1992, 11, 271–308. [Google Scholar] [CrossRef]
  35. Nagy, J.; Lewin, K.F.; Hendrey, G.R.; Hassinger, E.; LaMorte, R. FACE facility CO2 concentration control and CO2 use in 1990 and 1991. Agric. For. Meteorol. 1994, 70, 31–48. [Google Scholar] [CrossRef]
  36. Pinter, P.J., Jr.; Kimball, B.A.; Wall, G.W.; LaMorte, R.L.; Hunsaker, D.J.; Adamsen, F.J.; Frumau, K.F.A.; Vugts, H.F.; Hendrey, G.R.; Lewin, K.F.; et al. Free-air CO2 enrichment (FACE): Blower effects on wheat canopy microclimate and plant development. Agric. For. Meteorol. 2000, 103, 319–332. [Google Scholar] [CrossRef]
  37. Hendrey, G.R. (Ed.) Free-Air Carbon Dioxide Enrichment for Plant Research in the Field; C.K. Smoley: Boca Raton, FL, USA, 1993; p. 308. [Google Scholar]
  38. Hendrey, G.; Lewin, K.; Nagy, J. Control of carbon dioxide in unconfined field plots. In Design and Execution of Experiments on CO2 Enrichment; Schulze, E.-D., Mooney, H.A., Eds.; Commission of the European Communities: Brussels, Belgium, 1993; pp. 309–327. [Google Scholar]
  39. Dugas, W.A.; Pinter, P.J., Jr. (Eds.) Free-Air Carbon Dioxide Enrichment (Face) Cotton Project: A New Field Approach to Assess the Biological Consequences of Global Change. Agric. For. Meteorol. 1994, 70, 1–342. [Google Scholar] [CrossRef]
  40. Fox, F.A., Jr.; Scherer, T.; Slack, D.C.; Clark, L.J. AriZona Irrigation SCHEDuling User’s Manual; Cooperative Extension, Agricultural and Biosystems Engineering, University of Arizona: Tucson, AZ, USA, 1992; p. 36. [Google Scholar]
  41. Cambardella, C.A.; Elliott, E.T. Particulate soil organic-matter changes across a grassland cultivation sequence. Soil Sci. Soc. Am. J. 1992, 56, 777–783. [Google Scholar] [CrossRef]
  42. Boutton, T.W. Stable carbon isotope ratios of natural materials: I. Sample preparation and mass spectrometric analysis. In Carbon Isotope Techniques; Coleman, D.C., Fry, B., Eds.; Academic Press: San Diego, CA, USA, 1991; pp. 173–175. [Google Scholar]
  43. Craig, H. Isotopic standards for carbon and oxygen and correction factors for mass-spectrometric analysis of CO2. Geochim. Cosmochim. Acta 1957, 12, 133–149. [Google Scholar] [CrossRef]
  44. Coplen, T.B. Discontinuance of SMOW and PDB. Nature 1995, 375, 285. [Google Scholar] [CrossRef]
  45. Henderson, S.; von Caemmerer, S.; Farquhar, G.D.; Wade, L.; Hammer, G. Correlation between carbon isotope discrimination and transpiration efficiency in lines of the C4 species Sorghum bicolor in the glasshouse and the field. Aust. J. Plant Physiol. 1998, 25, 111–123. [Google Scholar] [CrossRef]
  46. Leavitt, S.W.; Paul, E.A.; Pendall, E.; Pinter, P.J., Jr.; Kimball, B. Field variability of carbon isotopes in soil organic carbon. Nucl. Instrum. Methods Phys. Res. B 1997, 123, 451–454. [Google Scholar] [CrossRef]
  47. Cernusak, L.A.; Tcherkez, G.; Keitel, C.; Cornwell, W.K.; Santiago, L.S.; Knohl, A.; Barbour, M.M.; Williams, D.G.; Reich, P.B.; Ellsworth, D.S.; et al. Why are non-photosynthetic tissues generally 13C enriched compared with leaves in C3 plants? Review and synthesis of current hypotheses. Funct. Plant Biol. 2009, 36, 199–213. [Google Scholar] [CrossRef]
  48. Wall, G.W.; Brooks, T.J.; Adam, N.R.; Cousins, A.B.; Kimball, B.A.; Pinter, P.J., Jr.; LaMorte, R.L.; Triggs, J.; Ottman, M.J.; Leavitt, S.W.; et al. Elevated atmospheric CO2 improved sorghum plant water status by ameliorating the adverse effects of drought. New Phytol. 2001, 152, 231–248. [Google Scholar] [CrossRef]
  49. Jenkinson, D.S.; Fox, R.H.; Rayner, J.H. Interactions between fertilizer nitrogen and soil nitrogen—The so-called ‘priming’ effect. Eur. J. Soil Sci. 1985, 36, 425–444. [Google Scholar] [CrossRef]
  50. Kuzyakov, Y.; Friedel, J.K.; Stahr, K. Review of mechanisms and quantification of priming effects. Soil Biol. Biochem. 2000, 32, 1485–1498. [Google Scholar] [CrossRef]
  51. Pendall, E.; Leavitt, S.W.; Brooks, T.; Kimball, B.A.; Pinter, P.J., Jr.; Wall, G.W.; LaMorte, R.L.; Wechsung, G.; Wechsung, F.; Adamsen, F.; et al. Elevated CO2 stimulates soil respiration in a FACE wheat field. Basic Appl. Ecol. 2001, 2, 193–201. [Google Scholar] [CrossRef]
  52. Carney, K.M.; Hungate, B.A.; Drake, B.G.; Megonigal, J.P. Altered soil microbial community at elevated CO2 leads to loss of soil carbon. Proc. Natl. Acad. Sci. USA 2007, 104, 4990–4995. [Google Scholar] [CrossRef] [PubMed] [Green Version]
  53. Cheng, L. Elevated Atmospheric CO2 Impacts Carbon Dynamics in a C4-Sorghum-Soil Agroecosystem—An Application of Stable Carbon Isotopes (δ13C) in Tracing the Fate of Carbon in the Atmosphere-Plant-Soil Ecosystem. Ph.D. Thesis, University of Arizona, Tucson, AZ, USA, 2005. [Google Scholar]
  54. Cheng, L.; Leavitt, S.W.; Kimball, B.A.; Pinter, P.J., Jr.; Ottman, M.J.; Matthias, A.; Wall, G.W.; Brooks, T.; Williams, D.G.; Thompson, T.L. Dynamics of labile and recalcitrant soil carbon pools in a sorghum free-air CO2 enrichment (FACE) agroecosystem. Soil Biol. Biochem. 2007, 39, 2250–2263. [Google Scholar] [CrossRef]
Figure 1. Stable-carbon isotopic composition of commercial tank CO2, air and plants in the 1998 and 1999 sorghum FACE experiments. Number of samples (for tank CO2 and air) or number of replicates (for plants) are in parenthesis. Errors given are ±1 standard deviation.
Land 11 00309 g001
Figure 2. δ13C of the soil organic carbon (SOC) of soils in 3 depth intervals for each of the four sampling dates. Error bars are ±1 standard deviation (equivalent to ±2 standard errors; n = 4 replicates). Control–Wet (open square), FACE–Wet (solid square), Control–Dry (open triangle), FACE–Dry (solid triangle). Within any depth interval, the same letter appearing below error bars of a treatment on two dates indicates a difference (p < 0.05, repeated measures ANOVA; p < 0.10 if letters are in parenthesis). Within a depth interval, the same letter appearing above error bars for any date indicates a difference between treatments (p < 0.05, t-test; p < 0.10 if letters are in parenthesis).
Land 11 00309 g002
Figure 3. Soil organic carbon (SOC) content of soils in 3 depth intervals for each of the four sampling dates. Error bars are ±1 standard deviation (equivalent to ±2 standard errors; n = 4 replicates). Control–Wet (open square), FACE–Wet (solid square), Control–Dry (open triangle), FACE–Dry (solid triangle). Within any depth interval, the same letter appearing below error bars of a treatment on two dates indicates a difference (p < 0.05, repeated measures ANOVA; p < 0.10 if letters are in parenthesis). Within a depth interval, the same letter appearing above error bars for any date indicates a difference between treatments (p < 0.05, t-test; p < 0.10 if letters are in parenthesis).
Land 11 00309 g003
Table 1. Carbon isotope discrimination (∆) of FACE and corresponding Control plants and significance of differences.
1998FACE–WetControl–WetFACE–DryControl–Dry
mean2.82.53.23.0
std dev0.20.00.20.2
t-signifp < 0.05ns
1999FACE–WetControl–WetFACE–DryControl–Dry
mean2.82.43.62.5
std dev0.00.20.30.1
t-signifp < 0.01p < 0.01
Table 2. Isotopic values used in mixing model to calculate inputs of “new” SOC (finput), net FACE effect on “new” SOC, and estimated loss of pre-experiment SOC necessary to hamper detection of an increase in measured SOC content in spite of the new additions (see text for explanation). Errors given are ±1 standard deviation. We estimate from error propagation analysis that the error on finput is ca. 25% of the given values.
0–15 cm Depth15–30 cm Depth
DryWetDryWet
ControlFACEControlFACEControlFACEControlFACE
δ13Cplant−11.9 ± 0.2‰−10.8 ± 0.3−11.6 ± 0.3−10.4 ± 0.1−11.9 ± 0.2−10.8 ± 0.3−11.6 ± 0.3−10.4 ± 0.1
δ13Csoil original (July 1998)−22.6 ± 0.9‰−22.9 ± 0.3−22.7 ± 0.4−22.6 ± 0.3−21.6 ± 0.4−21.8 ± 0.4−21.7 ± 0.3−21.6 ± 0.6
δ13Csoil (November 1999)−21.9 ± 0.6‰−21.2 ± 0.6−21.8 ± 0.2−20.9 ± 0.6−20.6 ± 0.8−21.0 ± 0.4−21.0 ± 0.3−20.7 ± 0.5
finput new-C fraction6.5%14.28.414.29.96.66.87.9
Net CO2 effect (FACE-Control)7.7%5.8−3.31.1
Publisher’s Note: MDPI stays neutral with regard to jurisdictional claims in published maps and institutional affiliations.

