1. Introduction
Land use describes activities that take place on the land and represent the current use of property, while land cover describes the natural and anthropogenic activities that can be observed on the land [
1,
2]. Thus, land use goes deeper than cover by describing the actual use of the land. Remotely sensed data have been used to identify and derive land use through observations of land cover [
3]. Changes in Land Use and Land Cover (LULC) may affect ecosystem services that sustain livelihoods and services such as food production, climate regulation, biodiversity maintenance and erosion control [
4,
5,
6]. The drivers of LULC change are multifaceted and emanate from the interface between human-environment systems, socioeconomic, policy and institutional factors [
7,
8]. Considerable efforts have been undertaken to understand spatial drivers including distance to roads, distance to settlements, elevation, rainfall, population density and gross domestic product of LULC change [
9,
10,
11,
12,
13]. These studies have been helpful in planning effective use of land and sustainable development, and they provide valuable insights to improve our understanding of the drivers of LULC change. However, knowledge regarding spatially explicit interactive effects of LULC change in the open savanna woodlands of Namibia including the Zambezi Region is limited. In addition, since the drivers of LULC change are dynamic in space and time, there is a need to further study these drivers in order to aid decision-making.
It has been widely argued that increased anthropogenic activities have altered LULC in the Zambezi Region before the region became part of the Kavango-Zambezi Transfrontier Conservation Area. These arguments are, however, little supported by quantitative data. Changes in LULC in the Zambezi Region continuously influence the extent as well as the nature of forest ecosystems, thus influencing the services provided by these. In effect therefore, the spatial driving factors are far from being thoroughly understood.
In this study, distances to the roads and settlements, population density and fire return periods were investigated as the variables that explain the spatial and temporal extent of LULC change in the study area. The distances to roads and settlements are correlated with improved access to land thus facilitating the utilization of the forest resource. On the other hand, population density has an impact on the clearance rate of forests for agriculture and the use of natural forests areas as the main sources of wood for fuel and construction [
14]. Fire return period defined in this study as the average number of times an area was affected by fire. It was expected that these drivers might change over time, because of changes in socioeconomic and political conditions. Although these factors have previously been identified as determinants of LULC change, it is unclear if they are equally applicable in the open savanna woodlands of Namibia including the Zambezi Region to support regional LULC planning policy and practice.
It was within these contexts that we set out to (i) to quantify the impact of the spatial variables using current spatial modelling techniques; (ii) to compare the spatio-temporal variation of the effects of spatial drivers on LULC; and (iii) to prepare LULC conversion maps. Specifically, we attempted to examine the influential spatial drivers of LULC change of various LULC types in the protected and communal areas of the Zambezi Region. By understanding these, we hoped to provide new insights for guiding the sustainable land development of areas under similar socio-economic and environmental conditions.
2. Materials and Methods
2.1. Study Area
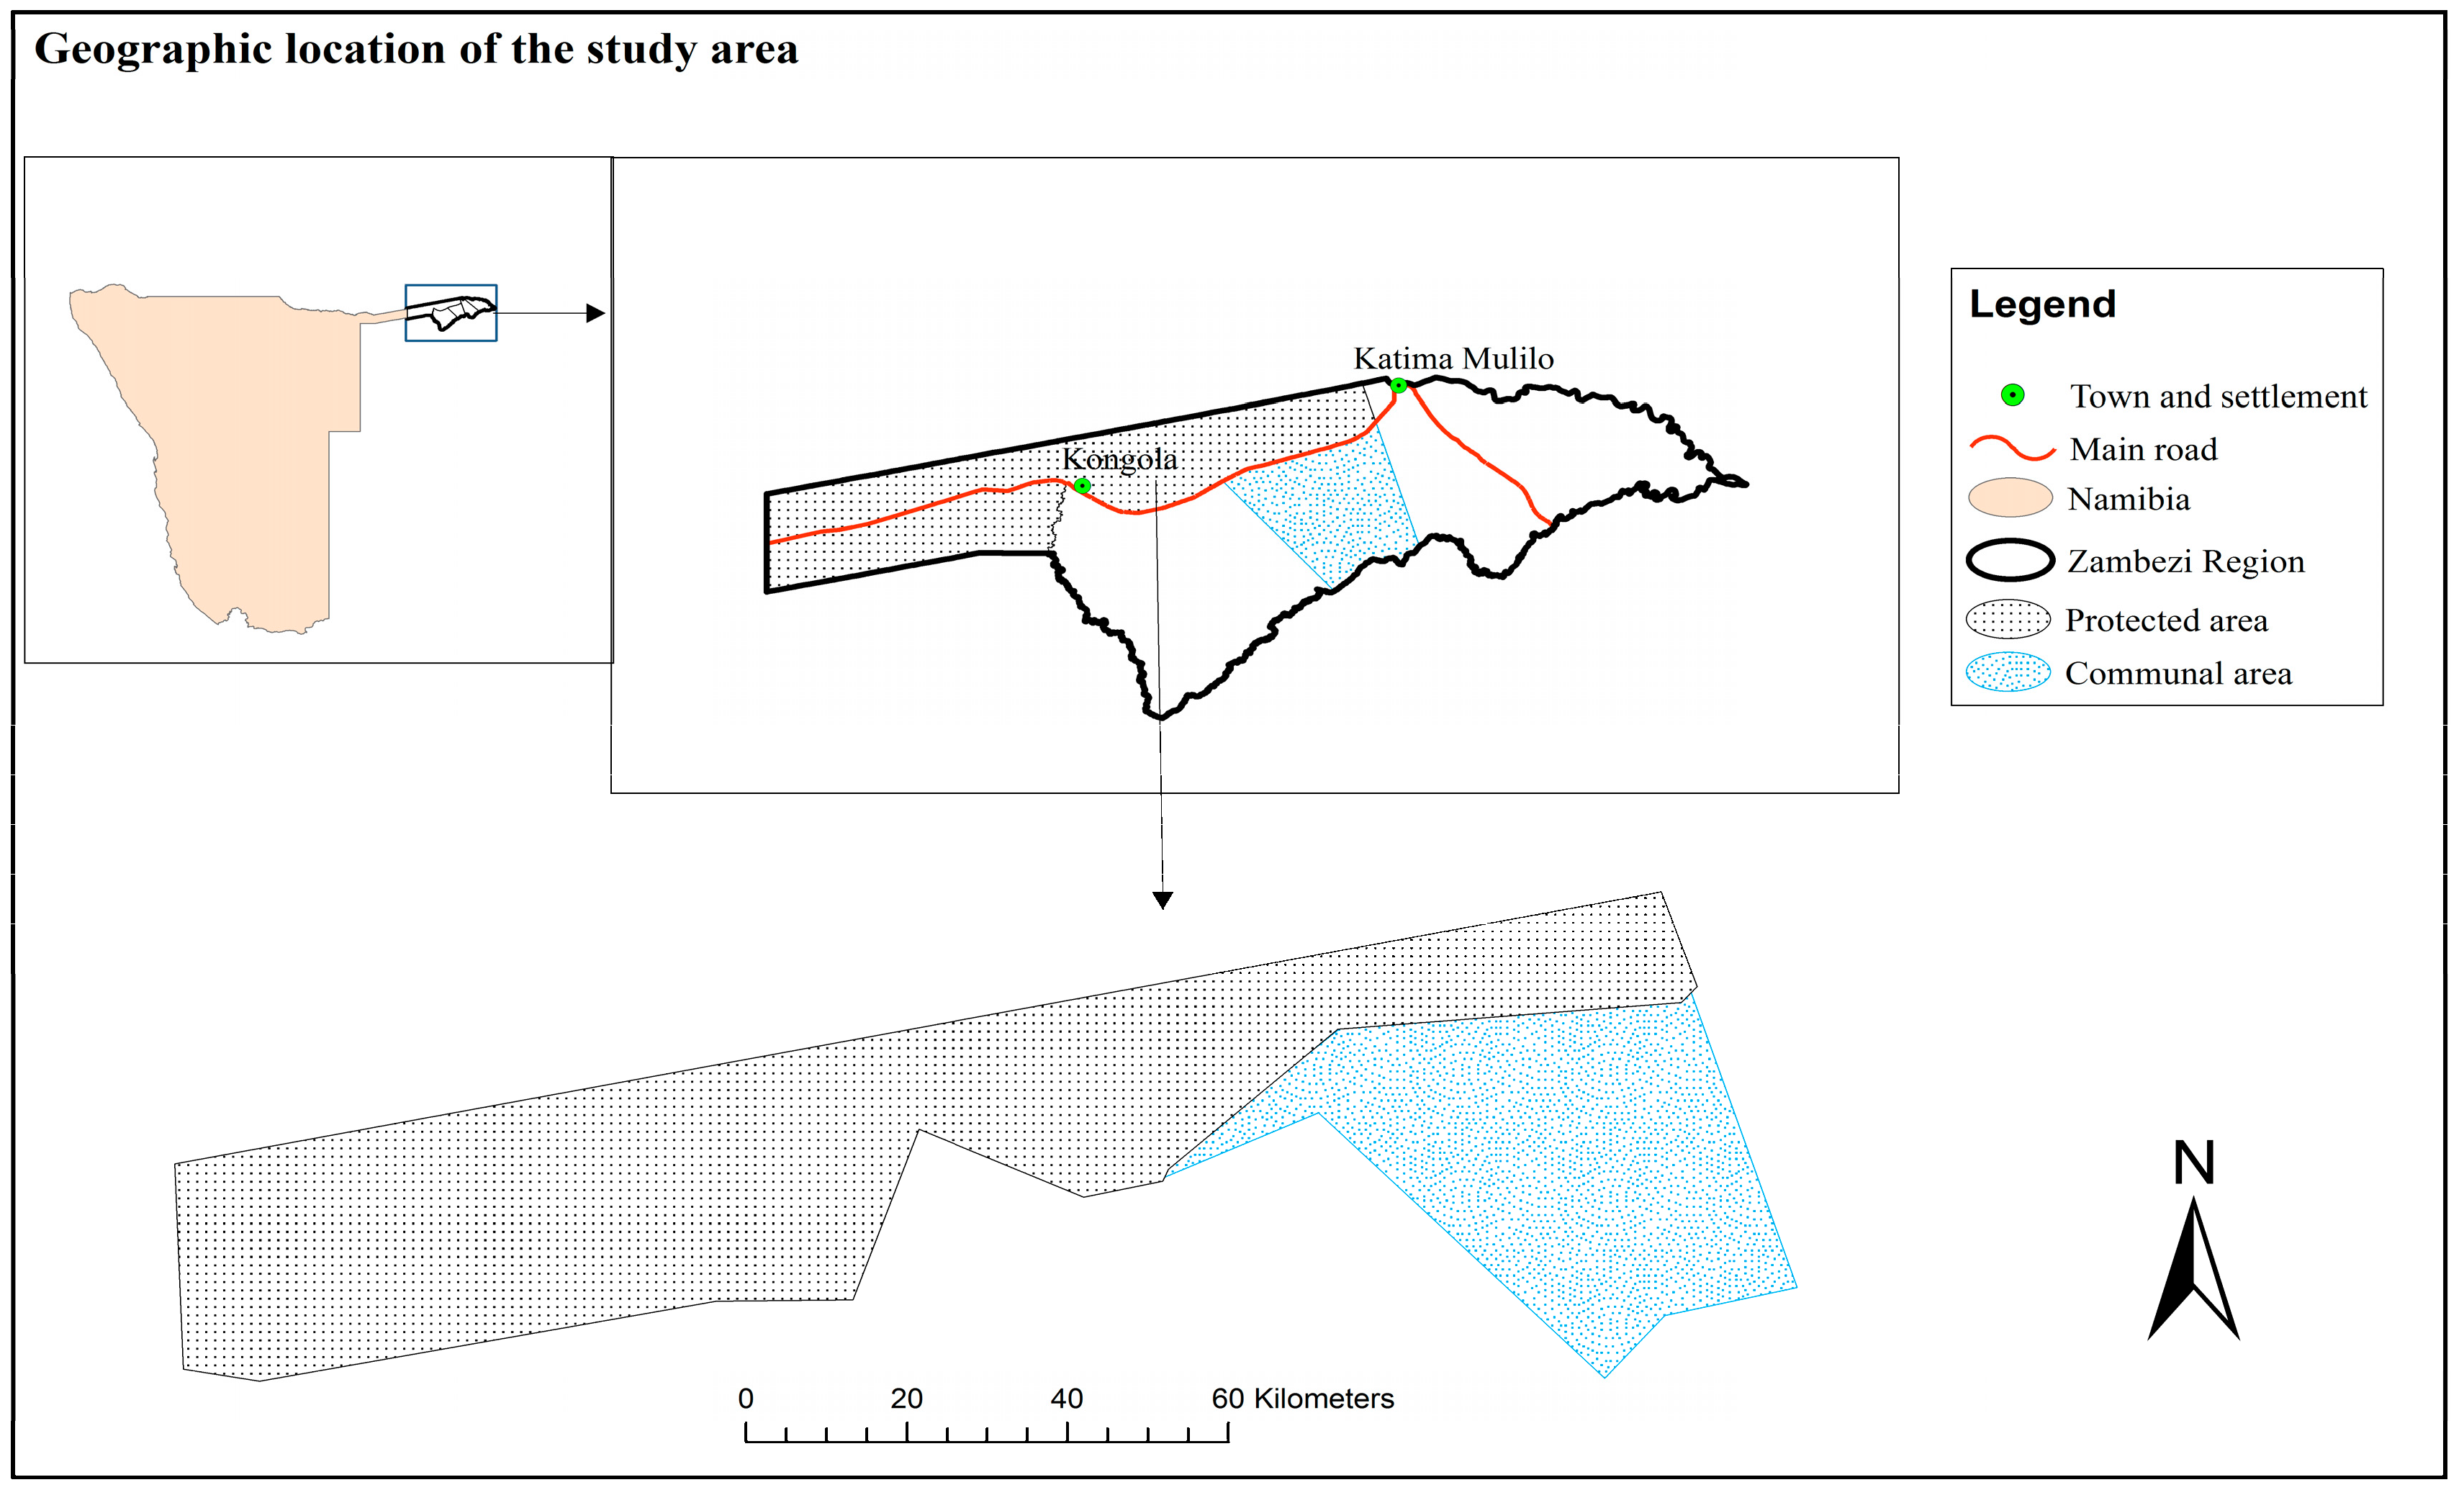
This study was undertaken in the Sibbinda Constituency of the Zambezi Region, Namibia (
Figure 1). Sibbinda is a communal area, which extends over an area of about 188,000 ha, located to the south-west of Katima Mulilo, the regional capital of the Zambezi Region. The mean annual precipitation ranges from 650 mm in the western parts of the Zambezi Region to 1000 mm in the east, mostly falling between October and March, with a marked dry season between May and September. Given the comparatively high rainfall, the area has potential for agriculture and forestry when compared to other parts of the country. The relatively high rainfall enables residents to practice dryland crop farming which supports a more sedentary standard of living compared to more arid areas. The soil is predominantly sandy-loam with isolated gravel hills. The vegetation is classified as woodland savanna and is predominantly comprised of
Baikiaea plurijuga,
Guibourtia coleosperma,
Pterocarpus angolensis,
Burkea africana and
Dialium engleranum. The land cover is mostly made up of woodland, interspersed with swamps and wetlands [
15].
The total population of Sibbinda constituency was 9190 in 2000 and increased to 10,182 in 2010, which represents an annual population growth rate of 1% [
16]. The agricultural sector is dominated by small-scale mixed-crop and livestock farming and is the primary source of livelihood for these communities [
14]. Land tenure is under a local traditional system headed by the “
Indunas” who have rights under both customary and Namibian state laws [
17]. Settlement clusters are found around the main settlements which are administered by the “
Induna Silalo”. Due to the relatively high rainfall, larger numbers of people are able to farm smaller parcels of land than in other areas of the country. Settlements are therefore relatively large with several satellite settlements. The road network is relatively dense, mainly comprising of dirt tracks and foot paths.
Since independence in 1990, and the end of Namibia’s war of independence, the National Forestry Policy of 1992 as well as changes to the Nature Conservation Ordinance of 1975 contributed to the diversification of the region’s economy to include wildlife-based tourism alongside agriculture. Supplementary, off-farm livelihood activities comprise of the gathering of non-timber forest products such as Vangueria infausta and Grewia fruits. Environmental degradation as a result of deforestation, land degradation, and illegal logging are now of great concern in the Zambezi Region.
2.2. Remote Sensing Analysis
Landsat TM and ETM images from 1984, 1991, 2000 and 2010 were downloaded from the University of Maryland’s Global Land Cover Facility (GLCF) (
http://glcapp.umiacs.umd.edu) and United States Geological Survey (USGS) Earth Resources Observation Systems (EROS) Data Center (EDC) (
http://glovis.usgs.gov) [
18]. The detailed description on the image specifications choice of image dates can be found in Ref. [
18]. However, it is important to reiterate that before interpretation, radiometric, geometric and atmospheric corrections were applied and the Root Mean Squared Error (RMSE) of geometric rectification was found to be less than 0.5 pixels. Moderate Resolution Imaging Spectroradiometer (Modis) with a spatial resolution of 250 m was used to map burned areas. MODIS images were downloaded from the MODIS web site (
http://modis.gsfc.nasa.gov/).
2.3. Image Classification and Accuracy Assessment
A classification scheme to derive five LULC classes was based on Ref. [
18]. (
Table 1). The detailed account on ground truthing, accuracy assessment and change detection are depicted in Ref. [
18].
2.4. Spatial Data Used
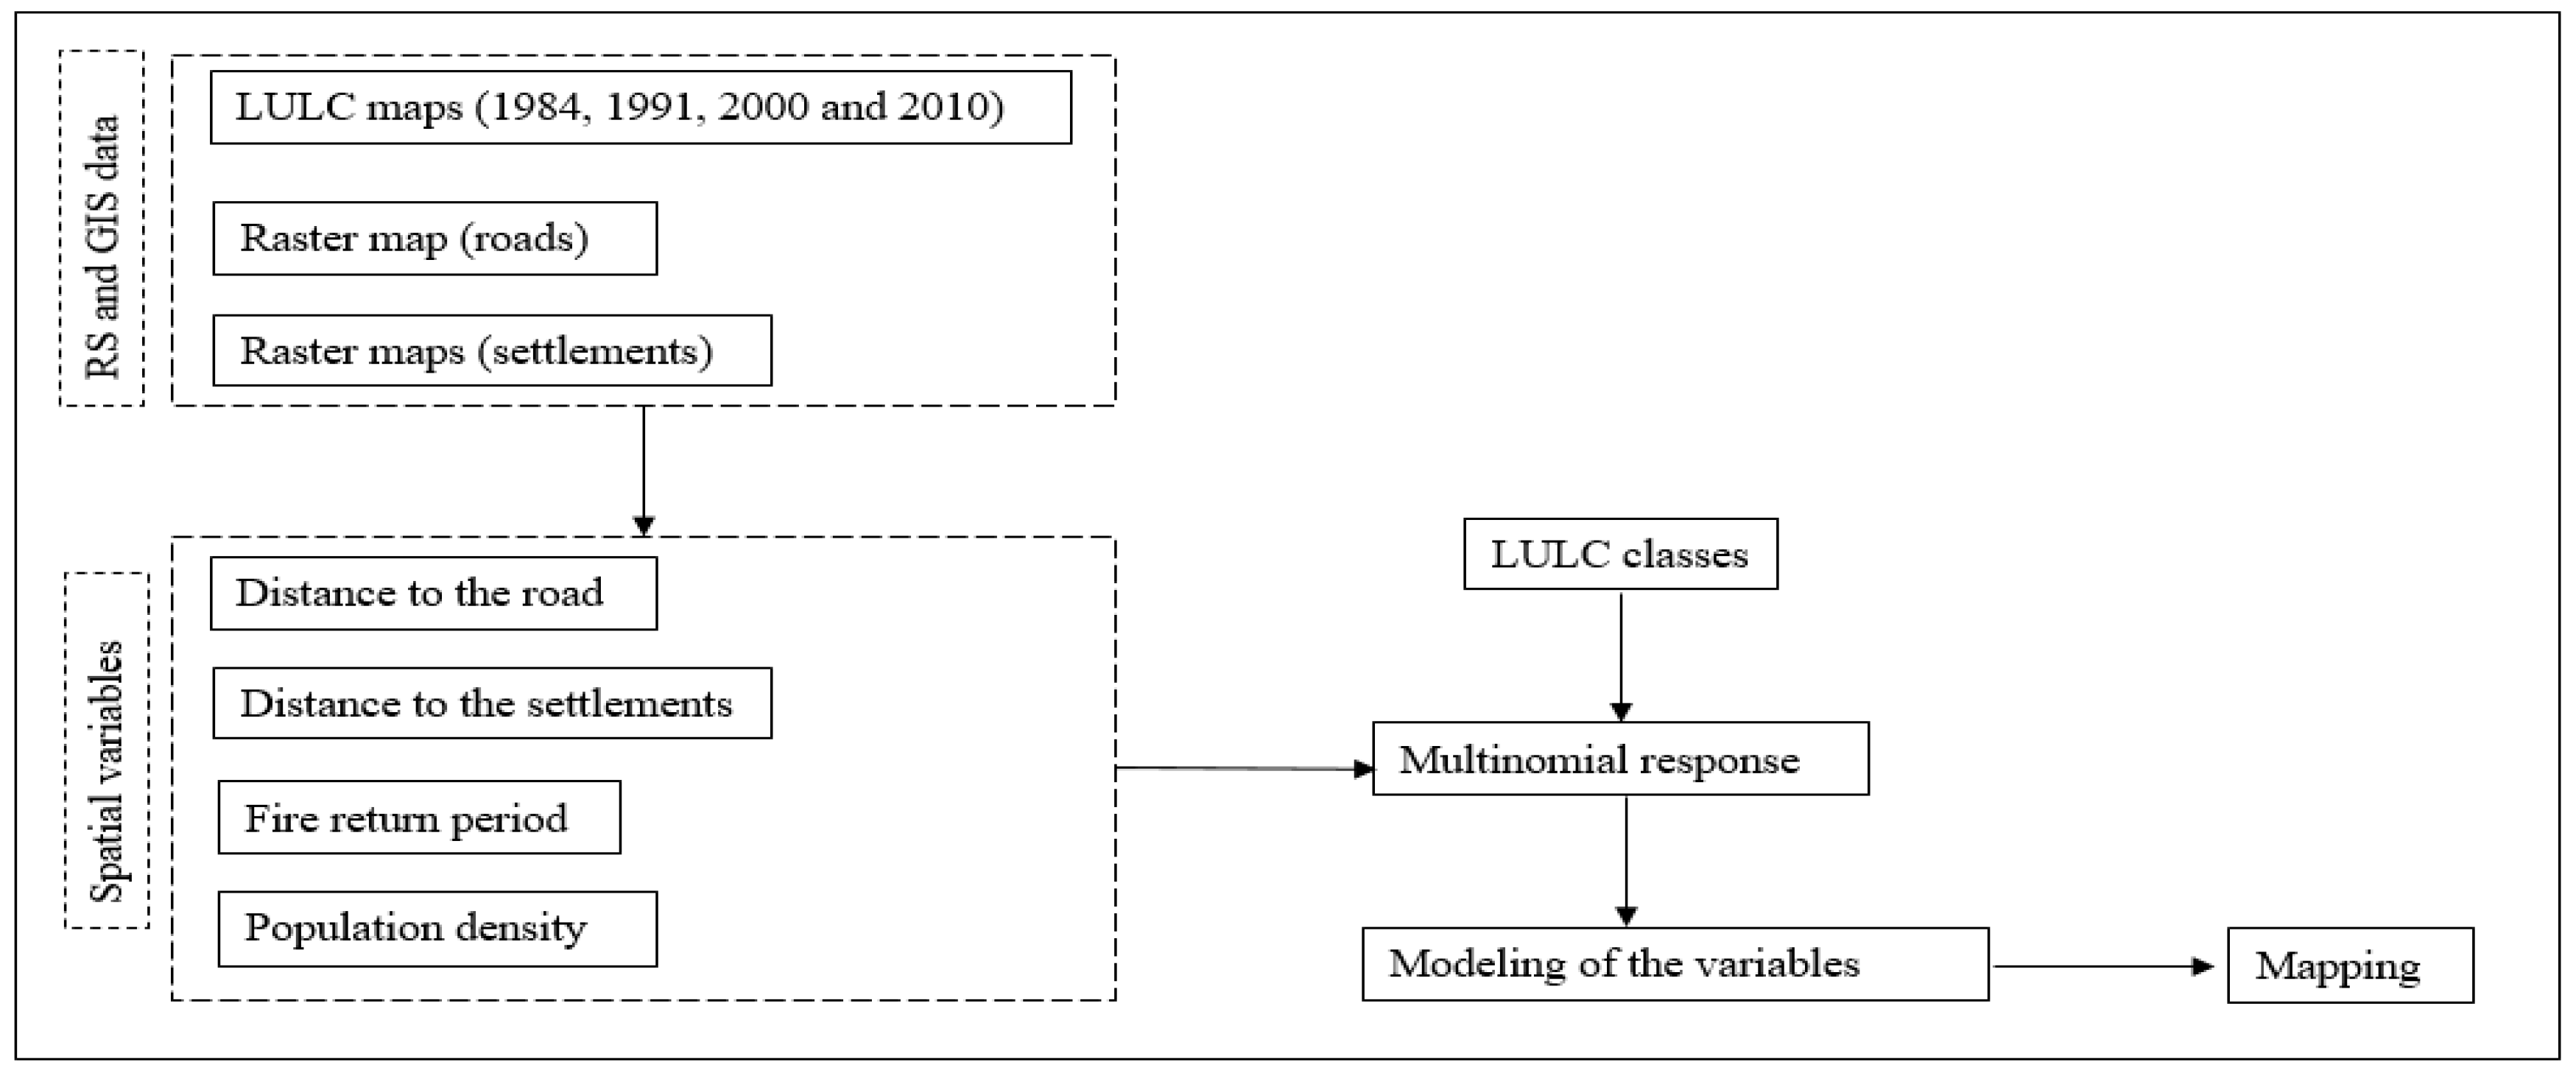
A systematic grid of 2 km by 2 km was superimposed on the study area to collect various factors on the 2000–2010 change map. A total of 926 survey pixels in the protected area and 402 in the communal area were evaluated (
Figure 2). Since mapping was conducted using multiple spatial resolution images (Landsat and Modis) at different scales, field observations were collected at the corresponding resolutions to match image values in pixel sizes. Proximity analysis tools in ArcGIS were used to determine the distances from survey points to the nearest roads and settlements. Similarly, querying and selection techniques were employed to identify the fire return periods on the survey points and was used as an input into the multinomial logistic regression model. Distance variables were calculated based on digital base maps, all done by ArcGIS 9.3’s near tool to determine the distances from random points to the nearest roads and settlements. The near distance was calculated by evaluating the shortest distance between the random points and near features such as roads or settlements. Image attributes of interest were extracted to the survey points through the spatial analyst extraction tools. The road network and settlement data were extracted from Namibian digital topographic maps produced by the Surveyor General’s office in Namibia. Population density was extracted from the National Planning Commission of Namibia settlement distribution information system. Fire return period was extracted from a series of maps, which annually characterizes the temporal fire regimes from the MODIS fire scar maps.
2.5. Multinomial Logistic Regression to Analyze the Spatial Drivers of LULC Change
Association between the derived spatial driver data and LULC change outcome was analyzed using the multinomial logistic regression. The multinomial logistic regression was used since the outcome variable (LULC change) had more than two outcome categories. We used the estimated odds ratios to measure the magnitude of strength of association between spatial explanatory variables and a particular LULC change. A
p-value less than 0.05 was considered to denote a statistically significant association. A set of spatially explicit explanatory and dependent variables generated and assembled in a Geographic Information System are shown in
Table 2. These were selected based on their representation of the processes believed to be driving LULC in the study area. Furthermore, the selection of explanatory variables was restricted by the availability of spatially explicit data in the study area. We are also aware that the spatial predictors may be collinear, which might cause problems in the estimation of regression coefficients. Informally, we used Pearson’s correlation to evaluate the correlation between the spatially explanatory variables. Formally, Variance Inflation Factor (VIF) and tolerance (I/VIF) were calculated to measure the degree of collinearity among the spatial predictor variables, and used a rule of thumb to further investigate or eliminate predictors whose VIF is greater than 10 [
19].
Although these variables have been well studied in other areas as determinants of LULC change, they have not been investigated in the woodland areas of Namibia. These variables were used as predictors to fit a multinomial logistic regression model with each LULC class as dependent variable. Other variables such as rainfall and soil conditions at field level are not available at the scale of the study.
Table 3 shows the dependent variables used in the multinomial logistic regression analysis.
Several categories of LULC change described were considered very sparse and were excluded from the analysis. In the communal area, these included conversions of bare land to shrub land, bare land to crop/grass land, crop/grass land to shrub land, crop/grass land to other land, crop/grass land to bare land, other land to forest land, other land to other land, other land to shrub land shrub land to bare land and shrub land to other. In the protected area, categories which were sparse and excluded in the analysis were conversions of crop/grass land to forest land, crop/grass land to shrub land and crop/grass land to bare land.
The fitted model was then used to map the predicted probabilities of specific LULC change in the study area. The selection of explanatory variables was restricted by the availability of spatially explicit data in the study area. The variables used were selected based on their representation of the processes believed to be driving LULC in the study area. We mapped the predicted probabilities of occurrence to produce probability maps to underline spatial distribution of LULC with their respective relationship with the spatial variables. All regression models were determined using SPSS 16.0, after all data were standardized and normalized.
The schematic representation of the research design indicating steps used for producing probability of occurrence maps is provided in
Figure 3.
3. Results
3.1. Land Use and Land Cover Change Assessment
The overall classification accuracy for 1984, 1991 and 2000 were respectively 79.6%, 75.5% and 80.6% [
18]. In satellite-based classifications using Landsat imagery, most studies have claimed accuracy of between 60% and 90% [
20] implying that the accuracy of LULC maps used here are well within acceptable limits [
18].
3.2. Land Use and Land Cover Changes
The results of the LULC classification for the time-series are presented in
Table 4. Prominent changes under different LULC classes were that forest land increased in both protected and communal land after independence in 1991. However, shrub land reduced after independence in the protected area. In the communal area, shrub land reduced after independence in the protected area, there was a progressive marginal increase in crop/grass land. However, crop/grass land reduced after 1991 in the communal area. The detailed transition tables can be found in Ref. [
18].
3.3. Modeling LULC
Table 5 shows that there is a negative correlation between population density and distance to the road and settlements in the communal area Fire return period recorded weak correlations with other spatial variables investigated in the communal area. As expected, distance to the road and settlement showed a strong correlation in the communal area.
Table 6 and
Table 7 present effects of the variables affecting the change direction of LULC in the protected and communal areas, where odds ratios (ORs) (with 95 confidence intervals) are used to measure the effects. For multinomial LULC outcome, the conversion from shrub land to shrub land was taken as the reference category. In the protected area, population density was found to have a significant effect on crop/grass to crop/grass land compared to forest land to forest land and shrub land to shrub land (
p < 0.05). Increasing distance to settlement significantly influenced the conversion of forest land to bare land, where the odds were 0.809 less likely with a unit increase in kilometer distance. Similarly, population density was found to have a significant effect on conversion from forest to crop/grass (
p < 0.05) with the odds of 1.235, compared to forest land to shrub land. Fire return period was found to have a significant effect on forest land to forest land (
p < 0.05) where the odds of 0.833 decreases with a unit increase in the number of years a pixel was burned, compared to shrub land to forest land (
Table 6). The VIF values ranged between 1 and 1.562 (with a corresponding tolerance level greater than 0.1), indicating multicollinearity is not a problem in estimating the predictor coefficients under the multinomial regression model.
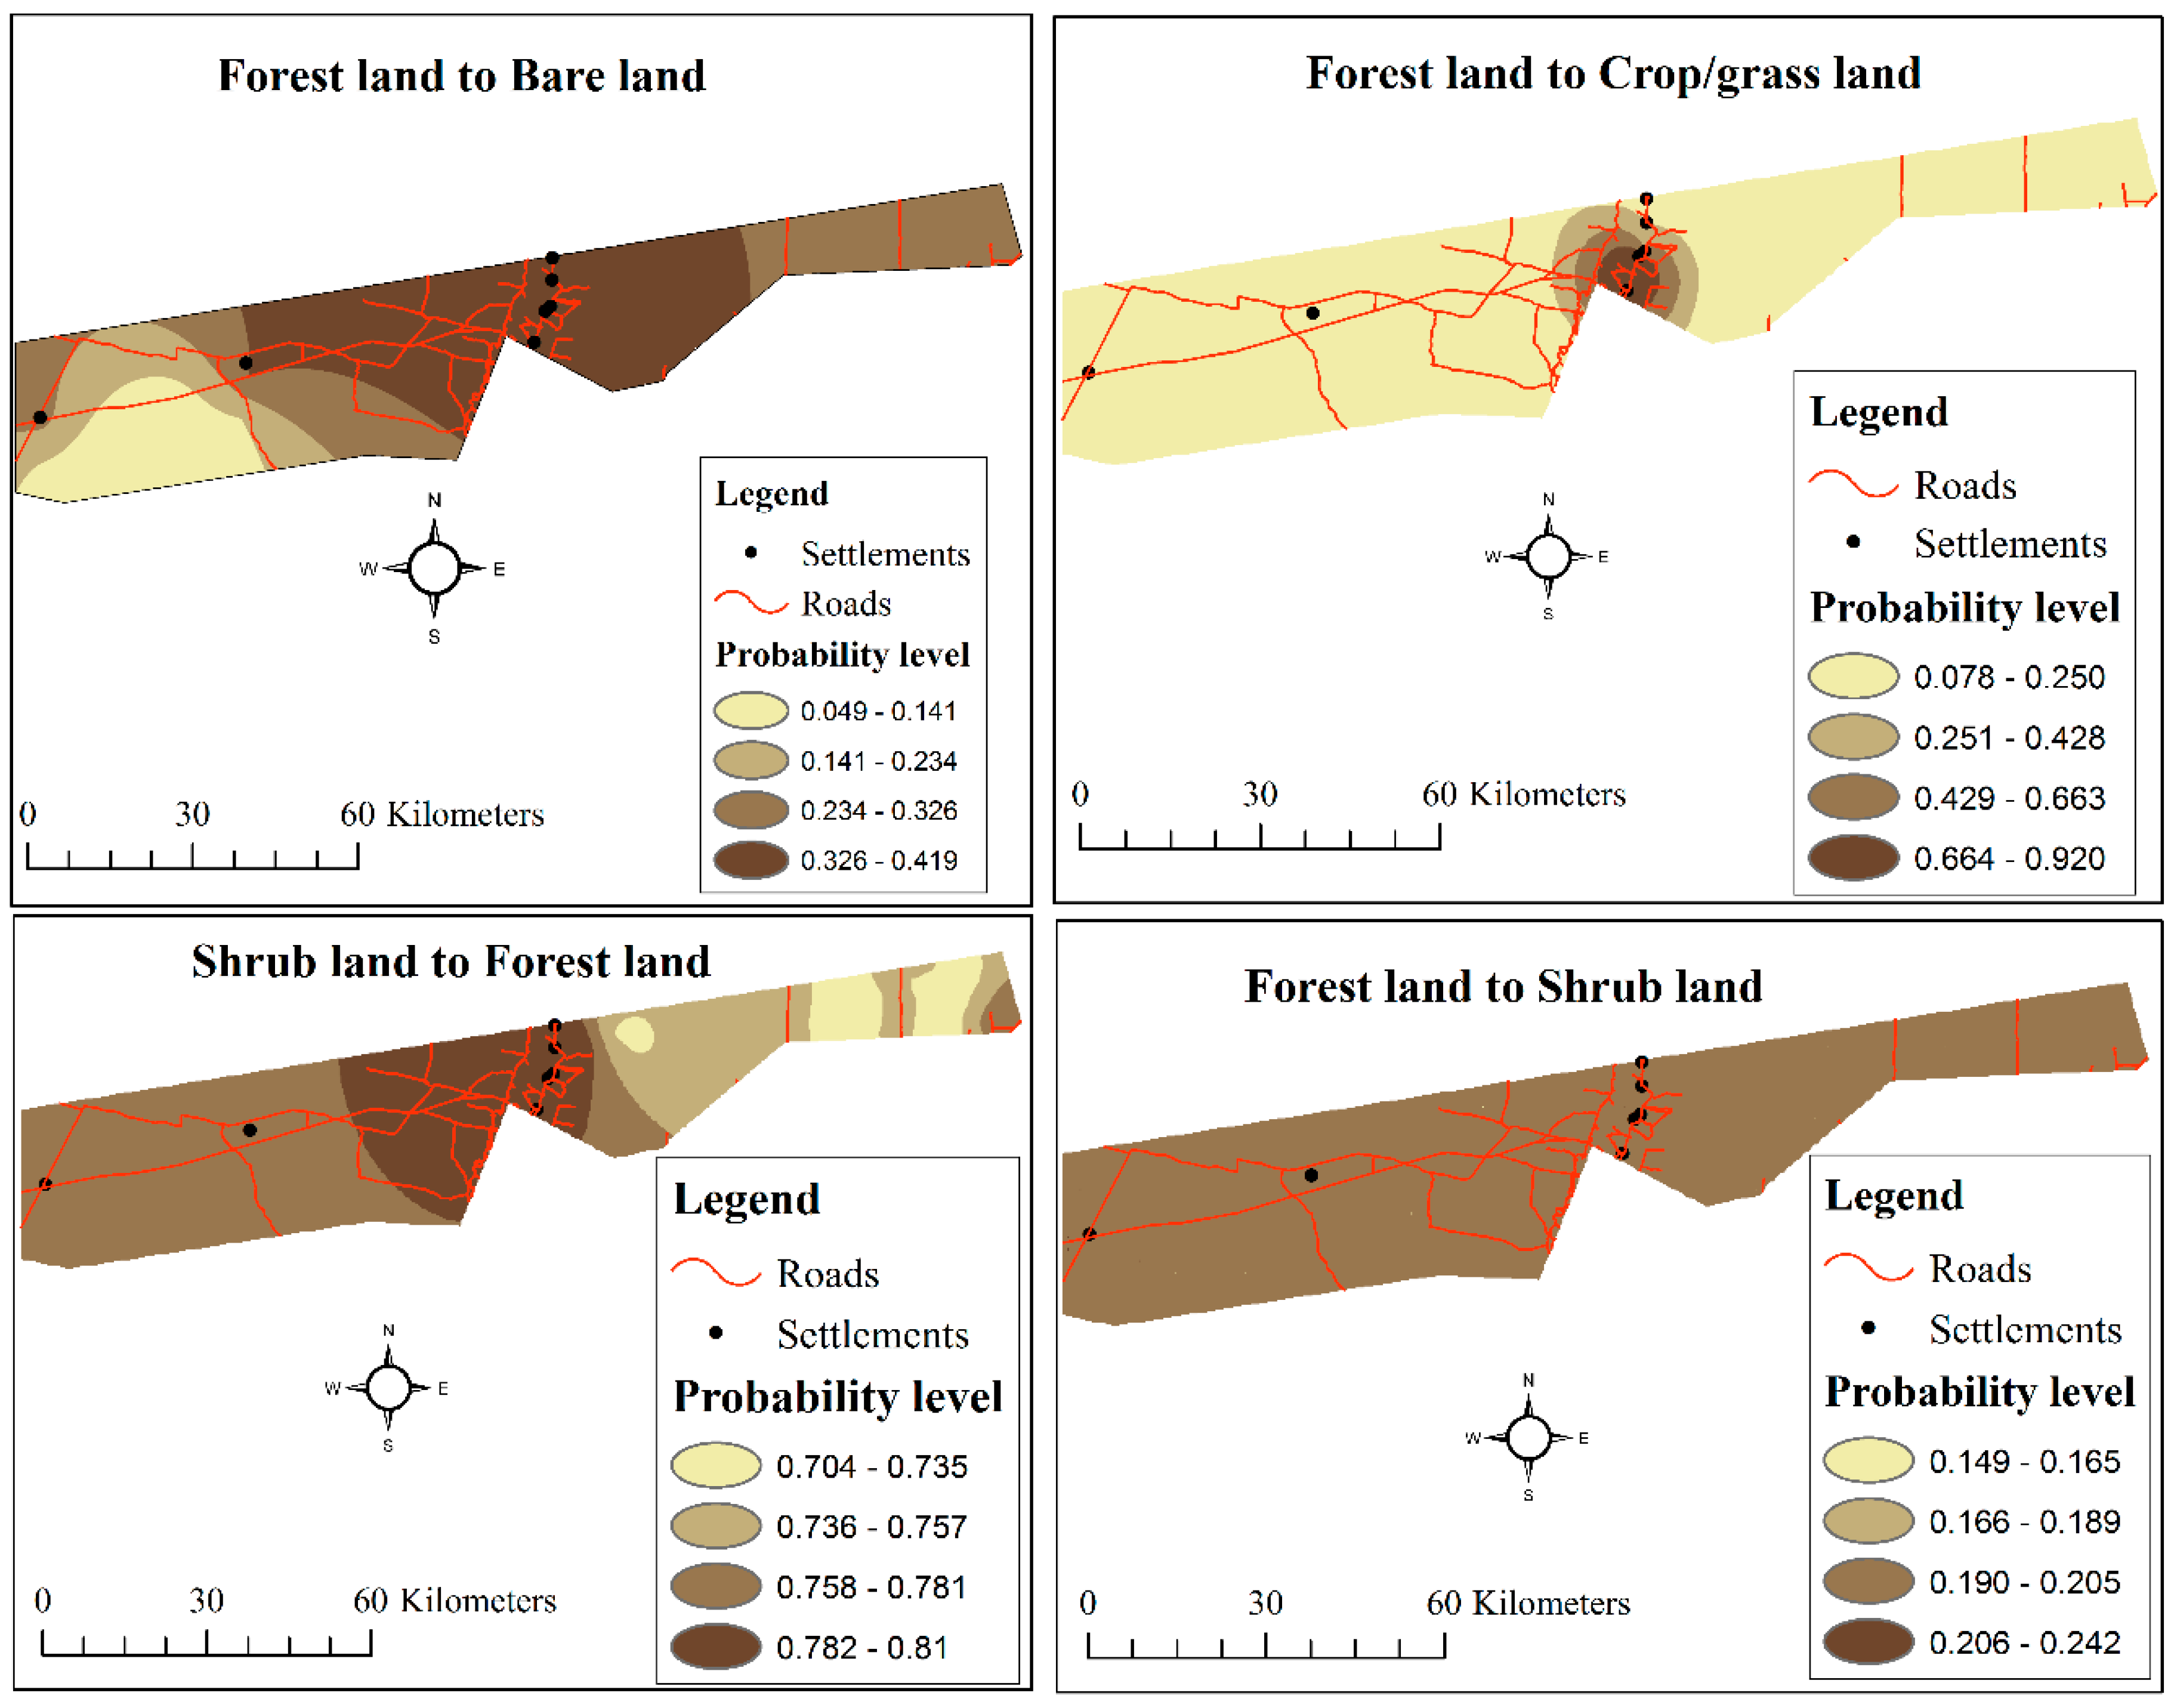
Figure 4 shows the effect of spatial variables on various LULC conversions. The conversion from forest land to bare land is pronounced in areas closer to the settlements and along the roads. As expected, higher probabilities of converting forest land to crop/grass land and shrub land to forest land were found closer to settlements. However, moderate to high probabilities of converting forest land to shrub land were similar throughout the entire protected area.
In the communal area, distance to the road was found to have a significant effect on crop/grass land to crop/grass land (
p < 0.05) where the odds reduced by a factor of 0.187 compared to crop/grass land to forest land and other LULC conversions (
Table 7). The
p-values of most of the LULC conversions are much higher than 0.05 meaning the effect of the respective explanatory is random. The VIF values ranged between 1 and 1.819 at a tolerance level of 1.
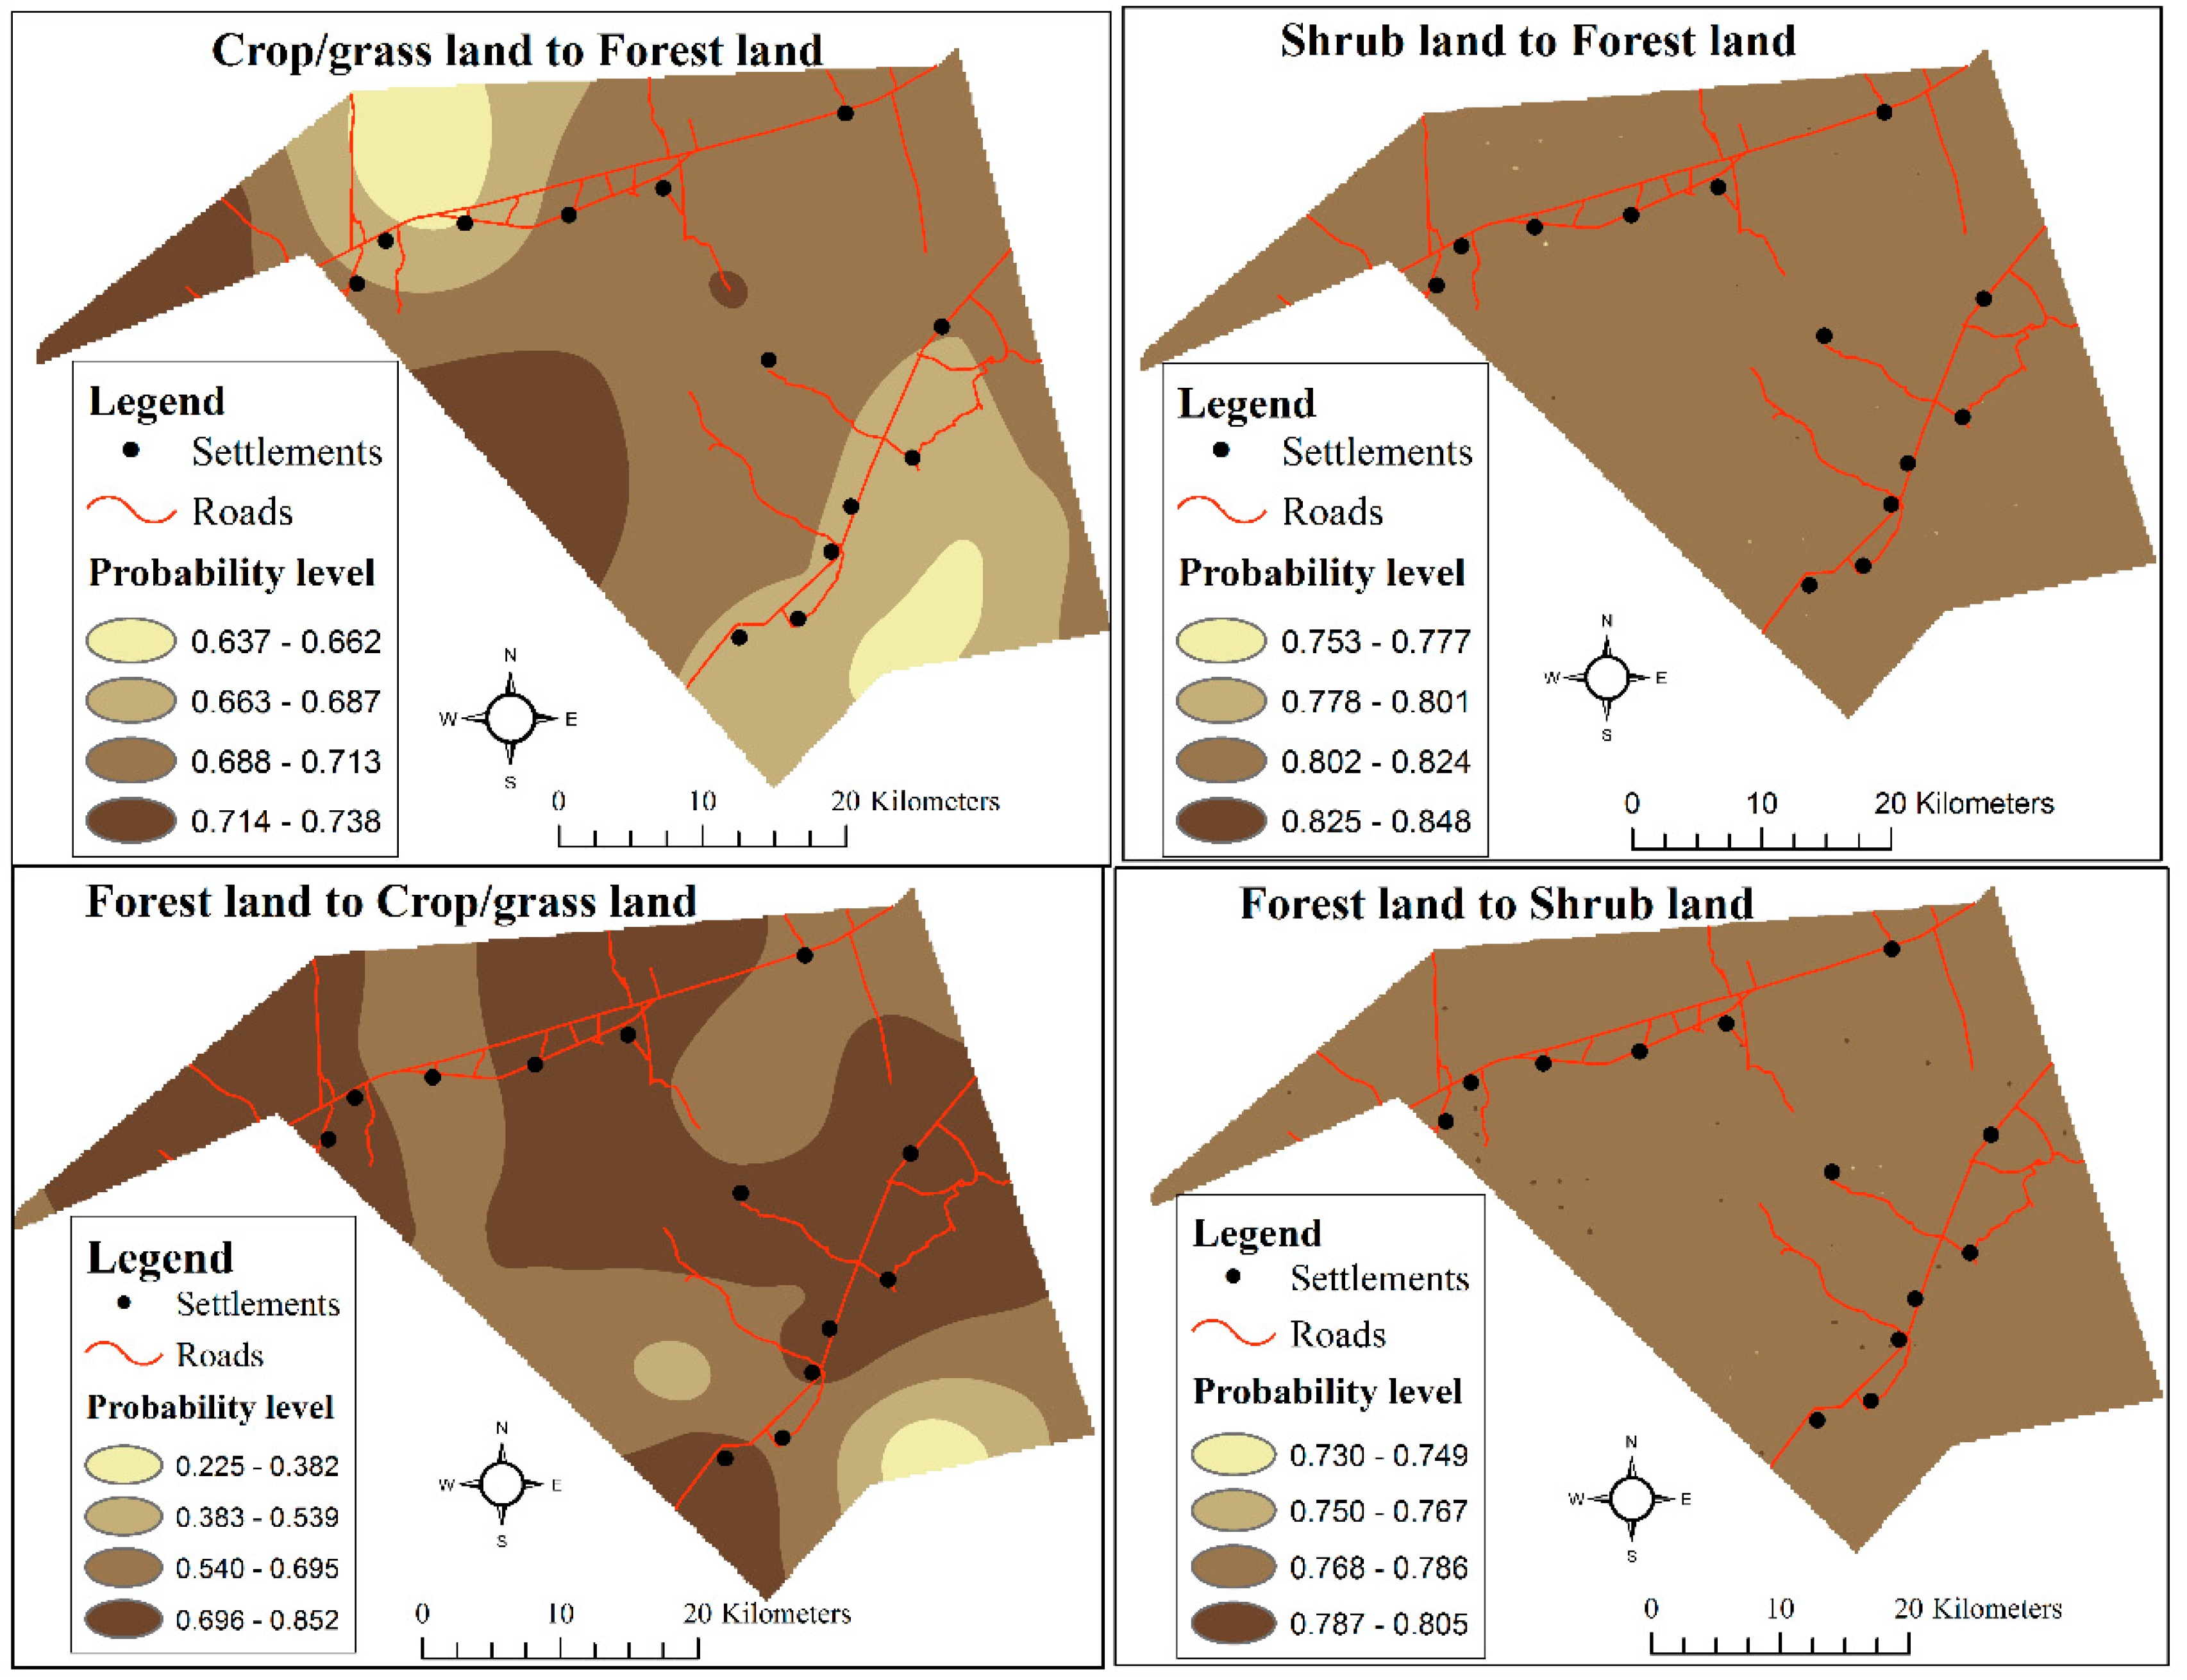
Figure 5 shows the effect of spatial variables on various LULC conversions in the communal area. Moderate to high probabilities of converting crop/grass land to forest land and forest land to crop/grass land are found in areas closer to the roads and settlements. However, areas with low probabilities of converting crop/grass land to forest land and forest land to crop/grass land were found in areas further away from the settlements and roads. On the other hand, moderate probabilities of converting shrub land to forest land and forest land are found throughout the entire communal areas.
4. Discussion
This study considered LULC change in the Zambezi Region, Namibia in periods of political and policy transition. Our analysis suggests that the factors affecting LULC change show different patterns for the two different near-decadal time periods (1984–1991 and 2000–2010). Overall, the main patterns in LULC occurring in the study area were summarized into 2 phases; (1) 1984–1991 represented high deforestation and gradual increase in shrub land; (2) 1991–2000 and 2000–2010 represented lower deforestation and slower agro-pastoral expansion [
18]. The changes in forest land were consistent with the general increase in forest land observed in the field and from semi-structured interviews carried out in 2013 [
14]. Two major LULC processes may have reduced crop/grasslands i.e., abandonment and intensification. Although there are no reliable data about the production of agricultural crops to estimate intensification of production, field visits showed that households had received fertilizer subsidies under the dryland cropping programs of the government.
Population density significantly influenced the retention of crop/grass land and conversions from forest land to crop/grass land with varying degrees to the observed LULC change dynamics in the protected area. A rather recent phenomenon in the protected area is demographic shrinkage since strict laws and regulations on resettlement have been passed. These developments call for increased detailed information on the types of households around the protected areas, to address differences in their preferences since they still derive their livelihoods from the protected area. Our models indicate that distance to the road affect the likelihood associated with crop/grass occurrence. It should be noted that there are numerous tracks in the study area that were not mapped and may affect the pattern showing the impact of the distance to the road and settlements.
Conversions of crop/grass land are driven by developments outside the agricultural sector, such as urbanization or nature development. The changes in agricultural production are driven by developments on the market for agricultural products, environmental regulations and technological innovations. The change towards multi-functional agricultural land is driven by regulations and subsidies for nature and landscape management, and by the attractiveness of different opportunities for subsistence farmers to increase their incomes. After independence in 1990, the benefits associated with the road network increased, such as access to health, education, employment and other opportunities, mainly along the major roads. This may have encouraged communities to move from remote areas (out-migration of 3.6%) of rural people was experienced between 2000 and 2010 to areas nearer the roads and towns, thus abandoning their inland croplands, and thereby reducing the land area under crops [
14]. In comparison with other constituencies of the Zambezi Region, the labor force participation rates were the lowest in the Sibbinda constituency (29.2%) in 2010 [
21]. Since agriculture is the main source of livelihoods, communities established crop fields in areas closer to their new settlements along the roads, hence the impact on the conversion of other LULC types to cropland near to the settlements.
Population density did not significantly influence the conversions of all the LULC types in the communal area. This is contrary to the findings of a study carried out in Sissili Province of Burkina Faso, which linked change in LULC to population density [
22]. The lack of significance of population density in this study is counter-intuitive. However, the census tracts averaged out population densities over larger areas, making it difficult to identify a significant link. Other variables such as rainfall and soil conditions at field level were not available at the scale relevant to the study. This may have inflated the effect of spatial drivers. In addition, the low spatial resolution of Landsat images (30 m) used for this study and the mixed vegetation type (resulting in mixed pixel problems) may have influenced the patterns of LULC change that were detected. Increasing the spatial extent of the study area may permit the identification of other drivers of change (such as site conditions, economic and environmental factors). Nonetheless, the limited number of variables in a LULC change model is useful to understand the LULC phenomenon that involves complex processes [
23], as carried out in this study. In addition, identifying the complex interaction between changes and their drivers in space and time is important to predict future developments, set decision making mechanisms and construct alternative scenarios.
5. Conclusions and Perspectives
The study concluded that prominent changes under different LULC classes were that forest land increased in both protected and communal land after independence in 1991. However, shrub land reduced after independence in the protected area. In the communal area, shrub land reduced after independence from 2000 to 2010. In the protected area, there was a progressive marginal increase in crop/grass land. However, crop/grass land reduced after 1991 in the communal area. Apart from the spatial driving forces investigated in this study, future land use may be strongly affected by existing patterns of land use and by policies in both the protected and communal areas of the Zambezi Region. Policies can affect land use directly (e.g., spatial policies) or via driving forces (e.g., subsidies and new technologies). Further, the likelihood that a land use change occurs at a location depends on the existing land use as demonstrated in this study. The information and models derived in the present study could be incorporated into an LULC framework for planning, environmental monitoring, scenario analysis and impact assessment at local government level. Moreover, many underlying factors, such as intensification of farming were difficult to establish using this quantitative approach due to data limitations. The same limitation might extend to population density as the population data obtained were based on the mean, thus, all areas or cells in an administration unit had the same numbers. However, the net of these less spatially distributed variables does not inevitably mean lower magnitude of these variables in reality. The problems of the non-spatial socio-economic drivers could be moderated through follow-up studies reflecting land use decisions. To do so, household surveys could be used to acquire socio-economic data and develop decision models for LULC. Otherwise, it is essential to develop methods for spatial disaggregation of statistical data in the Zambezi Region. Nonetheless, looking at isolated drivers of LULC change as carried out in this study may provide information on the spatial heterogeneity and dependence among LULC changes and the associated predisposing factors.
Author Contributions
Conceptualization, J.M.K.; Supervision, M.A.C., C.K., S.O.M., F.P.G. and P.W.C.
Funding
This research project was funded by the University of Pretoria in South Africa and the Ministry of Agriculture, Water and Forestry in Namibia. We are also grateful for the financial support from the Southern African Science Service Centre for Climate Change and Adaptive Land Management (SASSCAL) task 033.
Acknowledgments
We would like to acknowledge the invaluable help of the Forestry extension officers in Zambezi and all organizations that provided the necessary secondary data. Any errors are solely the responsibility of the authors and not of the funding agencies. This research complies with the current laws of the Republic of Namibia.
Conflicts of Interest
The authors declare no conflict of interest. The founding sponsors had no role in the design of the study; in the collection, analyses, or interpretation of data; in the writing of the manuscript and in the decision to publish the results.
References
- FAO. Planning for Sustainable Use of Land Resources; FAO Bulletin 2: Rome, Italy, 1995. [Google Scholar]
- Turner, B.L.; Meyer, W.B. Global land use and land cover change: An overview. In Changes in Land Use and Land Cover; Turner, B.L., Meyer, W.B., Eds.; Cambridge University Press: Cambridge, UK, 1994. [Google Scholar]
- Rozenstein, O.; Karnieli, A. Comparison of methods for land-use classification incorporating remote sensing and GIS inputs. Appl. Geogr. 2011, 31, 533–544. [Google Scholar] [CrossRef]
- González, M.G.; Martínez, M.; Lithgow, D.; Pérez-Maqueo, O.; Simonin, P. Land use change and its effects on the value of ecosystem services along the coast of the Gulf of Mexico. Ecol. Econ. 2012, 82, 23–32. [Google Scholar] [CrossRef]
- Portela, R.; Rademacher, I. A dynamic model of patterns of deforestation and their effect on the ability of the Brazilian Amazonia to provide ecosystem services. Ecol. Model. 2001, 143, 115–146. [Google Scholar] [CrossRef]
- Verburg, P.H.; Overmars, K.P. Combining top-down and bottom-up dynamics in land use modeling: Exploring the future of abandoned farmlands in Europe with the Dyna-CLUE model. Landsc. Ecol. 2009, 24, 1167. [Google Scholar] [CrossRef]
- Overmars, K.P.; Verburg, P.H. Analysis of land use drivers at the watershed and household level: Linking two paradigms at the Phillipine forest fringe. Int. J. Geogr. Inf. Sci. 2005, 19, 125–152. [Google Scholar] [CrossRef]
- Geist, H.J.; Lambin, E.F. What drives tropical deforestation? In A Meta-Analysis of Proximate and Underlying Causes of Deforestation Based on Subnational Case Study Evidence; LUCC Report Series No. 4; University of Louvain: Louvain-la-Neuve, Belgium, 2001. [Google Scholar]
- Lambin, E.F.; Geist, H.J. Land-Use and Land-Cover Change; Springer: Berlin, Germany, 2006; ISBN 9783540322016. [Google Scholar]
- Drummond, M.A.; Loveland, T.R. Land-use pressure and a transition to forest-cover loss in the Eastern United States. BioScience 2010, 60, 286–298. [Google Scholar] [CrossRef]
- Diaz, G.I.; Nahuelhual, L.; Echeverria, C.; Marin, S. Drivers of land abandonment in Southern Chile and implications for landscape planning. Lands Urban Plan 2011, 99, 207–217. [Google Scholar] [CrossRef]
- Mortimore, M.; Ba, M.; Mahamane, A.; Rostom, R.S.; Pozo, P.S.; Turner, B. Changing systems and landscapes: Measuring and interpreting land use transformation in African drylands. Geogr. Tidsskr. Dan. J. Geogr. 2005, 101, 101–118. [Google Scholar] [CrossRef]
- Maitima, J.M.; Olson, J.M.; Mugatha, S.M.; Mugisha, S.; Mutie, T. Land use changes, impacts and options for sustaining productivity and livelihoods in the basin of lake Victoria. J. Sustain. Dev. Afr. 2010, 12, 3. [Google Scholar]
- Kamwi, J.M.; Chirwa, P.W.C.; Manda, S.O.M.; Graz, F.P.; Kätsch, C. Livelihoods, land use and land cover change in the Zambezi Region, Namibia. Popul. Environ. 2015, 37, 207–230. [Google Scholar] [CrossRef] [Green Version]
- Giess, W. A preliminary vegetation map of Namibia. Third revised edition. Dinteria 1998, 4, 5–114. [Google Scholar]
- Central Bureau of Statistics. An Atlas of Namibia’s Population: Monitoring and Understanding Its Characteristics; Central Bureau of Statistics: Windhoek, Namibia, 2010.
- Harring, S.L.; Odendaal, W. God Stopped Making the Land—Land Rights, Conflict and Law in Namibia’s Caprivi Region; Land, Environment and Development Project; Legal Assistance Centre: Windhoek, Namibia, 2012. [Google Scholar]
- Kamwi, J.M.; Kätsch, C.; Graz, F.P.; Chirwa, P.W.C.; Manda, S.O.M. Trends in land use and land cover change in the protected and communal areas of the Zambezi Region, Namibia. Environ. Monit. Assess. 2017, 189, 242. [Google Scholar] [CrossRef] [PubMed]
- Field, A. Discovering Statistics Using SPSS; Sage: London, UK, 2009. [Google Scholar]
- Mango, L.M. Modeling the effect of land use and climate change scenarios on the water flux of the Upper Mara River Flow, Kenya. FIU Electron. Theses Diss. 2010. Available online: https://www.google.com/url?sa=t&rct=j&q=&esrc=s&source=web&cd=2&cad=rja&uact=8&ved=2ahUKEwiq5dfBm6XdAhUC7mEKHdygBuQQFjABegQICBAC&url=http%3A%2F%2Fdigitalcommons.fiu.edu%2Fcgi%2Fviewcontent.cgi%3Farticle%3D1212%26context%3Detd&usg=AOvVaw0dsitJMxq8slAgz1xf9nz9 (accessed on 5 September 2018). [CrossRef]
- Central Bureau of Statistics. Namibia 2011 Population and Housing Census Preliminary Results; Central Bureau of Statistics: Windhoek, Namibia, 2011.
- Ouedraogo, I.; Tigabul, M.; Savadogo, P.; Compaore’, H.; Odén, P.C.; Ouadba, J.M. Land cover change and its relation with population dynamics in Burkina Faso, West Africa. Land Degrad. Dev. 2010. [Google Scholar] [CrossRef]
- Huang, B.; Zhang, L.; Wu, B. Spatiotemporal analysis of rural-urban land conversion. Int. J. Geogr. Inf. Sci. 2009, 23, 379–398. [Google Scholar] [CrossRef]
© 2018 by the authors. Licensee MDPI, Basel, Switzerland. This article is an open access article distributed under the terms and conditions of the Creative Commons Attribution (CC BY) license (http://creativecommons.org/licenses/by/4.0/).

 ,
, 


