An Assessment of Multiple Drivers Determining Woody Species Composition and Structure: A Case Study from the Kalahari, Botswana

 ,
,
Abstract
:1. Introduction
1.1. Precipitation
1.2. Grazing
1.3. Trampling
1.4. Fire
1.5. Research Gap and Questions
2. Materials and Methods
2.1. Study Area
2.2. Data Collection
2.3. Data Analysis
3. Results
3.1. Woody Vegetation Surveys
3.2. Regression Analysis
4. Discussion
5. Conclusions
Supplementary Materials
Author Contributions
Funding
Acknowledgments
Conflicts of Interest
Appendix A. Derived Burned Area Product

References
- Chapin, S., III; Kofinas, G.P.; Folk, C. Principles of Ecosystem Stewardship: Resilience-Based Natural Resource Management in a Changing World; Springer Science and Business: New York, NY, USA, 2009. [Google Scholar]
- Scholes, R.; Archer, S. Tree-grass interaction in savannas 1. Annu. Rev. Ecol. Syst. 1997, 28, 517–544. [Google Scholar] [CrossRef]
- Grossman, D.; Gandar, M. Land transformation in South African savanna regions. S. Afr. Geogr. J. 1989, 71, 38–45. [Google Scholar] [CrossRef]
- Acemoglu, D.; Johnson, S.; Robinson, J. An African Success Story: Botswana. CEPR Discussion Paper No 3219. 2002. Available online: https://ssrn.com/abstract=304100 (accessed on 23 July 2013).
- Robinson, J.A.; Parsons, Q.N. State formation and governance in Botswana. J. Afr. Econ. 2006, 15, 100–140. [Google Scholar] [CrossRef]
- Moleele, N.; Ringrose, S.; Matheson, W.; Vanderpost, C. More woody plants? The status of bush encroachment in Botswana’s grazing areas. J. Environ. Manag. 2002, 64, 3–11. [Google Scholar] [CrossRef]
- Ringrose, S.; Matheson, W.; Wolski, P.; Huntsman-Mapila, P. Vegetation cover trends along the Botswana Kalahari transect. J. Arid Environ. 2003, 54, 297–317. [Google Scholar] [CrossRef]
- Archer, S.R. Have southern Texas savannas been converted to woodlands in recent history? Am. Nat. 1989, 134, 545–561. [Google Scholar] [CrossRef]
- Van Auken, O. Shrub invasions in North American semiarid grasslands. Annu. Rev. Ecol. Syst. 2000, 31, 197–215. [Google Scholar] [CrossRef]
- Eldridge, D.J.; Bowker, M.A.; Maestre, F.T.; Roger, E.; Reynolds, J.F.; Whitford, W.G. Impacts of shrub encroachment on ecosystem structure and functioning: Towards a global synthesis. Ecol. Lett. 2011, 14, 709–722. [Google Scholar] [CrossRef]
- Sankaran, M.J.; Ratnam, J.; Hanan, N.P. Woody cover in African savannas: The role of resources, fire, and herbivory. Glob. Ecol. Biogeogr. 2008, 17, 236–245. [Google Scholar] [CrossRef]
- Wigley, B.J.; Bond, W.J.; Hoffman, M. Thicket expansion in a South African savanna under divergent land use: Local vs global drivers? Glob. Chang. Biol. 2010, 16, 964–976. [Google Scholar] [CrossRef]
- O’Connor, T.G.; Puttick, J.R.; Hoffman, M.T. Bush encroachment in southern Africa: Changes and causes. Afr. J. Range Forage Sci. 2014, 31, 67–88. [Google Scholar] [CrossRef]
- Stevens, N.; Lehmann, C.E.R.; Murphy, B.P.; Durigan, G. Savanna woody encroachment is widespread across three continents. Glob. Chang. Biol. 2017, 23, 235–244. [Google Scholar] [CrossRef]
- Archer, S.R.; Andersen, E.M.; Predick, K.I.; Schwinning, S.; Steidl, R.J.; Woods, S.R. Woody Plant Encroachment: Causes and Consequences. In Rangeland Systems; Briske, D., Ed.; Springer Series on Environmental Management; Springer: Cham, Switzerland, 2017; pp. 25–84. [Google Scholar] [Green Version]
- Sankaran, M.J.; Hanan, N.P.; Scholes, R.J.; Ratnam, J.; Augustine, D.J.; Cade, B.S.; Gignoux, J.; Higgins, S.I.; Le Roux, X.; Ludwig, F.; et al. Determinants of woody cover in African savannas. Nature 2005, 438, 846. [Google Scholar] [CrossRef]
- Ward, D. Do we understand the causes of bush encroachment in Africa savannas? Afr. J. Range Forage Sci. 2005, 22, 101–105. [Google Scholar] [CrossRef]
- Fensham, R.J.; Fairfax, R.J.; Archer, S.R. Rainfall, land use and woody vegetation cover change in semi-arid Australian savanna. J. Ecol. 2005, 93, 596–606. [Google Scholar] [CrossRef]
- Kraaij, T.; Ward, D. Effects of rain, nitrogen, fire and grazing on tree recruitment and early survival in bush-encroached savanna, South Africa. Plant Ecol. 2006, 186, 235–246. [Google Scholar] [CrossRef]
- Yang, X.; Crews, K.A.; Yan, B. Analysis of the pattern of potential woody cover in Texas savanna. Int. J. Appl. Earth Obs. Geoinform. 2016, 52, 527–531. [Google Scholar] [CrossRef] [Green Version]
- Joubert, D.F.; Smit, G.N.; Hoffman, M.T. The influence of rainfall, competition and predation on seed production, germination and establishment of an encroaching Acacia in an arid Namibian savanna. J. Arid Environ. 2013, 91, 7–13. [Google Scholar] [CrossRef]
- Kulmatiski, A.; Beard, K.H. Woody plant encroachment facilitated by increased precipitation intensity. Nat. Clim. Chang. 2013, 3, 833. [Google Scholar] [CrossRef]
- Mistry, J.; Beraldi, A. World Savannas: Ecology and Human Use; Routledge: London, UK, 2014. [Google Scholar]
- Seymour, C.L. Grass, rainfall and herbivores as determinants of Acacia eriobola (Meyer) recruitment in an African savanna. Plant Ecol. 2008, 197, 131–138. [Google Scholar] [CrossRef]
- Walter, H. Die Verbuschung, eine Ercheinung der subtropischen savannengebiete, und ihre ökologischen ursachen. Vegetatio 1954, 5, 6–10. [Google Scholar] [CrossRef]
- Skarpe, C. Shrub layer dynamics under different herbivore densities in arid savanna, Botswana. J. Appl. Ecol. 1990, 27, 873–885. [Google Scholar] [CrossRef]
- Perkins, J.; Thomas, D. Spreading deserts or spatially confined environmental impacts? Land degradation and cattle ranching in the Kalahari desert of Botswana. Land Degrad. Dev. 1993, 4, 179–194. [Google Scholar] [CrossRef]
- Holdo, R.M. Revisiting the two-layer hypothesis: Coexistence of alternative functional rooting strategies in savannas. PLoS ONE 2013, 8, e69625. [Google Scholar] [CrossRef]
- Brown, J.R.; Archer, S. Shrub invasion of grassland: Recruitment is continuous and not regulated by herbaceous biomass or density. Ecology 1999, 80, 2385–2396. [Google Scholar] [CrossRef]
- Wiegand, K.; Ward, D.; Saltz, D. Multi-scale patterns and bush encroachment in an arid savanna with a shallow soil layer. J. Veg. Sci. 2005, 16, 311–320. [Google Scholar] [CrossRef]
- Angassa, A.; Oba, G. Herder perceptions on impacts of range enclosures, crop farming, fire ban and bush encroachment on the rangelands of Borana, southern Ethiopia. Hum. Ecol. 2008, 36, 201–215. [Google Scholar] [CrossRef]
- Eldridge, D. Trampling of microphytic crusts on calcareous soils, and its impact on erosion under rain-impacted flow. Catena 1998, 33, 221–239. [Google Scholar] [CrossRef]
- Thomas, A.D. Impact of grazing intensity on seasonal variations in soil organic carbon and soil CO2 efflux in two semiarid grasslands in southern Botswana. Philos. Trans. R. Soc. B Biol. Sci. 2012, 367, 3076–3086. [Google Scholar] [CrossRef]
- Dougill, A.J.; Thomas, A.D. Kalahari sand soils: Spatial heterogeneity, biological soil crusts and land degradation. Land Degrad. Dev. 2004, 15, 233–242. [Google Scholar] [CrossRef]
- Wang, L.; D’Odorico, P.; Manzoni, S.; Porporato, A.; Macko, S. Soil carbon and nitrogen dynamics in southern African savannas: The effect of vegetation-induced patch-scale heterogeneities and large scale rainfall gradients. Clim. Chang. 2009, 94, 63–74. [Google Scholar] [CrossRef]
- O’Halloran, L.R.; Shugart, H.H.; Wang, L.; Caylor, K.K.; Ringrose, S.; Kgope, B. Nutrient limitations on aboveground grass production in four savanna types along the Kalahari Transect. J. Arid Environ. 2010, 74, 284–290. [Google Scholar] [CrossRef]
- Dougill, A.J.; Thomas, D.S.; Heathwaite, A.L. Environmental change in the Kalahari: Integrated land degradation studies for nonequilibrium dryland environments. Ann. Assoc. Am. Geogr. 1999, 89, 420–442. [Google Scholar] [CrossRef]
- Berkeley, A.; Thomas, A.D.; Dougill, A.J. Cyanobacterial soil crusts and woody shrub canopies in Kalahari rangelands. Afr. J. Ecol. 2005, 43, 137–145. [Google Scholar] [CrossRef]
- Stringer, L.; Reed, M. Land degradation assessment in southern Africa: Integrating local and scientific knowledge bases. Land Degrad. Dev. 2007, 18, 99–116. [Google Scholar] [CrossRef]
- Higgins, S.I.; Bond, W.J.; Trollope, W.S. Fire, resprouting and variability: A recipe for grass-tree coexistence in savanna. J. Ecol. 2000, 88, 213–229. [Google Scholar] [CrossRef]
- van Wilgen, B.W.; Trollope, W.S.; Biggs, H.C.; Potgieter, A.; Brockett, B.H. Fire as a driver of ecosystem variability. In The Kruger Experience: Ecology and Management of Savanna Heterogeneity; Island Press: Washington, DC, USA, 2003. [Google Scholar]
- Sankaran, M.J.; Ratnam, J.; Hanan, N.P. Tree-grass coexistence in savannas revisited—Insights from an examination of assumptions and mechanism invoked in existing models. Ecol. Lett. 2004, 7, 480–490. [Google Scholar] [CrossRef]
- Trollope, W. Controlling bush encroachment with fire in the savanna areas of South Africa. Proc. Annu. Congr. Grassl. Soc. S. Afr. 1980, 15, 173–177. [Google Scholar] [CrossRef]
- Van der Walt, P.T.; Le Riche, E.A.N. The influence of veld fire on an Acacia eriobola community in the Kalahari Gemsbok National Park. Koedoe 1984, 27, 103–106. [Google Scholar] [CrossRef]
- Seymour, C.L.; Huyser, O. Fire and the demography of camelthorn (Acacia eriobola Meyer) in the southern Kalahari—Evidence for a bonfire effect? Afr. J. Ecol. 2008, 46, 594–601. [Google Scholar] [CrossRef]
- Bond, W.; Midgley, G.; Woodward, F. The importance of low atmospheric CO2 and fire in promoting the spread of grasslands and savannas. Glob. Chang. Biol. 2003, 9, 973–982. [Google Scholar] [CrossRef]
- Mouillot, F.; Field, C.B. Fire history and the global carbon budget: A 1x1 fire history reconstruction for the 20th Century. Glob. Chang. Biol. 2005, 11, 398–420. [Google Scholar] [CrossRef]
- Joubert, D.F.; Smit, G.N.; Hoffman, M.T. The role of fire in preventing transitions from a grass dominated state to a bush thickened state in arid savannas. J. Arid Environ. 2012, 87, 1–7. [Google Scholar] [CrossRef]
- Lomolino, M.V. A call for a new paradigm of island biogeography. Glob. Ecol. Biogeogr. 2000, 9, 1–6. [Google Scholar] [CrossRef]
- Marquet, P.A.; Fernández, M.; Navarrete, S.A.; Valdovinos, C. Diversity emerging: Toward a deconstruction of biodiversity patterns. In Frontiers of Biogeography: New Directions in the Geography of Nature; Lomolino, M.V., Heaney, L.R., Eds.; Sinauer Associates Inc Publishers: Sunderland, MA, USA, 2004; pp. 191–209. [Google Scholar]
- Joubert, D.F.; Rothauge, A.; Smit, G.N. A conceptual model of vegetation dynamics in the semiarid Highland savanna of Namibia, with particular reference to bush thickening by Acacia mellifera. J. Arid Environ. 2008, 72, 2201–2210. [Google Scholar] [CrossRef]
- Hijmans, R.J.; Cameron, S.E.; Parra, J.L.; Jones, P.G.; Jarvis, A. Very high resolution interpolated climate surfaces for global land areas. Int. J. Climatol. 2005, 25, 1965–1978. [Google Scholar] [CrossRef]
- Krebs, C.J. Ecological Methodology; Addison Welsey Educational Publishers: Menlo Park, CA, USA, 1999. [Google Scholar]
- Palgrave, K.C. Trees of Southern Africa; Struik, C., Ed.; Penguin Random House South Africa: Cape Town, South Africa, 1977. [Google Scholar]
- Meyer, T.; D’Odorico, P.; Okin, G.S.; Shugart, H.H.; Caylor, K.K.; O’Donnell, F.C.; Bhattachan, A.; Dintwe, K. An analysis of structure: Biomass structure relationships for characteristic species of the western Kalahari, Botswana. Afr. J. Ecol. 2013, 52, 20–29. [Google Scholar] [CrossRef]
- DSM. Digital Atlas of Botswana. In DOSA Mapping; Gabarone, Botswana, 2003. [Google Scholar]
- Giglio, L.; Loboda, T.; Roy, D.P.; Quayle, B.; Justice, C.O. An active-fire based burned area mapping algorithm for the MODIS sensor. Remote Sens. Environ. 2009, 113, 408–420. [Google Scholar] [CrossRef]
- Land Processing Distributed Active Archive Center (LP DAAC). MODIS/Terra and Aqua Burned Area Monthly L3 Global 500m SIN Grid V006, NASA EOSDIS Land Processes DAAC, USGS/Earth Resources Observation and Science (EROS) Center, Siox Falls, South Dakota (https://lpdaac.usgs.gov). Available online: https://lpdaac.usgs.gov/dataset discovery/modis/modis products table/mcd64a1v006 (accessed on 23 January 2018).
- Craig, G.C. Department of Wildlife and National Parks. Animal Distribution, Numbers and Trends in the Kalahari Ecosystem 1989–2005; Department of Wildlife and National Parks: Gaborone, Botswana, 2010. [Google Scholar]
- Department of Water Affairs. Boreholes; Department of Water Affairs: Maun, Botswana, 2000.
- R Core Team. R: A Language and Environment for Statistical Computing; R Foundation for Statistical Computing: Vienna, Austria, 2013; Available online: https://www.R-project.org/ (accessed on 1 February 2019).
- Peterson, E. Estimating cover of an invasive grass (Bromus tectorum) using tobit regression and phenology derived from two dates of Landsat ETM+ data. Int. J. Remote Sens. 2005, 26, 2491–2507. [Google Scholar] [CrossRef]
- Osgood, D.W.; Finken, L.L.; McMorris, B.J. Analyzing multiple-item measures of crime and deviance II: Tobit regression analysis of transformed scores. J. Quant. Criminol. 2002, 18, 319–347. [Google Scholar] [CrossRef]
- Laue, J.E.; Arima, E.Y. Spatially explicit models of land abandonment in the Amazon. J. Land Use Sci. 2016, 11, 48–75. [Google Scholar] [CrossRef]
- Tobin, J. Estimation of relationships for limited dependent variables. Econ. J. Econ. Soc. 1958, 26, 24–36. [Google Scholar] [CrossRef]
- Henningsen, A. CensReg: Censored Regressions (Tobit) Models. R Package Version 0.5-26. Available online: https://CRAN.R-project.org/package=censReg (accessed on 2 February 2019).
- Henningsen, A.; Toomet, O. maxLik; A package for maximum likelihood estimation in R. Comput. Stat. 2011, 26, 443–458. [Google Scholar] [CrossRef]
- White, M.A.; Asner, G.P.; Nemani, R.; Privette, J.L.; Running, S.W. Measuring fractional cover and leaf area index in arid ecosystems: Digital camera, radiation transmittance and laser altimetry methods. Remote Sens. Environ. 2000, 74, 45–57. [Google Scholar] [CrossRef]
- Ward, D.; Esler, K.J. What are the effects of substrate and grass removal on recruitment of Acacia mellifera seedlings in a semi-arid environment. Plant Ecol. 2011, 212, 245–250. [Google Scholar] [CrossRef]
- Le Houérou, H.N.; Corra, M. Some browse plants of/ethiopia. In Browse in Africa; Le Houérou, H.N., Ed.; ILCA: Addis Abada, Ethiopia, 1980; pp. 109–114. [Google Scholar]
- Moleele, N.; Perkins, J.S. Encroaching woody plant species and boreholes: Is cattle density the main driving factor in the Olifants Drift communal grazing lands, south-eastern Botswana? J. Arid Environ. 1998, 40, 245–253. [Google Scholar] [CrossRef]
- Dublin, H.T.; Sinclair, A.R.E.; McGlade, J. Elephants and fire as causes of multiple stable states in the Serengeti-Mara woodlands. J. Anim. Ecol. 1990, 59, 1147–1164. [Google Scholar] [CrossRef]
- Anderies, J.M.; Janssen, M.A.; Walker, B.H. Grazing, management, resilience and the dynamics of fire-driven rangeland system. Ecosystems 2002, 5, 23–44. [Google Scholar] [CrossRef]
- D’Odorico, P.; Laio, F.; Ridolfi, L. A probabilistic analysis of fire-induced tree-grass coexistence in savannas. Am. Nat. 2006, 167, E79–E87. [Google Scholar] [CrossRef]
- Twomey, M.; Brodte, E.; Ute, J.; Brose, U.; Crowe, T.P.; Emmerson, M.C. Idiosyncratic species effects confound size-based predictions of responses to climate change. Philos. Trans. R. Soc. B Biol. Sci. 2012, 367, 2971–2978. [Google Scholar] [CrossRef] [Green Version]
- Mutuku, P.M.; Kenfack, D. Effect of local topographic heterogeneity on tree species assembly in an Acacia-dominated African savanna. J. Trop. Ecol. 2019, 35, 46–56. [Google Scholar] [CrossRef]
- Joubert, D.F.; Zimmermann, I. The potential impacts of wood harvesting of bush thickening species on biodiversity and ecological processes. Proc. Natl. For. Res. Work. Wind. Namibia 2002, 2, 67–98. [Google Scholar]
- Legendre, P. Spatial Autocorrelation: Trouble or New Paradigm? Ecology 1993, 74, 1659–1673. [Google Scholar] [CrossRef]
- Keitt, T.H.; Bjornstad, O.N.; Dixon, P.M.; Citron-Pousty, S. Accounting for spatial pattern when modeling organism-environmental interactions. Ecography 2002, 25, 616–625. [Google Scholar] [CrossRef]
- Miller, J.A.; Franklin, J.; Aspinall, R. Incorporating spatial dependence in predictive vegetation models. Ecol. Model. 2007, 202, 225–242. [Google Scholar] [CrossRef]
- Holloway, P.; Miller, J.A. Exploring Spatial Scale, Autocorrelation and Nonstationarity of Bird Species Richness Patterns. Int. J. Geo Inf. 2015, 4, 783–798. [Google Scholar] [CrossRef] [Green Version]


| Variable | Description | Source |
|---|---|---|
| Mean Annual Precipitation | We derived mean annual precipitation (MAP) from the isopleth vector data representing rainfall conditions across the Kalahari. | [56] |
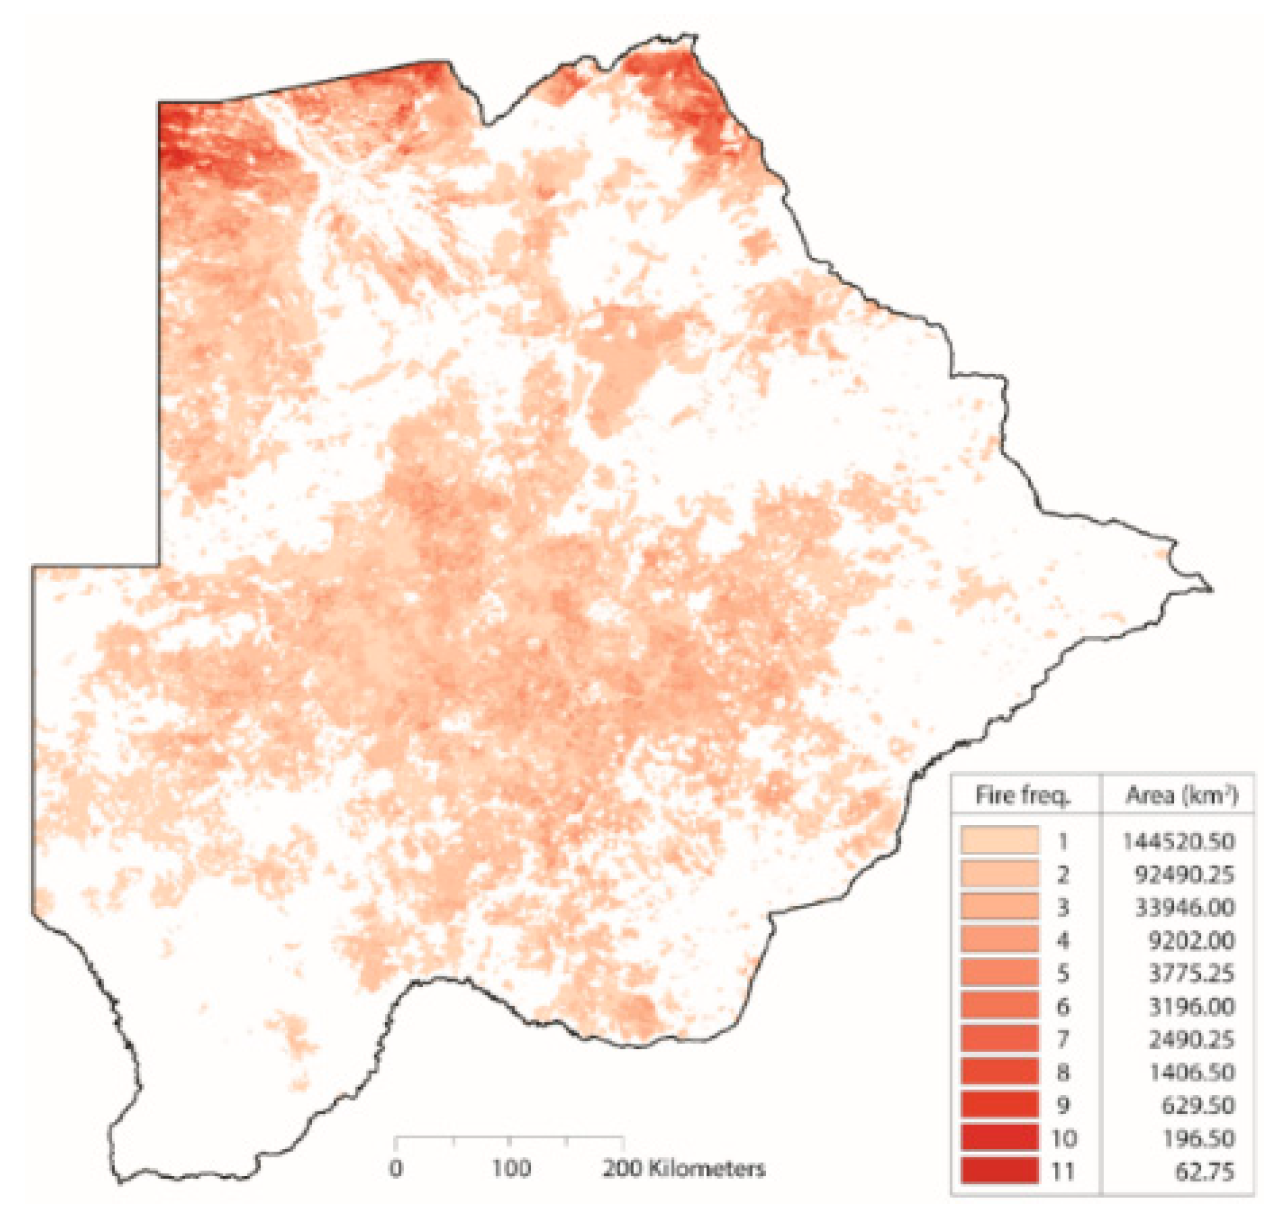
| Fire Frequency | We derived fire frequency using the MODIS direct broadcast burned area product (MCD64A1) as described in Giglio et al. [57]. Fire frequency product and generation outlined in Appendix A. | [58] |
| Grazing | We identified density of cattle using the latest available Department of Wildlife and National Parks aerial counts of wildlife. This survey was conducted during the dry season of 2005. | [59] |
| Borehole Density | We counted the number of boreholes within an eight-kilometer (based on Dougill et al. [37]) radius. | [60] |
| Total SR | Total AB | MG I SR | MG I AB | MG II SR | MG II AB | MG III SR | MG III AB | MG IV SR | MG IV AB | |
|---|---|---|---|---|---|---|---|---|---|---|
| Regression | T | T | T | P | T | P | T | P | P | P |
| AIC | 319.72 | 597.98 | 218.54 | 398.95 | 223.60 | 588.33 | 226.76 | 450.45 | 126.61 | 488.37 |
| Intercept | 5.66 ** | 20.05 ** | 0.92 ** | −1.81 | 1.18 ** | −0.05 | 1.00 | 0.34 | −40.69 | −4.67 |
| PPT | 1.32 ** | 11.07 ** | −0.40 ** | 1.71 ** | 3.51 ** | 2.36 ** | 0.92 ** | −0.01 | −27.03 | −4.32 |
| Boreholes | −0.57 ** | −1.85 ** | −0.31 | 4.06 ** | −1.65 ** | −3.24 ** | −2.78 ** | −2.51 ** | 51.60 | −0.04 |
| Livestock | −12.97 | 1.14 ** | 2.04 ** | 1.62 ** | 1.87 ** | −132.0 | −10.02 | |||
| Fire | −3.16 ** | −0.20 | −9.96 | −0.60 ** | −0.61 ** | 0.39 | −14.52 | 0.13 | ||
| PPT * Boreholes | 0.56 ** | 5.80 ** | −2.83 ** | 56.83 | ||||||
| PPT * Livestock | −2.59 ** | 4.17 ** | 2.37 ** | 0.79 | 1.68 ** | −109.8 | −8.30 | |||
| PPT * Fire | −0.46 ** | 0.28 | 0.29 ** | −2.44 | ||||||
| Boreholes * Livestock | −5.05 ** | 1.86 ** | 1.31 | 2.82 ** | ||||||
| Boreholes * Fire | −0.76 | 1.19 | −27.79 | |||||||
| Livestock * Fire | −18.08 | |||||||||
| logSigma | 0.57 ** | 2.28 ** | −0.01 | 0.27 ** | 0.07 |
© 2019 by the authors. Licensee MDPI, Basel, Switzerland. This article is an open access article distributed under the terms and conditions of the Creative Commons Attribution (CC BY) license (http://creativecommons.org/licenses/by/4.0/).
Share and Cite
Meyer, T.; Holloway, P.; Christiansen, T.B.; Miller, J.A.; D’Odorico, P.; Okin, G.S. An Assessment of Multiple Drivers Determining Woody Species Composition and Structure: A Case Study from the Kalahari, Botswana. Land 2019, 8, 122. https://0-doi-org.brum.beds.ac.uk/10.3390/land8080122
Meyer T, Holloway P, Christiansen TB, Miller JA, D’Odorico P, Okin GS. An Assessment of Multiple Drivers Determining Woody Species Composition and Structure: A Case Study from the Kalahari, Botswana. Land. 2019; 8(8):122. https://0-doi-org.brum.beds.ac.uk/10.3390/land8080122
Chicago/Turabian StyleMeyer, Thoralf, Paul Holloway, Thomas B. Christiansen, Jennifer A. Miller, Paolo D’Odorico, and Gregory S. Okin. 2019. "An Assessment of Multiple Drivers Determining Woody Species Composition and Structure: A Case Study from the Kalahari, Botswana" Land 8, no. 8: 122. https://0-doi-org.brum.beds.ac.uk/10.3390/land8080122