Article

Interactive Relationship among Urban Expansion, Economic Development, and Population Growth since the Reform and Opening up in China: An Analysis Based on a Vector Error Correction Model

1
Institute of Ecological Civilization, Jiangxi University of Finance and Economics, Nanchang 330013, China
2
School of Tourism and Urban Management, Jiangxi University of Finance and Economics, Nanchang 330032, China
*
Author to whom correspondence should be addressed.
Submission received: 26 September 2019 / Revised: 14 October 2019 / Accepted: 15 October 2019 / Published: 17 October 2019

Abstract

:
Based on cointegration analysis, a vector error correction model (VECM), and the impulse response function method, this paper empirically analyses the interaction among urban expansion, economic development, and population growth in China from 1980 to 2016. The results show that (I) there is a long-term equilibrium relationship among urban expansion, economic development and population growth, but there is an imbalance in the short term. When urban expansion deviates from the long-term equilibrium, it cannot be restored to equilibrium in the short term. However, when economic development and population growth deviate from equilibrium, they will adjust back to equilibrium with strengths of −0.1770 and −0.0217, respectively. (II) From the results of the impulse response, there is an interactive statistical relationship between urban expansion, economic development, and population growth; In the short term, both economic development and population growth will cause urban expansion. In the long term, economic development will inhibit urban expansion, and economic development will be less dependent on land. Also, population growth has a long-lasting positive effect on urban expansion. (III) The results of variance decomposition show that urban expansion and economic development were most affected by the structural impact of population growth, and the relative variance contribution (RVC) rate was stable at 29.2% and 42%, respectively. However, economic development contributes the least to the RVC of urban expansion and population growth, and only stabilizes at 12.3% and 8.0% after 30 periods. Finally, the paper proposes that the Chinese government should maintain stable and healthy economic growth and promote sustainable land use in terms of improving land use efficiency, improving human capital levels, and promoting industrial structure.

1. Introduction

1.1. Research Background and Significance

Land is the spatial carrier of urban populations and socioeconomic and ecological environments [1]. Due to the continuous expansion of the urban economy and a growing population, China has one of the highest urbanization rates in the world [2]. At the beginning of the reform and opening up, China’s urbanization rate was less than 20%. After more than 40 years of development, the urbanization rate reached 57.35% in 2016. However, the scarcity of land resources has made it impossible to meet the land demands of China’s rapid urbanization without imposing some restrictions. Therefore, the contradiction between urban expansion and land resource scarcity is becoming increasingly prominent [3].
Rapid urban expansion often has a violent impact on the regional landscape, mainly due to the conversion of a large amount of agricultural land into construction land and other urban land types [4]. The disorderly spread of urban construction creates a series of social, economic, and ecological problems that threaten the sustainable development of urban areas: (I) construction land invades large areas of farmland, seriously threatening the stable supply of food [5]; (II) problems such as unreasonable compensation during the process of land acquisition and demolition may easily create dissatisfaction among land-lost farmers, thereby increasing social instability [6]; (III) inefficient use of construction land has intensified traffic congestion and air pollution, putting tremendous pressure on regional resources and the ecological environment [7,8]. Although the Chinese government has repeatedly introduced macro-control policies intended to curb disorderly urban expansion and promote land-intensive conservation and utilization, China is currently in a critical period of urbanization and industrialization, and continued urban expansion is inevitable. Therefore, to reduce the negative effects caused by urban expansion and guide rational urban expansion, it is necessary to thoroughly analyze the causes of urban expansion. This analysis is essential if the government is to formulate effective land management policies and successfully implement macroeconomic regulation and control [9].
In urban expansion, the social economy plays a leading role [10]. As a main carrier of urban development, construction land is the main driving force for urban economic growth in a certain stage. Rapid urban expansion has generated a large amount of financial funding for local governments, which has helped the government improve urban infrastructure and support urbanization. At the same time, this funding has also helped local governments to promote local industry and economic development by implementing low-cost land policies to attract investment [11]. It can be seen that, in the initial stage of economic development of China, a fixed path of urban economic growth over-reliance on urban expansion has been formed. However, with the continuous adjustment of the industrial structure, land use structure, and model of China have undergone tremendous changes, and in some areas there has been a phenomenon of urban expansion and economic development has not synchronized [12]. Therefore, the current causal relationship between urban expansion and economic growth is still unclear. On the other hand, the relationship between urban expansion and population growth has also become the focus of academic attention. Since the reform and opening up, China has entered a stage of rapid urbanization, and the increase of urban population has become an important factor in urban expansion and land use structure change. The city-building movement led by local government has promoted the transfer of agricultural population to cities to a certain extent. However, due to the lack of supporting policies such as industry, social security, housing, education, and medical care, the urbanization of the agricultural population has not been effectively realized as the urban land has been greatly expanded. In the end, the coordinated development of land urbanization and population urbanization was not realized. In addition, there is a two-way relationship between population growth and economic development. Neglecting this relationship tends to overestimate the role of population growth in economic development. However, there is currently little literature on the interaction between the two.
The time series used in economic research are mostly non-stationary sequences. The VECM model can model non-stationary sequences with cointegration relations to characterize the linear adjustment mechanism between economic variables [13]. The VECM model has been widely applied to the study of urban land. For example, Du [14] used the VECM model to explore the interaction between economic development and land urbanization based on panel data of 35 major cities in China from 2003 to 2015. The research results show that economic growth has a positive impact on the quality of land urbanization. However, as time went on, the impact was weakened. Narayan [15] used the VECM model to explore the causal relationship between economic growth and urbanization in India using data from the World Development Indicators for the period 1963–2013. The research results show that economic growth has a promoting effect on urbanization. However, urbanization does not promote economic growth. From the above analysis, the past scholars only explored the relationship between economic growth and urban expansion by constructing VECM model. There is a lack of empirical testing and analysis of systems consisting of urban expansion, economic development, and population growth.
Since the reform and opening-up, the economy of China has developed rapidly. As a concentration of population and socio-economic activities, the city is a type of land use that is most strongly influenced by human intervention and dominated by the artificial environment. Under the interaction of various factors such as population, economy, social system, and natural environment, the changes in urban construction land show the characteristics of complex systems. In view of this, based on theoretical analysis, this paper studies the interaction between urban expansion, economic development, and population growth since reform and opening up of China by constructing the VECM model. This is of great significance for promoting urban land intensive use, urban smart growth, and regional sustainable development.

1.2. Literature Review

1.2.1. Literature Review of the Interactive Relationship between Urban Expansion and Economic Development

The academic research on the driving forces of urban expansion falls into three main categories: (I) socioeconomic factors such as urban population growth, economic growth, industrial development, foreign investment and government institutional policies [16,17]; (II) accessibility factors such as the distance to the administrative center, distance to subway stations, distance to the main river and distance to the road network [18,19]; and (III) natural environmental factors such as slope, altitude, and soil quality [20]. The results of widespread research indicate that urban population growth and economic development are the main drivers of urban expansion. The expansion of construction land is closely related to the size of the regional economy and shows a strong statistical correlation with economic growth. Most of the research focuses on the impact of economic growth rates and economic structural changes on urban expansion. For example, Deng conducted an empirical analysis of China’s county-level panel data based on spatial statistical analysis tools [21]. The results of the study show that every 10% increase in GDP will cause an urban expansion increase of 3%, and economic structural changes will also have a certain impact on urban expansion. Tan conducted a study on construction land expansion and the loss of cultivated land in the Beijing–Tianjin–Hebei region and found that cities of different grades have large differences in urban development (urban expansion speed and urban per-capita land growth rate). The main influencing factor on urban expansion is the economic growth rate. Tan also found that China’s strict household registration system and urban development planning have both hindered the transfer of populations to large and medium-sized cities, leading to the rapid expansion of the scale of construction in small cities [22].
At the same time, some scholars believe that urban expansion will have a profound impact on the social economy. The reason is that the speed and orientation of urban expansion are not only related to the level and quality of urbanization but also important to the change in modes of economic growth and the adjustment of regional development strategies. Urban expansion lays the foundation for more capital and industrial agglomeration and pushes the boundaries of production functions outwards, thereby increasing the total productivity level of the city. For example, Abdullah believes that in the era of globalization, Malaysia is an emerging urbanizing country, and the regional government is prioritizing the economic competitiveness of the country’s cities. Major metropolitan areas in Malaysia are showing continued expansion, and most of the new development projects are located in the surrounding areas of the city, thereby promoting the level of socioeconomic development and the progress of culture while also improving the overall competitiveness of the country. This observation shows that there is a close relationship between urban expansion and economic development [23] and that urban expansion and economic development are mutually causal. However, the interaction between the two is rarely discussed in the current literature.

1.2.2. Literature Review of the Interactive Relationship between Urban Expansion and Population Growth

At present, the speed of urban expansion in China far exceeds the population growth rate, and the extensive and disorderly use of land is a major problem. The imbalance between land urbanization and population urbanization has aggravated the contradiction between the protection of cultivated land and urban expansion, which has revealed many hidden dangers threatening further urbanization. Current research on urban expansion and population growth focuses on the following: (I) considering population growth as the main driver of urban expansion or studying the role of urban expansion in promoting population non-agriculturalization. As Yang found, as of the end of 2011, China’s population urbanization rate exceeded 50%. If the growth rate remains unchanged for the next 20 years, 13- to 15-million square kilometers of agricultural land will be converted into urban land [24]. (II) From the perspective of urbanization, the degree of coordination between population urbanization and land urbanization is evaluated in order to classify the type of coordinated development occurring; or, from the perspective of influencing factors, researchers study the reasons for the differences between population urbanization and land urbanization. For example, Chen noted that the promotion of new urbanization is important to China’s modernization under the National New Urbanization Plan (2014–2020). China has promoted the citizenization of migrant workers by reforming the household registration system in the pilot province of Anhui Province and has made progress. However, the rapid rise in housing prices has become the main hindrance to the coordinated development of urbanization [25]. The results of prior research have guiding significance for promoting population urbanization and land urbanization, but the specific manifestations and mechanisms of interaction between land expansion and population growth are not clear.

1.2.3. Literature Review of the Interactive Relationship between Economic Development and Population Growth

There are regional differences in China’s economic growth, showing a gradient from east to west. China’s population distribution is extremely uneven; it has been characterized as the coexistence of three dense areas and three sparsely populated ones. That is, the eastern coastal areas are dense, and the central and western areas are sparse. Cities are dense, but the countryside is sparse. Rural economically developed areas are dense, and poor areas are sparse. At present, research on the relationship between population and the economy mainly focuses on (I) the impact of population structure on economic growth, including the age structure of the population and the impact of human capital on economic growth. For example, Golini studied the reasons for the low economic growth rate in European countries and found that the increase in the proportion of dependents has a significant negative impact on economic growth [26]. Fleisher argues that increasing investment in human capital in China’s interior will promote the improvement of total factor productivity in the region. (II) The impact of economic growth on population migration [27]. For example, Zhang argues that from the perspective of population migration, economic growth will lead to population migration, rather than population migration promoting economic growth [28]. Is there an interaction between economic development and population growth? At present, few studies have attempted to answer this question.
From the literature review, it can be seen that scholars have not reached consensus on the relationship among urban expansion, economic development, and population growth, and research combining the three is rare. Therefore, based on the above theoretical analysis, this study uses the Chinese 1981–2016 annual time series data to test the cointegration relationship among urban expansion, economic development, and population growth based on the vector autoregressive model (VAR). Accordingly, a VECM model is constructed. Based on the VECM model, the impulse response function is used to analyze the long-term interaction among the three. Finally, the variance decomposition technique is used to examine the relative importance of the three factors in explaining changes in the others. In this way, we study the dynamic relationship among urban expansion, economic development and population growth.

2. Theoretical Model

2.1. Interactive Relationship between Urban Expansion and Economic Development

2.1.1. Main Influence Paths of Urban Expansion

The main influence paths of urban expansion on the quality of economic growth include: (I) the transformation of land use structure. Urban land is an indispensable material foundation for all sectors of the national economy. Differences in the quantity and quality of urban land and its allocation among different industrial sectors will have different effects on the economic development of a city. Modern economic growth is a structurally dominant type of growth [29], and land use change can promote a qualitative shift in industrial structure. Due to the differential incomes of different types of land, the economic benefits of agricultural land are generally lower than those of commercial land or industrial land [30]. Therefore, urban expansion often triggers changes from primary industrial land to secondary and tertiary industrial land. Clearly, urban expansion is an important force driving the upgrading of industrial structure and is conducive to the improvement of the quality of regional economic growth. (II) Changes in the ecological environment. The rapidly expanding urban system and the ecological environment have not undergone mutual adaptation, resulting in an imbalance between the two systems. Urban expansion affects the physiological and ecological conditions, structural composition, and spatial pattern of surface ecological elements by changing the material composition and characteristics of the underlying surface [31], which in turn has a major impact on the quality of the ecological environment. This impact mainly includes urban vegetation changes [32], atmospheric environmental crises [33], heat island effects [34], water pollution [35], and soil carbon cycles [36]. If the destruction of the ecological environment caused by urban expansion is included in the quality assessment system of economic growth as an unexpected output, urban expansion will significantly reduce the quality level of economic growth [37] (see Figure 1).
Since reform and opening up, GDP of China has maintained a high growth rate. In the early stage of reform and opening up, land as an indispensable factor of production and a carrier of social, economic, cultural, and other activities became an important factor affecting economic growth of China during the transition period. Urban expansion in the initial stage is conducive to improving the regional agglomeration economic effects and the level of economies of scale, thereby promoting the quality of economic development. However, with the disorderly expansion of the city and the continuous expansion of the construction land area, urban land has broken through the optimal economies of scale state. As a result, the land input factors are redundant, and the ratio between land, capital and labor factors is not optimal. Also, due to the rapid increase in management, transportation, and environmental costs, the efficiency of regional scale will decline, which in turn will reduce the quality of regional economic development. On the other hand, along with the transformation of the economic structure, the theoretical importance of land elements to economic growth has gradually declined. Economic development of China is affected by the macroeconomic environment, government policies, and industrial structure optimization, which in turn makes economic development less dependent on urban expansion.

2.1.2. Role of Social Economy in Expansion of Construction Land

In the process of the expansion of construction land, the social economy plays a leading role. At different stages of development, regional economies have different levels of technology, different industrial characteristics, and different forces motivating economic development. Land is an important foundation and condition for regional industry and economic development, and the quality of economic growth has a significant impact on urban expansion. Since reform and opening up, land use change has different characteristics in different stages of economic development. Due to the existence of industrial structure evolution rules and the differences in land demand between different industrial structures, land resource conditions, macro social and economic environment and land management policies are also different. As a result, the degree of impact of economic development on urban land expansion is also different. Therefore, it is necessary to analyze the urban expansion in different stages of economic development. This can avoid the stage difference of driving mechanism concealed by the overall analysis. This is also conducive to the Chinese government to adopt differentiated land use and management policies to provide decision support for guiding the rational expansion of urban land use. The theoretical explanation of the impact of economic development on urban expansion revolves around three aspects: scale effect, structural effect, and elimination effect: (I) The scale effect. The improvement of technical efficiency is achieved through economies of scale and the improvement of management; such efficiency promotes the intensive use of urban land, thus effectively suppressing urban expansion. (II) The structural effect. This refers to the transformation of the land use pattern and the optimization of industrial structure to promote the healthy growth of the economy and to some extent alleviate the dependence of economic development on urban expansion, thus slowing down the speed of urban expansion. (III) The elimination effect. In the early stages of economic development, land served as a tool for GDP competition among local governments. Local governments tend to develop real estate and industry that produce local fiscal revenues, thereby increasing the frequency and scale of land exploitation. In the future, the government can regulate the size of the city by delineating urban growth boundaries, implementing space-control planning, and establishing urban development rights. Therefore, the elimination effect can inhibit urban expansion.

2.2. Interactive Relationship between Urban Expansion and Population Growth

The growth of urban population size is the most direct driving force behind urban land expansion [38]. Urban population growth has driven the construction of urban housing, commerce, industry, and transportation, thus accelerating the process of urban expansion [39]. On the other hand, the expansion of urban land to environmentally sensitive agricultural land on the edge of the city has caused a large number of land-lost farmers to passively flood into the city. Moreover, in 2000, to accelerate the process of industrialization and urbanization, China launched a boom in urban construction by promoting new urban areas, development zones, industrial zones, and university towns across the country. While industry has led to agglomeration, it has also promoted major growth in urban space and population. At the same time, in the face of the gradual expansion of urban built-up areas, it is necessary to increase investment in urban fixed assets (such as urban construction and industrial infrastructure). Compared with the relatively backward rural areas, the city’s new infrastructure, convenient communication conditions, good medical care, and sanitary conditions all create a strong pull on the agricultural population. Thus, urban expansion and population growth have a mutually causal relationship.

2.3. Interactive Relationship between Economic Development and Population Growth

At present, the academic literature has reached consensus on the relationship between population growth and economic development. Many scholars have verified—from both theoretical and empirical perspectives—that population factors have a positive effect on economic growth. The role of population in promoting economic development can be summarized using three categories:
(I) Research on the interaction between human capital and economic development. Human capital acts on economic development mainly through three channels. First, human capital itself directly promotes economic development as an input factor. That is, the knowledge spillover of human capital and the complementarity of factors can improve labor productivity. Second, human capital promotes economic growth by promoting technological progress and improving production efficiency; that is, by indirectly promoting economic growth by influencing economic development activities [40,41]. Third, the improvement in the health of human capital brought about by improved food security and nutrition not only improves the proportion of workers in the total population but also promotes improved labor intensity or labor productivity, thus promoting economic development. After the reform and opening up, China began to implement the ‘one child’ policy. The population accumulation pattern has changed from the stage of “high fertility rate, high mortality rate, low growth rate” to “low fertility rate, low mortality rate, high growth rate”, and the population dependency ratio has dropped rapidly [42]. As a result, the cost advantage of low-cost labor of China is outstanding. At the same time, with the gradual deepening of market-oriented reforms, the demand for agricultural surplus labor in the private non-agricultural sector is increasing. The overlapping effect of population structure transition and agricultural surplus labor will contribute to the long-term rapid development of economy of China during the 40 years of reform and opening up. With the transfer of labor-intensive industries from developed to developing countries, it has stimulated the latecomer advantage of a populous country like China. Development strategy of China of relying on opening up and export-oriented growth has attracted a large amount of FDI net inflows. As a result, the proportion of trade income has gradually increased. On the other hand, the economic growth of a country or region will greatly promote education and medical advancement in the region, thus enhancing human capital [43].
(II) Research on the relationship between population age structure and economic growth. Overall, the working-age population has a stronger ability to produce and consume. Therefore, economic growth can be promoted by increasing the total factor productivity, capital output rate, human capital level, and population employment rate in the region. Ageing will restrain the consumption demand of the region and cause loss of economic vitality [44].
(III) Research on the interaction between population mobility and economic development. The contribution of population mobility to economic development lies in the effective allocation of labor resources and other economic resources. For example, the transfer of rural surplus labor to secondary and tertiary industries is conducive to raising the income level of farmers, narrowing the gap between urban and rural areas, realizing the smooth flow and rational allocation of labor factors throughout the whole society, and thus producing the remarkable effect of improved economic development. After 1978, China implemented the household contract responsibility system, which promoted the transfer of rural surplus labor to the non-agricultural sector [45]. Along with the continuous deepening of China’s urbanization, the agricultural population has formed an inevitable trend toward urban and secondary and tertiary industries. The huge transfer of agricultural population has formed a huge consumer market and has formed a huge purchasing power. These consumptions have increased the demand for urban consumption and increased the income of urban residents, thus contributing to regional economic development. On the other hand, based on the push–pull theory, rural living areas are poor, the agricultural population is large, agricultural income is low, and the demonstration role of the neighborhood creates a strong external thrust, which promotes the transfer of the agricultural population. Regions with rapid economic growth are characterized by complete infrastructure and high wages, which exert a strong pull on the population. The rural push factor and the urban pull factor together contribute to population growth (see Figure 2).
In summary, this paper argues theoretically that there is an interactive relationship among urban expansion, economic development, and population growth. However, the existing research studies the linear relationship among the three from a static perspective. Few scholars have combined the three factors to study their interaction. Therefore, based on the above theoretical analysis, this study uses an econometric model to answer the following questions:
(1)
Is there a long-term equilibrium relationship among urban expansion, economic development and population growth?
(2)
What is the interactive relationship among urban expansion, economic development, and population growth?
(3)
How can the coordinated development of urban expansion, economic development, and population growth be promoted?

3. Research Method

3.1. VECM Model

According to the conventional method of the VAR model, the stability of each time series variable needs to be checked before the model is built. If some time series variables are not stable, but there is a cointegration relationship, the simple VAR model will lose a large amount of useful information, resulting in errors in the results. Moreover, the VAR model only measures the short-term fluctuation relationship between variables, ignoring the long-term equilibrium relationship, thus affecting the determinable coefficient of the VAR model. It is necessary to transform an unstable time series into a stationary sequence by a differential method to establish a classical regression analysis model. To address this issue, Engle and Granger combined the cointegration and error correction models to establish the VECM model. Currently, the VECM model has become the standard analytical tool for time series measurement [13]. The formulas for the VAR model and the VECM model are as follows:
First, create a V A R ( p ) model:
y t = Φ 1 y t 1 + + Φ p y t p + H x t + ε t
In the formula, t = 1 , 2 , , T ; y t is the model variable; y t p is the p -order lag item of the model variable; Φ p represents the estimated coefficient of y t p ; x t is an exogenous variable; H represents the estimated coefficient of x t ; ε t is a random disturbance project.
If the variable y t in Equation (1) is unstable and there is a cointegration relationship between the variables, then the cointegration change can be used to obtain the VECM model:
Δ y t = α β y t i + i = 1 p 1 Γ i Δ y t i + ε t = α e c m t 1 + i = 1 p 1 Γ i Δ y t i + ε t
In the formula, β y t i = e c m t 1 ; e c m t 1 is an error correction term that reflects the long-term equilibrium relationship between variables.   α is the error correction coefficient, which reflects the speed at which the automatic correction mechanism adjusts the variable to the equilibrium state when the variable deviates from the long-term equilibrium.   Γ i reflects the impact of short-term fluctuations of variables on other variables. The advantage of the cointegration-transformed VECM model is that all variables can be used as endogenous variables, avoiding endogeneity problems. On the other hand, the VECM model can simultaneously estimate the long-term equilibrium relationship between variables and the short-term dynamic error correction process. This paper uses Eviews 10.0 metrology analysis software to consider the interaction mechanism among urban expansion, economic development and population growth from the long-term and short-term perspectives on the basis of cointegration analysis.

3.2. Impulse Response Function

Cointegration analysis only shows whether there is a long-term equilibrium relationship between variables and does not show how the disturbance of a variable affects the whole system or the comprehensive response of each variable on these disturbances. The impulse response function can be used to measure the impact of a standard deviation shock from a random disturbance item on the current and future values of endogenous variables. Therefore, it is possible to more intuitively describe the dynamic interactions and effects between variables in order to obtain information such as the positive and negative direction, adjustment time lag, and stability process of the response generated by the impulse of the system [46]. In this paper, the two-variable impulse response function is taken as an example to illustrate its implementation process. The planning formula is
{ x t = a 1 x t 1 + a 2 x t 2 + b 1 z t 1 + b 2 z t 2 + ε 1 t z t = c 1 x t 1 + c 2 x t 2 + d 1 z t 1 + d 2 z t 2 + ε 2 t
In the formula, t = 1 , 2 , , T ; a i , b i , c i , d i are parameters; Disturbance item ε t = ( ε 1 t ,   ε 2 t ) . Assume that the white noise vector has the following properties:
{ E ( ε i t ) = 0 ,   t   i = 1 , 2 v a r ( ε t ) = E ( ε t ε t ) = { σ i j } ,   t E ( ε i t ε i s ) = 0 ,   t
Assume that the above system starts from t = 0 and sets x 1 = x 2 = z 1 = z 2 = 0 . It is assumed that the disturbance item ε 10 = 1 ,   ε 20 = 0   are set in the zeroth phase, and the subsequent values are all equal to 0. The initial given disturbance item is continuously transmitted in the system. After iterative calculation, the following can be obtained:
x 0 ,   x 1 , x 2 , x 3 ,
This result is called the response function of x caused by the pulse of x . Similarly, the following can be obtained:
z 0 ,   z 1 , z 2 , z 3 ,
This result is called the response function of z caused by the pulse of x . If a disturbance item ε 10 = 0 ,   ε 20 = 1   are given when t = 0 , the response function of z and the response function of x , which are caused by the pulse of z , can be obtained. The above impulse response process can directly capture the effect of the system on a particular pulse.

3.3. Variance Decomposition

The impulse response function is able to capture the dynamic influence path of a variable’s impulse on other variables. The purpose of variance decomposition is to analyze the contribution of each structural pulse to changes in endogenous variables (usually expressed in terms of variance). Therefore, the relative importance of different structural pulses can be more clearly evaluated. The intensity of its influence is expressed by the relative variance contribution (RVC). The formula is as follows:
According to VMA (∞), Sims proposes a variance decomposition method for quantitatively calculating the influence relationship between variables [47]:
y i t = j = 1 k ( θ i j ( 0 ) ε j t + θ i j ( 1 ) ε j t 1 + θ i j ( 2 ) ε j t 2 + θ i j ( 3 ) ε j t 3 + + θ i j ( k ) ε j t k )
In the formula, i = 1 , 2 , , k , t = 1 , 2 , , T , the content in parentheses is the sum of the influence of the j -th disturbance item ε j on the variable y i from the past to the present. In the case of assuming that the disturbance term ε j has no sequence correlation, the variance of Equation (7) can be obtained as
E [ ( θ i j ( 0 ) ε j t + θ i j ( 1 ) ε j t 1 + θ i j ( 2 ) ε j t 2 + θ i j ( 3 ) ε j t 3 + + θ i j ( k ) ε j t k ) 2 ] = q = 0 ( θ i j ( q ) ) 2 σ j j
In the formula, i , j = 1 , 2 , , k . Assuming that the covariance matrix of the disturbance item vector is a diagonal matrix, then the k of the above variance is summed to obtain the variance of the variable y i as
var ( y i ) = j = 1 k { q = 0 ( θ i j ( q ) ) 2 σ j j }
In the formula, i = 1 , 2 , , k . The variable y i can be decomposed into k unrelated impacts. To measure the different contribution degree of each disturbance item to y i , this paper uses RVC to calculate. According to the relative contribution of the variance of the j variable to the variance of y i as the scale for observing the influence of the j -th variable on the i -th variable. In practice, if the model satisfies the stationary condition, only limited s   items are needed. The formula for RVC is
RVC j i ( s ) = q = 0 s 1 ( θ i j ( q ) ) 2 σ j j j = 1 k { q = 0 ( θ i j ( q ) ) 2 σ j j } s . t . { 0 RVC j i ( s ) 1 ,   i , j = 1 , 2 , , k j = 1 k RVC j i ( s ) = 1 ,   i = 1 , 2 , , k
In the formula, the larger RVC j i ( s ) is, the greater the contribution of the j -th variable to the i -th variable. In contrast, the smaller RVC j i ( s ) is, the smaller the contribution of the j -th variable to the i -th variable.

4. Indicator Selection and Data Sources

4.1. Indicator Selection

This paper mainly examines the interactive relationship among the three elements of urban expansion, economic development, and population growth. Based on the availability and quality of the data, this paper selects the following three variables:
(1) Built-up area (BUIL). The unit is km2. According to the regulations of the National Bureau of Statistics of China on the statistical division of urban and rural areas in 2008, the urban area refers to the actual construction of the municipal, district, and municipal government resident areas and connected to the residents committee and other areas. The China Urban Statistical Yearbook currently provides two indicators for the area of urban built-up areas and the total area of urban areas. The urban built-up area refers to the land that has been requisitioned within the municipal area as well as the non-agricultural production and construction area that has been constructed and developed in practice. These areas include urban contiguous sections as well as urban construction land with well-established municipal utilities, the sites of which are scattered around the city. Therefore, the urban built-up area is consistent with the definition of the city. This indicator is closer to the nature of urban entities in China. Therefore, this paper uses the change in the area of the built-up area to characterize urban expansion.
(2) Gross domestic product (GDP). The unit is 104 yuan. This paper uses GDP to reflect the level of urban economic development. To eliminate the impact of price factors on the analysis, the consumer price index (cpi) was used to deflate the nominal GDP of 1980–2016, and the real GDP of each year was obtained. The calculation formula is
R e a l   G D P = N o m i n a l   G D P * 100 C P I ( 1980 = 100 )
(3) Non-agricultural population (POP). The unit is 104 people. The population can be divided into urban population and rural population according to the division of residence. According to the current household registration system, the population can be divided into agricultural and non-agricultural populations. In the urban, the urban population is often higher than the non-agricultural population, because a considerable number of people with agricultural hukou live in urban. However, due to economic factors (differences in urban and rural consumption levels), institutional factors (hukou system), and psychological factors (land attachment), the agricultural population that has moved to the urban has the possibility of returning to the countryside. Moreover, the current urban population statistics in China are not continuous, resulting in poor comparability of urban population in time and region. Therefore, this paper selects the non-agricultural population as a representative indicator of the urban population because the statistics of the non-agricultural population are continuous and the data are richer.

4.2. Data Sources

The basic data of this study are mainly from the “China Statistical Yearbook (1994–2017)”, “China City Statistical Yearbook (1994–2017)”, “China Urban Construction Statistical Yearbook (1994–2017)”, and the China City Database in EPS Data Platform.
In order to eliminate the influence of dimension, heteroscedasticity and outliers on the model as much as possible, and to make the degree of influence of each factor more comparable, all variables are logarithmized. The properties of the data will not change as a result of using the natural logarithm of the time series data. The processed variables are named l n B U I L , l n G D P , l n P O P .

5. Empirical Analysis

5.1. Construction of VECM Model

5.1.1. Unit Root Test

Modern time series analysis is based on the assumption of data stationarity, meaning that the various structural parameters accompanying data generation do not change over time. To avoid the pseudo-regression phenomenon in the metrological analysis, it is first necessary to perform a unit root test on each variable. In this paper, Dickey’s augmented Dickey–Fuller (ADF) unit root test, which was proposed in 1981, is used to test the stationarity of each variable. The determination of the lag difference item in the verification process is judged by the Schwarz information criterion (SIC). The original hypothesis is that l n B U I L , l n G D P , l n P O P , l n B U I L , l n G D P , and l n P O P have unit roots. If the ADP test value is smaller than the critical value, the time series variable is stable. In contrast, if it is larger, it is not stable.
The ADF test results (see Appendix A, Table A1) show that the logarithmic forms of the original variables l n B U I L , l n G D P , and l n P O P have ADF statistics greater than the critical value at the 1% or 5% confidence levels and accept the null hypothesis. Note that l n B U I L , l n G D P , and l n P O P all have unit roots, which are non-stationary time series, and it is necessary to perform first-order differential processing. If the first-order difference of an unstable time series is stable, it is called first-order single integration. The unit root test is the basis of the cointegration test. After the first-order difference, the ADF test statistic of l n B U I L , l n G D P , and l n P O P is less than the critical value of 1% or 5% of the significance level, indicating that the null hypothesis is rejected at the 99% or 95% confidence level. There are no unit roots in all three differential sequences, which are stationary sequences. That is, l n B U I L , l n G D P , and l n P O P are first-order single integration sequences, so the covariance test can be performed on the above variables.

5.1.2. Determination of the Optimal Lag Order

The VECM model is a constrained VAR model. The VECM model can only be established if there is a cointegration relationship between the variables. Cointegration tests are very sensitive to the lag order of variables, and improper lag orders may lead to false cointegration. The lag order should not be too large, which would lead to a loss of degrees of freedom, which in turn affects the validity of the parameter estimation. If the lag order is too small, it will lead to the autocorrelation of the error and affect the consistency of the parameter estimation. In view of this, to choose the appropriate lag order, the paper determines the optimal order of the VAR model according to the principle that the values of the LogL, likelihood ratio (LR), final prediction error (FPE), Akaike information criterion (AIC), SIC, and Hannan–Quinn information criterion (HQ), are the smallest (see Appendix A, Table A2). Table A2 shows that the lag order of the unconstrained VAR model is lag phase 5. Because the cointegration test is a constraint test on the lag period of the first-order difference variable of the unconstrained VAR model, the cointegration test lag order is lag phase 4.

5.1.3. Johansen Cointegration Test

To test whether there is a long-term equilibrium relationship between variables, a cointegration test is needed. The Johansen cointegration test is a method for testing regression parameters based on the VAR model and is suitable for multivariate cointegration tests. The result of the cointegration test is not only affected by the lag order of the variable but also needs to further determine the form of the cointegration equation. The cointegration test of time series has five forms. As shown in Table 1, this paper uses the third form. That is, the sequence is analyzed without the trend item but with the intercept item. The Trace and Maximum Eigenvalue tests were performed with a lag order of 4. The test results are shown in Table A3 and Table A4 (see Appendix A, Table A3 and Table A4).
According to the results of the Johansen test, both the Trace statistic and the Maximum Eigenvalue statistic reject the null hypothesis that the cointegration rank is 1 at the 10% significance level, while accepting the null hypothesis that the cointegration rank is 2 at the 10% significance level. This result shows that there are two cointegration equations between urban expansion, economic development, and population growth, and there is a long-term equilibrium relationship.

5.1.4. VECM Model and Robustness Test

(1) Analysis of the VECM model. The Johansen cointegration test has proved that there is a long-term equilibrium relationship among the three variables of urban expansion, economic development and population growth, which means that there is an inherent equilibrium mechanism among the three. However, the above results fail to reflect the short-term dynamic relationship among the three. The VECM model is a VAR model based on the cointegration relationship of variables, which not only reflects the long-term related information among different variables but also reflects the correction mechanism when the variables deviate from the long-term equilibrium in the short term. The VECM model is an econometric model that combines long-term and short-term models with high stability and reliability. Among then, e c m t 1 indicates the strength of the adjustment of the long-term equilibrium relationship to short-term fluctuation. In this paper, the VECM model is established for l n B U I L , l n G D P , and l n P O P , and the results are shown in Table A5 (see Appendix A, Table A5).
The t-statistic of the error correction coefficient of the first correction equation is not significant at the significance level of 5%. Therefore, this paper focuses on the second correction equation. In the VECM equation with l n B U I T as the explanatory variable, the coefficient of the error correction item e c m t 1 is 0.0939, which is less than the critical value at the 5% significance level and does not conform to the inverse correction mechanism with the negative error correction item. This result shows that when urban expansion deviates from the equilibrium state, the non-equilibrium error of the previous period will increase at the speed of 0.0939 in the t-th period, and this fluctuation cannot be restored to the equilibrium state in the short term. The reasons are as follows: at present, secondary industry is still an important driving force for the economic development of most cities in China. On the one hand, the rapid development of land-resource-intensive industries such as the building industry, low-end manufacturing and the mining industry will inevitably generate huge demand for land resources and thus promote the rapid expansion of construction land. On the other hand, urban fill and enclave expansion has increased rapidly. The phenomenon of competition in the construction of development zones, industrial parks, and new towns is very common, and the series of infrastructure construction and agglomeration effects brought about by this competition make the out-of-control use of space for land urbanization very common. Finally, due to traffic congestion, air pollution, and rising crime rates in urban built-up areas, the quality of urban production and life has declined significantly. This phenomenon of urban sprawl caused by the spillover of internal urban pressures gradually causes residents, houses, and enterprises to move from the city to the suburbs and the outer suburbs, thus creating residential suburbanization and industrial suburbanization.
The error correction coefficient e c m t 1 of the economic development variable l n G D P and the population growth variable l n P O P are −0.1770 and −0.0217, respectively, and both reject the null hypothesis at the significance level of 5%. This result shows that in the short term, when economic development and population growth deviate from the equilibrium state, the unbalanced state can return to the equilibrium state with adjustment strengths of −0.1770 and −0.0217, and the adjustment direction is in line with the error correction mechanism. The error correction term coefficient of the population growth variable is very small, indicating that the correction speed is relatively slow; that is, the time required to adjust back to the equilibrium state is relatively long. The reasons why the variable l n P O P can be adjusted back to equilibrium are as follows: high urban living costs, urban employment discrimination, household registration system restrictions, lack of social security, and unequal access to education for children all exert a huge external thrust on the urbanization of the agricultural population, which in turn hinders the process of citizenization. On the other hand, the agricultural population’s attachment to the land and the support function that agricultural production provides them tend to cause this population to reject the city. These factors also create a strong pull on the agricultural population to return to the countryside. Therefore, the external thrust of the city and the pullback of the countryside explain the return of population growth to a long-term equilibrium in the short term.
(2) AR root test. The stable VECM model is the basis for impulse analysis and variance analysis. In this paper, the stability of the established VECM model is tested by the AR root. If the reciprocal of the modulus of all roots of the estimated VECM model is less than 1, it is located within the unit circle and the model is stable. In contrast, if these conditions are not met, the model is not stable. Through analysis (see Figure 3), the VECM model has a total of 15 roots. Except for the unit root assumed by the VECM model itself, which is on the unit circle (Modulus = 1), the other characteristic roots are located in the unit circle (Modulus < 1). Therefore, the VECM model is stable and there is no set deviation, and further research can proceed.

5.2. Impulse Response Function and Variance Decomposition Analysis

To analyze the interactive relationship among urban expansion, economic development, and population growth, this paper first analyses the pulse of the three factors and obtains the impulse response diagram of all three. In the impulse response diagram, the horizontal axis represents the number of lag periods of the pulse effect, the vertical axis represents the degree of response of the interpreted variable to the explanatory variable, and the solid line is the orthogonal impulse response function. Variance analysis is used to further evaluate the relative importance of different structural pulses by analyzing the contribution of each structural pulse to changes in endogenous variables. In the variance analysis graph, the horizontal axis represents the number of lag periods, and the vertical axis represents the relative contribution of different variables, expressed as a percentage.

5.2.1. Impulse Response Function and Variance Decomposition Analysis of Urban Expansion

The impulse response function of a structural standard deviation of urban expansion to the system is shown in Figure 4. The dynamic response of urban expansion to economic development presents a trend of positive and negative interaction fluctuations, and the degree of reflection gradually decreases. On the one hand, when l n B U I L is subjected to a standard deviation shock from l n G D P , the response is first increased, reaching its maximum in the third period, with a maximum value of 0.02688. After the fifth period, economic development had a negative impact on urban expansion and reached the maximum negative response point in the seventh period, with a response value of −0.008790. In the 8–16 period, when economic development gives urban expansion a positive and negative volatility shock similar to the regular cosine regularity, the fluctuation range is small and there is a hysteresis effect. The cumulative response of l n B U I L to a standard deviation shock of l n G D P was negative during the entire observation period, indicating that l n G D P had a significant negative effect on l n B U I L in the long term. This finding shows that economic development can promote urban expansion in the short term. However, in the long run, sustained economic development will inhibit urban expansion and may even promote land-intensive use. On the other hand, l n B U I L received the strongest structural impulse from l n P O P , with a maximum value of 0.01354 in the fourth period. However, its impulse response effect is less than that of economic development on urban expansion in the 0–6 and 22 periods, indicating that the short-term impulse of population growth on urban expansion is more significant. The structural impulse of population growth on urban expansion is positive, indicating that the increase in the urban non-agricultural population can promote urban expansion and has a strong stimulating effect.
As shown in Figure 5, economic development has a relatively low level of interpretation of urban expansion. In the first period, the contribution of economic development to the variance decomposition of urban expansion is 0, but in the second period, it increased to 11.03%. After the third period, the impact of economic development gradually declined, from 7.27% in the third period to 5.58% in the sixth period. After that, there was a trend of volatility growth, but the contribution of economic development after the 13th period has been decreasing over time. At the same time, it can be seen that population growth contributes greatly to urban expansion, although the contribution of the first seven periods is below 20%. However, starting from the eighth period, with the increase in the lag order, the proportion of population growth increased significantly and reached its maximum in the 30th period, which was 29.92%. The above results reflect that the short-term pulse of urban expansion mainly comes from economic development. The interpretation of population growth on urban expansion has been ahead of that of economic development since the fourth period, becoming the most important factor in addition to urban expansion itself. The results of the variance analysis are basically consistent with the results of the impulse response analysis.
The reasons are as follows: in the early stage of industrialization, the industrial structure was gradually transformed from a traditional structure dominated by traditional agriculture to an industrialized structure dominated by modern industry. Moreover, with the development of the economy, the investment environment has improved, the urbanization process has accelerated, and infrastructure (such as urban roads) has continued to advance. At this stage, the land resources are relatively affluent, and the expansion of urban land is mainly extended by epitaxial extension, thus accelerating the speed of urban expansion. However, with the adjustment and upgrading of economic structure, the proportion of tertiary industry began to gradually increase, and most of China began the urbanization process of suppressing secondary industry and developing tertiary industry. At the same time, the ratios among the scale of three industrial land have also changed (that is, the industrial land structure has been continuously adjusted), and with the improvement of infrastructure, economic development has gradually reduced dependence on the expansion of built-up areas [48]. Therefore, for urban economies, improving the quality of economic development is conducive to controlling urban expansion and facilitating intensive land use. The relationship between technological progress and land use caused by higher quality economic development is shown in Figure 6.
In Figure 6, there are two production frontiers, OF1 and OF2, where the technical level represented by OF2 is higher than the technical level represented by OF1. Now, assume that a city is producing in a technically efficient state, producing OE unit output at point B, and investing in OG area land. With the improvement in the quality of economic development and the advancement of technology, the production frontier moves from OF1 to OF2. At point H, in the case of the same production of OE units, only OI area land is required. Because OI is less than OG, technological advancement is conducive to saving urban built-up areas and inhibiting land expansion.
From the results of impulse response analysis and variance analysis, it can be seen that compared with economic development, urban population growth has a more significant pull effect on urban expansion. The reasons are as follows: On the one hand, in the process of the rapid growth of the urban population and the rapid increase in the urbanization rate, due to the shortsightedness of land planning and construction planning, the built-up areas at the edge of the city are interlaced with agricultural land, resulting in serious urban disorder. On the other hand, the current urban population has a distinct suburbanized character. Suburbanization refers to the centrifugal dispersion of population and industrial economic activities from the central city to the periphery of the suburbs. With the suburban migration of living space or employment space, spaces used for daily activities such as commuting, shopping, leisure, and socializing often need to be reconstructed, which promotes the construction of large-scale new urban areas in the suburbs. However, China’s suburbanization still faces a series of problems. Particularly, during the process of building many new urban areas, planning objectives have not been implemented, there have been improper planning and site selection, and the funds for planning implementation are seriously insufficient, which has led to the emergence of ‘ghost towns’ and ‘empty cities’. This not only wastes considerable land resources and funds but also becomes a major burden for local development [49].

5.2.2. Impulse Response Function and Variance Decomposition Analysis of Economic Development

The impulse response function of a structural standard deviation of economic development in the system is shown in Figure 7. It can be seen from Figure 7 that the economic response to the impulse from itself was positive in the first four periods, then quickly turned negative, and stabilized at approximately −0.0034 after the 21st period. This finding indicates that economic development has a negative effect on the pulse from itself. From the pulse of a one-unit standard deviation of the endogenous variable urban expansion l n B U I L , the response of economic development slightly lags in the short term, then gradually increases and reaches the first peak in the eighth period, at which time the impulse response parameter is 0.026967. The phenomenon of repeated shocks followed, and the phenomenon of rebound appeared after 23 stages. This result shows that economic development is volatile due to the pulse of urban expansion, but in the long run, urban expansion has a positive effect on economic development. The positive impact of economic development from the one-unit standard deviation of population growth peaked in the eighth period, at which time the impulse response parameter was 0.036145. Since then, the degree of influence has decreased and stabilized, but it still has a positive effect. This result shows that in a short period of time, the rise of the urban non-agricultural population has driven the investment and consumption of cities, which has promoted economic development. However, as the urban population continues to grow, the positive impact is decreasing, and it can be inferred that the subsequent long-term trend is a downward one.
By analyzing the results of the variance analysis of economic development variables, it can be seen that the changes in economic development are affected by the fluctuation itself and by economic development in the first period, and the contribution rate of self-fluctuation is relatively large. Over time, the contribution rate of self-fluctuation gradually decreased and reached its lowest value of 12.3439% in the 30th period. In contrast, urban expansion is a major factor affecting economic development (see Figure 8). The contribution rate of urban expansion to economic development was approximately 16.6770% in the first period and then began to rise slowly. After the 19th period, the contribution rate was above 40% and continued to increase. It can be seen that China’s current economic development is still largely dependent on urban expansion. At the same time, economic development is also largely dependent on population growth. Although the contribution rate of population growth was 0% in the first period, the subsequent contribution rate increased year by year, reaching a peak in the 12th period, which was 52.06187%. After that, the contribution rate of population growth gradually declined, and it stabilized at approximately 42% after the 20th period.
The reasons are as follows: land has always been considered an important factor driving the rapid development of China’s economy. On the one hand, according to China’s current land management law, the compensation for conversion of agricultural land to construction land is calculated according to the income generated by the land’s original use, which results in a huge gap between the cost of compensation and the price of construction land. The huge differential rent has prompted many local governments to make greater concessions to investors on land prices and to develop traditional industries through low land prices to undertake industrial transfer in international or domestically advanced regions, thereby replacing agricultural land and labor with economic development. On the other hand, after the implementation of the tax-sharing reform in China in 1994, the main sources of income controllable by local governments are (I) land transfer fees; and (II) increasing the disposable tax of local governments through urban expansion (such as business taxes and income taxes in the construction business and real estate). In the context of a shortage of financial funds, performance evaluation, and official promotion incentives, local governments in various regions have a strong incentive to rely on urban expansion to drive economic development. Therefore, if we do not pay attention to the optimization of internal urban structure, allowing the rapid expansion of construction land will lead to the development of an economic structure that tends to be over-industrialized. As a result, local governments have shifted their attention to the development of high-tech industries and ignored the importance of technology and resource utilization efficiency. Therefore, local economies will be further encouraged to use the resource input instead of technology to implement economic growth in urban enclosures behavior [50].
It can be seen from the results of impulse response analysis and variance analysis that the effect of population growth on economic development is volatile. In the early stage, China’s population was huge, and the proportion of the working-age population continued to rise, resulting in an infinite supply of labor. The infinite supply of labor has made it possible for China to expand its supply of low-cost labor. On the one hand, the infinite supply of labor makes it easy for China to combine its investments in physical capital with labor to generate productivity; on the other hand, companies can hire cheap labor, giving them a strong cost advantage in production. Therefore, China’s economic development has relied on physical capital investment and the export trade for many years [51]. However, due to limited resources, the concentration of the population in urban areas has created crowding and raised the costs of migration, with an adverse impact on the economy. In recent years, China has begun to increase investment in basic education, secondary education, and higher education to improve the education level of the urban labor force. Increasing the proportion of the labor force that is educated and of high quality can transform the mode of economic development, promote the upgrading of the industrial structure, and indirectly promote economic growth.

5.2.3. Impulse Response Function and Variance Decomposition Analysis of Population Growth

The impulse response function of a structural standard deviation of population growth in the system is shown in Figure 9. The impulse response of population growth to a standard deviation of the endogenous variable urban expansion ( l n B U I L ) is intense and rapid. The impulse response parameter reached a peak of 0.012888 in the fourth period. However, this effect lasted for a short period of time, the influence gradually weakened after the fourth period, and the lowest value of the impulse response parameter reached in the eighth period was 0.004667. In addition, after fluctuating up and down in the subsequent response period, the fluctuation amplitude gradually decreases with the increase in the lag period. There was a sustained and steady positive response throughout the study period, showing that in the long run, urban expansion has a positive effect on population growth. After population growth is affected by its own standard deviation impulse, its impulse response function fluctuates similarly to urban expansion, both of which have positive effects but have obvious hysteresis effects. A standard deviation of economic development on population growth has a significant negative effect at the initial stage and is gradually strengthened. After reaching the minimum value in the sixth period, the effect began to rise gradually and was positive for the first time in the tenth period. Subsequently, it decayed rapidly after reaching the maximum value in the twelfth period, returned to the negative value in the sixteenth period, and gradually became stable. This result shows that economic development has a negative effect on population growth, but the force is weak, ranging from −0.004785 to −0.005901.
By analysing the results of the variance analysis of population growth, it can be found that the degree of self-contribution of population growth shows a fluctuating declining trend, from 74.97448% in the first period to 39.45697% in the eighteenth period. After that, there was a small rebound, but it dropped year by year after the twenty-fifth period. This result shows that the degree to which population growth influences itself gradually decreases with the increase in the lag period. The contribution degree of economic development to the variance of population growth is low; in the first period it is 9.795845%, and in the 14th period it reaches the maximum value of 11.7858% (see Figure 10). After that, the impact of economic development accelerated and declined over time. showing that economic development has not become the dominant factor in population growth. The impact of urban expansion on population growth increased rapidly in the first three periods, with the first period being 15.26665% and the third period reaching 48.0622%. After the twenty-eighth period, population growth of more than 50% can be explained by urban expansion. This result shows that urban expansion has a strong influence on population growth, and the impact is not only short-term but also long-term.
The reasons are as follows: Among the many factors affecting the growth of the employed population, the improvement of infrastructure, especially the improvement of urban transportation infrastructure, plays a pivotal role. From the supply side of the employed population, the upgrading of urban transportation facilities and the expansion of the transportation network can improve regional accessibility, thereby shortening commuting time and reducing commuting costs. These changes enable the labor force to reach more job opportunities, thereby expanding the labor market space and the size of the potential employed population; from the demand side of the employed population, the expansion and upgrading of urban transportation facilities has reduced transportation costs and expanded the geographical scope and scale of the local market, thereby increasing the labor force demand of local enterprises. In general, urban rail transit and ground transportation construction caused by urban expansion can simultaneously increase the supply and demand of the urban labor market, thus affecting the growth of the urban employed population. However, in the context of the rapid suburbanization of Chinese cities, suburban space has become the most intense area of urban spatial reconstruction. Moreover, due to the greater distribution industrial enterprises in the suburbs than in the cities, there are more employment opportunities, lower rental expenses, and lower living costs in the suburbs, thus attracting a large number of people and providing a relatively good life and production space for many migrant workers. Therefore, the expansion of urban spatial structure to suburbanization can promote population growth [52].
Combined with the impulse response function and the results of variance analysis, it can be seen that economic growth has a positive and negative volatility effect on population growth. The reasons are as follows: on the one hand, in the early stage of China’s reform and opening up, when per capita income was low, people can only meet the minimum living consumption demand, and then use more time and income to raise children, in order to accumulate the human capital of future family members. At this time, if economic development led to an increase in per capita income, the main outcome was an increased fertility rate, so people’s consumption was still subsistence-level. However, with the further development of the economy, the further improvement of technology and the continuous accumulation of human capital, per capita income will break through the constraints of survival. People will pay more attention to the quality of human capital, and the size of the population will become less important. As a result, the population growth rate will drop significantly. On the other hand, with the continuous development of the economy, labor-intensive industries will gradually transform into capital-intensive and technology-intensive industries. As a result, the size of the labor force will be significantly reduced, thereby inhibiting the growth of urban non-agricultural populations [53,54].

6. Discussion

This study reveals the interactive relationship between urban expansion, economic development and population growth. It can provide reference for the Chinese government to guide the rational expansion of urban land use, promote sustainable economic development, and coordinate the development of population urbanization and land urbanization. Although this paper has made clear conclusions, there are still some problems that need to be solved and improved.
(1) This study focuses on the interaction between quantity, urban expansion, economic development, and population growth. In the theoretical analysis and model construction, the discussion of factors other than the three is slightly insufficient, and there are certain limitations. Urban expansion not only affects the number of economic development, but also affects the quality of economic development through industrial structure upgrading, urbanization, ecological environment, economies of scale, investment in education, and investment in science and technology. For example, with the further expansion of the urban, the negative impacts of insufficient cultivated land, food crisis, and urban diseases will reduce the quality of economic development. For example, Yue [55] believes that due to the limitations of data, few scholars have explored the effects of rapid urban expansion in China from the perspective of coordinated development of economy and environment. Yue studied urban expansion in Shanghai and examined the dynamic relationship between economic development and environmental consequences. The results show that the imbalance between economic development and environmental development in Shanghai is mainly attributed to four institutional factors: (I) the role of government; (II) multi-level urban planning system; (III) land market reform; (IV) economic restructuring. In addition, since the reform and opening-up, land urbanization has been significantly faster than population urbanization. The Chinese government emphasizes the importance of giving full play to the role of market mechanism in the process of urbanization. However, the urban–rural segregation policy based on the household registration management system is often seen as a major obstacle to the urbanization process of the population [56]. Moreover, population growth can stimulate capital demand and thus promote economic growth. However, it will also cause the consumption rate of non-renewable resources and the continuous increase of the environmental pollution index. For example, Liu [57] believes that encouraging green and sustainable population urbanization can promote economic growth without sacrificing the environment. There are many studies in the academic community that use the urban expansion, economic development and population growth as the dependent variables to conduct driving force analysis, and many worthy findings have been obtained (see Table 1). Therefore, in the future research, a variety of factors should be included in a unified empirical analysis framework. In order to supplement and improve the discussion of the relationship between the three, establish a long-term equilibrium relationship between the three, and form a coordinated development mechanism.
(2) Although the VECM model can examine the dynamic characteristics between variables, the structural relationship between variables is difficult to visually observe. Because complex systems are made up of several interacting subsystems. When a certain factor changes, not only the system itself is affected, but also the operation of other systems will be triggered. The impulse response function is an effective way to implement this function. The advantage of the impulse response function is the ability to visually characterize the dynamic interactions between variables and their effects. The analysis combined with variance decomposition technology can further demonstrate the impact of urban expansion, economic development and population growth on each other. 
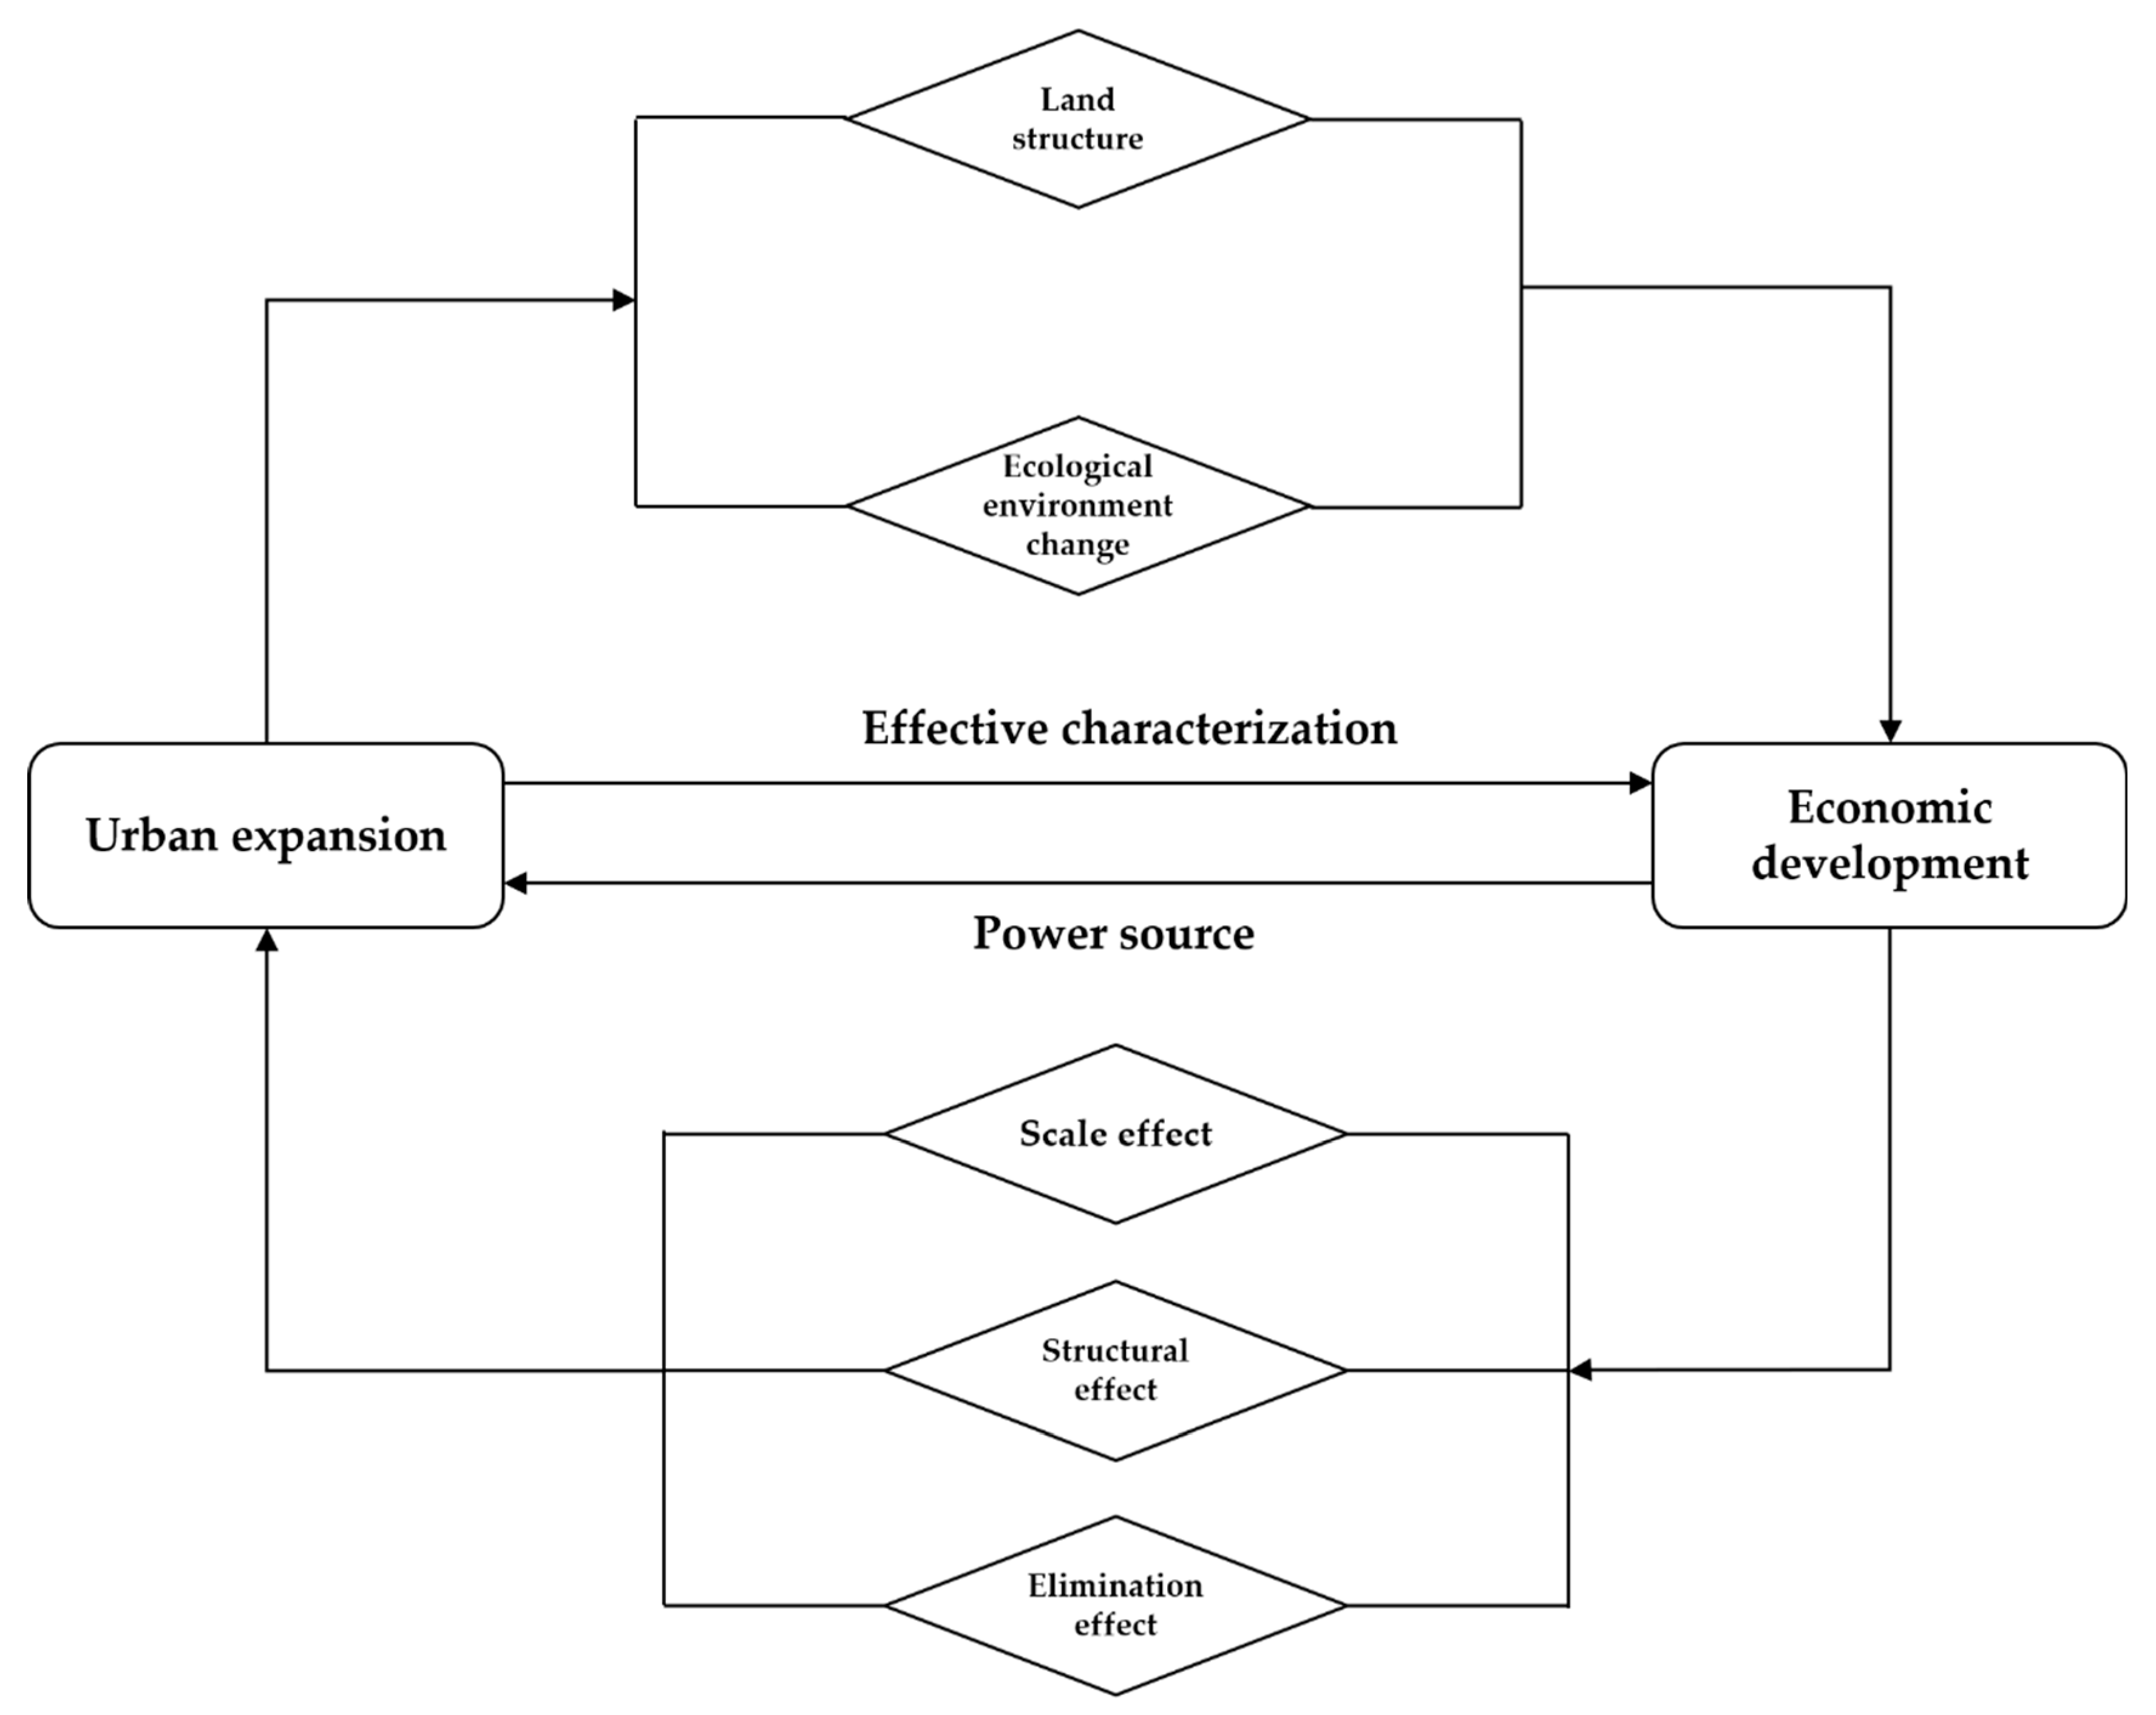
Section 5.2 shows that the improvement of the quality of economic development can promote the intensive use of urban land through the improvement of technological efficiency and technological progress. Technological advances can change the elasticity of substitution between elements, increase the intensity of land use, and change the structure of land use, thereby inhibiting urban expansion [66]. Improvements in technical efficiency can inhibit urban expansion through economies of scale, improved level of management, and the development of rational land systems. Therefore, the Chinese government should formulate and improve policies, create a fair institutional environment, encourage technological innovation, and actively implement technology introduction. On the other hand, the increase in urban population is a major factor in the urban expansion. Moreover, the imbalance of the proportion of population urbanization and land urbanization leads to the decentralization of urban form and layout, showing a trend of low-density growth. Therefore, it is necessary to improve the coordination level of population urbanization and land urbanization, and then achieve intentional urban growth.
However, the drawback of the VECM model, the impulse response function, and the variance decomposition technique is that there are few variables involved, and there is a problem of insufficient information. Urban expansion, economic development, and population growth are mutually causal relationships. Therefore, when assessing the impact of economic development and population growth on urban expansion, economic development, and population growth are endogenous variables. Therefore, the estimator obtained by the ordinary least squares method for regression analysis are biased and have no causal inference. Although the VECM model can solve the endogeneity problem to some extent, it has the problem of missing variables. The instrumental variable method has unique advantages in solving endogenous problems and in causal inference in social sciences. Therefore, in future research, in order to accurately estimate the impact of economic development and population growth on urban expansion, scholars can find suitable instrumental variables for economic development and population growth. This instrumental variable can explain changes in economic development and population growth, but apart from the two specific pathways mentioned above, they do not directly or indirectly affect urban expansion. If the indirect impulse of the selected exogenous variable on urban expansion can be statistically proven to be significant, then the true magnitude of the impact of economic development or population growth on urban expansion can be derived. At present, few scholars use the instrumental variable method to explore this research issue, which can become a research direction in the future.

7. Conclusions and Policy Implications

7.1. Conclusions

Based on data of urban construction land, economic development and population growth in China from 1980 to 2016, this paper first examines whether there is a long-term equilibrium relationship among the three factors by using a cointegration test. Based on the VECM model, the interactive mechanism and dynamic effects among the three are studied using the impulse response function and the variance decomposition model system. The conclusions are as follows:
(1) The sequences of urban expansion, economic development, and population growth in China are all first-order single sequences. In the long run, the three can maintain a balanced state and have a stable cointegration relationship. From the perspective of the two VECM models, the coefficient of economic development and population growth is negative. This result shows that when economic development and population growth show a short-term deviation, the reverse correction mechanism of the long-term equilibrium trend deviation of the two variables can pull the two back to an equilibrium state with strengths of −0.17703 and −0.02174, respectively. Therefore, this mechanism can play a strong adjustment role. However, urban expansion is a phenomenon of imbalance and deviation in the short term; when urban expansion deviates from the equilibrium state, the error correction mechanism will cause the deviation to further expand.
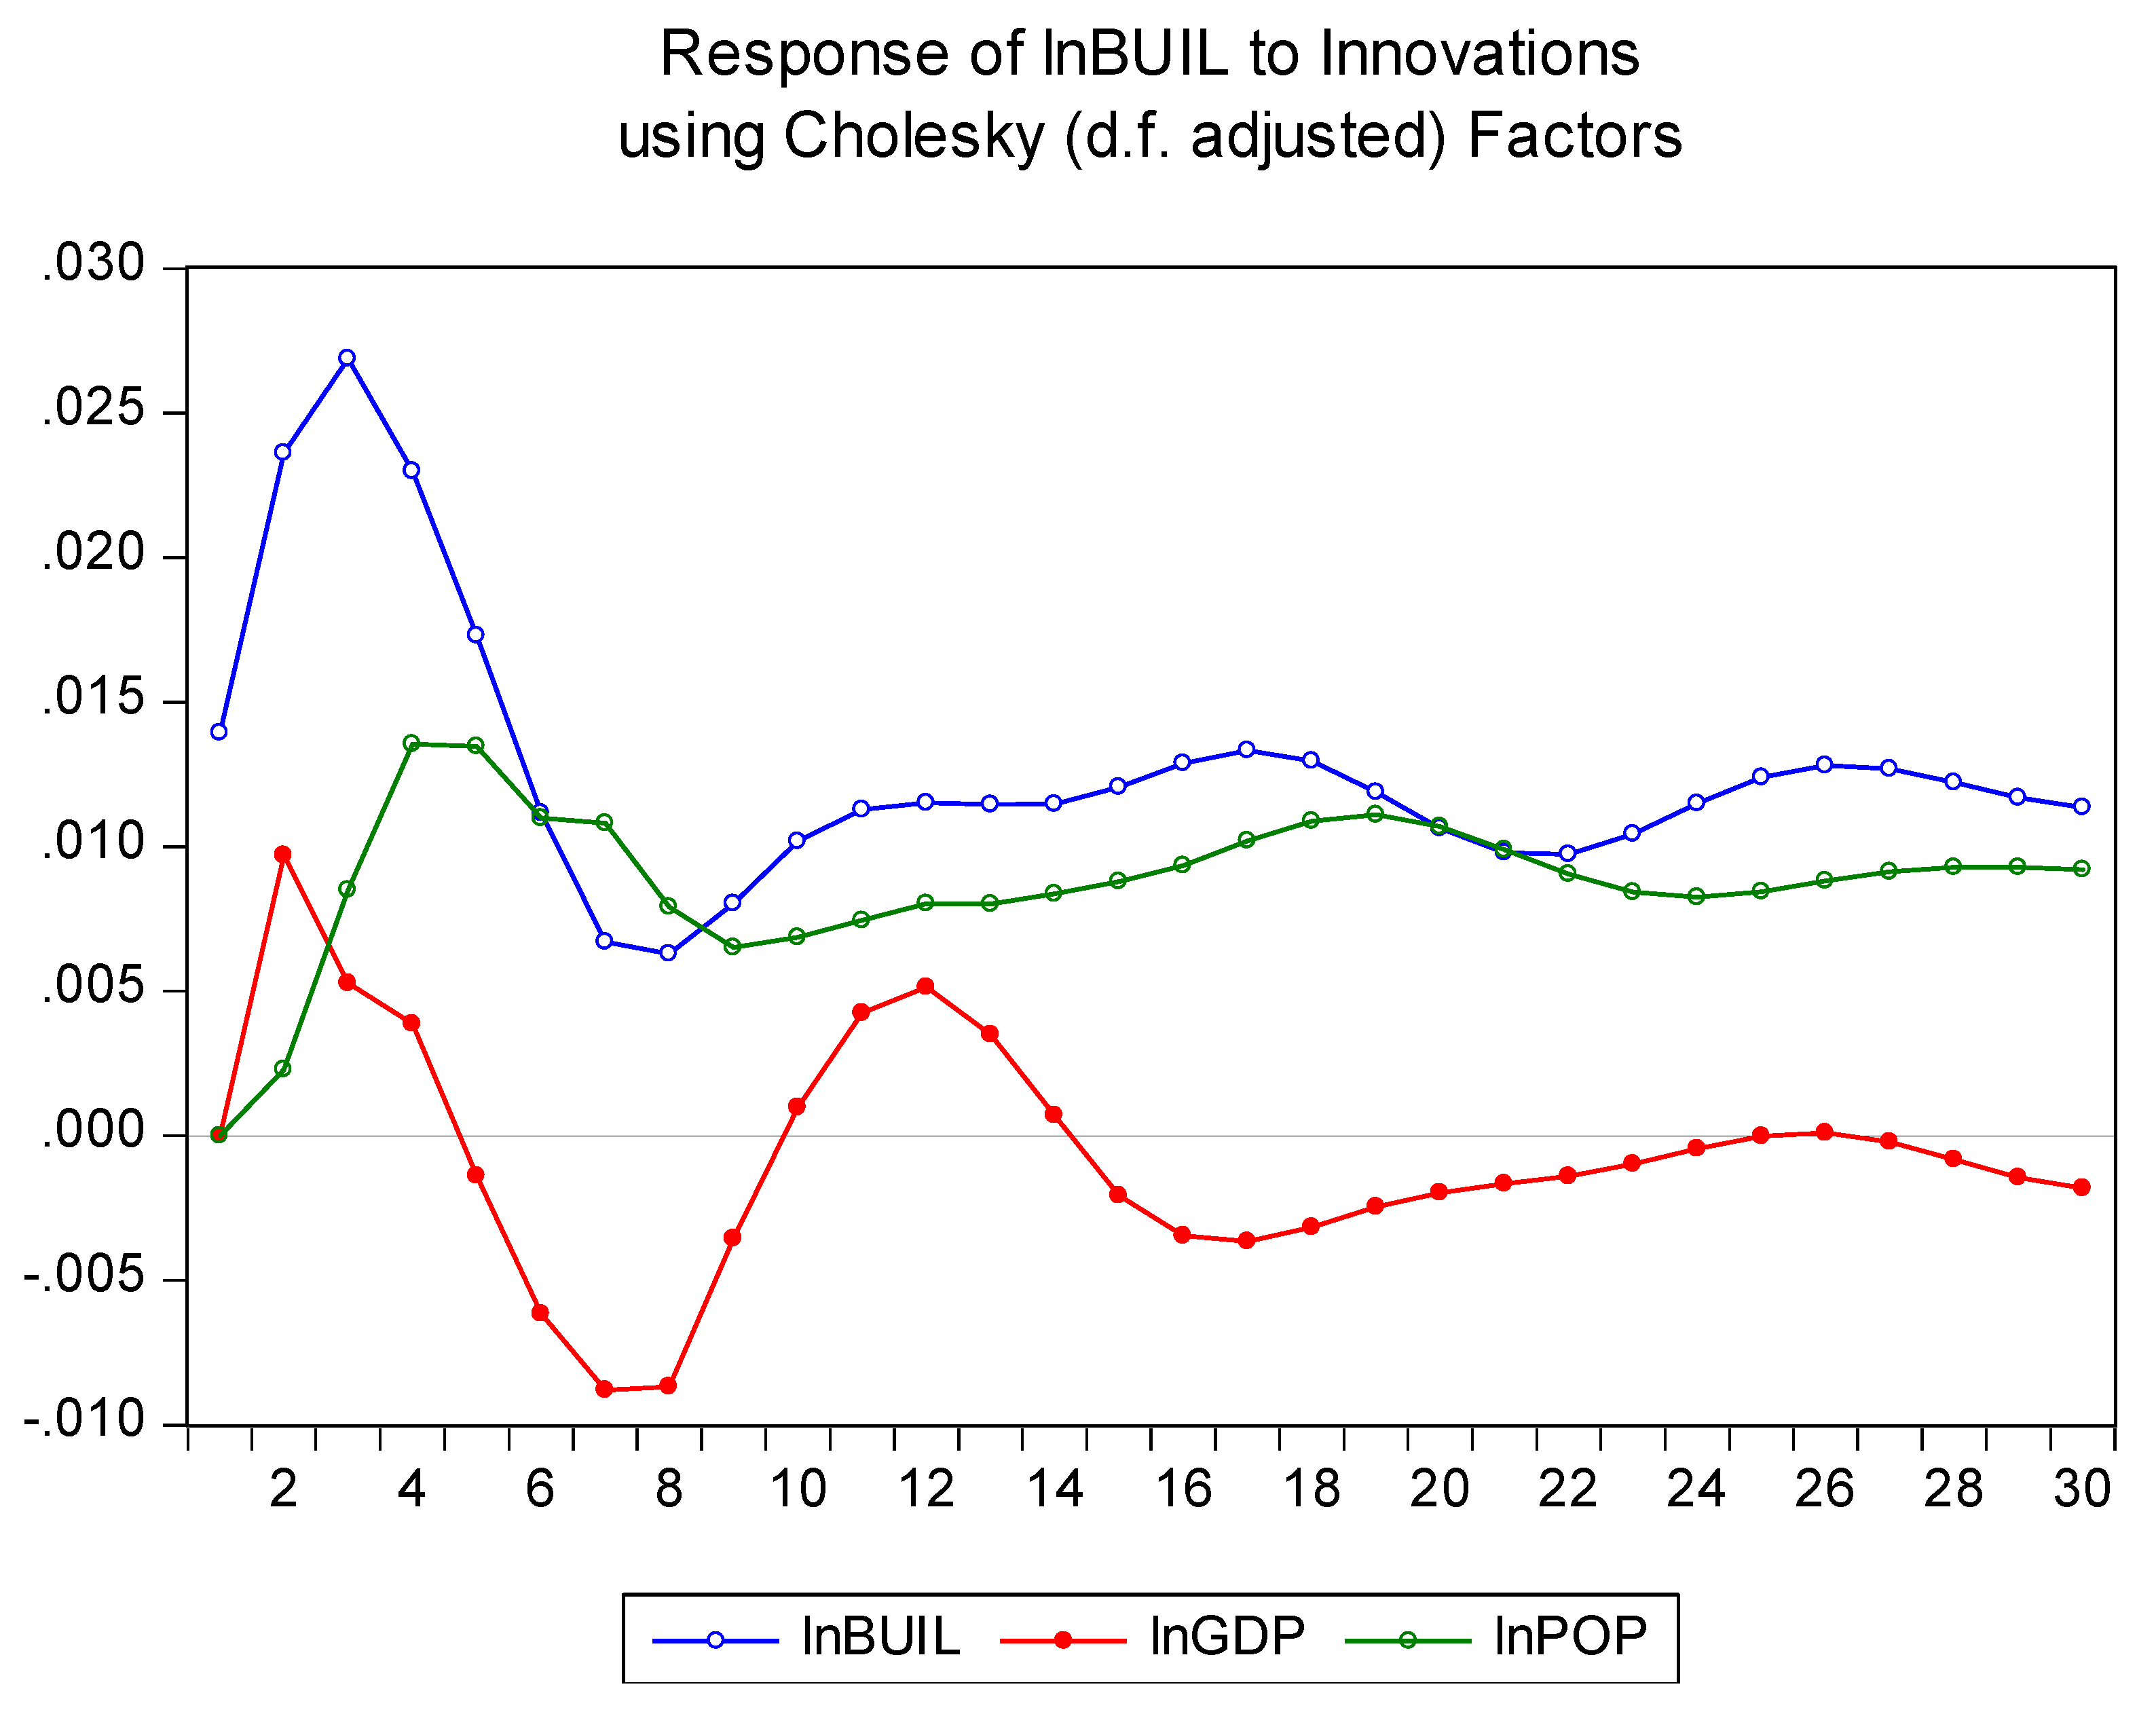
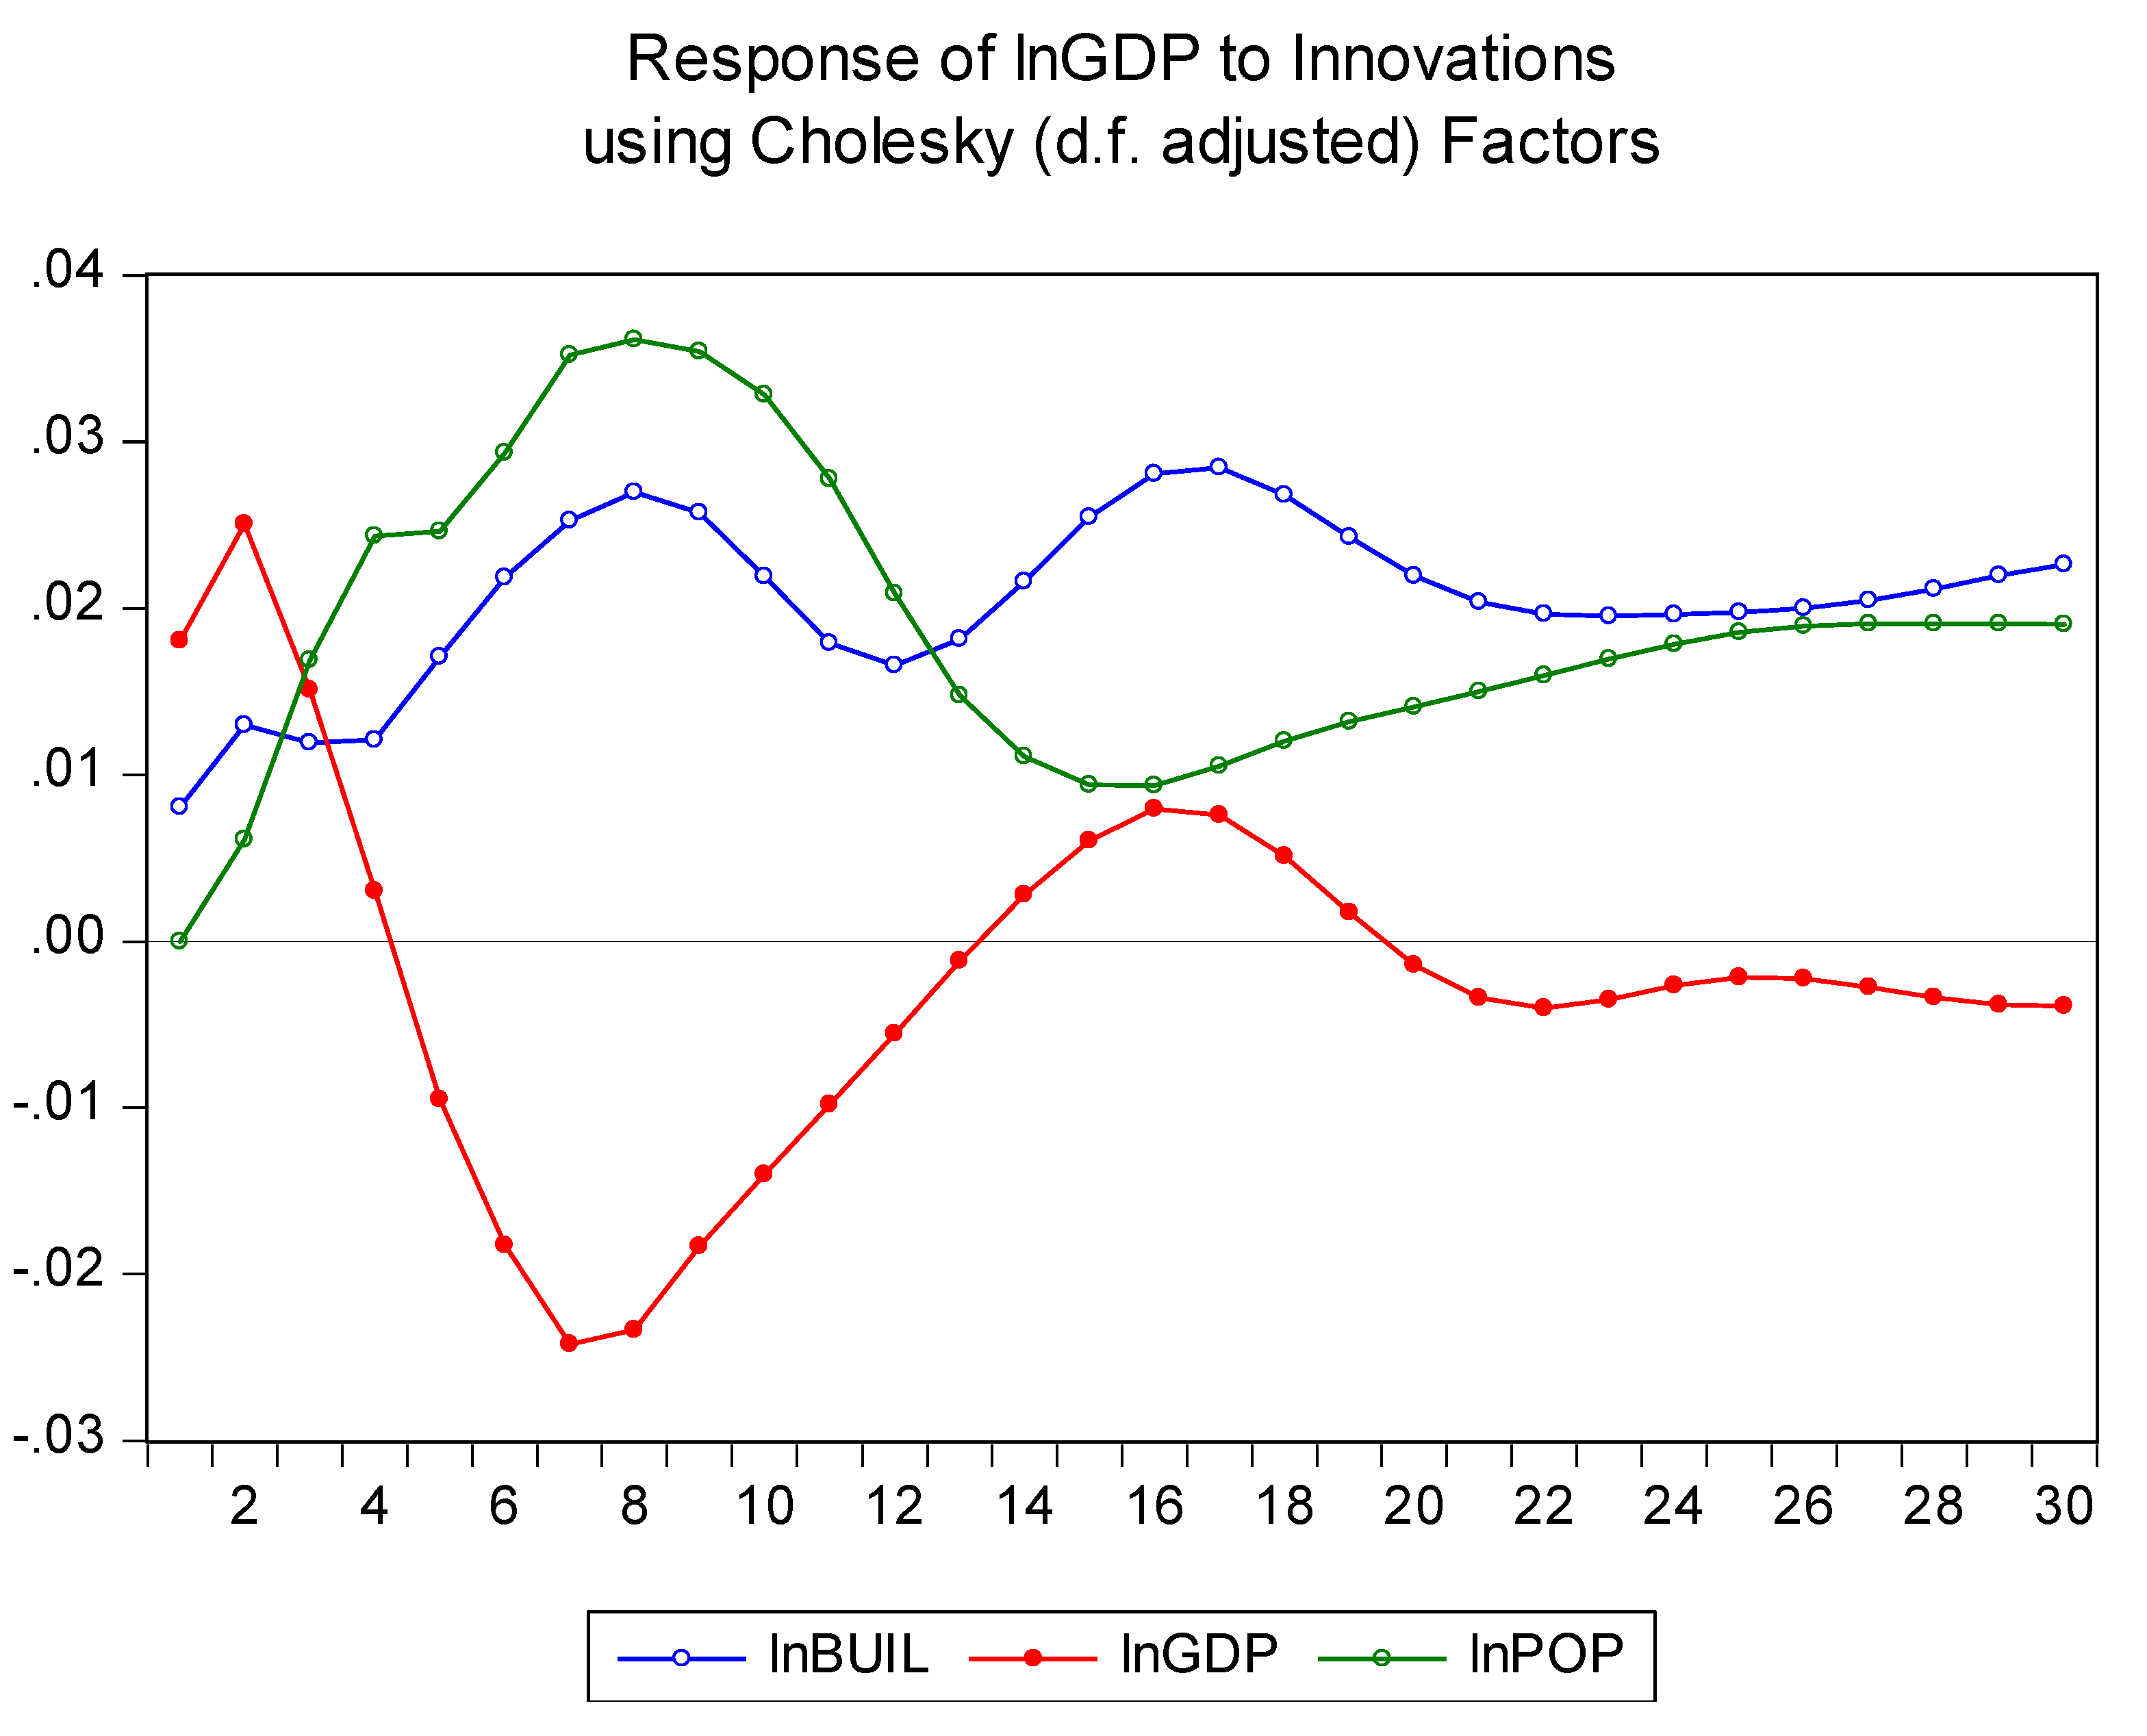
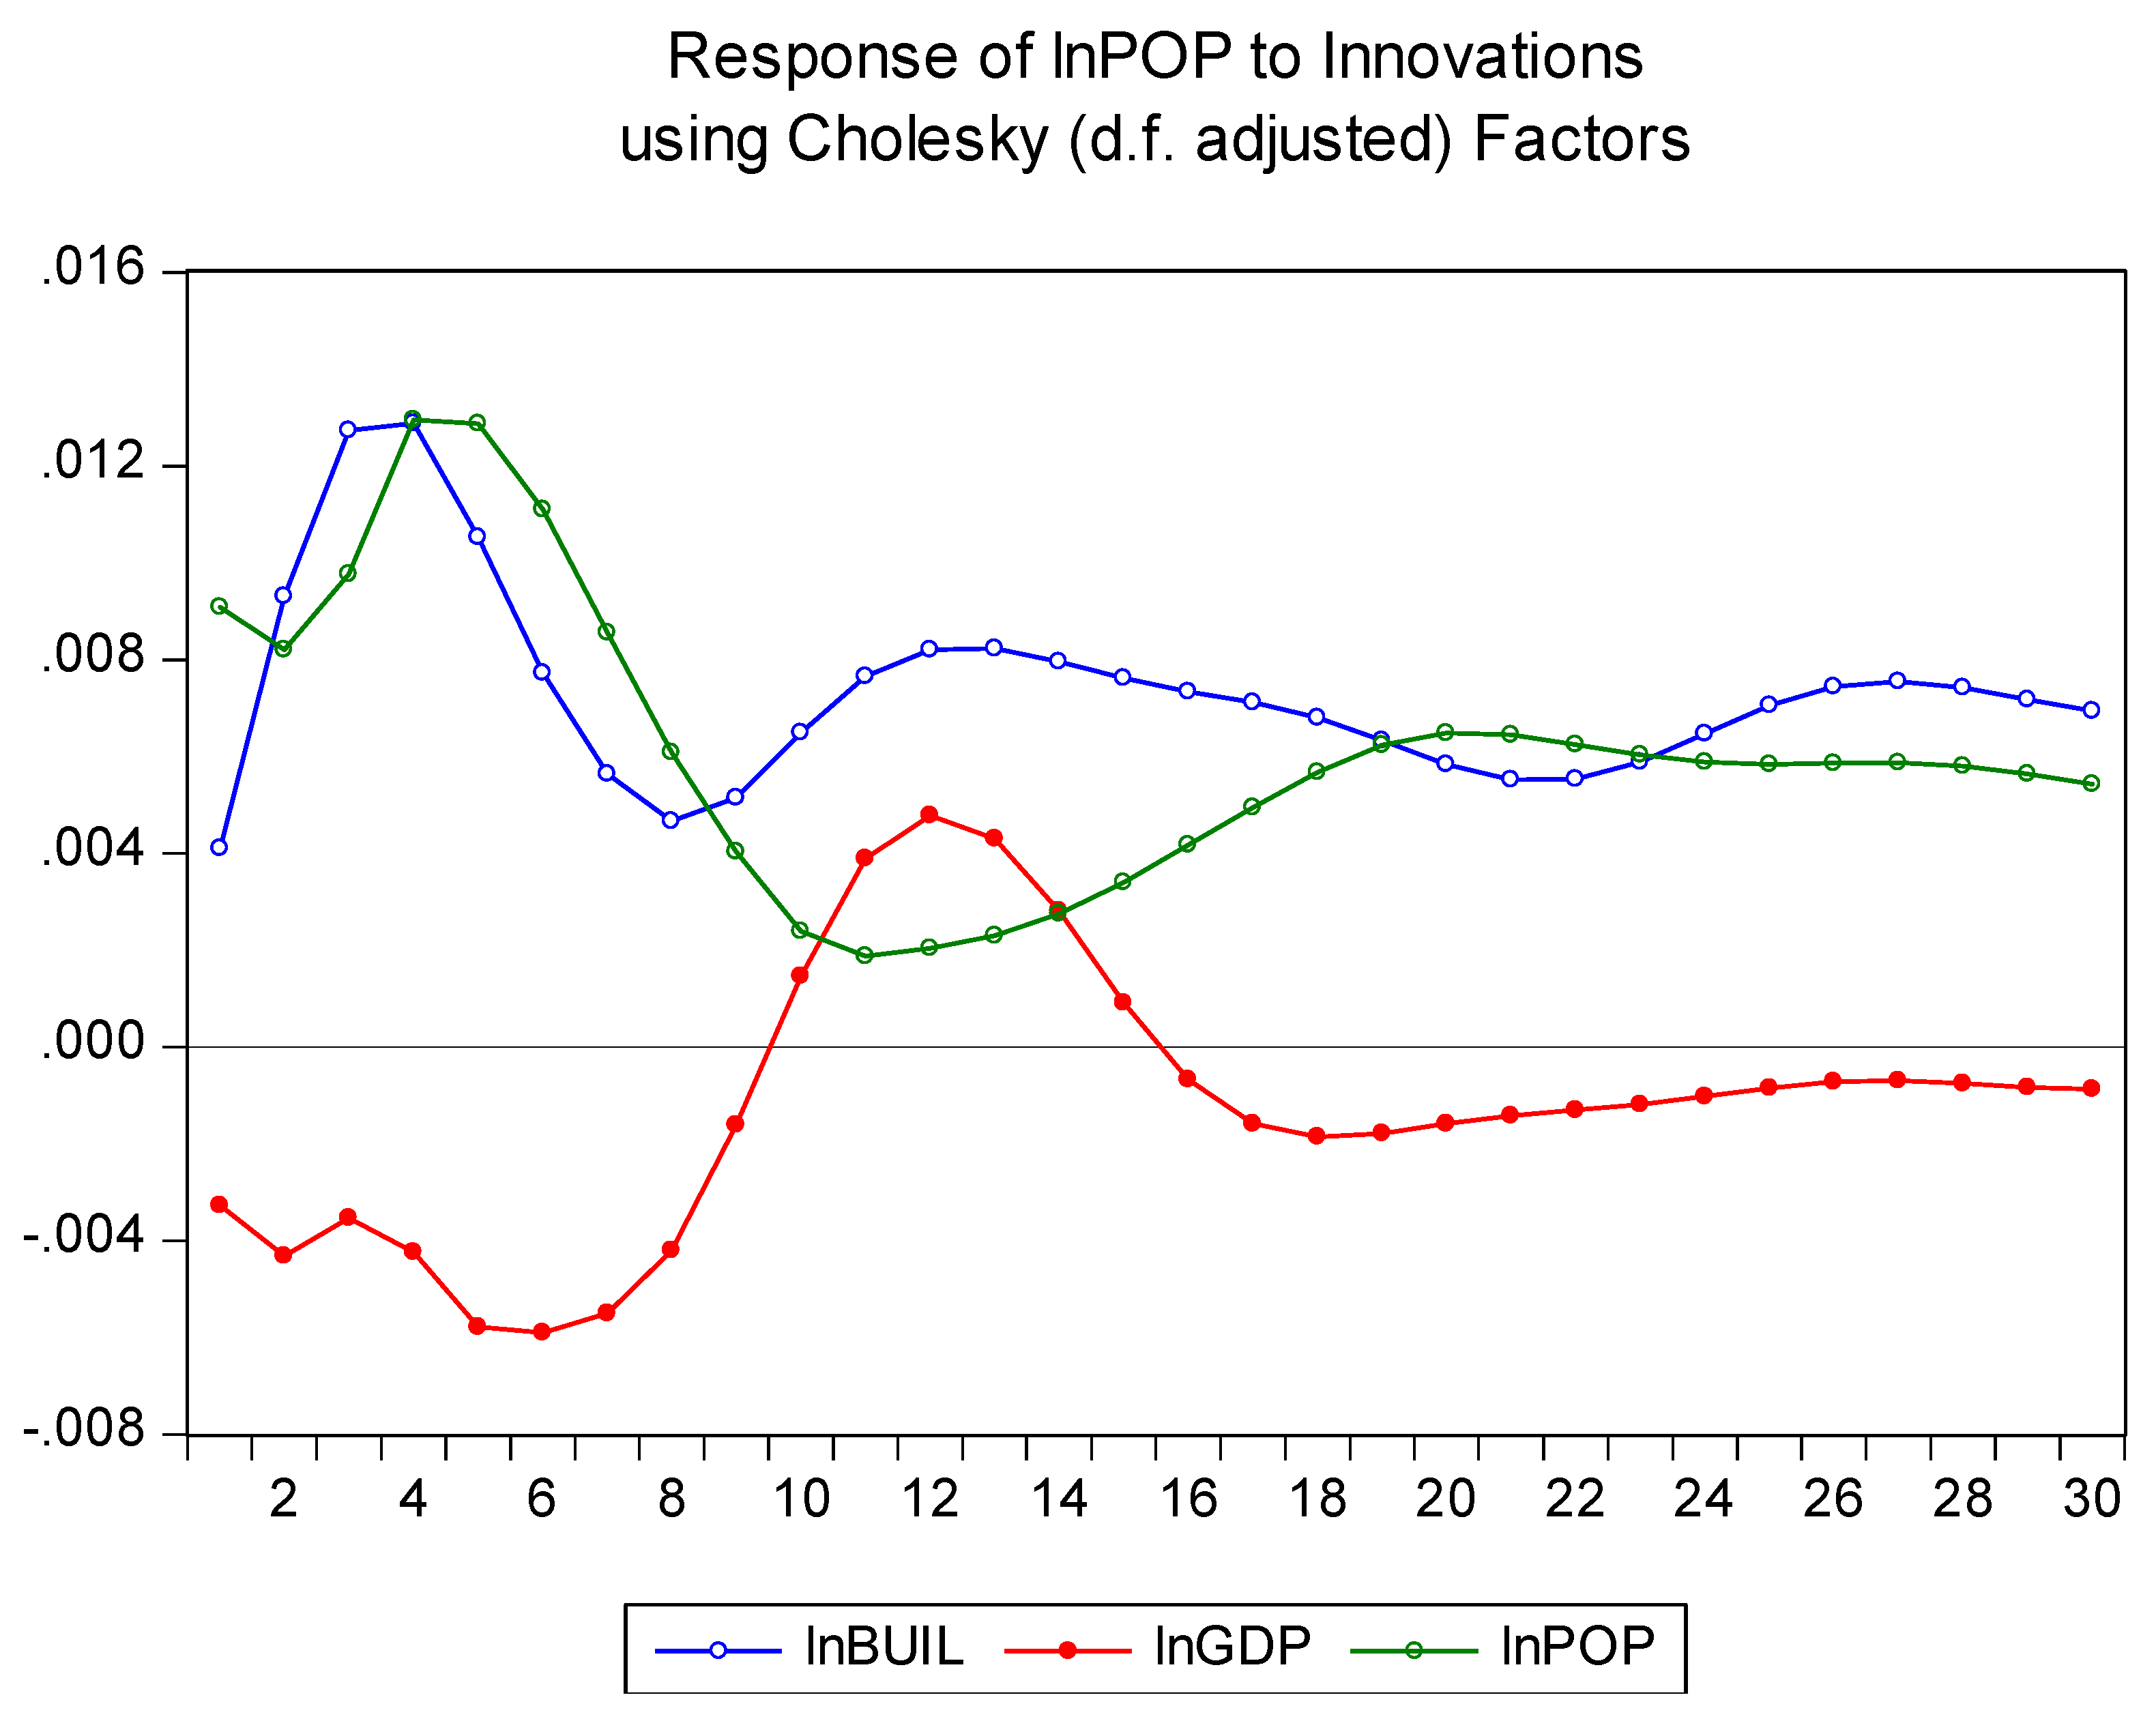
(2) Based on the impulse response function among urban expansion, economic development and population growth, it can be seen that the impact of a standard deviation shock of urban expansion on economic growth has a positive effect of continuous fluctuations and is a powerful force. The impact of a standard deviation of economic growth on urban expansion is relatively small and even has a negative effect. The impulse of population growth on urban expansion has a positive effect overall, and population growth has a certain long-term impact on urban expansion, but the short-term impact is more significant. Urban expansion will cause a rapid increase in population in the short term and will have a long-term positive and persistent impact, showing that there is a mutually reinforcing statistical relationship between urban expansion and population growth. Economic development is highly responsive to population growth. In the long run, population growth has a positive pulse effect on economic growth, and this effect gradually declines after reaching a peak. Conversely, with the gradual increase in the level of economic development, it will have a negative impact on population growth.
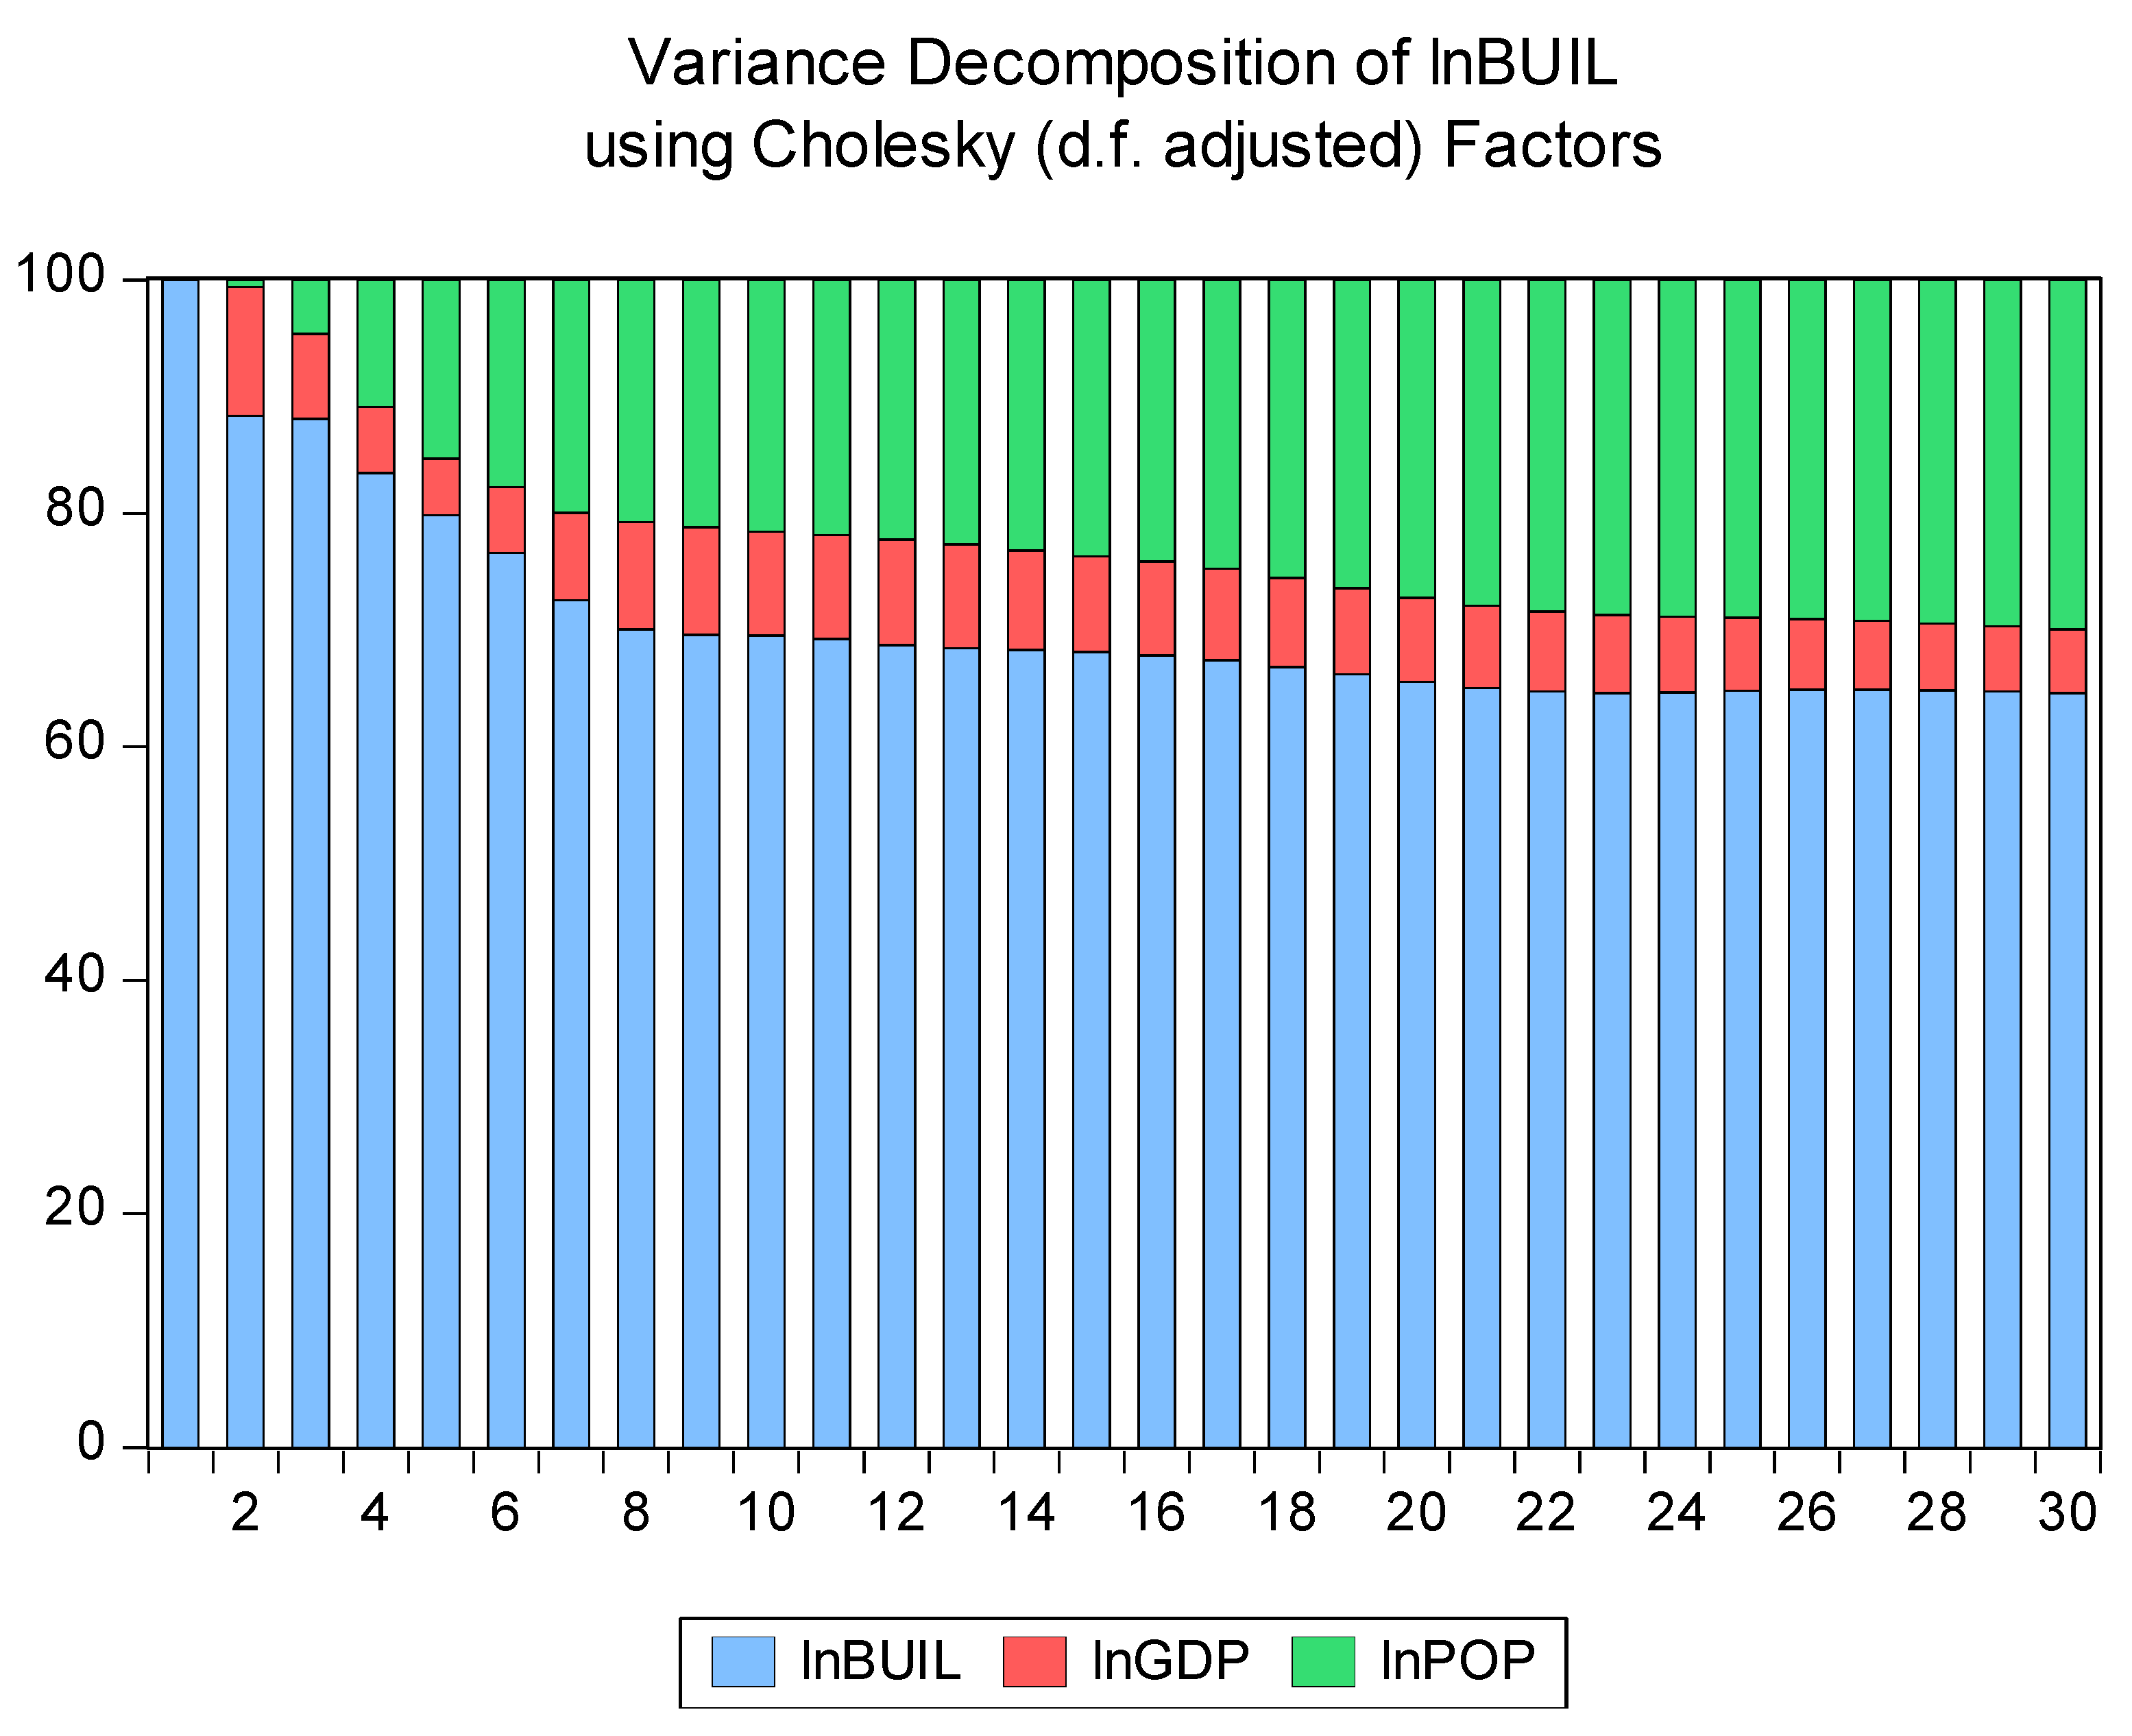
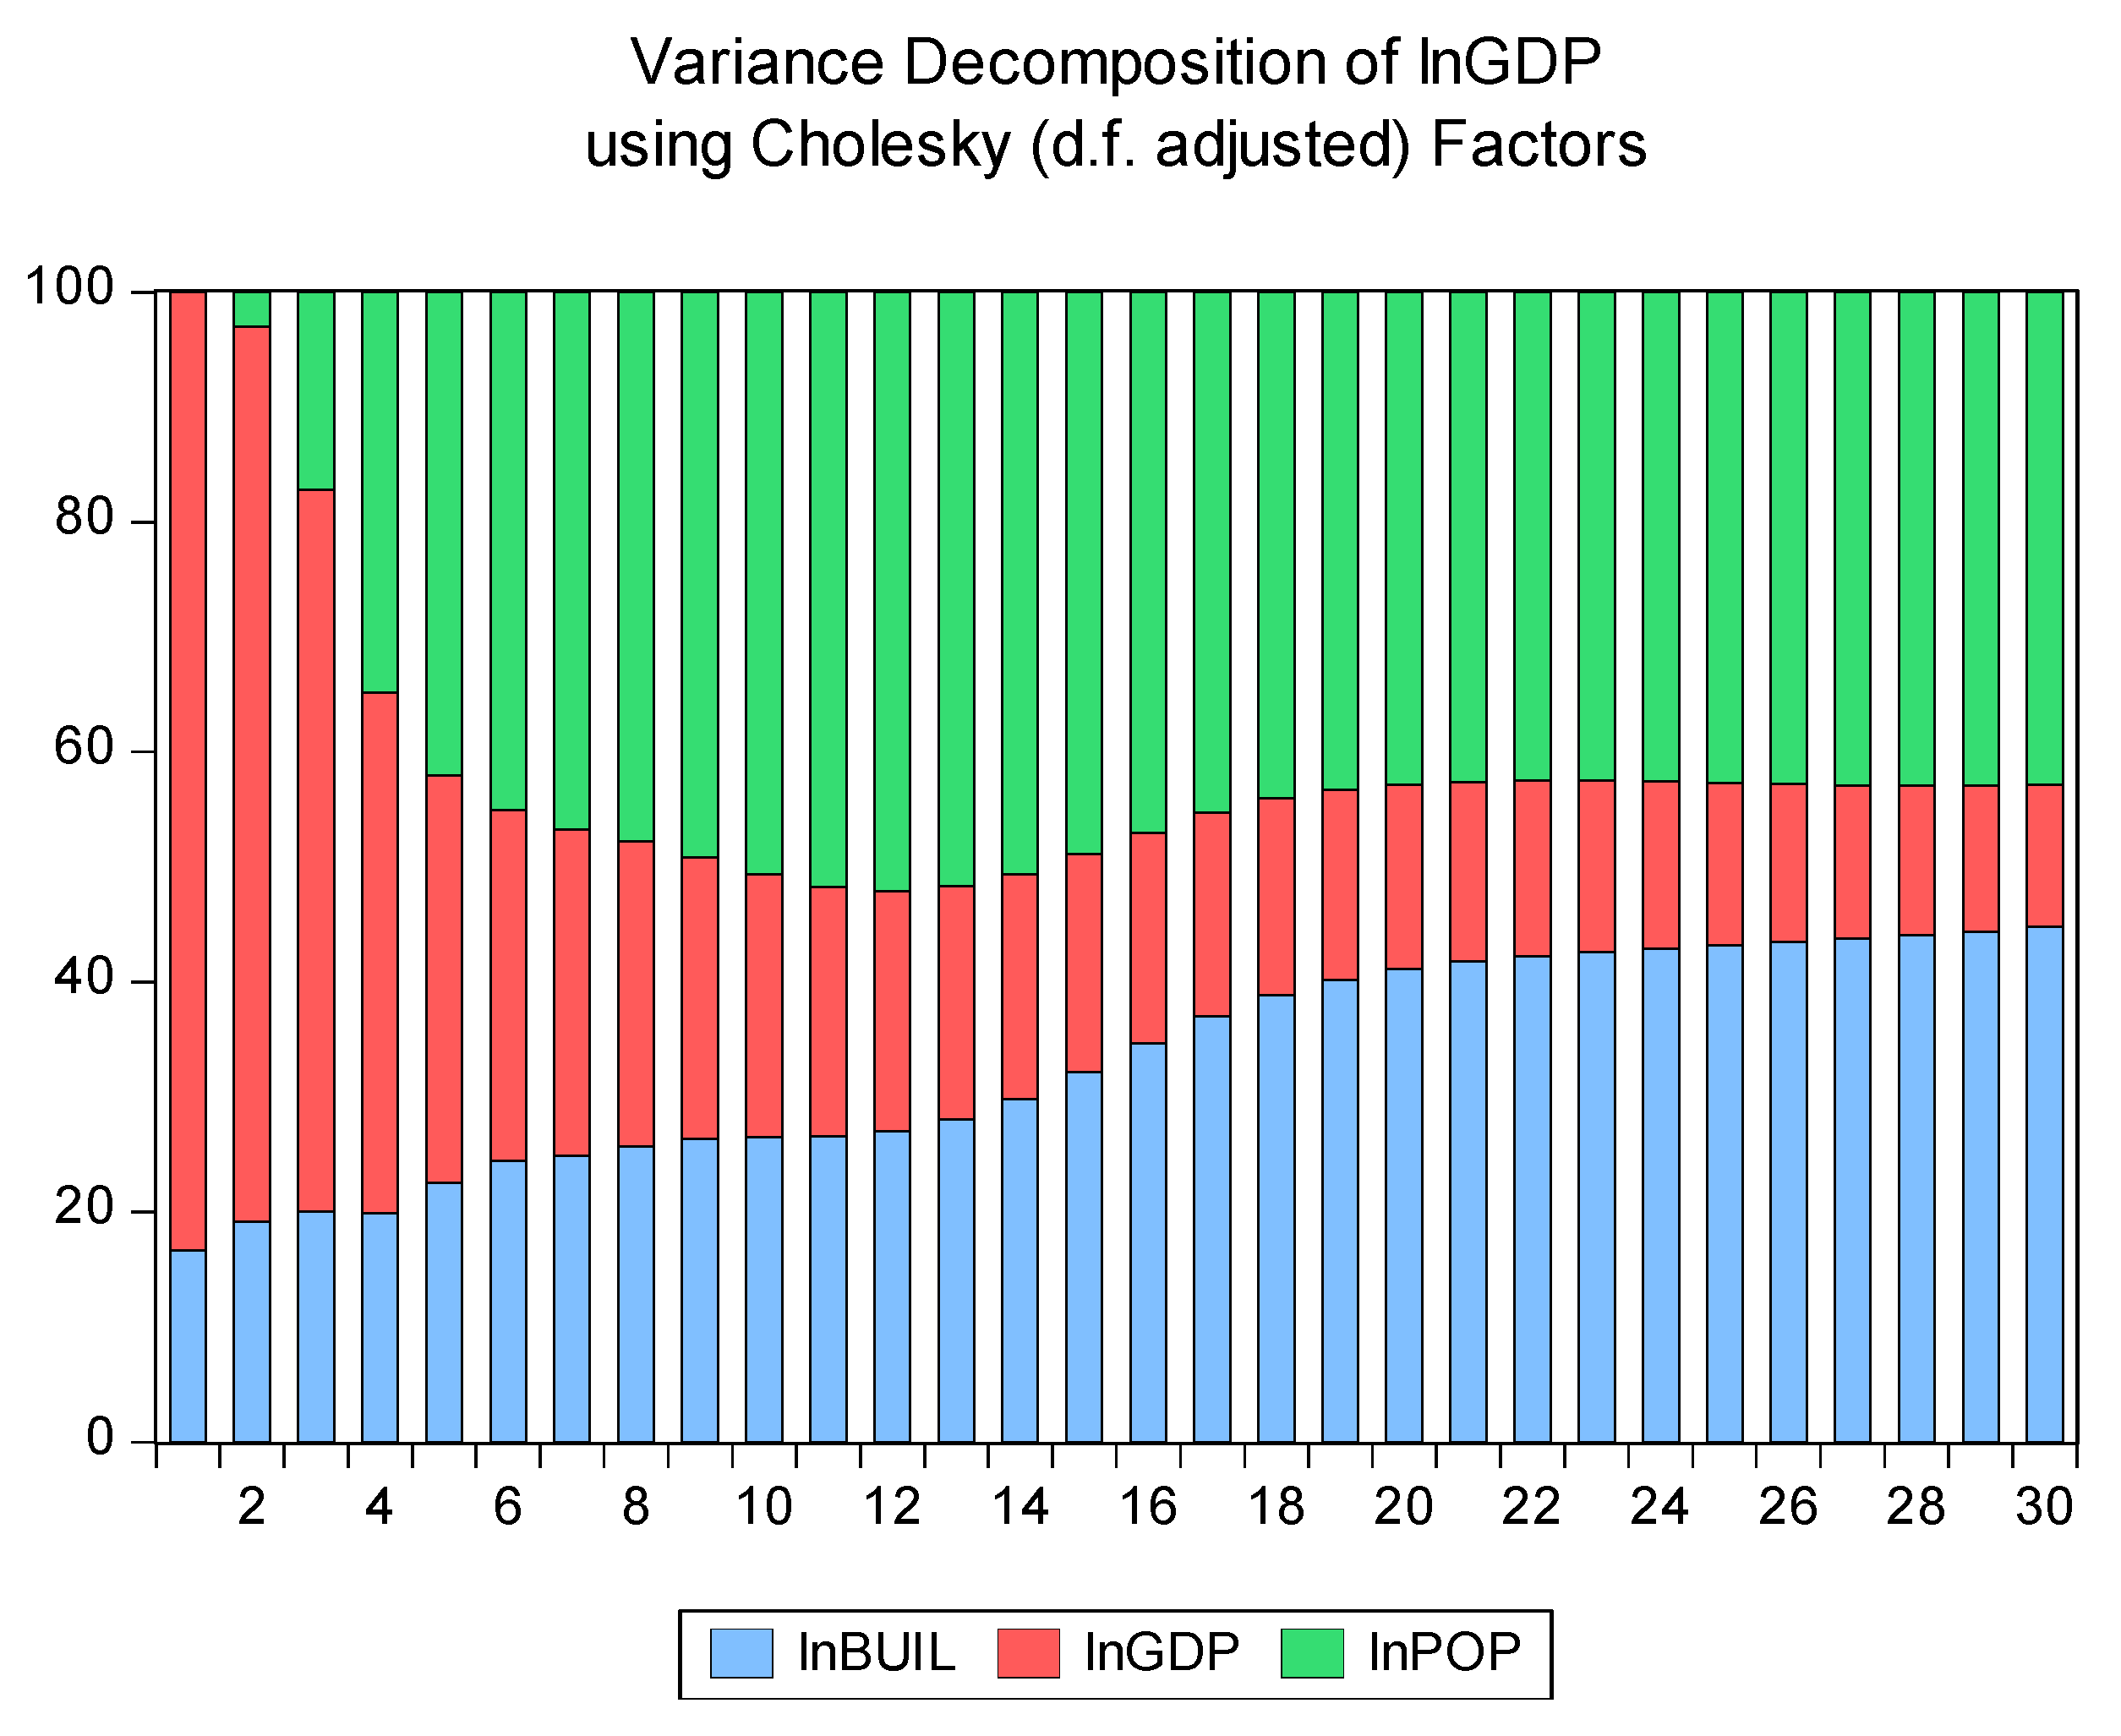
(3) The results of variance analysis indicate that urban expansion in China is mainly affected by the contribution of population growth, and it tends to be stable after it increases. The impact of economic development on urban expansion is decreasing and is generally low. Combined with the impulse response function graph, it can be shown that economic development has a certain inhibitory effect on urban expansion, but the suppression intensity is still insufficient. In the short term, the main factor that causes economic development to change is its own factors. However, with the passage of time, urban expansion, and population growth have become the main factors affecting economic development. After the variance decomposition of population growth, half of the predicted variance comes from urban expansion. However, the degree of contribution of economic development is only approximately 10%. This result shows that population growth is mainly affected by urban expansion, followed by the role of population itself, and minimally affected by economic development.

7.2. Policy Implications

Based on the above empirical analysis, this paper proposes the following policy recommendations:
(1) Protect limited land resources in China and promote sustainable urbanization. First, we should accelerate the reform of the land taxation system, adjust the land income distribution policy, rationally distribute the rights and financial power of the central government and local governments, and alleviate the excessive emphasis on economic indicators in the local performance appraisal system. At the same time, we should guide local governments to rationally examine and approve the transfer of commercial and residential land on the basis of ensuring that people have the services to optimize their livelihood and by following the laws of the market, thus abandoning the strategy of raising the price of commercial and residential land to obtain huge land sales revenue. For cities in coastal areas, we should continue to increase industrial integration and use limited land to develop new, highly competitive industries to achieve smart growth in cities and increase tax revenue. This will prevent the government from over-promoting urban expansion for political reasons and to generate fiscal revenues and consequently distorting the allocation of urban land resources. Cities in western China should regulate and rationally use fiscal revenue from transfer payments. Therefore, it is possible to abandon the old pathway of sacrificing land replacement capital for development, achieve intensive development, and alleviate urban expansion.
(2) The traditional economic development model not only wastes land resources, increases environmental pollution pressure, and threatens national food security; but it also causes economic development to lack vitality and motivation. Therefore, the economic growth model should be transformed, and more investment in land resources should be transformed into dependence on technology and capital investment to promote the upgrading and transformation of the industrial structure. First, the government should adopt the intensive use of land as a guiding ideology and prioritize the reuse of existing industrial land (especially inefficient industrial land). At the same time, it is necessary to give full play to the market mechanism and promote the structural reform of the supply side of industrial land so that scarce industrial land can truly serve the development of essential and advanced industries. Therefore, the rational allocation of land resources and the healthy development of the industrial economy can be promoted. On the other hand, the government should focus on promoting the development of emerging industries such as the internet technology industry, biotechnology, and new energy sources. The government should strive to improve the industrial level of leading regional industries and use its true economic value and leadership position to optimize and upgrade the regional industrial structure. In addition, the government should further improve the level of intensive land use and comprehensive land-use efficiency.
(3) Suburbanization is a process in which the surrounding towns assume the functions of the city center. The purpose is to create a reasonable spatial scale through a multi-center pattern, thereby inhibiting the sprawling expansion of the central city. In view of the current mismatch of residential and employment space in the suburbs, we should actively promote the integration and development of suburbs. On the one hand, it is necessary to actively and synergistically promote the suburbanization of housing and employment. This requires uniting the central urban population (that has moved to the suburbs) with employment, as well as moving urban functions to the suburbs. On the other hand, it is necessary to promote the interactive and coordinated suburbanization of the manufacturing and service industries and to reverse the phenomenon of excessive suburbanization, in which the manufacturing and service industries significantly lag behind residential suburbanization or do not match each other. At the same time, due to the sprawl of urbanization, it is easy to build a single type of residential real estate that cannot meet the demands of residents for public service infrastructure and objectively deprives residents of opportunities for health-promoting activities by imposing space restrictions. Therefore, there is an urgent need to explore a people-oriented suburbanization development policy. The formulation of urban planning and public policy requires more consideration of the issue of spatial fairness. It is necessary to rationally allocate the public activity resources of the suburbs according to the needs of residents and to compensate for the lack of urban public amenities caused by commercial capital-chasing interests. These changes will help provide an environment conducive to the physical and mental health of individuals [67].
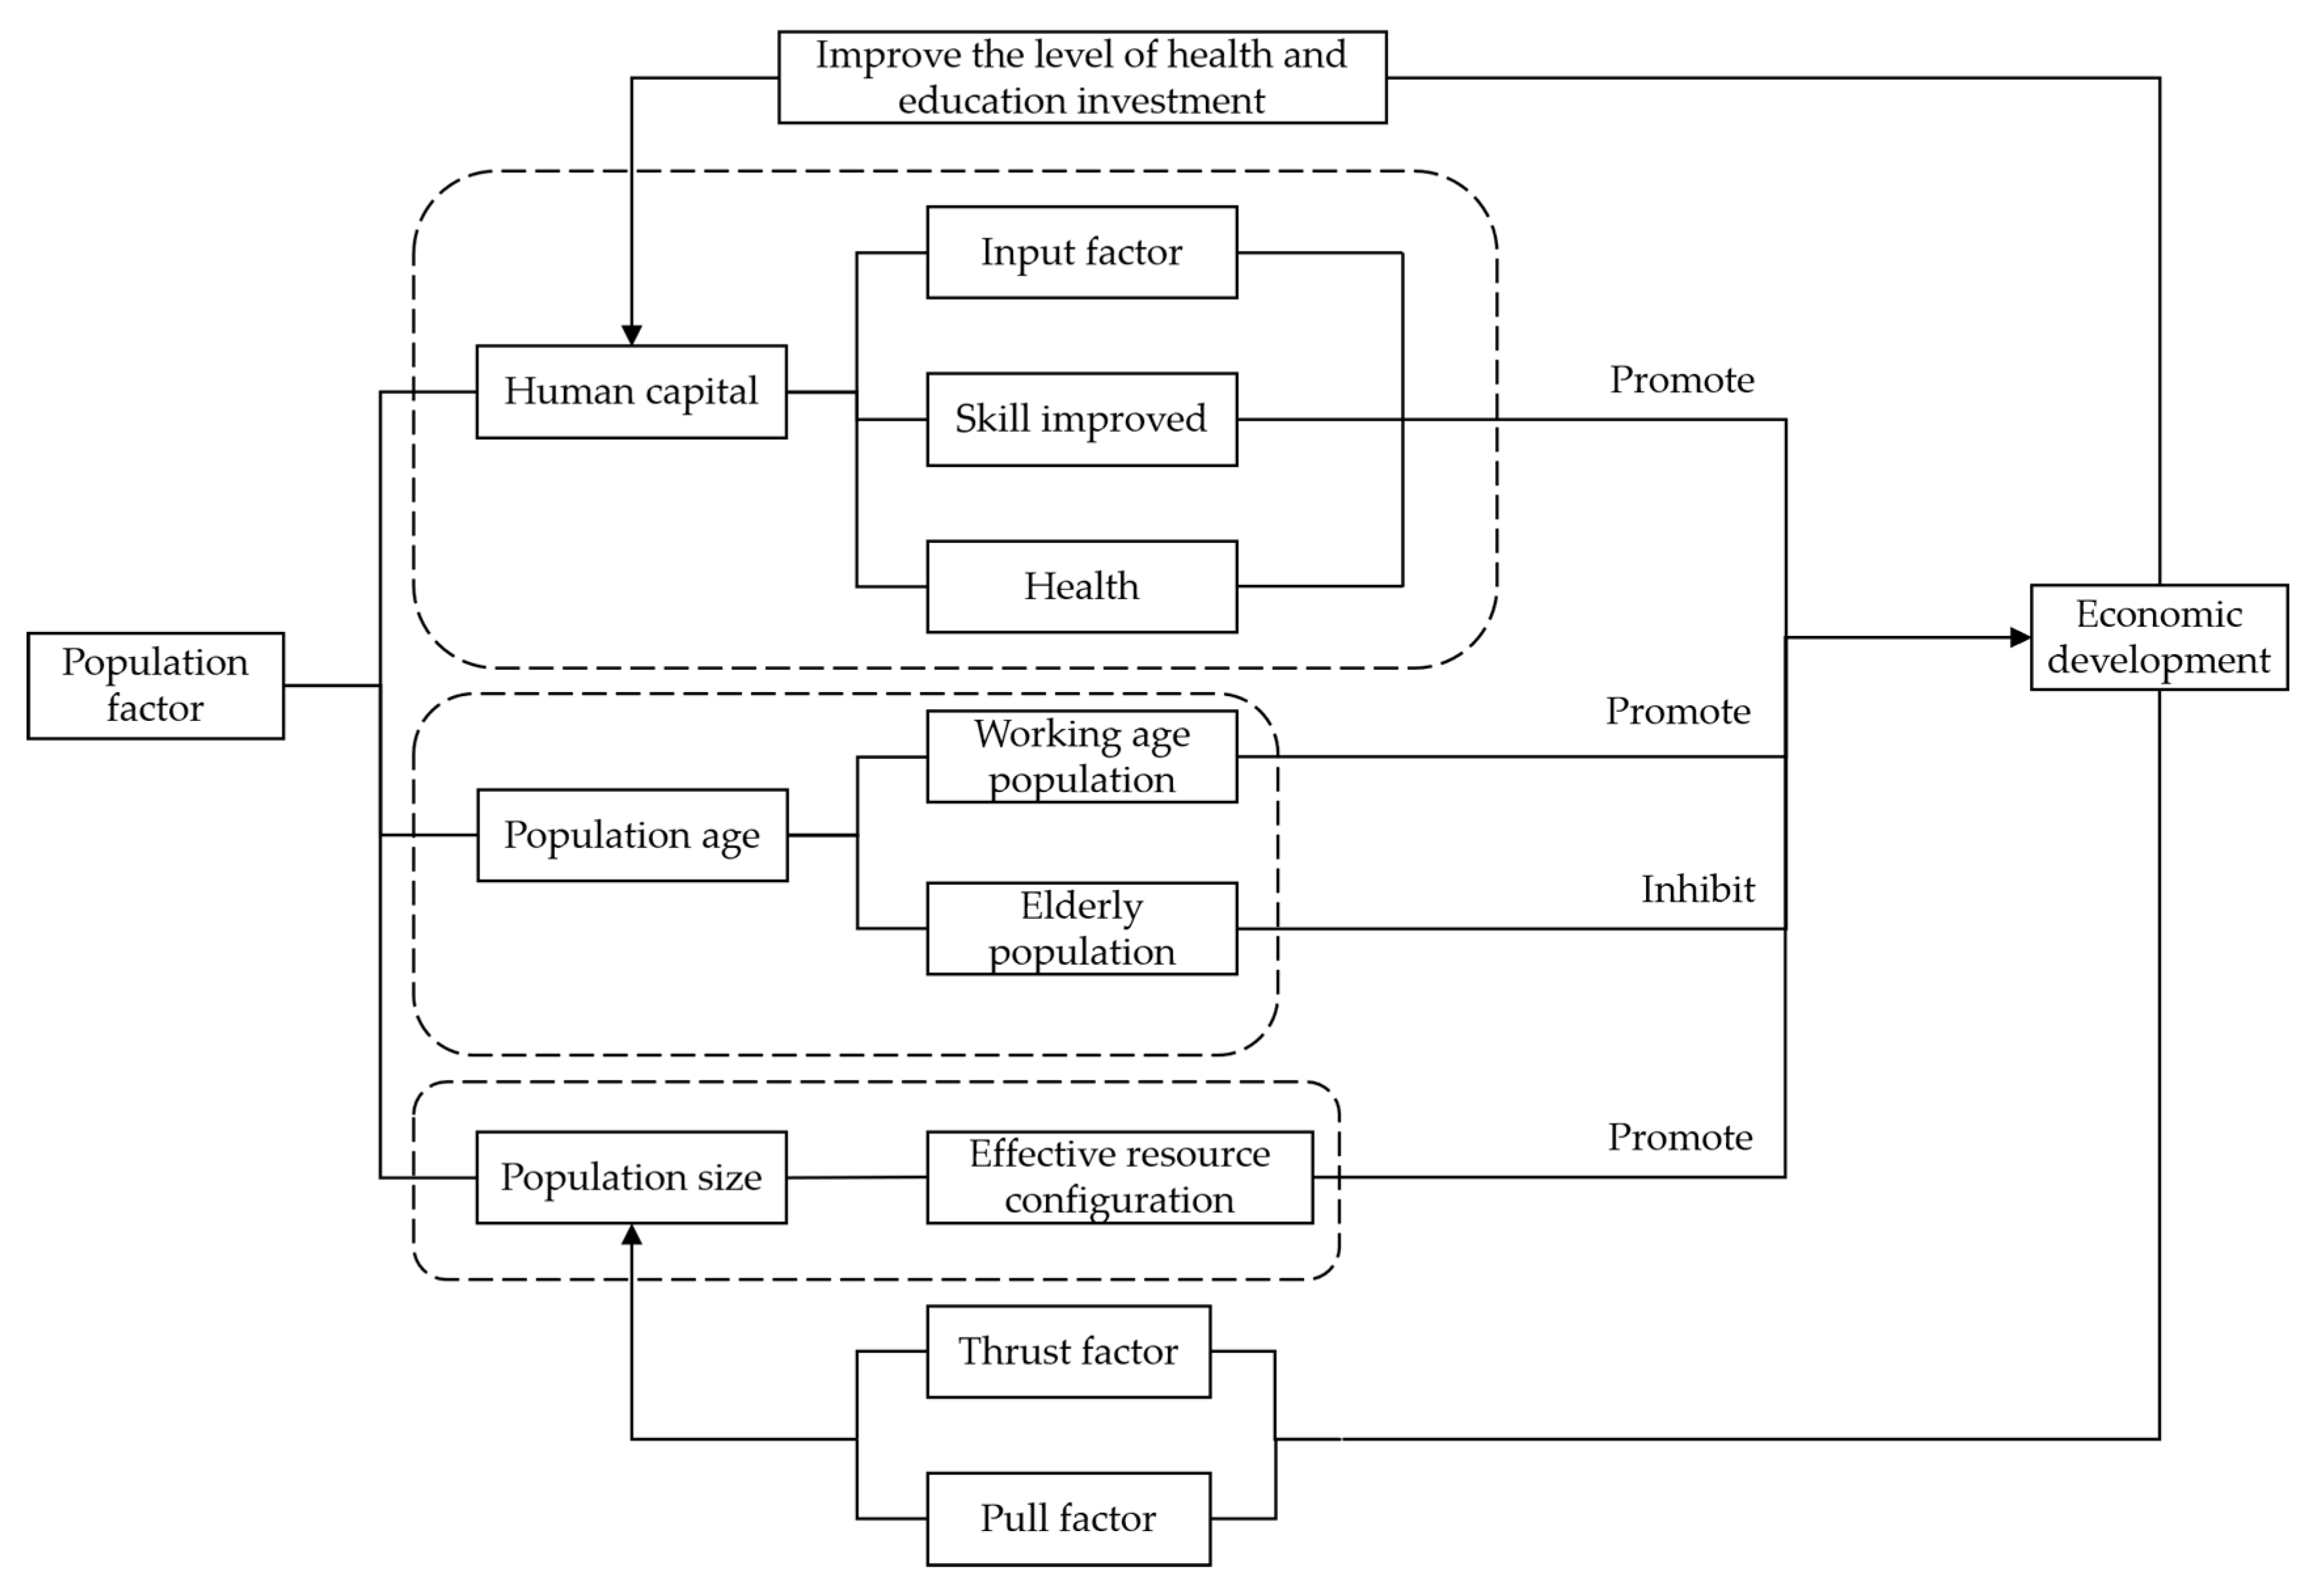
(4) Human capital has an important impact on economic development in China. The rational use and development of human capital as well as a better economic system, political system, and education system will help China’s human capital to positively promote its economic development. On the one hand, in the current situation of limited resources, the government should focus on investing in human capital to develop the economy. The government can accumulate abundant human capital through foreign investment, increase education expenditure, and adjusting the educational structure to achieve sustained and stable endogenous economic development. On the other hand, as the economy develops and the industrial structure is upgrading, the requirements for skill-based human capital will also increase. Therefore, the proportion of investment in vocational education can be improved to better serve the further development of the economy. From the perspective of public policy, local governments should continue to increase training intensities for low-skilled labor (including migrant workers), strengthen the combination of training and actual demand in the labor market, and improve the existing training system to improve the efficiency of training funds. These measures will help ordinary workers adapt to the challenges brought about by the upgrading of China’s industrial structure and help enterprises to more smoothly upgrade and transform the industrial structure.

Author Contributions

Y.Z. and H.X. conceptualized the research and performed the validation. Y.Z. and H.X. administered the project, developed the methodology, curated the data, conducted the formal analysis, produced visualizations, and wrote and prepared the original draft manuscript. Y.Z. and H.X. reviewed and edited the manuscript. H.X. acquired funding. All the authors contributed to drafting the manuscript and approved the final version of the manuscript.

Funding

This study was supported by the National Natural Science Foundation of China (no. 41971243); the Academic and Technical Leaders Funding Program for Major Disciplines in Jiangxi Province (no. 20172BCB22011); and the Fok Ying-Tung Fund (no. 141084).

Acknowledgments

The authors would like to thank the reviewers and the editor whose suggestions greatly improved the manuscript.

Conflicts of Interest

The authors declare no conflict of interest.

Appendix A

Table A1. Examination of ADF.
Variable NameForm(C,T,N)ADF1% Threshold5% Thresholdp-ValueTest Result
lnBUIL(C,T,2)−2.8776−4.2627−3.55290.1822Unstable
(C,0,4)−1.9251−3.6616−2.96040.3170Unstable
(0,0,1)4.5116−2.6347−1.9510−1.6109Unstable
lnGDP(C,T,2)−1.9282−4.2627−3.55290.6174Unstable
(C,0,2)−0.0349−3.6463−2.95400.9484Unstable
(0,0,2)3.1779−2.6369−1.95130.9993Unstable
lnPOP(C,T,1)−1.4982−4.2528−3.54840.8105Unstable
(C,0,1)−1.0782−3.6394−2.95110.7130Unstable
(0,0,1)5.4413−2.6347−1.95101.0000Unstable
lnBUIL(C,T,3)−3.5334−4.2845−3.56280.0532Unstable
(C,0,3)−2.9839−3.6616−2.96040.0475 **Stable
(0,0,5)−0.9059−2.6471−1.95290.3154Unstable
lnGDP(C,T,1)−3.5521−4.2627−3.55920.0490**Stable
(C,0,1)−3.6355−3.6436−2.95400.0103 **Stable
(0,0,0)−1.0740−2.6347−1.95100.2501Unstable
lnPOP(C,T,0)−6.7273−4.2528−3.54840.0000 ***Stable
(C,0,0)−6.6956−3.6394−2.95110.0000 ***Stable
(0,0,0)−2.6928−2.6347−1.95100.0086 ***Stable
Note: (1) Inspection form is (C,T,N), where C and T represent the intercept and trend items of the ADF test, respectively. N represents the lag order, and the selection principle is automatic—based on SIC, maxlag = 9. (2) **, *** indicate that the t-statistic passed the hypothesis test at the 5% and 1% significance levels.
Table A2. VAR lag order selection criteria.
LagLogLLRFPEAICSCHQ
1233.9373NA 1e-10−14.5121−14.0958−14.3764
2250.122926.105736.39e-11−14.9757−14.14303 **−14.7043
3259.997314.015346.26e-11−15.0321−13.7831−14.625
4274.862518.22187 **4.63e-11−15.4105−13.7452−14.8677
5286.652312.170124.43e-11 **−15.59047 **−13.5089−14.91192 **
Note: ** indicates the optimal lag period chosen for this criterion at a significance level of 5%.
Table A3. Trace test of Johansen cointegration.
No. of CE(s)EigenvalueStatistic0.05Critical ValueProb. **
None *0.80825767.1774229.797070
At most 1 *0.37029315.9777815.494710.0423
At most 20.0515371.6402773.8414660.2003
Note: *, ** indicate that the t-statistic passed the hypothesis test at the 10% and 5% significance levels, respectively. There is a cointegration relationship between variables.
Table A4. Maximum eigenvalue test of Johansen cointegration.
No. of CE(s)EigenvalueStatistic0.05Critical ValueProb. **
None *0.80825751.1996421.131620
At most 1 *0.37029314.337514.26460.0487
At most 20.0515371.6402773.8414660.2003
Note: *, ** indicate that the t-statistic passed the hypothesis test at the 10% and 5% significance levels, respectively. There is a cointegration relationship between variables.
Table A5. VECM estimation output.
Error Correction:lnBUILlnGDPlnPOP
CointEq1−0.13281−0.268270.093318
(0.07882)(0.11179)(0.05934)
[−1.68502][−2.39984][1.57262]
CointEq20.093949−0.17703−0.02174
(0.03174 **)(0.04502 **)(0.0239 **)
[2.95990][−3.93239][−0.90979]
R-squared0.8300390.8645060.684618
Adj. R-squared0.6813230.7459490.408658
F-statistic5.5813817.2919012.480865
Note: (1) The number in [] is the value of the t-statistic of the regression coefficient. (2) The number in () is the p value. (3) ** indicates that the t-statistic passed the hypothesis test with a 5% significance level.

References

  1. Ding, C.; Lichtenberg, E. Land and Urban Economic Growth in China. J. Reg. Sci. 2010, 51, 299–317. [Google Scholar] [CrossRef]
  2. Xinhua, Z.; Zhang, P.; Wei, Y.; Li, Y.; Zhao, H. Measuring the efficiency and driving factors of urban land use based on the DEA method and the PLS-SEM model—A case study of 35 large and medium-sized cities in China. Sustain. Cities Soc. 2019, 50, 101646. [Google Scholar] [CrossRef]
  3. Shu, C.; Xie, H.; Jiang, J.; Chen, Q. Is Urban Land Development Driven by Economic Development or Fiscal Revenue Stimuli in China? Land Use Policy 2018, 77, 107–115. [Google Scholar] [CrossRef]
  4. Liu, Y.; Liu, Y.; Chen, Y.; Long, H. The process and driving forces of rural hollowing in China under rapid urbanization. J. Geogr. Sci. 2010, 20, 876–888. [Google Scholar] [CrossRef]
  5. Jiang, L.; Deng, X.; Seto, K. Multi-level modeling of urban expansion and cultivated land conversion for urban hotspot counties in China. Landsc. Urban Plan. 2012, 108, 131–139. [Google Scholar] [CrossRef]
  6. Hui, E.; Bao, H.; Zhang, X. The policy and praxis of compensation for land expropriations in China: An appraisal from the perspective of social exclusion. Land Use Policy 2013, 32, 309–316. [Google Scholar] [CrossRef]
  7. De Ridder, K.; Lefebre, F.; Adriaensen, S.; Arnold, U.; Beckroege, W. Simulating the impact of urban sprawl on air quality and population exposure in the German Ruhr area. Part II: Development and evaluation of an urban growth scenario. Atmos. Environ. 2008, 42, 7070–7077. [Google Scholar] [CrossRef]
  8. Yeo, J.; Park, S.; Jang, K. Effects of Urban Sprawl and Vehicle Miles Traveled on Traffic Fatalities. Traffic Inj. Prev. 2014, 16, 397–403. [Google Scholar] [CrossRef]
  9. Xian, S.; Li, L.; Qi, Z. Toward a sustainable urban expansion: A case study of Zhuhai, China. J. Clean. Prod. 2019, 230, 276–285. [Google Scholar] [CrossRef]
  10. Henderson, V. The Urbanization Process and Economic Growth: The So-What Question. J. Econ. Growth 2003, 8, 47–71. [Google Scholar] [CrossRef]
  11. Whiting, S. Values in Land: Fiscal Pressures, Land Disputes and Justice Claims in Rural and Peri-urban China. Urban Stud. 2011, 48, 569–587. [Google Scholar] [CrossRef]
  12. Chang, G.; Brada, J. The paradox of China’s growing under-urbanization. Econ. Syst. 2006, 30, 24–40. [Google Scholar] [CrossRef]
  13. Engle, R.; Granger, C. Co-Integration and Error Correction: Representation, Estimation, and Testing. Econometrica 1987, 55, 251–276. [Google Scholar] [CrossRef]
  14. Du, D. The causal relationship between land urbanization quality and economic growth: Evidence from capital cities in China. Qual. Quant. 2016, 51, 2707–2723. [Google Scholar] [CrossRef]
  15. Narayan, L. Relationship between Urbanisation and Economic Growth: A Causality Analysis for India. Indian J. Econ. Dev. 2016, 12, 237–242. [Google Scholar] [CrossRef]
  16. Gao, J.; Wei, Y.; Chen, W.; Chen, J. Economic transition and urban land expansion in Provincial China. Habitat Int. 2014, 44, 461–473. [Google Scholar] [CrossRef]
  17. Ma, Y.; Xu, R. Remote sensing monitoring and driving force analysis of urban expansion in Guangzhou City, China. Habitat Int. 2010, 34, 228–235. [Google Scholar] [CrossRef]
  18. Reilly, M.; O’Mara, M.; Seto, K. From Bangalore to the Bay Area: Comparing transportation and activity accessibility as drivers of urban growth. Landsc. Urban Plan. 2009, 92, 24–33. [Google Scholar] [CrossRef]
  19. Osman, T.; Divigalpitiya, P.; Arima, T. Driving factors of urban sprawl in Giza governorate of the Greater Cairo Metropolitan Region using a logistic regression model. Int. J. Urban Sci. 2016, 20, 206–225. [Google Scholar] [CrossRef]
  20. Li, G.; Sun, S.; Fang, C. The varying driving forces of urban expansion in China: Insights from a spatial-temporal analysis. Landsc. Urban Plan. 2018, 174, 63–77. [Google Scholar] [CrossRef]
  21. Deng, X.; Huang, J.; Rozelle, S.; Uchida, E. Economic Growth and the Expansion of Urban Land in China. Urban Stud. 2009, 47, 813–843. [Google Scholar] [CrossRef]
  22. Tan, M.; Li, X.; Xie, H.; Lu, C. Urban land expansion and arable land loss in China—A case study of Beijing–Tianjin–Hebei region. Land Use Policy 2005, 22, 187–196. [Google Scholar] [CrossRef]
  23. Abdullah, J. City Competitiveness and Urban Sprawl: Their Implications to Socio-Economic and Cultural Life in Malaysian Cities. Procedia Soc. Behav. Sci. 2012, 50, 20–29. [Google Scholar] [CrossRef] [Green Version]
  24. Yang, Y.; Feng, Z.; Zhao, Y. Coordination between urban land expansion and population growth in China. Geogr. Res. 2013, 32, 1668–1678. [Google Scholar]
  25. Chen, M.; Gong, Y.; Lu, D.; Ye, C. Build a people-oriented urbanization: China’s new-type urbanization dream and Anhui model. Land Use Policy 2019, 80, 1–9. [Google Scholar] [CrossRef]
  26. Golini, A.; Bartolomeo, A. The impact of a massive migration flow on the regional population structure: The case of Italy. Vienna Yearb. Popul. Res. 2009, 7, 149–165. [Google Scholar] [CrossRef]
  27. Fleisher, B.; Li, H.; Zhao, M. Human capital, economic growth, and regional inequality in China. J. Dev. Econ. 2010, 92, 215–231. [Google Scholar] [CrossRef] [Green Version]
  28. Zhang, K.; Song, S. Rural-Urban Migration and Urbanization in China. Ser. Contemp. China 2011, 14, 279–300. [Google Scholar]
  29. Gries, T.; Naudé, W. Entrepreneurship and structural economic transformation. Small Bus. Econ. 2009, 34, 13–29. [Google Scholar] [CrossRef] [Green Version]
  30. Ball, M. Differential rent and the role of landed property. Int. J. Urban Reg. Res. 1977, 1, 380–403. [Google Scholar] [CrossRef]
  31. Cao, Q.; Yu, D.; Georgescu, M.; Wu, J.; Wang, W. Impacts of future urban expansion on summer climate and heat-related human health in eastern China. Environ. Int. 2018, 112, 134–146. [Google Scholar] [CrossRef] [PubMed]
  32. Ishaya, S.; Ifatimehin, O.O.; Okafor, C. Remote sensing and gis applications in urban expansion and loss of vegetation cover in kaduna town, northern nigeria. Am. Eurasian J. Sustain. Agric. 2008, 2, 117–124. [Google Scholar]
  33. Liao, J.; Wang, T.; Jiang, Z.; Zhuang, B.; Xie, M.; Yin, C. WRF/Chem modeling of the impacts of urban expansion on regional climate and air pollutants in Yangtze River Delta, China. Atmos. Environ. 2015, 106, 204–214. [Google Scholar] [CrossRef]
  34. Xu, H.; Ding, F.; Wen, X. Urban Expansion and Heat Island Dynamics in the Quanzhou Region, China. IEEE J. Sel. Top. Appl. Earth Obs. Remote Sens. 2009, 2, 74–79. [Google Scholar] [CrossRef]
  35. Dong, Y.; Liu, Y.; Chen, J. Will urban expansion lead to an increase in future water pollution loads?—A preliminary investigation of the Haihe River Basin in northeastern China. Environ. Sci. Pollut. Res. 2014, 21, 7024–7034. [Google Scholar] [CrossRef]
  36. Seto, K.; Guneralp, B.; Hutyra, L. Global forecasts of urban expansion to 2030 and direct impacts on biodiversity and carbon pools. Proc. Natl. Acad. Sci. USA 2012, 109, 16083–16088. [Google Scholar] [CrossRef] [Green Version]
  37. Chiu, Y.; Shyu, M.; Lee, J.; Lu, C. Undesirable output in efficiency and productivity: Example of the G20 countries. Energy Sources Part B Econ. Plan. Policy 2016, 11, 237–243. [Google Scholar] [CrossRef]
  38. Sharifi, A.; Hosseingholizadeh, M. The Effect of Rapid Population Growth on Urban Expansion and Destruction of Green Space in Tehran from 1972 to 2017. J. Indian Soc. Remote Sens. 2019, 47, 1063–1071. [Google Scholar] [CrossRef]
  39. Weinhold, D.; Reis, E. Model Evaluation and Causality Testing in Short Panels: The Case of Infrastructure Provision and Population Growth in the Brazilian Amazon. J. Reg. Sci. 2001, 41, 639–657. [Google Scholar] [CrossRef]
  40. Faria, H.; Montesinos-Yufa, H.; Morales, D.; Navarro, C. Unbundling the roles of human capital and institutions in economic development. Eur. J. Political Econ. 2016, 45, 108–128. [Google Scholar] [CrossRef] [Green Version]
  41. Fahimi, A.; Akadiri, S.; Seraj, M.; Akadiri, A. Testing the role of tourism and human capital development in economic growth. A panel causality study of micro states. Tour. Manag. Perspect. 2018, 28, 62–70. [Google Scholar] [CrossRef]
  42. Wang, C. History of the Chinese Family Planning program: 1970–2010. Contraception 2012, 85, 563–569. [Google Scholar] [CrossRef] [PubMed]
  43. Ogundari, K.; Awokuse, T. Human capital contribution to economic growth in Sub-Saharan Africa: Does health status matter more than education? Econ. Anal. Policy 2018, 58, 131–140. [Google Scholar] [CrossRef]
  44. Zhang, H.; Zhang, H.; Zhang, J. Demographic age structure and economic development: Evidence from Chinese provinces. J. Comp. Econ. 2015, 43, 170–185. [Google Scholar] [CrossRef]
  45. Zheng, T.; Wang, X.; Guo, H. Estimating forward-looking rules for China’s Monetary Policy: A regime-switching perspective. China Econ. Rev. 2012, 23, 47–59. [Google Scholar] [CrossRef]
  46. Luetkepohl, H.; Staszewska-Bystrova, A.; Winker, P. Comparison of Methods for Constructing Joint Confidence Bands for Impulse Response Functions. Int. J. Forecast. 2015, 31, 782–798. [Google Scholar] [CrossRef]
  47. Sims, C. Comparison of Interwar and Postwar Business Cycles: Monetarism Reconsidered. NBER Work. Pap. 1980, 70, 250–257. [Google Scholar]
  48. Deng, X.; Huang, J.; Rozelle, S.; Uchida, E. Growth, population and industrialization, and urban land expansion of China. J. Urban Econ. 2008, 63, 96–115. [Google Scholar] [CrossRef]
  49. Zheng, H.; Wang, X.; Cao, S. The land finance model jeopardizes China’s sustainable development. Habitat Int. 2014, 44, 130–136. [Google Scholar] [CrossRef]
  50. Shen, X.; Wang, L.; Wang, X.; Zhang, Z.; Lu, Z. Interpreting non-conforming urban expansion from the perspective of stakeholders’ decision-making behavior. Habitat Int. 2019, 89, 102007. [Google Scholar] [CrossRef]
  51. Xu, X.; Li, D.; Zhao, M. “Made in China” matters: Integration of the global labor market and the global labor share decline. China Econ. Rev. 2018, 52, 16–29. [Google Scholar] [CrossRef]
  52. Jiwattanakulpaisarn, P.; Noland, R.; Graham, D.; Polak, J. Highway Infrastructure Investment and Regional Employment Growth: Dynamic Panel Regression Analysis. J. Reg. Sci. 2009, 49, 263–286. [Google Scholar] [CrossRef]
  53. Benhabib, J.; Spiegel, M. The role of human capital in economic development evidence from aggregate cross-country data. J. Monet. Econ. 1994, 34, 143–173. [Google Scholar] [CrossRef]
  54. Tamura, R. Human capital and economic development. J. Dev. Econ. 2006, 79, 26–72. [Google Scholar] [CrossRef] [Green Version]
  55. Yue, W.; Fan, P.; Wei, Y.; Qi, J. Economic development, urban expansion, and sustainable development in Shanghai. Stoch. Environ. Res. Risk Assess. 2012, 28, 783–799. [Google Scholar] [CrossRef]
  56. Guo, Y.; Wang, J.; Peeta, S.; Anastasopoulos, P. Impacts of internal migration, household registration system, and family planning policy on travel mode choice in China. Travel Behav. Soc. 2018, 13, 128–143. [Google Scholar] [CrossRef]
  57. Liu, X.; Bae, J. Urbanization and industrialization impact of CO2 emissions in China. J. Clean. Prod. 2018, 172, 178–186. [Google Scholar] [CrossRef]
  58. Luo, T.; Tan, R.; Kong, X.; Zhou, J. Analysis of the Driving Forces of Urban Expansion Based on a Modified Logistic Regression Model: A Case Study of Wuhan City, Central China. Sustainability 2019, 11, 2207. [Google Scholar] [CrossRef]
  59. Azhdari, A.; Sasani, M.; Soltani, A. Exploring the relationship between spatial driving forces of urban expansion and socioeconomic segregation: The case of Shiraz. Habitat Int. 2018, 81, 33–44. [Google Scholar] [CrossRef]
  60. Silva, P.; Li, L. Mapping Urban Expansion and Exploring Its Driving Forces in the City of Praia, Cape Verde, from 1969 to 2015. Sustainability 2017, 9, 1434. [Google Scholar] [CrossRef]
  61. Lei, M.; Yin, Z.; Yu, X.; Deng, S. Carbon-weighted economic development performance and driving force analysis: Evidence from China. Energy Policy 2017, 111, 179–192. [Google Scholar] [CrossRef]
  62. Wu, C.; Dang, K.; Zhao, C.; Zhang, H. A driving force for sustainable economic growth in China from the wave-like effects of technological diffusion. Appl. Econ. Lett. 2018, 26, 1228–1233. [Google Scholar] [CrossRef]
  63. Jeanty, P.; Partridge, M.; Irwin, E. Estimation of a spatial simultaneous equation model of population migration and housing price dynamics. Reg. Sci. Urban Econ. 2010, 40, 343–352. [Google Scholar] [CrossRef]
  64. Yu, T. Spatial-temporal Features and Influential Factors of the China Urban Floating Population Growth. Chin. J. Popul. Sci. 2012, 4, 47–58. [Google Scholar]
  65. Fu, Y.; Gabriel, S. Labor migration, human capital agglomeration and regional development in China. Reg. Sci. Urban Econ. 2012, 42, 473–484. [Google Scholar] [CrossRef]
  66. Xie, H.; Zhu, Z.; Wang, B.; Liu, G.; Zhai, Q. Does the Expansion of Urban Construction Land Promote Regional Economic Growth in China? Evidence from 108 Cities in the Yangtze River Economic Belt. Sustain. 2018, 10, 4073. [Google Scholar] [CrossRef]
  67. Zhang, L.; Yue, W.; Liu, Y.; Fan, P.; Wei, Y. Suburban industrial land development in transitional China: Spatial restructuring and determinants. Cities 2018, 78, 96–107. [Google Scholar] [CrossRef]
Figure 1. Two-way interaction mechanism between urban expansion and economic development.
Land 08 00153 g001
Figure 2. Two-way interaction mechanism between economic development and population growth.
Land 08 00153 g002
Figure 3. VECM model stability examination.
Land 08 00153 g003
Figure 4. Impulse response results of l n B U I L .
Land 08 00153 g004
Figure 5. Variance Decomposition of l n B U I L .
Land 08 00153 g005
Figure 6. Relationship between land investment and technical progress caused by the quality of economic development.
Land 08 00153 g006
Figure 7. Impulse response results of l n G D P .
Land 08 00153 g007
Figure 8. Variance decomposition of l n G D P .
Land 08 00153 g008
Figure 9. Impulse response results of l n P O P .
Land 08 00153 g009
Figure 10. Variance decomposition of l n P O P .
Land 08 00153 g010
Table 1. Driving force analysis of urban expansion, economic development and population growth.
Research ObjectDependent VariablesIndependent VariablesModel
Urban expansionProbability of occurrence urban expansionNatural environment factors, accessibility factors, policy-oriented factors [58]Modified logistic regression model
Probability of land use conversationAccessibility factors, neighborhood factor, environmental factors [59]Geographically weighted logistic regression
Built-up areaRoad density, amount of infrastructure, accessibility factors, Number of infrastructure, industrial area (binary variable) [60]OLS regression
Economic developmentCarbon-weighted economic developmentFDI, foreign trade, industrial structure, local fiscal expenditure, energy consumption structure [61]Panel vector auto-regression (PVAR) model
Total output of regionLabor input, FDI, R&D, ability to absorb technical knowledge [62]Spatial Durbin model
Economic growthCapital stock of local cities, labor level, investment level of urban construction landSpatial autoregressive model with spatial autoregressive disturbances (SARAR)
Population growthPercent change in tract population from 1990 to 2000Demographic variables, housing characteristics, economic variables, agglomeration variables, amenity variables [63]Spatial autoregressive lag simultaneity (SARLS model) and FS (feedback simultaneity)- SARLS
Population growth Comprehensive opportunity, quality of life, secondary industry development, primary industry development, railway [64]Correlation analysis
Number of labor migrationWages, income level, urban workforce size, consumption level, climatic conditions [65]Directional migration odds model

