Article

Modelling Land Cover Changes in Peri-Urban Areas: A Case Study of George Town Conurbation, Malaysia

Geography Section, School of Humanities, Universiti Sains Malaysia, 11800 Penang, Malaysia
*
Author to whom correspondence should be addressed.
Submission received: 19 August 2020 / Revised: 2 October 2020 / Accepted: 3 October 2020 / Published: 5 October 2020
(This article belongs to the Section Urban Contexts and Urban-Rural Interactions)

Abstract

:
Drastic growth of urban populations has caused expansion of peri-urban areas—the transitional zone between a city and its hinterland. Although urbanisation may bring economic opportunities and improve infrastructure in an area, uncontrolled urban expansion towards peri-urban areas will negatively impact the environment and the community living within the area. Malaysia, for example, has become one of the most urbanised countries in East Asia. However, cities in Malaysia are relatively small and less densely populated compared with other cities in East Asia. This indicates that urban expansion has been sprawling towards peri-urban areas, and not being controlled and properly managed. To ensure urban expansions occur sustainably, urban growth boundary (UGB) can potentially be used as a mechanism to contain and limit urban expansion, and allow urban growth to be planned to achieve sustainable development. A scientific approach is essential to determine an UGB that allows future growth to be predicted and taken into consideration. Potentially, urban spatial models have been widely used to plan and predict future urban expansions. George Town Conurbation, the second largest urban conurbation in Malaysia, has been chosen as the study area in this study. This study aims to demonstrate the application of a GIS-Cellular Automata model, known as FutureSim, which was developed to simulate land cover changes and generate a designated UGB for this area. The model was developed based on the transition rule derived from land cover changes, from 2010 to 2018, and then used to predict future land cover changes under two different planning scenarios—compact growth and urban sprawl scenarios. With the accuracy of the model exceeding 74%, FutureSim was used to predict land cover change until 2030. The model can potentially be used to assist planners and policymakers to make decisions on the allocation of sustainable land use and planning for rapidly developing regions.

1. Introduction

World population growth (and resulting urban expansion) have caused cities to expand toward peri-urban areas. Malaysia, for example, is currently one of the most urbanized countries of East Asia and one of the most rapidly urbanized regions around the world [1]. It became an urbanized nation in 1991, when it was reported that 50.4 % of the population lived in urban areas [2]. The percentage of the urban population continued to increase—to 65% in 2010 and 75% in 2020. Based on the Department of Statistics Malaysia, the population in Malaysia will reach 33.8 million in 2040, and 85% will be residing in urban areas [3,4]. This will occur in the three main metropolitan areas of Malaysia, the Kuala Lumpur (with 1.31 million people), George Town in Penang and Johor Bahru in Johor, both with populations less than 500,000 people, and are relatively small when compared to the 33.8 million people living in Malaysia in 2020 [1]. This indicated that urban sprawl has become major challenges in managing cities in Malaysia. Therefore, there is an urgent need to find sustainable approach in balancing population distribution between urban and rural settlements [4].
Cities in Malaysia are small and less dense when compared to other cities in East Asia [1,5]. This phenomenon has caused land use/land cover change in built-up areas that started to encroach into agriculture, and forest areas in peri-urban areas [6,7]. Land use/land cover change brings both positive and negative impacts to an area. The expansion of a built-up area is believed to create more economic growth and generate employment opportunities in a region. On the other hand, this phenomenon has also become a significant threat for environmental degradation, traffic congestion, and overcrowding [8,9]. Therefore, land use and cover change needs to be properly planned and monitored. At present, however, the dilemma in planning and managing of urban expansion is due to lack of a scientific planning tool to assist in controlling urban expansion and assisting planners in decision making [10].
Urban growth boundary (UGB) can potentially be used to contain and ensure new urban development (to occur within designated boundaries); thus, achieving sustainable urban development. In Malaysia, for example, the Town and Country Planning Act of 1976, amended in 2001, was used to manage urban spatial growth at the national, regional, and local levels. A recently adopted policy, namely the second National Urbanisation Policy, has incorporated UGB and Urban Containment Boundary (UCB) to control and contain urban expansion towards designated areas. This policy aimed to manage land distribution by recognising suitable locations for future sustainable urban expansions [4]. Despite the existing policy in managing land cover changes and planning future urban expansions within UGB or UCB, no scientific tool to predict future land use cover changes has been developed [11]. The attempt to apply the UGB concept was developed by a private consultant for the city of Kuantan in Malaysia. However, in delineating UGB, a multi-criteria evaluation approach was utilised. Thus, future urban spatial growth has not been incorporated in delineating UGB. Therefore, its suitability towards future sustainable urban development is still questionable.
Geographic Information Systems (GIS) and cellular automata (CA) models have been used to simulate spatial patterns of urban growth and forecast future urban expansions [12,13]. Many studies that used GIS and CA models were undertaken to simulate urban spatial growth over different time periods to be performed [14,15,16]. This was due to the characteristics of CA, which requires relatively simple data, modest and easy to understand, so the model formulation and its results are easy to comprehend [12]. This model, however, has been criticised as being too simple to realistically simulate the urban system [14]. Therefore, to forecast future patterns of urban growth, the robustness of the model needs to be evaluated [11,16].
Apart from criticism over the simplicity of the CA model in modelling urban systems, the Slope, Land use, Exclusion, Urban extent, Transportation, and Hillshade (SLEUTH) model, developed more than 15 years ago by [17,18], has been widely used worldwide. The model was developed based on a simple rule of a cellular automate modelling framework to mimic the behaviour of complex urban systems [12,15]. The model has been revised and modified many times, and now it has been applied to simulate more than 66 different cities and regions. A recent study by Saxena [18] used the SLEUTH model to capture the heterogeneous urban growth of Pushkar Town in India. The findings of that study indicated that the SLEUTH model was able to capture fragmented urban growth in areas where built-up units are small and scattered. Although this model was proven to be successfully used to model urban systems of many parts of the world, its application in relatively flat areas, and limited dataset, might not be appropriate [9,10].
Future land use simulation (FLUS) is another popular model that can simulate urban growth based on different planning scenarios. The study by Liu et al. [19] showed its application in China between 2000 and 2010. The model used human influence and climatic impact on urban growth, and managed to accurately simulate future land use patterns. Although such approach may enhance the predictive capability of the model, the development of the model would require high computational skills, which were lacking among planners and urban managers. Thus, in developing a model for moderately growing cities in Malaysia, for example, the modelling framework used should be simple and require limited datasets that can be used with widely available and proprietary software [16]. A CA-Markov model available as a module in IDRISI software would be appropriate to assist planners in forecasting future land cover changes. Therefore, this study aims to use a CA-Markov model to monitor land cover change, predict future urban expansions, and delineate UGB to ensure sustainable urban expansion.

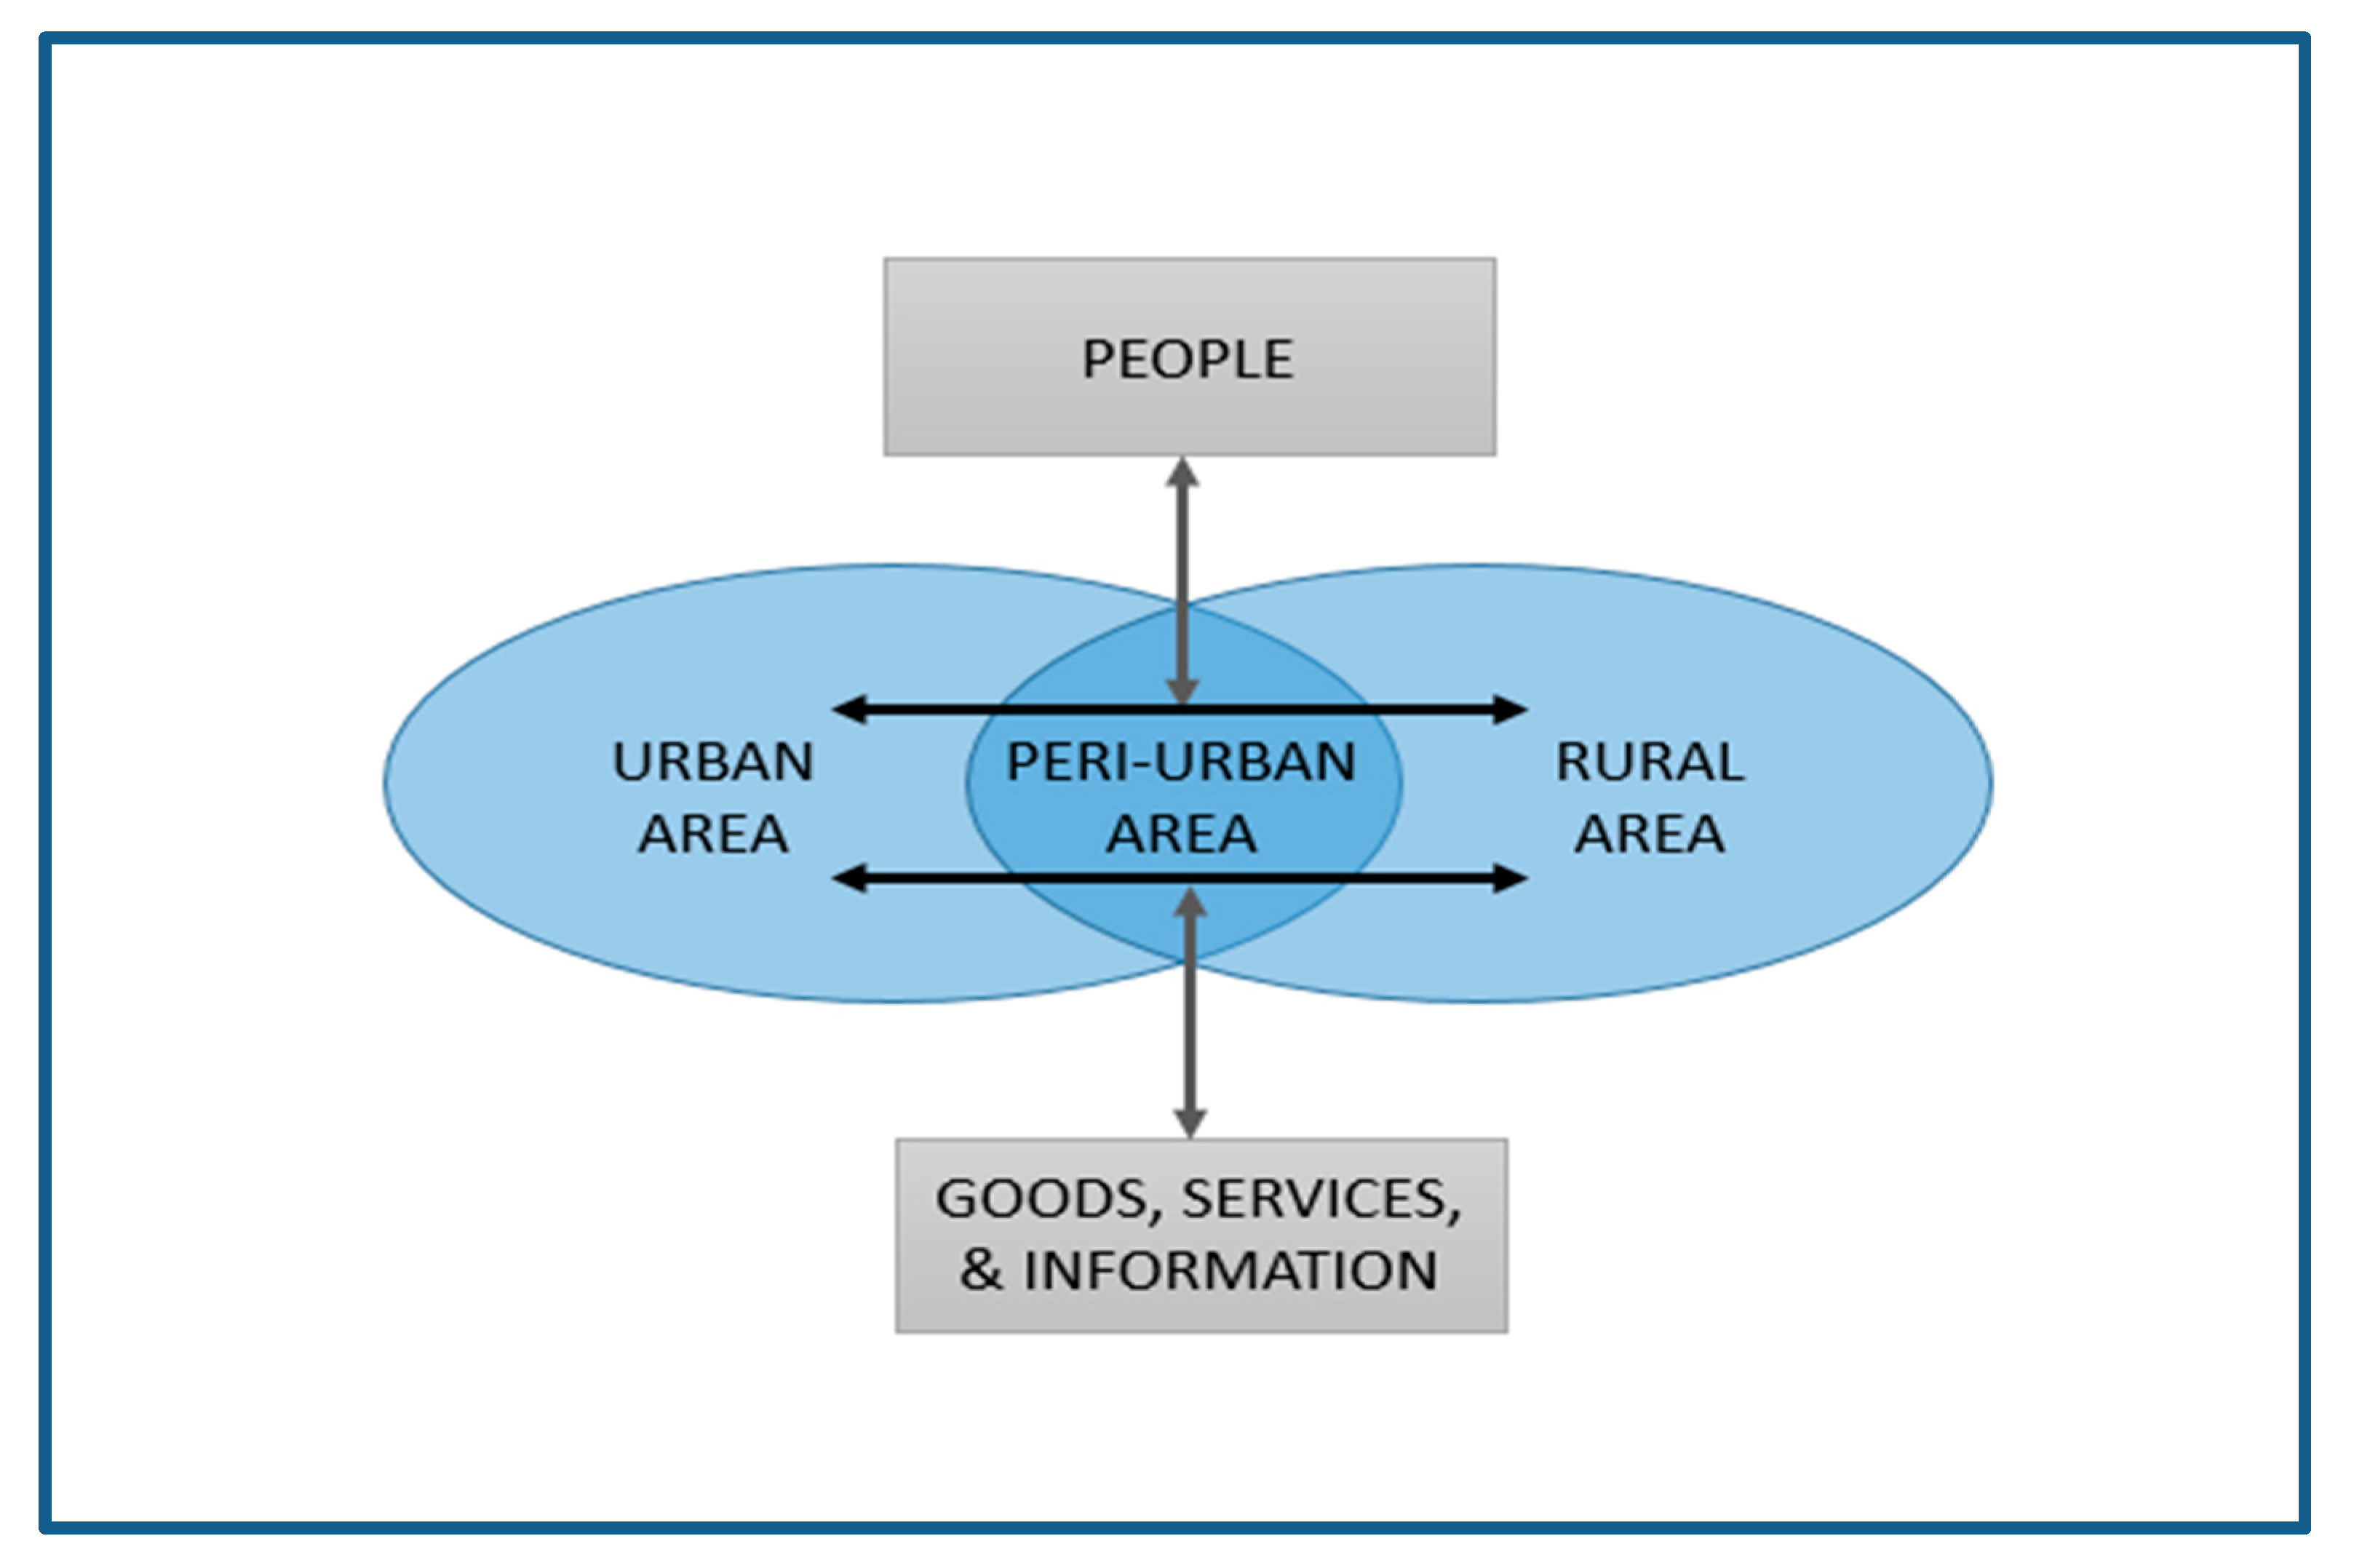
2. Background of the Study

The world population has increased drastically in the past 50 years. For example, between 1950 and 2009, the world population has increased from 1.8 billion to 3.4 billion, with urbanization occurring at 30% and 55%, respectively [20,21]. The world population is expected to reach 6.4 billion in 2020, and 60% of people are expected to be living in urban areas [20]. What is even more severe is that more than 90% of this increase will occur in developing nations, particularly in Asia and Africa [21]. As a result, cities will start to expand towards fringe areas, encroaching into arable agriculture land [3]. Southeast Asia has also experienced significant population growth. Since the 1970s, cities in Southeast Asia have been steadily growing and encroaching into rural areas [4]. In 2010, for example, the total population for the 10 Southeast Asia countries (Association of Southeast Asia Nations—ASEAN) was 508.08 million, and in 2018, it increased to 647.74 million [22]. Among the ASEAN, Malaysia has experienced drastic urban growth, with its urban population reaching 70% in 2018. In particular, population growth in Malaysia was due to natural growth and migration from rural to urban areas, while a small portion of it came from international migration from surrounding countries. This was probably due to the industrialisation policy implemented in Malaysia since the 1970s, when industrial estates and free trade zones were developed near major cities. As a result, Kuala Lumpur and other sub-urban regions, such as Shah Alam in the Central region, George Town in the Northern region, and Johor Bahru in the Southern region of Peninsular Malaysia, have expanded rapidly [2,4].
The expansion of urban areas towards the fringe area is often termed ‘peri-urbanization’, which connotes the confluence of urban and rural spaces, in particular the stretches of land connecting two city centres [22,23]. According to McGee [22], peri-urban areas are generally found in the edge of built-up areas—up to 50 km from the city centres. It is a transition zone with intermingling of urban and rural uses, yet the boundary between the two areas is blurred. This is due to the linkages between urban and rural areas, where movement of goods, people, and services are intense (refer to Figure 1). Peri-urban areas have three dimensions: the zone between the urbanised built-up area and the rural landscape, the zone that experiences a transition from one land cover/use to another, and the zone that is prone to governance transition [8]. These regions are multifunctional and complex, where land uses comprise low density settlement, functional agriculture, open green space, agro-business, and industrial areas. This area also has an abundant supply of relatively cheap land and good road network, which attracts investment and development.
Peri-urbanisation has also contributed to many environmental and geo-political changes, such as modifications in land-use, sub-urban development, and a diversification in livelihoods [25,26]. According to Pascariu [26], peri-urban areas of developing countries have often been thought of in negative terms rather than positive territorial assets, since this area has been characterised by pollution of land and water bodies, poverty, and informal settlements. Land use/cover changes in this area have been dynamic, where the most prominent among these changes are the growing number of factories that have been built on agricultural land. In Southeast Asian cities, earlier studies on peri-urban areas were conducted by McGee [22,27], where the impact of urbanisation on spatial organisations and related developments at the urban fringe were analysed. The term “desa-kota” was used to describe the transition zone between urban and rural areas for cities in Southeast Asia. Since then, various studies were undertaken in relation to urban growth at peri-urban regions.
The study by Legates and Hudalah [28] in Chengdu, China, and Yogyakarta/Kartamantul, Indonesia, for example, investigated innovation, governance, coordination, and policies implemented to prevent problems and capitalised opportunities that resulted from urbanisation in the peri-urban areas of these regions [26]. Meanwhile, Rauws and Roo [29] explored changes in the peri-urban areas of four cases studied in Europe. In that study, the focus was on the dynamic and multi-functionality of peri-urban areas and proposed a non-linear perspective on peri-urban development [29]. The study showed that peri-urban areas are very important, since they provide linkages between urban-rural areas connecting two cities across many nations [25].
Peri-urban areas are strongly influenced by nearby cities, where public service and utilities are provided by the cities. These areas also receive spill-over effects, socio-economic opportunities, and cultural impacts from nearby cities [6]. Furthermore, urban development has brought positive impact in terms of providing a market from newly developed residential areas for agricultural products [6]. In addition, local communities have gained socio-economic benefits by providing services, such as childcare, cleaning services, and providing food services for middle-income dwellers in peri-urban areas [23,25].
On the other hand, this area has undergone constant pressure from development, due to the demand for land to cater to residential and related services from growth of the migrating urban population [27]. This has resulted in the reduction of land size [6,25]. Furthermore, agriculture and natural areas of peri-urban areas are under constant threat from urban intrusion, resulting in rapid transformation in land use and land cover [25]. This occurs due to increased urbanisation. This has also allowed entrepreneurs to buy land from farmers and develop land in rural areas into high-cost, low-density residential areas, leisure facilities, holiday resorts, and private holiday homes [25,29]. The incursion of private developments into peri-urban areas has undermined the sustainability of local communities, as many of them are forced to sell their land, causing poverty to become an increasing concern [8]. Moreover, the arrival of migrant workers from other regions and countries has had a significant impact on the sense of local identity, and is often the cause of social conflicts. Thus, understanding the physical transformation of peri-urban areas would be beneficial in planning and managing these areas [23,25].
Most of the studies undertaken in peri-urban regions have focused on social, economic, and physical transformations of these areas in relation to the local communities. However, few studies were undertaken to simulate spatial patterns of land cover changes and develop a mechanism to control such changes in these areas. GIS and CA models have been widely used to forecast land use cover changes. The CA model has the capability to mimic the behaviour of urban system based on simple uniform transition rules, suitable to be used in areas where spatial data are not freely available. In addition, this model can be used to forecast the spatial pattern of urban growth, to ensure that urban expansion is controlled or contained within the designated areas. UGB and UCB have been effectively used to control and plan urban expansions sustainably [13]. This planning boundary has been used to limit or demarcate urban and rural land uses and intended to constrain urban development within defined boundaries to increase urban land use density and protect open or natural spaces from being developed [11]. Furthermore, it is introduced as a policy that could direct urban growth towards compact growth, which will minimise inefficient use of space, reduce urban sprawl, and retain open space land close to developed areas.
An earlier study by Tayyebi, Pijanowski, and Tayyebi [11] has used GIS and neural network to predict urban spatial growth in the city of Tehran, Iran. The approach managed to simulate urban expansion and use urban growth boundary to control urban expansion from encroaching into valuable agriculture land [11]. Another study by Xun et al. [13] also used a CA-based method named the future land use simulation (FLUS) to delineate UGBs in the Pearl River Delta from 2020 to 2050. Both top-down approach macro policy and socio-economic policy and bottom-up approach of cellular automata urban growth simulation were combined to control urban expansion within designated boundaries. UGB can be used to control and allocate urban development sustainably [30]. This model, however, has not been tested in the context of moderately growing cities, such as in Malaysia. It is timely, therefore, that dynamic models, such as GIS and CA, be developed and used as scientific mechanisms to mimic the behaviour of urban systems to ensure sustainable urban development.

3. Materials and Methods

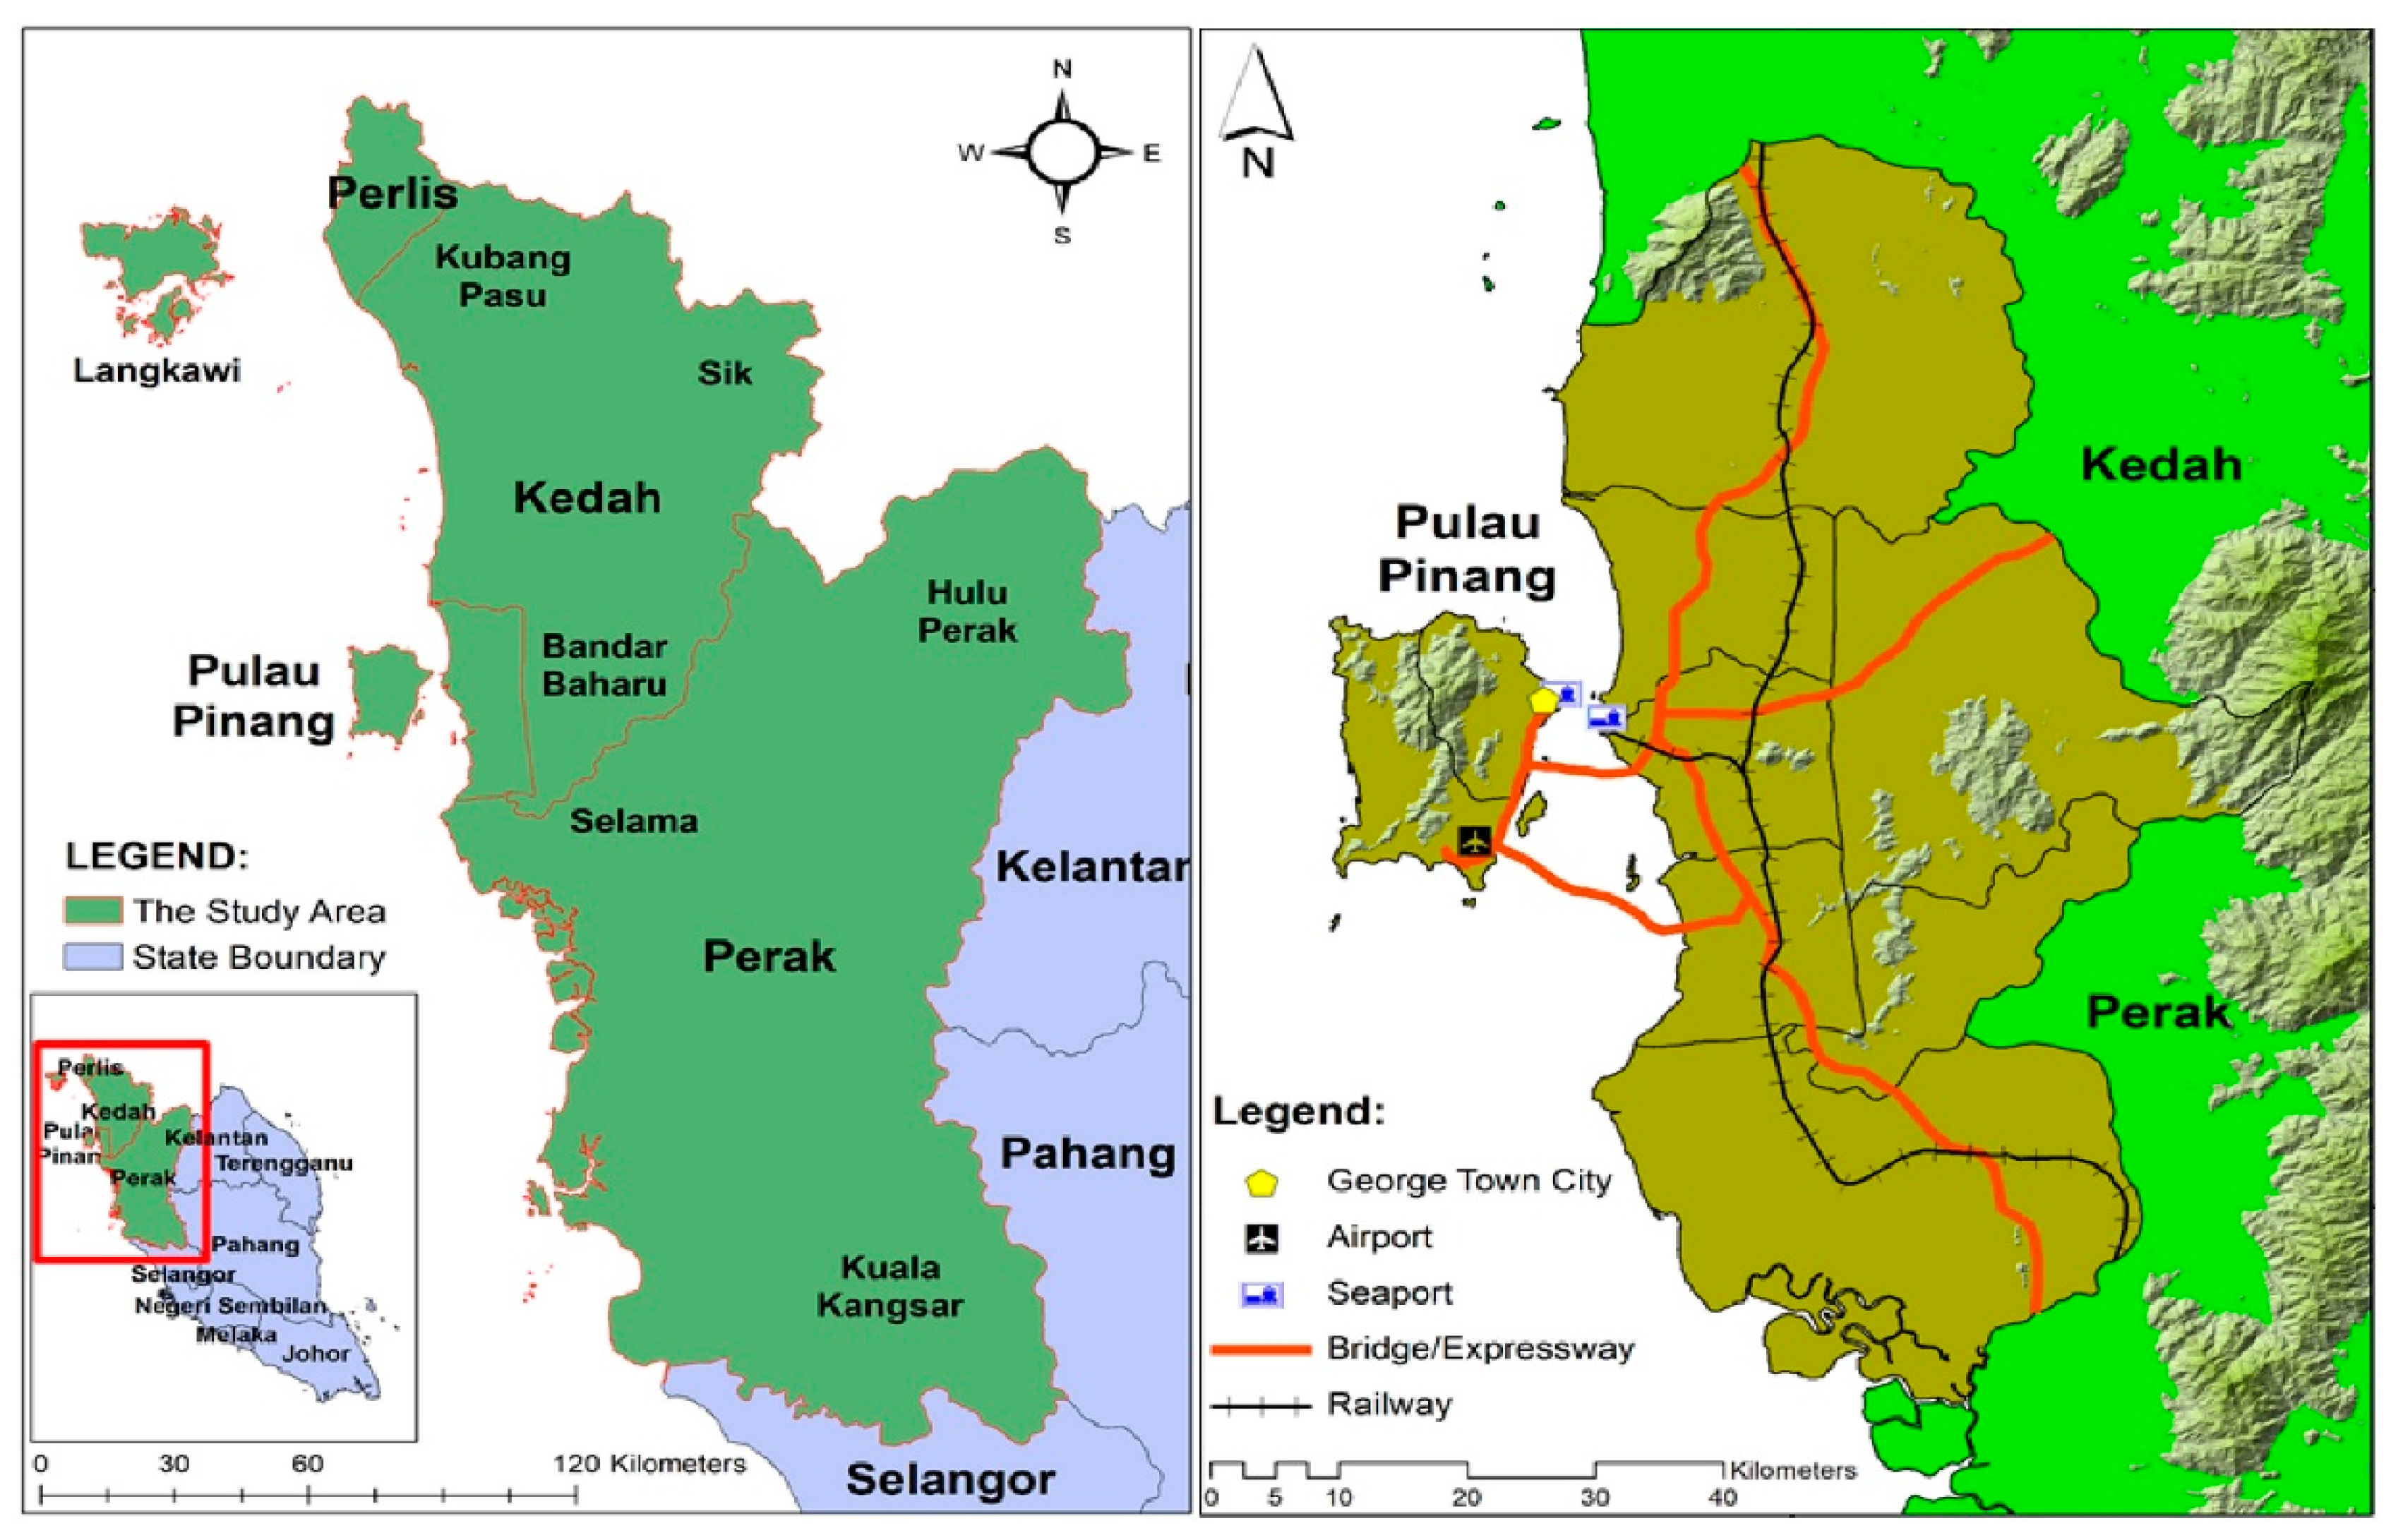
3.1. The Study Area and Data

George Town Conurbation, located in the northwest coast of Peninsular Malaysia, between latitude 4°50′ N–5°52′ N and longitude 100°10′ E–100°51′ E, with an area of approximately 3938 square km, was chosen as the study area (refer to Figure 2). George Town Conurbation, comprising of Penang state, and parts of neighbouring states (Kedah and Perak), was expected to be a major urban growth corridor in Malaysia, with a population exceeding 2 million people [2,4]. The population was projected to reach 3 million people in 2020 and to further increase to 3.7 million in 2030. Furthermore, this region is expected to become the main growth centre for the Northern Corridor Economic Region (NCER), a regional policy of concentrated decentralisation, established since 2007, to reduce regional imbalances, ensure equitable economic growth, and transform the socio-economic landscape of the region [31]. Since then, various development plans, top-down investments, and economic initiatives were undertaken to promote economic development and to reduce socio-economic imbalances within the region. Various infrastructures, such as highways, railways, and industrial estates were developed to attract foreign direct investments into this region [4]. Although such initiatives would bring economic opportunities and socio-economic benefits to the communities, it will cause urban expansions and land cover changes. Such changes need to be scientifically planned and managed to ensure they do not bring about negative impacts to the environment and the future generation [6,16].
Data used for this study were obtained from various agencies, such as the PLANMalaysia, Department of Statistics, and the Malaysia and Northern Corridor Implementation Agency (NCIA) [2,3,31]. Land cover data were obtained from PLANMalaysia. Other data were gathered from various projects undertaken previously at the School of Humanities, Universiti Sains Malaysia [16]. Three sets of land cover data 2010, 2014, and 2018 were used in this study (refer to Figure 3 and Table 1). Table 2 shows land size for each category of land cover. Agriculture was that main activity in this area of 2158 square km in 2010. However, it decreased to 2137 square km and 2113 square km in 2014 and 2018, respectively. Forest area did not experience much changes in the observed periods. In 2010, total forest area was 716 square km and it decreased to 712 square km in 2018. The built-up area has experienced significant changes; it increased from 887 square km in 2010 to 925 square km in 2018. A four-year time interval was used to validate the model.
Data were prepared in ArcMap 10.5 proprietary software and converted into raster format with the same resolution of 30m by 30m to project future land use patterns of the George Town Conurbation. The module CA-Markov model, readily available in the IDRISI Kilimanjaro software, was used for model development and predict future land use projection [32]. Based on available data, the study developed FutureSim, a GIS-based CA-Markov model to simulate urban spatial growth in George Town Conurbation.

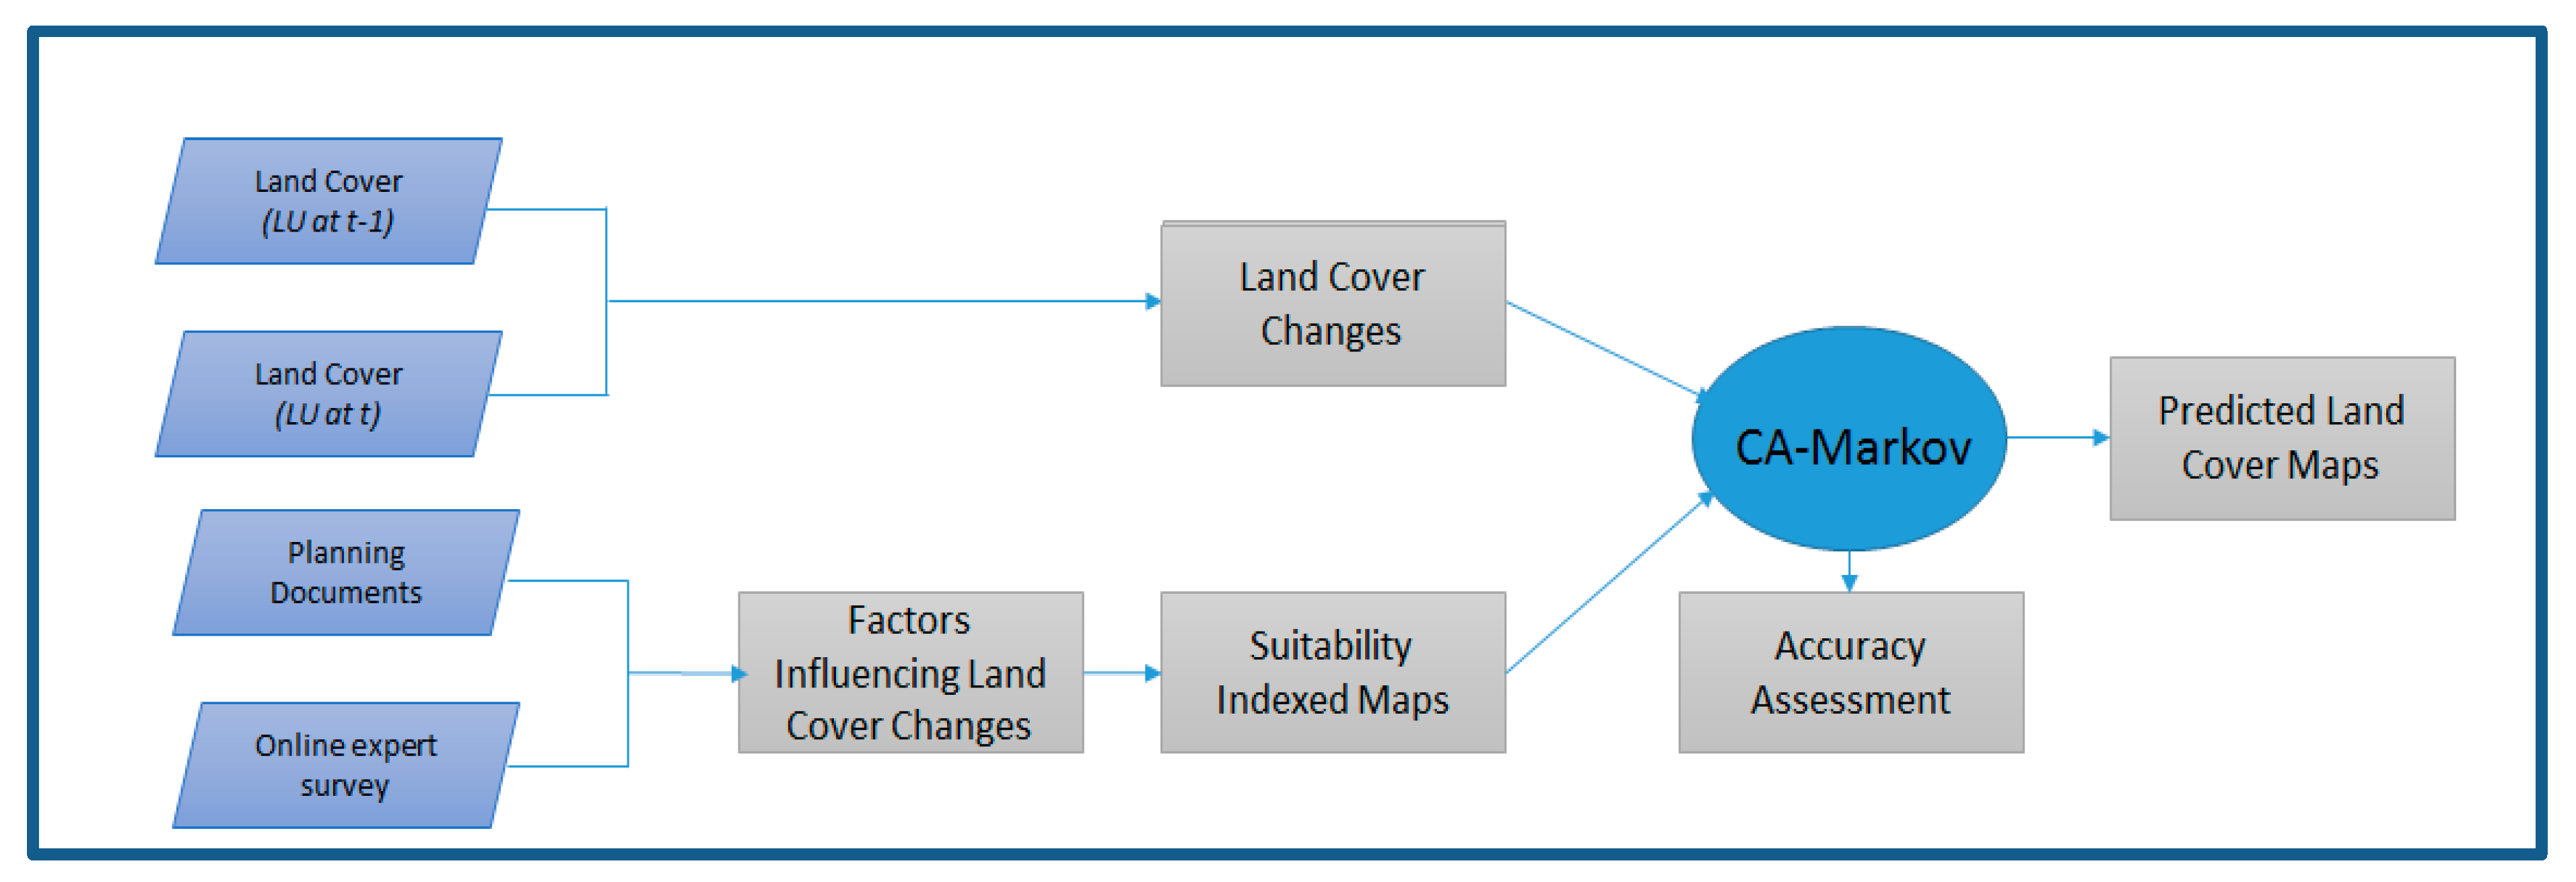
3.2. FutureSim Modelling Methodologies

GIS based CA-Markov model called FutureSim was developed based on earlier work by Samat [16], which was used as the modelling methodology. A significant improvement was made to the original model. First, the improvement was about the factors influencing urban development, where the factors were determined based on planning literature and expert opinions. Six factors—distance to education amenities, distance to employment areas, distance to developed areas, distance to health facilities, distance to major roads, and distance to major town—influenced urban development in the study area were used in FutureSim. All factors were converted into Likert scale rating from 1 to 9 [33]. Through purposive sampling, the surveys were distributed to planners from Department of Town and Country Planning (DTCP), academicians, and researchers of public universities in Malaysia, private urban modellers, and developers. The study managed to obtain 39 respondents who responded to the factors, based on their knowledge and preferences, on how those factors influenced urban development in Malaysia.
The majority of the respondents (69.2%) were older than 40 years old. This implied that the respondents had witnessed and understood urban growth and development during the observed period in the study area. Moreover, 33 respondents (84.6%) were directly involved in urban planning and development in Malaysia. The reliability of the on-line survey was tested, and the result showed that Cronbach’s Alpha value α was 0.789, indicating that the instrument was reliable.
In the study, the questionnaire was in the form of the Likert Scale to avoid confusion among respondents in determining the relative importance of each factor [34,35]. Furthermore, it will avoid from misunderstanding the questions asked in the questionnaire. Therefore, the relative importance of the respondents’ rating of the factors was calculated by averaging each factor’s ratings given by the respondents. Then, a matrix was used to convert the scores from Likert Scale to calculate weights using the Pairwise comparison method [35]. Table 3 indicates factors influencing urban development based on compact growth and urban sprawl scenario. The table shows that “distance to employment centre” was the highest weight for the compact growth scenario and “major roads” was the highest score for the urban sprawl scenario.
Second, population projection was used to delineate UGB. Based on the Department of Statistics, Malaysia [36], the population in the year 2030 is expected to be 3,785,999 people. The total population of the George Town Conurbation in the year 2000 was 1,898,594 people; in the year 2010 it increased to 2,527,729 people. It is projected to reach 3,785,999 people in 2030.
FutureSim was developed to model two different planning scenarios; namely compact growth and urban sprawl growth scenarios. Figure 4 shows the FutureSim modelling framework used in this study. The figure shows that the model was developed based on the transition rule, derived from land cover changes and the suitability indexed map produced, based on factors influencing land cover changes. Finally, accuracy assessment of the model was conducted by comparing the actual land cover with the predicted land cover.
In the CA modelling approach, lattice, cell state, neighbourhood, and transition rules are four fundamental elements [14,15]. In this study, lattice is the study area divided into cell grids of 30 m by 30 m. The state of the cells was represented by land cover in the study area, which comprised of agriculture, built-up, forest, and water body. Small patches of grassland and shrub were included under agriculture area since those areas were used by local farmers for grazing.
In this study, CA-Markov analysed the possible changes of cell states, with a calculated probability within a given time frame [16]. The computed probability (or transition probability) was derived from the initial state value of all cells and transition matrices, which contain an array of transition probabilities, either change or constant in value.
Neighbourhood index or CA filters is the size of neighbourhood that comprises adjacent cells that can influence the state of the current cell. Usually, 3 × 3 cells or Moore or 5 × 5 extended Moore neighbourhood was used. In this study, extended Moore neighbourhood was used. The study, then, calculated the suitability index. Weighted linear summation approach of the multi-criteria evaluation approach (MCE) was used to combine factors and their respective weights. This analysis is readily available with IDRISI Kilimanjaro software [32]. The study also took into consideration constraints where planning regulation prohibited built-up areas from encroaching into paddy fields were used to restrict development for compact growth scenario. The factors and their respective weights are shown in Table 3.
Table 3 shows the factors and their respective weights used to model two urban growth scenarios, namely compact growth and urban sprawl scenarios. For the compact urban growth scenario, higher weights were given to existing built-up areas, such as employment centres, developed areas and towns. Meanwhile, for the urban sprawl scenario or uncontrolled growth scenario, a higher weight was given to proximity to highway (refer to Table 3). Table 3 also shows that consistency ratios of 0.06 and 0.08 were obtained for the two growth scenarios. These values indicated the weights used were acceptable and consistent.
Then, the model was run using the transition rule based on calculated transition probability, suitability index, and neighbourhood index. The modelling methodologies used in this study were adapted from IDRISI Kilimanjaro Software [32]. This proprietary software was used because it enables non-technical users, especially planners in this study area, to use the model for planning purposes. To ensure the robustness of the model, FutureSim was validated with actual land cover in 2014 and 2018. Finally, after obtaining good prediction accuracy from the model, it was used to predict future urban growth (up to 2030). Based on the forecasted population, the size of land area (needed to accommodate the growing population) was calculated. Then, based on the high suitability index, a UGB was delineated.

4. Results and Discussions

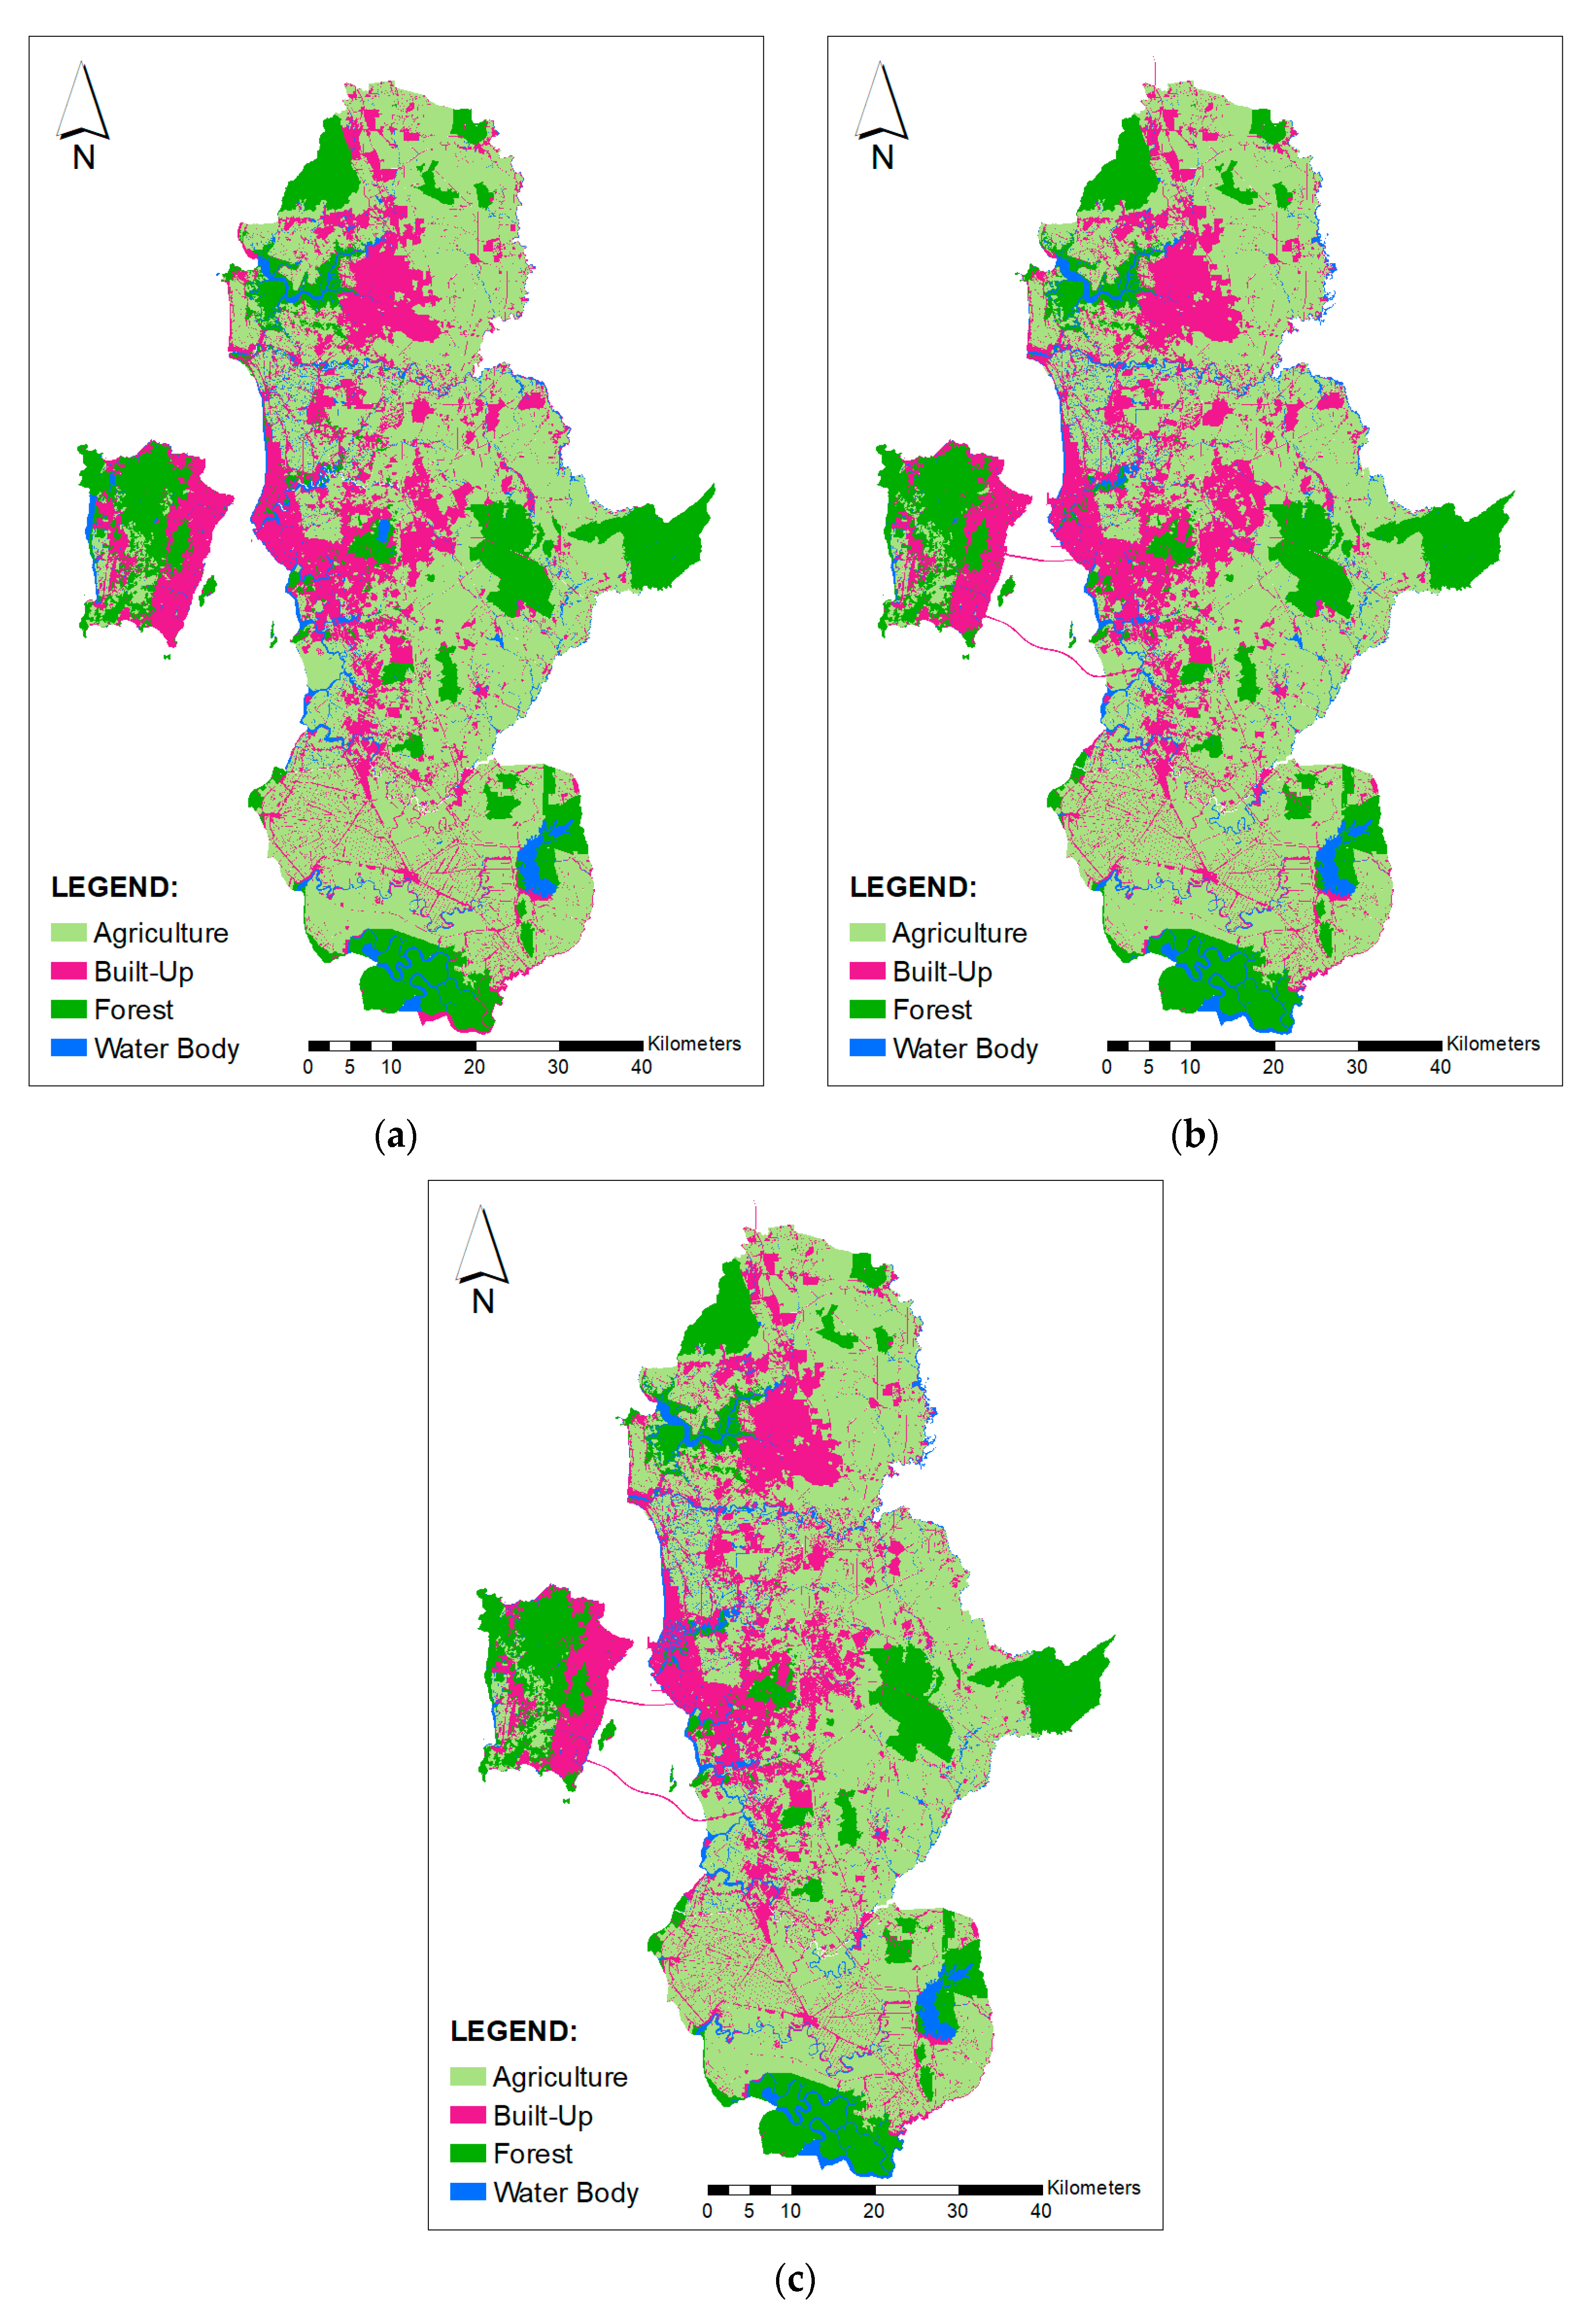
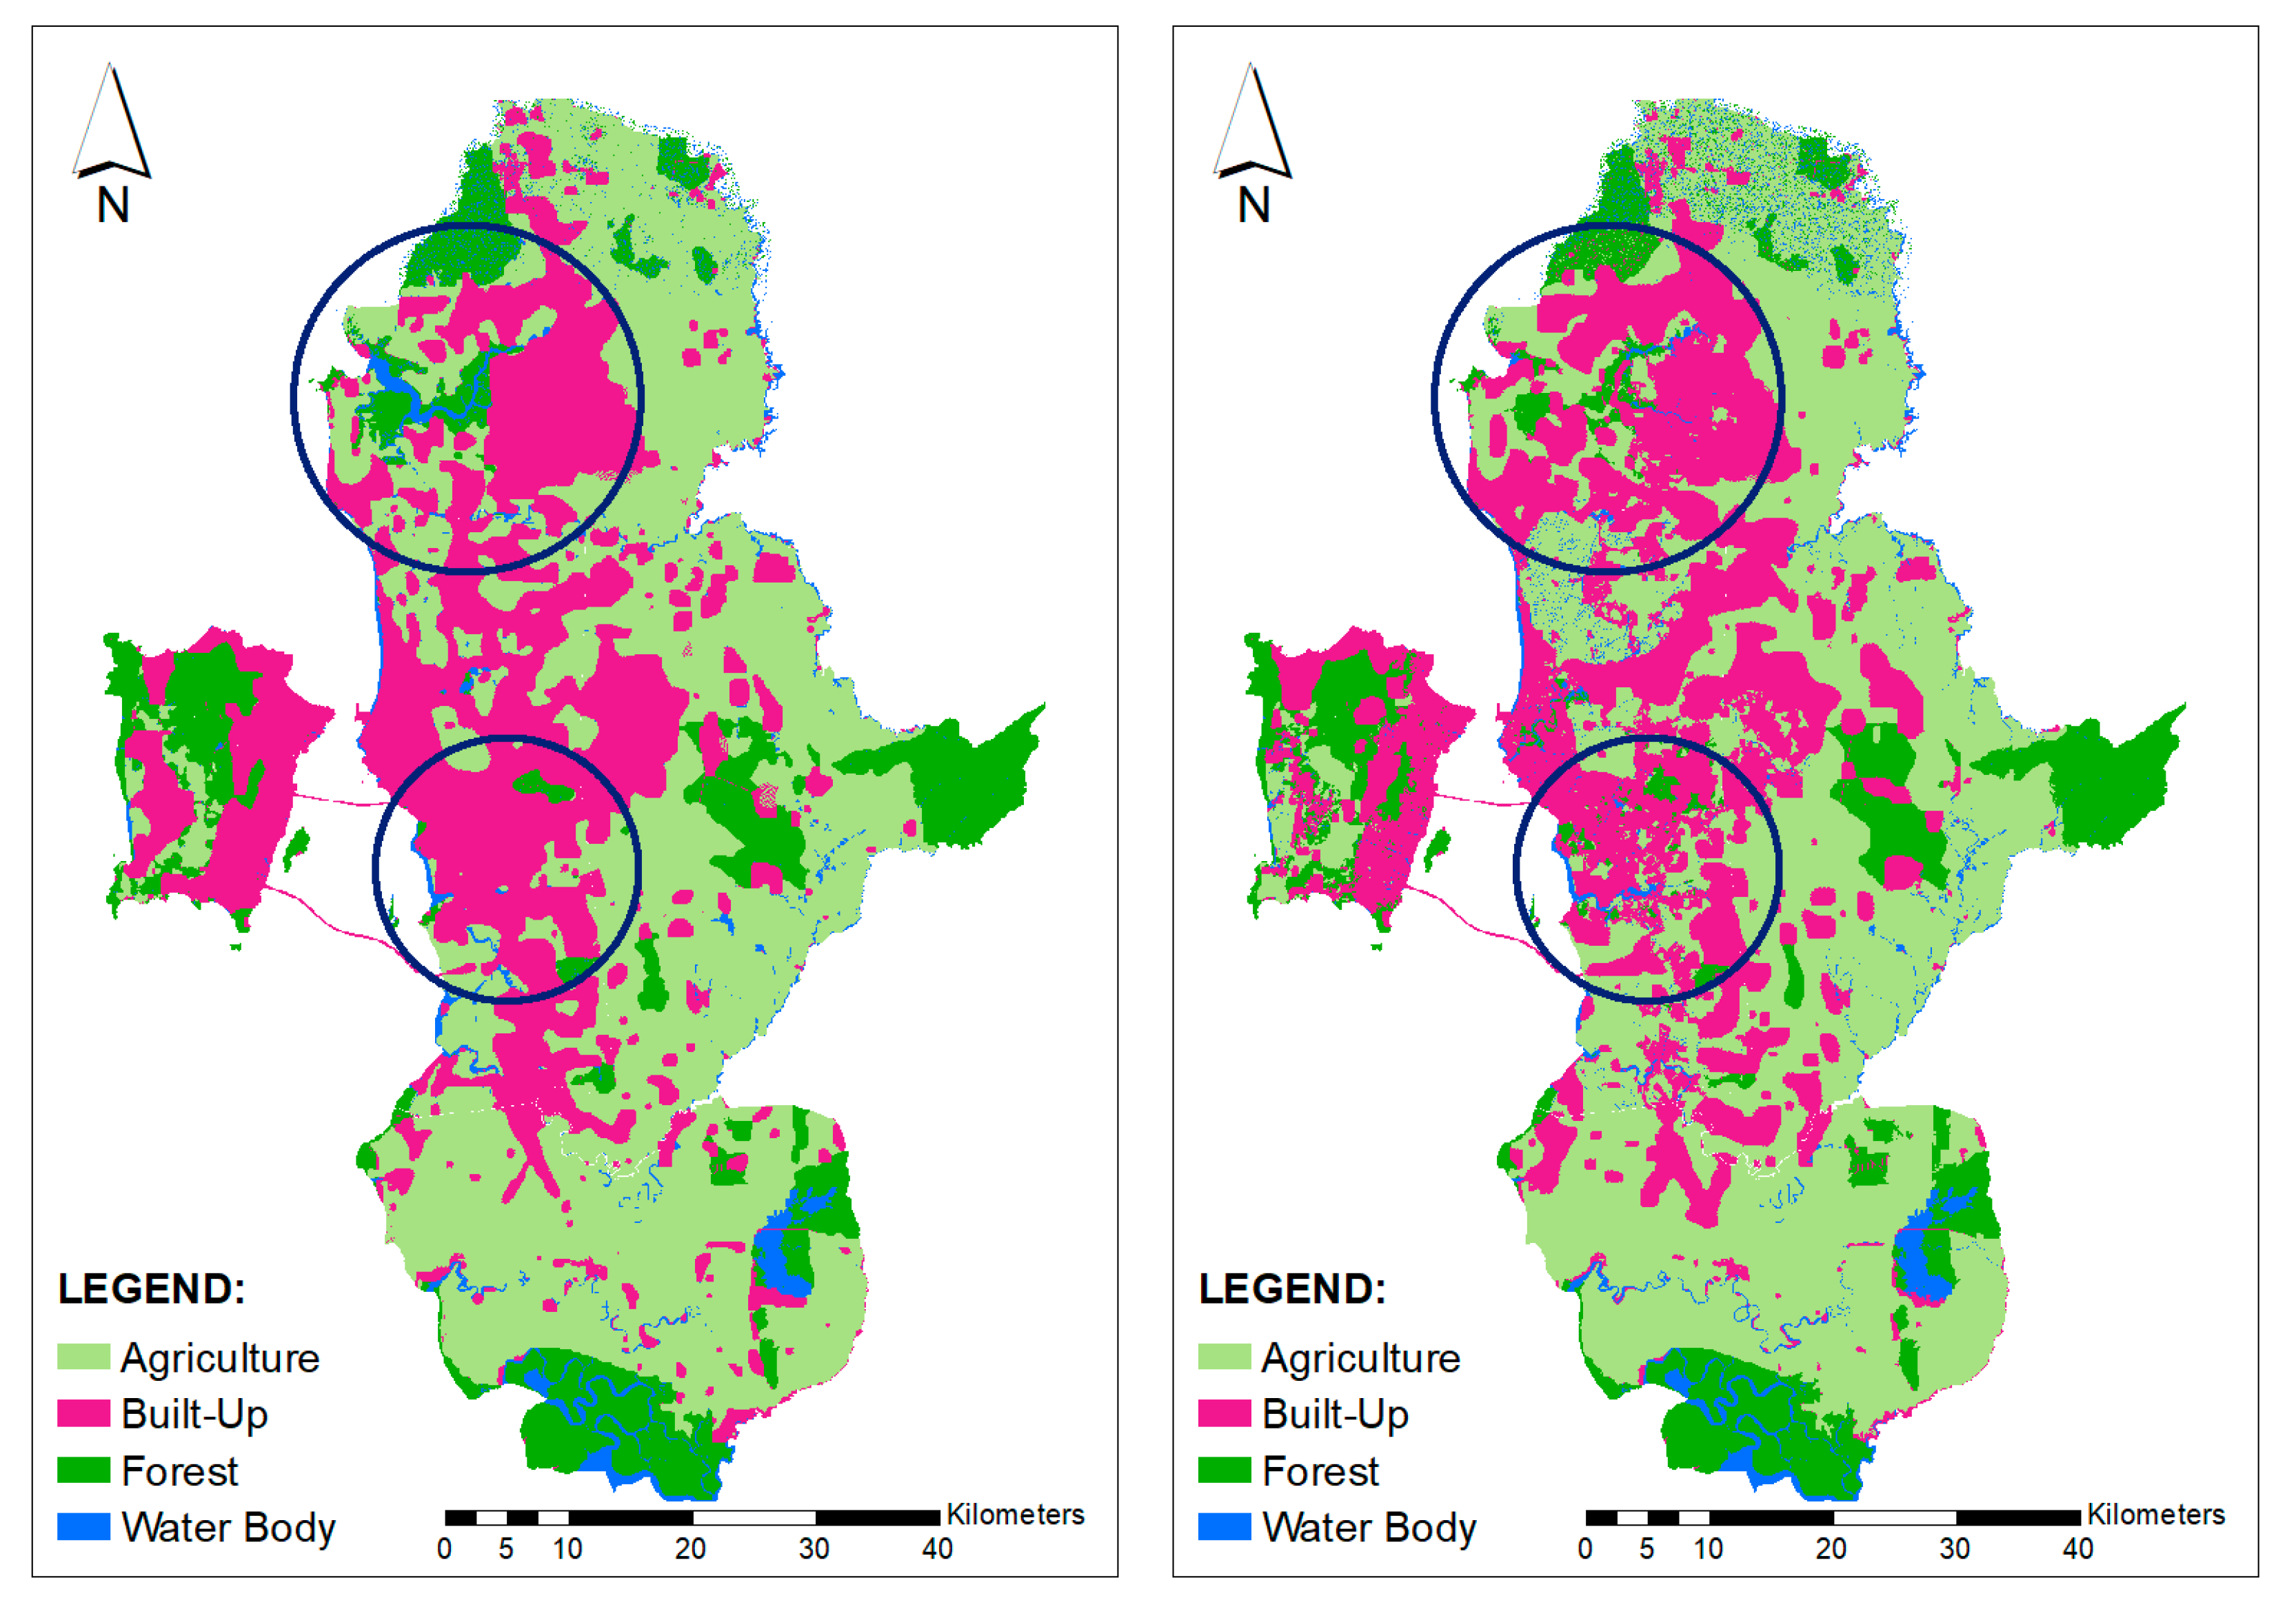
4.1. Land Cover Changes 2010–2018

The study monitored land cover changes from 2010 to 2018 to derive a transition rule for the model. The study area experienced moderate urban expansion when compared to Kuala Lumpur, the largest city in Malaysia, with a population density of 6890 people per square km [20]. In George Town Conurbation, the built-up area in 2010 was 887.17 km2 and the population density was 2849 people per square km. In 2014, its population increased to 2,779,383, with its built-up area of 906.37 square km. Then, the population reached 3,031,037, and its built-up area increased to 925.77 square km. The population density was 3274 people per square km. However, the population was forecasted to reach 3,785,999 people in 2030, and it is expected to cause significant changes to its land cover, mainly due to the spill over effects of demand for housing from the people of Penang Island and policy directed growth. Furthermore, this area is expected to be a regional growth centre for the northern region of Peninsular Malaysia [31].
A transition probability matrix was generated for each class of land cover based on changes in land cover pattern from the year 2010 to 2014 and from 2014 to 2018. The percentage of agriculture that has changed into built-up areas was 14.4% and 20.0% from 2010 to 2014 and from 2014 to 2018, respectively. The probability for forest and water bodies to change to built-up areas was quite small since forest areas were protected under environmentally sensitive areas. Thus, the probability of a forest becoming a built-up area was only 9.2% and 12.8% for the years 2010 to 2014, and from 2014 to 2018, respectively. The increased of built-up areas was, approximately, 2.16% and 2.14% in 2014 and 2018, respectively.

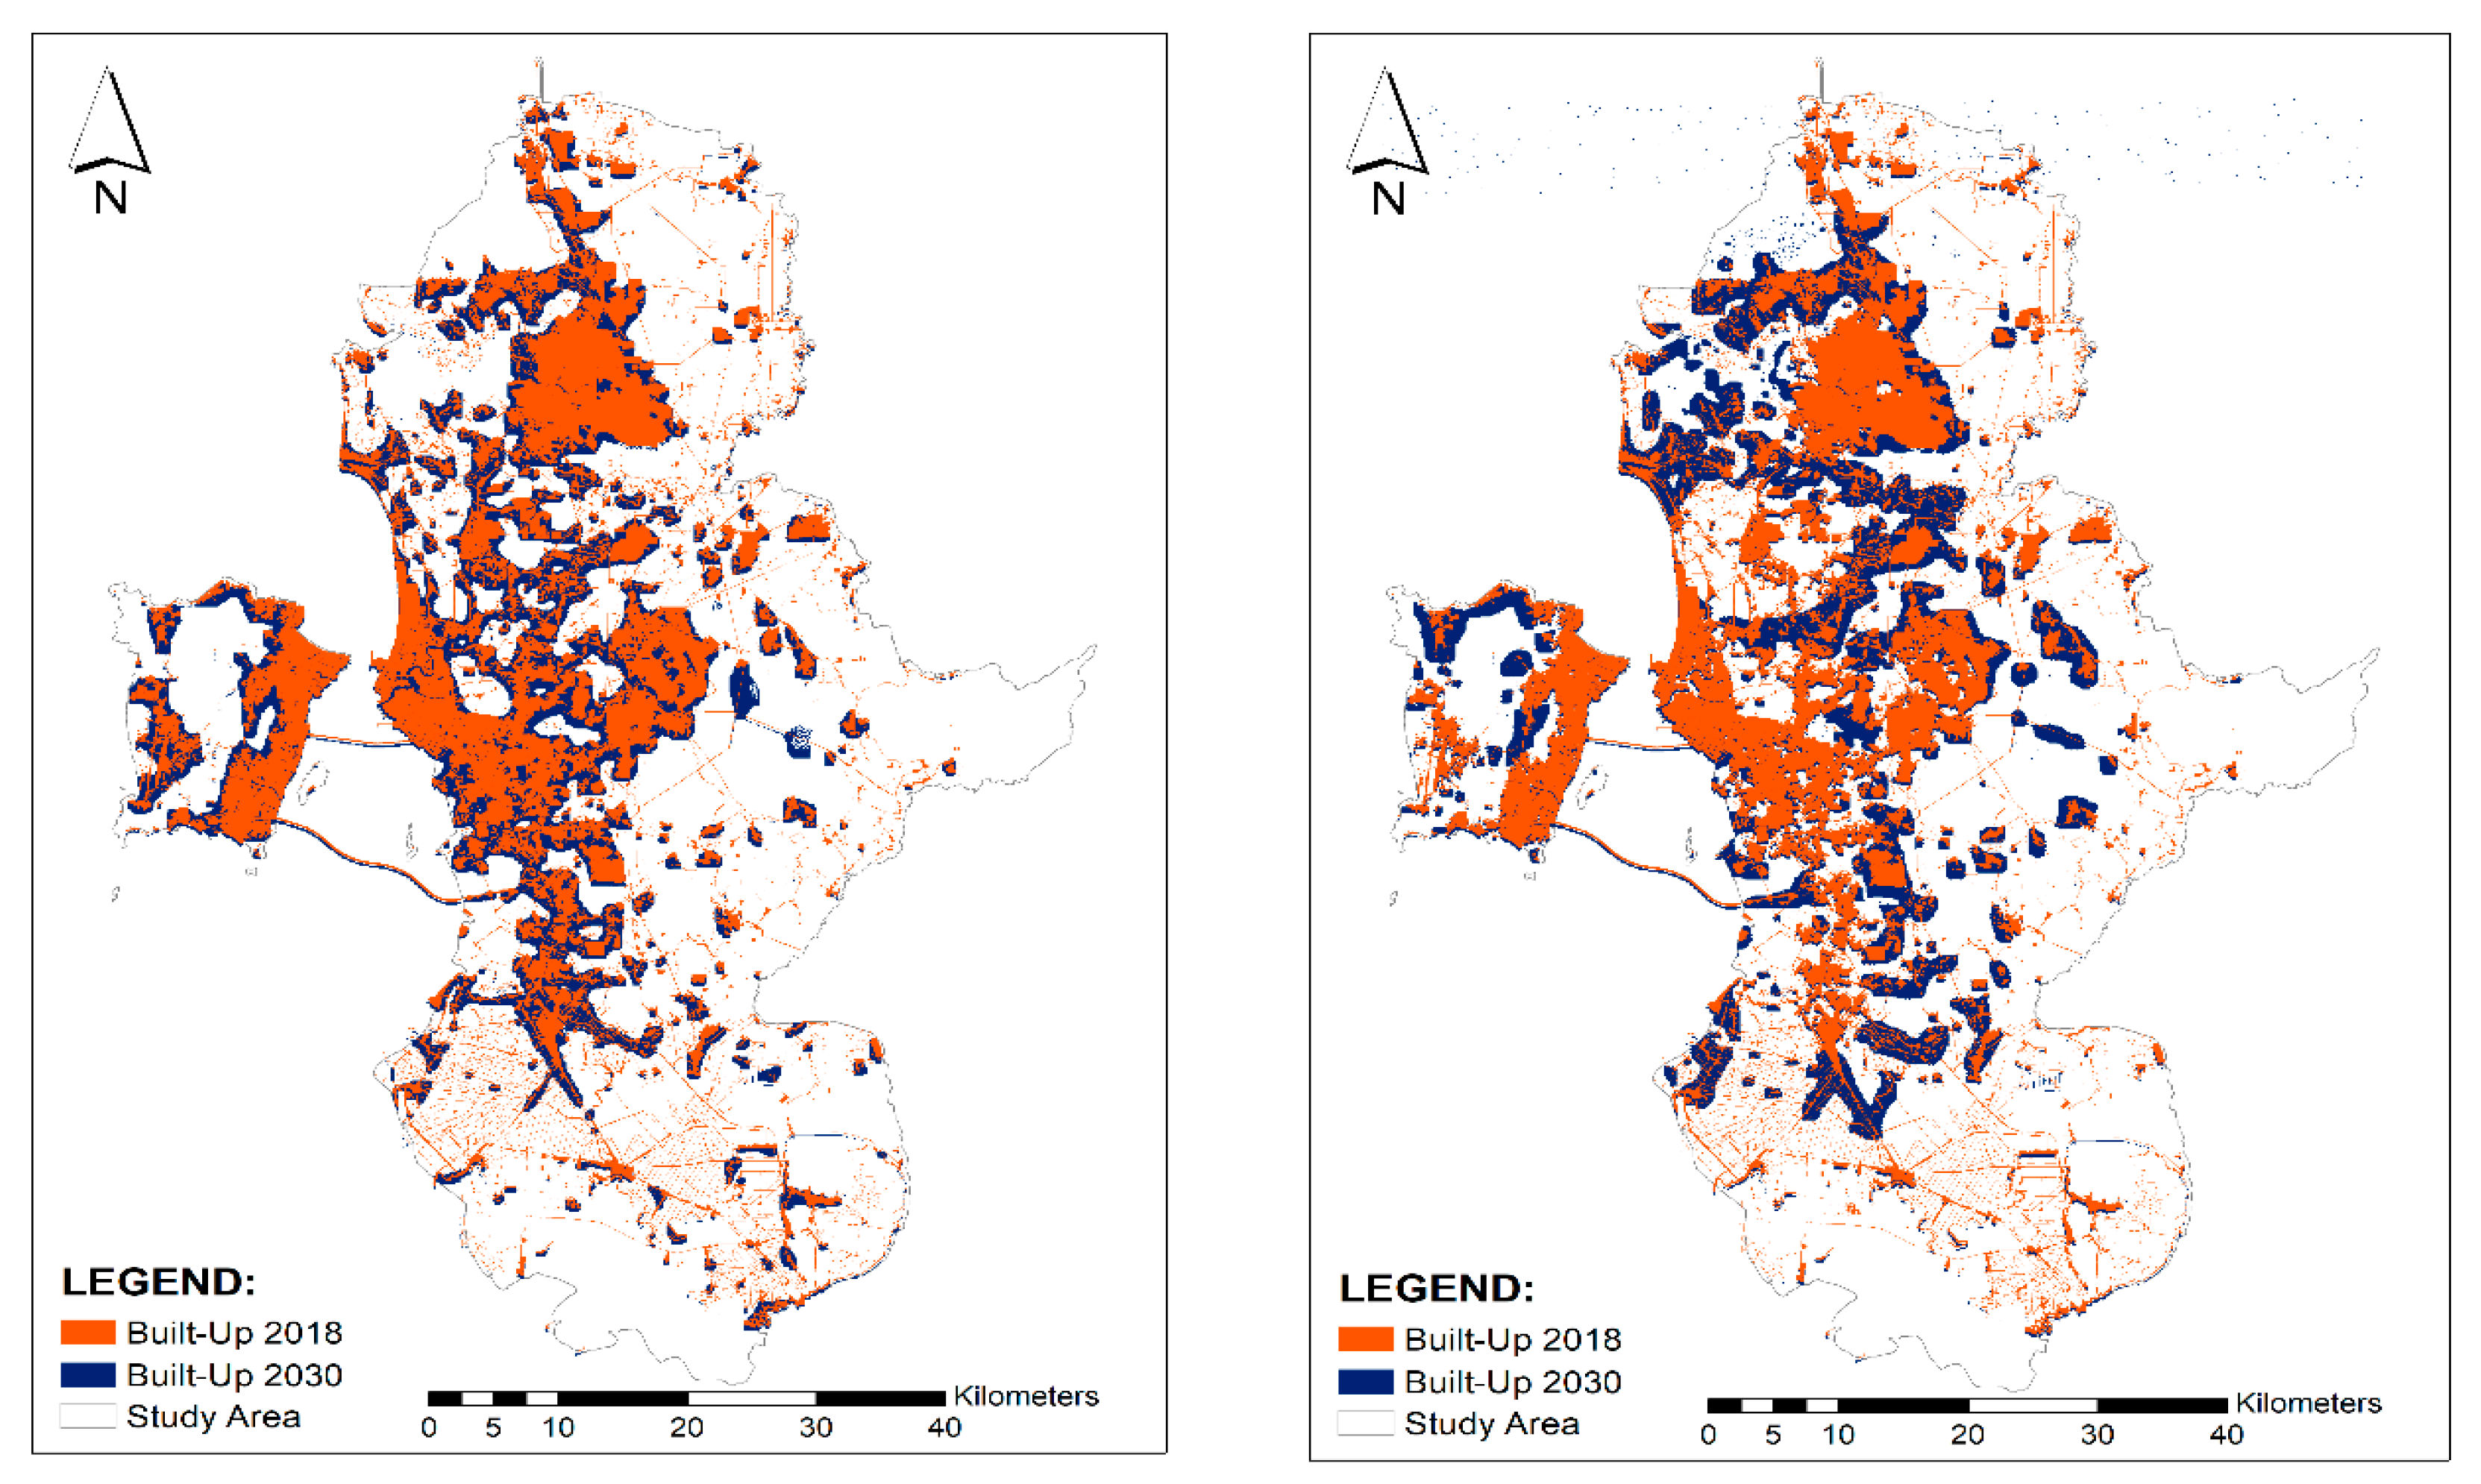
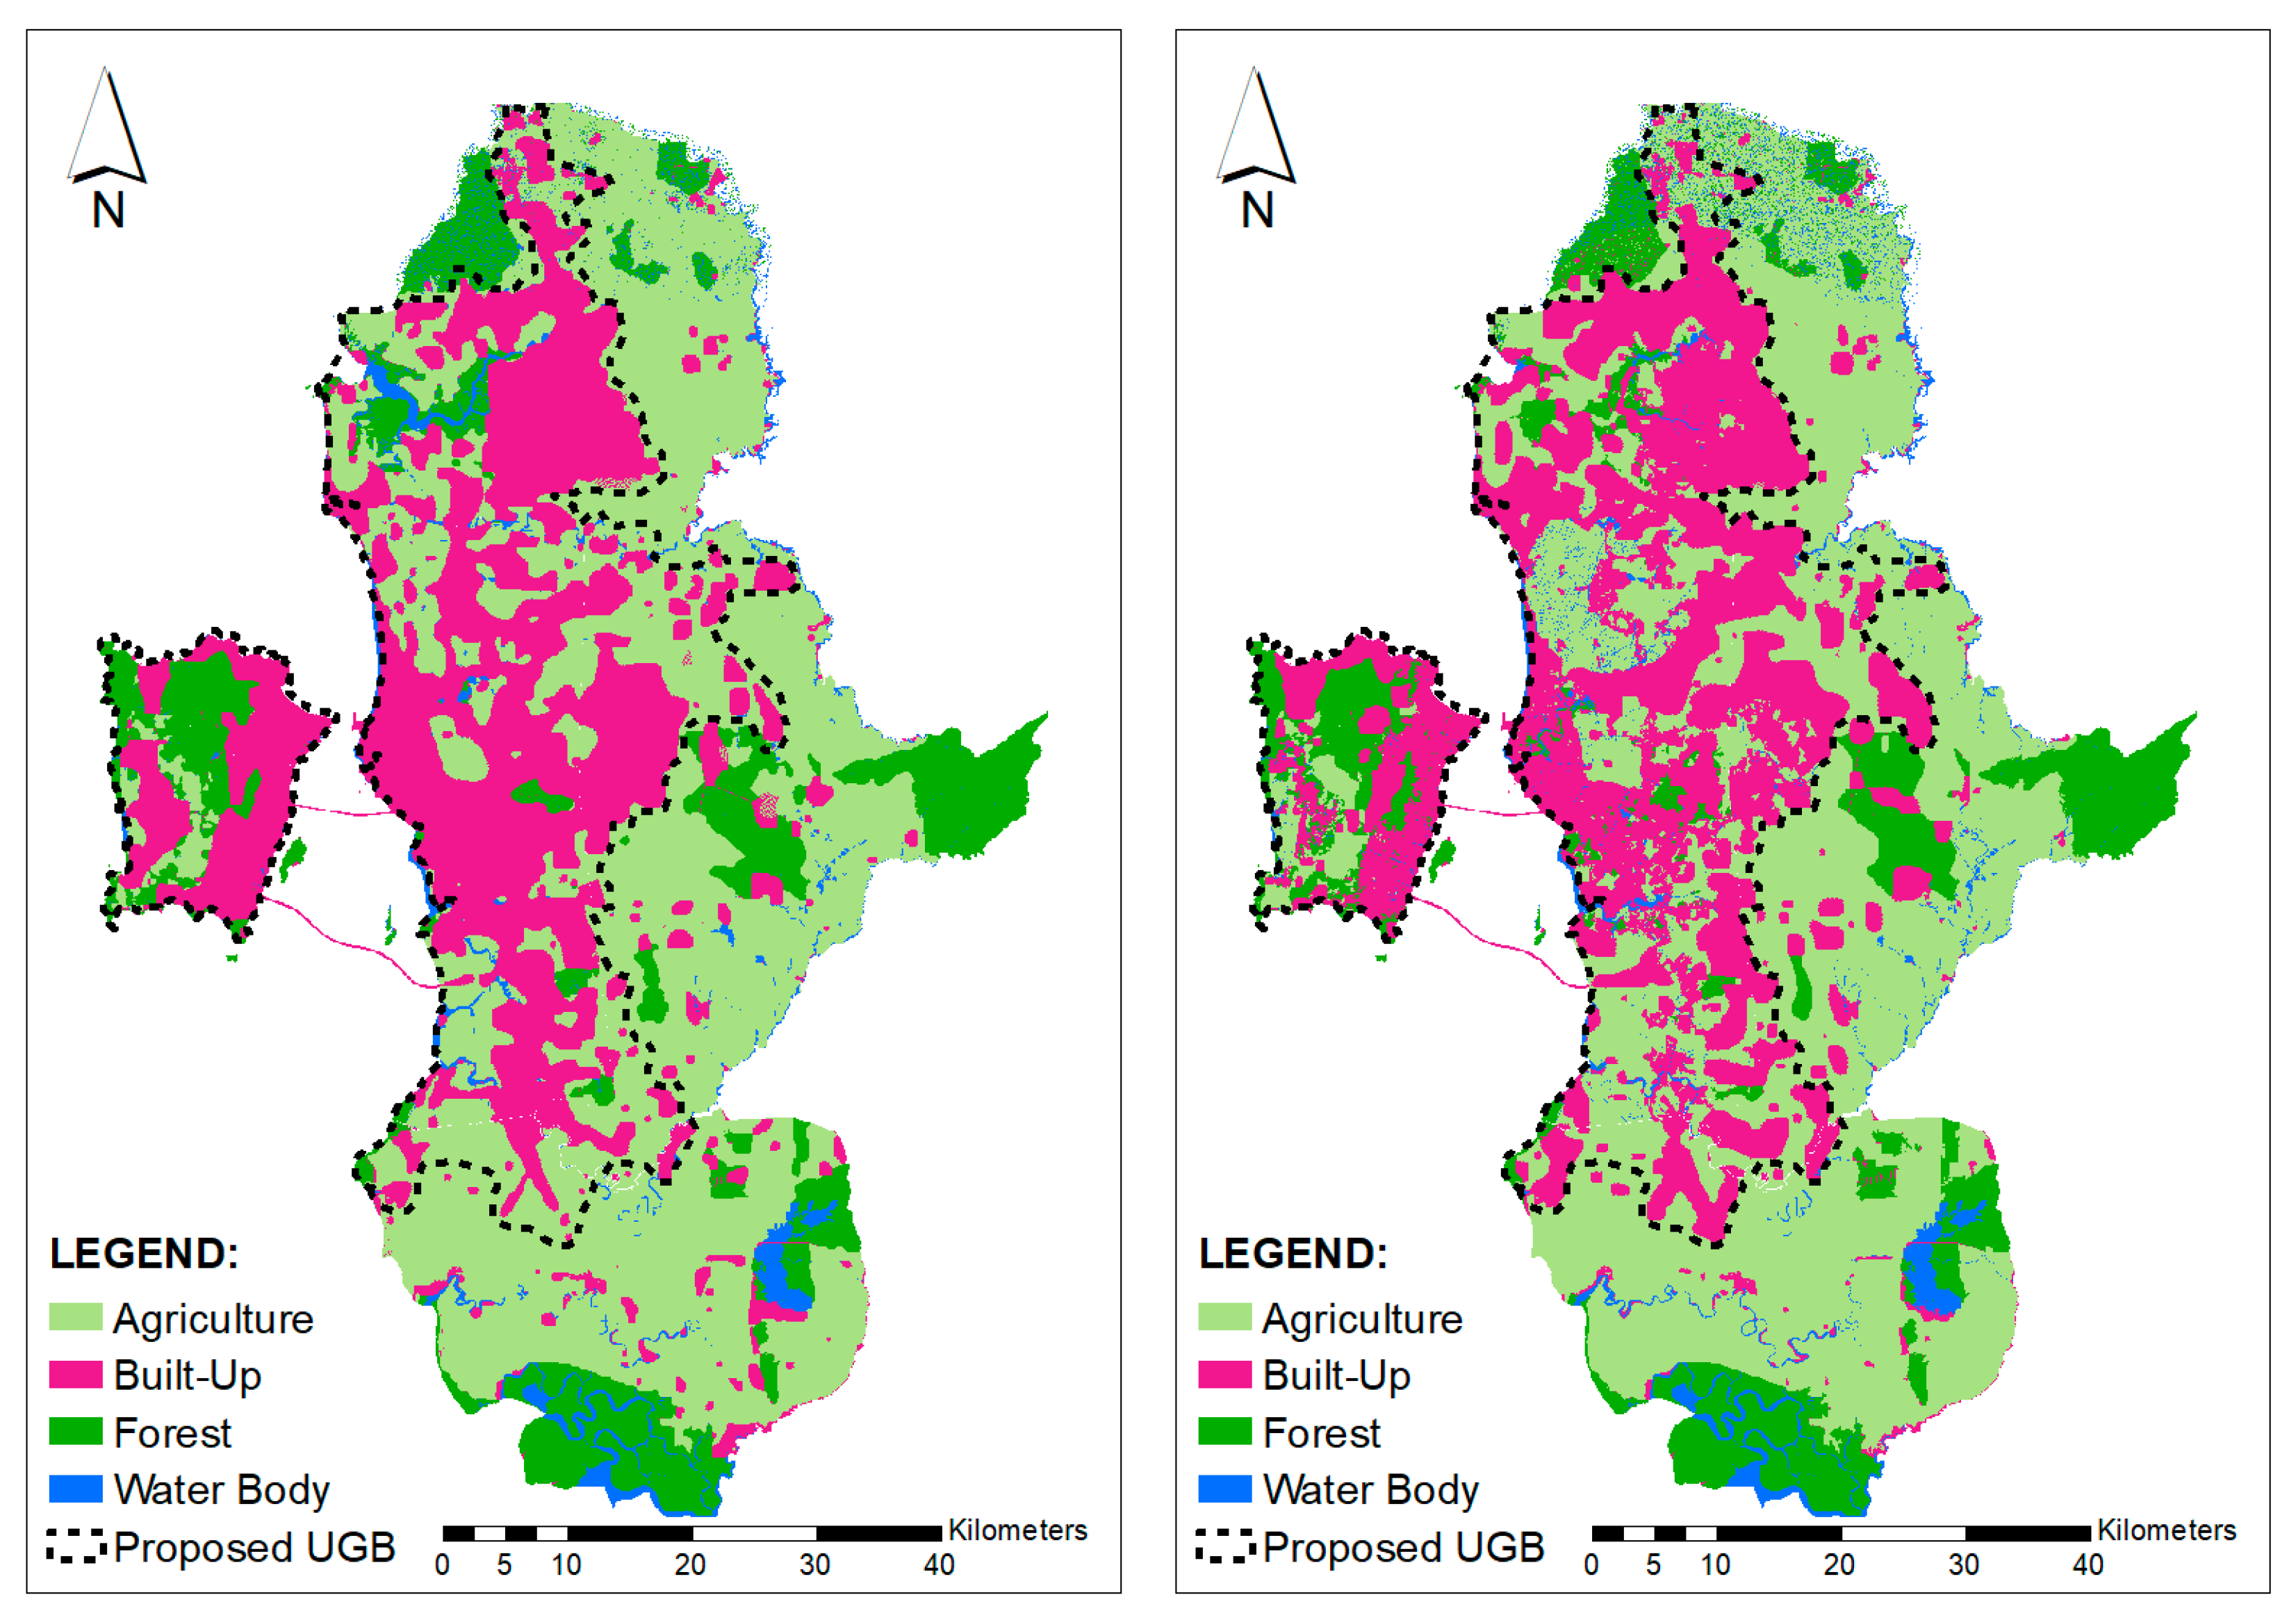
4.2. Predicting Land Cover for George Town Conurbation

Based on the probabilities calculated during 2010 to 2014 and 2014 to 2018, FutureSim could predict future land cover change up to 2030. This prediction is guided by population growth. To ensure the robustness of the models, the assessment was conducted by comparing the predicted land cover in 2018 with actual land cover in 2018, where the Kappa index was generated. Table 4 shows the results of models assessment. Kappa value, the accuracy for a compact growth model, and urban sprawl model were 74.08% and 79.40%, respectively, indicating a good prediction made by both models [37]. Furthermore, the urban sprawl model outperformed the compact growth model. It indicated that the model was able to truly capture the urban growth pattern for the cities in Malaysia [38]. Although, the type of growth was considered inefficient and an uneconomical use of land, since it relied on private transport, such as urban sprawl growth pattern, which has been experienced by cities in the study area.
The model was used to project land cover for 2014 and 2018, using both the compact growth and the urban sprawl scenarios (refer to Figure 5 and Figure 6). These figures showed that built-up areas in both models have spread out towards the north and east of the study area. More agriculture lands have been converted into built-up areas. The expansion of built-up areas should be controlled to ensure their sustainability. As shown in Figure 5 and Figure 6, built-up areas have started to expand towards peri-urban areas to the north and east of the study area.
The built-up area was expected to continue growing towards the north and the middle of George Town Conurbation, between Kedah-Penang state borders (as circled on the map). The models, then, were used to predict land cover changes (up to the year 2030). Figure 6 shows built-up areas continued to expand for both compact growth and urban sprawl scenarios. The availability of the North-South Highway has shortened the travelling time from this area to Penang Mainland and across to Penang Island [30]. The Second Penang Bridge that was opened to the public in 2014 has become another option for people to travel across to Penang Island, especially those from the southern region of George Town Conurbation [31]. Figure 7 shows the changes from other land covers to built-up areas can been clearly seen. Good accessibility to business centres, a commercial and industrial area in Juru, Bukit Minyak, Bayan Lepas (in Penang state), and Kulim (in Kedah State) has made this area attractive for residential development [6,8]. Such rapid expansion of the built-up area needs to be controlled and managed to ensure urban expansion does not bring negative impacts to the environment and society [4]. In developed nations, UGB can potentially be used to control built-up areas. Therefore, this model has been used to predict future expansion of built-up areas.
Since FutureSim is able to accurately predict land cover changes in the study area, the model was used to simulate land cover changes up to the year 2030 (Figure 8). As mentioned earlier, the proposed UGB for George Town Conurbation was determined based on land demand calculated to ensure land for built-up areas are allocated sufficiently for the growing population. Based on population projection by the Department of Statistics, Malaysia [36], the study area will accommodate 3,785,999 people in 2030, and the projected built-up area will be approximately 1253.95 square km (Table 5). The population density would be 3274.07 people per square kilometre. Based on additional land needed for 2030, areas with the highest suitability index, generated from potential sites for the urban development map, were used to delineate UGB. Figure 8 shows UGB drawn on projected land cover (2030) for both compact growth and urban sprawl growth scenarios.
The proposed model, FutureSim, was developed as a scientific tool to understand land cover changes at the peri-urban area of George Town Conurbation. This area is expected to experience rapid urbanisation due to industrialisation policies implemented since the 1970s [38]. Recent regionalisation policies foresee this area to be the hub for economic growth for the northern region [4,31]. As a result, this area is expected to experience rapid land cover changes. Uncontrolled growth will bring negative impacts to the society and threats to the environment [6,39]. FutureSim will provide the practical tool for executing the second National Urbanisation Policy in Malaysia, such that expansion of built-up areas can be allocated sustainably. Although UGB has been used for allocating land use, the boundary can potentially be used to restrict movement of urban populations to outside of the city boundary during emergencies, such as during a disease outbreak (e.g., flu or COVID-19).

5. Conclusions

Several cities in Malaysia have experienced a drastic urban growth, e.g. Penang, located in the northern part of Peninsular Malaysia [40]. This study demonstrated the development of FutureSim—an integrated GIS and CA-Markov model for predicting future land cover patterns in a moderately growing city. The prediction accuracy of 74.08% and 79.40% were obtained for compact growth models and urban sprawl models, respectively. These results showed that the model can be used to predict future urban expansion and can assist urban planners in managing land cover changes. Assessment of the model revealed the robustness of the model in simulating actual land cover. Thus, it can potentially be used to support the second National Urbanisation Policy in Malaysia, which imposes on the use of UGB or UCB in ensuring sustainable urban development. At present, no scientific tool is available that can be used to simulate expansion of built-up areas in the country. Therefore, it is timely that such an approach be used, as a guide in managing land cover changes and controlling expansions of built-up areas. Furthermore, the George Town Conurbation boundary, proposed by the Federal Department of Town and Country Planning, was based on the whole district, and affected by the rapid urban development due to George Town City. The boundary should be redrawn so that built-up areas can be developed solely to accommodate significant development of built-up areas. By identifying and implementing the UGB, encroachment of built-up areas into the forest and agricultural land can be controlled.

Author Contributions

Conceptualization, N.S.; methodology, M.A.M. and Y.L.T.; software, M.A.M. and Y.L.T.; validation, N.S. and M.A.M.; writing—original draft preparation, N.S.; writing—review and editing, M.L.T., and M.J.M.T.; project administration, N.S.; funding acquisition, N.S. All authors have read and agreed to the published version of the manuscript.

Funding

This research was funded by the Ministry of Higher Education, Malaysia, via Fundamental Research Grant Scheme (FRGS) grant number 203/PHUMANITI/671109.

Acknowledgments

The authors would like to thank the experts who have agreed to participate in the survey used to derive factors influencing urban development and their respective weights and PLANMalaysia, Penang State, for providing data used in this study. Special thanks to the three anonymous reviewers for their constructive comments.

Conflicts of Interest

The authors wish to declare that there is no conflict of interest in this study.

References

  1. Plecher, H. Urbanization in Malaysia. Statistica. 2020. Available online: https://0-www-statista-com.brum.beds.ac.uk/statistics/455880/urbanization-in-malaysia/#:~:text=Malaysia%20is%20currently%20one%20of,to%2074%20percent%20in%202014 (accessed on 15 September 2020).
  2. Department of Statistics Malaysia. Population Distribution and Basic Demographic Characteristic Report 2010; Population and Housing Census: Putrajaya, Malaysia, 2010. [Google Scholar]
  3. Samat, N. Pembangunan Tanpa Sempadan di Malaysia: Persoalan Kelestarian dan Transformasi Kawasan, Siri Syarahan Umum Pelantikan Profesor; Universiti Sains Malaysia, USM: Pulau Pinang, Malaysia, 2019. [Google Scholar]
  4. PlanMalaysia. Second National Urbanisation Policy (NuP2); Federal Department of Town and Country Planning, Ed.; PlanMalaysia: Putrajaya, Malaysia, 2016. [Google Scholar]
  5. Plecher, H. Total Population of the ASEAN Countries from 2008 to 2018. Available online: https://0-www-statista-com.brum.beds.ac.uk/statistics/796222/total-population-of-the-asean-countries/ (accessed on 15 September 2020).
  6. Elhadary, Y.A.E.; Samat, N.; Obeng-Odoom, F. Development at the peri-urban area and its impact on agricultural activities: An example from the Seberang Perai Region, Penang State, Malaysia. Agroecol. Sustain. Food Syst. 2013, 37, 834–856. [Google Scholar] [CrossRef]
  7. Wandl, A.; Magoni, M. Sustainable Planning of Peri-Urban Areas: Introduction to the Special Issue. Plan. Pract. Res. 2013, 32, 1–3. [Google Scholar]
  8. Ghazali, S. Socio-Economic Changes in the Peri-Urban Villages in Penang; University of Leeds: Leeds, UK, 1999. [Google Scholar]
  9. Samat, N.; Hasni RGhazali, S.; ElHadary, Y. Urban Expansion and its Impact on Local Communities: A Case Study of Seberang Perai, Penang, Malaysia. Pertanika J. Soc. Sci. Humanit. 2014, 22, 349–367. [Google Scholar]
  10. Samat, N. A Geographic Information System and Cellular Automata Spatial Model of Urban Development for Penang State, Malaysia; University of Leeds: Leeds, UK, 2002. [Google Scholar]
  11. Tayyebi, A.; Pijanowski, B.C.; Tayyebi, A.H. An urban growth boundary model using neural networks, GIS and radial parameterization: An application to Tehran, Iran. Landsc. Urban Plan. 2011, 100, 35–44. [Google Scholar] [CrossRef]
  12. Batty, M. Cellular automata and urban form: A primer. J. Am. Plan. Assoc. 1997, 63, 266–274. [Google Scholar] [CrossRef]
  13. Liang, X.; Liu, X.; Li, X.; Chen, Y.; Tian, H.; Yao, Y. Delineating multi-scenario urban growth boundaries with a CA-based FLUS model and morphological method. Landsc. Urban Plan. 2018, 177, 47–63. [Google Scholar] [CrossRef]
  14. Batty, M.; Xie, Y. From cells to cities. Environ. Plan. B Plan. Des. 1994, 21, S31–S48. [Google Scholar] [CrossRef]
  15. Wu, F. Modelling intrametropolitan location of foreign investment firms in a Chinese city. Urban Stud. 2000, 37, 2441–2464. [Google Scholar] [CrossRef]
  16. Samat, N. Integrating GIS and CA-MARKOV model in evaluating urban spatial growth. Malays. J. Environ. Manag. 2009, 10, 83–99. [Google Scholar]
  17. Clarke, K.; Hoppen, L.; Gaydos, A. A Self-modifying cellular automata model of historical urbanization in the San Francisco Bay Area. Environ. Plan. B Plan. Des. 1997, 24, 247–261. [Google Scholar] [CrossRef] [Green Version]
  18. Saxena, A.; Mahesh Kumar, J. Capturing heterogeneous urban growth using SLEUTH model. Remote Sens. Appl. Soc. Environ. 2019, 13, 426–434. [Google Scholar] [CrossRef]
  19. Liu, X.; Lianga, X.; Lib, X.; Xua, X.; Oua, J.; Chenb, Y.; Lic, S.; Wanga, S.; Peid, F. A future land use simulation model (FLUS) for simulating multiple land use scenarios by coupling human and natural effects. Landsc. Urban Plan. 2017, 168, 94–116. [Google Scholar] [CrossRef]
  20. World Population Review. Kuala Lumpur Population 2020. 2020. Available online: https://worldpopulationreview.com/world-cities/kuala-lumpur-population (accessed on 14 September 2020).
  21. UNDESA. World Urbanization Prospects: The 2014 Revision; UNDESA: New York, NY, USA, 2014. [Google Scholar]
  22. McGee, T.G. The Southeast Asian City: A Social Geography of the Primate Cities of Southeast Asia; G. Bell and Sons Ltd.: London, UK, 1967. [Google Scholar]
  23. Samat, N.; Mahamud, M.A.; Rashid, S.M.R.A.; Elhadary, Y.; Noor, N.M. Urbanisation beyond its core boundary and its impact on the communities in George Town conurbation, Malaysia. Plan. Malays. 2019, 17, 38–49. [Google Scholar] [CrossRef]
  24. Nugroho, P. The concept, form and mechanism transfer of knowledge in peri-urban areas in Indonesia. IOP Conf. Ser. Earth Environ. Sci. 2018, 202, 012037. [Google Scholar]
  25. Butsch, C.; Heinkel, S.-B. Periurban Transformations in the Global South and Their Impact on Water-Based Livelihoods. Water 2020, 12, 458. [Google Scholar] [CrossRef] [Green Version]
  26. Pascariu, S.A.; Czischke, D. Promoting Urban-Rural Linkages in Small and Medium Size Cities in URBACT Study; European Exchange and Learning Programme Promoting Sustainable Urban Development: Paris, France, 2017. [Google Scholar]
  27. McGee, T.G. Urbanisasi or Kotadesasi? Evolving patterns of urbanization in Asia. In Urbanization in Asia: Spatial Dimensions and Policy Issues; University of Hawaii Press: Honolulu, HI, USA, 1989; pp. 93–108. [Google Scholar]
  28. Legates, R.; Hudalah, D. Peri-urban planning for developing East Asia: Learning from Chengdu, China and Yogyakarta/Kartamantul, Indonesia. J. Urban Aff. 2014, 36, 334–353. [Google Scholar] [CrossRef]
  29. Rauws, W.; de Roo, G. Exploring transitions in the peri-urban area. Plan. Theory Pract. 2011, 12, 269–284. [Google Scholar] [CrossRef] [Green Version]
  30. Abbott, C. Planning a Sustainable City. The Promise and Performance of Portland’s Urban Growth Boundary. Urban Spraw. CausesConseq. Policy Responses; Urban Institute: Washington, DC, USA, 2002; pp. 207–235. [Google Scholar]
  31. Northern Corridor Implementation Agency (NCIA). Annual Report 2018; NCIA: Simpang Ampat, Pulau Pinang, 2018. [Google Scholar]
  32. Eastman, J.R. IDRISI Kilimanjaro: Guide to GIS and Image Processing; Clark University: Worcester, MA, USA, 2003. [Google Scholar]
  33. Saaty, T.A. Decision-Making for Leaders, 2nd ed.; RWS Publication: Pittsburgh, PA, USA, 1992. [Google Scholar]
  34. Beynon, M. DS/AHP method: A mathematical analysis, including an understanding of uncertainty. Eur. J. Oper. Res. 2002, 140, 148–164. [Google Scholar] [CrossRef]
  35. Hossain, M.F.; Adnan, Z.H.; Hasin, M.A.A. Improvement in weighting assignment process in Analytic Hierarchy Process by introducing suggestion matrix and Likert scale. Int. J. Supply Chain Manag. 2014, 3, 91–95. [Google Scholar]
  36. Department of Statistic, Malaysia. Population projection (Revised) Malaysia 2000–2040; Department of Statistics: Putrajaya, Malaysia, 2016. [Google Scholar]
  37. Monserud, R.A.; Leemans, R. Comparing global vegetation maps with the Kappa statistic. Ecol. Model. 1992, 62, 275–293. [Google Scholar] [CrossRef]
  38. Rosni, N.A.; Noor, N.M.; Abdullah, A. Managing Urbanization and Urban Sprawl in Malaysia by Remote Sensing and GIS Applications. Plan. Malays. 2016, 14, 17–30. [Google Scholar]
  39. Salleh, G. Urbanisation & Regional Development in Malaysia; Utusan Publications & Distributors: Kuala Lumpur, Malaysia, 2000. [Google Scholar]
  40. Tew, Y.L.; Tan, M.L.; Samat, N.; Yang, X. Urban Expansion Analysis using Landsat Images in Penang, Malaysia. Sains Malays. 2019, 48, 2307–2315. [Google Scholar] [CrossRef]
Figure 1. Peri-urban areas provide linkages between urban and rural areas. Source: modified from Wahyudi and Nugroho [24].
Land 09 00373 g001
Figure 2. George Town Conurbation located within the Northern Region of Peninsular Malaysia.
Land 09 00373 g002
Figure 3. Land cover data of (a) 2010, (b) 2014, and (c) 2018 used in this study.
Land 09 00373 g003
Figure 4. FutureSim modelling framework used in this study.
Land 09 00373 g004
Figure 5. Predicted land cover, 2014, using compact growth (left) and urban sprawl scenarios (right).
Land 09 00373 g005
Figure 6. Predicted land cover, 2018 using compact growth (left) and urban sprawl scenarios (right).
Land 09 00373 g006
Figure 7. Changes of the built-up area from the year 2018 to (predicted year) 2030 for compact growth (left) and urban sprawl scenario (right).
Land 09 00373 g007
Figure 8. Projected Land Cover and urban growth boundary (UGB) 2030 for compact growth (left) and urban sprawl growth scenario (right).
Land 09 00373 g008
Table 1. Data sources and resolution collected for the study.
DataSourcesFormat/
Resolution
Details
Land usePLANMalaysia and NCIAShapefile/30 m × 30 mLand use of the George Town Conurbation for years 2010, 2014, and 2018
Major road or highwayGoogle Earth ProShapefile/30 m × 30 mMajor road or highway are digitized based on Google Earth Pro year 2018
Major cities or townsPLANMalaysia and NCIAShapefile/30m × 30mMajor cities or towns in the George Town Conurbation year 2018
Employment areasPLANMalaysia and NCIAShapefile/30 m × 30 mEmployment area are digitized based on city area drawn by PLANMalaysia for year 2018
Education amenitiesPLANMalaysia and NCIAShapefile/30 m × 30 mEducation amenities in the George Town Conurbation year 2018
Developed areasPLANMalaysia and NCIAShapefile/30 m × 30 mDeveloped area in the George Town Conurbation year 2018
Health facilitiesPLANMalaysia and NCIAShapefile/30 m × 30 mHealth facilities in the George Town Conurbation year 2018
Table 2. Area of Major Land Cover for Years 2010, 2014, and 2018.
Land Use2010 (km2)2014 (km2)2018 (km2)
Agriculture2158.022137.572113.83
Built-up887.17906.37925.77
Forest716.18718.16712.11
Water Body170.97178.04188.43
Table 3. Factors influencing urban development and their respective weights for two planning scenarios.
CriteriaWeight for Compact Development ModelWeight for Urban Sprawl Model
Distance to education amenities0.060.06
Distance to employment areas0.380.19
Distance to developed areas0.160.10
Distance to health facilities0.040.04
Distance to major roads0.100.35
Distance to major towns0.260.26
Consistency Ratio0.060.08
Table 4. Accuracy assessment and Kappa value.
Compact Growth ScenarioSprawl Scenario
0.74040.8106
0.82350.8676
0.74510.7961
0.75290.7529
0.74080.7940
Table 5. Projected land cover size for 2030 using compact growth scenario.
Land CoverProjected Land Cover (km2) 2030
Agriculture1966.02
Built-Up1253.95
Forest714.35
Water Body186.35

