Urban Planning and Design for Building Neighborhood Resilience to Climate Change


Department of Spatial Planning and Environmental Sciences, Faculty of Geodesy and Cartography, Warsaw University of Technology, Plac Politechniki 1, 00-661 Warsaw, Poland
*
Author to whom correspondence should be addressed.
Land 2020, 9(10), 387; https://0-doi-org.brum.beds.ac.uk/10.3390/land9100387
Submission received: 17 August 2020
/
Revised: 5 October 2020
/
Accepted: 8 October 2020
/
Published: 12 October 2020
(This article belongs to the Special Issue Urban Ecosystem Services)
Abstract
:The aim of the paper was to present the procedure of building neighborhood resilience to climate threats, embedded in planning (from the strategic to local level) and design process and focused on usage of natural adaptive potential. The presented approach encompasses: (1) the strategic identification of focal areas in terms of climate adaptation needs, (2) comprehensive diagnosis of local ecological vulnerability and natural adaptive potential to build adaptive capacity, and (3) incorporation of natural adaptive potential through an identified set of planning and design tools. For diagnosis and strategic environmental impact assessment, the multicriteria analysis has been elaborated. The described procedure is applied to the City of Warsaw on the strategic level, by elaboration of the ranking of districts in terms of priority to take adaptation actions based on climatic threats, demographic vulnerability, and assessment of Warsaw Green Infrastructure potential. For further analysis at the planning and design stage, the district with the most urgent adaptation needs has been chosen, and within its borders, two neighborhoods (existing and planned one) with diagnosed ecological sensitivity were selected. Both case studies were analyzed in terms of environmental conditions, urban structure, and planning provisions. It enabled identification of existing natural adaptive potential and assessment of its use. As a result, propositions for enhancing neighborhood resilience to climate change were suggested.
1. Introduction
Cities and their inhabitants are particularly vulnerable to threats related to climate change (thermal and hydrological in particular), which have a negative impact on human health, quality of life, and urban infrastructure. Creating resilient cities is a major challenge for city builders [1,2]. It applies not only to new development but also to existing urban structures. Creating resilient neighborhoods should be the result of properly implemented urban planning and design [3]; for this to happen, planning documents should contribute significantly, because they shape the natural performance of planned areas. However, this is problematic in terms of the conceptualization of resilience and its implementation in the urban realm.
Meerow et al. [4] and Masnavi et al. [5] stated that the concept of resilience related to the urban realm is inconsistent and contested, but crucial in order to develop the adaptive capacity of urban socioecological systems. For a resilient city to be understood as a socioecological system, it should consist of physical and social sub-systems. The physical sub-systems encompass the natural and built components of an urban structure. The social sub-system is built by human societies. Since system structure determines overall system behavior, systems should not be managed only for productivity but also for resilience [6].
Masnavi et al. [5] indicated three conceptual approaches of resilience thinking present in literature: (1) resilience as recovery, (2) resilience as compatibility or adaptation capacity, and (3) resilience as change. There are also two levels of resilience: general and specific. A strategic evaluation of urban resilience focused on general resilience proprieties before considering specific resilience. The authors pointed out the importance of the relationship between urban form and urban resilience. The role of spatial planning in building urban resilience to climate change was demonstrated by Jabareen [7] as one of four drivers in his resilient city planning framework.
Adaptive instruments aimed at building urban resilience to climate change should be implemented systemically and strategically, through planning tools to design and technical solutions. The strategic level focuses on a city’s general resilience and corresponds to its ecological and social vulnerability [8,9]. The planning and design level relates to the specific urban physical system resilience. According to Aguiar et al. [10], who compared local adaptation strategies in Europe, spatial planning was considered as one of the priority sectors for adaptation. However, there is a little knowledge of how it is implemented in practice at the planning level [11]. Masnavi et al. [5] highlighted the need for further research on spatial morphology and urban spatial structures as tools to build urban resilience. While opportunities at the strategic and technical levels have already been recognized, there is a gap at the planning and design level [5,11,12,13]. The reason may be internal constraints related to the legal context, for example, available tools and scope of mandatory regulations, or the level of awareness of local authorities and the awareness and skills of designers [11,14].
Such a problem can be observed in Poland, where, at the strategic level, adaptation plans are developed both at the national level [15] in relation to EU policy [16,17] and at the municipal level. Local adaptation plans to climate change were produced in three separate projects including: the Urban Adaptation Plans (MPA44) [18] and the Adaptcity [19], which resulted in plans for 44 cities with over 100,000 residents and the capital city of Warsaw, and the CLIMCITIES [20], which provide training on climate change issues and developing an urban climate adaptation plan for local authorities in cities with populations from 50,000 to 99,000 residents. This paper discusses only the Adaptcity project in more detail as an exemplification.
However, even though climate change adaptation is well recognized at the strategic level, Polish spatial planning system does not directly address this issue. Instead, it requires the provision of proper living conditions and the maintenance of biological balance. The key instruments (the study of conditions and directions of spatial development at the municipal scale and local spatial development plans) are accompanied by environmental study and strategic environmental impact assessment (EIA). Environmental study and strategic EIA in general refer to the natural performance and very rarely comprehensively consider the issue of climatic threats. Nevertheless, planning documents must compulsorily set the principles of environmental protection to include: (1) a rational use of the earth’s surface, (2) ensuring protection of landscape values of the environment and climatic conditions, and (3) comprehensive solutions for urban development problems with particular emphasis on: (a) water management and (b) arranging and shaping green areas.
From the climate adaptation perspective, a problem occurs in terms of available tools on the planning level. For instance, even though the biologically active area index is the most important indicator, it lacks sufficient legal clarification and authorization. The index does not reflect the impact of vegetation structure and adopted technical solutions on natural performance. Moreover, stormwater management is not mandatory to planning provisions and appears mostly as facultative recommendations.
The implementation of adaptation actions to climate change postulated at the strategic level requires the use of urban planning and design tools, but owing to the flawed spatial planning system in Poland as mentioned above, there is a problem in the integration of activities between strategic and planning levels.
This article is focused on the issue of urban planning and design as tools for building specific urban resilience to climate change with reference to urban form. Due to the problems indicated in the introduction, it aims to fill the gap in the implementation of adaptation measures that exists at the planning and design level. To fill that gap, we propose the procedure of building neighborhood resilience to climate threats embedded in planning (from the strategic to the local level) and designing while focusing on usage of natural adaptive potential. It will be applicable both when planning new investments and when evaluating the natural condition of existing neighborhoods in order to improve their resilience. The practical implementation of the procedure is described on the example of Warsaw, Poland.
To achieve the objective of the paper, a literature review describing resilience implementation with the use of natural adaptation potential and a set of tools for urban planning and design are presented. Next, at the strategic level, a ranking of districts in terms of priority to take adaptation actions has been enumerated, while at the planning and design level a multicriteria analysis to diagnose the natural functioning of the neighborhoods in their existing and planned states has been elaborated. Then, the results and discussion related to the case studies and literature are provided. The paper concludes with proposal of a procedure to integrate the strategic level with the planning and design level.
2. Literature Review
2.1. Resilience Implementation
The first step in dealing with the system is to get a deep understanding of its structure and behavior [6]. Since cities constitute socioecological systems, the integration of ecology with urban planning and design has been recommended to build urban resilience, particularly to climate change. This way of thinking about urban planning already has a long tradition that fits with existing environmental approaches [1,21,22,23,24,25,26,27,28,29]. According to McHarg and Steiner [30], the design process should start with a comprehensive ecological inventory focused on natural processes in order to integrate them into planning and design. Ecological factors constitute determinants of the environmental capacity to support human activity and suitability for a particular type of land use. The idea is to use nature as a strategic ally through planning and designing around ecosystems services. To achieve natural and social sub-system compatibility, Pickett et al. [1] indicated understanding and using spatial heterogeneity. Ahern [24] proposed five strategies to build urban resilience capacity: (1) biodiversity, (2) multifunctionality, (3) multiscale networks, (4) modularity, and (5) adaptive design. Nature-based solutions (e.g., green infrastructure) are recommended as best practices in adaptation by the European Commission [31]. Nature could be integrated into built components of urban systems by incorporating its forms and features, natural processes, and entire living systems through planning and design [1,32]. In relation to hydrological and thermal hazards resulting from climate change, two natural processes and their determinants are crucial to build adaptive capacity: hydrological cycle and air circulation. Natural adaptation potential for building adaptive capacity of urban physical sub-systems consists of environmental features of the area such as geology, soils, water, and vegetation. These features enable rainwater management based on natural hydrological processes and favorable climatic conditions (in particular, optimal thermal conditions). These properties can be employed to minimize hydrological and climatic hazards. Moreover, entire living systems (ecosystems) like forests or wetlands should be integrated to build natural adaptation potential. A set of the most useful tools for urban planning and design level is presented in the next section.
2.2. Tools for Urban Planning and Design
There is a wide range of nature-based and technical adaptation solutions to climate change suitable for urban planning and design. First, the proper zoning of the area corresponding to its natural predispositions have to be established [21,25,28]. Next, three types of adaptation tools for urban planning and design should be taken into consideration: (1) urban development indicators, (2) urban structure (morphology), and (3) technical solutions (Table 1). These tools are useful for building resilience to thermal and hydrological threats resulting from climate change; their effectiveness has been supported by numerous published researches (Table 1).
Zoning allows the incorporation of the natural ecosystems into building resilient neighborhoods and cities as well as using the natural properties of the areas to create suitable functions of the development. The effectiveness of this ecological approach to urban planning and design has been supported by the Woodlands Neighborhood, designed by McHarg [27].
The urban development indicators support the zoning tool in terms of fitting the development intensity to natural conditions in order to manage natural processes and to provide well-being. The most significant indicators used to shape climatic conditions of the urbanized areas are the biologically active area index (BAAI), the surface runoff indicator, and the maximum building height. According to Szulczewska et al. [33], there is a threshold of 45% of the biologically active area’s share to enable proper natural performance in the neighborhoods, especially to provide sustainable stormwater management. The BAAI and surface runoff indicator could be integrated into one indicator as it is implemented in Berlin (Biotope Area Factor), Malmö (Green Space Factor), and Seattle (Seattle Green Factor). Scott et al. [32] stated that one of the methods of adapting cities to future high temperatures is to increase the presence of green spaces. Gill et al. [34] indicated the effectiveness of the increase of BAAI by 10% in his case study of Manchester. The maximum building height in relation to the separation width between buildings shapes the areas’ roughness and air circulation conditions in terms of wind flow, velocity, turbulences, and dispersion. The following intervals of building height as obstacles for air circulation can be established: 3–10, 10–15, 15–25, above 25 m [37,67].
Urban morphology is a matter of urban design, which is a crucial tool to incorporate natural adaptive potential into urban composition, and to design natural processes, and adjust them to local environmental performance. The building and vegetation structure and layout, as well as green areas’ layout and size, should be considered, in particular, to provide proper climatic conditions. The relationships between both are also important. Stewart and Oke [37] and Krautheim et al. [38] pointed out the width/height ratio (the distance between buildings in relation to their height) as the most useful indicator for climatic conditions in urbanized areas. The best air circulation conditions are in areas where the width/height ratio is above 2.4, between 1.4 and 2.4 air circulation conditions are limited, while below 1.4 they are strongly limited.
Vegetation structure modifies not only the roughness, but also evapotranspiration, which is a key process resulting in cooling surface temperature. This is the reason why vegetation structure plays a significant role as a resilience building tool for both thermal and hydrological threats. The areas covered by trees have higher evapotranspiration than grass surfaces and, consequently, a higher cooling effect [40,41]. However, since the coverage of trees has higher roughness and limits horizontal air circulation, while improving convection as a thermally contrasting patch, it is more appropriate to introduce it among intensely urbanized areas rather than in ventilation corridors.
In contrast, it is difficult to give precise specifications as to how many, how big, and where the green areas should be established, because there are too many variables determining climatic conditions in cities [29]. Therefore, the configuration should always be considered for each case, using existing natural forces, processes, and features. Nevertheless, some data have been provided. According to Asgarian et al. [43], composition, configuration, and structure of green space patches considerably affect the nearest urban land surface temperature of built areas. They pointed out that the patches should be homogeneously dispersed, stating that the buffer zone of lower surface temperature reaches up to 200 m. Stewart and Oke [37] indicated the existence of the thermal transitions zones between thermally contrasting local climate zones like green and built-up areas of 200–500 m, depending on surface roughness, building geometry, and atmospheric stability conditions.
The size of green patches is also important: the greater the size, the higher the reduction of surface temperature [43]. Nonetheless, Kensington Garden (100 ha) has the relatively small buffer zone of a width of 400 m. Thus, networks of small (2–3 ha) green spaces were recommended by Doick et al. [44] for effective cooling of urban environments. Also, Hough [29] stated that a fine net of small green areas, distributed homogenously, is more effective than a few large spaces. Apart from size, the crucial features of each green cover patch are: (1) the perimeter-to-area ratio must be minimal—the optimal patches are compact, circular, and rectangular shapes, as well as (2) the core area index—areas with more irregular shapes, which contain more core area, are better than simple, linear shapes [43].
Green areas are also crucial to provide proper hydrological functioning and can be used in stormwater management to reduce the risk of flooding in urban areas dominated by impervious surfaces. Generally, green areas minimize runoff volume; however, the effectiveness of the process greatly depends on vegetation structure as well as the layout and size of a patch. Deutscher et al. [42] has shown that areas covered with trees can intercept up to five times as much water as lawns and produce half as much runoff. Kim and Park [46] indicated that larger and less-fragmented patterns are more likely to decrease peak runoff. Additionally, the effect is amplified by vegetation abundance, especially trees or shrubs, as they increase the storage capacity of an area during flooding.
Finally, technical solutions are to be considered. For adaptation to thermal threats, the modification of the albedo is the point. It could be achieved by technical (cool roofs, facades, or pavements) or nature-based solutions (green roofs, facades, infiltration and bioretention basins and trenches, swales, detention and retention ponds, constructed wetlands, etc.). Adaptation to hydrological threats concerns mostly the sustainable storm water management. Nature-based solutions have a positive impact for both hydrological and thermal threats due to the evapotranspiration process.
3. Materials and Methods
This study consisted of two stages to comply with the aim of the paper, which was the integration of adaptation activities between strategic and planning and design levels. The first stage presents the strategic level of the planning process, and its research area encompasses the city of Warsaw within its administrative borders. The second stage corresponds to the local level of planning and design, and it was conducted on two neighborhoods (existing and planned one) chosen from a district with the most urgent adaptation needs based on the results from the first stage.
3.1. Strategic Level
The first stage of the study involved exploring adaptation needs of Warsaw’s districts in context of their potential to implement nature-based solutions. In order to indicate the priority areas for implementing adaptation actions, a ranking of districts was developed. These areas include districts with climatic and demographic risks as well as limited potential for creating green infrastructure. To assess climatic risk, nine indicators were used according to the Warsaw Adaptation Plan [68]: (1) Flood risk in the Vistula valley (Flood), (2) Risk of local flooding after heavy rainfall (Local Flooding), (3) Urban Heat Island, (4) Number of hot nights with minimal temperature above 18 degrees (Hot Nights), (5) Impervious surface coverage (Impervious Surface), (6) Urban Density, (7) Share of built-up areas (Built-up Areas), (8) Estimated increase in residential units (Projected Development), (9) Green areas and forests share (Green Areas).
Demographic vulnerability was estimated based on age structure of inhabitants in districts (percent of the population considered to be vulnerable including people under 4 and over 65 years old) [69]. The potential of green infrastructure was evaluated by eight indicators determining quantitative and spatial potential [70,71]: (1) Share of green infrastructure area in district area (GI Area), (2) Green infrastructure area per inhabitant in district (GI per Inhabitant), (3) Share of recreational green areas in district area (Recreational GI), (4) Share of recreational green areas per inhabitant in district (Recreational GI per Inhabitant), (5) Share of housing areas with recreational green areas within a 500-m distance in district area (Housing with Recreational GI within 500 m), (6) Share of housing areas with recreational green areas above a 500-m distance in district area (Housing with Recreational GI above 500 m), (7) Length of planned bike lanes per 1000 ha of housing area (Planned Bike Lanes Density), (8) Share of potential areas for creating green infrastructure in district area (Potential areas for GI).
The indicators were assessed on a point scale, where those increasing climatic risk scored negative points, while those decreasing the risk gained positive points. Each criterion was scored separately to create three sub-rankings; here, districts were assigned to five classes to facilitate comparison of the results. Final summarized ratings of all three criteria determined the priority of taking adaptation actions in the districts. For further analysis, within the district with the highest adaptation priority, two neighborhoods (one existing and one planned) were chosen based on development plans, exposure to climatic risk and similar natural conditions.
3.2. Local Planning and Design Level
The second stage of the study included determination of natural adaptation potential and an analysis of the existing urban layout and planning provisions of the chosen neighborhoods. We proposed to identify current and future conditions for ventilation, air regeneration and cooling, infiltration, and surface runoff using multicriteria analysis in which criteria were inspired by planning tools (Table 1) derived from literature review presented in Section 2. The method consists of the following steps:
- 1.
- Factors selection and division into classes based on ranking criteria (Table 2).
- 2.
- Evaluation of classes in a gradient of values from 0 to 1 considering relationships between classes and their importance for the factor in terms of the objective of the analysis (expert method). Class of the highest importance (class I) receives the highest value.
- 3.
- Calculation of factor’s values for planning units (units from local spatial development plans) using weighted arithmetic mean (WAM) as in Equation (1):where Ci for is the class value assigned separately for each factor in the expert method and Ai for is the area of class i in the planning unit.
- 4.
- Assigning weights to factors (expert method) taking into account relative magnitude of the impact the factors have on natural conditions analyzed. For example, in terms of infiltration conditions, land cover obtains lower weight than hydrogeologic factors, because it is easily modifiable by human activity, and therefore its impact also changes.
- 5.
- Combining factors’ values within each analysis with factors’ weights (assigned in step 4) using weighted geometric mean (WGM) as in Equation (2):where f o r is the factor rating (WAM) in the planning unit and for - the factor weight. This function allows to model synergistic interaction between factors [72]. The step results in average conditions for: ventilation, air regeneration and cooling, infiltration, and average surface runoff in each planning unit.
Next, obtained values (WGM) were classified into four classes of climatic and hydrological conditions (very good, good, moderate, bad). To assess the impact of planned development on hydrological and climatic conditions, the classes in existing and planned state were compared. As a result, three types of changes were distinguished: improvement, no change, deterioration. Criteria values for the existing state were calculated based on data derived from the Warsaw Environmental Atlas [73], topographic objects database (BDOT10k), aerial imagery (orthophoto), and on-site visits.
Criteria values for the planned state were estimated according to urban indicators from planning provisions and included biologically active area index, maximum building height, and percentage of impermeable built-up area. All calculations referred to the planning units specific to local spatial development plans.
The analysis determined natural performance of case studies as well as their sensitivity to hydrological and thermal hazards. In a further step, the degree of usage of the natural potential in adaptation to climate change was assessed.
4. Results and Discussion–The City of Warsaw Case Study
4.1. Priority of Adaptation to Climate Change in Warsaw
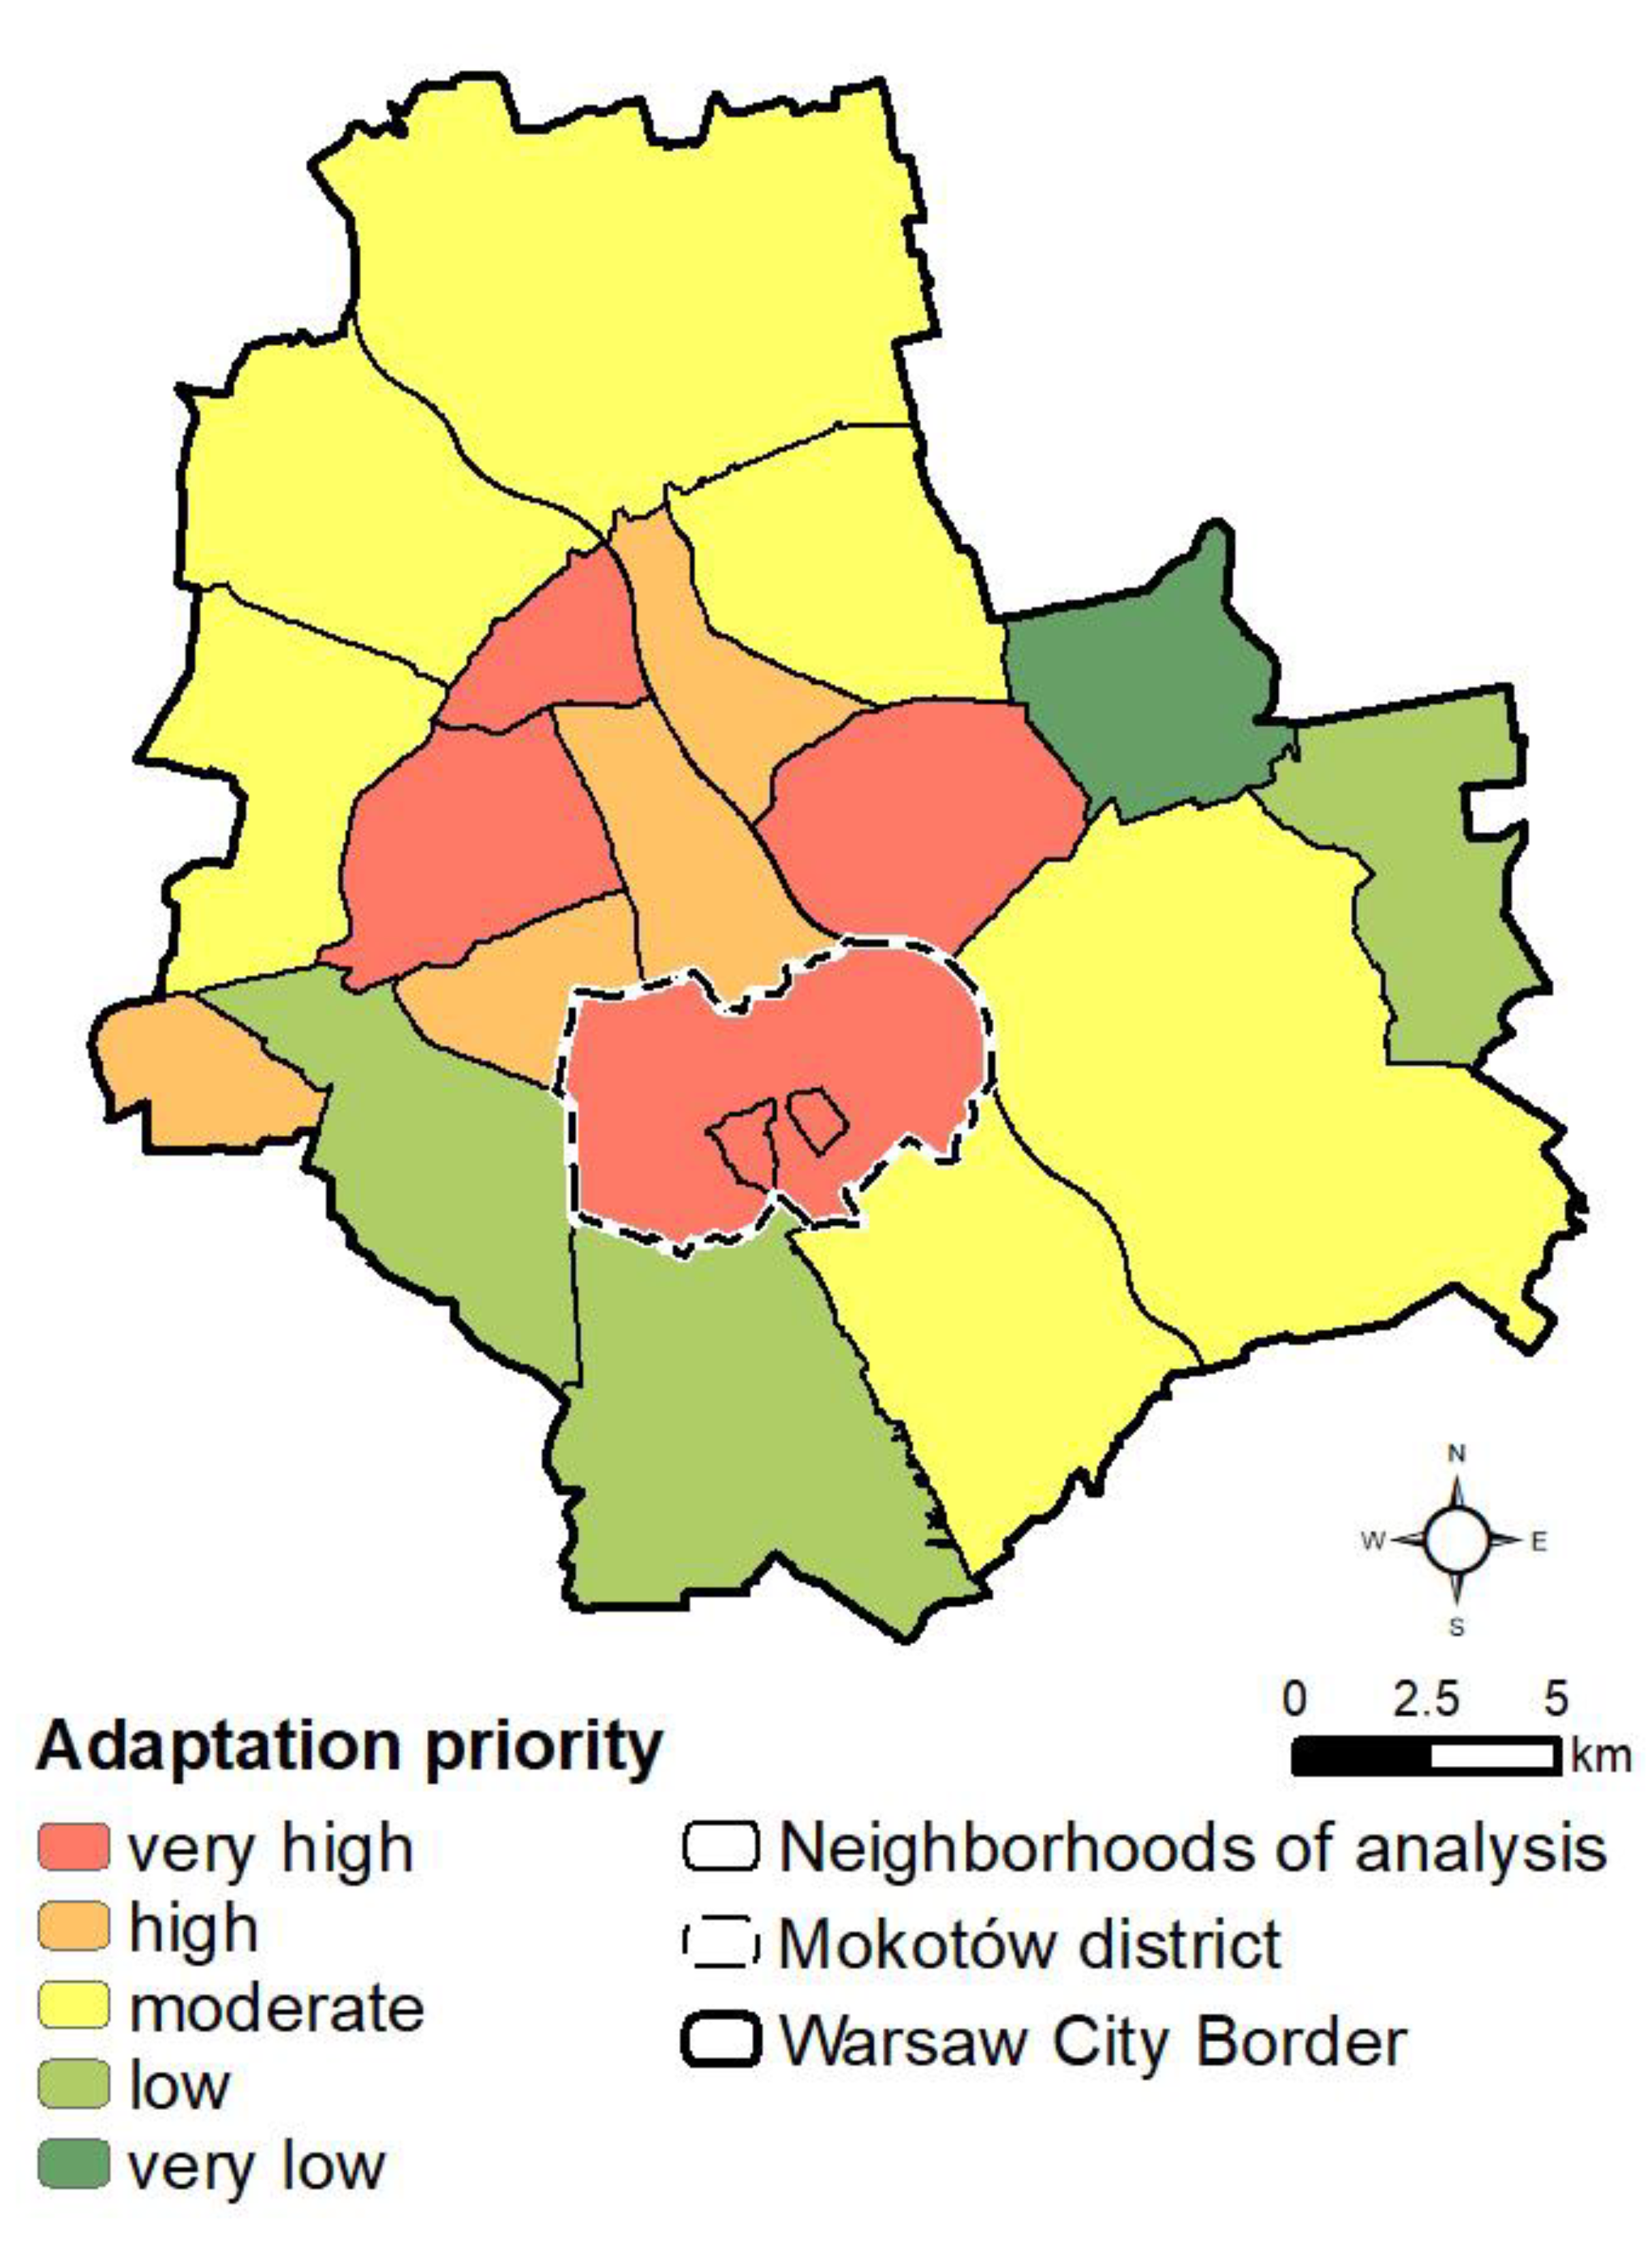
Warsaw will be negatively affected by climate change, in particular the increase in number and intensity of hot days [74] and frequency of precipitation that causes local flooding [68]. The ranking of the adaptation priority shows differences among districts.
Very-high priority was identified in Wola, Praga Południe, Mokotów, and Żoliborz, while high priority in Ursus, Ochota, Śródmieście, Praga Północ (Figure 1, Table 3). These are densely built-up inner parts of the city populated by a vulnerable group of inhabitants, mostly in old age. Climatic threat in those districts comprises urban heat island, high risk of flooding in the event of levee failure in the Vistula valley, and/or inundation due to an overloaded sewage system during heavy rainfall. Simultaneously, the existing amount of greenery and potential areas for creating new green infrastructure is insufficient to compensate the risks.
Moderate priority to take adaptation action concerns the outer districts of Bemowo, Targówek, Bielany, Białołęka, Wawer, and Wilanów, with low or moderate climatic threat characterized by less frequent or no occurrence of urban heat island and only local risk of flooding. This group comprises both older districts with high share of built-up areas and a high amount of well-designed greenery (Bielany, Bemowo, Targówek), and developing districts which lack accessible green infrastructure but have potential areas for creating it (Białołęka, Wilanów). The former are inhabited predominantly by an older population, the latter by younger people.
Low priority was also diagnosed in the outer districts of Włochy, Ursynów, Wesoła and Rembertów, where the climatic threat is very low to moderate due to lower urban density and a larger share of open green areas or forests, and share of vulnerable groups among inhabitants is not significant.
For further analysis in the case studies formula, two neighborhoods were chosen from the district of Mokotów (Figure 1):
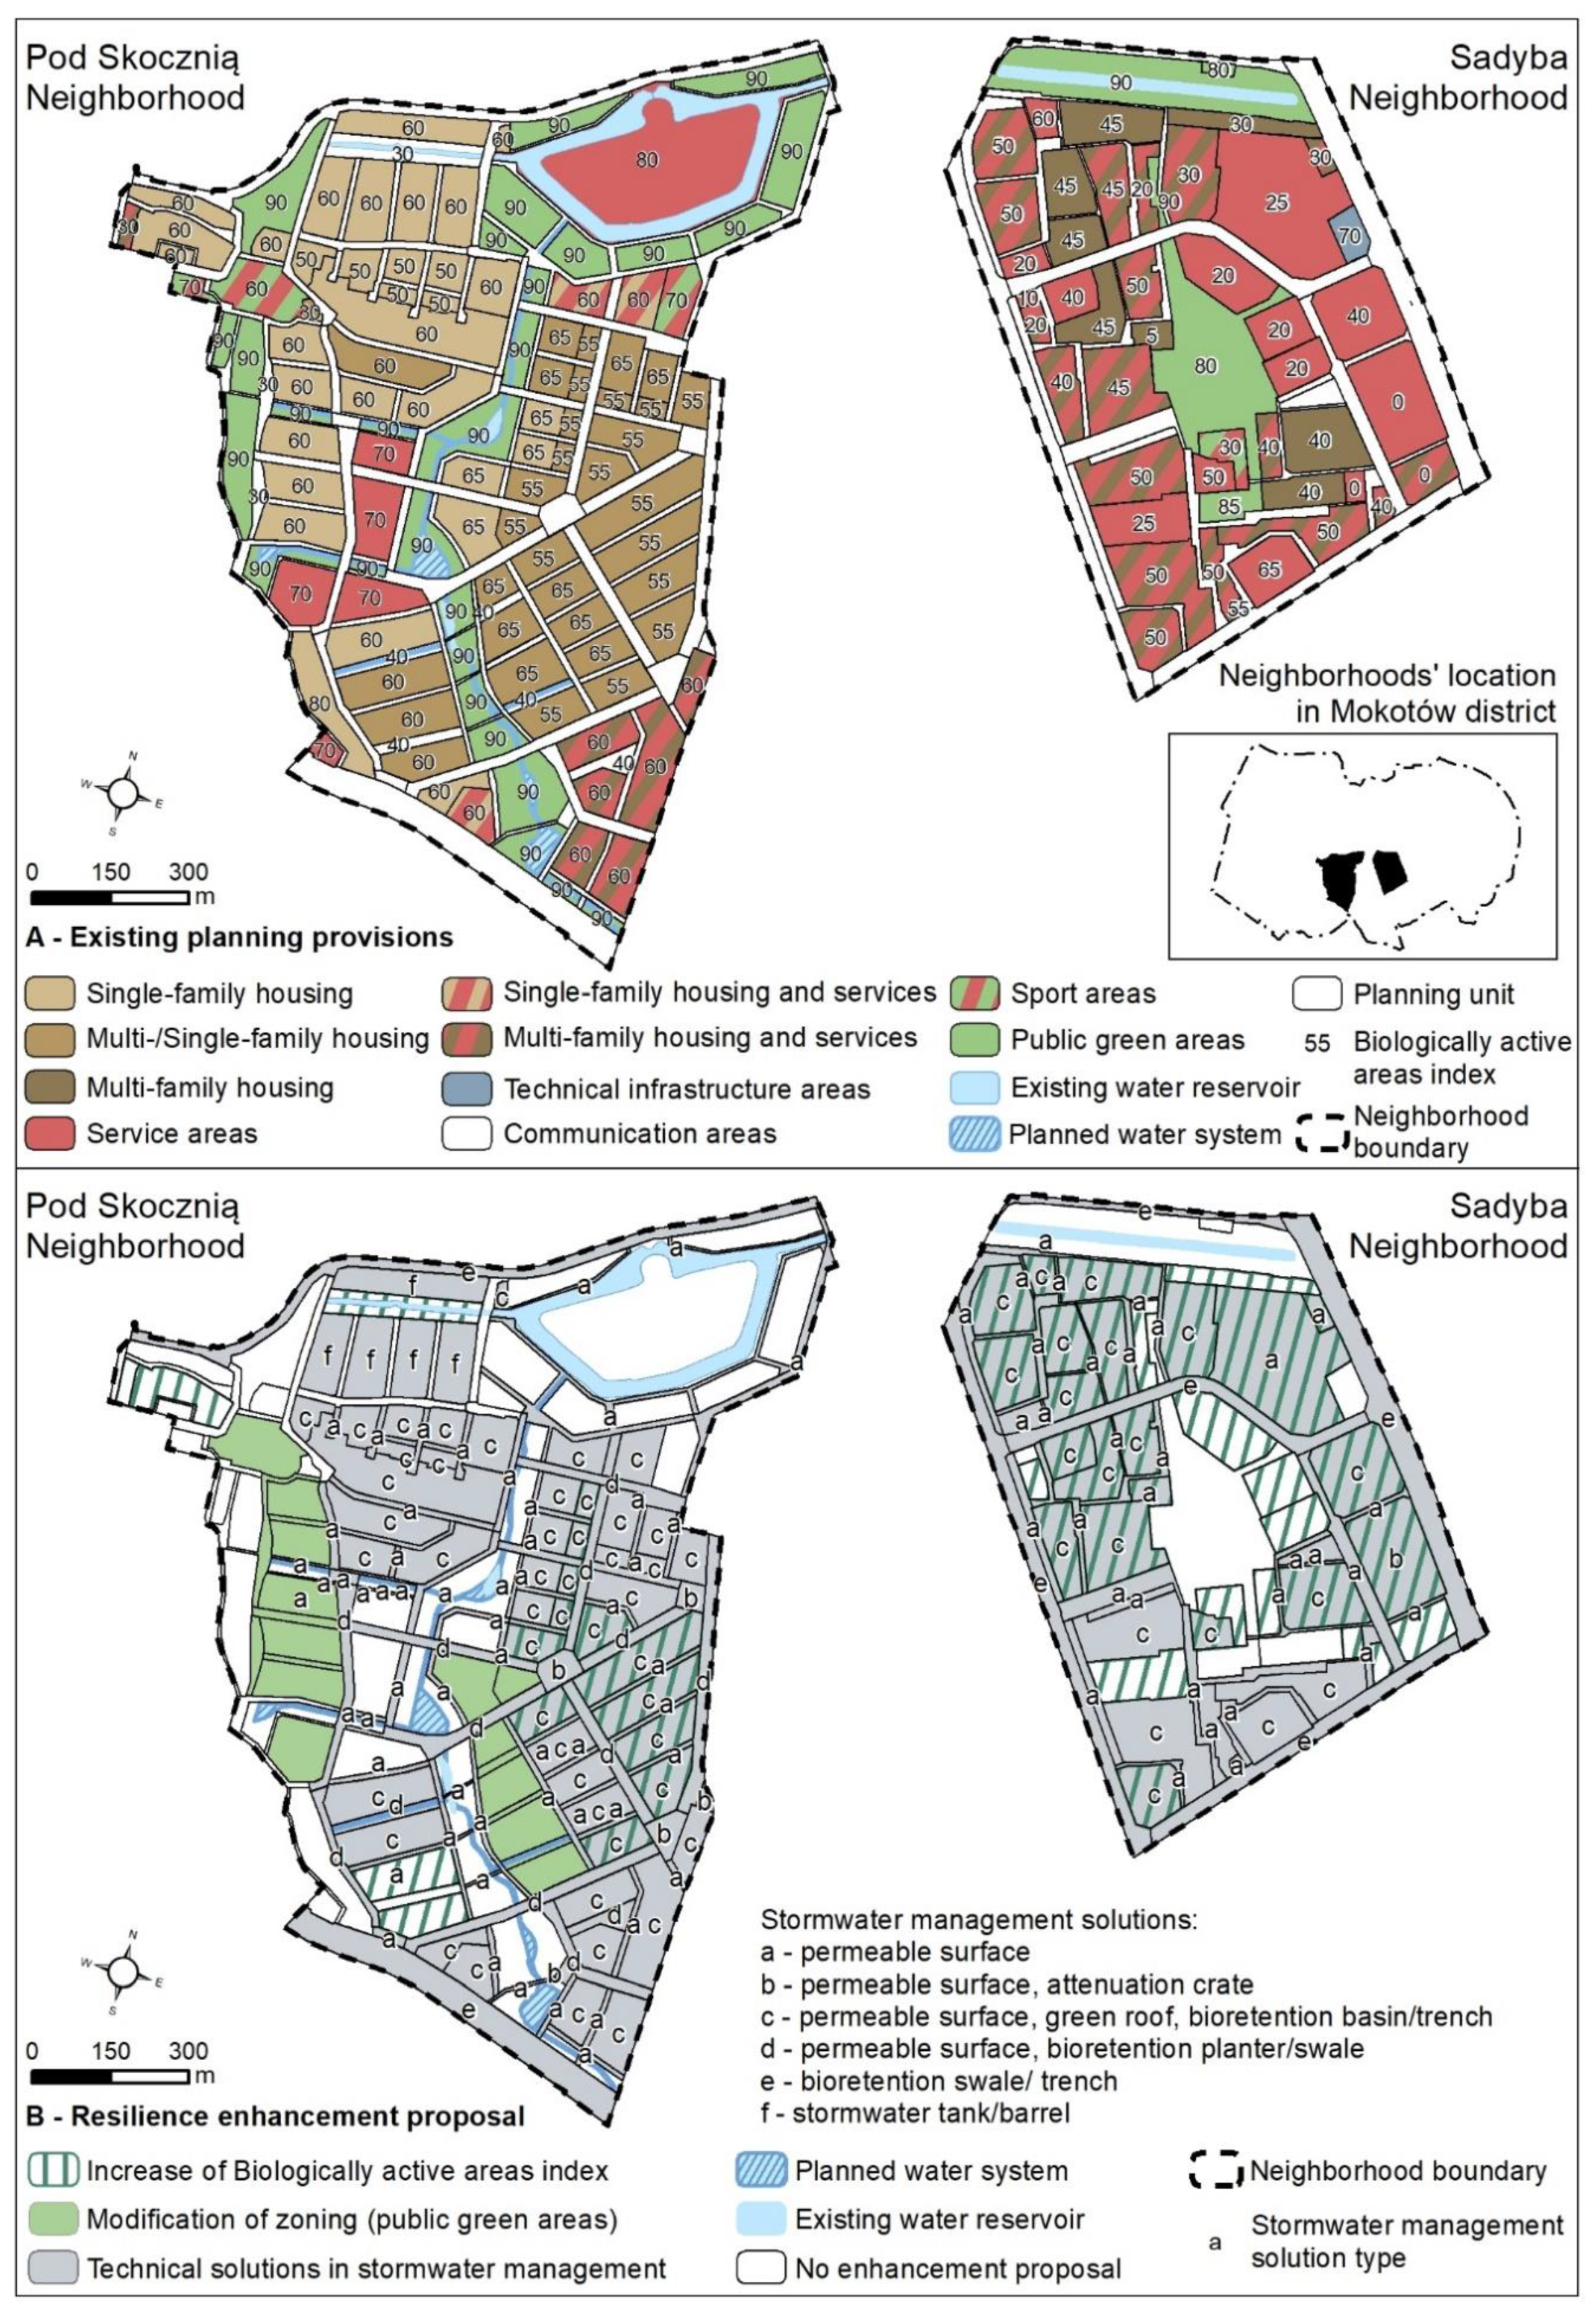
According to existing planning provisions [75,76], the biggest changes will concern the Pod Skocznią, where, as a result of the development of residential and service buildings, the green area will be significantly reduced and it will take the form of a linear park with a water system consisting of retention ponds and water canals. In Sadyba, the plan allows for more dense housing and the development of service functions within existing housing units.
4.2. Neighborhood Resilience in Question
Case studies are located on the upper terrace of the Vistula valley. For both analyzed neighborhoods, we diagnosed hydrological threats, such as flooding caused by an overloaded sewage system during heavy rainfall. Moreover, there is a risk of inundation in Sadyba related to levees breaking in the Vistula valley and groundwater ponding in Pod Skocznią. Thermal threats mainly concern Sadyba due to its location away from the ventilation corridor, land cover albedo, and urban structures that impede air exchange. Whereas in Pod Skocznią, there are no thermal hazards because of the location in the ventilation corridor and the large share of biologically active areas. According to the Warsaw Environmental Atlas [73] the function of the ventilation corridor is to be maintained.
The analysis of natural performance showed that both neighborhoods have high natural adaptive potential, which can be used to minimize thermal and hydrological hazards. In Pod Skocznią, the adaptive potential is aided by mostly flat relief, water table less than 2 m below ground level, predominantly good soil permeability, good quality soil with water retention capacity (peat), and high proportion of biologically active area. Moreover, the existence of a hydrographic system and location within the ventilation corridor can be considered beneficial. Similarly, the natural adaptive potential of Sadyba comprises flat relief, high proportion of green areas with tree dominance, water table less than 2 m below ground level, and very good soil permeability.
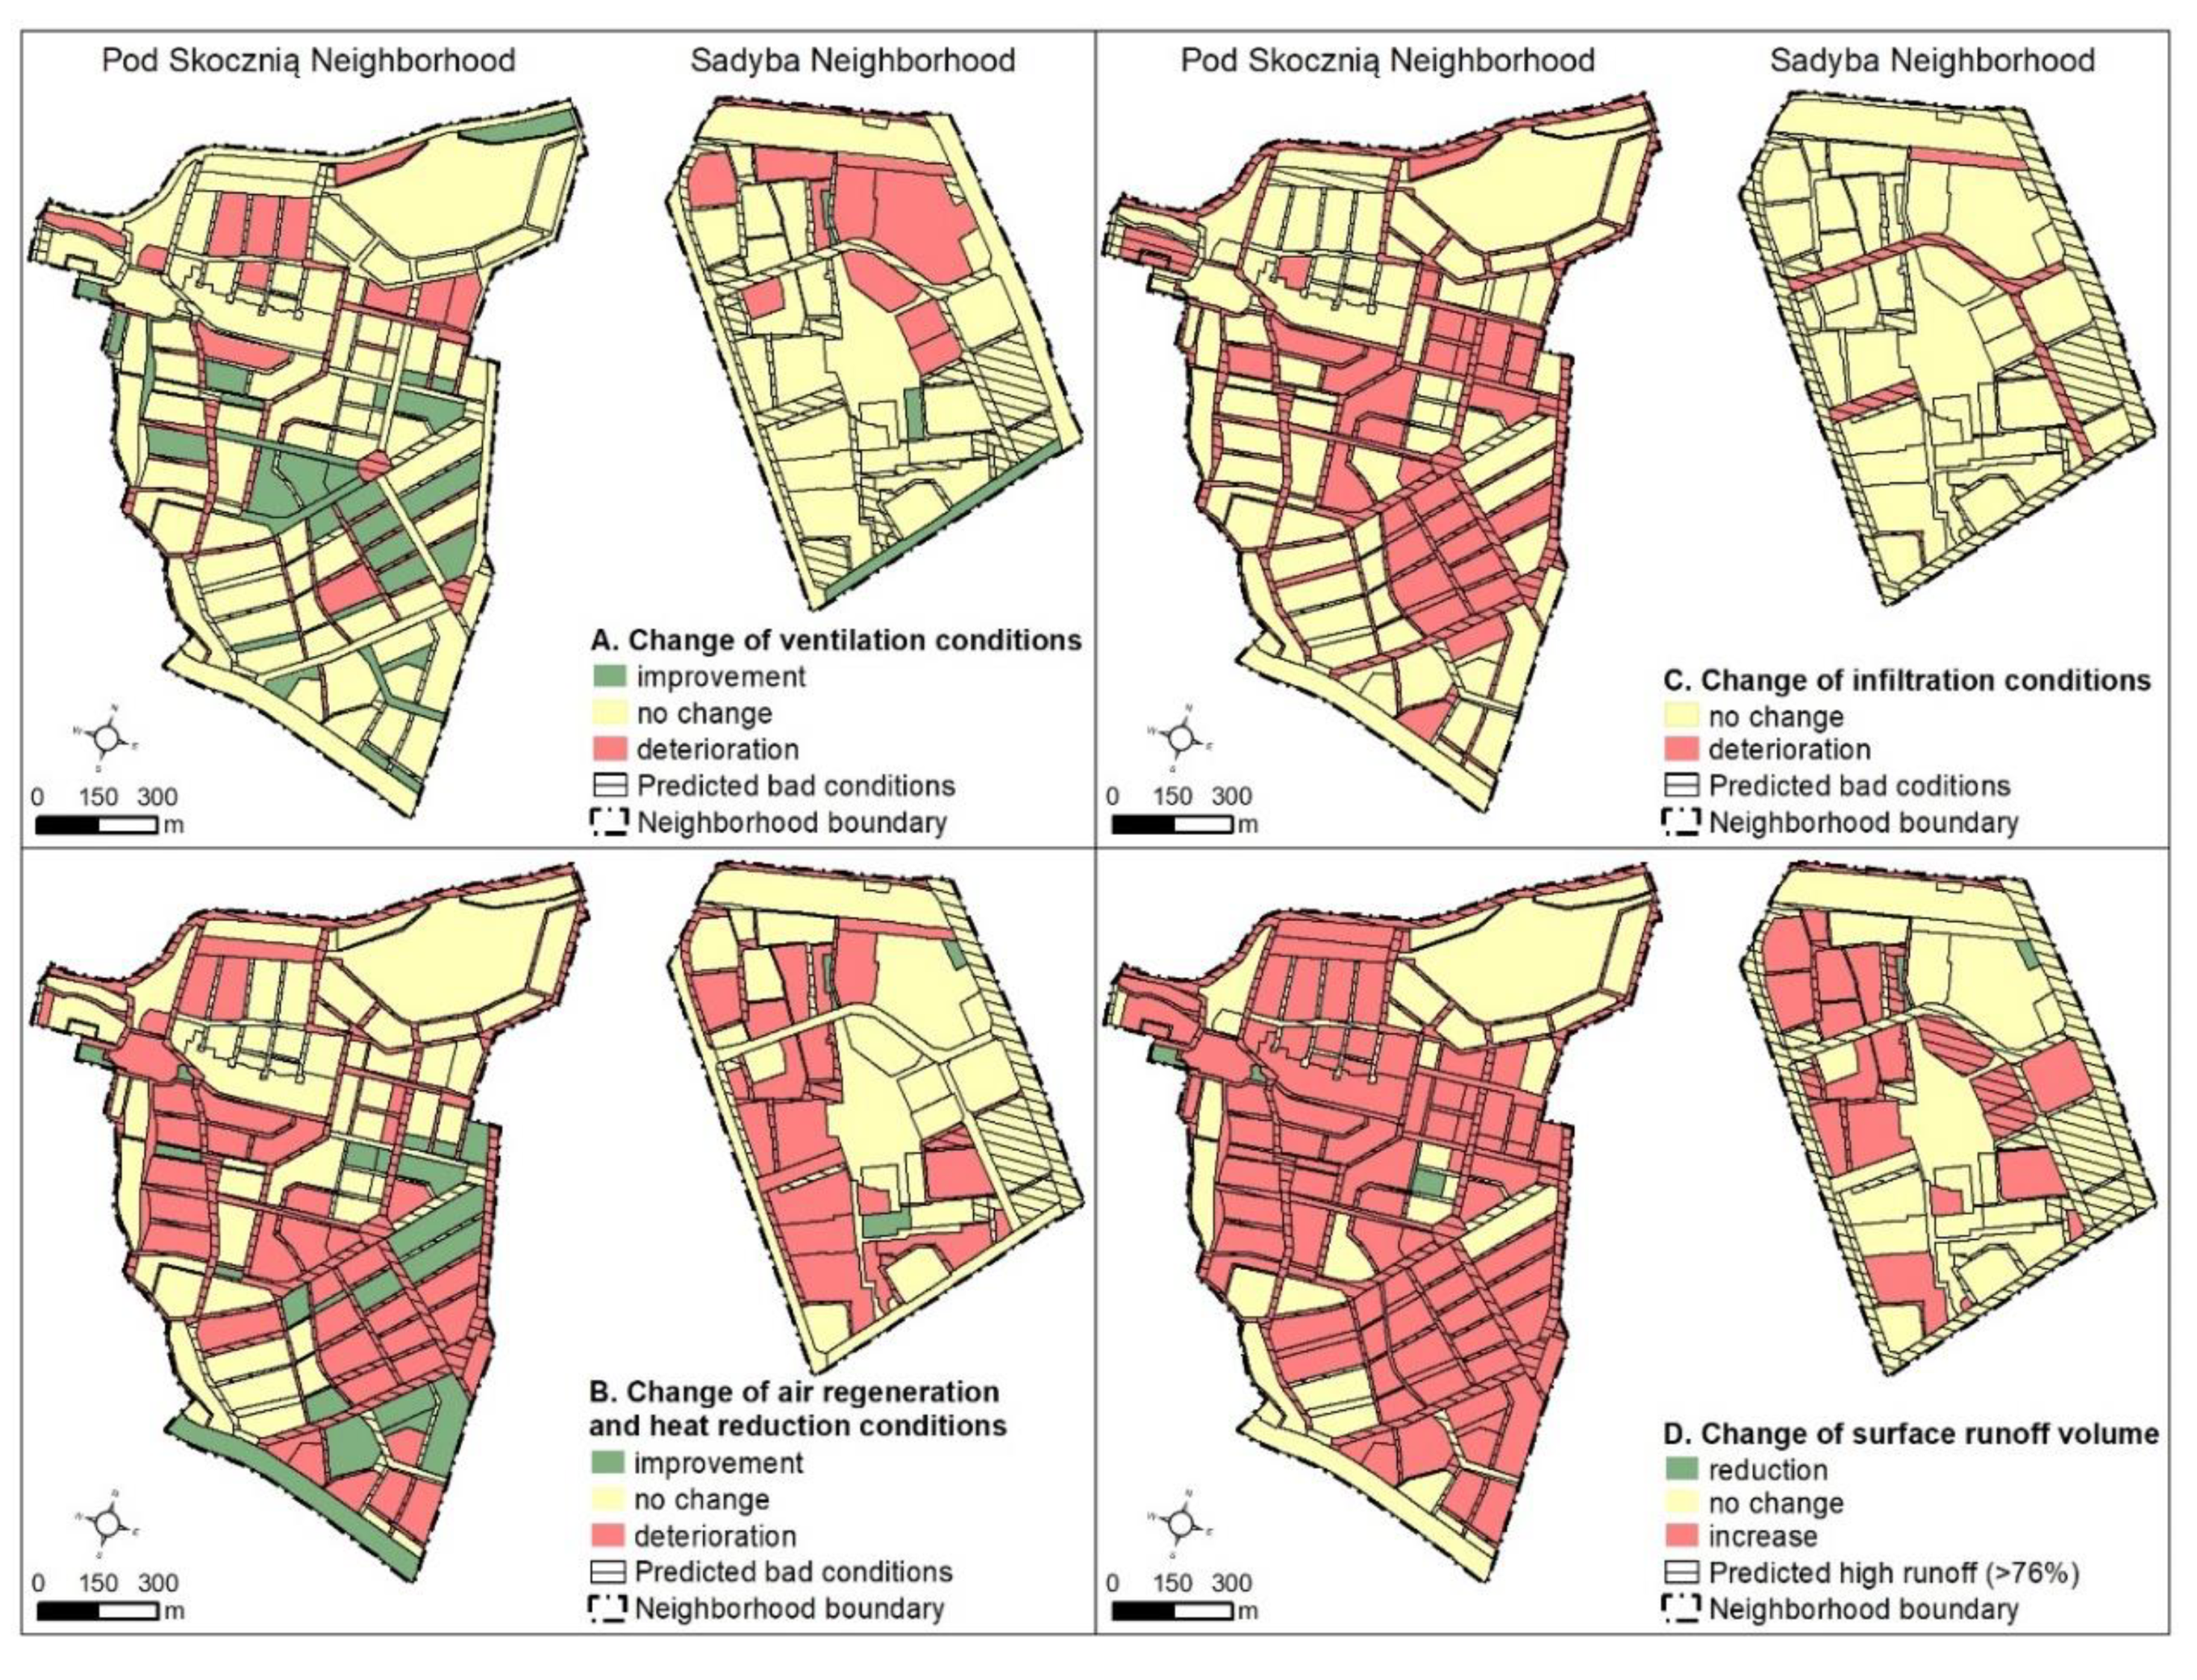
As the natural performance analysis indicated, climatic and hydrological disorders occur in Sadyba but not in the undeveloped area of Pod Skocznią (Figure 2). However, in the case of implementation of planning provisions, the deterioration of the natural performance in terms of climatic and hydrological functioning had been predicted for both areas. Furthermore, the usage of natural adaptive potential of the study areas and technical adaptation solutions in the planning provisions [75,76] had been relatively low and not compulsory.
The possibilities of implementing adaptation tools varied between the newly designed housing estate and the modernized one. While in Sadyba, the possibility to engage its natural adaptive potential had been limited; in Pod Skocznią it had been neglected. In Sadyba, a large proportion of impervious surfaces implied constrained infiltration capacity. In Pod Skocznią, the existing planning provisions allow for development in areas with organic soils (peats) that are crucial for water retention in the context of adaptation to climate change.
Some adaptation tools identified in Table 1 were introduced in the neighborhoods. These tools included biologically active area index, maximum building height, urban structure, and selected technical solutions (green roofs, permeable pavements) for which optional recommendations were made. Moreover, sustainable rainwater management has been introduced as a rule in Pod Skocznią, while it remains only a recommendation for new investments in Sadyba.
4.3. Building Resilient Neighborhoods
The implementation of the procedure on the strategic level requires identifying focal areas for adaptive interventions and their spatial distribution. In order to properly locate adaptation actions, the ranking of priority among districts was developed. The method presented in the paper differs from the one in The Warsaw Adaptation Plan [68] (strategy of adaptation to climate change), which identifies priority areas based on data related only to threats resulting from climate change. Our approach, however, also considers demographic vulnerability; its importance was pointed out by Meerow and Newell [8], Shokry et al. [9], and Błażejczyk et al. [69] and the potential to implement green infrastructure [70,71]. Consequently, there was a need to integrate strategic information from different municipal documents [68,71]. The results obtained from both rankings slightly differ, having taken into account the additional criteria allowed for more holistic assessment of districts in terms of their needs and their potential to adapt. Considering evaluation of green infrastructure makes it possible to assign higher priority to districts which lack areas for creating new greenery to sufficiently compensate the climatic risk. With a lesser effect, the social vulnerability index also influenced the position of some districts in the ranking, exposing those inhabited by an older population.
The Warsaw Adaptation Plan [68] recommends that adaptation to climate change should be considered during urban planning, particularly in local spatial development plans. Although plans are potentially powerful instruments for building adaptive capacity at the local level, available planning tools in the Polish legal context are deficient. Moreover, it is also a matter of the designer’s skills [14] as well as investor and local authorities’ awareness [11,27].
In the literature, there are some guidelines and recommendations on how to design with respect to climatic and hydrological processes, but they are dispersed [13], as evidenced by extensive literature (Table 1). The key for selecting the literature for this paper was the effectiveness of the planning and design tools in shaping climatic and hydrological conditions proved by empirical studies. Defined tools like land cover height, vegetation vertical structure and size, biologically active area index, surface runoff volume, and building structure (expressed by local climate zones [37]) impacting terrain roughness were used to design the criteria for the multicriteria analysis. Due to the fact that there are many interdependent tools to build resilience of neighborhoods and that it is desirable to use them simultaneously to obtain the expected effect, the multicriteria analysis method was the best to take into account these interdependencies [72].
The multicriteria analysis described in this paper aims to fill the gap of implementing solutions for building urban resilience which exists at the planning and design level. Moreover, it helps to visualize the possible consequences of planning decisions. The results of the analysis were aggregated on the planning unit level which allowed the assessment of the potential impact of specific planning provisions on climatic and hydrological processes in the unit. Conducting such an evaluation enhances the planning process by introducing the issue of adaptation to climate change.
Nevertheless, in the analysis, some limitations occur connected with the availability of data. The choice of criteria depended on the possibility of estimating the value of indicators in the selected analysis scale (planning level). Furthermore, the scope and accuracy of spatial development plans which comprise zoning, a set of urban indicators, and building lines for planning units do not allow the extraction of detailed information about future urban composition and planned vertical structure of vegetation. This required making assumptions about those properties of the site that will shape the climatic and hydrological conditions in the future. Consequently, the method has the potential to be further extended. Introducing the floor area ratio to differentiate the impact of various development scenarios (for example, a scenario with maximal building coverage ratio or maximal building height) may allow the selection of an optimal combination of built-up and biologically active areas on the site in compliance with the planning provisions.
Our analysis of spatial development plans shows that constructing adaptive capacity of the neighborhoods was not the priority. The implementation of planning provisions negatively affects the conditions of hydrological and climatic functioning. In case of the Pod Skocznią neighborhood, where permeable land cover prevailed, the possibility for infiltration will decrease because of an increase in soil sealing. In addition, both housing estates may experience an increase in surface runoff as a result of fragmentation of green areas and change in the vertical structure of vegetation, which shape the amount of runoff, as demonstrated by Kim and Park [46] and Deutscher et al. [42]. Moreover, failure to maintain the existing tall trees in the housing estates will result in worse conditions for air regeneration, because, as shown by Zölch et al. [40] and Hertel and Schlink [41], areas covered by trees have a higher cooling effect than grass surfaces. Therefore, an update of existing planning provisions in the focal areas is suggested.
For Sadyba and Pod Skocznią, we recommend correction of existing spatial development plans oriented towards the utilization of natural adaptation potential (Figure 3B). In reference to environmental approach recommendations [1,21,22,23,24,25,26,28], it comprises modifying zoning, increasing the index of the biologically active area, and adjusting technical solutions to the natural conditions. The modification of zoning refers to the units where identified natural potential was ignored and to the units located within the climatic corridor. To sustain its function in the city’s natural system, the protection of a 200-m wide strip of open land in the Warsaw Escarpment areas has been proposed. Zoning as green areas has been suggested for all these units [27]. The increase of the index of the biologically active area was motivated by the need to maintain good climatic and hydrological performance in Sadyba and Pod Skocznią [33]. Technical solutions aimed at stormwater management have been suggested in order to reduce runoff. Research-supported guidelines include the application of permeable pavements and combinations of infiltration and bioretention devices [57,58,60].
5. Summary and Conclusions
Redefining cities to build resilience to climate threats in urban neighborhoods should be carefully conducted from the strategic to the local level. While the strategic and technical tools are well developed, the planning and design phase needs to be more considered. The relationship between the strategic and planning levels ought to be strongly established.
Polish law related to spatial planning addresses climate adaptation indirectly, providing some deficient tools to implement adaptation actions. The planning provisions aimed to build resilience to climate threats are rather facultative than obligatory. Analyzed case studies have shown that, despite available instruments, local spatial development plans in Sadyba and Pod Skocznią were not formulated to build neighborhood resilience to climate change.
The adaptation of urban areas to climate change by spatial planning and urban design should prioritize the engagement of natural adaptive potential and the adjustment of adopted solutions to natural conditions. If this is not possible, or if the potential has been limited because of existing or planned development, compensation measures should be implemented (i.e., nature-based solutions, see Table 1—technical solutions). However, we argue that, among a set of adaptation tools provided in this paper, the most important one for building neighborhood resilience is properly conducted urban design.
The procedure proposed in this paper could be a useful, simple method within the planning process to build neighborhoods’ resilience to climate threats. It is applicable both when planning new investments and when evaluating the natural performance of existing neighborhoods to enhance their resilience. The method utilizes the indicators from literature like land cover height, vegetation vertical structure and size, biologically active area index, building structure, and surface runoff volume. Still, it has the potential to be further developed considering the local context and tools available. The procedure consists of the following steps:
- Strategic level
- (a)
- Identification of needs in response to climatic threats, social vulnerability, and possibilities of implementing adaptation solutions based on ecosystem services. At this stage, rankings of assessment could be helpful, as shown in the paper.
- (b)
- Selection of the most vulnerable areas, which have limited potential to benefit from ecosystem services engagement and are threatened by rapid urbanization.
- (c)
- Planning and design level
- Diagnosis of the existing state of the neighborhood including local ecological sensitivity (in terms of existing climatic threats and disturbances in natural performance), natural adaptive potential, and natural functioning (climatic and hydrological). It should be performed in environmental studies for spatial development plans.
- (a)
- Evaluation of the impact of planning provisions on natural performance (climatic and hydrological functioning) using planning tools embedded in the multicriteria analysis presented in this paper.
- (b)
- Implementing adaptation solutions with reference to diagnosed needs and possibilities. Available planning and design tools comprise zoning, urban development indicators, urban morphology, and technical solutions.
The application of this procedure in the Sadyba and Pod Skocznią neighborhoods in Warsaw has shown various possibilities of using natural adaptation potential and tools. In Sadyba, the natural adaptation potential has already been limited by development, so the possibilities of its incorporation were smaller compared to Pod Skocznią. This implies the need for compensation measures, including nature-based solutions. However, implementation of these usually requires undertaking renewal actions while adjusting to environmental and technical conditions of existing buildings. In Pod Skocznią, the range of possibilities was much broader, as the mostly undeveloped area allowed incorporation of natural ecosystems, processes, and features to build a resilient neighborhood. Unfortunately for both neighborhoods, local spatial development plans ignored or neglected natural adaptation potential and only a few solutions to increase the neighborhoods’ resilience to climate threats were used. This poor planning will trigger the deterioration of the neighborhoods’ natural performance; therefore, enhancement of existing planning provisions is highly recommended.
Author Contributions
Conceptualization, K.R.; methodology, K.R. and M.P.; formal analysis, M.P.; investigation, K.R. and M.P.; writing—original draft preparation, K.R. and M.P.; writing—review and editing, K.R. and M.P.; visualization, M.P. All authors have read and agreed to the published version of the manuscript.
Funding
The research was carried out as part of the cooperation of the City of Warsaw and the science sector. “The APC was funded by WARSAW UNIVERSITY OF TECHNOLOGY”.
Acknowledgments
We would like to thank Warsaw City Hall for providing access to data related to Warsaw Green Infrastructure.
Conflicts of Interest
The authors declare no conflict of interest. The funders had no role in the design of the study; in the collection, analyses, or interpretation of data; in the writing of the manuscript, or in the decision to publish the results.
References
- Pickett, S.T.; Cadenasso, M.L.; McGrath, B. Resilience in Ecology and Urban Design: Linking Theory and Practice for Sustainable Cities; Springer: Berlin/Heidelberg, Germany, 2013; Volume 3. [Google Scholar]
- Bai, X.; Dawson, R.J.; Ürge-Vorsatz, D.; Delgado, G.C.; Barau, A.S.; Dhakal, S.; Dodman, D.; Leonardsen, L.; Masson-Delmotte, V.; Roberts, D.C. Six research priorities for cities and climate change. Nature 2018, 555, 23–25. [Google Scholar] [CrossRef] [PubMed]
- Biesbroek, G.R.; Swart, R.J.; Van der Knaap, W.G. The mitigation–adaptation dichotomy and the role of spatial planning. Habitat Int. 2009, 33, 230–237. [Google Scholar] [CrossRef]
- Meerow, S.; Newell, J.P.; Stults, M. Defining urban resilience: A review. Landsc. Urban Plan. 2016, 147, 38–49. [Google Scholar] [CrossRef]
- Masnavi, M.R.; Gharai, F.; Hajibandeh, M. Exploring urban resilience thinking for its application in urban planning: A review of literature. Int. J. Environ. Sci. Technol. 2019, 16, 567–582. [Google Scholar] [CrossRef]
- Meadows, D.H.; Wright, D. Thinking in Systems: A Primer; Chelsea Green Pub: White River Junction, VT, USA, 2008; 218p. [Google Scholar]
- Jabareen, Y. Planning the resilient city: Concepts and strategies for coping with climate change and environmental risk. Cities 2013, 31, 220–229. [Google Scholar] [CrossRef]
- Meerow, S.; Newell, J.P. Spatial planning for multifunctional green infrastructure: Growing resilience in Detroit. Landsc. Urban Plan. 2017, 159, 62–75. [Google Scholar] [CrossRef]
- Shokry, G.; Connolly, J.J.T.; Anguelovski, I. Understanding climate gentrification and shifting landscapes of protection and vulnerability in green resilient Philadelphia. Urban Clim. 2020, 31, 100539. [Google Scholar] [CrossRef]
- Aguiar, F.C.; Bentz, J.; Silva, J.M.N.; Fonseca, A.L.; Swart, R.; Santos, F.D.; Penha-Lopes, G. Adaptation to climate change at local level in Europe: An overview. Environ. Sci. Policy 2018, 86, 38–63. [Google Scholar] [CrossRef]
- Kim, H.; Tran, T. An evaluation of local comprehensive plans toward sustainable green infrastructure in US. Sustainability 2018, 10, 4143. [Google Scholar] [CrossRef] [Green Version]
- Kabisch, N.; Korn, H.; Stadler, J.; Bonn, A. (Eds.) Nature-Based Solutions to Climate Change Adaptation in Urban Areas; Springer International Publishing: Cham, Switzerland, 2017; p. 337. [Google Scholar]
- Bartesaghi Koc, C.; Osmond, P.; Peters, A. Evaluating the cooling effects of green infrastructure: A systematic review of methods, indicators and data sources. Sol. Energy 2018, 166, 486–508. [Google Scholar] [CrossRef]
- Eliasson, I. The use of climate knowledge in urban planning. Landsc. Urban Plan. 2000, 48, 31–44. [Google Scholar] [CrossRef]
- Polish National Strategy for Adaptation to Climate Change (NAS 2020). 2013. Available online: https://klimada.mos.gov.pl/wp-content/uploads/2014/12/ENG_SPA2020_final.pdf (accessed on 5 July 2020).
- Commission of the European Communities. White Paper Adapting to Climate Change: Towards a European Framework for Action; COM (2009) 147 final; European Commission: Brussels, Belgium, 2009. [Google Scholar]
- COMMUNICATION FROM THE COMMISSION TO THE EUROPEAN PARLIAMENT, THE COUNCIL, THE EUROPEAN ECONOMIC AND SOCIAL COMMITTEE AND THE COMMITTEE OF THE REGIONS An EU Strategy on Adaptation to Climate Change; (COM(2013) 216); European Commission: Brussels, Belgium, 2013.
- MPA 44. Available online: http://www.44mpa.pl/?lang=en (accessed on 5 July 2020).
- ADAPTCITY. Available online: http://www.adaptcity.pl/english/about/ (accessed on 5 July 2020).
- Climcities. Available online: http://www.climcities.ios.gov.pl/about-the-project (accessed on 5 July 2020).
- McHarg, I.L. Design with Nature; American Museum of Natural History: New York, NY, USA, 1969. [Google Scholar]
- Spirn, A.W. The Granite Garden: Urban Nature and Human Design; Basic Books: New York, NY, USA, 1984; 334p. [Google Scholar]
- Steiner, F. Commentary: Healing the earth: The relevance of Ian McHarg’s work for the future. Philos. Geogr. 2004, 7, 141–149. [Google Scholar] [CrossRef]
- Ahern, J. Urban landscape sustainability and resilience: The promise and challenges of integrating ecology with urban planning and design. Landsc. Ecol. 2013, 28, 1203–1212. [Google Scholar] [CrossRef]
- McHarg, I.L. An ecological method for landscape architecture. In The Ecological Design and Planning Reader; Ndubisi, F.O., Ed.; Island Press: Washington, DC, USA, 2014; pp. 341–347. [Google Scholar]
- Spirn, A.W. Ecological urbanism: A framework for the design of resilient cities (2014). In The Ecological Design and Planning Reader; Ndubisi, F.O., Ed.; Island Press: Washington, DC, USA, 2014; pp. 557–571. [Google Scholar]
- Yang, B.; Li, S. Design with Nature: Ian McHarg’s ecological wisdom as actionable and practical knowledge. Landsc. Urban Plan. 2016, 155, 21–32. [Google Scholar] [CrossRef]
- Steiner, F.R. The Living Landscape: An Ecological Approach to Landscape Planning; Island Press: Washington, DC, USA, 2012. [Google Scholar]
- Hough, M. Cities and Natural Process; Routledge, Taylor & Francis e-Library: Oxford, UK, 2004. [Google Scholar]
- McHarg, I.L.; Steiner, F.R. To Heal the Earth: Selected Writings of Ian L. McHarg; Island Press: Washington, DC, USA, 1998. [Google Scholar]
- European Commission. Building a Green Infrastructure for Europe; Publication Office of the European Union: Luxembourg, 2013; p. 23. [Google Scholar]
- Scott, M.; Lennon, M.; Haase, D.; Kazmierczak, A.; Clabby, G.; Beatley, T. Nature-based solutions for the contemporary city/Re-naturing the city/Reflections on urban landscapes, ecosystems services and nature-based solutions in cities/Multifunctional green infrastructure and climate change adaptation: Brownfield greening as an adaptation strategy for vulnerable communities?/Delivering green infrastructure through planning: Insights from practice in Fingal, Ireland/Planning for biophilic cities: From theory to practice. Plan. Theory Pract. 2016, 17, 267–300. [Google Scholar]
- Szulczewska, B.; Giedych, R.; Borowski, J.; Kuchcik, M.; Sikorski, P.; Mazurkiewicz, A.; Stańczyk, T. How much green is needed for a vital neighbourhood? In search for empirical evidence. Land Use Policy 2014, 38, 330–345. [Google Scholar] [CrossRef]
- Gill, S.E.; Handley, J.F.; Ennos, A.R.; Pauleit, S. Adapting cities for climate change: The role of the green infrastructure. Built Environ. 2007, 33, 115–133. [Google Scholar] [CrossRef] [Green Version]
- Ellis, J.B. Sustainable surface water management and green infrastructure in UK urban catchment planning. J. Environ. Plan. Manag. 2013, 56, 24–41. [Google Scholar] [CrossRef]
- Meng, M.; Dąbrowski, M.; Chan, F.K.S.; Stead, D. Chapter 19—Spatial planning for climate adaptation and flood risk: Development of the sponge city program in Guangzhou. In Smart, Resilient and Transition Cities; Galderisi, A., Colucci, A., Eds.; Elsevier: Amsterdam, The Netherlands, 2018; pp. 153–162. [Google Scholar]
- Stewart, I.D.; Oke, T.R. Local climate zones for urban temperature studies. Bull. Am. Meteorol. Soc. 2012, 93, 1879–1900. [Google Scholar] [CrossRef]
- Krautheim, M.; Pasel, R.; Pfeiffer, S.; Schultz-Grandberg, J. City and Wind: Climate as An Architectural Instrument; DOM Publishers: Berlin, Germany, 2014. [Google Scholar]
- Middel, A.; Häb, K.; Brazel, A.J.; Martin, C.A.; Guhathakurta, S. Impact of urban form and design on mid-afternoon microclimate in Phoenix Local Climate Zones. Landsc. Urban Plan. 2014, 122, 16–28. [Google Scholar] [CrossRef]
- Zölch, T.; Maderspacher, J.; Wamsler, C.; Pauleit, S. Using green infrastructure for urban climate-proofing: An evaluation of heat mitigation measures at the micro-scale. Urban For. Urban Green. 2016, 20, 305–316. [Google Scholar] [CrossRef]
- Hertel, D.; Schlink, U. Decomposition of urban temperatures for targeted climate change adaptation. Environ. Model. Softw. 2019, 113, 20–28. [Google Scholar] [CrossRef]
- Deutscher, J.; Kupec, P.; Kučera, A.; Urban, J.; Ledesma, J.L.J.; Futter, M. Ecohydrological consequences of tree removal in an urban park evaluated using open data, free software and a minimalist measuring campaign. Sci. Total Environ. 2019, 655, 1495–1504. [Google Scholar] [CrossRef] [PubMed]
- Asgarian, A.; Amiri, B.J.; Sakieh, Y. Assessing the effect of green cover spatial patterns on urban land surface temperature using landscape metrics approach. Urban Ecosyst. 2015, 18, 209–222. [Google Scholar] [CrossRef]
- Doick, K.J.; Peace, A.; Hutchings, T.R. The role of one large greenspace in mitigating London’s nocturnal urban heat island. Sci. Total Environ. 2014, 493, 662–671. [Google Scholar] [CrossRef] [PubMed]
- Morini, E.; Touchaei, A.G.; Rossi, F.; Cotana, F.; Akbari, H. Evaluation of albedo enhancement to mitigate impacts of urban heat island in Rome (Italy) using WRF meteorological model. Urban Clim. 2018, 24, 551–566. [Google Scholar] [CrossRef]
- Kim, H.W.; Park, Y. Urban green infrastructure and local flooding: The impact of landscape patterns on peak runoff in four Texas MSAs. Appl. Geogr. 2016, 77, 72–81. [Google Scholar] [CrossRef]
- Alexandri, E.; Jones, P. Temperature decreases in an urban canyon due to green walls and green roofs in diverse climates. Build. Environ. 2008, 43, 480–493. [Google Scholar] [CrossRef]
- Zhang, J.; Li, Y.; Tao, W.; Liu, J.; Levinson, R.; Mohegh, A.; Ban-Weiss, G. Investigating the Urban Air Quality Effects of Cool Walls and Cool Roofs in Southern California. Environ. Sci. Technol. 2019, 53, 7532–7542. [Google Scholar] [CrossRef] [Green Version]
- Taleghani, M.; Crank, P.J.; Mohegh, A.; Sailor, D.J.; Ban-Weiss, G.A. The impact of heat mitigation strategies on the energy balance of a neighborhood in Los Angeles. Solar Energy 2019, 177, 604–611. [Google Scholar] [CrossRef]
- Berardi, U. The outdoor microclimate benefits and energy saving resulting from green roofs retrofits. Energy Build. 2016, 121, 217–229. [Google Scholar] [CrossRef]
- Song, U.; Kim, E.; Bang, J.H.; Son, D.J.; Waldman, B.; Lee, E.J. Wetlands are an effective green roof system. Build. Environ. 2013, 66, 141–147. [Google Scholar] [CrossRef]
- Pęczkowski, G.; Kowalczyk, T.; Szawernoga, K.; Orzepowski, W.; Żmuda, R.; Pokładek, R. Hydrological performance and runoff water quality of experimental green roofs. Water 2018, 10, 1185. [Google Scholar] [CrossRef] [Green Version]
- Wang, X.; Tian, Y.; Zhao, X. The influence of dual-substrate-layer extensive green roofs on rainwater runoff quantity and quality. Sci. Total Environ. 2017, 592, 465–476. [Google Scholar] [CrossRef] [PubMed]
- Zhang, Q.; Miao, L.; Wang, X.; Liu, D.; Zhu, L.; Zhou, B.; Sun, J.; Liu, J. The capacity of greening roof to reduce stormwater runoff and pollution. Landsc. Urban Plan. 2015, 144, 142–150. [Google Scholar] [CrossRef]
- Lau, J.T.; Mah, D.Y.S. Green Wall for Retention of Stormwater. Pertanika J. Sci. Technol. 2018, 26, 283–298. [Google Scholar]
- Tiwary, A.; Godsmark, K.; Smethurst, J. Field evaluation of precipitation interception potential of green façades. Ecol. Eng. 2018, 122, 69–75. [Google Scholar] [CrossRef]
- Ahiablame, L.; Shakya, R. Modeling flood reduction effects of low impact development at a watershed scale. J. Environ. Manag. 2016, 171, 81–91. [Google Scholar] [CrossRef]
- Liao, Z.L.; He, Y.; Huang, F.; Wang, S.; Li, H.Z. Analysis on LID for highly urbanized areas’ waterlogging control: Demonstrated on the example of Caohejing in Shanghai. Water Sci. Technol. 2013, 68, 2559–2567. [Google Scholar] [CrossRef]
- Hua, P.; Yang, W.; Qi, X.; Jiang, S.; Xie, J.; Gu, X.; Li, H.; Zhang, J.; Krebs, P. Evaluating the effect of urban flooding reduction strategies in response to design rainfall and low impact development. J. Clean. Prod. 2020, 242, 118515. [Google Scholar] [CrossRef]
- Haghighatafshar, S.; Nordlöf, B.; Roldin, M.; Gustafsson, L.-G.; la Cour Jansen, J.; Jönsson, K. Efficiency of blue-green stormwater retrofits for flood mitigation—Conclusions drawn from a case study in Malmö, Sweden. J. Environ. Manag. 2018, 207, 60–69. [Google Scholar] [CrossRef] [PubMed]
- Pereira Souza, F.; Leite Costa, M.E.; Koide, S. Hydrological modelling and evaluation of detention ponds to improve urban drainage system and water quality. Water 2019, 11, 1547. [Google Scholar] [CrossRef] [Green Version]
- Baird, J.; Hunt, I.; Winston, R. Evaluating the Hydrologic and Water Quality Performance of Infiltrating Wet Retention Ponds. In Proceedings of the World Environmental and Water Resources Congress, Portland, OH, USA, 1–5 June 2014; pp. 145–154. [Google Scholar]
- Chrétien, F.; Gagnon, P.; Thériault, G.; Guillou, M. Performance analysis of a wet-retention pond in a small agricultural catchment. J. Environ. Eng. 2016, 142, 04016005. [Google Scholar] [CrossRef]
- Sun, R.; Chen, A.; Chen, L.; Lü, Y. Cooling effects of wetlands in an urban region: The case of Beijing. Ecol. Indic. 2012, 20, 57–64. [Google Scholar] [CrossRef]
- Thomas, G.; Zachariah, E. Urban heat island in a tropical city interlaced by wetlands. J. Environ. Sci. Eng. 2011, 5, 234–240. [Google Scholar]
- Rizzo, A.; Bresciani, R.; Masi, F.; Boano, F.; Revelli, R.; Ridolfi, L. Flood reduction as an ecosystem service of constructed wetlands for combined sewer overflow. J. Hydrol. 2018, 560, 150–159. [Google Scholar] [CrossRef]
- Britter, R.; Hanna, S. Flow and dispersion in urban areas. Annu. Rev. Fluid Mech. 2003, 35, 469–496. [Google Scholar] [CrossRef]
- Uchwała Rady Miasta Stołecznego Warszawy NR XV/339/2019 z dnia 4 lipca 2019 r. w sprawie przyjęcia Strategii adaptacji do zmian klimatu dla m.st. Warszawy do roku 2030 z perspektywą do roku 2050. Miejski Plan Adaptacji”, stanowiącej politykę m.st. Warszawy w zakresie podejmowania działań zapobiegających i łagodzących negatywne skutki zmian klimatu; Rada m.st. Warszawy: Warszawa, Poland, 2019.
- Błażejczyk, K.; Kuchcik, M.; Milewski, P.; Dudek, W.; Kręcisz, B.; Błażejczyk, A.; Szmyd, J.; Degórska, B.; Pałczyński, C. Miejska Wyspa Ciepła w Warszawie: Uwarunkowania Klimatyczne i Urbanistyczne; Wydawnictwo Akademickie Sedno: Warszawa, Poland, 2014; p. 171. [Google Scholar]
- Szulczewska, B.; Giedych, R.; Maksymiuk, G. Can we face the challenge: How to implement a theoretical concept of green infrastructure into planning practice? Warsaw case study. Landsc. Res. 2017, 42, 176–194. [Google Scholar] [CrossRef]
- Szulczewska, B.; Adamczyk-Jabłońska, J.; Cieszewska, A.; Giedych, R.; Janus, A.; Maksymiuk, G.; Pirowski, A.; Szumański, M.; Szumilas, H.; Wałdykowski, P.; et al. Potencjał do Kształtowania Zielonej Infrastruktury w Warszawie—Raport; Miasto Stołeczne Warszawa, Biuro Architektury i Planowania Przestrzennego: Warszawa, Poland, 2016; p. 144. [Google Scholar]
- Langhans, S.D.; Reichert, P.; Schuwirth, N. The method matters: A guide for indicator aggregation in ecological assessments. Ecol. Indic. 2014, 45, 494–507. [Google Scholar] [CrossRef] [Green Version]
- Fogel, P.; Szulczewska, B.; Kiczyńska, A.; Fic, M.; Lewiński, S. Atlas ekofizjograficzny Miasta st. Warszawy. Miasto Stołeczne Warszawa; Biuro Architektury i Planowania Przestrzennego: Warszawa, Poland, 2018. [Google Scholar]
- Kuchcik, M. The attempt to validate the applicability of two climate models for the evaluation of heat wave related mortality in Warsaw in the 21st century. Geogr. Pol. 2013, 86, 295–311. [Google Scholar] [CrossRef] [Green Version]
- Uchwała Rady Miasta Stołecznego Warszawy NR LXVIII/1817/2013 z dnia 17 października 2013 r. w sprawie miejscowego planu zagospodarowania przestrzennego obszaru Sadyby Północnej—część pierwsza. Dz. Urz. Woj. Mazowieckiego z dnia 26.11.2013 poz. 12259; Rada m.st. Warszawy: Warszawa, Poland, 2013.
- Uchwała Rady Miasta Stołecznego Warszawy NR XLII/1299/2008 z dnia 23 października 2008 r. w sprawie uchwalenia miejscowego planu zagospodarowania przestrzennego rejonu pod Skocznią—część I. Dz. Urz. Woj. Mazowieckiego nr 210 z dnia 5.12.2008 poz. 8300; Rada m.st. Warszawy: Warszawa, Poland, 2008.
Figure 1.
Adaptation priority of Warsaw’s districts.

Figure 2.
Changes in hydrological and climatic performance in neighborhoods: (A) Change of ventilation conditions, (B) Change of air regeneration and heat reduction conditions, (C) Change of infiltration conditions, (D) Change of surface runoff volume.
Figure 2.
Changes in hydrological and climatic performance in neighborhoods: (A) Change of ventilation conditions, (B) Change of air regeneration and heat reduction conditions, (C) Change of infiltration conditions, (D) Change of surface runoff volume.

Figure 3.
(A) Existing planning provisions in case studies, (B) Resilience enhancement proposal.


Table 1.
Tools to build resilience at the planning and design level and its impact on climate threats.
Table 1.
Tools to build resilience at the planning and design level and its impact on climate threats.
| Adaptation Actions | Threat | References | ||
|---|---|---|---|---|
| Thermal | Hydrological | Thermal | Hydrological | |
| Planning tools | ||||
| 1. Urban development indicators | ||||
| Biologically active area index | + | + | Szulczewska et al. [33], Gill et al. [34] | Szulczewska et al. [33], Gill et al. [34], Ellis [35] |
| Surface runoff indicator | - | + | - | Gill et al. [34], Meng et al. [36] |
| Maximum building height | + | - | Stewart and Oke [37], Krautheim et al. [38] | - |
| 2. Urban structure (morphology) | ||||
| Building structure and layout | + | - | Stewart and Oke [37]; Krautheim et al. [38], Middel et al. [39] | - |
| Vegetation structure | + | + | Zölch et al. [40], Hertel and Schlink [41] | Deutscher et al. [42] |
| Green areas layout and size | + | + | Stewart and Oke [37], Asgarian et al. [43], Doick et al. [44], Morini et al. [45] | Kim and Park [46] |
| Design tools | ||||
| 3. Technical solutions | ||||
| Cool roofs or facades | + | - | Alexandri and Jones [47], Zhang et al. [48] | - |
| Cool pavements | + | - | Taleghani et al. [49] | - |
| Green roofs green-blue roofs | + | + | Zölch et al. [40], Alexandri and Jones [47], Berardi [50] | Gill et al. [34], Song et al. [51], Pęczkowski et al. [52], Wang et al. [53], Zhang et al. [54]. |
| Green facades | + | +/- | Zölch et al. [40], Alexandri and Jones [47] | Lau and Mah [55], Tiwary et al. [56] |
| Permeable surfaces | +/- | + | Hertel and Schlink [41] | Ahiablame and Shakya [57], Liao et al. [58] |
| Infiltration basins and trenches, bioretention basins and trenches, swales | - | + | - | Ahiablame and Shakya [57], Liao et al. [58], Hua et al. [59], Haghighatafshar et al. [60] |
| Detention ponds | - | + | - | Haghighatafshar et al. [60], Pereira Souza et al. [61] |
| Retention ponds | + | + | Stewart and Oke [37] | Baird et al. [62], Chrétien et al. [63] |
| Wetlands, constructed wetlands | + | + | Sun et al. [64], Thomas and Zachariah [65] | Rizzo et al. [66] |
| Rainwater barrels, tanks | - | + | - | Ahiablame and Shakya [57], Liao et al. [58], Hua et al. [59] |
Table 2.
Methodology for natural performance analysis of climatic and hydrological functioning of Warsaw neighborhoods.
Table 2.
Methodology for natural performance analysis of climatic and hydrological functioning of Warsaw neighborhoods.
| Analysis Type | Factor | Ranking Criteria | Class | Factor Weight | ||||
|---|---|---|---|---|---|---|---|---|
| I | II | III | IV | V | ||||
| Ventilation conditions | Land cover | Height (min ► max) | less than 4 m | 4–8 m | 8–13 m | above 13 m | 0.45 | |
| Local climate zones | Building structure (lowest ► highest roughness) | absence | open midrise, open low-rise | compact low-rise, compact midrise | open high-rise | compact high-rise | 0.20 | |
| Vegetation cover | Area (max ► min) | over 10,000 sq. m | 1000–10,000 sq. m, | less than 1000 sq. m, | 0.30 | |||
| Ventilation corridor | Access | presence | absence | 0.05 | ||||
| Air regeneration and cooling conditions | Vegetation | Vertical structure (high ► low) | high | mixed | low | seasonal low | surface water | 0.50 |
| Biologically active area index | Share (%) (max ► min) | over 60% | 46–60% | 25–45% | less than 25% | 0.50 | ||
| Infiltration conditions | Soil | Permeability (highest ► lowest) | coarse sands, medium sands | fine sands, loess | silty sands, loamy sands, silts | loams, sandy clay | clay, clay loam | 0.4 |
| Water table | Height (high ► low) | 0–2 m | under 2 m | 0.25 | ||||
| Land cover | Infiltration capacity (high ► low) | low, seasonal low vegetation | mixed vegetation | uncovered soils | high vegetation | surface water, impervious surfaces | 0.35 | |
| Surface runoff indicator | Land cover | Runoff volume (max ► min) | black roofs, asphalt and concrete roads | permeable pavement, gravel, or dirt paths | vegetation | uncovered soils | surface water | 1.00 |
Table 3.
Adaptation priority rating of Warsaw’s districts.
| District | Climatic Threat | RATE OF CLIMATIC THREAT (A) | RATE OF DEMOGRAPHIC VULNERABILITY (B) | Potential of Green Infrastructure (GI) | RATE OF GI POTENTIAL (C) | FINAL RATING (A+B+C) | Priority of Taking Adaptation Actions | |||||||||||||||||
|---|---|---|---|---|---|---|---|---|---|---|---|---|---|---|---|---|---|---|---|---|---|---|---|---|
| Flood | Local Flooding | Urban Heat Island | Hot Nights | Impervious Surface | Urban Density | Built-up Areas | Projected Development | Green Areas Share | Total Climatic Threat | GI Area | GI Area per Inhabitant | Recreational GI Area | Recreational GI per Inhabitant | Housing with Recreational GI within 500 m | Housing with Recreational GI above 500 m | Density of Planned Bike Lanes fin Housing Areas | Potential Areas for GI | Total Potential | ||||||
| PRAGA PD. | −4 | −4 | −1 | −4 | −4 | −5 | −5 | −3 | 3 | −27 | −5 | −4 | 3 | 1 | 3 | 2 | 5 | 4 | 3 | 1 | 22 | 2 | −7 | very high |
| WOLA | 0 | −4 | −5 | −5 | −4 | −5 | −5 | −5 | 5 | −28 | −5 | −4 | 2 | 1 | 3 | 2 | 4 | 4 | 4 | 1 | 21 | 2 | −7 | very high |
| MOKOTÓW | −2 | −3 | −1 | −4 | −4 | −5 | −4 | −5 | 3 | −25 | −4 | −5 | 3 | 2 | 4 | 3 | 4 | 2 | 3 | 3 | 24 | 3 | −6 | very high |
| ŻOLIBORZ | −1 | −4 | −5 | −4 | −4 | −5 | −5 | −2 | 4 | −26 | −5 | −5 | 3 | 2 | 4 | 3 | 5 | 5 | 4 | 1 | 27 | 4 | −6 | very high |
| OCHOTA | 0 | −4 | −3 | −5 | −4 | −5 | −5 | −2 | 4 | −24 | −4 | −4 | 2 | 1 | 5 | 3 | 5 | 5 | 3 | 1 | 25 | 3 | −5 | high |
| PRAGA PN. | −3 | −4 | −5 | −3 | −4 | −5 | −5 | −3 | 3 | −29 | −5 | −3 | 4 | 2 | 2 | 1 | 3 | 5 | 5 | 1 | 23 | 3 | −5 | high |
| ŚRÓDMIEŚCIE | −1 | −4 | −5 | −5 | −4 | −5 | −5 | −2 | 4 | −27 | −5 | −5 | 4 | 2 | 5 | 3 | 4 | 5 | 5 | 1 | 29 | 5 | −5 | high |
| URSUS | 0 | −4 | 0 | −3 | −4 | −5 | −4 | −3 | 2 | −21 | −3 | −3 | 1 | 1 | 2 | 1 | 5 | 2 | 3 | 2 | 17 | 1 | −5 | high |
| BEMOWO | 0 | −2 | −1 | −3 | −3 | −5 | −4 | −4 | 4 | −18 | −3 | −4 | 4 | 3 | 5 | 4 | 3 | 2 | 3 | 2 | 26 | 4 | −3 | moderate |
| TARGÓWEK | 0 | −3 | 0 | −3 | −3 | −5 | −3 | −4 | 4 | −17 | −2 | −4 | 3 | 2 | 5 | 4 | 4 | 3 | 2 | 2 | 25 | 3 | −3 | moderate |
| BIAŁOŁĘKA | −3 | −2 | −1 | −2 | −2 | −3 | −2 | −5 | 3 | −17 | −2 | −1 | 3 | 3 | 1 | 2 | 1 | 1 | 2 | 5 | 18 | 1 | −2 | moderate |
| BIELANY | −1 | −2 | −1 | −3 | −3 | −5 | −3 | −4 | 5 | −17 | −2 | −5 | 5 | 3 | 4 | 4 | 3 | 5 | 3 | 2 | 29 | 5 | −2 | moderate |
| WAWER | −2 | −3 | 0 | −2 | −2 | −3 | −2 | −3 | 5 | −12 | −1 | −3 | 5 | 5 | 1 | 2 | 1 | 3 | 2 | 3 | 22 | 2 | −2 | moderate |
| WILANÓW | −4 | −2 | 0 | −3 | −2 | −3 | −2 | −4 | 2 | −18 | −3 | −2 | 3 | 4 | 2 | 4 | 1 | 3 | 3 | 5 | 25 | 3 | −2 | moderate |
| URSYNÓW | 0 | −5 | −1 | −3 | −3 | −3 | −3 | −4 | 5 | −17 | −2 | −3 | 3 | 3 | 5 | 5 | 3 | 1 | 2 | 4 | 26 | 4 | −1 | low |
| WESOŁA | 0 | −2 | 0 | −2 | −2 | −3 | −2 | −2 | 5 | −8 | −1 | −2 | 5 | 5 | 1 | 1 | 1 | 5 | 1 | 1 | 20 | 2 | −1 | low |
| WŁOCHY | 0 | −2 | −1 | −4 | −3 | −5 | −4 | −2 | 2 | −19 | −3 | −3 | 4 | 4 | 3 | 5 | 3 | 3 | 4 | 3 | 29 | 5 | −1 | low |
| REMBERTÓW | 0 | −2 | 0 | −2 | −2 | −5 | −3 | −2 | 5 | −11 | −1 | −2 | 5 | 5 | 1 | 2 | 2 | 5 | 3 | 2 | 25 | 3 | 0 | low |
© 2020 by the authors. Licensee MDPI, Basel, Switzerland. This article is an open access article distributed under the terms and conditions of the Creative Commons Attribution (CC BY) license (http://creativecommons.org/licenses/by/4.0/).
Share and Cite
MDPI and ACS Style
Rędzińska, K.; Piotrkowska, M. Urban Planning and Design for Building Neighborhood Resilience to Climate Change. Land 2020, 9, 387. https://0-doi-org.brum.beds.ac.uk/10.3390/land9100387
AMA Style
Rędzińska K, Piotrkowska M. Urban Planning and Design for Building Neighborhood Resilience to Climate Change. Land. 2020; 9(10):387. https://0-doi-org.brum.beds.ac.uk/10.3390/land9100387
Chicago/Turabian StyleRędzińska, Katarzyna, and Monika Piotrkowska. 2020. "Urban Planning and Design for Building Neighborhood Resilience to Climate Change" Land 9, no. 10: 387. https://0-doi-org.brum.beds.ac.uk/10.3390/land9100387
Note that from the first issue of 2016, this journal uses article numbers instead of page numbers. See further details here.