Review

Serum and Plasma Tumor Necrosis Factor Alpha Levels in Individuals with Obstructive Sleep Apnea Syndrome: A Meta-Analysis and Meta-Regression

by
Mohammad Moslem Imani
1,
Masoud Sadeghi
2,
Habibolah Khazaie
3,
Mehrdad Emami
4,
Dena Sadeghi Bahmani
3,5,6,7 and
Serge Brand
3,5,6,8,9,*
1
Department of Orthodontics, Kermanshah University of Medical Sciences, 6713954658 Kermanshah, Iran
2
Medical Biology Research Center, Kermanshah University of Medical Sciences, 6714415185 Kermanshah, Iran
3
Sleep Disorders Research Center, Kermanshah University of Medical Sciences, 6719851115 Kermanshah, Iran
4
Students Research Committee, Kermanshah University of Medical Sciences, 6715847141 Kermanshah, Iran
5
Center for Affective, Stress and Sleep Disorders, University of Basel, Psychiatric Clinics, 4001 Basel, Switzerland
6
Substance Abuse Prevention Research Center, Kermanshah University of Medical Sciences, 6715847141 Kermanshah, Iran
7
Departments of Physical Therapy, University of Alabama at Birmingham, Birmingham, AL 35209, USA
8
Department of Sport, Exercise and Health, Division of Sport Science and Psychosocial Health, University of Basel, 4052 Basel, Switzerland
9
School of Medicine, Tehran University of Medical Sciences, 1416753955 Tehran, Iran
*
Author to whom correspondence should be addressed.
Submission received: 22 April 2020 / Revised: 2 June 2020 / Accepted: 9 June 2020 / Published: 12 June 2020

Abstract

:
Background: Obstructive sleep apnea syndrome (OSAS) is associated with a variety of inflammatory factors. Specifically, proinflammatory cytokines appear to be associated with the pathogenesis of OSAS. Methods: For the present meta-analysis and meta-regression on serum and plasma tumor necrosis factor alpha (TNF-α) levels in individuals with and without OSAS, we performed a systematic search without any restrictions of the PubMed/Medline, Scopus, Cochrane Library, and Web of Science databases to find relevant articles published up to 1 February 2020. Results: Fifty-five (adults: 29 studies on serum and 17 studies on plasma; children: 4 studies on serum and 5 studies on plasma) were included and analyzed. Always compared to age-matched healthy controls, the pooled MDs were as follows: adults, serum: 10.22 pg/mL (95% CI = 8.86, 11.58; p < 0.00001); adults, plasma: 5.90 pg/mL (95% CI = 4.00, 7.80; p < 0.00001); children, serum: 0.21 pg/mL (95% CI = 0.05, 0.37; p = 0.01); children, plasma: 5.90 pg/mL (95% CI = 4.00, 7.80; p < 0.00001). Conclusions: Compared to healthy and age-matched controls, adult individuals with OSAS had significantly higher serum/plasma TNF-α levels. For children with OSAS, significantly higher levels were observed for TNF-α in serum but not in plasma.

1. Introduction

Obstructive sleep apnea syndrome (OSAS) is a common sleep-related breathing disorder. It is estimated that 4% of both female and male adults suffer from OSAS [1]. Specifically, about 2% middle-aged individuals (30–60 years) suffer from OSAS, and prevalence rates increased by 30% to 50% in adults with overweight and obesity [2,3]. Typically, in individuals with OSAS, the repetitive obstruction of the upper airway during sleep leads to hypoxemia, arousals, intermittent snoring, episodes of complete apnea, and to increased daytime sleepiness as a result of non-restoring sleep [4]. To define OSAS, both objective and subjective measurements are applied: While self-rating questionnaires such as the STOP-Bang [5,6] allow a rough screening, polysomnography is the gold standard: OSAS are defined as the Apnea–Hypopnea Index (AHI) > 5 events per hour [7].
People with objectively assessed OSAS are at increased risk to suffer from atherogenesis [8], vascular dysfunction [9], congestive heart failure, hypertension, atrial fibrillation, nocturnal arrhythmias, stroke, pulmonary hypertension, and metabolic syndrome [10,11].
As regards the immune system, the tumor necrosis factor alpha (TNF-α) is a common cytokine secreted by adipocytes and the mononuclear-macrophage system [12], which regulates the immune system, induces inflammation, and participates in the regulation of fat metabolism [13]. More specifically, several inflammatory cells secrete proinflammatory cytokines such as TNF-α. Increased TNF-α concentrations can cause inflammatory responses such as neutrophil recruitment, tissue destruction, neovascularization [14], oxidative stress, systemic inflammation, autonomic nervous system dysfunction, atherosclerosis, and aging [15]. Further, highly increased TNF-α concentrations appear to be causally associated with the pathogenesis of diseases such as metabolic diseases, cardiovascular diseases, and OSAS [16]. Further, higher TNF-α concentrations were observed in individuals with OSAS, compared to healthy controls. In 2013, Nadeem et al. [17] showed in their meta-analysis of 15 case-control studies that compared to controls, individuals with OSAS had significantly higher TNF-α concentrations. Similarly, in 2015, Wang et al. [18] also reported in their meta-analysis that compared to healthy controls, individuals with OSAS had significantly higher serum TNF-α concentrations. With the present meta-analysis, we expand upon the previous two meta-analyses in that we focused on (a) both on serum and on plasma TNF-α, (b) on samples with adults and children with OSAS, and in that (c) we performed a meta-regression, and (d) we ran sub-group analyses.

2. Materials and Methods

The meta-analysis was performed in accordance with the Preferred Reporting Items for Systematic Reviews and Meta-Analyses (PRISMA) guidelines [19].

2.1. Search Strategy

One of the authors (M. Sadeghi) systematically searched four databases, namely PubMed/Medline, Scopus, Cochrane Library, and Web of Science, for articles published in English up to 1 February 2020, with no restrictions, and with the following expressions: “sleep apnea” or “OSA” or “obstructive sleep apnea” or “obstructive sleep apnea syndrome” or “OSAS“, with “TNF-alpha” or “TNF-α” or “TNF” or “tumor necrosis factor alpha”; and with “blood” or “plasma” or “serum”. We also manually inspected the reference lists of the articles (original and review articles) for publications related to our topic.

2.2. Eligibility Criteria

Inclusion criteria were as follows: (1) studies evaluating the association between plasma or serum TNF-α levels and OSAS with case-control design without age (≥18 years as adults and <18 years as children), sex or BMI restrictions; (2) OSAS was defined as AHI > 5 events/h diagnosed by polysomnography; (3) participants with OSAS and controls had no other systematic diseases such as diabetes, asthma, neurological disorders such as multiple sclerosis, neurodegenerative disorders such as Alzheimer’s disease, or oral diseases; (4) studies reporting pretreatment morning serum and/or plasma levels of TNF-α (around 6:00–10:00 a.m.); (5) studies reporting sufficient data to compute the MD and 95% confidence interval (CI) in participants with OSAS and controls; (6) studies with more than 10 cases included as individuals with OSAS and controls.
Exclusion criteria were: (1) studies with irrelevant or insufficient data or without clinical data; (2) Letter to the editors, review articles, conference papers, meeting abstracts, and book chapters; (3) studies without a control group; (4) studies reporting controls with AHI > 5 events/h; (5) studies with overlapped data with other studies; (6) studies without reporting cut-off AHI values for OSAS; (7) studies mixing pediatric and adult participants.

2.3. Study Selection

Two authors (M.M.I. and M.E.) read independently the titles and abstracts of the retrieved studies. They then selected the relevant studies, while another author (M.S.) retrieved the full-texts of the articles and excluded several full-texts based on the exclusion criteria mentioned above. If two studies had overlapped data, we selected the study with the most recent publication year.

2.4. Data Extraction

Two authors (S.B. and M.S.) independently extracted the data from each study included in the meta-analysis. If there was a disagreement between the two authors, the third author (M.M.I.) helped to find a final decision. The data extracted for the meta-analysis included basic information including the first author, publication year, country of study, ethnicity of subjects in each study, age, BMI, and AHI of both groups, and mean and standard deviation (SD) of TNF-α levels in plasma and serum. Since some studies considered patients with mild OSAS (AHI: 1–5 events/h) as a control group condition, and since we had to use this protocol for other studies, reporting the quality of studies as for usual case-control studies did not seem to be reasonable.

2.5. Quality Assessment

One author (M.S) evaluated the quality of the studies included in the meta-analysis using the Newcastle-Ottawa Scale (NOS) with a total score of nine for each study [20].

2.6. Statistical Analyses

The data were analyzed by one author. Review Manager 5.3 software (RevMan 5.3, (RevMan 5.3, The Cochrane Collaboration, Oxford, UK) was used to calculate the crude MD and 95% CI, which evaluated the significance of the pooled MD by Z-test. Heterogeneity across the studies was evaluated using both Cochran Q [21] and I2 metrics with scores ranging from 0% to 100% [22]. In addition, when p-value < 0.1 and I2 > 50% showed a statistically significant heterogeneity, the analysis was performed by the random-effect model to evaluate the pooled ORs and CI values. Otherwise, we used the fixed-effect model. The weight (%) represents the effect of an individual study on the pooled results obtained. In general, the larger the sample size and the narrower CI are, the higher is the percentage of weight.
The results of the Begg’s and Egger’s tests were analyzed by the Comprehensive Meta-Analysis version 2.0 software (CMA 2.0). The Begg’s funnel plot shows the standard error (SE) of the log (MD), and the precision of each study is plotted against its log (MD) [23]. In addition, the Egger’s test shows the linear regression between the precision of the studies and the standardized effect [24].
Subgroup analyses were performed based on ethnicity, AHI, BMI, and number of participants. The sensitivity analyses, namely the “cumulative analysis” and “one study removed”, were applied to estimate the consistency/stability of the results. If the p-value (two-tailed) was less than 0.05, then there was a statistically significant difference. The meta-regression is a quantitative method used in meta-analyses to estimate the impact of moderator variables on study effect size. The trim-and-fill method was used to estimate potentially missing studies due to publication bias in the funnel plot and adjusting the overall effect estimate [25].
Some studies reported the values of TNF-α in standard errors (SE); SEs were transformed into standard deviation (SD) (SE = SD/√N; N = number of individuals). Some studies reported median and interquartile values, which were transformed into mean and SD [26]. The serum and plasma TNF-α levels were reported in picograms per milliliter (pg/mL). Participants with BMI >30 kg/m2 were considered obese [27].

3. Results

3.1. Search Strategies
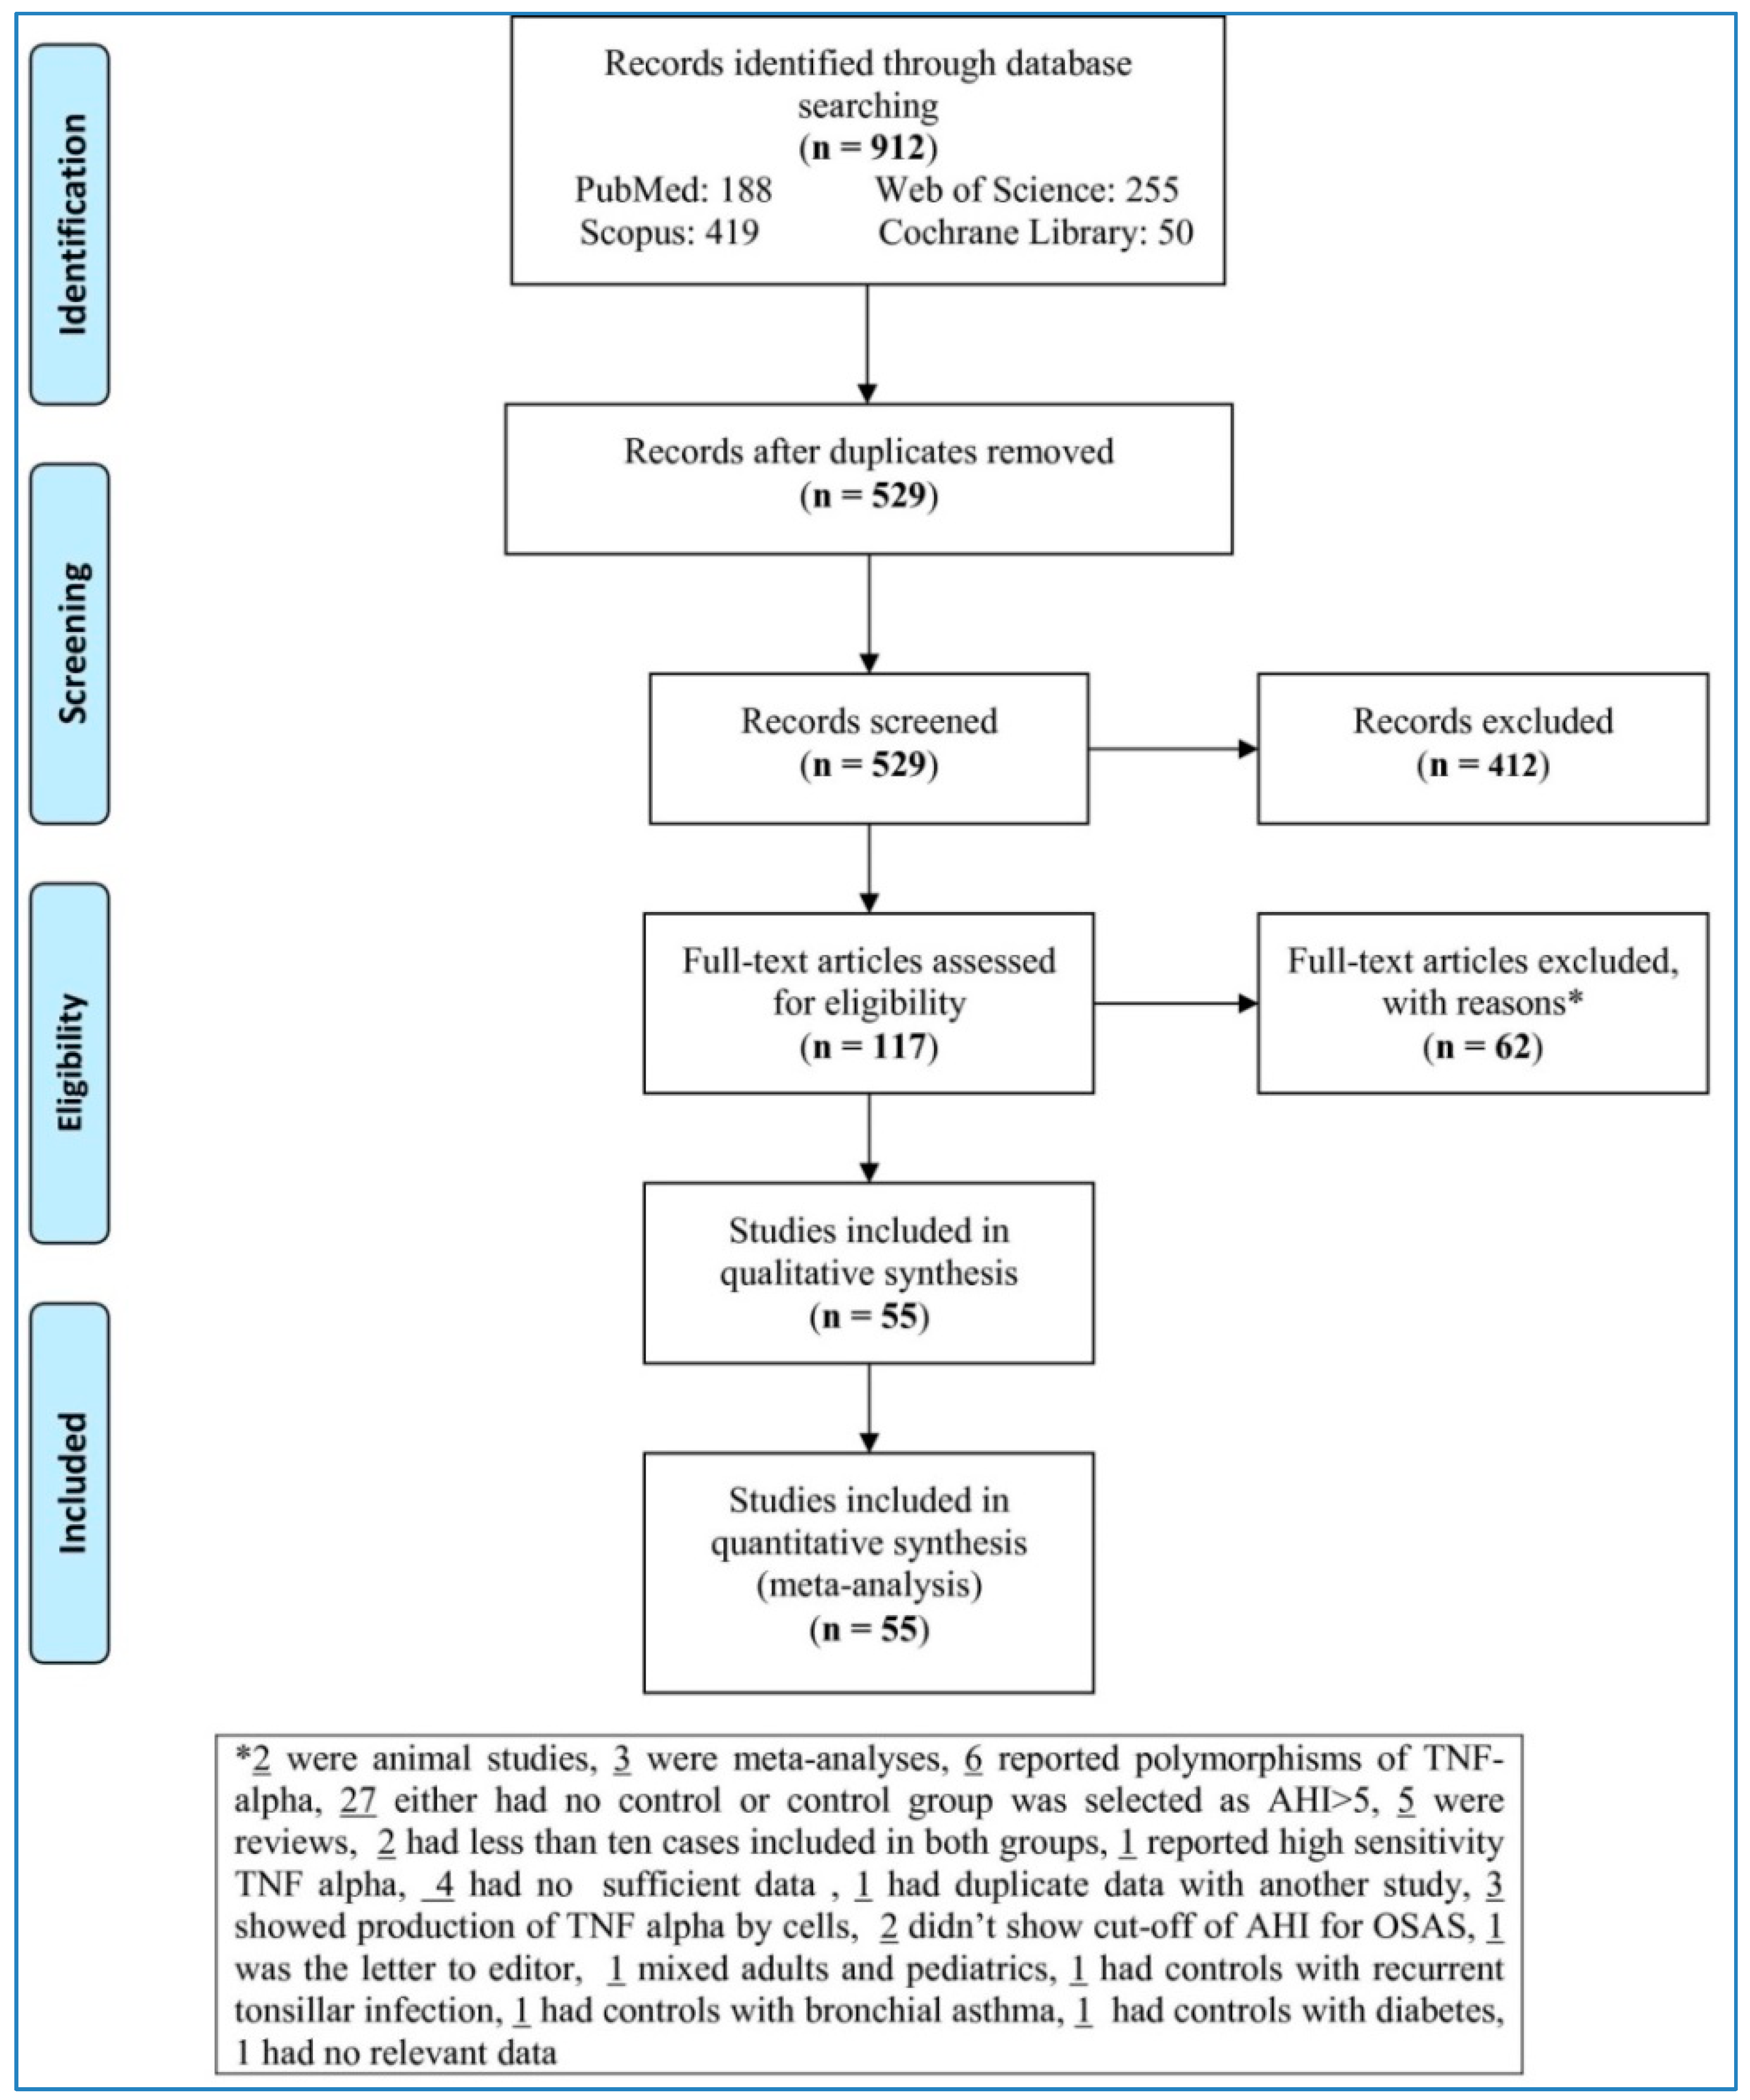
The flow chart (Figure 1) sets out the selection process. The search databases yielded 912 articles; of these, 117 full-texts met eligibility criteria after removing duplicates and irrelevant studies. Next, 62 articles were removed with reasons (two were animal studies, three were meta-analyses, six reported polymorphisms of TNF-alpha, twenty-seven either had no control or control group was selected as AHI > 5, five were reviews, two had less than ten cases included in both groups, one reported high sensitivity TNF alpha, four had no sufficient data, one had duplicate data with another study, three showed production of TNF alpha by cells, two did not show cut-off of AHI for OSAS, one was the letter to editor, one mixed adults and pediatric samples, one had controls with recurrent tonsillar infection, one had controls with bronchial asthma, one had controls with diabetes, one had no relevant data). This left 55 studies to be analyzed in the meta-analysis [14,16,28,29,30,31,32,33,34,35,36,37,38,39,40,41,42,43,44,45,46,47,48,49,50,51,52,53,54,55,56,57,58,59,60,61,62,63,64,65,66,67,68,69,70,71,72,73,74,75,76,77,78,79,80].

3.2. Characteristics of Studies

Table 1 presents the characteristics of the 55 studies included in the meta-analysis. Forty-six studies [16,28,29,30,31,32,33,34,35,36,38,39,40,41,43,44,45,46,47,48,49,50,51,52,54,56,57,58,59,60,61,62,63,64,65,67,68,69,70,71,72,75,76,78,79,80] reported serum or plasma TNF-α concentrations in adults, and nine studies [14,37,42,53,55,66,73,74,77] reported serum or plasma TNF-α concentrations in children and adolescents. Among adult participants, eighteen studies were performed with Caucasians [31,34,36,39,40,41,46,47,48,49,59,61,63,65,68,69,75,80], nineteen sampled Asians [16,29,32,33,35,43,45,52,54,58,60,62,64,67,71,72,76,78,79], and nine samples mixed [28,30,38,44,50,51,56,57,70] ethnicities. For studies with adult samples, 29 out of 46 studies reported serum TNF-α concentrations [16,31,32,33,34,35,36,38,40,41,45,46,48,50,51,52,56,60,61,63,64,65,67,68,70,76,78,79,80] and 17 reported plasma TNF-α concentrations [28,29,30,39,43,44,47,49,54,57,58,59,62,69,71,72,75].

3.3. Overall Analysis

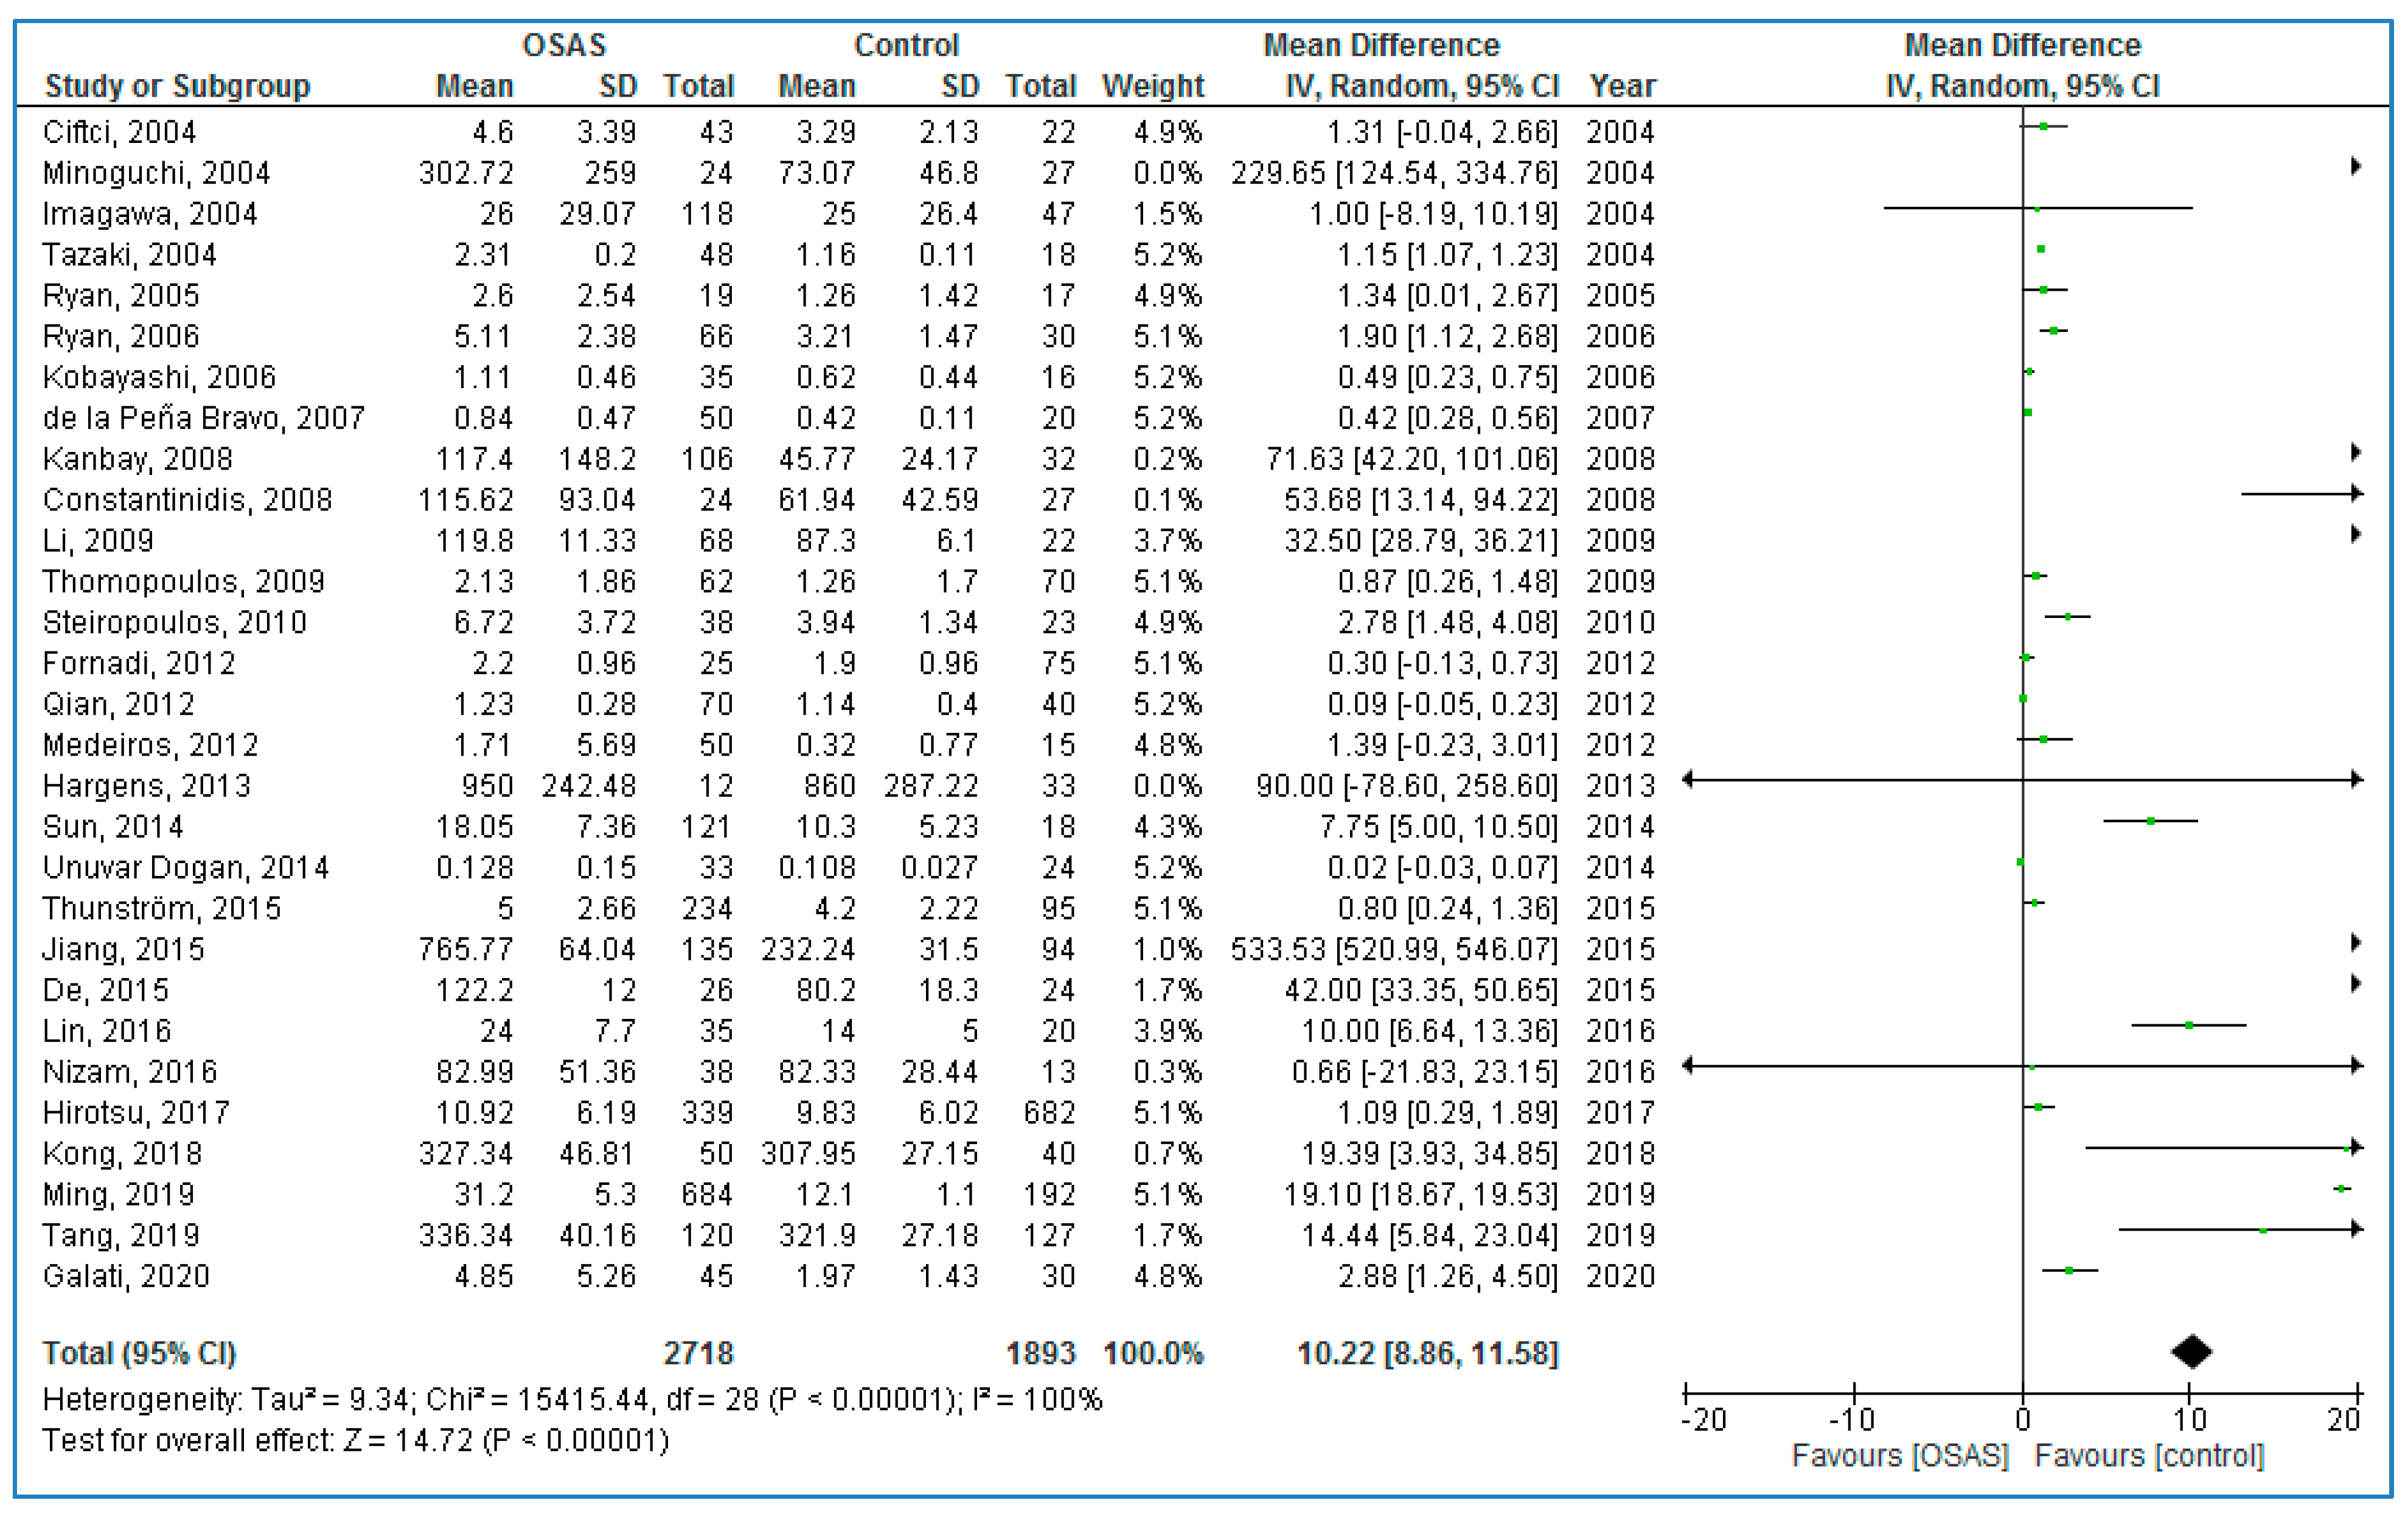
3.3.1. Serum Levels of TNF-α in Adults

Twenty-nine studies compared serum TNF-α concentrations between adults with OSAS and healthy controls (Figure 2); adults with OSAS had significantly higher TNF-α concentrations compared to healthy controls: 10.22 pg/mL (95% CI = 8.86, 11.58; p < 0.00001; I2 = 100% (Ph or Pheterogeneity < 0.00001)).

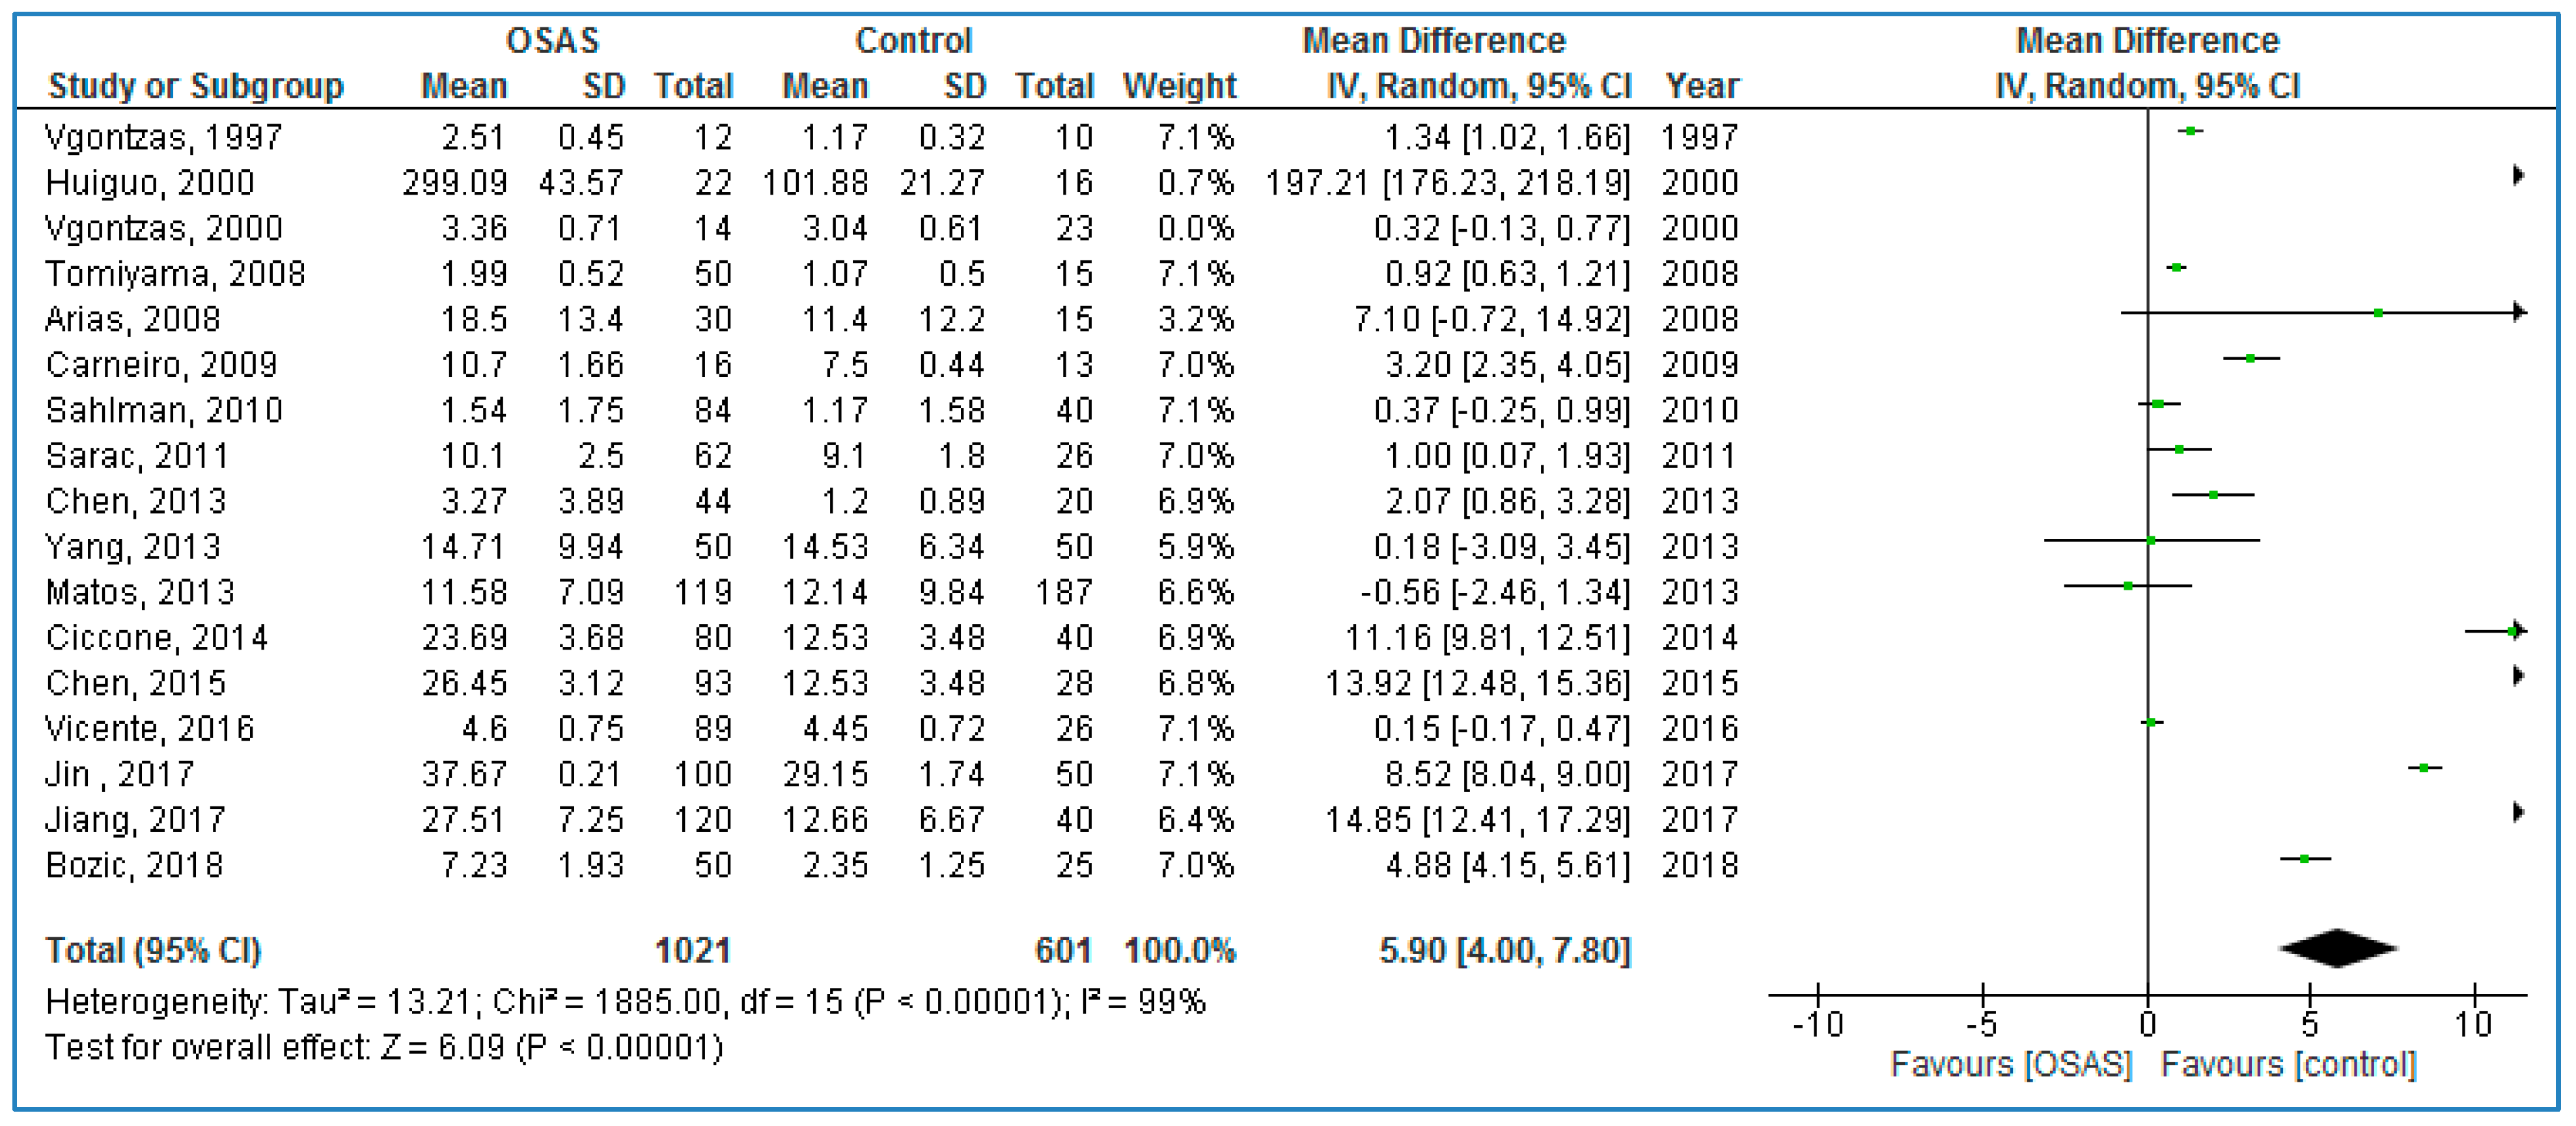
3.3.2. Plasma Levels of TNF-α in Adults

Seventeen studies compared plasma TNF-α concentrations between adults with OSAS and healthy controls (Figure 3) and found significantly higher TNF-α concentrations in those with OSAS: 5.90 pg/mL (95% CI = 4.00, 7.80; p < 0.00001; I2 = 99% (Ph < 0.00001)).

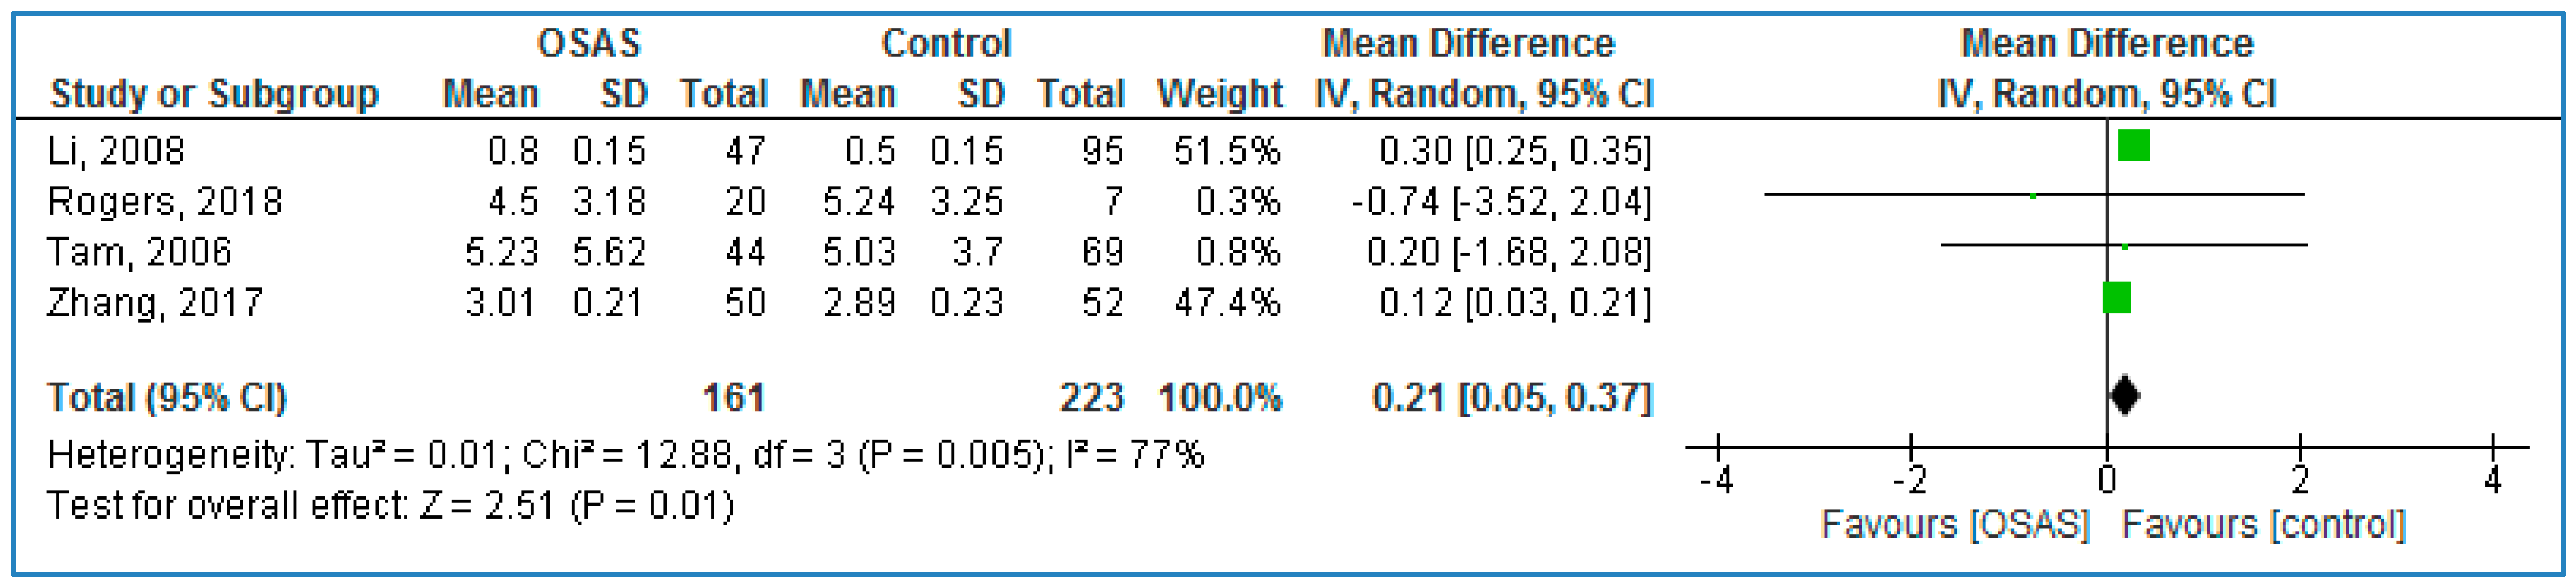
3.3.3. Serum TNF-α Levels in Children

Four studies compared serum TNF-α concentrations between children with OSAS and without OSAS (Figure 4) and found significantly higher TNF-α concentrations in those with OSAS: 0.21 pg/mL (95% CI = 0.05, 0.37; p = 0.01; I2 = 77% [Ph = 0.005].

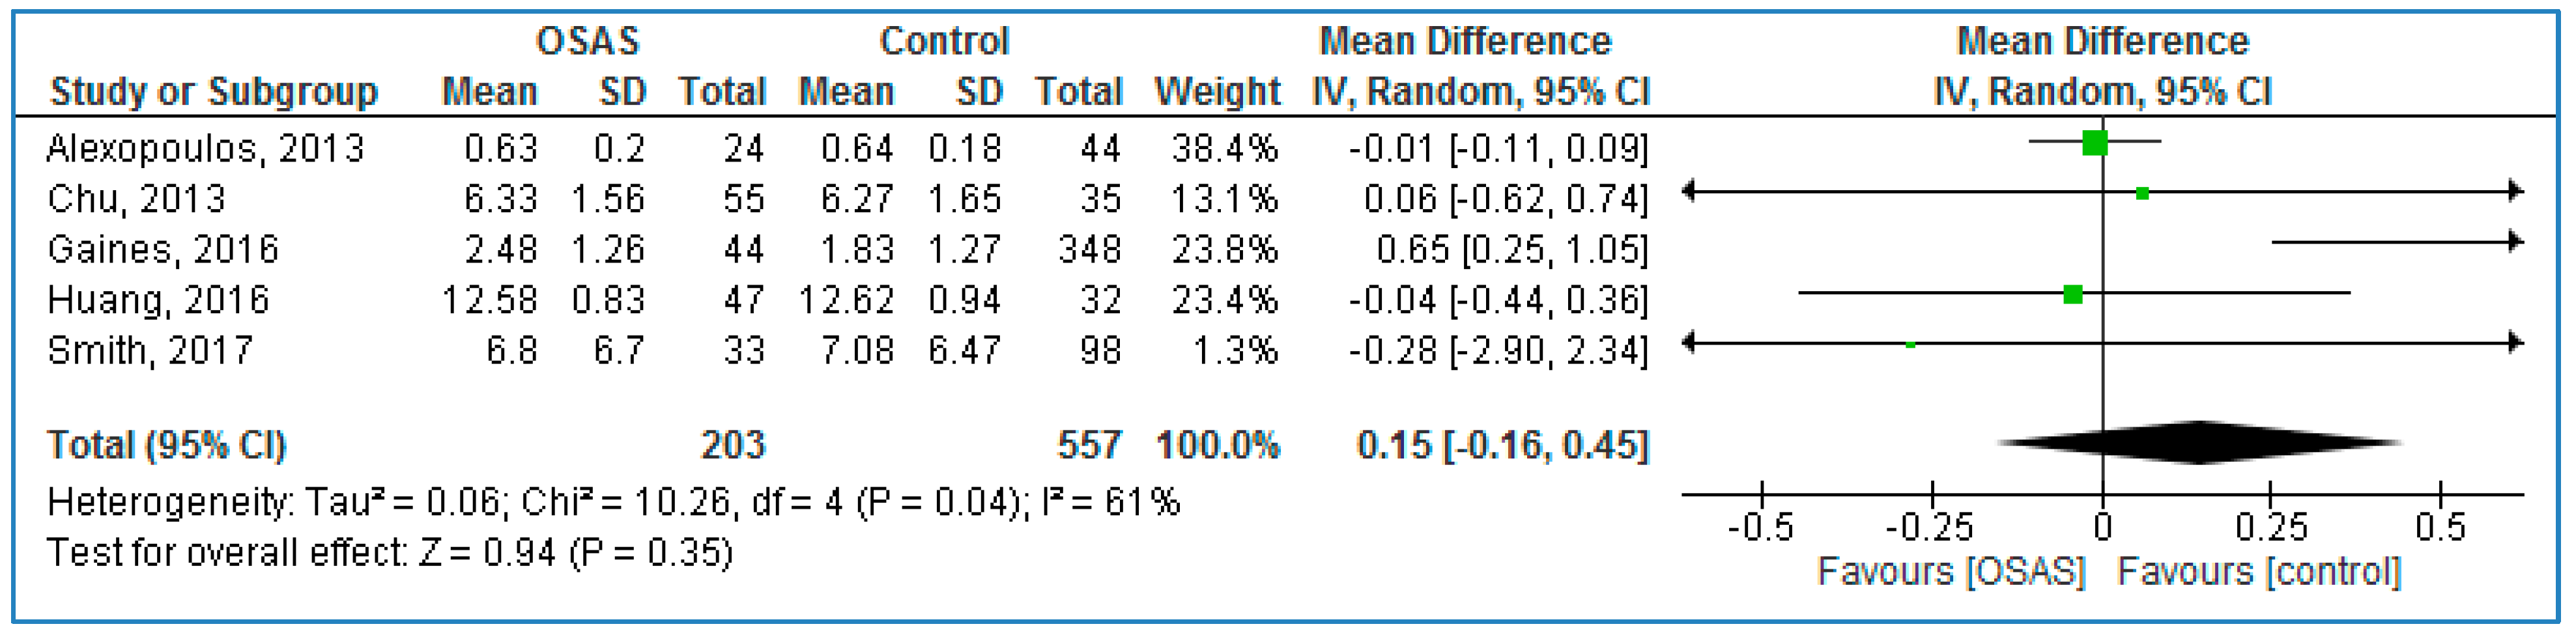
3.3.4. Plasma TNF-α Levels in Children

Five studies compared serum TNF-α concentrations between children with OSAS and without OSAS (Figure 5) and found no statistically significant MDs: 0.15 pg/mL (95% CI = −0.16, 0.45; p = 0.35; I2 = 61% [Ph = 0.04]).

3.4. Overall Subgroup Analysis of Serum and Plasma TNF-α Levels

3.4.1. Ethnicity

Subgroup analysis of serum TNF-α concentrations in adult samples are reported in Table 2. The pooled analysis showed that for those with OSAS, serum TNF-α concentrations in Asians (MD = 37.11 pg/mL (95% CI = 33.27, 40.95; p < 0.00001), in Caucasians (MD = 2.20 pg/mL; 95% CI = 1.06, 3.34; p = 0.0002), and in mixed ethnicities (MD = 0.43; 95% CI = 0.30, 0.56; p < 0.00001) were significantly higher, compared to healthy controls. Serum TNF-α concentrations in Asians were 16.9 and 86.3 times higher than serum TNF-α concentrations in Caucasian and mixed ethnicities with OSAS, and always compared to controls.
For plasma TNF-α concentrations, for those adults with OSAS, plasma TNF-α concentrations in Asians (MD = 14.92 pg/mL; 95% CI = 9.86, 19.98; p < 0.00001), in Caucasians (MD = 3.72 (95% CI = 1.04, 6.40; p = 0.007)), and in mixed ethnicities (MD = 1.22; 95% CI = 0.10, 2.34; p = 0.03) were significantly higher, compared to healthy controls. Next, in Asians, plasma TNF-α concentrations were 4 and 12.2 times higher than in Caucasian and mixed ethnicities with OSAS, and always compared to controls.

3.4.2. Mean BMI of Individuals with OSAS

For serum TNF-α concentrations, and compared to healthy controls, adult participants with OSAS and a BMI > 30 km/m2 showed a pooled MD of 1.27 (95% CI: 0.67, 1.86; p < 0.0001). For adult participants with OSAS and a BMI ≤ 30 km/m2, the pooled MD was 23.07 pg/mL (95% CI: 20.18, 25.96; p < 0.00001). Thus, results showed that serum TNF-α concentrations were 18.2 times higher participants with OSAS and a BMI > 30 kg/m2, when compared to those participants with a mean BMI ≤30 kg/m2.
For plasma TNF-α concentrations, and compared to healthy controls, adult participants with OSAS and a BMI > 30 km/m2 showed a pooled MD of 1.06 pg/mL (95% CI: 0.34, 1.78; p = 0.004). For adult participants with OSAS and a BMI ≤ 30 km/m2, the pooled MD was 10.82 pg/mL (95% CI: 7.14, 14.49; p < 0.00001). Thus, results showed that plasma TNF-α concentrations were 10.2 times higher in adults with OSAS and a BMI > 30 kg/m2 than plasma TNF-α concentrations of adults with OSAS and a BMI ≤ 30 kg/m2 and always compared to healthy controls.

3.4.3. Mean BMI of Controls

For serum TNF-α levels, compared to controls, individuals with OSAS and with a BMI > 30 kg/m2 showed a pooled MD of 2.28 pg/mL (95% CI: 0.86, 3.70; p = 0.002); while compared to controls, individuals with OSAS and with a BMI ≤ 30 kg/m2 showed a pooled MD of 18.64 pg/mL (95% CI: 16.33, 20.95; p < 0.00001). Thus, serum TNF-α levels were 8.2 times higher in studies with participants with OSAS and a BMI >30 kg/m2 than serum TNF-α levels with participants with OSAS and a BMI ≤ 30 kg/m2.
For plasma TNF-α levels, compared to controls, the pooled MD was 7.32 pg/mL (95% CI: 5.02, 9.62; p < 0.00001) for participants with OSAS and a BMI > 30 kg/m2; for participants with OSAS and a BMI ≤ 30 kg/m2, the pooled MD was not statistically significant (MD = 1.19 pg/mL; 95% CI: 0.00, 2.38; p = 0.05).

3.4.4. Total Number of Participants

For serum TNF-α levels, the pooled MD was 55.47 pg/mL (95% CI: 47.21, 63.72; p < 0.00001) for studies with more than 100 cases, and 2.15 pg/mL (95% CI: 1.57, 2.72; p < 0.00001) for studies with less than 100 cases. Thus, serum TNF-α levels were 25.8 times higher in the studies with more 100 cases, compared to studies with less than 100 cases.
For plasma TNF-α levels, the pooled MD was 6.91 pg/mL (95%CI: 2.20, 11.63; p = 0.004) for studies with more than 100 cases, while the pooled MD was 2.87 pg/mL (95%CI: 1.37, 4.37; p = 0.0002) for studies with less than 100 cases. Thus, plasma TNF-α levels were 2.4 times higher in the studies with more than 100 cases, compared to studies with less than 100 cases.

3.4.5. Mean AHI of Individuals with OSAS

For serum TNF-α levels, in individuals with OSAS and a AHI > 30 events/h, the pooled MD was 5.72 pg/mL (95% CI: 4.32, 7.12; p < 0.00001), while the pooled MD was 127.01 pg/mL (95%CI: 100.56, 153.47; p < 0.00001) in individuals with OSAS and a AHI ≤ 30 events/h. Thus, serum TNF-α levels were 22.2 times higher, when participants with OSAS had AHI ≤ 30 events/h, compared to AHI > 30 events/h.
For plasma TNF-α levels, in individuals with OSAS and AHI > 30 events/h, the pooled MD was 8.15 pg/mL (95% CI: 5.59, 10.71; p < 0.00001), while in individuals with OSAS and AHI ≤ 30 events/h, the pooled MD was 2.97 pg/mL (95% CI: 0.21, 5.73; p = 0.03). Thus, serum TNF-α levels were 2.7 times higher in participants with OSAS and AHI > 30 events/h, compared to serum TNF-α levels in participants with OSAS and AHI ≤ 30 events/h.

3.5. Adult Caucasian Participants

3.5.1. Mean BMI of Individuals with OSAS

For serum TNF-α levels, studies with Caucasian participants with OSAS and a BMI > 30 kg/m2 showed the pooled MD of 2.58 pg/mL (95% CI: 1.07, 4.10; p = 0.0008), whereas for studies with participants with a BMI ≤ 30 kg/m2 serum TNF-α levels did not statistically differ between participants with or without OSAS (Table 3).
For plasma TNF-α levels, studies with Caucasian participants with OSAS and a BMI ≤ 30 kg/m2 showed the pooled MD of 7.99 pg/mL (95% CI: 1.84, 14.15; p = 0.01), whereas no significant MDs were observed in studies including Caucasian participants with OSAS and a BMI > 30 kg/m2.

3.5.2. Mean BMI of Controls

For studies with serum TNF-α levels and Caucasian controls with a mean BMI > 30 kg/m2, the pooled MD was 2.58 pg/mL (95% CI: 1.07, 4.10; p = 0.0008). There was no statistically significant MD for serum TNF-α levels between Caucasians with or without OSAS and a mean ≤ 30 kg/m2.
For studies with plasma TNF-α levels and controls with a BMI > 30 kg/m2, the pooled MD was 0.56 pg/mL (95% CI: 0.05, 1.08; p = 0.03). Studies with controls with a BMI ≤ 30 kg/m2 showed a pooled MD of 5.64 pg/mL (95% CI: 0.77, 10.52; 0.02). Thus, plasma TNF-α levels were 10.1 times higher in controls with a BMI ≤ 30 kg/m2, compared to plasma TNF-α levels of controls with a BMI > 30 kg/m2

3.5.3. Total Number of Participants

Serum TNF-α levels had a significant difference in studies with ≤ 100 cases (MD = 3.21 pg/mL; 95% CI: 1.37, 5.05; p = 0.0006), whereas there was no significant difference for studies with >100 cases.

3.5.4. Mean AHI of Individuals with OSAS

In studies with individuals with OSAS and AHI of > 30 events/h, serum TNF-α levels were 1.40 pg/mL (95% CI: 0.34, 2.46; p = 0.010), and plasma TNF-α levels were 7.80 pg/mL (95% CI: 2.47, 13.13; p = 0.004).

3.6. Adult Asian Participants

3.6.1. Mean BMI of Individuals with OSAS

For serum and plasma TNF-α levels, there were no Asian participants with OSAS and a mean BMI > 30 kg/m2. For studies with Asian participants with OSAS and a mean BMI ≤ 30 kg/m2, serum (MD = 37.11 pg/mL; 95% CI: 33.27, 25.96; p < 0.0001) and plasma (MD = 14.92 pg/mL; 95% CI: 9.86, 19.98; p < 0.00001) TNF-α levels differed statistically significantly (Table 4).

3.6.2. Mean BMI of Controls

For serum and plasma TNF-α levels, there were no studies including controls with a BMI > 30 kg/m2. The serum TNF-α levels were 37.11 pg/mL (95% CI: 33.27, 25.96; p < 0.0001) for studies including OSAS patients with a mean BMI of ≤30 kg/m2, and plasma TNF-α levels were 14.92 pg/mL (CI: 9.86, 19.98; p < 0.00001) for studies including OSAS patients with a mean BMI of ≤30 kg/m2.

3.6.3. Total Number of Participants

For serum TNF-α levels, the pooled MD was 89.88 pg/mL (95% CI: 74.59, 105.17; p < 0.00001) for studies with 100 or more participants, and the pooled MD was 7.80 pg/mL (95% CI: 5.76, 9.85; p < 0.00001) for studies less than 100 participants. Thus, serum TNF-α levels were 11.5 times higher in studies with more than 100 participants, compared to studies with less than 100 participants.
For plasma TNF-α levels, the pooled MD was 12.34 pg/mL (95%CI: 7.84, 16.84; p < 0.00001) for studies with 100 or more participants, and the pooled MD was 21.51 pg/mL (95%CI: 13.15, 29.87; p < 0.00001) for studies less than 100 participants. Thus, plasma TNF-α levels were 1.7 times higher in studies with less than 100 participants, compared to studies with more than 100 participants.

3.6.4. Mean AHI of Individuals with OSAS

No study investigated serum and plasma TNF-α levels in participants with OSAS with a mean AHI ≤ 30 events/h.
For studies including AHI > 30 events/h, mean serum TNF-α levels were 12.94 (pg/mL; 95% CI: 7.74, 18.13; p < 0.00001); plasma TNF-α levels were 12.48 pg/mL (95% CI: 17.04, 31.52; p < 0.00001).

3.7. Adult Participants Including Mean BMI of Individuals with OSAS > 30 kg/m2

3.7.1. Mean BMI of Controls

For studies with serum TNF-α levels and controls with BMI of controls >30 kg/m2, there was a significant difference for serum TNF-α levels (MD = 2.28 pg/mL; 95% CI: 0.86, 3.70; p = 0.002), compared to studies with controls with BMI of controls ≤ 30 kg/m2 (Table 5).

3.7.2. Total Number of Participants

For studies with 100 or less participants, there was a significant difference for serum TNF-α levels (MD = 1.27 pg/mL; 95% CI: 0.65, 1.89; p < 0.0001) and for plasma TNF-α levels (MD = 1.51 pg/mL; 95% CI: 0.53, 2.49; p = 0.003), compared to studies with more than 100 participants.

3.7.3. Mean AHI of Participants with OSAS

For serum TNF-α levels, the pooled MD for studies including participants with OSAS with AHI > 30 events/h was 0.96 pg/mL (95% CI: 0.50, 1.42; p < 0.0001); the pooled MD for studies with participants with OSAS with AHI ≤ 30 events/h was 42.13 pg/mL (95%CI: 33.48, 50.77; p < 0.00001). Thus, serum TNF-α levels were 42.9 times higher in studies with participants with OSAS and AHI ≤ 30 events/h, compared to the serum TNF-α levels in studies including participants with OSAS and AHI > 30 events/h.
For plasma TNF-α levels, the pooled MD for studies with participants with OSAS with AHI > 30 events/h was 1.69 pg/mL (95% CI: 0.47, 2.90; p = 0.007). When studies included participants with OSAS and an AHI ≤ 30 events/h, MDs between studies with participants with or without OSAS were not significant.

3.8. Adult Participants with a Mean BMI ≤ 30 kg/m2 in Participants with OSAS

3.8.1. Mean BMI of Controls

No study investigated serum and plasma TNF-α levels in participants with OSAS with a mean BMI >30 kg/m2.
For studies including BMI ≤ 30 kg/m2 in controls, TNF-α levels were 23.07 pg/mL (95% CI: 20.18, 4.50; p < 0.00001) for serum, and MD = 10.82 pg/mL (95% CI: 7.14, 14.49; p < 0.00001) for plasma (Table 6).

3.8.2. Total Number of Participants

For serum TNF-α levels and in studies with more than 100 participants, the pooled MD was 63.51 pg/mL (95% CI: 53.65, 73.45; p < 0.00001), while in studies with ≤ 100 participants, the pooled MD was 4.42 pg/mL (95% CI: 3.10, 5.74; p < 0.00001). Thus, serum TNF-α levels were 14.4 times higher in studies with more than 100 participants, compared to serum TNF-α levels in studies with ≤100 participants.
For plasma TNF-α levels and in studies with more than 100 participants, the pooled MD was 8.12 pg/mL (95%CI: 4.46, 11.79; p < 0.0001) while in studies with ≤100 participants, the pooled MD 13.79 pg/mL (95%CI: 8.24, 19.35; p < 0.00001). Thus, plasma TNF-α levels were 1.7 times higher in studies with more than 100 participants, compared to plasma TNF-α levels in studies with ≤100 participants.

3.8.3. Mean AHI of Participants with OSAS

For serum TNF-α levels, the pooled MD for studies including participants with OSAS and an AHI > 30 events/h was 12.94 pg/mL (95% CI: 7.74, 18.13; p < 0.00001); the pooled MD for studies including participants with OSAS and an AHI ≤ 30 events/h was 173.00 pg/mL (95%CI: 139.66, 206.34; p < 0.00001). Thus, serum TNF-α levels were 13.4 times higher in participants with OSAS and AHI ≤ 30 events/h, compared to the serum TNF-α levels in participants with OSAS and AHI > 30 events/h.
For plasma TNF-α levels, the pooled MD for studies including participants with OSAS and an AHI > 30 events/h was 16.13 pg/mL (95% CI: 11.20, 21.06; p < 0.00001). When studies included participants with OSAS had an AHI ≤ 30 events/h, MDs between studies including participants with or without OSAS were not significant.

3.9. Meta-Regression

The results of meta-regression showed that age, the publication year, the mean BMI, the mean AHI, and the number of participants did not systematically change serum and plasma TNF-α levels (Table 7).

3.10. Quality Assessment

The quality score of each study included in the meta-analysis is illustrated in Table 8.

3.11. Sensitivity Analysis

The “cumulative analysis” and the “one study removed” as two sensitivity analyses showed the stability of the results. In addition, excluding statistically the studies with outliers data did not change pooled analysis of serum (MD = 4.53 pg/mL, p < 0.00001) and plasma (MD = 4.18 pg/mL, p < 0.00001) TNF-α levels (Table 9).

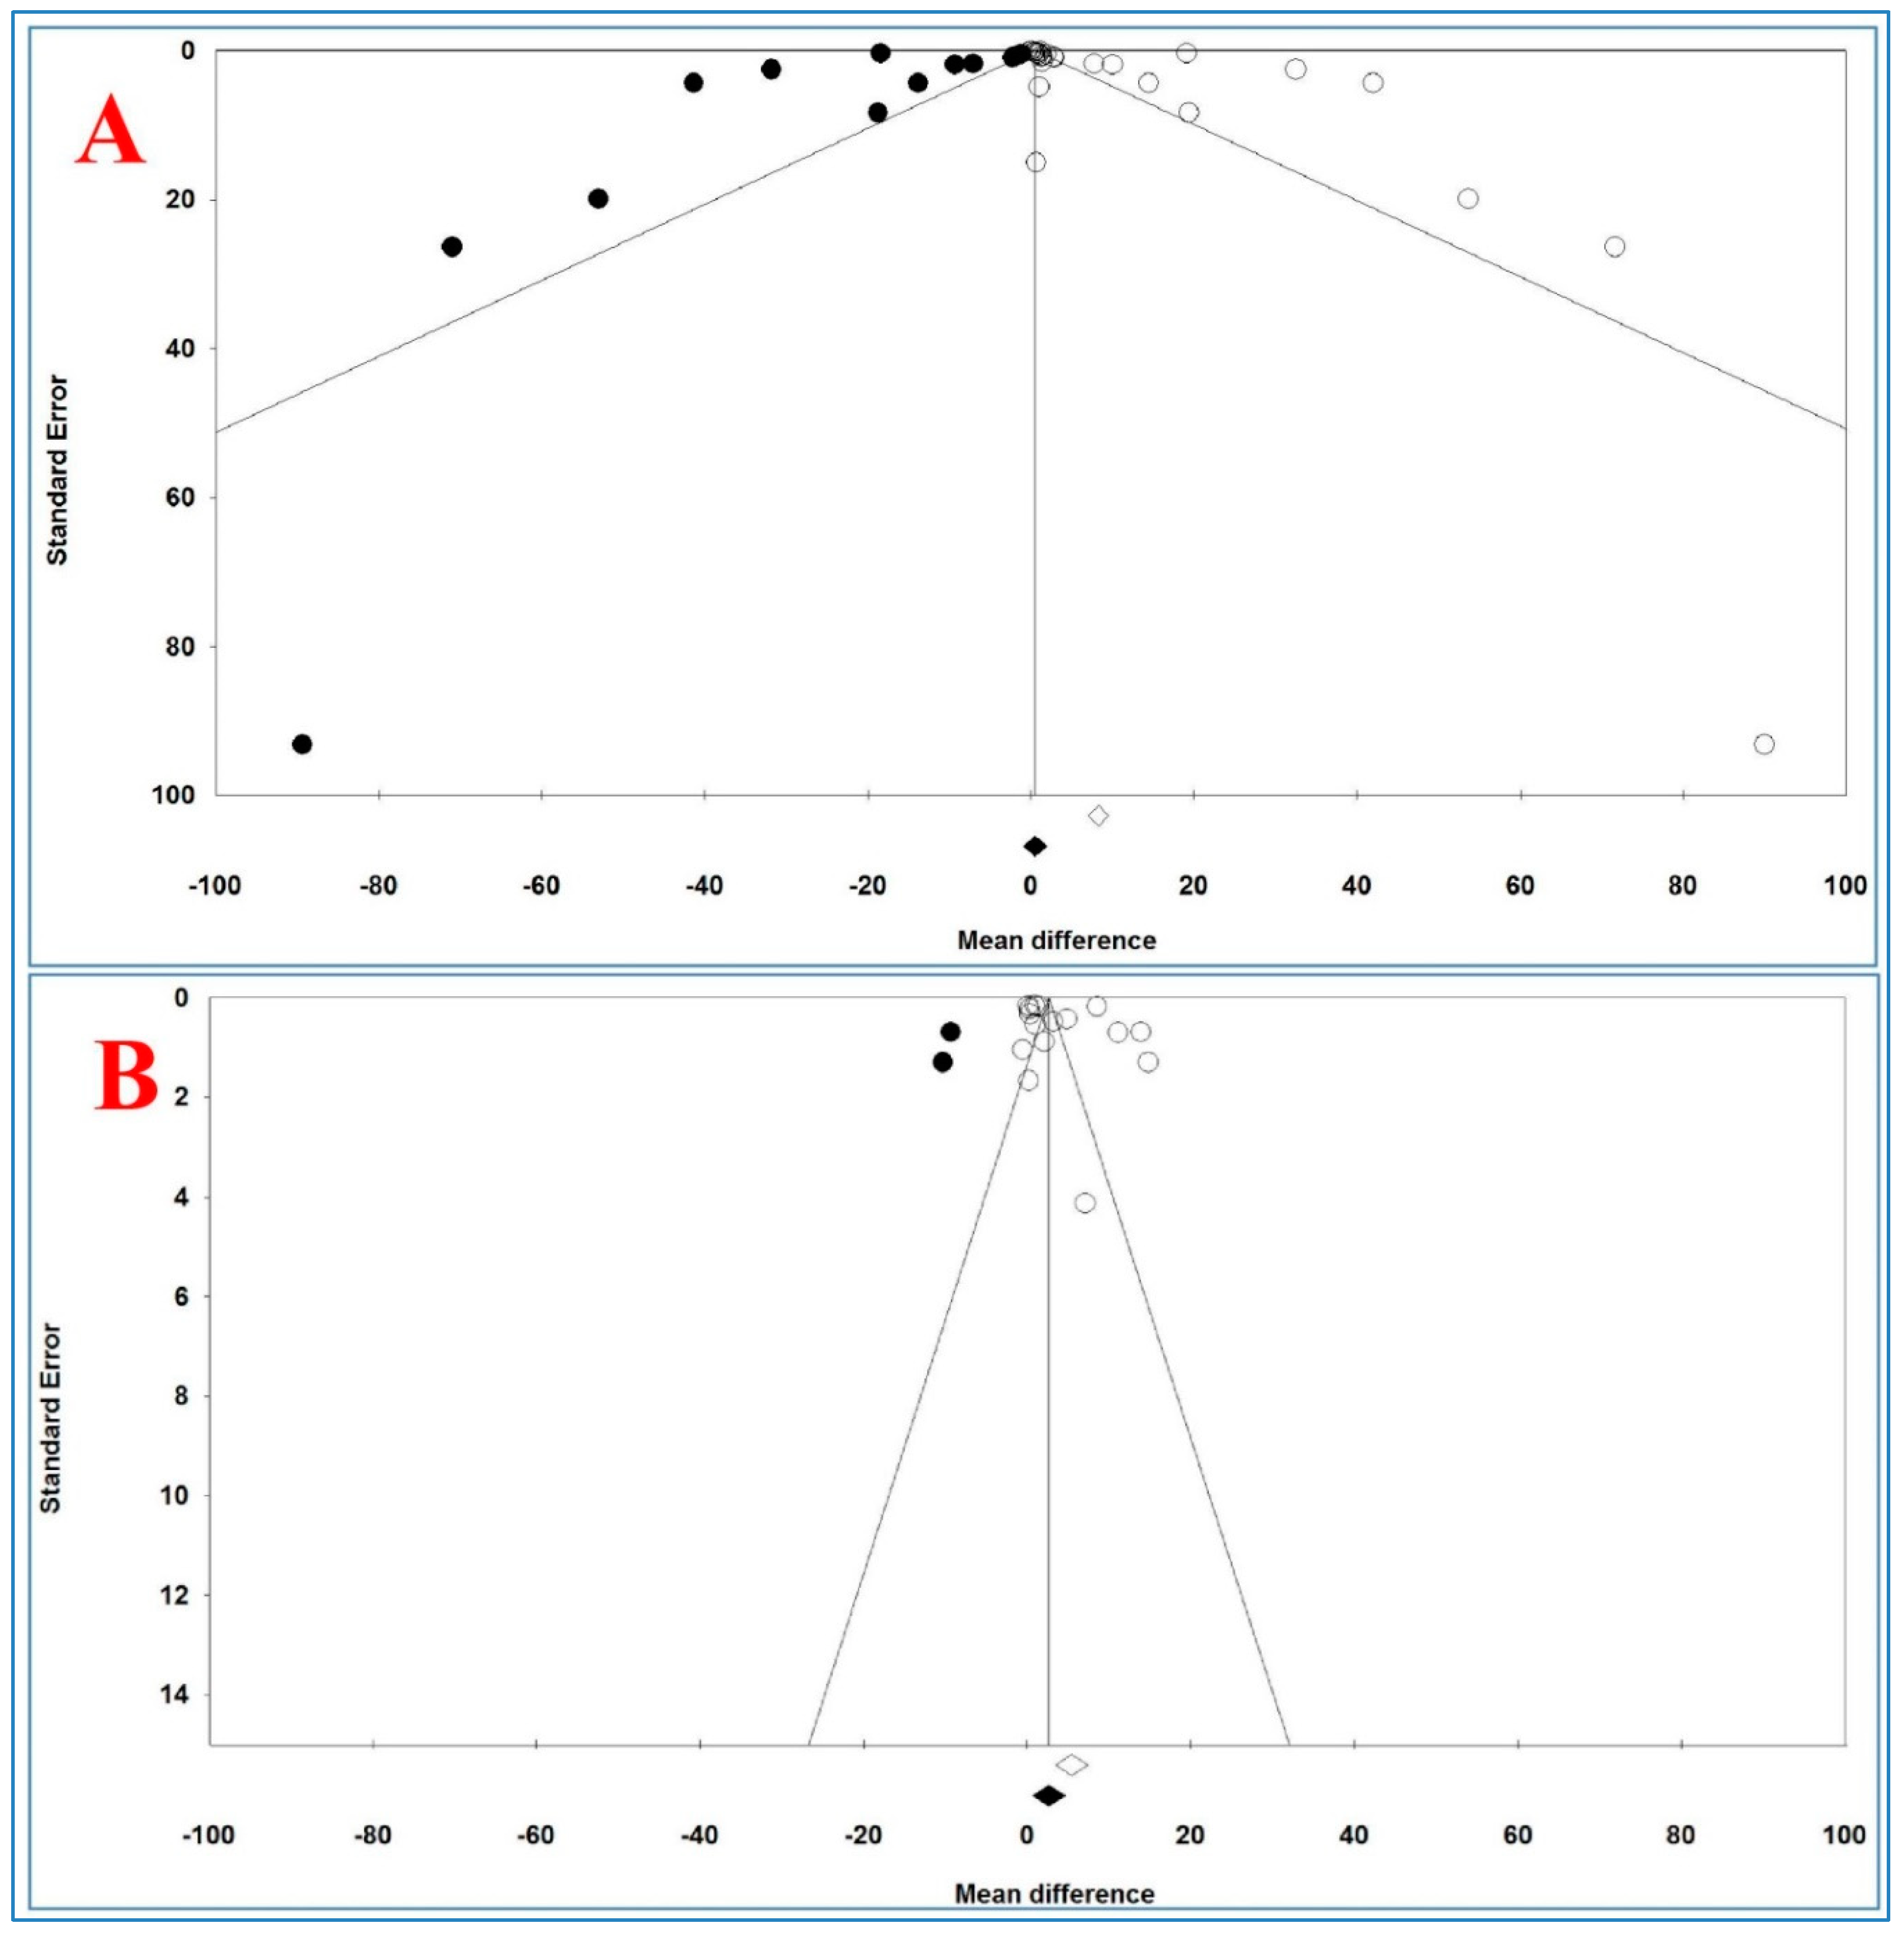
3.12. Publication Bias

Figure 6 shows the funnel plots of the analysis of serum and plasma TNF-α levels and Table 10 illustrates the results of trim-and-fill method on bias.
For serum levels, Egger’s and Begg’s tests (p = 0.02431 and p = 0.04677, respectively) revealed a publication bias. For plasma TNF-α levels, Begg’s test (p = 0.03943) revealed a publication bias, but Egger’s test (p = 0.19315) did not show any bias between and across the studies.
For serum TNF-α levels and 15 imputed studies, under the fixed-effects model, the point estimate and pseudo 95% CI for the combined studies was 0.410 (0.365, 0.455); using the trim-fill method, the imputed point estimate was 0.323 (0.278, 0.368). In addition, under the random-effects model, the point estimate and 95% CI for the combined studies was 8.245 (7.006, 9.483); using the trim-fill method, the imputed point estimate was 0.523 (−0.889, 1.935).
For plasma TNF-α levels and 3 imputed studies, under the fixed-effects model, the point estimate and 95% CI for the combined studies was 2.463 (2.323, 2.602), and using trim-fill method, the imputed point estimate was 2.294 (2.156, 2.433). In addition, under the random-effects model, the point estimate and pseudo 95% CI for the combined studies was 5.452 (3.501, 7.403); using the trim-fill method, the imputed point estimate was 2.668 (0.638, 4.698).
The overall effect sizes on serum and plasma TNF-α levels reported in the forest plot appeared valid, with trivial publication bias effect based on fixed-effects model, because the observed estimates were similar to the adjusted estimates. In contrast, the overall effect sizes on serum and plasma TNF-α levels reported in the forest plot appeared invalid, with significant publication bias effect based on random-effects model, because the observed estimates had high difference with the adjusted estimates.

4. Discussion

The present meta-analysis with 55 studies evaluated the serum TNF-α levels (29 studies of adults and 4 studies of children) and plasma TNF-α levels (17 studies of adults and 5 studies of children) in individuals with OSAS, compared to controls. The results showed that plasma and serum TNF-α levels in adult individuals with OSAS were significantly higher than the corresponding levels of control. For children with OSAS serum TNF-α levels, but not plasma TNF-α levels, were statistically significantly higher than those of controls. The present results have clinical importance because elevated serum and plasma TNF-α levels can be a risk factor for the development of further systemic diseases in adults with OSAS. Further, more generally, inflammation may play a crucial role in the pathogenesis of OSAS, and there is evidence that individuals with OSAS have elevated interleukin TNF-α [16,29,40,41,45,48,62,78]. These conclusions also have practical importance because, in addition to routine checks on sleep and sleep-disordered breathing, both children and adults with OSAS need a thorough monitoring of their immune systems.
Elevated TNF-α levels have been associated with the pathophysiology of reoxygenation injury, myocarditis, cardiac allograft vasculopathy, heart failure progression [81], arthritis, diabetes, Crohn’s disease, and also cachexia which correlated with terminal malignancy and AIDS [82]. Further, TNF-α is a well-known inflammatory marker, besides being related to atherosclerosis in males [83]. It is also confirmed that hypoxia raises the expression of proinflammatory molecules such TNF-α [84,85].
The present pattern of results also sheds some light on further new findings: More specifically, for adults, it turned out that compared to healthy controls, TNF-α levels were higher both in blood serum and blood plasma. It follows that at least for adults with OSAS, assessing either blood plasma or blood serum does not appear to be of clinical importance. In contrast, for pediatric samples and compared to healthy controls, higher TNF-α levels were observed for blood serum but not for blood plasma. The quality of the data at hand does not allow a deeper understanding of the underlying physiological mechanisms. Thus, for want of such data, the following admittedly speculative assumptions are advanced. First, it is conceivable that for pediatric samples, the number of four studies on plasma TNF-α was too small, and therefore, the statistical variance of plasma TNF-α was blurred by sample size inconsistencies. Similarly, second, at least among adults, Hirotsu et al. [70] showed that OSAS and inflammatory markers such as IL-6 and TNF-α were associated with gender in a very complex fashion. A closer inspection of the four studies on plasma TNF-α among pediatric samples showed that gender was not introduced as a specific factor or confounder. Given this lack of analyses in these publications, possible gender effects could neither be confirmed, nor declined. Third, Imani et al. [86] showed that for pediatric samples, the definition of OSAS was not applied as strict and consistent as among adult samples. It follows that the zero-differences of plasma TNF-α between children with and without OSAS might mirror inconsistencies as regards the definition of control samples. Fourth, Cameron et al. [87] observed that besides the disease status, in pediatric samples with Inflammatory Bowel Disease, the outcome of an antitumor necrosis factor (TNF) therapy depended from participants’ pubertal stage. Given this, it is conceivable that the zero-difference of plasma TNF-α between pediatric samples with and without OSAS might have been blurred by the pubertal stage. In the same vein, fifth, it is conceivable that pubertal stage and its implicit growth spurt in height and weight might have obscured a clear-cut pattern of results as regards TNF-α levels between children with and without OSAS. Last, even if highly unlikely, one cannot rule out that the pattern of results is an accidental finding.
The pattern of results described in the present meta-analysis and systematic review consistently showed that higher TNF-α levels were associated with pathologically higher BMI scores as a proxy of obesity. Given that above all childhood overweight and childhood obesity is increasing worldwide and is a major concern of public health [88], the association between overweight/obesity, TNF-α levels and OSAS demand particular attention. Following Popa et al. [13], TNF-alpha appeared to be of upmost importance in the development and maintenance of metabolic diseases in which a shift toward a proatherogenic lipid profile and impaired glucose tolerance appeared to occur. Further, investigations assessing the impact of anti-TNF agents on intermediary metabolism seemed to show that a TNF-alpha blockade may improve insulin resistance and lipid profiles, which in turn appeared to be associated with overweight and obesity. Likewise, Ciftci et al. [31] showed in their study that compared to obese males with no OSAS, in obese males with OSAS TNF-alpha levels were significantly higher. Ciftci et al. [31] concluded from their results, that the association between cardiovascular morbidity and OSAS appeared to be best described by the coexistence of other cardiovascular risk factors such as circulating IL-6 and TNF-alpha levels. In the same vein, Sahlman et al. [47] showed in their study that pro-inflammatory markers such as TNF-alpha were markedly increased in patients with mild OSAS. To find a physiological explanation for such processes, Steiropoulos et al. [48] summarized in their introduction that besides the role of energy depot adipose tissue is also an active endocrine organ, releasing proinflammatory cytokines such as Tumor Necrosis Factor-α (TNF-α) and Interleukin-6 (IL-6) which modulate blood pressure, and lipid- and glucose-metabolism. Further, the proinflammatory transcription factor NF-κB appears to be upregulated in OSAS as a result of alterations between hypoxia and reoxygenation and as a result of sleep deprivation. Additionally, NF-κB regulates the expression of inflammatory genes. Given these physiological processes, it appears plausible that OSAS, obesity and poor sleep appear to be highly interrelated.
The results of one study [70] showed that IL-6, triglycerides, and AHI were positively associated with TNF-α, while sex, ghrelin and total cholesterol had a negative association. Further, postmenopausal women had higher TNF-α levels than those of premenopausal women [70]. One study showed that higher TNF-α levels were significantly related to some neurocognitive deficits in children with OSAS [14].
Next, TNF-α appears to mediate both a somnogenic activity and fatigue related to excessive daytime somnolence in obese patients with OSAS [14,28,30]. TNF-α levels were related to the severity of OSAS [31]. One study reported that BMI was weakly related to TNF-α levels [32]. However, Kanbay et al. [41] showed that in individuals with OSAS and obesity serum TNF-α levels were significantly higher than those without obesity. Not surprisingly, there was also a positive albeit modest correlation (r: 0.181; p: 0.034) between higher BMI scores and higher TNF-α levels [16].
As regards AHI and TNF-α levels, Kanbay et al. [41] and others [16,78] reported a significant positive correlation between a higher AHI and higher serum TNF-α levels.
Next, Minoguchi et al. [16] reported in their meta-analysis higher plasma and serum TNF-α levels in adults, compared to non-adults.
Despite the novelty of the results, the following limitations should be considered: (1) In all studies, results have not been adjusted for possible confounding factors such as obesity, smoking, or alcohol consumption. (2) The results of the funnel plots showed a publication bias across the studies; it follows that a systematic bias in the data presentation cannot be ruled out. (3) Studies with a small sample size (less than100 cases) had an inadequate power to detect possibly meaningful associations. (4) There was a high heterogeneity among studies in some analyses. (5) Studies reported different cut-off AHI values, which made comparisons between the studies difficult. (6) In some studies, TNF-α levels were considered as secondary outcome. (7) In some studies, the existence of mixed ethnicities might have blurred the associations between the ethnicity and TNF-α levels.
By contrast, the strengths of the meta-analysis were as follows: (1) There were sufficient studies to allow the subgroup analyses. (2) The sensitivity analysis showed a stability of the results. (3) The studies written in other languages than English were included in the meta-analysis.

5. Conclusions

The result of the meta-analysis and meta-regression confirmed that compared to healthy controls, individuals with OSAS (adults) had significant higher serum/plasma TNF-α levels, whereas for children with OSAS, this pattern of results was observed for serum TNF-α levels, but not for plasma TNF-α levels. Last, the results of the present meta-analysis showed that elevated TNF-α levels in individuals with OSAS appeared to be related to the severity of the disease. Future studies might investigate if and to what extent interventions on OSAS (e.g., using CPAP devices) favorably impact on TNF-α levels and possibly also on weight regulation.

Author Contributions

Conceptualization, M.M.I and M.S.; methodology, M.S.; software, M.S.; validation, M.M.I. and S.B.; formal analysis, M.S.; investigation, M.E and D.S.B.; resources, S.B.; data curation, M.S.; writing—original draft preparation, S.B.; writing—review and editing, M.S., H.K., M.E., D.S.B. and S.B.; visualization, H.K.; supervision, M.M.I.; project administration, S.B.; funding acquisition, M.M.I. All authors have read and agreed to the published version of the manuscript.

Funding

This research was funded by Kermanshah University of Medical Sciences grant number (980764) and the APC was funded by University of Basel.

Acknowledgments

This work was performed in partial fulfillment of the requirements for a doctorate degree in General Dentistry (Mehrdad Emami), in the Faculty of Dentistry, Kermanshah University of Medical Sciences, Kermanshah, Iran. This study was funded by the Research Council of Kermanshah University of Medical Sciences.

Conflicts of Interest

The authors declare no conflict of interest.

References

  1. Young, T.; Palta, M.; Dempsey, J.; Skatrud, J.; Weber, S.; Badr, S. The Occurrence of Sleep-Disordered Breathing among Middle-Aged Adults. N. Engl. J. Med. 1993, 328, 1230–1235. [Google Scholar] [CrossRef] [PubMed] [Green Version]
  2. Punjabi, N.M.; Sorkin, J.D.; Katzel, L.I.; Goldberg, A.P.; Schwartz, A.R.; Smith, P.L. Sleep-disordered Breathing and Insulin Resistance in Middle-aged and Overweight Men. Am. J. Respir. Crit. Care Med. 2002, 165, 677–682. [Google Scholar] [CrossRef]
  3. Tufik, S.; Santos-Silva, R.; Taddei, J.A.; Bittencourt, L.R.A. Obstructive Sleep Apnea Syndrome in the Sao Paulo Epidemiologic Sleep Study. Sleep Med. 2010, 11, 441–446. [Google Scholar] [CrossRef]
  4. Bradley, T.D.; Floras, J.S. Obstructive sleep apnoea and its cardiovascular consequences. Lancet 2009, 373, 82–93. [Google Scholar] [CrossRef]
  5. Panchasara, B.; Poots, A.J.; Davies, G. Are the Epworth Sleepiness Scale and Stop-Bang model effective at predicting the severity of obstructive sleep apnoea (OSA); in particular OSA requiring treatment? Eur. Arch. Oto-Rhino-Laryngol. 2017, 274, 4233–4239. [Google Scholar] [CrossRef] [PubMed]
  6. Farney, R.J.; Walker, B.S.; Snow, G.L.; Walker, J.M.; Farney, R.M. The STOP-Bang Equivalent Model and Prediction of Severity of Obstructive Sleep Apnea: Relation to Polysomnographic Measurements of the Apnea/Hypopnea Index. J. Clin. Sleep Med. 2011, 7, 459–465. [Google Scholar] [CrossRef] [PubMed] [Green Version]
  7. Lim, D.C.; I Pack, A. Obstructive Sleep Apnea: Update and Future. Annu. Rev. Med. 2017, 68, 99–112. [Google Scholar] [CrossRef]
  8. Gozal, D.; Kheirandish-Gozal, L. The multiple challenges of obstructive sleep apnea in children: morbidity and treatment. Curr. Opin. Pediatr. 2008, 20, 654–658. [Google Scholar] [CrossRef]
  9. Pedrosa, R.P.; Barros, I.M.L.; Drager, L.F.; Bittencourt, M.S.; Medeiros, A.K.L.; Carvalho, L.L.; Lustosa, T.C.; Carvalho, M.M.B.; Ferreira, M.N.L.; Lorenzi-Filho, G.; et al. OSA Is Common and Independently Associated With Hypertension and Increased Arterial Stiffness in Consecutive Perimenopausal Women. Chest 2014, 146, 66–72. [Google Scholar] [CrossRef]
  10. Drager, L.F.; Togeiro, S.M.; Polotsky, V.Y.; Lorenzi-Filho, G. Obstructive Sleep Apnea: a cardiometabolic risk in obesity and the metabolic syndrome. J. Am. Coll. Cardiol. 2013, 62, 569–576. [Google Scholar] [CrossRef] [Green Version]
  11. Epstein, L.J.; Kristo, D.; Strollo, P.J.; Friedman, N.; Malhotra, A.; Patil, S.P.; Ramar, K.; Rogers, R.; Schwab, R.J.; Weaver, E.M.; et al. Clinical Guideline for the Evaluation, Management and Long-term Care of Obstructive Sleep Apnea in Adults. J. Clin. Sleep Med. 2009, 5, 263–276. [Google Scholar] [PubMed]
  12. Cawthorn, W.P.; Sethi, J.K. TNF-α and adipocyte biology. FEBS lett. 2008, 582, 117–131. [Google Scholar] [CrossRef] [PubMed] [Green Version]
  13. Popa, C.; Netea, M.G.; Van Riel, P.L.C.M.; Van Der Meer, J.W.M.; Stalenhoef, A.F.H. The role of TNF-α in chronic inflammatory conditions, intermediary metabolism, and cardiovascular risk. J. Lipid Res. 2007, 48, 751–762. [Google Scholar] [CrossRef] [PubMed] [Green Version]
  14. Huang, Y.-S.; Guilleminault, C.; Hwang, F.-M.; Cheng, C.; Lin, C.-H.; Li, H.-Y.; Lee, L.-A. Inflammatory cytokines in pediatric obstructive sleep apnea. Medicine 2016, 95, e4944. [Google Scholar] [CrossRef]
  15. Lavie, L. Obstructive sleep apnoea syndrome – an oxidative stress disorder. Sleep Med. Rev. 2003, 7, 35–51. [Google Scholar] [CrossRef]
  16. Minoguchi, K.; Tazaki, T.; Yokoe, T.; Minoguchi, H.; Watanabe, Y.; Yamamoto, M.; Adachi, M. Elevated Production of Tumor Necrosis Factor-α by Monocytes in Patients With Obstructive Sleep Apnea Syndrome. Chest 2004, 126, 1473–1479. [Google Scholar] [CrossRef]
  17. Nadeem, R.; Molnar, J.; Madbouly, E.M.; Nida, M.; Aggarwal, S.; Sajid, H.; Naseem, J.; Loomba, R. Serum Inflammatory Markers in Obstructive Sleep Apnea: A Meta-Analysis. J. Clin. Sleep Med. 2013, 9, 1003–1012. [Google Scholar] [CrossRef]
  18. Wang, J.; Yu, W.; Gao, M.; Zhang, F.; Gu, C.; Yu, Y.; Wei, Y. Impact of Obstructive Sleep Apnea Syndrome on Endothelial Function, Arterial Stiffening, and Serum Inflammatory Markers: An Updated Meta-analysis and Metaregression of 18 Studies. J. Am. Hear. Assoc. 2015, 4, e002454. [Google Scholar] [CrossRef] [Green Version]
  19. Moher, D.; Shamseer, L.; Clarke, M.; Ghersi, D.; Liberati, A.; Petticrew, M.; Shekelle, P.G.; Stewart, L.A. Preferred reporting items for systematic review and meta-analysis protocols (PRISMA-P) 2015 statement. Syst. Rev. 2015, 4, 1. [Google Scholar] [CrossRef] [Green Version]
  20. Wells, G.; Shea, B.; O’Connell, D.; Peterson, J.; Welch, V.; Losos, M.; Tugwell, P. The Newcastle–Ottawa Scale (NOS) for Assessing the Quality of Non-Randomized Studies in Meta-Analysis. 2018. Available online: http://www.ohri.ca/programs/clinical_epidemiology/oxford.asp (accessed on 12 May 2017).
  21. Zintzaras, E.; Hadjigeorgiou, G.M. The role of G196A polymorphism in the brain-derived neurotrophic factor gene in the cause of Parkinson’s disease: a meta-analysis. J. Hum. Genet. 2005, 50, 560–566. [Google Scholar] [CrossRef]
  22. Higgins, J.P.T.; Thompson, S.G. Quantifying heterogeneity in a meta-analysis. Stat. Med. 2002, 21, 1539–1558. [Google Scholar] [CrossRef] [PubMed]
  23. Begg, C.B.; Mazumdar, M. Operating Characteristics of a Rank Correlation Test for Publication Bias. Biometrics 1994, 50, 1088. [Google Scholar] [CrossRef]
  24. Egger, M.; Smith, G.D.; Schneider, M.; Minder, C. Bias in meta-analysis detected by a simple, graphical test. BMJ 1997, 315, 629–634. [Google Scholar] [CrossRef] [PubMed] [Green Version]
  25. Duval, S.; Tweedie, R.L. Trim and fill: A simple funnel-plot-based method of testing and adjusting for publication bias in meta-analysis. Biometrics 2000, 56, 455–463. [Google Scholar] [CrossRef] [PubMed]
  26. Wan, X.; Wang, W.; Liu, J.; Tong, T. Estimating the sample mean and standard deviation from the sample size, median, range and/or interquartile range. BMC Med. Res. Methodol. 2014, 14, 135. [Google Scholar] [CrossRef] [Green Version]
  27. Ghiciuc, C.M.; Dima-Cozma, L.C.; Bercea, R.M.; Lupușoru, C.E.; Mihaescu, T.; Cozma, S.; Patacchioli, F.R. Imbalance in the diurnal salivary testosterone/cortisol ratio in men with severe obstructive sleep apnea: an observational study. Braz. J. Otorhinolaryngol. 2016, 82, 529–535. [Google Scholar] [CrossRef] [Green Version]
  28. Vgontzas, A.N.; Papanicolaou, D.A.; Bixler, E.O.; Kales, A.; Tyson, K.; Chrousos, G.P. Elevation of plasma cytokines in disorders of excessive daytime sleepiness: role of sleep disturbance and obesity. J. Clin. Endocrinol. Metab. 1997, 82, 1313–1316. [Google Scholar] [CrossRef]
  29. Huiguo, L.; Jin, L.; Shengdao, X.; Guanxin, S.; Zhenxiang, Z.; Yongjian, X. The change of interleukin-6 and tumor necrosis factor in patients with obstructive sleep apnea syndrome. J. Tongji Med. Univ. 2000, 20, 200–202. [Google Scholar] [CrossRef]
  30. Vgontzas, A.N.; Papanicolaou, D.A.; Bixler, E.O.; Hopper, K.; Lotsikas, A.; Lin, H.-M.; Kales, A.; Chrousos, G.P. Sleep apnea and daytime sleepiness and fatigue: relation to visceral obesity, insulin resistance, and hypercytokinemia. J. Clin. Endocrinol. Metab. 2000, 85, 1151–1158. [Google Scholar] [CrossRef]
  31. Ciftci, T.U.; Kokturk, O.; Bukan, N.; Bilgihan, A. The relationship between serum cytokine levels with obesity and obstructive sleep apnea syndrome. Cytokine 2004, 28, 87–91. [Google Scholar] [CrossRef]
  32. Imagawa, S.; Yamaguchi, Y.; Ogawa, K.; Obara, N.; Suzuki, N.; Yamamoto, M.; Nagasawa, T. Interleukin-6 and Tumor Necrosis Factor-α in Patients with Obstructive Sleep Apnea-Hypopnea Syndrome. Respiration 2004, 71, 24–29. [Google Scholar] [CrossRef] [PubMed]
  33. Tazaki, T.; Minoguchi, K.; Yokoe, T.; Samson, K.T.R.; Minoguchi, H.; Tanaka, A.; Watanabe, Y.; Adachi, M. Increased Levels and Activity of Matrix Metalloproteinase-9 in Obstructive Sleep Apnea Syndrome. Am. J. Respir. Crit. Care Med. 2004, 170, 1354–1359. [Google Scholar] [CrossRef] [PubMed]
  34. Ryan, S.; Taylor, C.T.; McNicholas, W.T. Selective Activation of Inflammatory Pathways by Intermittent Hypoxia in Obstructive Sleep Apnea Syndrome. Circulation 2005, 112, 2660–2667. [Google Scholar] [CrossRef] [PubMed] [Green Version]
  35. Kobayashi, K.; Nishimura, Y.; Shimada, T.; Yoshimura, S.; Funada, Y.; Satouchi, M.; Yokoyama, M. Effect of Continuous Positive Airway Pressure on Soluble CD40 Ligand in Patients With Obstructive Sleep Apnea Syndrome. Chest 2006, 129, 632–637. [Google Scholar] [CrossRef]
  36. Ryan, S.; Taylor, C.T.; McNicholas, W.T. Predictors of Elevated Nuclear Factor-κB–dependent Genes in Obstructive Sleep Apnea Syndrome. Am. J. Respir. Crit. Care Med. 2006, 174, 824–830. [Google Scholar] [CrossRef] [PubMed]
  37. Tam, C.S.; Wong, M.; McBain, R.; Bailey, S.; Waters, K.A. Inflammatory measures in children with obstructive sleep apnoea. J. Paediatr. Child Heal. 2006, 42, 277–282. [Google Scholar] [CrossRef] [Green Version]
  38. Bravo, M.D.L.P.; Serpero, L.D.; Barceló, A.; Barbé, F.; Agusti, A.; Gozal, D. Inflammatory proteins in patients with obstructive sleep apnea with and without daytime sleepiness. Sleep Breath. 2007, 11, 177–185. [Google Scholar] [CrossRef]
  39. Arias, M.; García-Río, F.; Alonso-Fernández, A.; Hernanz, A.; Hidalgo, R.; Martínez-Mateo, V.; Bartolomé, S.; Rodríguez-Padial, L. CPAP decreases plasma levels of soluble tumour necrosis factor-α receptor 1 in obstructive sleep apnoea. Eur. Respir. J. 2008, 32, 1009–1015. [Google Scholar] [CrossRef] [Green Version]
  40. Constantinidis, J.; Ereliadis, S.; Angouridakis, N.; Konstantinidis, I.; Vital, V.; Angouridaki, C. Cytokine changes after surgical treatment of obstructive sleep apnoea syndrome. Eur. Arch. Oto-Rhino-Laryngol. 2008, 265, 1275–1279. [Google Scholar] [CrossRef]
  41. Kanbay, A.; Kokturk, O.; Ciftci, T.U.; Tavil, Y.; Bukan, N. Comparison of Serum Adiponectin and Tumor Necrosis Factor-Alpha Levels between Patients with and without Obstructive Sleep Apnea Syndrome. Respiration 2008, 76, 324–330. [Google Scholar] [CrossRef]
  42. Li, A.M.; Lam, H.S.; Chan, M.H.M.; So, H.K.; Ng, S.K.; Chan, I.H.S.; Lam, C.W.K.; Wing, Y.K. Inflammatory cytokines and childhood obstructive sleep apnoea. Ann. Acad. Med. Singap. 2008, 37. [Google Scholar]
  43. Tomiyama, H.; Okazaki, R.; Inoue, D.; Ochiai, H.; Shiina, K.; Takata, Y.; Hashimoto, H.; Yamashina, A. Link between obstructive sleep apnea and increased bone resorption in men. Osteoporos. Int. 2008, 19, 1185–1192. [Google Scholar] [CrossRef] [PubMed]
  44. Carneiro, G.; Togeiro, S.M.; Ribeiro-Filho, F.F.; Truksinas, E.; Ribeiro, A.B.; Zanella, M.T.; Tufik, S. Continuous Positive Airway Pressure Therapy Improves Hypoadiponectinemia in Severe Obese Men With Obstructive Sleep Apnea Without Changes in Insulin Resistance. Metab. Syndr. Relat. Disord. 2009, 7, 537–542. [Google Scholar] [CrossRef] [PubMed]
  45. Li, Y.; Chongsuvivatwong, V.; Geater, A.F.; Liu, A. Exhaled breath condensate cytokine level as a diagnostic tool for obstructive sleep apnea syndrome. Sleep Med. 2009, 10, 95–103. [Google Scholar] [CrossRef]
  46. Thomopoulos, C.; Tsioufis, C.; Dimitriadis, K.; Tsiachris, D.; Tousoulis, D.; Manolis, A.; Alchanatis, M.; Kallikazaros, I.; Stefanadis, C. Obstructive sleep apnoea syndrome is associated with enhanced sub-clinical inflammation and asymmetric dimethyl-arginine levels in hypertensives. J. Hum. Hypertens. 2008, 23, 65–67. [Google Scholar] [CrossRef] [PubMed] [Green Version]
  47. Sahlman, J.; Miettinen, K.; Peuhkurinen, K.; Seppä, J.; Peltonen, M.; Herder, C.; Punnonen, K.; Vanninen, E.; Gylling, H.; Partinen, M.; et al. The activation of the inflammatory cytokines in overweight patients with mild obstructive sleep apnoea. J. Sleep Res. 2009, 19, 341–348. [Google Scholar] [CrossRef] [PubMed]
  48. Steiropoulos, P.; Papanas, N.; Nena, E.; Antoniadou, M.; Serasli, E.; Papoti, S.; Hatzizisi, O.; Kyriazis, G.; Tzouvelekis, A.; Maltezos, E.; et al. Inflammatory Markers in Middle-Aged Obese Subjects: Does Obstructive Sleep Apnea Syndrome Play a Role? Mediat. Inflamm. 2010, 2010, 1–6. [Google Scholar] [CrossRef]
  49. Saraç, F.; Basoglu, O.K.; Gunduz, C.; Bayrak, H.; Avci, C.B.; Akcicek, F. Association of osteopontin and tumor necrosis factor-? levels with insulin resistance in obese patients with obstructive sleep apnea syndrome. J. Endocrinol. Investig. 2010, 34, 528–533. [Google Scholar]
  50. Fornadi, K.; Lindner, A.; Czira, M.E.; Szentkirályi, A.; Lazar, A.S.; Zoller, R.; Turanyi, C.Z.; Veber, O.; Novak, M.; Mucsi, I.; et al. Lack of association between objectively assessed sleep disorders and inflammatory markers among kidney transplant recipients. Int. Urol. Nephrol. 2011, 44, 607–617. [Google Scholar] [CrossRef]
  51. Medeiros, C.A.M.; De Bruin, V.M.S.; Andrade, G.M.; Coutinho, W.M.; De Castro-Silva, C.; De Bruin, P.F.C. Obstructive sleep apnea and biomarkers of inflammation in ischemic stroke. Acta Neurol. Scand. 2011, 126, 17–22. [Google Scholar] [CrossRef]
  52. Qian, X.; Yin, T.; Li, T.; Kang, C.; Guo, R.; Sun, B.; Liu, C. High Levels of Inflammation and Insulin Resistance in Obstructive Sleep Apnea Patients with Hypertension. Inflammation 2012, 35, 1507–1511. [Google Scholar] [CrossRef] [PubMed]
  53. Alexopoulos, E.I.; Theologi, V.; Malakasioti, G.; Maragozidis, P.; Tsilioni, I.; Chrousos, G.; Gourgoulianis, K.; Kaditis, A.G. Obstructive Sleep Apnea, Excessive Daytime Sleepiness, and Morning Plasma TNF-α Levels in Greek Children. Sleep 2013, 36, 1633–1638. [Google Scholar] [CrossRef] [PubMed] [Green Version]
  54. Chen, P.-C.; Guo, C.-H.; Tseng, C.-J.; Wang, K.-C.; Liu, P.-J. Blood trace minerals concentrations and oxidative stress in patients with obstructive sleep apnea. J. Nutr. Heal. Aging 2013, 17, 639–644. [Google Scholar] [CrossRef] [PubMed]
  55. Chu, L.; Li, Q. The evaluation of adenotonsillectomy on TNF-α and IL-6 levels in obese children with obstructive sleep apnea. Int. J. Pediatr. Otorhinolaryngol. 2013, 77, 690–694. [Google Scholar] [CrossRef]
  56. Hargens, T.A.; Guill, S.G.; Kaleth, A.S.; Nickols-Richardson, S.M.; E Miller, L.; Zedalis, D.; Gregg, J.M.; Gwazdauskas, F.; Herbert, W.G. Insulin resistance and adipose-derived hormones in young men with untreated obstructive sleep apnea. Sleep Breath. 2012, 17, 403–409. [Google Scholar] [CrossRef]
  57. Matos, G.; Hirotsu, C.; Alvarenga, T.A.; Cintra, F.D.; Bittencourt, L.R.A.; Tufik, S.; Andersen, M.L. The association between TNF-α and erectile dysfunction complaints. Andrology 2013, 1, 872–878. [Google Scholar] [CrossRef]
  58. Luo, Q.; Yang, D.; Liu, Z. Plasma ghrelin and pro-inflammatory markers in patients with obstructive sleep apnea and stable coronary heart disease. Med. Sci. Monit. 2013, 19, 251–256. [Google Scholar] [CrossRef] [Green Version]
  59. Ciccone, M.; Scicchitano, P.; Zito, A.; Cortese, F.; Boninfante, B.; Falcone, V.A.; Quaranta, V.N.; Ventura, V.A.; Zucano, A.; Di Serio, F.; et al. Correlation between Inflammatory Markers of Atherosclerosis and Carotid Intima-Media Thickness in Obstructive Sleep Apnea. Molecules 2014, 19, 1651–1662. [Google Scholar] [CrossRef]
  60. Sun, L.; Chen, R.; Wang, J.; Zhang, Y.-L.; Li, J.; Peng, W.; Liu, C. Association between inflammation and cognitive function and effects of continuous positive airway pressure treatment in obstructive sleep apnea hypopnea syndrome. Zhonghua yi xue za zhi 2014, 94, 3483–3487. [Google Scholar]
  61. Doğan, F.Ü.; Yosunkaya, Ş.; Okur, H.K.; Can, Ü. Relationships between Obstructive Sleep Apnea Syndrome, Continuous Positive Airway Pressure Treatment, and Inflammatory Cytokines. Sleep Disord. 2014, 2014, 1–6. [Google Scholar] [CrossRef]
  62. Chen, B.; Zhang, W.; Chen, Y.; Hu, C.; Bian, H.; He, J.; Ji, L.; Zhu, S. Association of obstructive sleep apnea hypopnea syndrome with carotid atherosclerosis and the efficacy of continuous positive airway pressure treatment. Zhonghua yi xue za zhi 2015, 95, 2791–2795. [Google Scholar]
  63. De Santis, S.; Cambi, J.; Tatti, P.; Bellussi, L.; Passali, D. Changes in ghrelin, leptin and pro-inflammatory cytokines after therapy in Obstructive Sleep Apnea Syndrome (OSAS) patients. Otolaryngol. Polska 2015, 69, 1–10. [Google Scholar] [CrossRef] [PubMed] [Green Version]
  64. Jiang, H.; Cao, H.; Wang, P.; Liu, W.; Cao, F.; Chen, J. Tumour necrosis factor-α/interleukin-10 ratio in patients with obstructive sleep apnoea hypopnoea syndrome. J. Laryngol. Otol. 2014, 129, 73–78. [Google Scholar] [CrossRef] [PubMed] [Green Version]
  65. Thunström, E.; Glantz, H.; Fu, M.; Yucel-Lindberg, T.; Petzold, M.; Lindberg, K.; Peker, Y. Increased Inflammatory Activity in Nonobese Patients with Coronary Artery Disease and Obstructive Sleep Apnea. Sleep 2015, 38, 463–471. [Google Scholar] [CrossRef] [Green Version]
  66. Gaines, J.; Vgontzas, A.N.; Fernandez-Mendoza, J.; Calhoun, S.L.; He, F.; Liao, D.; Sawyer, M.; Bixler, E.O. Inflammation mediates the association between visceral adiposity and obstructive sleep apnea in adolescents. Am. J. Physiol. Metab. 2016, 311, E851–E858. [Google Scholar] [CrossRef]
  67. Lin, C.-C.; Liaw, S.-F.; Chiu, C.-H.; Chen, W.-J.; Lin, M.-W.; Chang, F.-T. Effects of nasal CPAP on exhaled SIRT1 and tumor necrosis factor-α in patients with obstructive sleep apnea. Respir. Physiol. Neurobiol. 2016, 228, 39–46. [Google Scholar] [CrossRef]
  68. Nizam, N.; Basoglu, O.K.; Taşbakan, M.S.; Lappin, D.F.; Buduneli, N.; Başoǧlu, Ö.K. Is there an association between obstructive sleep apnea syndrome and periodontal inflammation? Clin. Oral Investig. 2015, 20, 659–668. [Google Scholar] [CrossRef]
  69. Vicente, E.; Marin, J.M.; Carrizo, S.J.; Osuna, C.S.; González, R.; Marin-Oto, M.; Forner, M.; Vicente, P.; Cubero, P.; Gil, A.V.; et al. Upper airway and systemic inflammation in obstructive sleep apnoea. Eur. Respir. J. 2016, 48, 1108–1117. [Google Scholar] [CrossRef] [Green Version]
  70. Hirotsu, C.; Albuquerque, R.G.; Nogueira, H.; Hachul, H.; Bittencourt, L.R.A.; Tufik, S.; Andersen, M.L. The relationship between sleep apnea, metabolic dysfunction and inflammation: The gender influence. Brain, Behav. Immun. 2017, 59, 211–218. [Google Scholar] [CrossRef]
  71. Ji, Y.-L.; Xue, J.; Xu, J.; Zhou, Z.; Ji, Y. Efficacy of continuous positive airway pressure treatment in treating obstructive sleep apnea hypopnea syndrome associated with carotid arteriosclerosis. Exp. Ther. Med. 2017, 14, 6176–6182. [Google Scholar] [CrossRef] [Green Version]
  72. Jin, F.; Liu, J.; Zhang, X.; Cai, W.; Zhang, Y.; Zhang, W.; Yang, J.; Lu, G.; Zhang, X. Effect of continuous positive airway pressure therapy on inflammatory cytokines and atherosclerosis in patients with obstructive sleep apnea syndrome. Mol. Med. Rep. 2017, 16, 6334–6339. [Google Scholar] [CrossRef] [PubMed]
  73. Smith, D.; Hossain, M.; Hura, A.; Huang, G.; McConnell, K.; Ishman, S.L.; Amin, R. Inflammatory Milieu and Cardiovascular Homeostasis in Children With Obstructive Sleep Apnea. Sleep 2017, 40. [Google Scholar] [CrossRef] [PubMed] [Green Version]
  74. Zhang, Z.; Wang, C. Immune status of children with obstructive sleep apnea/hypopnea syndrome. Pak. J. Med. Sci. 2017, 33, 195–199. [Google Scholar] [CrossRef] [PubMed]
  75. Bozic, J.; Borovac, J.A.; Galic, T.; Kurir, T.T.; Supe-Domic, D.; Đogaš, Z. Adropin and Inflammation Biomarker Levels in Male Patients With Obstructive Sleep Apnea: A Link With Glucose Metabolism and Sleep Parameters. J. Clin. Sleep Med. 2018, 14, 1109–1118. [Google Scholar] [CrossRef] [PubMed] [Green Version]
  76. Kong, Y.; Li, Z.; Tang, T.; Wu, H.; Liu, J.; Gu, L.; Zhao, T.; Huang, Q. The level of lipopolysaccharide-binding protein is elevated in adult patients with obstructive sleep apnea. BMC Pulm. Med. 2018, 18, 90. [Google Scholar] [CrossRef] [PubMed] [Green Version]
  77. Rogers, V.E.; Bollinger, M.E.; Tulapurkar, M.E.; Zhu, S.; Hasday, J.D.; Pereira, K.D.; Scharf, S.M. Inflammation and asthma control in children with comorbid obstructive sleep apnea. Pediatr. Pulmonol. 2018, 53, 1200–1207. [Google Scholar] [CrossRef]
  78. Ming, H.; Tian, A.; Liu, B.; Hu, Y.; Liu, C.; Chen, R.; Cheng, L. Inflammatory cytokines tumor necrosis factor-α, interleukin-8 and sleep monitoring in patients with obstructive sleep apnea syndrome. Exp. Ther. Med. 2019, 17, 1766–1770. [Google Scholar] [CrossRef] [Green Version]
  79. Tang, T.; Huang, Q.; Liu, J.; Zhou, X.; Du, J.; Wu, H.; Li, Z. Oxidative stress does not contribute to the release of proinflammatory cytokines through activating the Nod-like receptor protein 3 inflammasome in patients with obstructive sleep apnoea. Sleep Breath 2018, 23, 535–542. [Google Scholar] [CrossRef]
  80. Galati, D.; Zanotta, S.; Canora, A.; Polistina, G.E.; Nicoletta, C.; Ghinassi, G.; Ciasullo, E.; Bocchino, M. Severe depletion of peripheral blood dendritic cell subsets in obstructive sleep apnea patients: A new link with cancer? Cytokine 2019, 125, 154831. [Google Scholar] [CrossRef]
  81. Ferrari, R. THE role of TNF in cardiovascular disease. Pharmacol. Res. 1999, 40, 97–105. [Google Scholar] [CrossRef] [PubMed]
  82. Matthys, P.; Billiau, A. Cytokines and cachexia. Nutrition 1997, 13, 763–770. [Google Scholar] [CrossRef]
  83. Drager, L.F.; Polotsky, V.Y.; Lorenzi-Filho, G. Obstructive sleep apnea: an emerging risk factor for atherosclerosis. Chest 2011, 140, 534–542. [Google Scholar] [CrossRef] [PubMed] [Green Version]
  84. Naldini A, Carraro F, Silvestri S, Bocci V. Hypoxia affects cytokine production and proliferative responses by human peripheral mononuclear cells. J. Cell. Physiol. 1997, 173, 335–342. [Google Scholar] [CrossRef]
  85. Hempel, S.L.; Monick, M.M.; Hunninghake, G.W. Effect of hypoxia on release of IL-1 and TNF by human alveolar macrophages. Am. J. Respir. Cell Mol. Boil. 1996, 14, 170–176. [Google Scholar] [CrossRef] [PubMed]
  86. IImani, M.M.; Sadeghi, M.; Khazaie, H.; Emani, M.; Sadeghi Bahmani, D.; Brand, S. Evaluation of serum and plasma interleukin-6 levels in obstructive sleep apnea syndrome (OSAS): a meta-analysis and meta-regression. Front. Immunol. 2020, in press. [Google Scholar]
  87. Cameron, F.L.; Altowati, M.A.; Rogers, P.; McGrogan, P.; Anderson, N.; Bisset, W.M.; Ahmed, S.F.; Wilson, D.C.; Russell, R.K. Disease Status and Pubertal Stage Predict Improved Growth in Antitumor Necrosis Factor Therapy for Pediatric Inflammatory Bowel Disease. J. Pediatr. Gastroenterol. Nutr. 2017, 64, 47–55. [Google Scholar] [CrossRef] [PubMed] [Green Version]
  88. Han, Y.; Liu, Y.; Zhao, Z.; Zhen, S.; Chen, J.; Ding, N.; Ma, Y.; Wen, D. Does Physical Activity-Based Intervention Improve Systemic Proinflammatory Cytokine Levels in Overweight or Obese Children and Adolescents? Insights from a Meta-Analysis of Randomized Control Trials. Obes Facts 2019, 12, 653–668. [Google Scholar] [CrossRef]
Figure 1. Flowchart of the study selection.
Life 10 00087 g001
Figure 2. Forest plot of serum tumor necrosis factor alpha levels in adult participants with obstructive sleep apnea syndrome patients compared to controls.
Life 10 00087 g002
Figure 3. Forest plot of plasma tumor necrosis factor alpha levels in adult participants with obstructive sleep apnea syndrome patients compared to controls.
Life 10 00087 g003
Figure 4. Forest plot of serum tumor necrosis factor alpha levels in pediatric participants with obstructive sleep apnea syndrome patients compared to controls.
Life 10 00087 g004
Figure 5. Forest plot of plasma tumor necrosis factor alpha levels in pediatric participants with obstructive sleep apnea syndrome patients compared to controls.
Life 10 00087 g005
Figure 6. Funnel plot of analysis of tumor necrosis factor alpha levels in adult participants on (A) serum and (B) plasma in adult participants. Open circles represent observed studies. Black circles represent imputed studies. Open diamond represents the pooled effects from the original studies. Black diamond represents the pooled effects incorporating the imputed studies.
Life 10 00087 g006
Table 1. Characteristics of studies included in the meta-analysis (n = 55).
First Author, YearCountryEthnicityNo. of OSAS/ControlOSAS PatientsControlsSample
Age (Years)BMI (kg/m2)AHI (Events/h)Age (Years)BMI (kg/m2)AHI (Events/h)
Adults
Vgontzas, 1997 [28]USAMixed12/1040.9 ± 2.240.5 ± 3.263.7 ± 10.324.1 ± 0.824.6 ± 0.70 ± 0Plasma
Huiguo, 2000 [29]ChinaAsian22/1647.4 ± 13.627.6 ± 3.344.0 ± 21.047.6 ± 14.723.1 ± 34.29 ± 2.16Plasma
Vgontzas, 2000 [30]USAMixed14/2346.6 ± 3.038.4 ± 1.648.7 ± 5.643.6 ± 2.530.7 ± 1.560.88 ± 0.4Plasma
Ciftci, 2004 [31]TurkeyCaucasian43/2249.6 ± 9.131.9 ± 4.133.2 ± 5.047.2 ± 10.331.03 ± 3.11.55 ± 0.96Serum
Imagawa, 2004 [32]JapanAsian118/47Adult27.7 ± 4.4≥5Adult22.9 ± 2.9<5Serum
Minoguchi, 2004 [16]JapanAsian24/2750.1 ± 11.729.1 ± 2.234.1 ± 14.748.11 ± 10.525.3 ± 1.252.27 ± 1.95Serum
Tazaki, 2004 [33]JapanAsian48/1850.6 ± 4.828.9 ± 1.636.05 ± 1.7548.2 ± 3.027.8 ± 0.83.7 ± 0.4Serum
Ryan, 2005 [34]IrelandCaucasian19/1739.5 ± 2032.32 ± 16.0749.6 ± 25.2539.5 ± 19.531.05 ± 15.551.03 ± 0.52Serum
Kobayashi, 2006 [35]JapanAsian35/1651.4 ± 13.127.9 ± 3.652.26 ± 14.7641 ± 13.127.4 ± 3.7<5Serum
Ryan, 2006 [36]IrelandCaucasian66/3042.5 ± 8.532.5 ± 4.835.0 ± 13.941 ± 830.7 ± 3.11.2 ± 1.0Serum
de la Peña Bravo, 2007 [38]USAMixed50/2051.7 ± 1.933.2 ± 1.751.3 ± 4.247.4 ± 1.228.4 ± 0.62.5 ± 0.5Serum
Arias, 2008 [39]SpainCaucasian30/1552.0 ± 13.030.5 ± 4.043.8 ± 27.048.0 ± 10.028.7 ± 4.73.7 ± 3.3Plasma
Constantinidis, 2008 [40]GreeceCaucasian24/2745.1 ± 8.2≥2523.3 ± 3.645.1 ± 8.2≥253.5 ± 0.4Serum
Kanbay, 2008 [41]TurkeyCaucasian106/3251.39 ± 10.3731.06 ± 5.8740.14 ± 14.3044.79 ± 13.3528.25 ± 5.491.96 ± 1.08Serum
Tomiyama, 2008 [43]JapanAsian50/1551.4 ± 13.026.9 ± 4.242.7 ± 27.953.0 ± 10.024.3 ± 2.5<5Plasma
Carneiro, 2009 [44]BrazilMixed16/1340.1 ± 2.846.9 ± 2.065.7 ± 9.938.8 ± 3.342.8 ± 1.33.2 ± 0.5Plasma
Li, 2009 [45]ChinaAsian68/2245.3 ± 11.120.7 ± 10.138.9 ± 26.543.0 ± 93.023.3 ± 2.02.9 ± 1.3Serum
Thomopoulos, 2009 [46]GreeceCaucasian62/7048.1 ± 7.631.9 ± 4.931.6 ± 2.048.1 ± 3.932.1 ± 3.00.4 ± 4.0Serum
Sahlman, 2010 [47]FinlandCaucasian84/4050.4 ± 9.332.5 ± 3.39.6 ± 2.945.6 ± 11.531.5 ± 3.51.9 ± 1.4Plasma
Steiropoulos, 2010 [48]GreeceCaucasian38/2345.5 ± 10.536.4 ± 7.461.0 ± 27.043.7 ± 6.734.5 ± 3.75.3 ± 3.2Serum
Sarac, 2011 [49]TurkeyCaucasian62/2650.0 ± 19.733.7 ± 4.229.5 ± 1.949.7 ± 11.134.3 ± 5.4<5Plasma
Fornadi, 2012 [50]CanadaMixed25/7554.0 ± 12.029.0 ± 5.0≥550.0 ± 13.026.0 ± 5.0<5Serum
Medeiros, 2012 [51]BrazilMixed50/1562.3 ± 7.825.5 ± 4.0≥562.50 ± 8.425.8 ± 4.0<5Serum
Qian, 2012 [52]ChinaAsian70/4045.8 ± 8.228.9 ± 2.3≥546.3 ± 8.124.1 ± 2.3<5Serum
Chen, 2013 [54]ChinaAsian44/2021.4 ± 11.9527.12 ± 3.5314.56 ± 2.8542 ± 1126.0 ± 3.33.3 ± 0.9Plasma
Hargens, 2013 [56]USAMixed12/3322.8 ± 0.832.4 ± 1.025.4 ± 5.421.9 ± 0.629.3 ± 0.52.1 ± 0.3Serum
Matos, 2013 [57]BrazilMixed119/18751.229.7≥540.724.5<5Plasma
Yang, 2013 [58]ChinaAsian50/2553.5 ± 6.927.4 ± 2.924.5 ± 15.953.0 ± 7.026.27 ± 1.93.0 ± 1.0Plasma
Ciccone, 2014 [59]ItalyCaucasian80/4052.8 ± 10.628.6 ± 3.033.9 ± 2152.3 ± 10.528.2 ± 2.72.1 ± 1.1Plasma
Sun, 2014 [60]ChinaAsian121/1843.3 ± 11.627.1 ± 3.140.8 ± 10.943.9 ± 13.425.7 ± 3.82.1 ± 1.8Serum
Unuvar Dogan, 2014 [61]TurkeyCaucasian33/2445.3 ± 8.531.0 ± 1.747.2 ± 23.240.5 ± 9.530.7 ± 1.53.6 ± 1.8Serum
Chen, 2015 [62]ChinaAsian93/2842.28 ± 8.5528.84 ± 3.8227 ± 4.0643.7 ± 9.826.4 ± 2.52.6 ± 1.2Plasma
De, 2015 [63]ItalyCaucasian26/2441.8 ± 7.433.0 ± 5.226.15 ± 12.143.7 ± 8.230.8 ± 4.31.65 ± 0.9Serum
Jiang, 2015 [64]ChinaAsian135/9448.7 ± 12.127.48 ± 2.5624.57 ± 15.947.2 ± 13.527.52 ± 2.581.60 ± 1.61Serum
Thunström, 2015 [65]SwedenCaucasian234/9565.3 ± 7.126.8 ± 2.128.9 ± 13.761.4 ± 9.525.2 ± 2.53.1 ± 1.3Serum
Lin, 2016 [67]TaiwanAsian35/2046 ± 729.2 ± 1.959.3 ± 23.243 ± 828.2 ± 1.63.6 ± 0.8Serum
Nizam, 2016 [68]TurkeyCaucasian39/1347.3 ± 10.433.2 ± 56.445.6 ± 20.743.23 ± 9.0831.71 ± 4.562.64 ± 1.82Serum
Vicente, 2016 [69]SpainCaucasian89/2645.33 ± 14.8130.03 ± 5.0428 ± 23.7045 ± 11.1128.7 ± 4.371.9 ± 2.7Plasma
Hirotsu, 2017 [70]BrazilMixed339/68250.8 ± 13.229.6 ± 5.819.3 ± 9.4438.2 ± 12.725.4 ± 3.82.5 ± 10.4Serum
Jiang, 2017 [71]ChinaAsian120/4024.82 ± 10.728.5 ± 5.1346.6 ± 4.5646.5 ± 12.327.5 ± 6.22.13 ± 1.26Plasma
Jin, 2017 [72]ChinaAsian100/5055.28 ± 7.1326.75 ± 3.5038.01 ± 8.0456.13 ± 6.2125.19 ± 2.453.62 ± 1.54Plasma
Bozic, 2018 [75]CroatiaCaucasian50/2553.0 ± 11.928.9 ± 2.735.0 ± 11.052.5 ± 10.227.8 ± 2.2<5Plasma
Kong, 2018 [76]ChinaAsian50/4054.34 ± 14.3826.86 ± 3.1237.34 ± 19.0250.42 ± 8.3522.26 ± 3.543.31 ± 1.09Serum
Ming, 2019 [78]ChinaAsian684/19251.34 ± 5.16≤3031.15 ± 9.1252.18 ± 4.51≤304.34 ± 2.01Serum
Tang, 2019 [79]ChinaAsian120/12748.88 ± 9.7626.86 ± 3.1239.00 ± 18.3847.37 ± 9.1222.46 ± 3.293.31 ± 1.09Serum
Galati, 2020 [80]ItalyCaucasian45/3053.9 ± 11.628 ± 2.2≥555 ± 5.826.3 ± 1.8<5Serum
Pediatrics
Tam, 2006 [37]AustraliaMixed44/697.3 ± 3.719.4 ± 5.55.3 ± 6.57.6 ± 4.017.9 ± 3.90 ± 0Serum
Li, 2008 [42]ChinaAsian47/9511.1 ± 1.27NR14.1 ± 8.010.7 ± 1.3NR0.7 ± 0.6Serum
Alexopoulos, 2013 [53]GreeceCaucasian24/445.7 ± 2<2511.5 ± 5.16.4 ± 2.3<251.3 ± 0.65Plasma
Chu, 2013 [55]ChinaAsian55/35ChildNR≥5ChildNR<5Plasma
Gaines, 2016 [66]USAMixed44/34818.41 ± 2.2NR12.08 ± 4.6418.4 ± 2.2NR1.65 ± 4.81Plasma
Huang, 2016 [14]TaiwanAsian47/327.84 ± 0.5616.95 ± 0.479.13 ± 1.677.02 ± 0.656.55 ± 0.580.41 ± 0.07Plasma
Smith, 2017 [73]USAMixed33/989.0 ± 2.723.4 ± 13.515.2 ± 11.719.66 ± 4.449.68 ± 2.51.03 ± 0.46Plasma
Zhang, 2017 [74]ChinaAsian50/526.6NR≥56.4NR<5Serum
Rogers, 2018 [77]USAMixed20/77.9 ± 2.2<2513.1 ± 9.87.9 ± 2.2<250.8 ± 0.3Serum
NR, Not reported; OSAS, Obstructive sleep apnea syndrome; AHI, Apnea-hypopnea index; BMI, Body mass index.
Table 2. Subgroup analysis on serum and plasma levels of tumor necrosis factor alpha in adult participants.
Subgroup Analysis of Serum Level (n)MD (95%CI), p-Value, I2 (%), PhSubgroup Analysis of Plasma Level (n)MD (95%CI), p-Value, I2 (%), Ph
Overall (29)10.22 (8.86, 11.58), <0.00001; 100, <0.00001Overall (17)5.41 (3.66, 7.15), <0.00001, 99, <0.00001
Ethnicity-Ethnicity-
Caucasian (12)2.20 (1.06, 3.34),0.0002, 94, <0.00001Caucasian (6)3.72 (1.04, 6.40), 0.007, 99, <0.00001
Asian (12)37.11 (33.27, 40.95), <0.00001, 100, <0.00001Asian (7)14.92 (9.86, 19.98), <0.00001, 100, <0.00001
Mixed (5)0.43 (0.30, 0.56), <0.00001, 26, 0.25Mixed (4)1.22 (0.10, 2.34), 0.03, 93, <0.00001
Mean BMI of OSAS patients, kg/m2-Mean BMI of OSAS patients, kg/m2-
>30 (11)1.27 (0.67, 1.86), <0.0001, 95, <0.000001>30 (7)1.06 (0.34, 1.78), 0.004, 91, <0.00001
≤30 (17)23.07 (20.18, 25.96), <0.00001, 100, <0.00001≤30 (10)10.82 (7.14, 14.49), <0.00001, 99, <0.00001
Mean BMI of controls, kg/m2-Mean BMI of controls, kg/m2-
>30 (8)2.28 (0.86, 3.70), 0.002, 95, <0.00001>30 (4)1.19 (0.00, 2.38), 0.05, 92, <0.00001
≤30 (20)18.64 (16.33, 20.95), <0.00001, 100, <0.00001≤30 (13)7.32 (5.02, 9.62), <0.00001, 99, <0.00001
Total number of participants -Total number of participants-
>100 (10)55.47 (47.21, 63.72), <0.00001, 100, <0.00001>100 (7)6.91 (2.20, 11.63), 0.004, 100, <0.00001
≤100 (19)2.15 (1.57, 2.72), <0.00001, 98, <0.00001≤100 (10)2.87 (1.37, 4.37), 0.0002, 98, <0.00001
Mean AHI of OSAS patients, events/h-Mean AHI of OSAS patients, events/h-
>30 (18)5.72 (4.32, 7.12), <0.00001, 100, <0.00001>30 (10)8.15 (5.59, 10.71), <0.00001, 99, <0.00001
≤30 (6)127.01 (100.56, 153.47), <0.00001, 100, <0.00001≤30 (6)2.97 (0.21, 5.73), 0.03, 99, <0.00001
BMI, Body mass index; CI, Confidence interval; OSAS, Obstructive sleep apnea syndrome; MD, Mean difference; Ph, Pheterogeneity. Bold numbers show statistically significant value (p-value < 0.05).
Table 3. Subgroup analysis on serum and plasma levels of tumor necrosis factor alpha in adult Caucasian participants.
Subgroup Analysis of Serum Level (n)MD (95%CI), p-Value, I2 (%), PhSubgroup Analysis of Plasma Level (n)MD (95%CI), p-Value, I2 (%), Ph
Overall (12)2.20 (1.06, 3.34), 0.0002, 94, <0.00001Overall (6)3.72 (1.04, 6.40), 0.007, 99, <0.00001
Mean BMI of OSAS patients, kg/m2-Mean BMI of OSAS patients, kg/m2-
>30 (9)2.58 (1.07, 4.10), 0.0008, 95, <0.00001>30 (4)0.43 (−0.010, 0.96), 0.11, 50, 0.11
≤30 (2)1.70 (−0.32, 3.71), 0.10, 82, 0.02≤30 (2)7.99 (1.84, 14.15), 0.01, 98, <0.00001
Mean BMI of controls, kg/m2-Mean BMI of controls, kg/m2-
>30 (8)2.28 (0.86, 3.70), 0.002, 95, <0.00001>30 (2)0.56 (0.05, 1.08), 0.03, 18, 27
≤30 (3)3.29 (−1.09, 7.67), 0.14, 93, <0.00001≤30 (4)5.64 (0.77, 10.52), 0.02, 99, <0.00001
Total number of participants -Total number of participants-
>100 (3)1.13 (−0.78, 3.04), 0.25, 91, <0.0001>100 (3)3.82 (−0.22, 7.85), 0.06, 99, <0.00001
≤100 (9)3.21 (1.37, 5.05), 0.0006, 95, <0.00001≤100 (3)3.52 (0.03, 7.02), 0.05, 95, <0.00001
Mean AHI of OSAS patients, events/h-Mean AHI of OSAS patients, events/h-
>30 (8)1.40 (0.34, 2.46), 0.010, 91, <0.00001>30 (3)7.80 (2.47, 13.13), 0.004, 97, <0.00001
≤30 (2)23.20 (−28.02, 74.41), 0.37, 85, 0.01≤30 (3)0.26 (−0.01, 0.53), 0.06, 34, 0.22
BMI, Body mass index; CI, Confidence interval; OSAS, Obstructive sleep apnea syndrome; MD, Mean difference; Ph, Pheterogeneity. Bold numbers show statistically significant value (p-value < 0.05).
Table 4. Subgroup analysis on serum and plasma levels of tumor necrosis factor alpha in adult Asian participants.
Subgroup Analysis of Serum Level (n)MD (95%CI), p-Value, I2 (%), PhSubgroup Analysis of Plasma Level (n)MD (95%CI), p-Value, I2 (%), Ph
Overall (12)37.11 (33.27, 40.95), <0.00001, 100, <0.00001Overall (7)14.92 (9.86, 19.98), <0.00001, 100, <0.00001
Mean BMI of OSAS patients, kg/m2-Mean BMI of OSAS patients, kg/m2-
>30 (0)->30 (0)-
≤30 (12)37.11 (33.27, 40.95), <0.00001, 100, <0.00001≤30 (7)14.92 (9.86, 19.98), <0.00001, 100, <0.00001
Mean BMI of controls, kg/m2-Mean BMI of controls, kg/m2-
>30 (0)->30 (0)-
≤30 (12)37.11 (33.27, 40.95), <0.00001, 100, <0.00001≤30 (7)14.92 (9.86, 19.98), <0.00001, 100, <0.00001
Total number of participants -Total number of participants-
>100 (6)89.88 (74.59, 105.17), <0.00001, 100, <0.00001>100 (3)12.34 (7.84, 16.84), <0.00001, 97, <0.00001
≤100 (6)7.80 (5.76, 9.85), <0.00001, 99, <0.00001≤100 (4)21.51 (13.15, 29.87), <0.00001, 99, <0.00001
Mean AHI of OSAS patients, events/h-Mean AHI of OSAS patients, events/h-
>30 (9)12.94 (7.74, 18.13), <0.00001, 100, <0.00001>30 (4)12.48 (17.04, 31.52), <0.00001, 100, <0.00001
≤30 (0)-≤30 (3)5.45 (−3.55, 14.45), 0.24, 99, <0.00001
BMI, Body mass index; CI, Confidence interval; OSAS, Obstructive sleep apnea syndrome; MD, Mean difference; Ph, Pheterogeneity. Bold numbers show statistically significant value (p-value < 0.05).
Table 5. Subgroup analysis on serum and plasma levels of tumor necrosis factor alpha in adult participants including mean BMI of OSAS patients >30 kg/m2.
Subgroup Analysis of Serum Level (n)MD (95%CI), p-Value, I2 (%), PhSubgroup Analysis of Plasma Level (n)MD (95%CI), p-Value, I2 (%), Ph
Overall (11)1.27 (0.67, 1.86), <0.0001, 95, <0.000001Overall (7)1.06 (0.34, 1.78), 0.004, 91, <0.00001
Mean BMI of controls, kg/m2-Mean BMI of controls, kg/m2-
>30 (8)2.28 (0.86, 3.70), 0.002, 95, <0.00001>30 (4)1.19 (0.00, 2.38), 0.05, 92, <0.00001
≤30 (3)40.64 (−24.23, 105.51), 0.22, 92, <0.00001≤30 (3)0.88 (−0.30, 2.07), 0.14, 93, <0.00001
Total number of participants -Total number of participants-
>100 (2)34.66 (−34.62, 103.93), 0.33, 95, <0.00001>100 (2)0.20 (−0.09, 0.48), 0.17, 0, 0.53
≤100 (9)1.27 (0.65, 1.89), <0.0001, 95, <0.00001≤100 (5)1.51 (0.53, 2.49), 0.003, 90, <0.00001
Mean AHI of OSAS patients, events/h-Mean AHI of OSAS patients, events/h-
>30 (9)0.96 (0.50, 1.42), <0.0001, 92, <0.00001>30 (4)1.69 (0.47, 2.90), 0.007, 92, <0.00001
≤30 (2)42.13 (33.48, 50.77), <0.00001, 0, 0.58≤30 (3)0.26 (−0.01, 0.53), 0.06, 34, 0.22
BMI, Body mass index; CI, Confidence interval; OR, OSAS, Obstructive sleep apnea syndrome; MD, Mean difference; Ph, Pheterogeneity. Bold numbers show statistically significant value (p-value < 0.05).
Table 6. Subgroup analysis on serum and plasma levels of tumor necrosis factor alpha in adult participants including mean BMI of OSAS patients ≤30 kg/m2.
Subgroup Analysis of Serum Level (n)MD (95%CI), p-Value, I2 (%), PhSubgroup Analysis of Plasma Level (n)MD (95%CI), p-Value, I2 (%), Ph
Overall (17)23.07 (20.18, 4.50), <0.00001, 100, <0.00001Overall (10)10.82 (7.14, 14.49), <0.00001, 99, <0.00001
Mean BMI of controls, kg/m2-Mean BMI of controls, kg/m2-
>30 (0)->30 (0)-
≤30 (17)23.07 (20.18, 4.50), <0.00001, 100, <0.00001≤30 (10)10.82 (7.14, 14.49), <0.00001, 99, <0.00001
Total number of participants -Total number of participants-
>100 (8)63.51 (53.65, 73.45), <0.00001, 100, <0.00001>100 (6)8.12 (4.46, 11.79), <0.0001, 98, <0.00001
≤100 (9)4.42 (3.10, 5.74), <0.00001, 98, <0.00001≤100 (4)13.79 (8.24, 19.35), <0.00001, 99, <0.00001
Mean AHI of OSAS patients, events/h-Mean AHI of OSAS patients, events/h-
>30 (9)12.94 (7.74, 18.13), <0.00001, 100, <0.00001>30 (6)16.13 (11.20, 21.06), <0.00001, 100, <0.00001
≤30 (3)173.00 (139.66, 206.34), <0.00001, 100, <0.00001≤30 (3)5.45 (−3.55, 14.45), 0.24, 99, <0.00001
BMI, Body mass index; CI, Confidence interval; OR, OSAS, Obstructive sleep apnea syndrome; MD, Mean difference; NA, Not available; Ph, Pheterogeneity. Bold numbers show statistically significant value (p-value < 0.05).
Table 7. Meta-regression analysis based on some variables for serum and plasma levels of tumor necrosis factor alpha in obstructive sleep apnea syndrome patients compared with controls in adult participants.
Year of PublicationRAdjusted R2pMean Age of OSAS PatientsRAdjusted R2pMean Age of ControlsRAdjusted R2p
Serum 0.014−0.0360.942Serum 0.111−0.0240.567Serum 0.081−0.0300.678
Plasma0.3840.0910.128Plasma0.018−0.0660.946Plasma0.079−0.0600.764
Mean BMI of OSAS patientsRAdjusted R2pMean BMI of controlsRAdjusted R2pMean AHI of OSAS patientsRAdjusted R2p
Serum 0.122−0.0250.545Serum 0.159−0.0140.429Serum 0.3390.0750.105
Plasma0.201−0.0240.439Plasma0.2920.0240.256Plasma0.126−0.0540.641
Number of participantsRAdjusted R2p--------
Serum 0.004−0.360.985-------
Plasma0.202−0.0230.438--------
BMI, Body mass index; OSAS, Obstructive sleep apnea syndrome. R: Correlation coefficient.
Table 8. Quality assessment scores of the studies involved in the meta-analysis.
The First Author, YearSelectionComparabilityExposureTotal Points
Adults
Vgontzas, 1997 [28]***-***6
Huiguo, 2000 [29]********8
Vgontzas, 2000 [30]********8
Ciftci, 2004 [31]********8
Imagawa, 2004 [32]*******7
Minoguchi, 2004 [16]********8
Tazaki, 2004 [33]********8
Ryan, 2005 [34]********8
Kobayashi, 2006 [35]********8
Ryan, 2006 [36]********8
de la Peña Bravo, 2007 [38]********8
Arias, 2008 [39]********8
Constantinidis, 2008 [40]********8
Kanbay, 2008 [41]********8
Tomiyama, 2008 [43]********8
Carneiro, 2009 [44]*******7
Li, 2009 [45]********8
Thomopoulos, 2009 [46]********8
Sahlman, 2010 [47]********8
Steiropoulos, 2010 [48]********8
Sarac, 2011 [49]*******7
Fornadi, 2012 [50]********8
Medeiros, 2012 [51]********8
Qian, 2012 [52]********8
Chen, 2013 [54]*******7
Hargens, 2013 [56]********8
Matos, 2013 [57]********8
Yang, 2013 [58]********8
Ciccone, 2014 [59]********8
Sun, 2014 [60]********8
Unuvar Dogan, 2014 [61]********8
Chen, 2015 [62]********8
De, 2015 [63]********8
Jiang, 2015 [64]********8
Thunström, 2015 [65]*********9
Lin, 2016 [67]********8
Nizam, 2016 [68]********8
Vicente, 2016 [69]********8
Hirotsu, 2017 [70]*********9
Jiang, 2017 [71]*******7
Jin, 2017 [72]********8
Bozic, 2018 [75]********8
Kong, 2018 [76]********8
Ming, 2019 [78]*******7
Tang, 2019 [79]********8
Galati, 2020 [80]*********9
Children
Tam, 2006 [37]*********9
Li, 2008 [42]*******7
Alexopoulos, 2013 [53]*******7
Chu, 2013 [55]***-***6
Gaines, 2016 [66]*******7
Huang, 2016 [14]*******7
Smith, 2017 [73]*******7
Zhang, 2017 [74]*******7
Rogers, 2018 [77]*******7
Each asterisk (*) denotes 1 point.
Table 9. Sensitivity analysis on the results of serum and plasma levels in adults participants.
First Author, YearSampleReason for RemovingMD (95%CI)Zp-ValueI2Ph
Jiang, 2015 [64]SerumOutlier data4.53 (3.48, 5.57)8.87<0.00001100<0.00001
Huiguo, 2000 [29]PlasmaOutlier data4.18 (2.58, 5.78)5.11<0.0000199<0.00001
CI, Confidence interval; MD, Mean difference; Ph, Pheterogeneity.
Table 10. The results of trim-and-fill method.
SampleValueStudies TrimmedFixed-EffectsRandom-EffectsQ Value
Point EstimateLower LimitUpper LimitPoint EstimateLower LimitUpper Limit
SerumObserved-0.409920.364740.455098.244897.006399.483398710.33950
Adjusted150.322710.277700.367710.52315−0.888821.9351217050.9022
PlasmaObserved-2.462592.323142.602045.452063.500927.403202508.21501
Adjusted32.294552.156052.433062.668130.638334.697943161.99635

