1. Introduction
Due to the key importance of the port sector in current society and due to the large volume of business involved, this sector is of crucial importance. Therefore, a slight improvement in profitability in this sector, whatever it may be, will result in huge repercussions. It is the result of the large number of port operations that take place.
Therefore, application of the smart concept in the port sector is especially important. Consequently, the “Smart Port” term was born. It has generated a great interest to all active ports because it is the basis for the development and survival of any future port.
Smart Port is based on the use of new technologies to transform port services into interactive and dynamic services, which are more efficient and transparent. Its objective is to satisfy the customer and user needs and requirements. Moreover, port sustainability, from the environmental point of view, is included as a fundamental pillar, as well as its orientation toward the city and the citizen, to provide quality spaces and services. Therefore, the Smart Port is designed to be fully integrated with the concept of the Smart City.
Furthermore, the use of new technologies will make possible the port of the future, or Smart Port. Therefore, the port system will walk hand in hand with data transport and big data systems, whose implementation will allow a complete transformation in several areas.
In the case of economic fields, the greater efficiency in the logistics of the maritime transport and the improvement in traffics and management of merchandise synchronization, the greater the impact on the final price of the product. It is translated into greater commercial profitability.
In the institutional field, ICTs will allow simplification and greater efficiency and security in port management. It improves relationships and information transmission between entities. Furthermore, greater control of incoming and outgoing goods will be possible, assuming an improvement in the customs security of countries.
In the social field, Smart Port must be designed for and by the citizen, placing it as the epicenter of future port. Thus, port must be integrated sustainably with the city or the environment, providing spaces for the use of citizens, promoting its relationship with sea and allowing its enjoyment. For instance, port management must be transparent and open, needing to provide computer platforms or applications. They allow citizens to know the day-to-day activities in the port and allow them to be part of ports.
Finally, the environmental field is closely linked to the social one. The reason is that a port must carry out its activities while trying to reduce negative impacts on citizens’ lives and on port surroundings. Therefore, technologies will be available to regulate port activities, such as treatment of dangerous or dusty substances, while considering the highest possible safety standards. At the same time, periodic analyzes or controls should be available to monitor contamination or discharge of dangerous substances in the port. They measure water quality or potential contamination that can be caused by vessels that want to use it. Technology will also have an important role in detection and control potential risks in maritime transport, for example, detecting adverse weather conditions or a sudden spill of dangerous substances.
These are the main theoretical foundations on which Smart Port concept is supported. It serves as the basis for port development toward a more efficient and sustainable model.
Despite these clear trends, there is a lack of a clear and concrete definition of Smart Port fundamentals. However, it is clear that, while the presence of intelligent detection systems in the ports becomes reality, different operation areas are working today in automatic modes, and the concept is settling down.
The objective of this paper is to outline the development of an indicator that allows for the measuring and ranking of ports in its Smart Port category. This indicator was applied to the Spanish Port System, and a ranking of Spanish Smart Ports was obtained.
This paper’s structure includes six sections.
Section 2 contains a review of the state of knowledge on the subject of Smarts Ports. From this, the proposed methodology is discussed in
Section 3. The methodology consists of setting out the working scenario that corresponds to the Spanish Port System. Next, the Smart Port index is discussed, with a recounting of the selection of variables that were part of the Smart Port index and the assignment of weights for each block and element. By applying the Smart Port index to different representative Spanish ports, the ranking of ports was obtained and is presented in
Section 4. Finally, an analysis of the results is carried out in
Section 5, to obtain the conclusions included in
Section 6.
2. Knowledge Framework
The port system is a key point in the global economic system, so the main incentive for port management evolution is the combination between the production evolution and market systems and competition between ports. In this way, the port sector attempts to adapt to changes in market models; thus, this sector is gradually evolving, along with the global economic systems, searching for greater profitability and efficiency.
Thus, both changes in global economic models and political changes have a crucial impact on market models, and they have a fundamental role in the evolution of port management. Currently, clear examples related to this group of political–economic factors can be found. One of them is the growing phenomenon of globalization or the policies of taxes, and another one is taxes on goods by the governments with a key role in the port system.
The global view of economic models and relations between different countries becomes key for the port system. In fact, the changes in maritime traffic trends marked by shipping companies should be highlighted within the economic factors.
The great revolutions at the technological level have, in turn, a key importance as engines of change. As an example, we have the industrial revolution, which meant a total change in production models. We are currently immersed in the digital ICT revolution. Another process that is revolutionizing all sectors of industry and services is automation. That is why two of the biggest drivers of change in port management systems are now digitization and port automation. Paradoxically and by way of criticism, port system has not been renewing and adapting to the digital revolution as quickly as possible. If we put the point of comparison with other economic sectors, it is more significant, considering the enormous importance of the system port in the economy. Despite this, it should be noted that, in recent years, great efforts are being made by the port authorities in this regard. These efforts in digitalization and use of ICT try to recover lost time and catch up with other business sectors. This circumstance is, in turn, one of the motivators for the preparation of this paper.
It cannot be forgotten to mention it as an important motor for change the social field and the opinion of the citizens. It has been gaining weight in recent years because it promotes consideration of public opinion and service to the citizen within the port management policies.
The port system is undergoing a profound 4.0 transformation. It is currently moving from the digitalization of processes that take place within it to the digital interconnection with other ports, with the logistics chain [
1]. In the near future, toward which we are already heading, ports are seeking full automation of their processes, operational risk management and synchromodality, within a framework of collaborative economy. Ports are key actors that will allow the development of new efficient transport management models to become a reality, practically in real time [
2].
The Industrial Revolution 4.0 is an irrevocable economic transformation that basically means that the usual technological limits are being erased [
3]. It is based on the combination of physical infrastructure with software, sensors, nanotechnology or digital communications technology, so that these cyberphysical systems are capable of making decentralized decisions and cooperating, both with each other and with humans [
4].
This transformation of industrial and economic processes, inherent in the concept of industry 4.0, directly affects the maritime, port and logistics sectors. Operational activities are digitized and combined with information and communication technologies through elements such as IoT (Internet of Things), LoT (Ledger of Things) or cyber–physical systems, and AoE (Automation of Everything), leading us to concepts such as Logistics 4.0, or Ports 4.0 [
5].
The digitalization of the port system must serve as a basis for the development of safe and attractive intermodal solutions which allow the port to be connected to its logistics chains and move toward the automation of port operations, facilitating emergencies, the so-called "building blocks" or synchro-modal processes. In addition, the digital transformation will make it possible to make decisions based on data, through the use of intelligent and collaborative platforms; the standardization of formats and protocols of port operations and the logistics chain associated with the port [
6].
The concept of Port 4.0, AoE (Automation of Everything), arises to cover the gaps and a higher level of efficiency in the port logistics and its extension to the whole network of logistics chains in the international trade of goods per container with an innovative ecosystem that is as follows [
7]:
Adaptive in response to a world characterized by volatility and uncertainty.
Inclusive, based on the circular society and economy taking advantage of the waste in its logistics ecosystem.
Synchromodal, as a result of adapted and inclusive Port 4.0.
Continuing with this concept, another of the factors that are currently key to the changes introduced in ports is environmental awareness. In recent years, all the changes introduced in management systems have been looked at through the lens of environmental sustainability. All of them seek a port system that is respectful of the environment. They even seek to avoid, as far as possible, the effects on it. A clear example of this awareness is the process of decarbonization. It is currently being experienced, trying to promote the presence of more sustainable fuels in maritime transport (Liquefied Natural Gas, for example).
2.1. Port Indicators
The methodological process of developing indicators is a complex task that is not universally valid, because its composition arises from the existence of certain representative variables inherent in the universe of analysis considered. It is important to remember that indicators are those attributes, relationships or contexts that are selected as relevant to describe the units of analysis. This means that there is always a previous classification criterion used to choose the indicators [
8].
In order to arrive at reliable results using statistical analysis, it is necessary to determine which indicators are appropriate, because otherwise the results are likely to be inaccurate. These must represent the aspects of reality that you want to measure. On the other hand, the indicators used for the subsequent statistical analysis must have the qualities of being objective, manageable, comparable and reliable, and those that are imprecise, redundant or not very homogeneous are preferred [
9].
Sánchez and Doerr [
10] conducted a study on productivity indicators for the port industry in Latin America to assess the state of affairs and trends in the industry.
Cerbán [
11] already carried out a study on the most relevant determinants of competitiveness and competition in Spanish ports through a group of indicators on port infrastructure and services.
While some works have dealt with obtaining the appropriate indicators to measure efficiency and productivity in the port environment, other more specific studies [
12] have focused on the container terminal efficiency model [
13]. All of these studies always take into account that ports play a role in trade development and in general in the country’s competitiveness, especially in the context of globalization experienced in recent decades.
In Spain, studies related to competitiveness have been carried out that highlight the factors that influence the selection of a port in the Spanish System [
12], that is, that reflects the capacity of the Spanish Port System to capture traffic.
In 2007, other authors carried out a classification of the Spanish Port System based on cluster analysis [
14]. In their proposal, they took only three entry variables referring to bulk, solid and liquid traffic and general merchandise, and they concluded that the Spanish Port System was not a homogeneous whole, but rather presented a group structure depending on the volume of port activity.
With regard to port indicators, there are some references to be considered. The DEA (Data Envelopment Analysis), or Data Envelopment Analysis applied to port traffic, is based on various studies [
15,
16,
17]. DEA is a non-parametric procedure that uses a linear programming technique. It is a technique for measuring the efficiency of productive units based on obtaining an efficiency frontier from a set of observations, without the need to assume any functional form between inputs or inputs or outputs.
The econometric estimation of functions and distances treated for ports is an empirical estimation of port cost functions [
18,
19,
20,
21], which had its origin in the 1970s with the work of Wanhill [
22], whose objective was to design a model that would make it possible to determine the number of optimal berths that minimizes the total cost of use of the port, understanding as such the sum of two components: the cost of providing the infrastructure (the berth) and the cost of the ship’s time in the port.
2.2. Smart Ports Projects
One of the most outstanding works carried out in this respect is the European project “Action plan towards the Smart Port concept in the Mediterranean Area”. The aim of this study is to analyze the situation of container ports in the Mediterranean on the basis of “Smart Port” (SP) trends. The following offers an outline of the path to be followed:
To improve the leading role of container ports in Southern Europe;
To consolidate them as the main gateway to the major European consumption centers, rather than the ports of Northern Europe.
The results achieved by this study are the definition of the criteria that define the Smart Port concept, emphasizing the operational and energy efficiency, competitiveness and environmental areas. This project is fundamentally oriented toward the area of competitiveness and productive efficiency and environmental and energy sustainability. However, it leaves aside one of the main pillars on which the Smart Port concept must be based: social and political institutional.
Another study to be highlighted is the research work carried out by the Department of Industrial Engineering of the University of Houston and by the College of Architecture and Design of the same university. This study entitled “A Framework for Building a Smart Port and Smart Port Indicator” aims to define the key points and distinctive characteristics of a Smart Port. It is a response to the lack of a clear and unified definition in the scientific literature. It develops a quantitative methodology based on the use of indicators or KPIs that define a global indicator of Smart Port (Smart Port Indicator). The approach of this methodology focuses on the analysis of four key activity domains of a Smart Port: operations, environment, energy and security. Once the bases and guidelines of the SPI are established, the study develops the practical case of analysis through the defined indicator of the performance of some of the world’s most active ports. The study looks at fourteen international ports, including Hamburg, Rotterdam, New York, Houston, Shanghai and Hong Kong.
After the analysis of this work, it has the same limitation as in the case of “Action plan towards the Smart Port concept in the Mediterranean Area”, which is the lack of analysis of one of the key aspects in a Smart Port and which we should never lose as a reference, the social field.
The interest in this subject in Spain means that, since 2017, the so-called Smart Ports Conference has been held. In these meetings, the most relevant and innovative subjects related to the world of Smart Ports are discussed every year.
In the Smart Port regulatory context, there are various approaches based on different international bodies, with the main ones being the United Nations Conference on Trade and Development (UNCTAD), the International Maritime Organization (IMO) and the European Union (EU) [
23].
As for specific regulations, the one promoted by the ISO (International Organization for Standardization) stands out, which is constituted as the International Organization for Standardization par excellence. It is made up of various national standardization organizations, whose function is to establish a set of rules, provisions and requirements for standardization and quality control.
The objective of legislation is to improve the sustainability of ports, motivate the implementation of new technologies and provide standards to evaluate their performance. The existing regulations cover different fields within the field of Smart Ports.
The role of ICT in the development and adaptation to the Smart Port concept is crucial. Current trends in the implementation of Smart Port measures are based on the use of Information and Communication Technologies. The objective is to improve knowledge share and information analysis, to increase operations and energy efficiency and environmental sustainability.
This is the field of action in which digitalization can play an important role covers the whole range of port activities. It allows for a substantial potential improvement in the following fields:
Greater efficiency in operations (which leads to better economic returns);
Worker safety;
Active and dynamic communication with the social environment;
Port management at an institutional level;
Environmental and energy sustainability.
In this way, intelligent infrastructures (hardware and software) in ports can increase efficiency and sustainability by collecting, processing and exchanging data in real time. Information on traffic flow of ships and transport vehicles inland, closing times of mobile bridges and other infrastructure information, the situation in container terminals and other important operations (e.g., empty container depots), and parking facilities should be available to port users. The rapid and easy flow of this information facilitates wise and informed decision-making by port authorities and port customers. Ultimately, this brings higher productivity, lower costs, high market competition for the port, lower emissions, energy efficiency and green logistics.
Regarding the ITC that allows the development of smart port, different studies can be mentioned.
Radio Frequency Identification (RFID) is a remote data storage and retrieval system that uses devices called RFID tags, cards or transponders. In this context, Yang et al.’s study [
24] can be cited. It highlights the main requirements and the key ideas for each port. It even senses the solutions and challenges related to the calibration. It tests distributed sensing systems associated with the main equipment that compose the world largest ports, too, such as quayside cranes and automated guided vehicles for container handling or yard cranes.
Furthermore, Li-ting study [
25] can be cited, too. This study systematically collates RFID application research in Smart Ports from three aspects of management: container, vehicle and ship. Thus, it points out that RFID can effectively improve the operational efficiency of ports. Continuing with this technology, Heilig and Voß’s study [
26] developed a framework for data security and privacy management in Smart Ports.
On the other hand, wireless communications (PMR for voice, WiFi for data, etc.) are treated in Kalffke et al.’s study [
27]. The aim of this study was to make an assessment of skill demands and the skill requirements of occupations and professions in Intermodal Traffic Management (ITM), at various levels in the Port of Hamburg, in relation to planning, implementation and application of Smart Port/Smart City technologies. Starting from the identified skill demands at the Port of Hamburg, an estimate of demands in this area for Germany, Europe and the world is projected.
In addition, OCR technology, CCTV (container/lorry identification, security, etc.) is one of the many technologies now available for asset identification and process automation in ports and terminals. This issue is addressed by Heilig and Voß’s study [
28] and by Attia’s study [
29]. In the first one, authors present a classification and a comprehensive survey of information systems. They related information technologies applied in ports too. As such, the paper provides a state-of-the-art information-central view on port operations. This aims to bridge the gap between industry solutions and academic works. In the second one, the author presented the key issues related to navigation systems, communication networks and information technology. They showed their applications to secure the ships and the development of business performance for the transfer and circulation of goods. The authors even included the impact of this on the national economy.
GNSS technology is the backbone of traffic management and modernization in seaport container terminals. One of the most important properties of GNSS-enabled systems is the ability to track container arrivals and their attachment at the terminal. The work of Rodriguez and Cabrer [
30] focuses on the development of a container tracking device. This device performs its functions when containerized goods come into contact with the sea. It indicates the position of the containers until they are submerged to a safe depth.
The TOS (Command and Control Integration, Logistic Support, etc.) lies in the fact that efficient cargo handling requires efficient data handling. Containers and other marine terminals require increasingly versatile operating terminals and other ICT systems to plan, schedule and manage operations. TOS are a key part of the supply chain. Their main objective is controlling the movement and storage of various types of cargo in and around a container terminal or port. This concept is discussed in the Heilig and Voß study [
28].
The development and implementation of Port Community Systems (PCS) have been important factors contributing to the more efficient movement of cargo across international borders. Ports are natural bottlenecks in the transport chain. Port community systems have played an important role in facilitating the more efficient movement of goods, while allowing customs departments and other government departments to maintain effective controls, as highlighted in Bisogno et al.’s study [
31]. The aim of this study is to investigate maritime logistic processes, focusing on efficiency and coordination. The topic is timely because, in the European context, the EU Directive no. 2010/65/EU imposes the adoption of digital procedures concerning documents and information, in order to facilitate the relationships between all the actors of a port community system (PCS).
Regarding Logistics Collaborative Systems and B2B systems, Smart Ports are a multi-operational space where many private companies coexist: Shipping lines, terminal operators, forwarders, inland transport providers and inland terminal operators are involved in inland transport. These collaborative B2B logistics systems play an important role in integrating the backend applications of different companies with each other to enable the exchange of data in Klaffke et al.’s study [
27].
The efficiency of seaports depends, to a great extent, on the cooperation of companies handling the flow of cargo between the sea and land sides. In a big data era, emergent information technologies increasingly facilitate the collection of different types of business-critical data from different sources including sensors, mobile devices and operating systems. However, a core problem is still the willingness to share information between competing and non-competing organizations. In this paper, we develop a framework for data security and privacy management in Smart Ports as a continuation of Heilig and Voß’s study [
26].
Finally, considering blockchain technology, all transaction parts, as well as a significant number of third parties, maintain a copy of the registry (for example, blockchain). It means that it would be virtually impossible to modify each copy of the registry globally to counterfeit a transaction [
32]. This increases the security of goods and container traffic and can in turn increase the transparency of port management systems. In Jabbar and Bjørn’s study [
33], the authors present ethnographic data, unpacking three different accounts of how blockchain technology gets introduced into the shipping domain. The results demonstrate that the shipping industry is based upon an information infrastructure with a sociotechnical kernel comprising transaction practices between shippers, freight forwarders, ports, shipping lines and other actors in the shipping industry.
3. Materials and Methods
The objective of this study was to develop an indicator that allows for the measuring and ranking of ports in a Smart Port category. We applied out indicator to the Spanish Port System, and a ranking of Spanish Smart Ports was obtained.
To obtain it, it was necessary to create an indicator. This indicator needed to cluster all characteristics in relation to Smart Ports. It was applied to all ports that are considered to study.
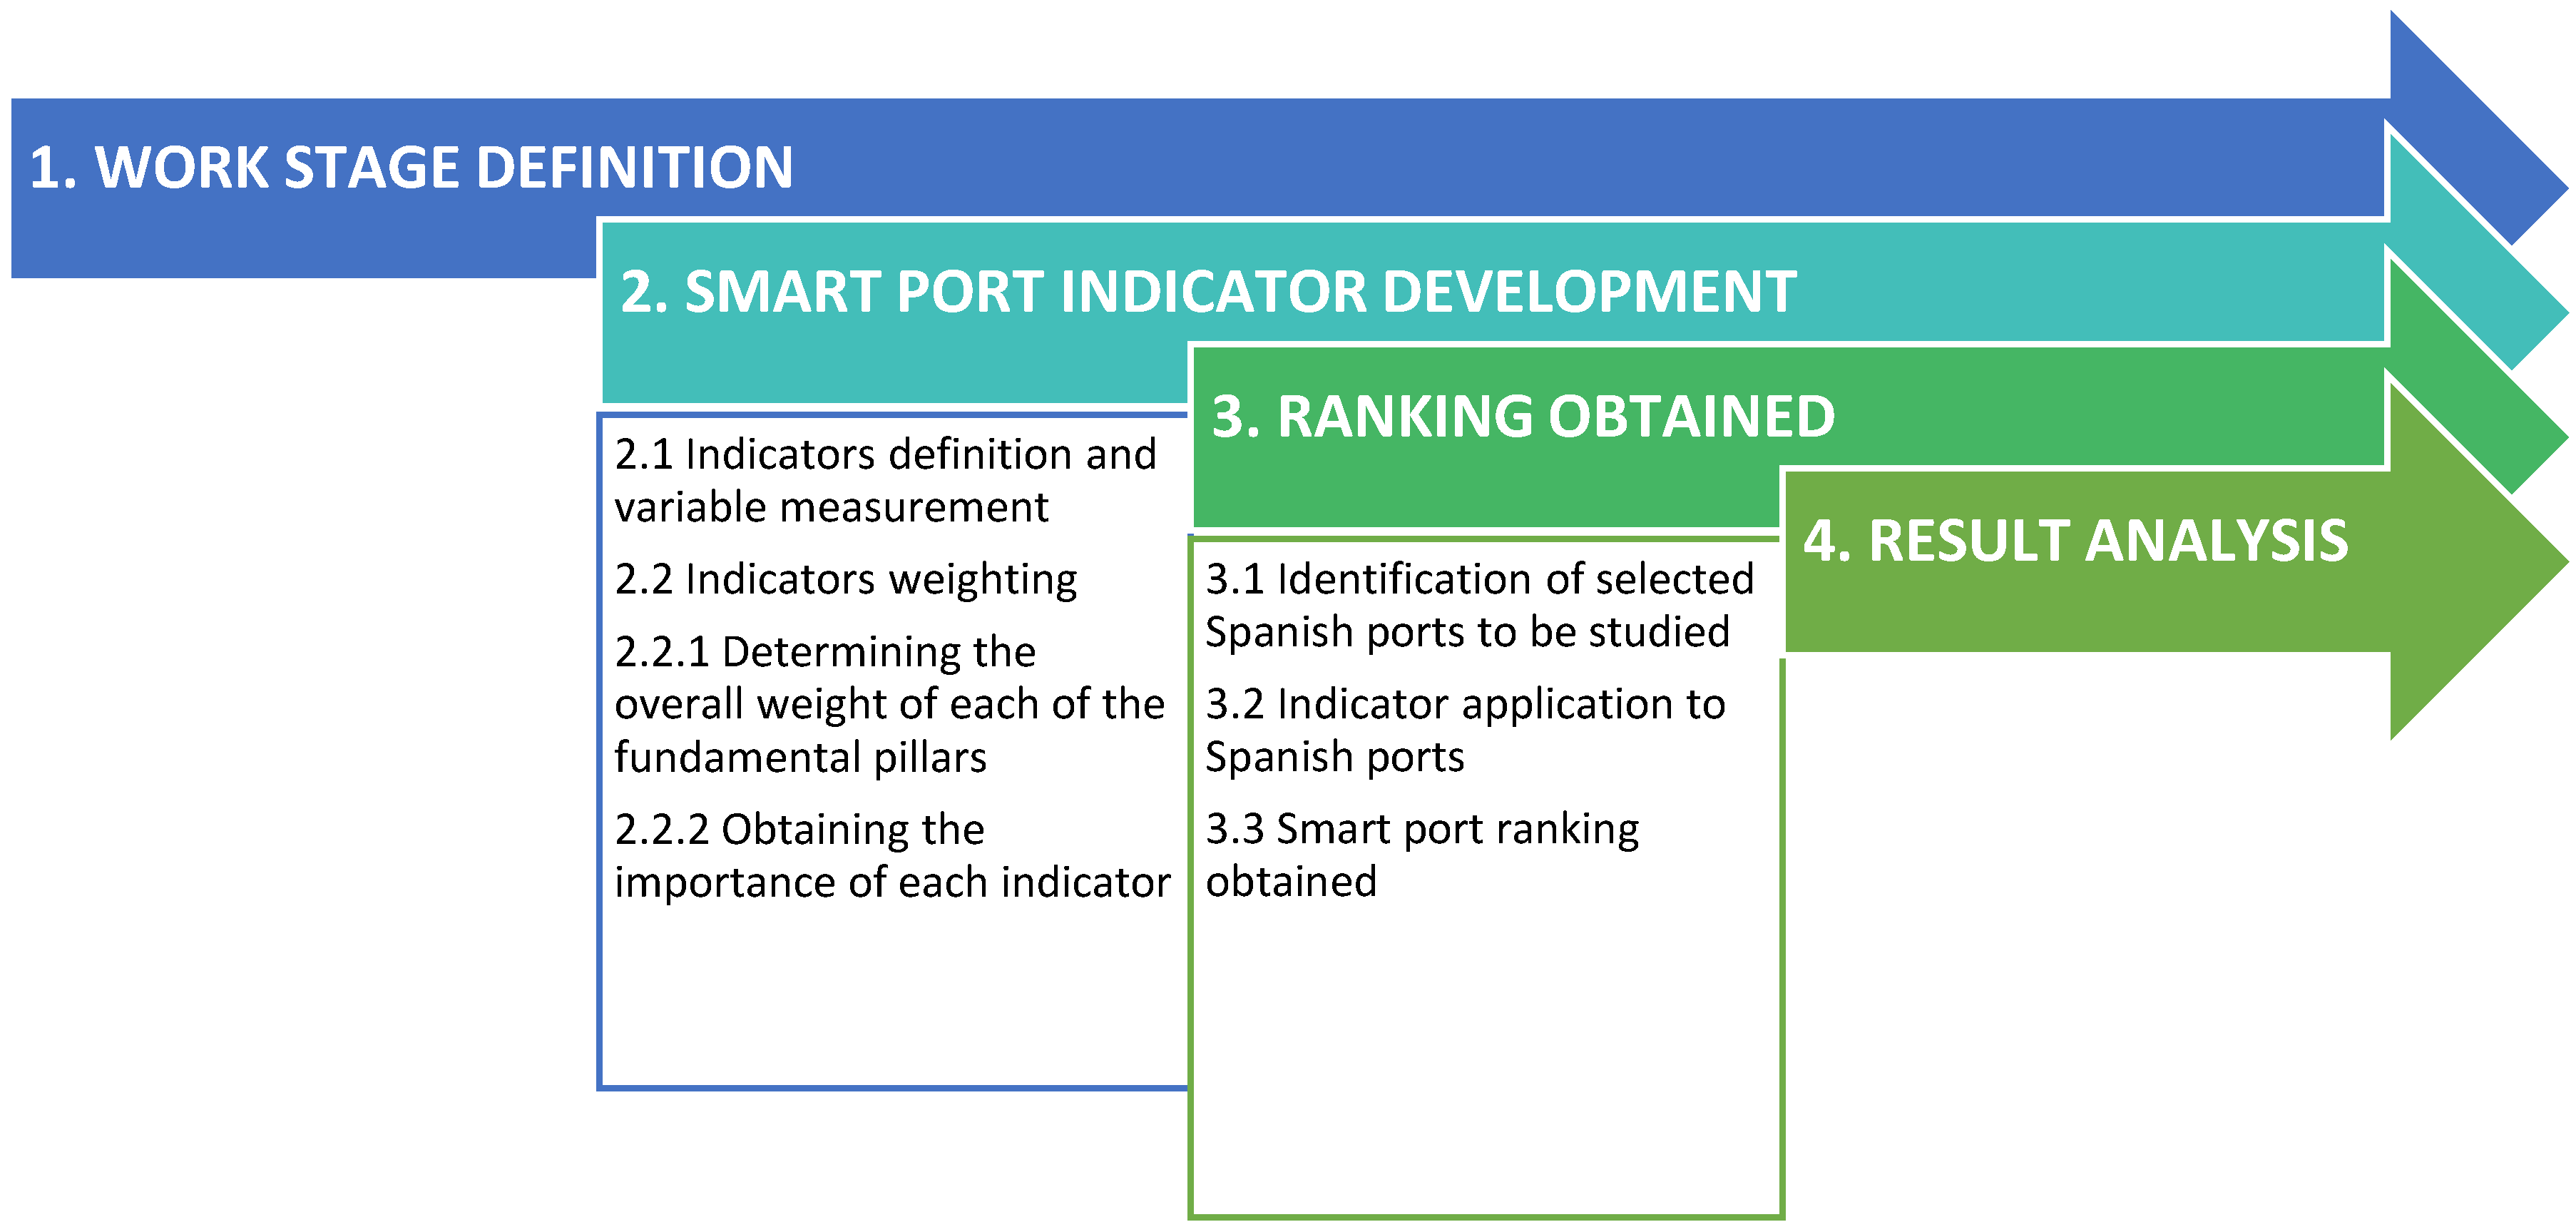
The methodology that was used is explained below. Its methodological flowchart is included in
Figure 1.
3.1. Phase 1: Work Stage Definition
Before the first step, it was necessary to develop an exhaustive study about Smart Ports and their impact over society and over the whole world, so we could identify the main areas in which port adaptation to Smart Port concept has an important impact.
This analysis must be supported by the establishment of clear and defined bases related to Smart Port concept. It was necessary to study the current situation of adaptation to ideal Smart Port, too. Moreover, identifying and defining the main current and future trends in Smart Port implementation was needed, too.
3.2. Phase 2: Smart Port Indicator Development
The next step was to define and develop a global indicator that allows us to measure and compare the grade of adaptation of a port to the Smart Port concept.
This indicator was made to be versatile and easily applicable to several ports interchangeably and without loss of objectivity in results.
Clear and concise indicators, measurement variables and scoring rules are referred to easily measurable and identifiable data and concepts when evaluating a port. Thus, their use must have a key role. Therefore, indicators and variables that may refer to very specific characteristics of a given port should be avoided. It does not imply a decrease in the degree of adaptation to the Smart Port ideal.
To carry out indicators’ definition, five phases were considered, and they were organized into two differentiated blocks. These blocks were developed with the considerations shown below.
3.2.1. Phase 2.1. Indicators Definition and Variable Measurement
The first methodological block for the development of the indicator consisted of three phases that were developed in their numerical order.
The objective of this first block was the choice of the indicators, measurement variables and scoring rules which were the most appropriate to our case study.
The process of division into phases was used as an instrument to search for objectivity and excellence in the choice of the set of indicators. We used it to try to ensure that each of the processes described below is independent of the rest and can in turn enrich each other.
The objective was to try to determine the suitable indicators that best adapt to the aforementioned characteristics, as well as their corresponding measurement variables and rules to follow for scoring. Thus, for this phase, the indicators and measurement variables were chosen through the use of a Delphi panel methodology.
3.2.2. Phase 2.2. Indicators’ Weighting
The second methodological block that integrated the definition of the Smart Port indicator consisted of two phases, which followed the dynamics established in the first block. They were developed linearly in numerical order of phases.
This second block’s main objective was the determination of the importance of each of the previously chosen indicators, assigning a particular weight to each of them. Due to the great importance of this step in the final results, the process was divided into two phases. These phases were differentiated in time, to obtain the most successful result possible.
Phase 2.2.1. This phase focused on determining the overall weight of each of the fundamental pillars defined. This first step was standing before the final allocation of weights to each indicator because it tries to control and limit the importance of each pillar within the Smart Port indicator. Thus, this first step restricted and limited the joint weight of the total indicators associated with each pillar. We tried to prevent the importance of each pillar in the study from becoming distorted with the assignment of particular weights to the indicators. Consequently, in order to weigh the global importance of these pillars, indicators associated with each pillar were considered less than the theoretical importance of that pillar itself.
Phase 2.2.2. Its objective was to obtain the importance of each indicator within the pillar in which it is contained. Thus, total weights of the indicators of each pillar are the total global weight of said pillar.
3.3. Phase 3: Spanish Smart Port Ranking Obtained
After Smart Port indicator was defined, the next key objective was to obtain a ranking of Spanish Port System, by considering its adaptation grade to the Smart Port concept.
3.3.1. Phase 3.1. Identification of Selected Spanish Ports to be Studied
The first step was the selection of those ports on which the indicator was applied. The ports that were selected provide a complete and plural vision of the Smart Ports development of the Spanish Port System.
The two selection criteria shown below were used, of which both one and both can occur:
Importance of the port as a key point of value creation, both economic and social.
Development and implementation of Smart Port measures in the port.
3.3.2. Phase 3.2. Indicator Application to Spanish Ports
In this step, deep research and data collection work was carried out. Information collected from various sources is contrasted in this section, looking for the veracity of the set of data collected.
The development of a definitive score for each of the indicators of each port on the overall total Smart Port indicator was carried out by following the two steps described below.
Score assignment to each indicator
Collection of the appropriate data required by each of the measurement variables associated with each indicator was organized according to the pillars established in this methodology. The measurement rules we defined are used in
Section 4 of this paper, to assign a justified score to each of the indicators of each port.
Weights application to score of each indicator
Before all the indicators of all the studied ports were scored, the next step was to define the Smart Port indicator. It corresponds to the weights assigned to each of the indicators in
Section 4 of this paper.
In this way, the score of each indicator was multiplied by its associated weight over the total of the Smart Port indicator. Therefore, it is possible to obtain the quantitative contribution of a certain indicator in a given port in the representation of its degree of adaptation to the Smart Port concept.
Weighted scores associated with each of the pillars are added, in order to reflect the degree of adaptation of a particular pillar to the Smart Port ideal.
3.3.3. Phase 3.3. Smart Port Ranking Obtained
Knowing the global score of each pillar, our next step was to weight global sums of all the pillars defined in the study. Our aim was to determine the total score of the Smart Port indicator in each port.
In this way, final classification of the selected Spanish ports in Smart Port was obtained. Scoring system used were adapted to a total score over 100 points. Thus, results are more visual and easily analyzed. Moreover, scores were adapted in the same way to a total of 100 points in each of the analysis pillars, in search of the same purpose expressed above.
4. Calculation
The definition of the methodological process was outlined in the previous section, and it is now followed by an outline of the development and complete definition of each of the sections or phases that were integrated.
4.1. Phase 1: Work Stage Definition
Considering the contextualization study of port management, as well as the definition of what Smart Port is understood, the next step was to analyze and structure analytically the work scenario. In this analysis, the study of the trends in the implementation of Smart Port measures carried out in Spain was used. A study of the research and other works carried out by other experts in Smart Ports were used, too.
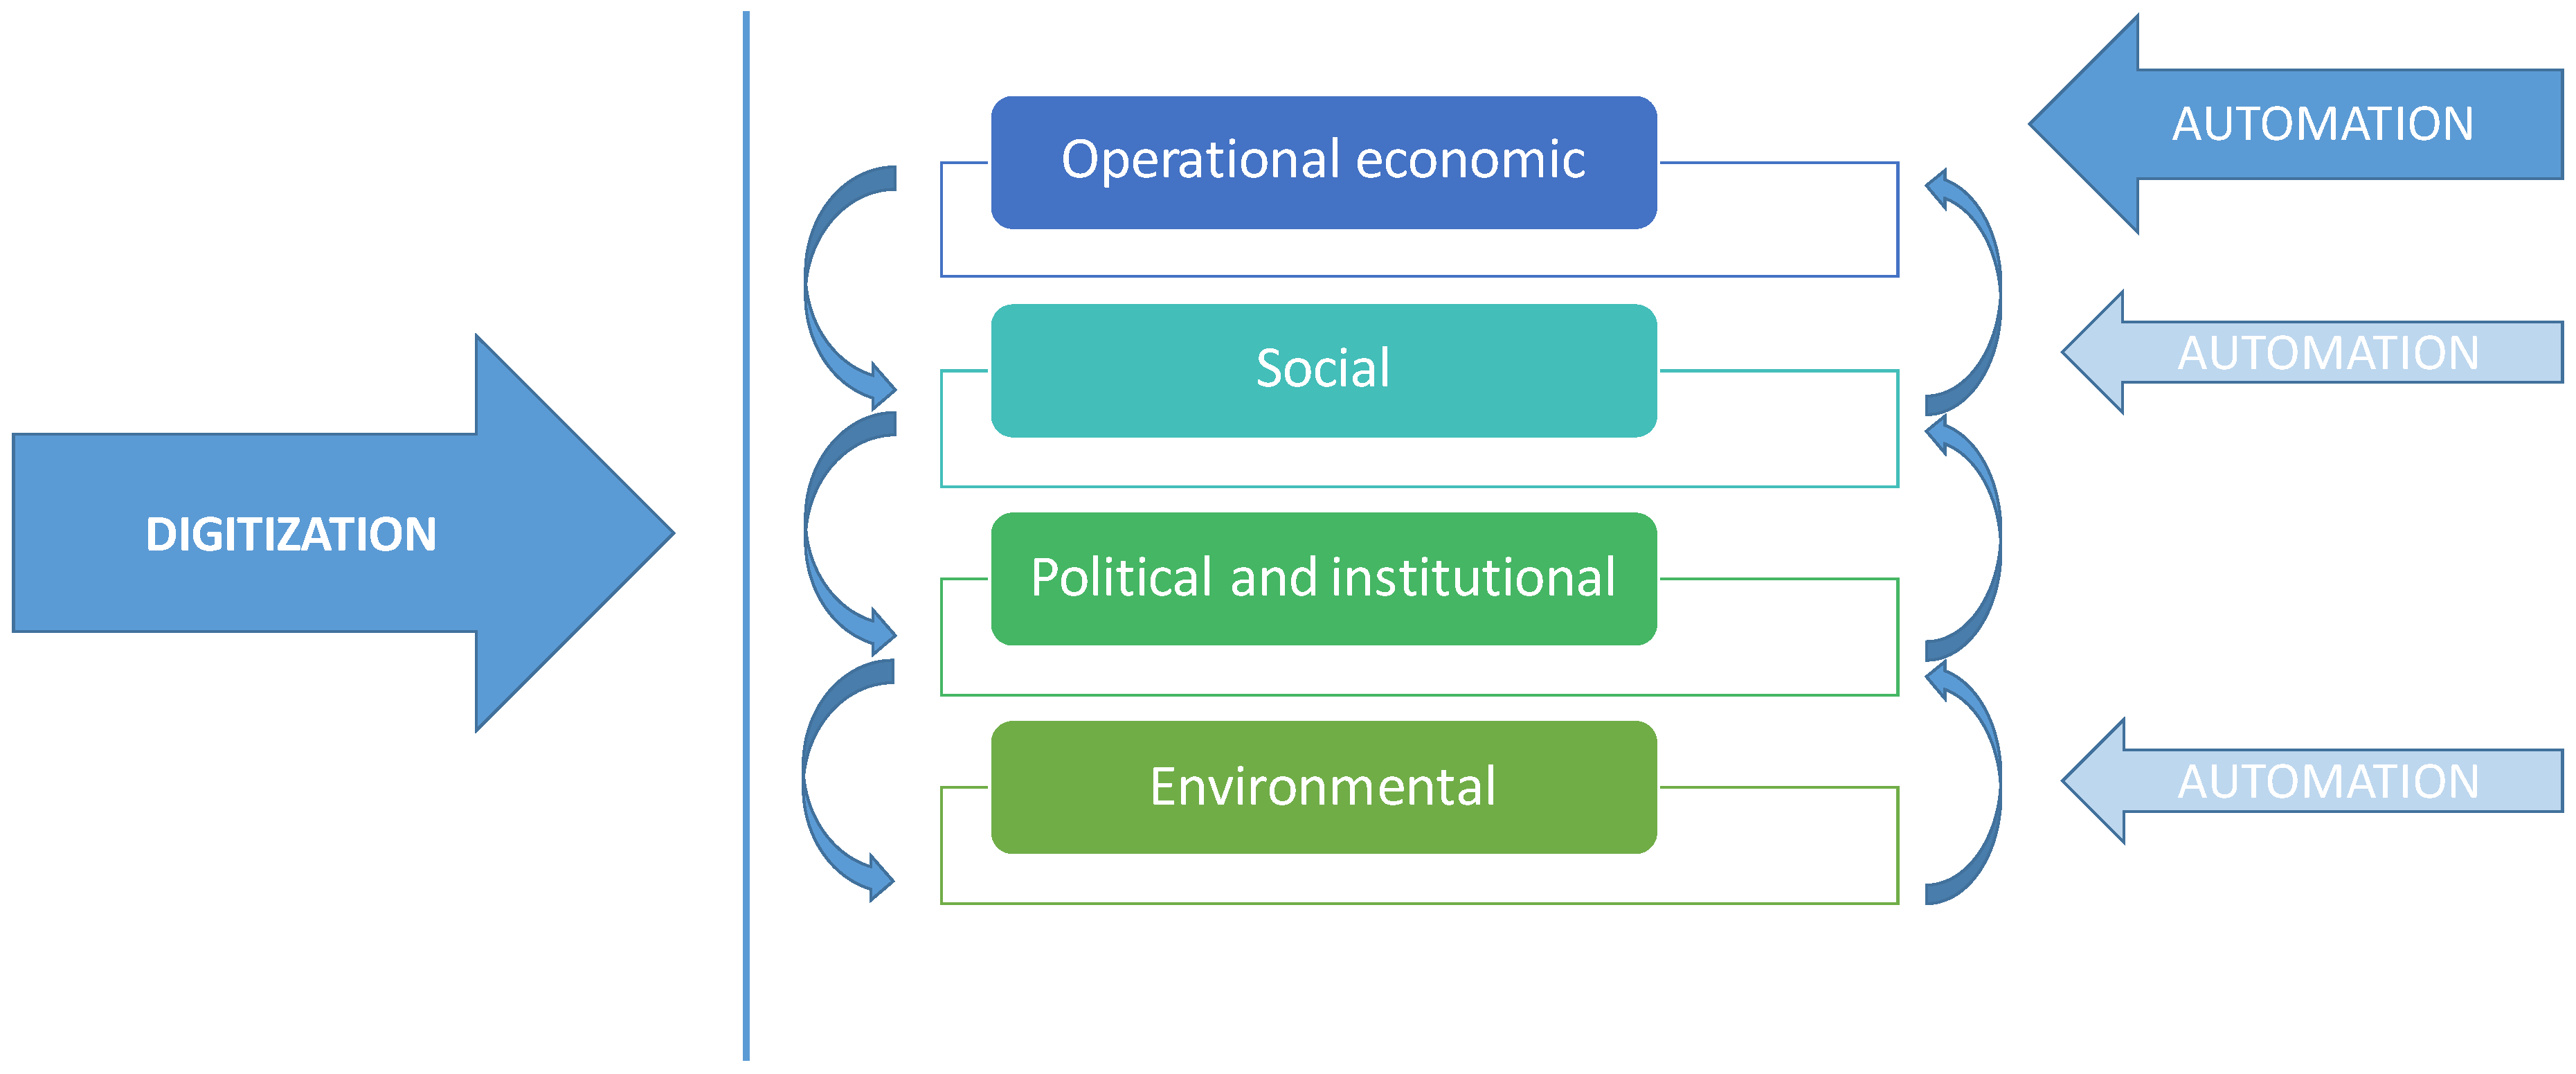
The study focused on the analysis of Smart Ports relating to the following four fundamental pillars:
On the one hand, digitalization was considered to be an intrinsic pillar of all of the abovementioned pillars because the four previous approaches were studied based on the digitalization and application of new technologies. In this way, digitalization was included in the previous four blocks because it was considered to be independent pillar. The other four pillars would have only the classic characteristics of a port sustainability study, and the main goal of this works is the analysis of the Smart Ports field, which should be based and focused on digitalization and new information and communication technologies.
Moreover, automation, together with digitalization, is another of the main technical and theoretical bases on which Smart Port concept is currently being supported.
In this case, automation will affect the operational economic field in a more direct and decisive way. The reason is that the main application of automation is the increase in the effectiveness of classic treatment operations of merchandise.
It also has effects to take into account in the social pillar, because automation of certain port processes implies a reduction in occupational risks and in the probability of accidents. This directly affects workers.
Thus, positive impact of automation on the environmental pillar has to be taken into account, because application of this concept to port operations increases operation safety.
Relating to direct effects of automation on the political and institutional pillar, it has a less important weight than in the previous pillars. However, it must not be forgotten that everything is closely related in the port world, so the effect on other pillars causes certain repercussions in the institutional political field.
The port system has to act within the concept of Port 4.0, derived from the fourth industrial revolution and industry 4.0, which means prioritizing connected ports and AoE, automation and robotization of everything that allows us to use sensors (IoT) and immutable records (LoT) with Artificial Intelligence and Augmented Intelligence (AI+IA). Synchromodilation will be a fundamental value that will be supported by digitizing and automation [
2].
Considering the previous scheme again, including the automation concept, we represent the scheme in
Figure 2:
4.2. Phase 2: Smart Port Indicator Development
The steps considered in developing the indicator are explained in a hasty manner, as follows.
4.2.1. Phase 2.1. Indicators Definition and Variable Measurement
Different indicators that will make up the global indicator should have the ability to collect particular information on certain aspects related to the Smart Port concept. They make it measurable and available through a series of rules and criteria that should be fixed and common for all ports.
Indicator choice and measurement variables were obtained through the use of the Delphi methodology. It served as an instrument to select the most appropriate indicators and variables from the list previously proposed by the authors.
For the development of the work, a Delphi panel was proposed. The novel topic of the research on which not much progress has been made to date is in line with this type of methodology: the objective of obtaining greater intersubjective and prospective knowledge about the chosen theme. The aim was to promote a process of structured debate by visualizing the points of dissent among the members of the panel of experts and to encourage currents of opinion among decision-makers.
Thus, the Delphi method is a technique of prospective research whose purpose is to elicit the degree of consensus or visualize the points of disagreement among experts in the subject matter of the research.
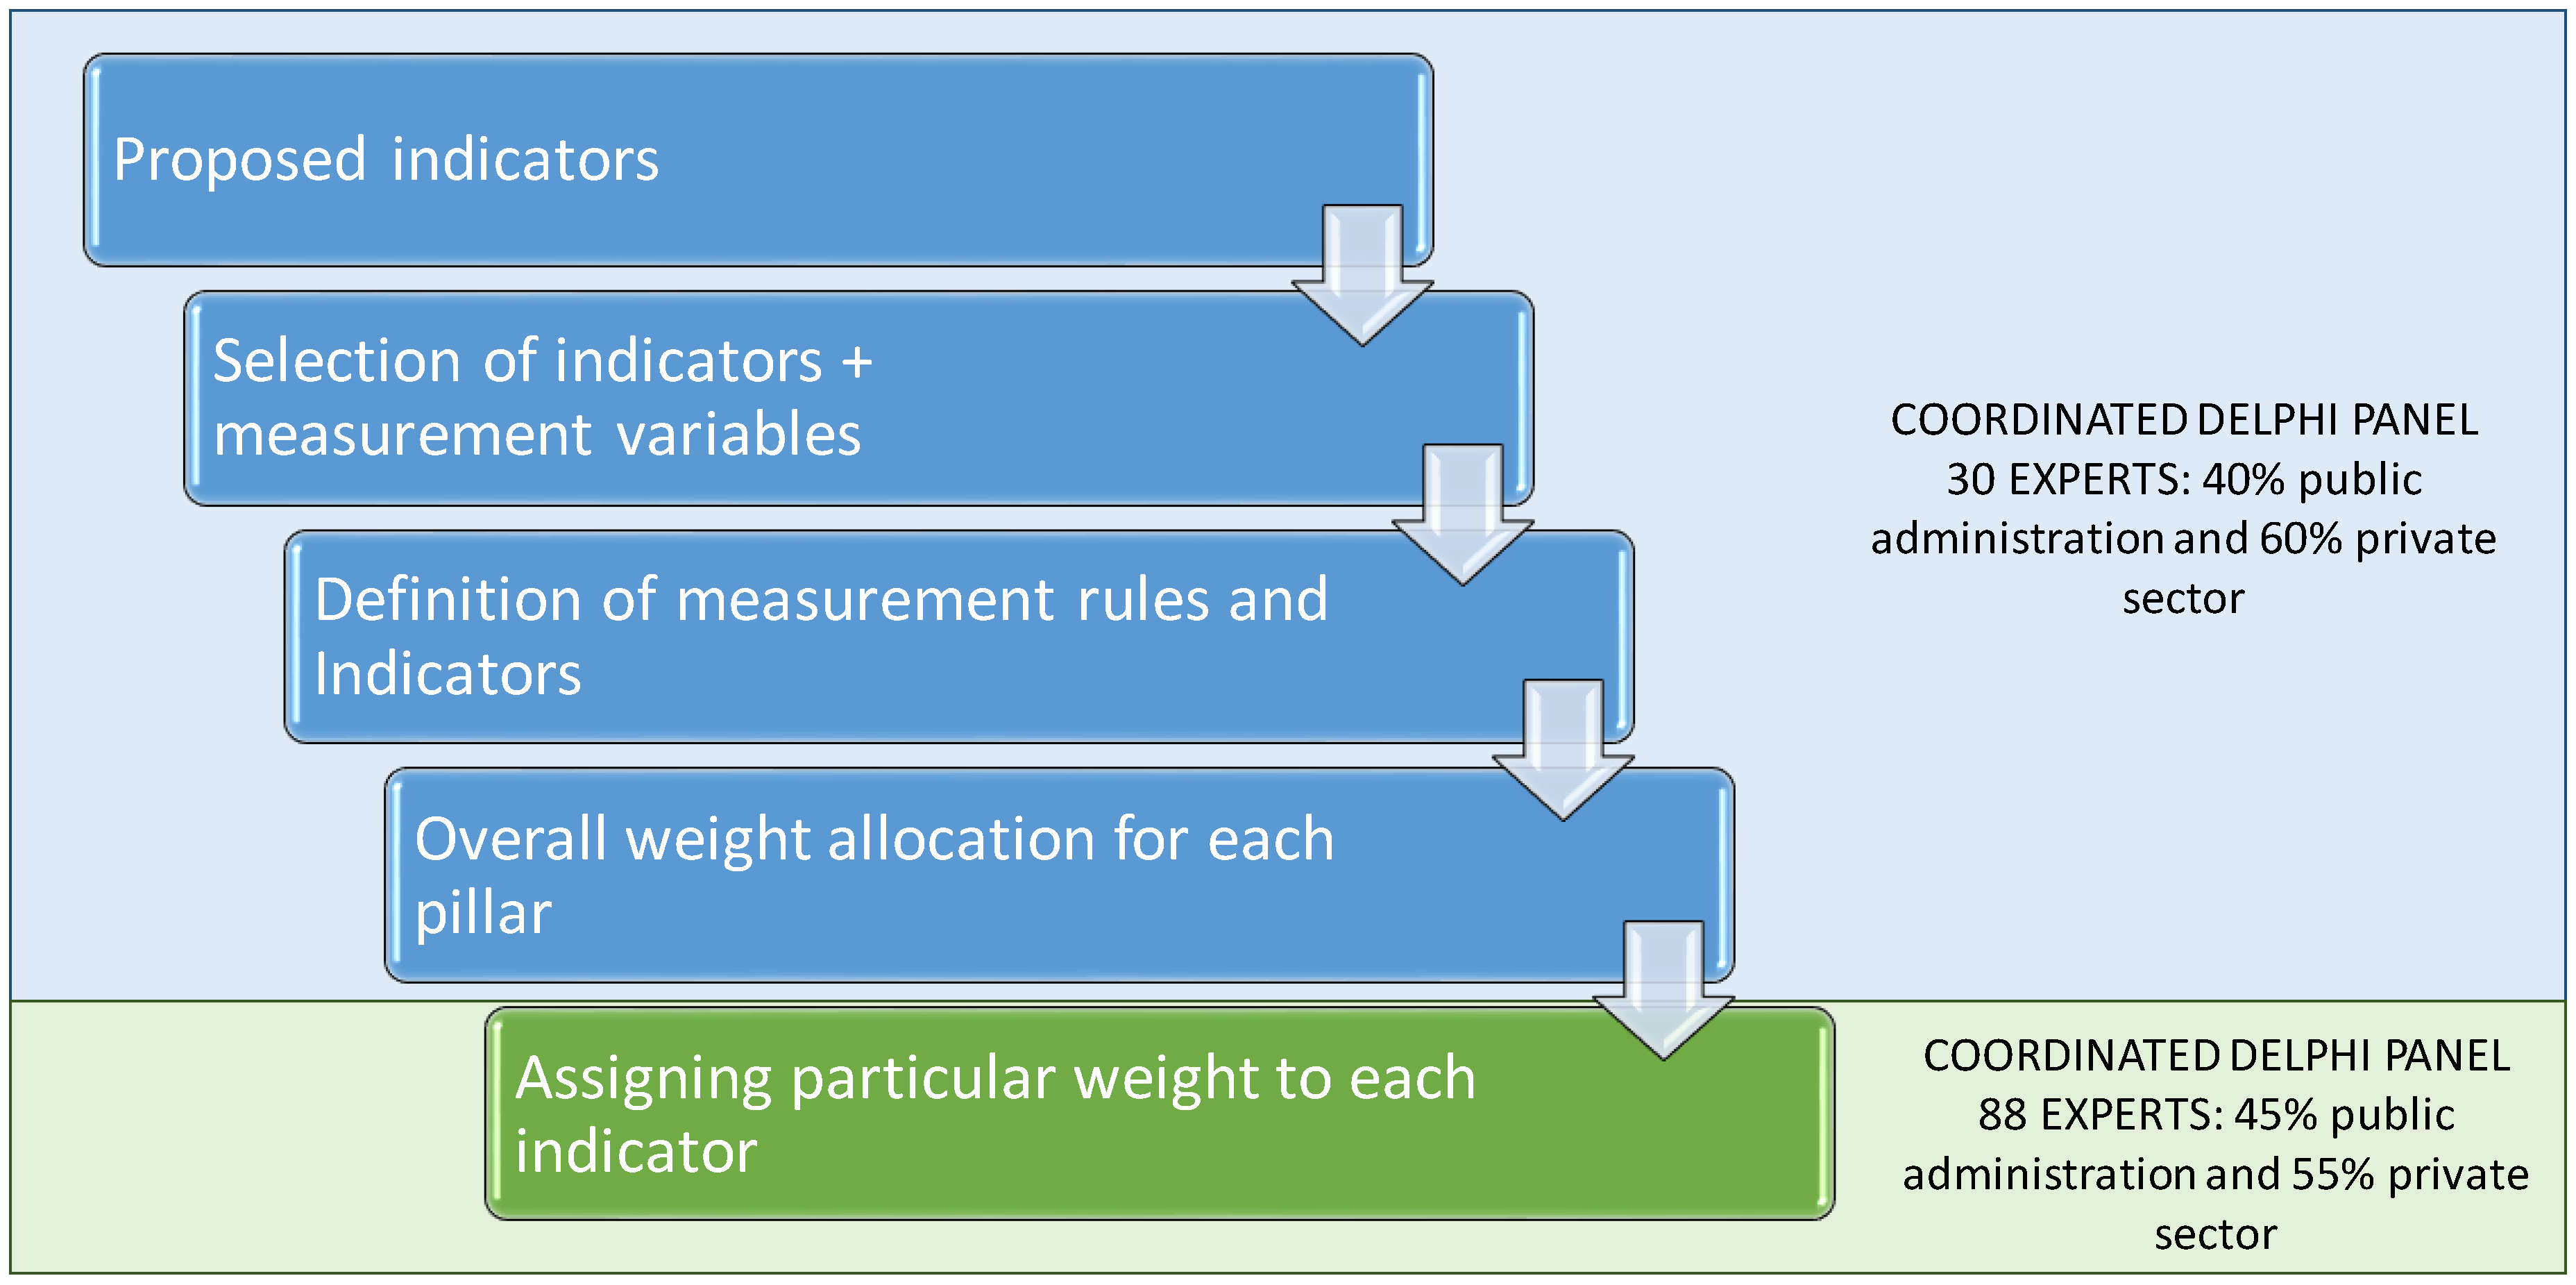
Both public administration and private-sector personnel participated in the development of the Delphi panel. For indicators’ definition and variable measurement, the number of experts was more limited and was extended for “Phase 2.2. Indicators’ Weighting”. Among the success factors of a Delphi study is the need to have the contribution of a qualified advisory group capable of formulating questions of real interest and of configuring a solvent panel of experts. Phase 2.2 was coordinated from two units: public administrations and the private sector, with each unit participating in 40/60 respectively, out of a total of 30 experts.
After completing the aforementioned expert panel consultation process, we selected the indicators and measurement variables, which are included in
Table 1.
After indicators and variables used were established, scoring systems and rules that were followed with each indicator and variable were determined:
Each indicator received a score from 0 to 4, in terms of adaptation to the Smart Port concept, depending on the indicator in question; 0 is the lousy value and 4 the optimal one.
Each indicator was weighted according to its importance within the role of reflecting the adaptation of a port to the Smart Port concept. A particular weight was assigned to each indicator, all of them over the total set of indicators that must correspond to the value 100. Weight determination was the last step and is outlined in the following section, after having definitively defined the scoring rules. Weight allocation was carried out by expert knowledge.
The measurement variables chosen for each indicator were easily applicable to the different ports studied. However, some ports did not present characteristics associated to the indicator, or there was an absence of information, so in these cases, scores of 0 were assigned to that indicator.
4.2.2. Phase 2.2. Indicators’ Weighting
A set of indicators and associated scoring regulations that define the final Smart Port indicator were specifically and definitively defined in previous sections of this paper, so the next step is to outline the process used to assign a particular weight to each indicator on the total set of indicators.
Indicator weighting is very important because it definitely marks the final result of the Smart Ports ranking.
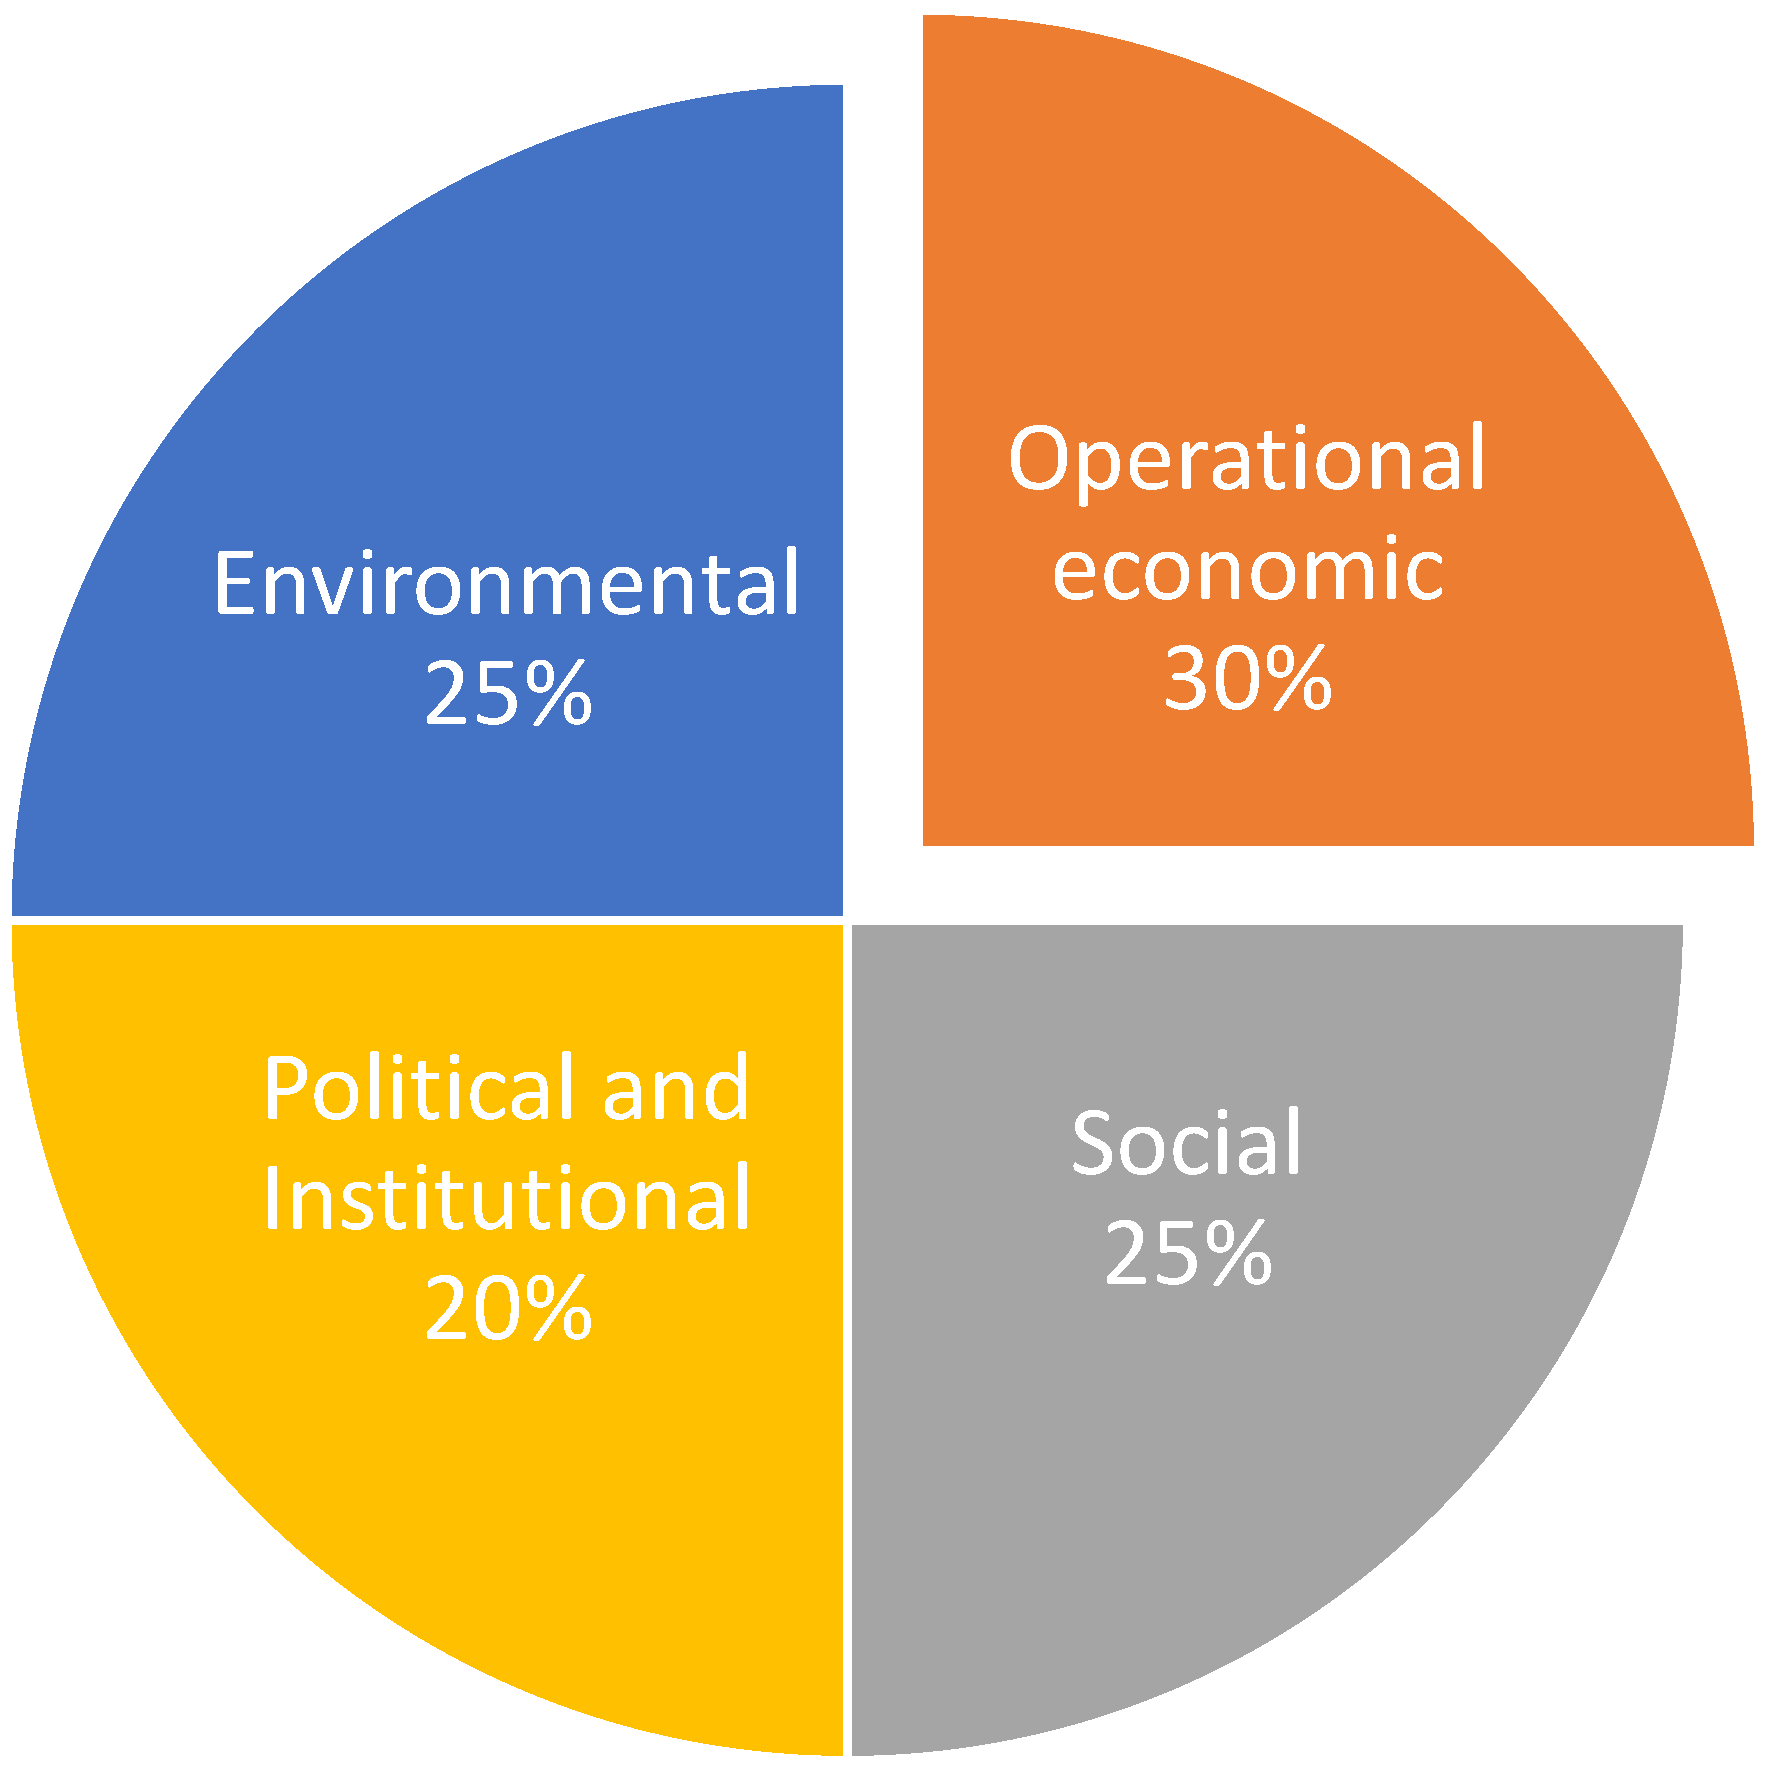
To assign weights to each of the four proposed pillars, the Delphi methodology was used again. Results included in
Figure 3 were obtained after the use of the Delphi methodology described above.
The Delphi panel was composed of a larger number of experts. In order to reach consensus on the working indicators, a smaller group was chosen, but in this phase in which it was intended to assign values to the indicators, work was done with a larger group (of up to 88 experts), from both the public and private sectors, in a 45/55 ratio, respectively.
The aim was to reduce the different predictive or prognostic possibilities as much as possible. Thus, it could be said that it simplifies the outcome of a complex project, thanks to the group opinion of several expert individuals, leading to possible decision-making.
The Delphi method is based on firm opinions, with which to obtain solutions or arguments supported and contrasted. In short, we are talking about a statistical summary of the experts’ judgements.
The contribution of the developed Delphi panel is presented in the fact of the large number of experts who participated in the process and the high degree of consensus reached.
The numerical scale is a universally accepted type of survey measurement. For number-scale questions, the number selected indicate the intensity of the respondent’s opinion. The greatest strength of a number scale is its simplicity. Another great strength of the number scale is the ease of statistical analysis.
Like the number scale, the written scale provides a list of scored categories for respondents to select from. However, instead of identifying each category with a score value, the written scale uses a description that indicates what each category represents.
The greatest strength of a redacted scale is the description it provides to the respondent for each category of the question. The written scale not only helps to describe the categories, but also allows researchers to present the findings by using the same words respondents used to give their opinions.
After that, it was necessary to assign weight to each indicator over total weight on its pillar. Thus, in this phase, Delphi methodology was used again. Options included in the questionnaire to filled out by the experts were as follows:
4 points to maximum importance;
3 point to high importance;
2 points to medium importance;
1 point to low importance.
In the proposed scale, a written scale of four options was decided. From previous studies, it has been found that, in odd-numbered scales, many experts tend to the midpoint; moreover, we wanted, in this specific case, to discard the option that the weight of the indicator be "no importance", given that the panel of experts of “Phase 2.1. Indicators Definition and Variable Measurement” already determined that these are the fundamental indicators and, therefore, all have some importance on the final indicator.
Figure 4 shows the process of obtaining the Smart Port indicator.
Once the indicators and variables to be used in the study were established, the scoring systems and rules to be followed for each indicator and variable were determined. To this end, the author of the project has defined the aforementioned scoring systems in a fixed and invariable manner, so that they are as congruent and adequate as possible to reflect, through a numerical value, the information collected by each measurement variable.
The scoring rules that were established for the different variables follow a set of common characteristics. In turn, a set of scoring rules is defined in this section, and they are particular and specific to each measurement variable.
Each indicator was scored between the range of values of 0 and 4, with 0 being the worst value and 4 the optimal value, all in terms of adaptation to the Smart Port concept, depending on the indicator in question.
Each indicator was weighted according to its importance within the role, consisting of reflecting the adaptation of a port to the Smart Port concept, assigning a particular weight to each indicator, all of this over the total set of indicators that must correspond to the value 100. The determination of the weights were established as a last step in the following section, after having defined the scoring rules definitively, seeking to ensure that the assignment of weights is carried out by experts who know the details associated with each indicator and the way in which its measurement and scoring is planned.
Throughout this study, we have tried to ensure that the measurement variables chosen for each indicator can be easily applied to the different ports studied. However, in the event that a port did not present characteristics associated with said indicator, or the lack of information in this regard indicated that it did not present development in a certain aspect, the score of 0 was assigned to said indicator.
Table 2 displays the indicators that form the Final Smart Port Indicator. All of their weights are included on it, too.
4.3. Phase 3: Spanish Smart Port Ranking Obtained
After having completely defined the final indicator that will determine, in numerical terms, the degree of adaptation of a port to the Smart Port concept, the Spanish Smart Ports ranking continues. This is consolidated as a central section.
4.3.1. Phase 3.1. Identification of Selected Spanish Ports to be Studied
Thus, the following Spanish ports were selected to be analyzed:
Port of Barcelona;
Port of Valencia;
Port of Algeciras;
Port of Las Palmas;
Port of Bilbao;
Port of Cartagena;
Port of Huelva;
Port of Vigo;
Port of Gijón;
Port of Malaga.
4.3.2. Phase 3.2. Indicator Application to Spanish Ports
A thorough research and data collection work has been carried out on each of the ports of the study. The main objective was to obtain truthful and proven information that allowed us to assign values to the measurement variables that make up the Smart Port indicator.
4.3.3. Phase 3.3. Smart Port Ranking Obtained
Ranking was determined by using calculation application, as it can be seen in
Table 3.
5. Results and Discussion
After having the Ranking of Spanish Smart Ports studied, the next step is to analyze the different aspects of results. The analysis tries to show port status relating to each of the pillars and their role in the overall result. Moreover, it tries to identify those aspects that ports have developed optimally and loosely in terms of Smart Port.
In a first analysis, considering the position that each port occupies with respect to each of the four pillars studied, it is possible to observe the relationship and position that each port occupies in global terms.
In operational economic terms, it is observed that the Port of Barcelona and the Port of Valencia maintain their positions of first and second place. These places are exchanged in respect to global score. The Port of Algeciras is in third position and in fifth place being global. However, despite doing well in this aspect, its performance in the other three pillars makes it descend several positions in the Global Ranking.
The rest of the evaluated ports maintain similar positions to their respective global positions, except for the Port of Las Palmas. This port stands out above the rest, occupying the sixth position in operational economic terms, but the last position in the Global Ranking. Even this pillar is the one that has the greatest weight over total score (30%). It shows that the Port of Las Palmas has been developing at the same time in this Smart Port pillar, but it has left in the background its development in other important pillars.
Moreover, the Ports of Huelva and the Port of Tarragona are in a contrary situation to the Port of Las Palmas. Their situation in the operational economic field is a very negative point in their overall score. Thus, it can be concluded that it would be a good aspect to consider in their future development to win positions in Smart Port terms.
Regarding the social pillar, there are several situations whose analysis can be interesting. First, the last positions on the list are closely resembled the positions occupied in the Global Ranking. It does not indicate a special preference for the development of this pillar over the rest of the pillars in these ports.
The Port of Barcelona and the Port of Bilbao stand out in a hasty manner. The Port of Barcelona occupies the second position in the Global Ranking, but the fourth position for the social pillar. Furthermore, the Port of Bilbao, occupies the third position in the Global Ranking, but the fifth in the social pillar one, so it can be concluded that the development of this pillar can be interesting for these two ports.
On the contrary, the Port of Algeciras occupies the fifth position in the Global Ranking, but the third in the social pillar. It indicates that in front of the rest of the pillars, the Port of Algeciras has shown good development, and there may be other pillars with more urgent development.
Regarding the Institutional Political pillar, positions in most of the ports remain similar to their relative positions in the Global Ranking. Thus, this pillar would not have special priority over another in terms of Smart Port development in most of the ports analyzed.
As a particular case, the Port of Gijón stands out in negative terms. It occupies the eighth position in the Global Ranking, but the last in the institutional political pillar. It indicates that it would be interesting for this port to develop its institutional political aspects in Smart Ports terms. This way it can place them at a similar level with its other three pillars.
Moreover, another particular case is the Port of Cartagena. It is a positive case because it occupies the ninth position in the Global Ranking but the seventh in the institutional political pillar. It indicates that its development in this pillar is greater than in the rest of the studied pillars. It can be concluded that Institutional Political Pillar has not established as a development priority over other pillars.
Finally, score analysis associated to the environmental pillar and its relationship with positions in Global Ranking shows clearly that, in this pillar, obtained positions are very different from Global Ranking ones. In fact, the environmental pillar is the pillar whom the positions with those corresponding to the Global Ranking correspond less. It broadly indicates that this pillar is a very interesting one to develop in some ports. However, in other ports, it is quite developed in relation to the rest of pillars of these ports, so other pillars would have priority over the environment one.
Ports of Valencia, Gijón and Las Palmas have a degree of environmental adaptation to the Smart Port that corresponds quite well with their Global Ranking positions. Therefore, in these cases, the environmental pillar is not a special priority.
On the one hand, in negative terms, Ports of Bilbao, Vigo, Algeciras and Barcelona occupy upper positions in Global Ranking, but not in the environmental one. It shows that adaptation to Smart Port concept in the environmental pillar is lower than global port adaptation. Therefore, it is the pillar in which they have to pay more attention in order to develop and adapt themselves to similar levels that the rest of the pillars. The most representative case is the Port of Algeciras. It occupies the fifth position in Global Ranking and the last position in environmental one. Thus, Port Authority the Port of Algeciras should concentrate its efforts in adapting the environmental pillar to Smart Port terms.
On the other hand, Ports of Huelva, Tarragona and Cartagena occupy lower positions in the Global Ranking than in the environmental one. It shows that their adaptation to the Smart Port concept in environmental terms is similar to or higher than their adaptation in the rest of their pillars. It can be concluded that their development does not have a clear priority related to the rest of these port pillars.
6. Conclusions
After carrying out this study, we were able to reach several conclusions on the degree of adaptation to the Smart Port concept of the Spanish Port System. It takes as a reference the evaluation of the most relevant ports for the case study to create an associated social and economic value. It will be at the forefront of the implementation of Smart Port measures in Spain.
For each of the pillars, the indicators most highly rated by the 88 experts coordinated in the Delphi panel are shown in
Table 4.
The table above shows that the pillars with the greatest weight are mostly those related to automation and digitalization processes. Considering the analysis of the Smart Port concept and its current and future trends, it has been determined that the development of a port must be based on the digitalization, on use of ICT and on automation of port processes. These processes must be gradually implemented, not only in the economic operational dimension, but also in the social, institutional and environmental policy dimensions. It allows ports to move themselves toward a sustainable model. This model is oriented toward port efficiency and toward the creation of social value.
Secondly, based on the analysis of the results of the developed Smart Ports ranking, clear critical vision of the Smart Port development in each of the four previously mentioned pillars (economic operational, social, political institutional and environmental) are shown.
As it has been noticed before, the development in these four pillars must be supported by digitalization and automation. When analyzing the information and data collected from the ports under study, as well as through the score associated with the digitalization and automation indicators for each of these four pillars, it can be concluded that the degree of development of the ports in these two aspects is very low, except Ports of Valencia and Barcelona, as well as those of Bilbao and Vigo, on a smaller scale. These ports have invested in and implemented certain digitalization and automation measures. Despite this, the degree of development in these ports is low in comparison with other ports at an international level, such as Rotterdam or Antwerp. These Spanish ports have only semiautomated terminals and digitized systems in the test phase or are not fully functional and efficient.
Regarding the indicators related to digitization and automation, it is important to point out that those systems in the test phase, or not yet fully functional, have been scored and taken into account. However, for the application in the coming years of the global Smart Port indicator defined, these systems must be required to be fully implemented and in effective operation.
Considering the particular results in each of the four pillars analyzed, it can be seen that the economic operational and environmental fields have obtained significantly lower scores than the rest of the dimensions. This conclusion is being discussed in terms of the general results of all the ports analyzed. However, certain cases of ports in these underdeveloped dimensions have obtained better scores than the other two. These ports coincide with the ports in the top of the ranking. Therefore, port investments must be higher in the development of the operational and environmental dimensions, relying on digitalization and automation processes, in order to advance in the ranking and in order to achieve a greater degree of adaptation to the Smart Port concept.
The main limitation to the development in Smart Port terms in these two dimensions that are most lacking in adaptation (economic operational and environmental) is that the amount of investment in both is usually higher than that of investment in social and political institutional measures.
As a conclusion, the Spanish Port System must make a large investment in digitalization and automation processes. If it does not, its efficiency will be reduced in regard to its future growth, with respect to other international ports. Moreover, the lack of investments can carry out possible sanctions and restrictions derived from international regulations. In order to do this, in the next years, port projects must be developed as quickly as possible, to obtain an effective implementation of these systems.

 ,
, 


