
Transparency in Global Agribusiness: Transforming Brazil’s Soybean Supply Chain Based on Companies’ Accountability


Faculty of Agronomy and Veterinary Medicine, University of Brasilia, Brasília 70910-900, Brazil
*
Author to whom correspondence should be addressed.
Logistics 2021, 5(3), 58; https://0-doi-org.brum.beds.ac.uk/10.3390/logistics5030058
Submission received: 28 July 2021
/
Revised: 16 August 2021
/
Accepted: 20 August 2021
/
Published: 25 August 2021
(This article belongs to the Special Issue Food Supply Chain through Ongoing Evolution: Lessons from Continuous Transformations)
Abstract
:Background: Although agri-food supply chains have become fundamental for food security throughout the world, some are associated with negative environmental and socioeconomic impacts. This study explores the possibilities of transforming the governance in Brazil’s soybean supply chain based on stakeholders’ accountability. Methods: We used secondary data from companies’ reports and statistical yearbooks to identify key stakeholders in the soybean supply chain as well as to explore trade-offs between reducing farming expansion into new agricultural frontiers and increasing investments in agro-industrial sectors. Results: The results reveal that at the global level, multinational corporations along with domestic groups should be held accountable for improving the governance of the soybean supply chain in Brazil since foreign multinationals control 65.4% of it. At the domestic level, losses in Brazil’s farming sector can either be offset by an 11% or 5.2% market share increase in the trading segment or in the whole supply chain, respectively, since Brazilian groups control 93.4% of the farming sector but only 7.1% of the agro-industrial sectors. Conclusions: Global accountability and domestic trade-offs are fundamental for transforming governance in global agri-food supply chains. They serve as a means for overcoming the current strategy of expansion into new farming frontiers.
1. Introduction
There is growing global interest in the transparency and sustainability of agri-food supply chains [1,2]. Improved relationship strategies in food supply chains (e.g., cooperation, coordination, and collaboration and accountability) can generate positive effects such sustainable gains in environmental and economic dimensions [3].
As some agri-food supply chains are largely international, making them more accountable and sustainable requires a collaborative effort among different countries and stakeholders [4]. Approaches toward sustainable and responsible agri-food supply chains, therefore, need to be promoted in different business sectors that include all the key stakeholders established along the supply chain [5,6,7].
There is a growing demand for transparency at the international market level over how supply chains source agricultural commodities [8]. As a practical outcome of flaws in transparency, part of the agricultural global flows remains unaccountable, which is detrimental to the agri-food sector as a whole.
Corporate sustainability as a business response to environmental issues requires improved transparency, governance, and accountability across the supply chain as a whole [7]. The existing top-down approaches such as market moratoriums [9], reductions in foreign direct investments [10], and commitments to eliminate deforestation from agricultural commodity chains [11] put pressure on domestic and multinational groups operating in the farming and trading sectors. However, by focusing on output segments, these approaches do not hold accountable the important multinational corporations involved in the input segments, such as seeds, machinery, agrochemicals, and fertilisers [8,12].
These approaches also offer no trade-offs between reducing domestic investments in farming expansion into new agricultural frontiers and increasing them in agro-industrial sectors such as seeds, machinery, fertilisers, agrochemicals, and trading. The opportunity costs of reducing the expansion of agricultural frontiers can be offset by investments in industrial segments that better remunerate capital and labour [12]. As a consequence, important stakeholders lack accountability in these current approaches to improve governance [13].
To improve the accountability in supply chains, those who will be sharing the costs for better practices, and the possible trade-offs for committed stakeholders, must be identified. There are two fundamental steps required to make this happen. First, the key stakeholders that need to be accountable in the process must be identified for the sake of transparency. Second, possible win-win solutions and trade-offs for addressing the existing challenges should be explored [14]. To this end, it is fundamental to have a comprehensive understanding of agri-food supply chains as a whole, as well as the market share held by key stakeholders.
This article adds to existing efforts to improve transparency in the soybean supply chain established in Brazil as a means to transform governance based on the accountability of companies and possible trade-offs for committed stakeholders. This can lead to future renegotiations of responsibilities targeting the development of fair, responsible, and sustainable agri-food supply chains.
This article specifically aims to identify the key stakeholders operating in the supply chain and their respective market shares as a means to discuss their accountability in the business. Further, it explores trade-offs between reducing the domestic investments in farming expansion and increasing the market share in agro-industrial segments that better remunerate capital and labour. By doing so, this study explores a novel conceptualisation of food supply chain transformations that can lead to greater benefits for different countries and stakeholders.
2. Theoretical Framework
2.1. Soybean Agribusiness
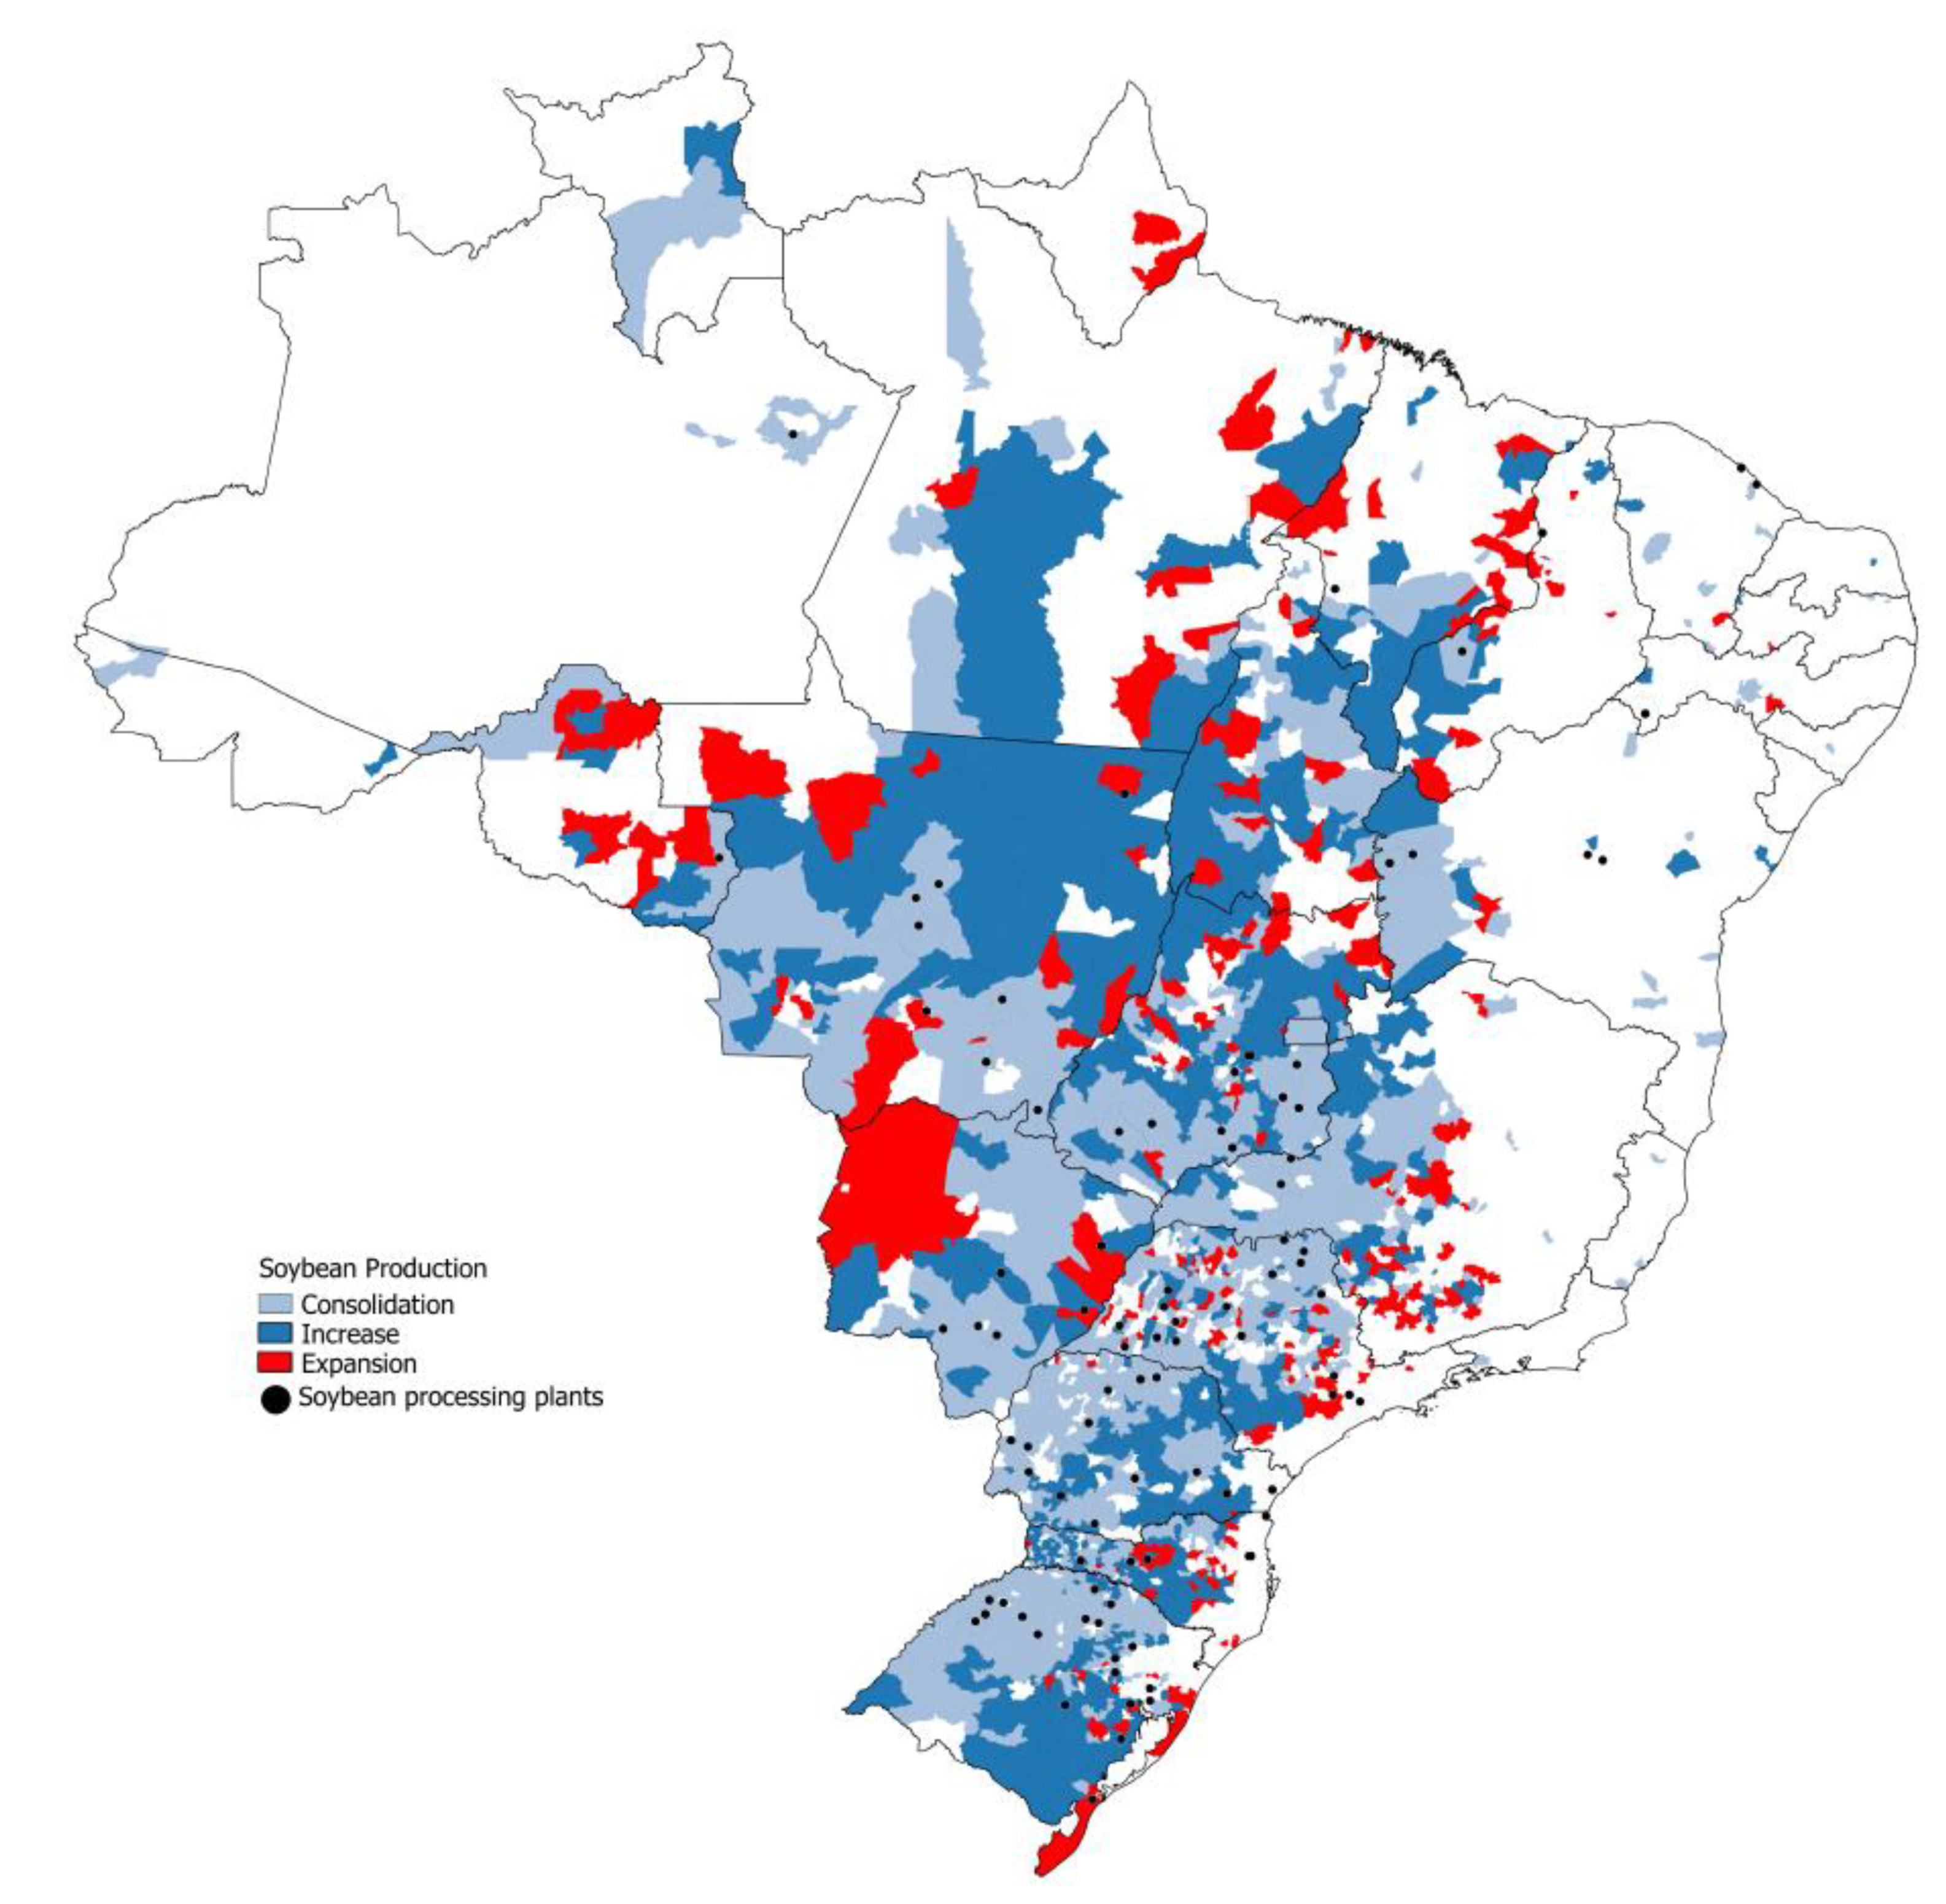
Soybean is the main crop in Brazil, both in scale and in value. In the 1990s, soybean advanced from the south towards the central area of Brazil, and in the 2000s, it expanded farther to the north [15]. Soybean monoculture is now expanding towards new agricultural frontiers such as parts of the Amazon and the Matopiba (Matopiba is a new agricultural frontier in Brazil that partially covers the states of Maranhão, Tocantins, Piauí, and Bahia) in the north and northeast of Brazil, respectively, as represented in Figure 1.
Brazilian environmental law and the forest code disciplines agricultural expansion into areas of native forests but the growing markets for soybeans drive farmers’ expansion towards new agricultural frontiers [16]. Part of the commodity-exporting farming sector strategy has been to laterally expand production into these new agricultural frontiers, particularly by reducing the so-called “Brazil cost” (transaction costs of producing and commercialising in Brazil), through the improvement of infrastructure (i.e., roads, storage conditions, railway construction, and improvements in ports) [17].
The most common implications from the expansion of the commodity-exporting farm sector in Brazil are land related conflicts [18] and the increase in deforestation rates [19]. Most commonly, land related conflicts happen when the local population, who are considered informal land holders (the so-called posseiros) are faced with immigrating large-scale farmers in search of new land to be farmed. There here are also similar cases of large-scale farmers invading traditional indigenous lands that are still not acknowledged by the government [20].
The expansion of the agricultural frontier has been causing relevant environmental impacts, particularly the deforestation of native forests. Farming expansion is one of the main causes of deforestation in the Amazon [21] and soybean expansion into the Matopiba region is taking place in the states with the greatest percentage of native vegetation of the Cerrado biome [17].
The growing demand for transparency at the international market level over how supply chains source agricultural commodities has resulted in important practical measures for curbing deforestation. Initiatives led by importing countries include the Amsterdam Declaration, a commitment by seven European countries to eliminate deforestation from agricultural commodity chains [11]. Brazil’s Soy Moratorium was the first voluntary zero-deforestation agreement implemented by major soybean traders agreeing not to purchase soy grown on deforested lands [9]. Recently, these efforts have also been underpinned by investors threatening to withdraw investments from companies connected to deforestation in the Amazon [10].
Initiatives toward sustainable supply chains focus on the traceability of goods produced by stakeholders established at chains (mainly farmers, soybean crushing plants, and traders). These stakeholders try to collaborate with members that are willing to adapt their practices to new market demands toward a free deforestation supply chain, as described in [7]. Even though progress has been made through these efforts, non-committed sectors maintain their business-as-usual practices by accessing less restrictive markets or leaking farming activities to other agricultural frontiers, such as the Cerrado Brazilian Savannah [11,16,21].
While only six large soy traders account for most soy exports from Brazil, soy businesses involve thousands of companies who may have different deforestation footprints, and must independently comply with any voluntary moratoriums [22]. Although most of Brazil’s agricultural output is deforestation-free, 2% of properties in the Amazon and Cerrado are responsible for 62% of all potentially illegal deforestation and roughly 20% of soy exports from both biomes to the EU may be contaminated with illegal deforestation [23]. These studies reveal the importance of targeting key market leading companies but also the need for considering the whole supply chain as a means for improving transparency and accountability [22,23].
2.2. Agribusiness Companies’ Accountability
Since the advent of the theoretical framework about the organisation–environment interface demonstrating that no business is an island, scholars have developed intersectoral analytical approaches involving whole supply chains [24]. Specifically in agri-food, supply chains include the farming sector, and the total sum of operations involved in the manufacture and distribution of farm supplies; the production operations of the farm; and the storage, processing, and distribution of farm commodities made from them [25].
Thus, firms are seen as no longer competing only as independent units, but also as members of supply chains or networks, connected to one another to organise and provide a product or service [26]. In this perspective, agri-food supply chains developed the ability to integrate themselves into a chain as a strategy to succeed, creating internal governances in order to increase coopetition [3]. Several challenges and opportunities arise from taking part in a supply chain that forces firms to look for more effective forms of coordinating flows, inside and outside the focal firm [27].
Considering agricultural and agro-industrial practices, new concerns have emerged [7], specifically in areas of the environment [12], transparency [8], and sustainability [28]. Therefore, the development of sustainable food supply chains has gained prominence in recent years [5], with special attention for local characteristics [1] and ecological, environmental, and social dimensions [3].
Through a food supply chain, stakeholders are characterised by interdependence [29]. Scholars sustain that beyond the interdependence based on economic behaviour and through the convergence of goals and needs, the stakeholders’ interaction and behaviour do not represent a disconnection from the scenario of social, cultural, and environmental reality, but are also situated on those [3]. The supply chain approach compose new frames that demand a new governance arrangement [5], and in some cases, a redesign of the food supply chain [30].
New frames create specific demands for specific resources that do not just address economic integration, but also correspond to scenarios that involve ecological, environmental, and social dimensions [29]. It is the case for globalised supply chains [5,31], and with multi-sectorial partnerships, as in the soybean produced in Brazil [8,12].
Thus, actions need to be coordinated and accountable to achieve a goal and determine responsibilities among supply chain stakeholders [7], [31]. A supply chain governance framework helps to better understand managerial issues such as how to select partners, how to go about designing partnership arrangements, and how partnerships can be developed to ensure long-term supply chain sustainability and success [32].
Stakeholders in supply chains create their own internal governance arrangements and a variety of external stakeholders may also seek to influence chain activities and/or outcomes [5]. This means that supply chain governance has a multi-institutional nature [5], besides being multi-sectorial [8,12]. Building on this background, studies on supply chains’ governance reinforce the importance of strategic alliances among stakeholders [33] realised in socio-technical arrangements [34].
This comprehensive approach helps us to address the functioning of agri-food supply chains, the role played by key stakeholders, and by exploring improvements in its governance based on stakeholders’ accountability and trade-offs. It is also useful for identifying the responsibilities and alliances of different stakeholders particularly in hierarchical structures. Even though it is focused on private firms, it can be complemented by a more comprehensive approach involving other stakeholders such as the state.
3. Methods
Similar to what was conducted in previous studies [8,12], key stakeholders in the soybean supply chain were identified based on the definition of the most popular inputs used in each production stage, their suppliers, and the country of origin of the companies involved. The relevance of each stakeholder was estimated based on their market share in each business segment as described in [35]. Market share information was obtained in the companies’ reports as well as in statistical yearbooks from producer associations that annually estimate the market participation of their members in Brazil, as described in Table 1.
For market share estimations, we first quantified the total sales in the country for each input per segment (e.g., 5580 soybean combines sold in Brazil in the 2019/20 agricultural year). We then identified the main international and domestic companies operating in each segment (e.g., CNH, John Deere, and AGCO in the case of soybean combines), and their total sales (e.g., 2903 soybean combines by CNH, 2269 by John Deere, and 408 by AGCO). To estimate the total market share of domestic groups in each segment of the supply chains in the sample, we calculated and added the market shares of all Brazilian groups. The results are found in Table 2. Information was collected for the years 2015 and 2020 as a means to measure market share evolution over time.
Trade-offs between reduced domestic investments in the farming sector and the increased market share of domestic groups in the agro-industrial segments were explored. This was performed according to the market size of each soybean supply chain stage, which was estimated based on the literature review. The market size of all studied segments (from seeds to trading) was estimated based on annual market transactions in each segment, as presented in Table 3. From this information, scenarios were projected to offset the opportunity costs of curbing agricultural expansion into the two main agricultural frontiers in Brazil: The Amazon with 4.5 million hectares planted with soybean and the Matopiba region of the Cerrado with 5.7 million hectares planted with soybean.
Trade-offs between reducing investments in farming expansion and increasing market share in agro-industrial sector were explored for the following scenarios: increased domestic market share in the trading segment and in the whole supply chain. Highlighting the significance of agri-food in 2019, the agri-food sector was responsible for 21.2 % of the Brazilian gross domestic product (GDP), while the farming sector represented 4.8% of the national GDP [41].

Table 3.
Market size of each business segments (in USD billions).
| Segment | Market Size in 2020 (in USD Billion) | Proportion of the Whole Market (%) | Source |
|---|---|---|---|
| Seeds | 2.0 | 2.3 | BRL 8 billion worth market [36] |
| Machinery | 2.3 | 2.6 | BRL 11 billion worth market, 85% soybean [42] |
| Fertilisers | 4.7 | 5.4 | Soybean represents 47% of Brazil’s fertiliser market worth USD 10.2 billion [37] * |
| Agrochemicals | 8.1 | 9.3 | Soybean represents 71% of Brazil’s pesticides market worth USD 11.5 billion (Santos & Glass, 2018) |
| Farming | 28.6 | 32.9 | Considering 114.8 tons produced in 2020 [43] |
| Trading | 41.2 | 47.5 | USD 34.7 billion exported plus domestic market [44] |
| Total | 86.9 | 100 |
* Based on raw materials and not on manufactured fertilisers.
4. Results
4.1. Key Stakeholders Based on Market Shares
In Brazil, 91.8% of the soybean cultivated is transgenic and the German multinational Bayer controls 90% of Brazil’s transgenic market share. Although Brazil has companies that dominate soy genetics, transgenics are controlled by multinationals that receive royalties from Brazilian companies licensed to use their technology in seed production. Domestic seed producers such as Tropical Melhoramento and Genética (TMG) who have created their own germplasm improvement programmes and pay royalties for the use of transgenics, hold 25% of the market share. Studies show that multinationals that own the characteristics transferred to local germplasm make about 65% of the profit from the final price of soybeans, while the other 35% of the profit is shared between the germplasm developers and seed multipliers [45]. Thus, in the segment of the chain related to the production of seeds, domestic capital would be equivalent to only 8.7% for the agricultural year of 2019/2020 (35% of 25% market share), as described in Table 2.
The machinery sector is a worldwide oligopoly as a result of mergers and acquisitions headed by the following major international groups: John Deere, CNH (holder of the brands Case and New Holland), and AGCO (holder of the brands Massey Ferguson and Valtra). In Brazil, the three companies together control 99.6% of tractor sales and 100% of combine harvester sales [39]. The national capital share for the agricultural year of 2019/2020 was estimated at 0.2% when including the Brazilian company Agrale, see Table 2, which produces tractors rarely used for soybean due to their relatively small size. There is a greater market share of domestic companies in the case of agricultural implements, such as ploughs, scarifiers, limestone spreaders and cultivators, although precise data on market share is not available.
The following two types of companies operate in the fertiliser segment: those that produce raw materials (or simple fertilisers) and those that manufacture formulated fertilisers. Most of the raw material for the fertilisers used in Brazil is imported. In the case of soybeans, phosphorus (44% imported) and potassium (95% imported) are the most commonly used macronutrients [37], since soybeans do not require nitrogen fertilisation and there is little use of micronutrient fertilisation. In Brazil, the Vale Company, controlled by Brazilian groups, used to be the largest producer of phosphorus and the only producer of potassium, a sector that is now controlled by the multinational Mosaic. It is estimated that domestic groups produce 8.7% of the fertilisers consumed in Brazil (17.5% of phosphorus and 0% of potassium), as in Table 2.
In relation to fertiliser manufacturers, the market in Brazil is led by the multinational Yara, with domestic groups holding 29.8% of the market. The Fertipar Group and Heringer (today with 56% of national capital) are the Brazilian companies with the largest participation in the manufacturing of fertilisers in Brazil. The rest of the market is serviced by domestic companies of a regional nature and by multinational groups. Considering an 8.7% national share in the production of raw materials and a 29.8% share in the production of fertilisers, it is estimated that Brazilian participation in the fertiliser market has an average of 19.2%, as shown in Table 2.
In Brazil, 94% of total agrochemical (pesticides) sales refer to the following three classes of products, defined by their purpose: insecticides (33%), herbicides (32%), and fungicides (29%). Soybean farming is the main consumer of agrochemicals in Brazil, accounting for 50% of sales according to the National Union of the Plant Defence Products Industry [46]. There are the following two business segments: products with patents that require innovation, controlled by multinational groups; and generic products, authorised after patent exclusivity periods end, in which the industry with domestic capital still has a stake. In the segment of products with patents, there is ample competition, but few of them have a significant market share. In Brazil, the multinationals control 94.2% of sales, specifically Syngenta/ChemChina (18.6%), Bayer (15.7%), and Basf (9.2%), and other multinational groups with smaller slices. The companies with national capital only make up 5.8% of the total of commercial agrochemicals traded in the country [38]. This percentage is made up of domestic companies such as Nortox and Ourofino, and a group of small businesses.
Brazil has been experiencing changes in the profile of the soybean grower. The private producer is now competing with large national corporations and multinational companies such as Los Grobo, which leases land and manages crops, and Agrinvest, which purchases land for agricultural production. In Brazil, there are 33,200 registered properties belonging to foreigners, occupying 3.8 million hectares [47]. The area used for soybeans in Brazil is around 57.2 million hectares and it has been estimated that 93.4% of this area belongs to Brazilian farmers (see Table 2).
The large multinational export companies such as ADM, Bunge, Cargill, and Dreyfus (known as the ABCD group) have oligopolised the governance of the soybean supply chain [48]. Recently, China celebrated the purchase of Noble Agri (trade) by China National Cereals, Oils, and Foodstuffs Corporation (COFCO) as a way to ensure their presence in 21 countries, including Brazil and Argentina, its two largest soy suppliers. It is estimated that domestic capital controlled about 16.1% of the commercial soybean market in the country in the agricultural year of 2019/2020, less than the 30.7% market share of 2015, as in Table 2. Brazilian groups include Amaggi, Coamo (a cooperative), Cutrale, Bianchini, Granol, Caramuru, and Comigo (a cooperative).
The results reveal that the market share held by Brazilian groups as a whole dropped between 2015 and 2020. In this time span, there were changes in the share held by domestic companies in the segments of seeds (from 16.5 to 8.7%), fertilisers (from 33.5 to 19.2%), pesticides (from 4.3 to 5.8%), machinery (from 1.9 to 0.2%), and in the trading sector (from 30.7 to 16.1%). Proportionally, the market share held by Brazilian groups as a whole dropped from 40% in 2015 to 34.6% in 2019/2020. The share of domestic groups in the capital and technology intensive sectors (excluding the farming sector) dropped from 12.5% in 2015 to 7.1% in 2020.
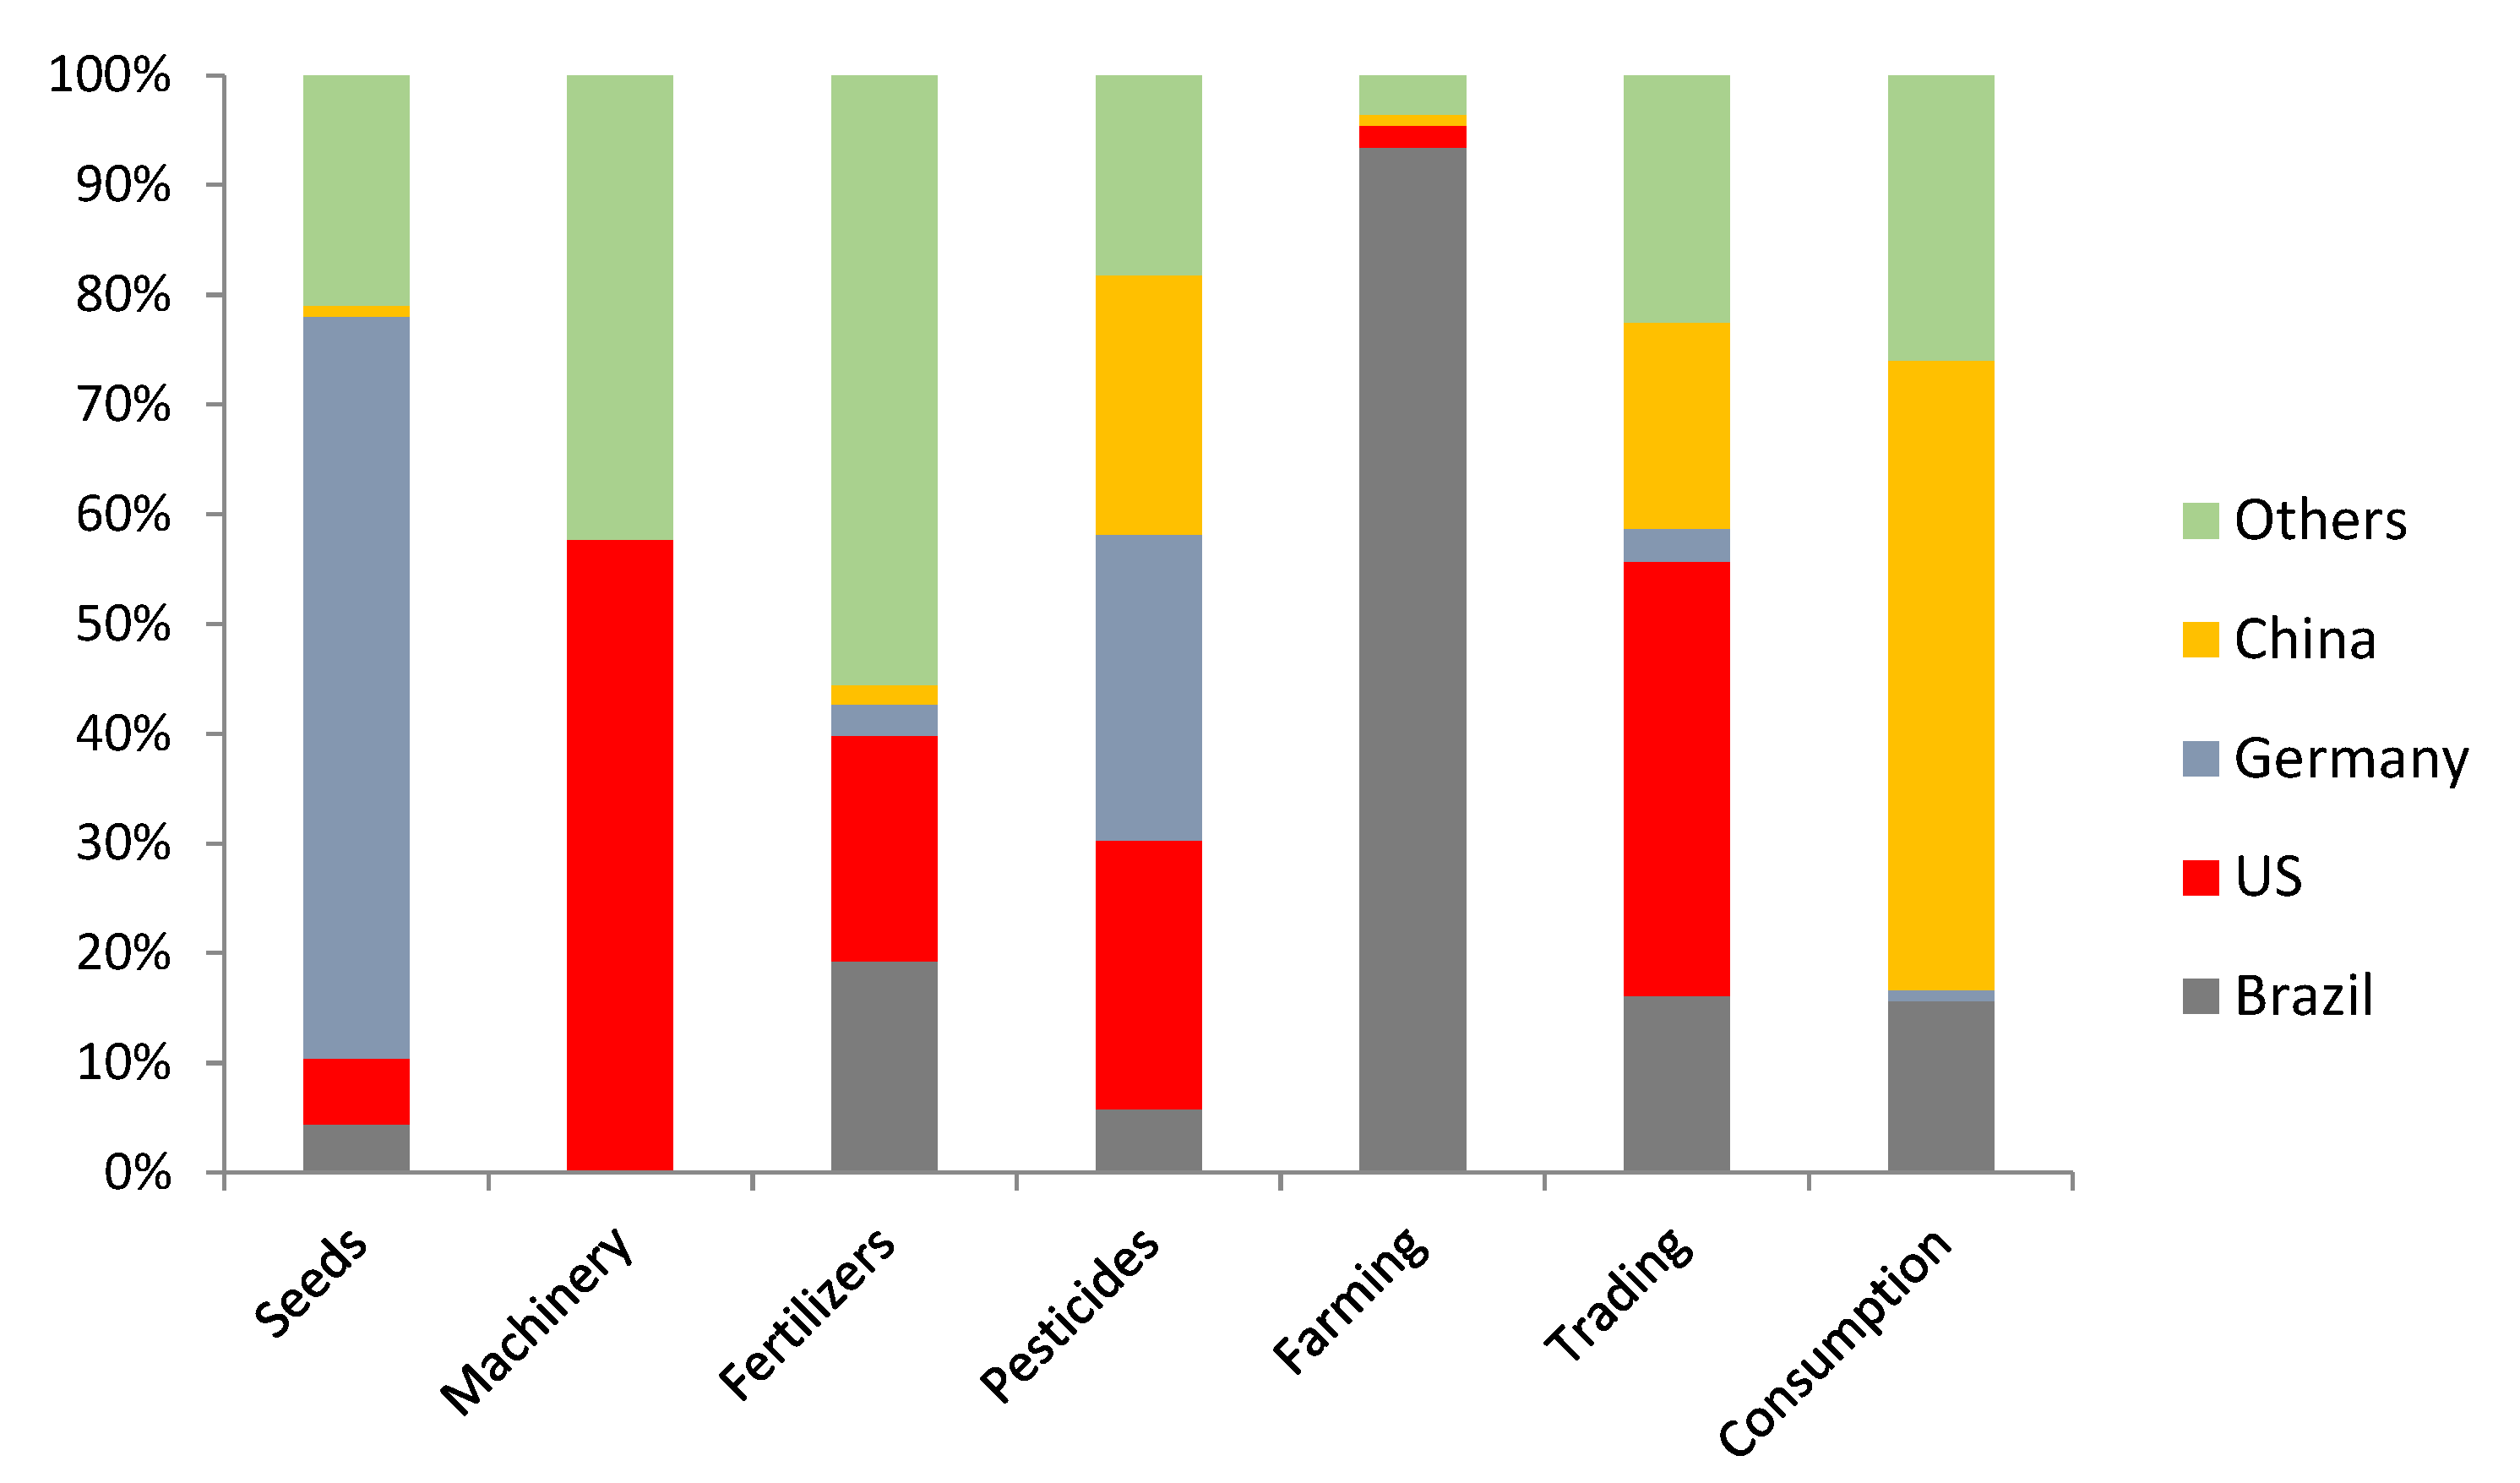
Figure 2 summarises the market share held by Brazilian vis à vis multinational companies in key sectors of Brazil’s soybean supply chain for the agricultural year of 2019/2020. It highlights that key agro-industrial segments (such as seeds, machinery, and pesticides) are controlled mainly by multinational companies.
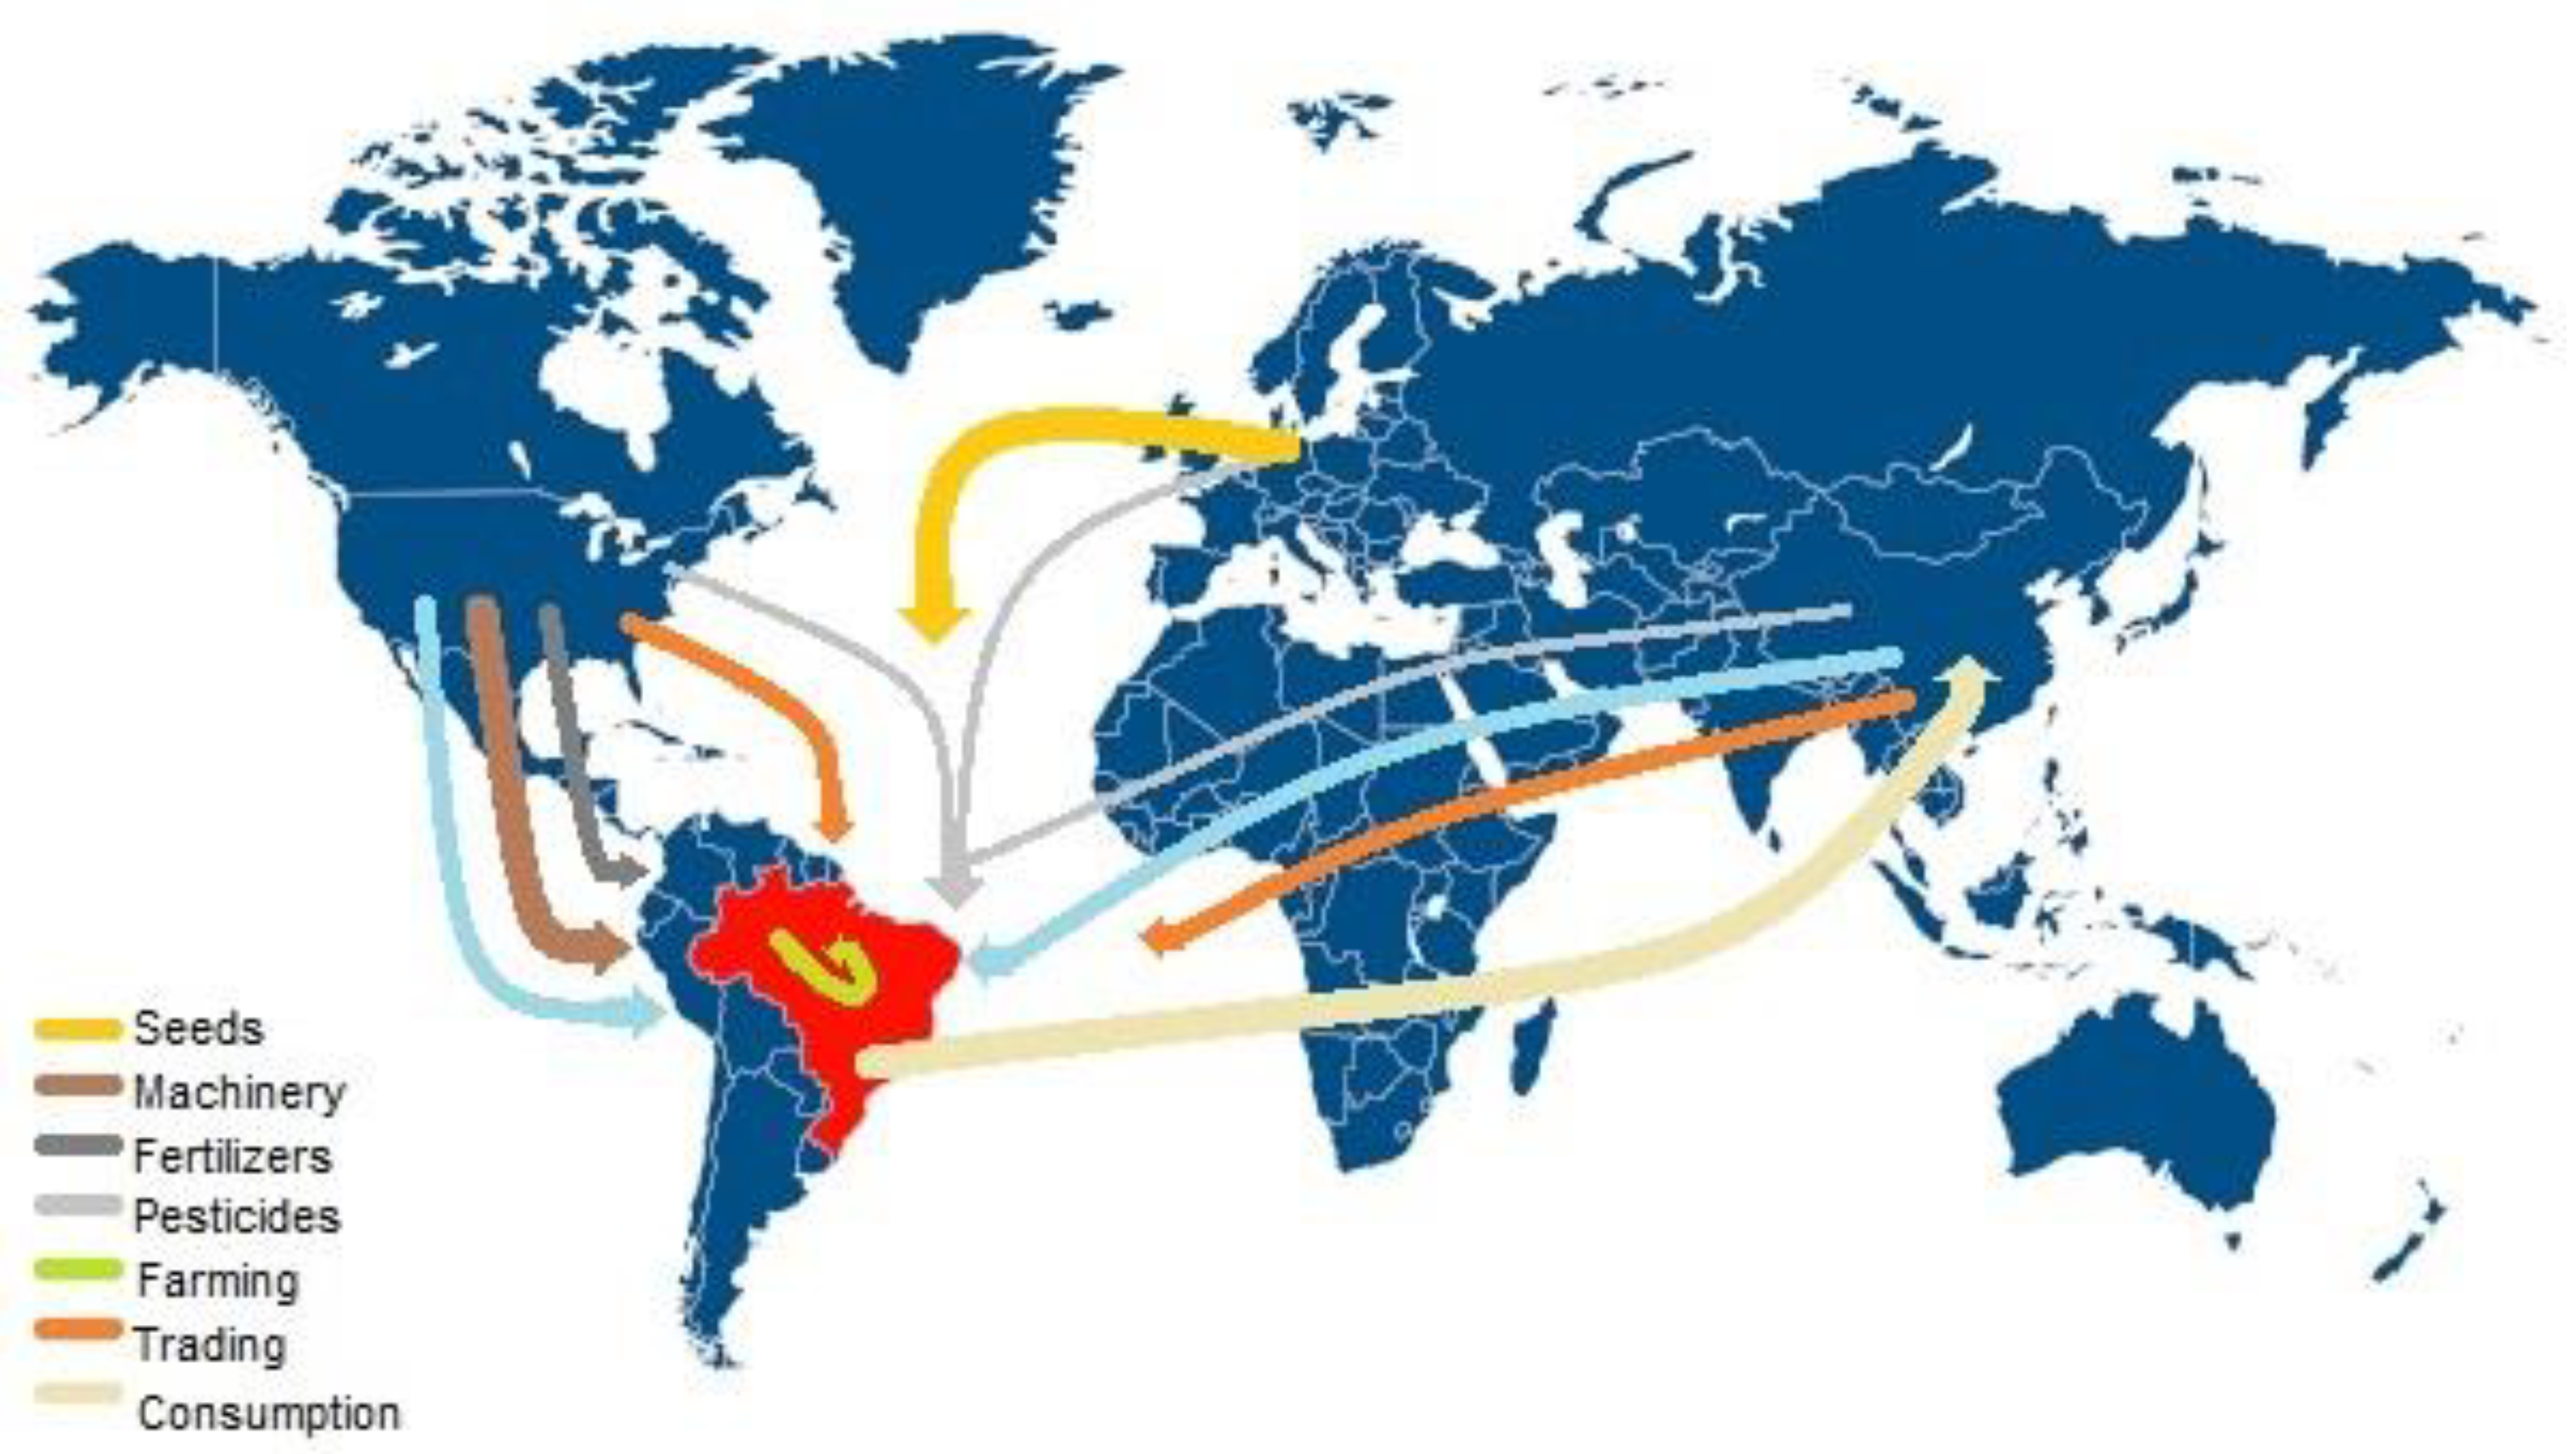
While domestic groups have an important market share in the farming sector, multinational companies tend to control the industrial segments of the production chain. German companies control the seed sector and have an important market share in the pesticides sector. American companies control the machinery sector and have important shares of the pesticides and trading sectors. Chinese companies have a relevant market share in the pesticide and trading sectors, as described in Figure 3. The soybean produced in Brazil is exported mainly to China (57.4%) and domestic consumption in Brazil is the second largest market (15.6%) [48].
4.2. Trade-Offs Based on Market Size
The studied segments of the soybean production chain in Brazil generated USD 86.9 billion worth of gross income in the agricultural year of 2019/2020 (see Table 3). The seed segment had a USD 2 billion income, while sales of tractors and combine harvesters resulted in a USD 2.6 billion gross revenue, as described by companies’ reports. Fertilisers generated a USD 4.7 billion gross income and the companies in the agrochemicals segment had a gross income of USD 8.1 billion. Estimations were also made for the farming and trading segments that accounted for USD 28.6 billion and USD 41.2 billion worth of markets, respectively [44].
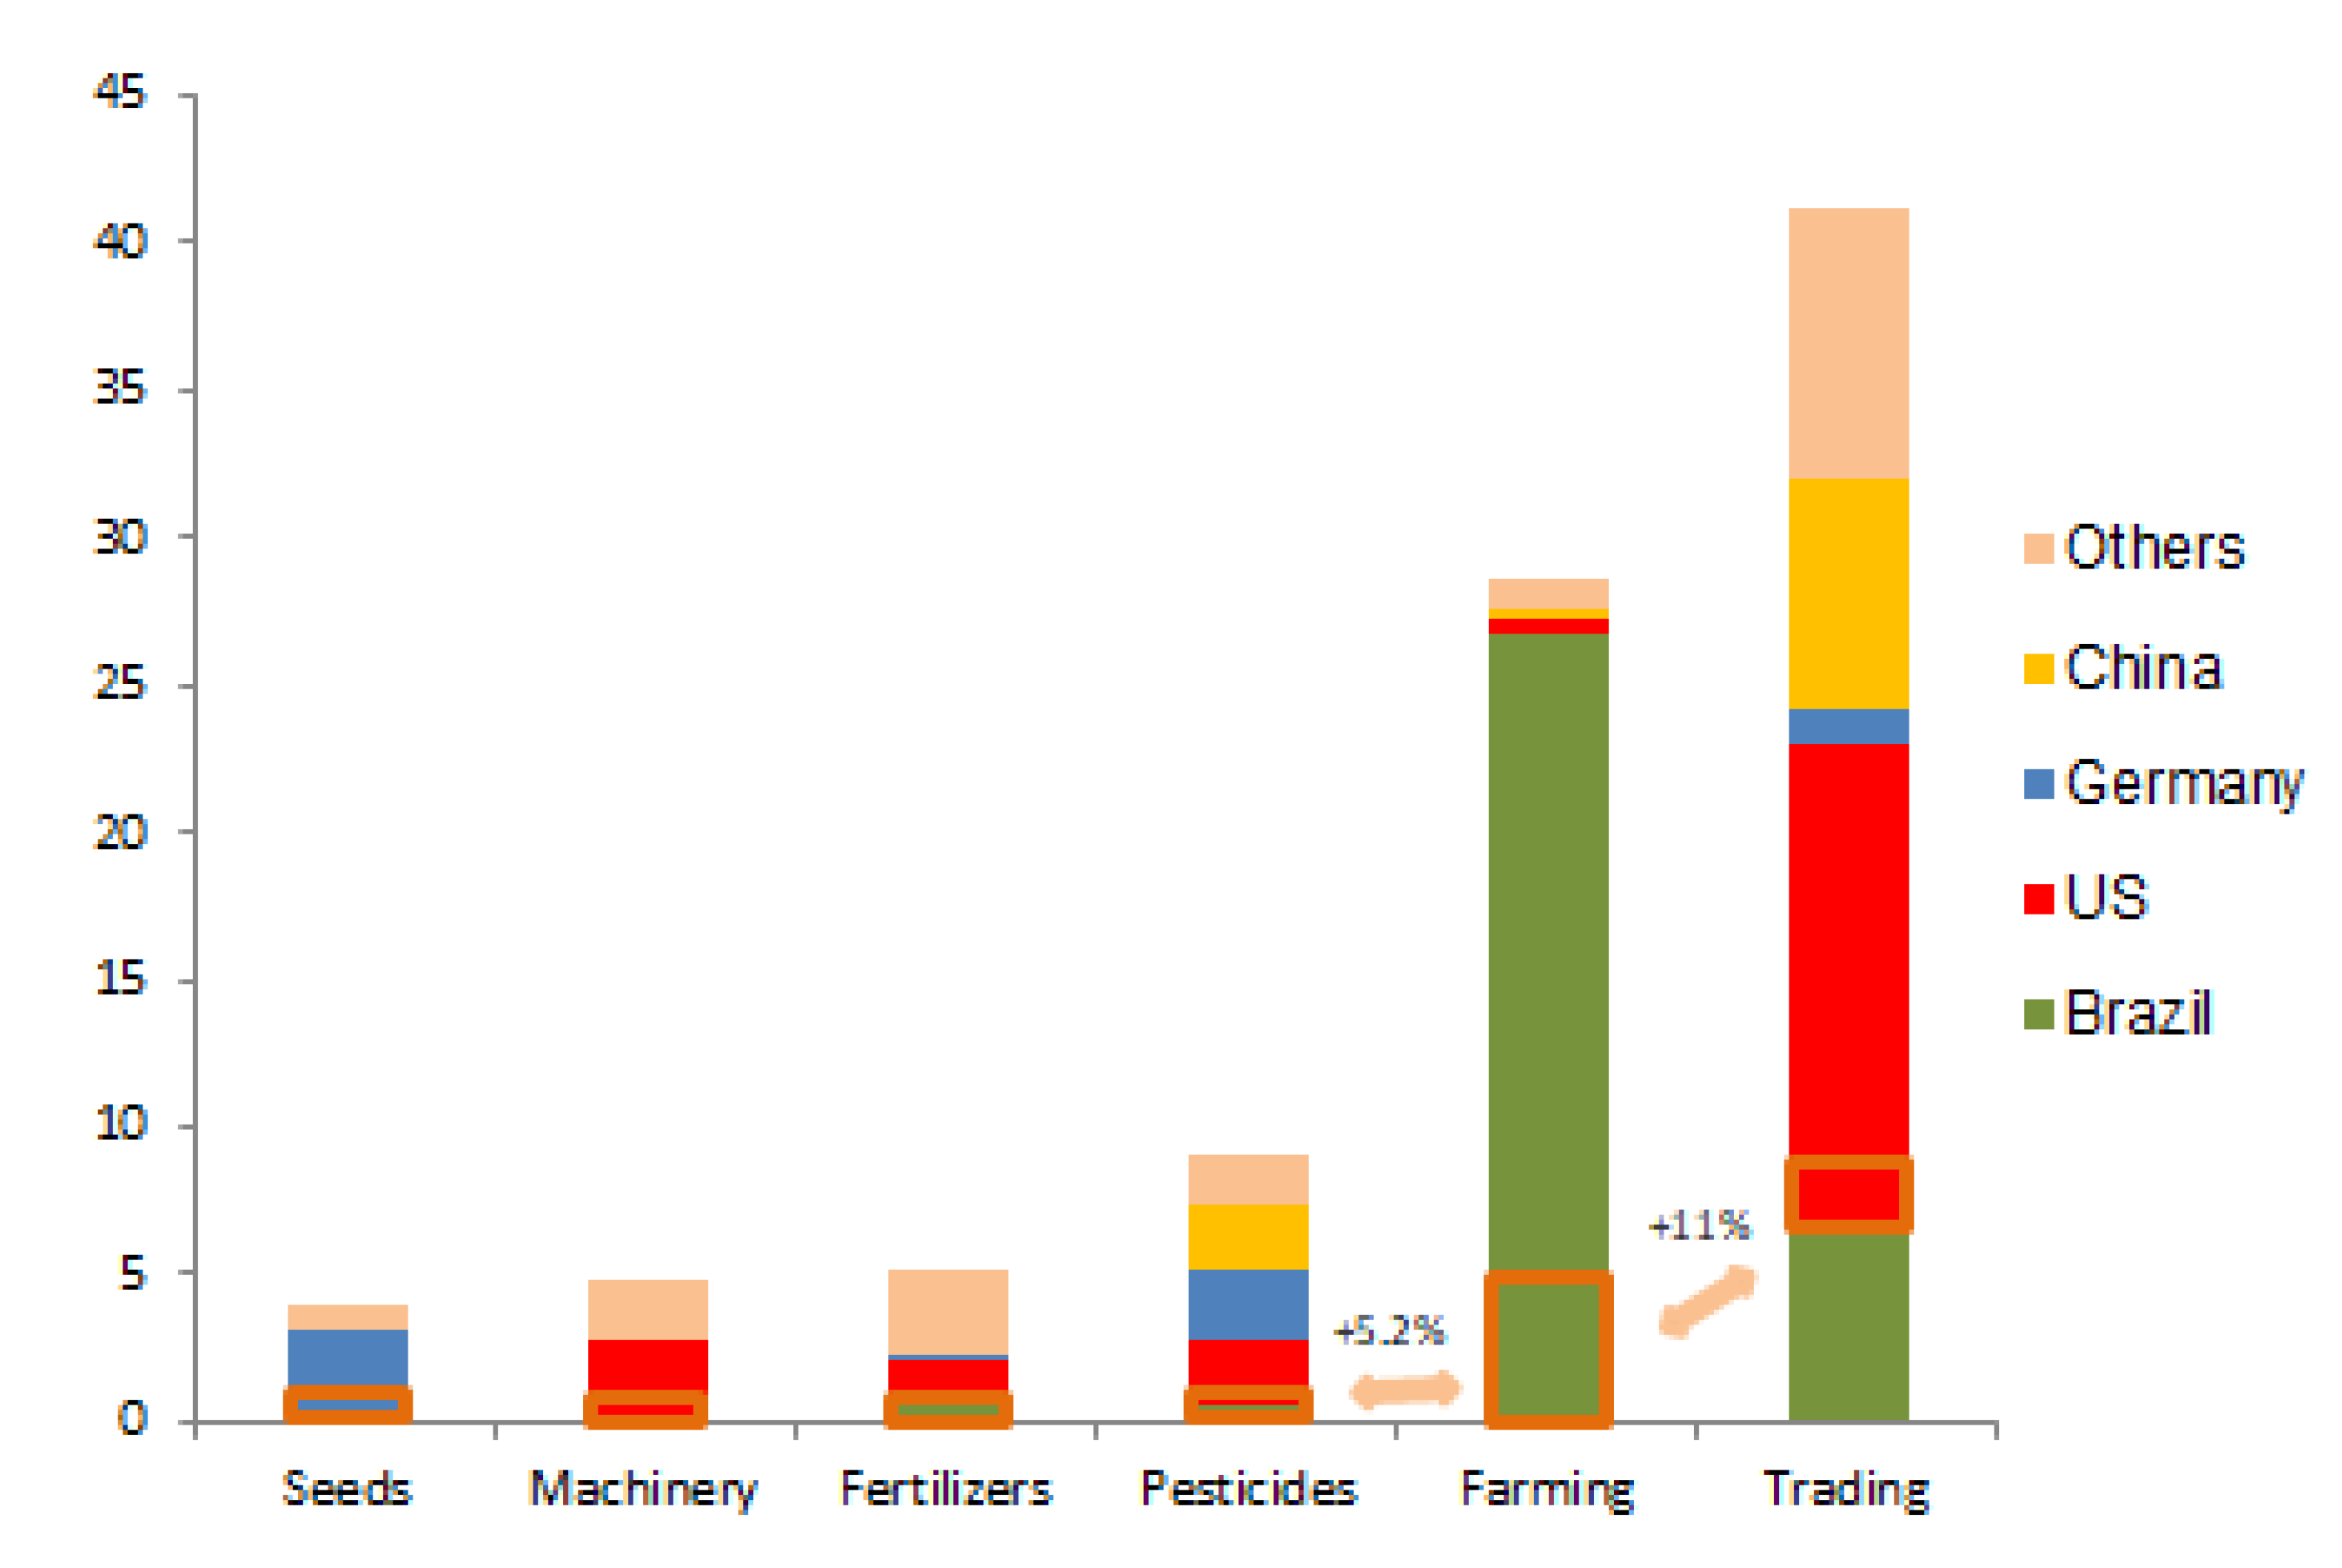
Figure 4 summarises the market size of each segment in the soybean production chain established in Brazil and the market share held by domestic vis à vis multinational companies. It also presents two possible scenarios for trade-offs between reduced farming expansion into new agricultural frontiers and increased market share in agro-industrial sectors. In the first scenario, the opportunity costs of hindered farming expansion are offset by an 11% domestic market share increase in the trading segment. In the second scenario, the opportunity costs are offset by a 5.2% domestic market share increase in the whole supply chain.
Both scenarios estimate the opportunity costs of stopping the two main agricultural frontiers in Brazil: the Amazon frontier with 4.5 million hectares planted with soybean and the Matopiba region of the Brazilian Savannah (Cerrado) with 5.7 million hectares. Soybean farming generates USD 3.5 billion income per year in the Amazon and USD 4.5 billion per year in the Matopiba, as shown in Table 3.
The results reveal that a USD 4.5 billion gross income in farming activities can either be offset by an 11 or 5.2% domestic market share increase in the trading segment or in the whole supply chain, respectively, as shown in Table 4. In the first scenario, a domestic share in the trading segment equivalent to 27% of the total (the current 16% plus 11%) would be enough for offsetting the income of soybean farms in the Amazon or in the Matopiba region (USD 4.5 billion). In the second scenario, the same outcome can be obtained with a 12.3% domestic market share in the whole soybean production chain (the current 7.1% plus 5.2%). In both cases, the estimated increased market share is smaller than the one held by domestic groups in 2015, that is, 30.7% in the trading segment and 12.5% in the industrial segments.
5. Discussion
Efforts to promote sustainable and responsible agri-food supply chains have focused on top-down approaches such as market moratoriums [9], reductions in foreign direct investments [10], and commitments to eliminate deforestation from agricultural commodity chains [11]. These measures have proved efficacious in committing the more modern agri-food supply chain to initiatives such as the soy moratorium [9]. However, current efforts still need to address the following two important issues for improved transparency and governance: 1. Make all the stakeholders accountable, including multinational companies and 2. Explore the trade-offs between reduced farming expansion into new agricultural frontiers and domestic investments in agro-industrial segments.
Sectors not committed to improved governance tend to maintain their business-as-usual practices and undermine the whole supply chain reputation [11]. Therefore, top-down enforcement approaches have to be complemented by horizontal efforts to improve accountability in agri-food supply chains. To this end, it is fundamental that supply chains are well understood, and that the roles and responsibilities of key stakeholders are made transparent and, in some cases, renegotiated [50]. It is possible based on a broad picture of the supply chains including the market share held by the key stakeholders.
Corporate sustainability in agri-food supply chains requires improved accountability across the supply chain as a whole [7]. Agri-food supply chains include the farming sector, and the total sum of operations involved in the manufacture and distribution of farm supplies as well as the processing and distribution of farm commodities [3]. Several opportunities, but also responsibilities, arise from taking part in a supply chain [5]. New concerns have emerged in agri-food supply chains [7], specifically in areas of the environment [12], transparency [8], and sustainability [28]. For addressing these issues, recent studies reveal that the supply chains’ governance should be based on multi-stakeholder efforts [5,8], [12].
This study reveals that multinational corporations are the key stakeholders in the soybean production chain established in Brazil. In all the soybean supply chain agro-industrial segments, multinationals hold the majority of the market share and this foreign control has grown in recent years [49]. Given the hierarchies established in the hybrid forms of governance in supply chains [12], powerful stakeholders such as multinational corporations can play a role in setting up strategic alliances for improved governance [28].
This study also adds to current efforts focusing on the output sectors such as farmers [21] and traders [48] by providing a comprehensive understanding of the whole supply chain including the input sectors (seeds, fertilisers, agrochemicals, and machinery) that should also take part in an improved effort for accountability (see Figure 2). Seeds and pesticides companies have been developing new varieties adapted to new agricultural frontiers prompting conflicts among farmers and among farmers and local communities [51]. Tractors and other machinery are used to introduce plantations in illegally deforested areas [52], and fertilisers make planting soybean in new agricultural frontiers viable [53]. Ultimately, these are business sectors profiting from the expansion of agricultural frontiers [54].
Although the governance is part of companies’ strategies for economic performance, in the soybean supply chain case, the existing governance has not avoided negative social and environmental externalities [17]. Therefore, besides the private sector, governments also have a role to play in promoting transparency and supporting sustainable business. As most of the multinational companies are based in wealthy economy countries such as the United States, Germany, and China, these countries should take an active role in promoting the accountability of their home companies operating in developing countries [55].
Local stakeholders including companies, governments, farmers, and local communities can also play a role in improved governance [1]. Domestic groups can explore trade-offs between reducing farming expansion and increasing their market share throughout agro-industrial segments upstream and downstream of farms, as represented in Figure 4. The advances of agri-food production in Brazil offer areas of opportunities for Brazilian groups ranging from strengthening domestic seed-producing companies to the consolidation of regional trading companies. It is by investing in the agro-industrial sectors that will better remunerate capital and labour [56], and going beyond the current focus on the primary production of commodities, that developing countries will benefit from agri-food expansion for their development [57].
To this end, agricultural policy in Brazil needs to evolve from the current almost exclusive focus on subsidised credit (mainly funding or “working” credit for large farmers) to more comprehensive investments that can bring longer-term returns to the agri-food sector as a whole [17]). Rural credit implies the risk of serving only to compensate the low profit margins of farmers who operate in the agri-food supply chains increasingly controlled by multinational groups. As it is now, credits are used by farmers as working capital to buy inputs such as seeds and pesticides from multinationals, which ultimately implies transferring money from Brazilian taxpayers to foreign corporations.
6. Conclusions
This study adds to existing efforts to improve transparency in the soybean supply chain by revealing the key companies operating in each production stage (from seeds to trading) as a means to transform the business based on companies’ accountability. The results highlight that all the firms established along the supply chain should be held accountable for improved governance. The efforts for doing so should involve both multinational corporations and domestic groups.
Specifically, this study reveals that multinational corporations established along Brazil’s soybean supply chain controls 91.3% of the seed, 99.8% of the machinery, 80.8% of the fertiliser, 94.2% of the agrochemicals, and 83.9% of the trading sectors. German companies control the seeds sector and have an important market share in the agrochemical business. Companies in the US control the machinery sector and have important shares in the agrochemical and trading sectors. Chinese groups have a relevant market share in the agrochemical and trading sectors.
As Brazilian groups control 93.4% of the farming sector, but only 7.1% of the agro-industrial sector, they should explore trade-offs between reducing investments in farming expansion into new agricultural frontiers and increasing their market share in agro-industrial segments. This study reveals two possible trade-offs between reduced farming expansion and increasing the industrial market share. The opportunity costs of hindered farming expansion can be offset either by an 11% domestic market share growth in the trading segment or by a 5.2% domestic market share growth in the whole supply chain. Domestic investments in the agro-industrial segments should be promoted as an alternative to investments in farming expansion into new agricultural frontiers.
These results reveal the need for structural changes as a means to improve governance and corporate sustainability in the soybean supply chain. The necessary improvements include i) increasing the accountability of multinational companies once they are the gearing parts of the soybean agri-food supply chain in Brazil and elsewhere; ii) increasing the market share held by domestic agro-industrial companies in domestic business as a means to promote regional development; iii) discouraging farmer expansion into new agricultural frontiers with high social and environmental costs by replacing the current agricultural policy focused on credit for large farmers through comprehensive investments targeting agri-food supply chains as a whole. By unveiling it, this study highlights the need for a novel conceptualisation of food supply chain transformations that can lead to greater benefits for different countries and stakeholders.
Author Contributions
Conceptualisation, G.M.; methodology, G.M.; investigation, G.M.; data curation, G.M.; analysis and draft preparation, G.M.; writing—review and editing, K.T.; literature review, K.T. All authors have read and agreed to the published version of the manuscript.
Funding
This research did not receive any specific grant from funding agencies in the public, commercial, or not-for-profit sectors.
Institutional Review Board Statement
Not applicable.
Informed Consent Statement
Not applicable.
Data Availability Statement
Dada supporting reported results can be found at: http://0-dx-doi-org.brum.beds.ac.uk/10.5801/ncn.v24i1.8521.
Conflicts of Interest
The authors declare no conflict of interest.
References
- de Janvry, A.; Sadoulet, E. Using agriculture for development: Supply- and demand-side approaches. World Dev. 2020, 133, 105003. [Google Scholar] [CrossRef]
- FAO. The State of Food and Agriculture, 1st ed.; FAO: Rome, Italy, 2019. [Google Scholar]
- Thomé, K.M.; Cappellesso, G.; Ramos, E.L.A.; Duarte, S.C.d.L. Food Supply Chains and Short Food Supply Chains: Coexistence conceptual framework. J. Clean. Prod. 2021, 278, 123207. [Google Scholar] [CrossRef]
- Godar, J.; Suavet, C.; Gardner, T.A.; Dawkins, E.; Meyfroidt, P. Balancing detail and scale in assessing the sustainability of commodity supply chains. Environ. Res. Lett. 2016, 11, 1–12. [Google Scholar] [CrossRef] [Green Version]
- Boström, M.; Jönsson, A.M.; Lockie, S.; Mol, A.P.; Oosterveer, P. Sustainable and responsible supply chain governance: Challenges and opportunities. J. Clean. Prod. 2015, 107, 1–7. [Google Scholar] [CrossRef]
- Husted, B.W.; de Sousa-Filho, J.M. The impact of sustainability governance, country stakeholder orientation, and country risk on environmental, social, and governance performance. J. Clean. Prod. 2017, 155, 93–102. [Google Scholar] [CrossRef]
- Koberg, E.; Longoni, A. A systematic review of sustainable supply chain management in global supply chains. J. Clean. Prod. 2018, 207, 1084–1098. [Google Scholar] [CrossRef]
- Jia, F.; Peng, S.; Green, J.; Koh, L.; Chen, X. Soybean supply chain management and sustainability: A systematic literature review. J. Clean. Prod. 2020, 255, 120254. [Google Scholar] [CrossRef]
- Gibbs, H.K.; Rausch, L.; Munger, J.; Schelly, I.; Morton, D.C.; Noojipady, P.; Soares-Filho, B.; Barreto, P.; Micol, L.; Walker, N.F. Brazil’s Soy Moratorium. Science 2015, 347, 377–378. [Google Scholar] [CrossRef] [PubMed]
- Spring, J. Exclusive: European Investors Threaten Brazil Divestment over Deforestation; Reuters: London, UK, 2020; Available online: https://www.reuters.com/article/us-brazil-environment-divestment-exclusi/exclusive-european-investors-threaten-brazil-divestment-over-deforestation-idUSKBN23Q1MU (accessed on 20 December 2020).
- Green, J.M.H.; Croft, S.A.; Durán, A.P.; Balmford, A.P.; Burgess, N.D.; Fick, S. Linking global drivers of agricultural trade to on-the-ground impacts on biodiversity. Proc. Natl. Acad. Sci. USA 2019, 116, 23202–23208. [Google Scholar] [CrossRef] [PubMed] [Green Version]
- Kamali, F.P.; Meuwissen, M.P.M.; de Boer, I.J.M.; van Middelaar, C.E.; Moreira, A.; Lansink, A.G.J.M.O. Evaluation of the environmental, economic, and social performance of soybean farming systems in southern Brazil. J. Clean. Prod. 2017, 142, 385–394. [Google Scholar] [CrossRef]
- Negash, M.; Lemma, T.T. Institutional pressures and the accounting and reporting of environmental liabilities. Bus. Strategy Environ. 2020, 29, 1941–1960. [Google Scholar] [CrossRef]
- Gualandris, J.; Klassen, R.; Vachon, S.; Kalchschmidt, M.G.M. Sustainable evaluation and verification in supply chains: Aligning and leveraging accountability to stakeholders. J. Oper. Manag. 2015, 38, 1–13. [Google Scholar] [CrossRef] [Green Version]
- Cattelan, A.; Dall’Agnol, A. The rapid soybean growth in Brazil. OCL 2018, 25, D102. [Google Scholar] [CrossRef] [Green Version]
- Lima, M.; Junior, C.A.S.; da Rausch, L.; Gibbs, H.K.; Johann, J.A. Demystifying sustainable soy in Brazil. Land Use Policy 2019, 82, 349–352. [Google Scholar] [CrossRef]
- Medina, G.; Santos, A. Curbing enthusiasm for Brazilian agribusiness: The use of actor-specific assessments to transform sustainable development on the ground. Appl. Geogr. 2017, 85, 101–112. [Google Scholar] [CrossRef]
- CPT. Conflitos no campo no Brasil 2020. Available online: https://www.cptnacional.org.br/publicacoes-2/destaque/5664-conflitos-no-campo-brasil-2020 (accessed on 20 June 2021).
- Ferrante, L.; Fearnside, P.M. Brazil’s new president and ‘ruralists’ threaten Amazonia’s environment, traditional peoples and the global climate. Environ. Conserv. 2019, 46, 261–263. [Google Scholar] [CrossRef]
- Villén-Pérez, S.; Moutinho, P.; Nóbrega, C.C.; De Marco, P. Brazilian Amazon gold: Indigenous land rights under risk. Elem. Sci. Anthr. 2020, 8. [Google Scholar] [CrossRef]
- Stabile, M.C.C.; Guimarães, A.L.; Silva, D.S.; Ribeiro, V.; Macedo, M.N.; Coe, M.T.; Pinto, E.; Moutinho, P.; Alencar, A. Solving Brazil’s land use puzzle: Increasing production and slowing Amazon deforestation. Land Use Policy 2020, 91, 104362. [Google Scholar] [CrossRef]
- Soterroni, A.C.; Ramos, F.M.; Mosnier, A.; Fargione, J.; Andrade, P.R.; Baumgarten, L.; Pirker, J.; Obersteiner, M.; Kraxner, F.; Câmara, G.; et al. Expanding the soy moratorium to Brazil’s Cerrado. Sci. Adv. 2019, 5. [Google Scholar] [CrossRef] [Green Version]
- Rajão, R.; Soares-Filho, B.; Nunes, F.; Börner, J.; Machado, L.; Assis, D.; Oliveira, A.; Pinto, L.; Ribeiro, V.; Rausch, L.; et al. The rotten apples of Brazil’s agribusiness. Science 2020, 369, 246–248. [Google Scholar] [CrossRef]
- Håkansson, H.; Snehota, I. No business is an island: The network concept of business strategy. Scand. J. Manag. 1989, 5, 187–200. [Google Scholar] [CrossRef]
- Ahumada, O.; Villalobos, J.R. Application of planning models in the agri-food supply chain: A review. Eur. J. Oper. Res. 2009, 196, 1–20. [Google Scholar] [CrossRef]
- Lambert, D.; Cooper, M. Issues in Supply Chain Management in Indian Agriculture. Ind. Mark. Manag. 2000, 29, 65–83. [Google Scholar] [CrossRef]
- dos Santos, R.R.; Guarnieri, P. Social gains for artisanal agroindustrial producers induced by cooperation and collaboration in agri-food supply chain. Soc. Responsib. J. 2020. [Google Scholar] [CrossRef]
- Bager, S.L.; Lambin, E.F. Sustainability strategies by companies in the global coffee sector. Bus. Strateg. Environ. 2020. [Google Scholar] [CrossRef]
- Schnittfeld, N.L.; Busch, T. Sustainability Management within Supply Chains—A Resource Dependence View. Bus. Strategy Environ. 2016, 25, 337–354. [Google Scholar] [CrossRef]
- Krishnan, R.; Agarwal, R.; Bajada, C.; Arshinder, K. Redesigning a food supply chain for environmental sustainability—An analysis of resource use and recovery. J. Clean. Prod. 2019, 242, 118374. [Google Scholar] [CrossRef]
- Castro, N.R.; Swart, J. Building a roundtable for a sustainable hazelnut supply chain. J. Clean. Prod. 2017, 168, 1398–1412. [Google Scholar] [CrossRef]
- Seitanidi, M.M.; Crane, A. Implementing CSR Through Partnerships: Understanding the Selection, Design and Institutionalisation of Nonprofit-Business Partnerships. J. Bus. Ethics 2009, 85, 413–429. [Google Scholar] [CrossRef]
- Solér, C.; Sandström, C.; Skoog, H. How can high-biodiversity coffee make it to the mainstream market? The performativity of voluntary sustainability standards and outcomes for coffee diversification. Environ. Manag. 2017, 59, 230–248. [Google Scholar] [CrossRef] [Green Version]
- Medaets, J.P.P.; Fornazier, A.; Thomé, K.M. Transition to sustainability in agrifood systems: Insights from Brazilian trajectories. J. Rural. Stud. 2020, 76, 1–11. [Google Scholar] [CrossRef]
- Scherer, F.M.; Ross, D. Industrial Market Structure and Economic Performance; Houghton-Mifflin: Boston, MA, USA, 1990. [Google Scholar]
- Anprosem. Associação Nacional dos Produtores de Sementes; Aprosem. 2020. Available online: https://anprosem.com.br/site/ (accessed on 20 December 2020).
- Anda. Anuário Estatístico; Associação Nacional para Difusão de Adubos: São Paulo, Brasil, 2020; Available online: http://anda.org.br/arquivos/ (accessed on 20 December 2020).
- Aenda. “Associados da Associação Brasileira dos Defensivos Genéricos,” Associação Brasileira dos Defensivos Genéricos (AENDA). 2020. Available online: https://www.aenda.org.br/ (accessed on 20 December 2020).
- Anfavea. Anuario da Indústria Automobilística Brasileira; Associação Nacional dos Fabricantes de Veículos Automotores: São Paulo, Brasil, 2020; Available online: https://0-doi-org.brum.beds.ac.uk/10.1017/CBO9781107415324.004 (accessed on 20 December 2020).
- Aprosoja. Associação dos Produtores de Soja; Aprosoja. 2020. Available online: https://aprosojabrasil.com.br/ (accessed on 1 August 2020).
- Cepea. PIB do Agronegócio—Dados de 1994 a 2019; Cepea: Piracicaba, Brazil, 2020; Available online: https://www.cepea.esalq.usp.br/br/pib-do-agronegocio-brasileiro.aspx (accessed on 20 December 2020).
- Tiengo, R. Setor de máquinas agrícolas tem alta de 15% e fatura R$ 2,38 bilhões no 1o trimestre. 2020. Available online: https://g1.globo.com/sp/ribeirao-preto-franca/agrishow/2017/noticia/setor-de-maquinas-agricolas-tem-alta-de-15-e-fatura-r-238-bilhoes-no-1-trimestre-de-2017.ghtml (accessed on 20 December 2020).
- Conab. Acompanhamento da Safra Brasileira: Cana-de-Açúcar; Companhia Nacional de Abastecimento (Conab): Brasília, Brasil, 2020. [Google Scholar]
- Escher, F.; Wilkinson, J. A economia política do complexo Soja-Carne Brasil-China. Rev. Econ. Sociol. Rural. 2019, 57, 656–678. [Google Scholar] [CrossRef]
- Marin, A.; Stubrin, L. Innovation in natural resources: New opportunities and new challenges The case of the Argentinian seed industry. In Innovation. 2015, 1. Issue 1. Available online: http://www.merit.unu.edu/publications/wppdf/2015/wp2015-015.pdf (accessed on 20 December 2020).
- Sindiveg. Associadas; Sindicato Nacional Da Indústria de Produtos Para Defesa Vegetal (Sindiveg). 2020. Available online: https://sindiveg.org.br/associadas/ (accessed on 20 December 2020).
- Hage, F.; Peixoto, M.; Filho, J.V. Aquisição de Terras por Estrangeiros no Brasil: Uma Avaliação Jurídica e Econômica. Núcleo de Estudos e Pesquisas do Senado. 20 December 2012. Available online: http://www.senado.gov.br/senado/conleg/textos_discussao/TD114-FabioHage-MarcusPeixoto-JoseEustaquio.pdf (accessed on 20 December 2020).
- Trase. Transparent Supply Chains for Sustainable Economies; 2020. Available online: https://trase.earth/ (accessed on 24 March 2020).
- Santos, M.; Glass, V. Atlas do Agronegócio: Fatos e Números Sobre as Corporações que Controlam o Que Comemos; Fundação Heinrich Böll: Berlin, Germany, 2018. [Google Scholar]
- Gurzawska, A. Towards Responsible and Sustainable Supply Chains—Innovation, Multi-stakeholder Approach and Governance. Philos. Manag. 2019, 19, 267–295. [Google Scholar] [CrossRef] [Green Version]
- Ferrari, V.; Pacheco, M. Propriedade intelectual e inovações tecnológicas na indústria de sementes: Discussões sobre os conflitos judiciais entre a Monsanto e os agricultores brasileiros. Rev. Estud. Soc. 2019, 20, 89–103. [Google Scholar] [CrossRef]
- Schielein, J.; Börner, J. Recent transformations of land-use and land-cover dynamics across different deforestation frontiers in the Brazilian Amazon. Land Use Policy 2018, 76, 81–94. [Google Scholar] [CrossRef]
- Illukpitiya, P.; Yanagida, J.F. Farming vs forests: Trade-off between agriculture and the extraction of non-timber forest products. Ecol. Econ. 2010, 69, 1952–1963. [Google Scholar] [CrossRef]
- Nascimento, N.; West TA, P.; Börner, J.; Ometto, J. What Drives Intensification of Land Use at Agricultural Frontiers in the Brazilian Amazon? Evidence from a Decision Game. Forests 2019, 10, 464. [Google Scholar] [CrossRef] [Green Version]
- OECD; FAO. OECD-FAO Guidance for Responsible Agricultural Supply Chains; FAO: Rome, Italy, 2013. [Google Scholar]
- Klimek, B.; Bjørkhaug, H. Norwegian Agro-Food Attracting Private Equity Capital; Varieties of Capitalism—Varieties of Financialisation? Sociol. Rural. 2015, 57, 171–190. [Google Scholar] [CrossRef] [Green Version]
- Coronel, D.A. Processo de desindustrialização da economia brasileira e possibilidade de reversão. Rev. Econ. Agronegócio 2020, 17, 389–398. [Google Scholar] [CrossRef]
Figure 1.
Consolidation and expansion of soy plantations in Brazil between 2006 and 2017. Consolidation is defined as municipalities that have remained as important producers and that have increased their planted areas, when comparing data from 2017 with 2006. Expansion is defined as municipalities planted with soy in 2017 that did not previously have soy planted in 2006. Source: Based on the data of the area planted with soybeans in 2006 and 2017, which are available at the Brazilian Institute for Geography and Statistics website (SIDRA/IBGE). 2017 is the year of the latest agricultural census in Brazil.

Figure 2.
Market share held by Brazilian vis à vis multinational companies in key production stage of the soybean supply chain established in Brazil in 2020 (in %). Source: Based on data published by Anprosem [36], Anda [37], Aenda [38], Anfavea [39] and Aprosoja [40].).

Figure 3.
Home countries of companies controlling key segments of Brazil’s soybean supply chain by 2020. Source: Based on data published by Anprosem [36], Anda [37], Aenda [38], Anfavea [39] and Aprosoja [40].

Figure 4.
Market size of key segments of the soybean supply chain for the agricultural year of 2019/2020 and possible financial trade-offs between farming expansion and increasing market share in industrial segments (in USD billions). Source: Based on data published by Anprosem [36], Anda [37], Santos and Glass [49] and Escher and Wilkinson [44].

Table 1.
Segments and sources.
| Segments | Organisations |
|---|---|
| Seeds | Brazilian Association of Soybean Seeds Producers (Abrass) |
| Fertilisers | National Fertilisers Association (ANDA) |
| Agrochemicals | Brazilian Association of Generic Pesticides (Aenda) |
| Machinery | National Manufacturers Association of Motor Vehicles (Anfavea) |
| Farmers | Soybean Producers Association (Aprosoja) |
Table 2.
Market share held by Brazilian vis à vis multinational companies in sectors of the soybean supply chain established in Brazil for the years of 2015 and 2020 (in percentage).
Table 2.
Market share held by Brazilian vis à vis multinational companies in sectors of the soybean supply chain established in Brazil for the years of 2015 and 2020 (in percentage).
| 2015 | 2020 | ||||||||||
|---|---|---|---|---|---|---|---|---|---|---|---|
| Segment | Company | Home Country | Total | Brazil | Total | Brazil | US | Germany | China | Others | |
| Seeds | Technology | Bayer (Monsanto) | Germany | 88.8 | 0.0 | 90.0 | 0.0 | 0.0 | 90.0 | 0.0 | 0.0 |
| Pioneer/Corteva | United States | 5.8 | 0.0 | 6.0 | 0.0 | 6.0 | 0.0 | 0.0 | 0.0 | ||
| Others | Multinational | 5.4 | 0.0 | 4.0 | 0.0 | 0.0 | 0.0 | 0.0 | 4.0 | ||
| Production | GDM and others | Multinational | 50.0 | 0.0 | 75.0 | 0.0 | 6.0 | 29.0 | 2.0 | 38.0 | |
| TMG and others | Brazil | 50.0 | 16.5 | 25.0 | 8.7 | 0.0 | 16.3 | 0.0 | 0.0 | ||
| Subtotal | 100.0 | 16.5 | 100.0 | 8.7 | 6.0 | 67.6 | 1.0 | 21.0 | |||
| Machinery | Tractors | AGCO Massey | United States | 25.6 | 0.0 | 16.9 | 0.0 | 16.9 | 0.0 | 0.0 | 0.0 |
| AGCO Valtra | United States | 22.3 | 0.0 | 13.4 | 0.0 | 13.4 | 0.0 | 0.0 | 0.0 | ||
| CNH Case | Italy | 6.4 | 0.0 | 9.4 | 0.0 | 0.0 | 0.0 | 0.0 | 9.4 | ||
| CNH New Holland | Italy | 19.3 | 0.0 | 23.1 | 0.0 | 0.0 | 0.0 | 0.0 | 23.1 | ||
| John Deere | United States | 22.5 | 0.0 | 36.7 | 0.0 | 36.7 | 0.0 | 0.0 | 0.0 | ||
| Agrale S.A | Brazil | 3.8 | 3.8 | 0.4 | 0.4 | 0.0 | 0.0 | 0.0 | 0.0 | ||
| Combines | AGCO Massey | United States | 10.3 | 0.0 | 6.4 | 0.0 | 6.4 | 0.0 | 0.0 | 0.0 | |
| AGCO Valtra | EU | 3.2 | 0.0 | 0.9 | 0.0 | 0.9 | 0.0 | 0.0 | 0.0 | ||
| CNH Case | Italy | 15.5 | 0.0 | 18.5 | 0.0 | 0.0 | 0.0 | 0.0 | 18.5 | ||
| CNH New Holland | Italy | 31.0 | 0.0 | 33.5 | 0.0 | 0.0 | 0.0 | 0.0 | 33.5 | ||
| John Deere | United States | 40.0 | 0.0 | 40.7 | 0.0 | 40.7 | 0.0 | 0.0 | 0.0 | ||
| Subtotal | 100.0 | 1.9 | 100.0 | 0.2 | 57.5 | 0.0 | 0.0 | 42.3 | |||
| Fertilisers | Phosphorus | Vale (now Mosaic) | United States | 29.6 | 29.6 | 29.7 | 0.0 | 29.7 | 0.0 | 0.0 | 0.0 |
| Anglo American | UK | 5.9 | 0.0 | 6.7 | 0.0 | 0.0 | 0.0 | 0.0 | 6.7 | ||
| Others | Brazil/Multinationals | 20.6 | 10.3 | 19.6 | 17.5 | 0.0 | 0.0 | 0.0 | 2.1 | ||
| Imported | 44.0 | 0.0 | 44.0 | 0.0 | 7.5 | 0.0 | 7.0 | 29.5 | |||
| Potassium | Vale (now Mosaic) | United States | 8.0 | 8.0 | 5.0 | 0.0 | 5.0 | 0.0 | 0.0 | 0.0 | |
| Imported | 92.0 | 0.0 | 95.0 | 0.0 | 0.0 | 11.4 | 0.0 | 83.6 | |||
| Manufacture | Yara | Norway | 20.5 | 20.5 | 25.0 | 0.0 | 0.0 | 0.0 | 0.0 | 25.0 | |
| Mosaic/ADM | United States | 19.0 | 19.0 | 20.0 | 0.0 | 20.0 | 0.0 | 0.0 | 0.0 | ||
| Dreyfus | France | 1.5 | 1.5 | 0.0 | 0.0 | 0.0 | 0.0 | 0.0 | 0.0 | ||
| Nutrien | Canada | 0.0 | 0.0 | 10.0 | 0.0 | 0.0 | 0.0 | 0.0 | 10.0 | ||
| Fertipar | Brazil | 17.7 | 17.7 | 15.0 | 15.0 | 0.0 | 0.0 | 0.0 | 0.0 | ||
| Heringer (undergoing judicial recovery) | Brazil (56%) | 13.3 | 7.4 | 6.0 | 3.3 | 0.0 | 0.0 | 0.0 | 2.7 | ||
| Regional | Brazil | 8.2 | 8.0 | 7.0 | 6.5 | 0.0 | 0.0 | 0.0 | 0.5 | ||
| Outros | Brazil/Multinationals | 17.3 | 8.6 | 17.0 | 5.0 | 0.0 | 0.0 | 0.0 | 12.0 | ||
| Subtotal | 100.0 | 33.5 | 100.0 | 19.2 | 20.5 | 2.9 | 1.8 | 55.6 | |||
| Pesticides | Syngenta/ChemChina | China | 21.2 | 0.0 | 18.6 | 0.0 | 0.0 | 0.0 | 18.6 | 0.0 | |
| Bayer | Germany | 15.3 | 0.0 | 15.7 | 0.0 | 0.0 | 15.7 | 0.0 | 0.0 | ||
| Basf | Germany | 12.4 | 0.0 | 9.2 | 0.0 | 0.0 | 9.2 | 0.0 | 0.0 | ||
| UPL | India | 0.0 | 0.0 | 8.9 | 0.0 | 0.0 | 0.0 | 0.0 | 8.9 | ||
| FMC | United States | 7.1 | 0.0 | 8.5 | 0.0 | 8.5 | 0.0 | 0.0 | 0.0 | ||
| Corteva | United States | 0.0 | 0.0 | 4.0 | 0.0 | 4.0 | 0.0 | 0.0 | 0.0 | ||
| DuPont | United States | 6.5 | 0.0 | 4.0 | 0.0 | 4.0 | 0.0 | 0.0 | 0.0 | ||
| Dow | United States | 5.6 | 0.0 | 3.0 | 0.0 | 3.0 | 0.0 | 0.0 | 0.0 | ||
| Others | Multinational | 26.6 | 0.0 | 22.3 | 0.0 | 5.0 | 3.0 | 5.0 | 9.3 | ||
| Nortox | Brazil | 2.3 | 2.3 | 2.7 | 2.7 | 0.0 | 0.0 | 0.0 | 0.0 | ||
| Ourofino | Brazil | 1.0 | 1.0 | 2.1 | 2.1 | 0.0 | 0.0 | 0.0 | 0.0 | ||
| Small companies | Brazil | 2.0 | 1.0 | 1.0 | 1.0 | 0.0 | 0.0 | 0.0 | 0.0 | ||
| Subtotal | 100.0 | 4.3 | 100.0 | 5.8 | 24.5 | 27.9 | 23.6 | 18.2 | |||
| Farming | Subtotal | 100.0 | 93.4 | 100.0 | 93.4 | 2.0 | 0.0 | 1.0 | 3.6 | ||
| Trading | Cargill | United States | 12.4 | 0.0 | 11.4 | 0.0 | 11.4 | 0.0 | 0.0 | 0.0 | |
| Bunge | United States | 15.7 | 0.0 | 9.4 | 0.0 | 9.4 | 0.0 | 0.0 | 0.0 | ||
| ADM | United States | 10.0 | 0.0 | 7.8 | 0.0 | 7.8 | 0.0 | 0.0 | 0.0 | ||
| Dreyfus | France | 5.4 | 0.0 | 7.5 | 0.0 | 0.0 | 0.0 | 0.0 | 7.5 | ||
| Cofco | China | 0.0 | 0.0 | 3.8 | 0.0 | 0.0 | 0.0 | 3.8 | 0.0 | ||
| Others | Multinational | 25.8 | 0.0 | 44.0 | 0.0 | 11.0 | 3.0 | 15.0 | 15.0 | ||
| Amaggi | Brazil | 4.1 | 44.0 | 6.6 | 6.6 | 0.0 | 0.0 | 0.0 | 0.0 | ||
| Coamo | Brazil | 4.5 | 4.5 | 2.3 | 2.3 | 0.0 | 0.0 | 0.0 | 0.0 | ||
| Cutrale | Brazil | 0.1 | 0.1 | 1.7 | 1.7 | 0.0 | 0.0 | 0.0 | 0.0 | ||
| Bianchini | Brazil | 3.5 | 3.5 | 1.2 | 1.2 | 0.0 | 0.0 | 0.0 | 0.0 | ||
| Caramuru | Brazil | 2.3 | 2.3 | 1.0 | 1.0 | 0.0 | 0.0 | 0.0 | 0.0 | ||
| Granol | Brazil | 3.5 | 3.5 | 0.2 | 0.2 | 0.0 | 0.0 | 0.0 | 0.0 | ||
| Comigo | Brazil | 1.7 | 1.7 | 0.1 | 0.1 | 0.0 | 0.0 | 0.0 | 0.0 | ||
| Algar Agro | Brazil | 1.7 | 1.7 | 0.0 | 0.0 | 0.0 | 0.0 | 0.0 | 0.0 | ||
| Others | Brazil | 9.3 | 9.3 | 2.9 | 2.9 | 0.0 | 0.0 | 0.0 | 0.0 | ||
| Subtotal | 100.0 | 30.7 | 100.0 | 16.1 | 39.6 | 3.0 | 18.8 | 22.5 | |||
Table 4.
Trade-offs between reducing investments in farming expansion and increasing market share in agro-industrial segments.
Table 4.
Trade-offs between reducing investments in farming expansion and increasing market share in agro-industrial segments.
| Current Situation | Projection | Outcome | ||||
|---|---|---|---|---|---|---|
| Expansion into agricultural frontiers | Area with soybeans in Brazil (million ha) | Gross income (USD billion) | Measure (Curb deforestation) | Area with soybeans (million ha) | % | Income (USD billion) |
| Amazon | 36.4 | 28.6 | 100% | 4.5 | 12.4 | 3.5 |
| Matopiba | 36.4 | 28.6 | 100% | 5.7 | 15.7 | 4.5 |
| Increased market share | Current domestic share | Gross income generated (USD billion) | Measure (increase in domestic market share by) | Targeted market share | % | Income generated (USD billion) |
| Trading | 16.0 | 41.2 | 11% | 27.0 | 6.6 | 4.5 |
| Whole chain | 7.1 | 86.9 | 5.2% | 12.3 | 6.2 | 4.5 |
Publisher’s Note: MDPI stays neutral with regard to jurisdictional claims in published maps and institutional affiliations. |
© 2021 by the authors. Licensee MDPI, Basel, Switzerland. This article is an open access article distributed under the terms and conditions of the Creative Commons Attribution (CC BY) license (https://creativecommons.org/licenses/by/4.0/).
Share and Cite
MDPI and ACS Style
Medina, G.; Thomé, K. Transparency in Global Agribusiness: Transforming Brazil’s Soybean Supply Chain Based on Companies’ Accountability. Logistics 2021, 5, 58. https://0-doi-org.brum.beds.ac.uk/10.3390/logistics5030058
AMA Style
Medina G, Thomé K. Transparency in Global Agribusiness: Transforming Brazil’s Soybean Supply Chain Based on Companies’ Accountability. Logistics. 2021; 5(3):58. https://0-doi-org.brum.beds.ac.uk/10.3390/logistics5030058
Chicago/Turabian StyleMedina, Gabriel, and Karim Thomé. 2021. "Transparency in Global Agribusiness: Transforming Brazil’s Soybean Supply Chain Based on Companies’ Accountability" Logistics 5, no. 3: 58. https://0-doi-org.brum.beds.ac.uk/10.3390/logistics5030058