Experimental Investigation into the Friction Coefficient of Ball-on-Disc in Dry Sliding Contact Considering the Effects of Surface Roughness, Low Rotation Speed, and Light Normal Load


Abstract
:1. Introduction
2. Experimental Materials and Methods
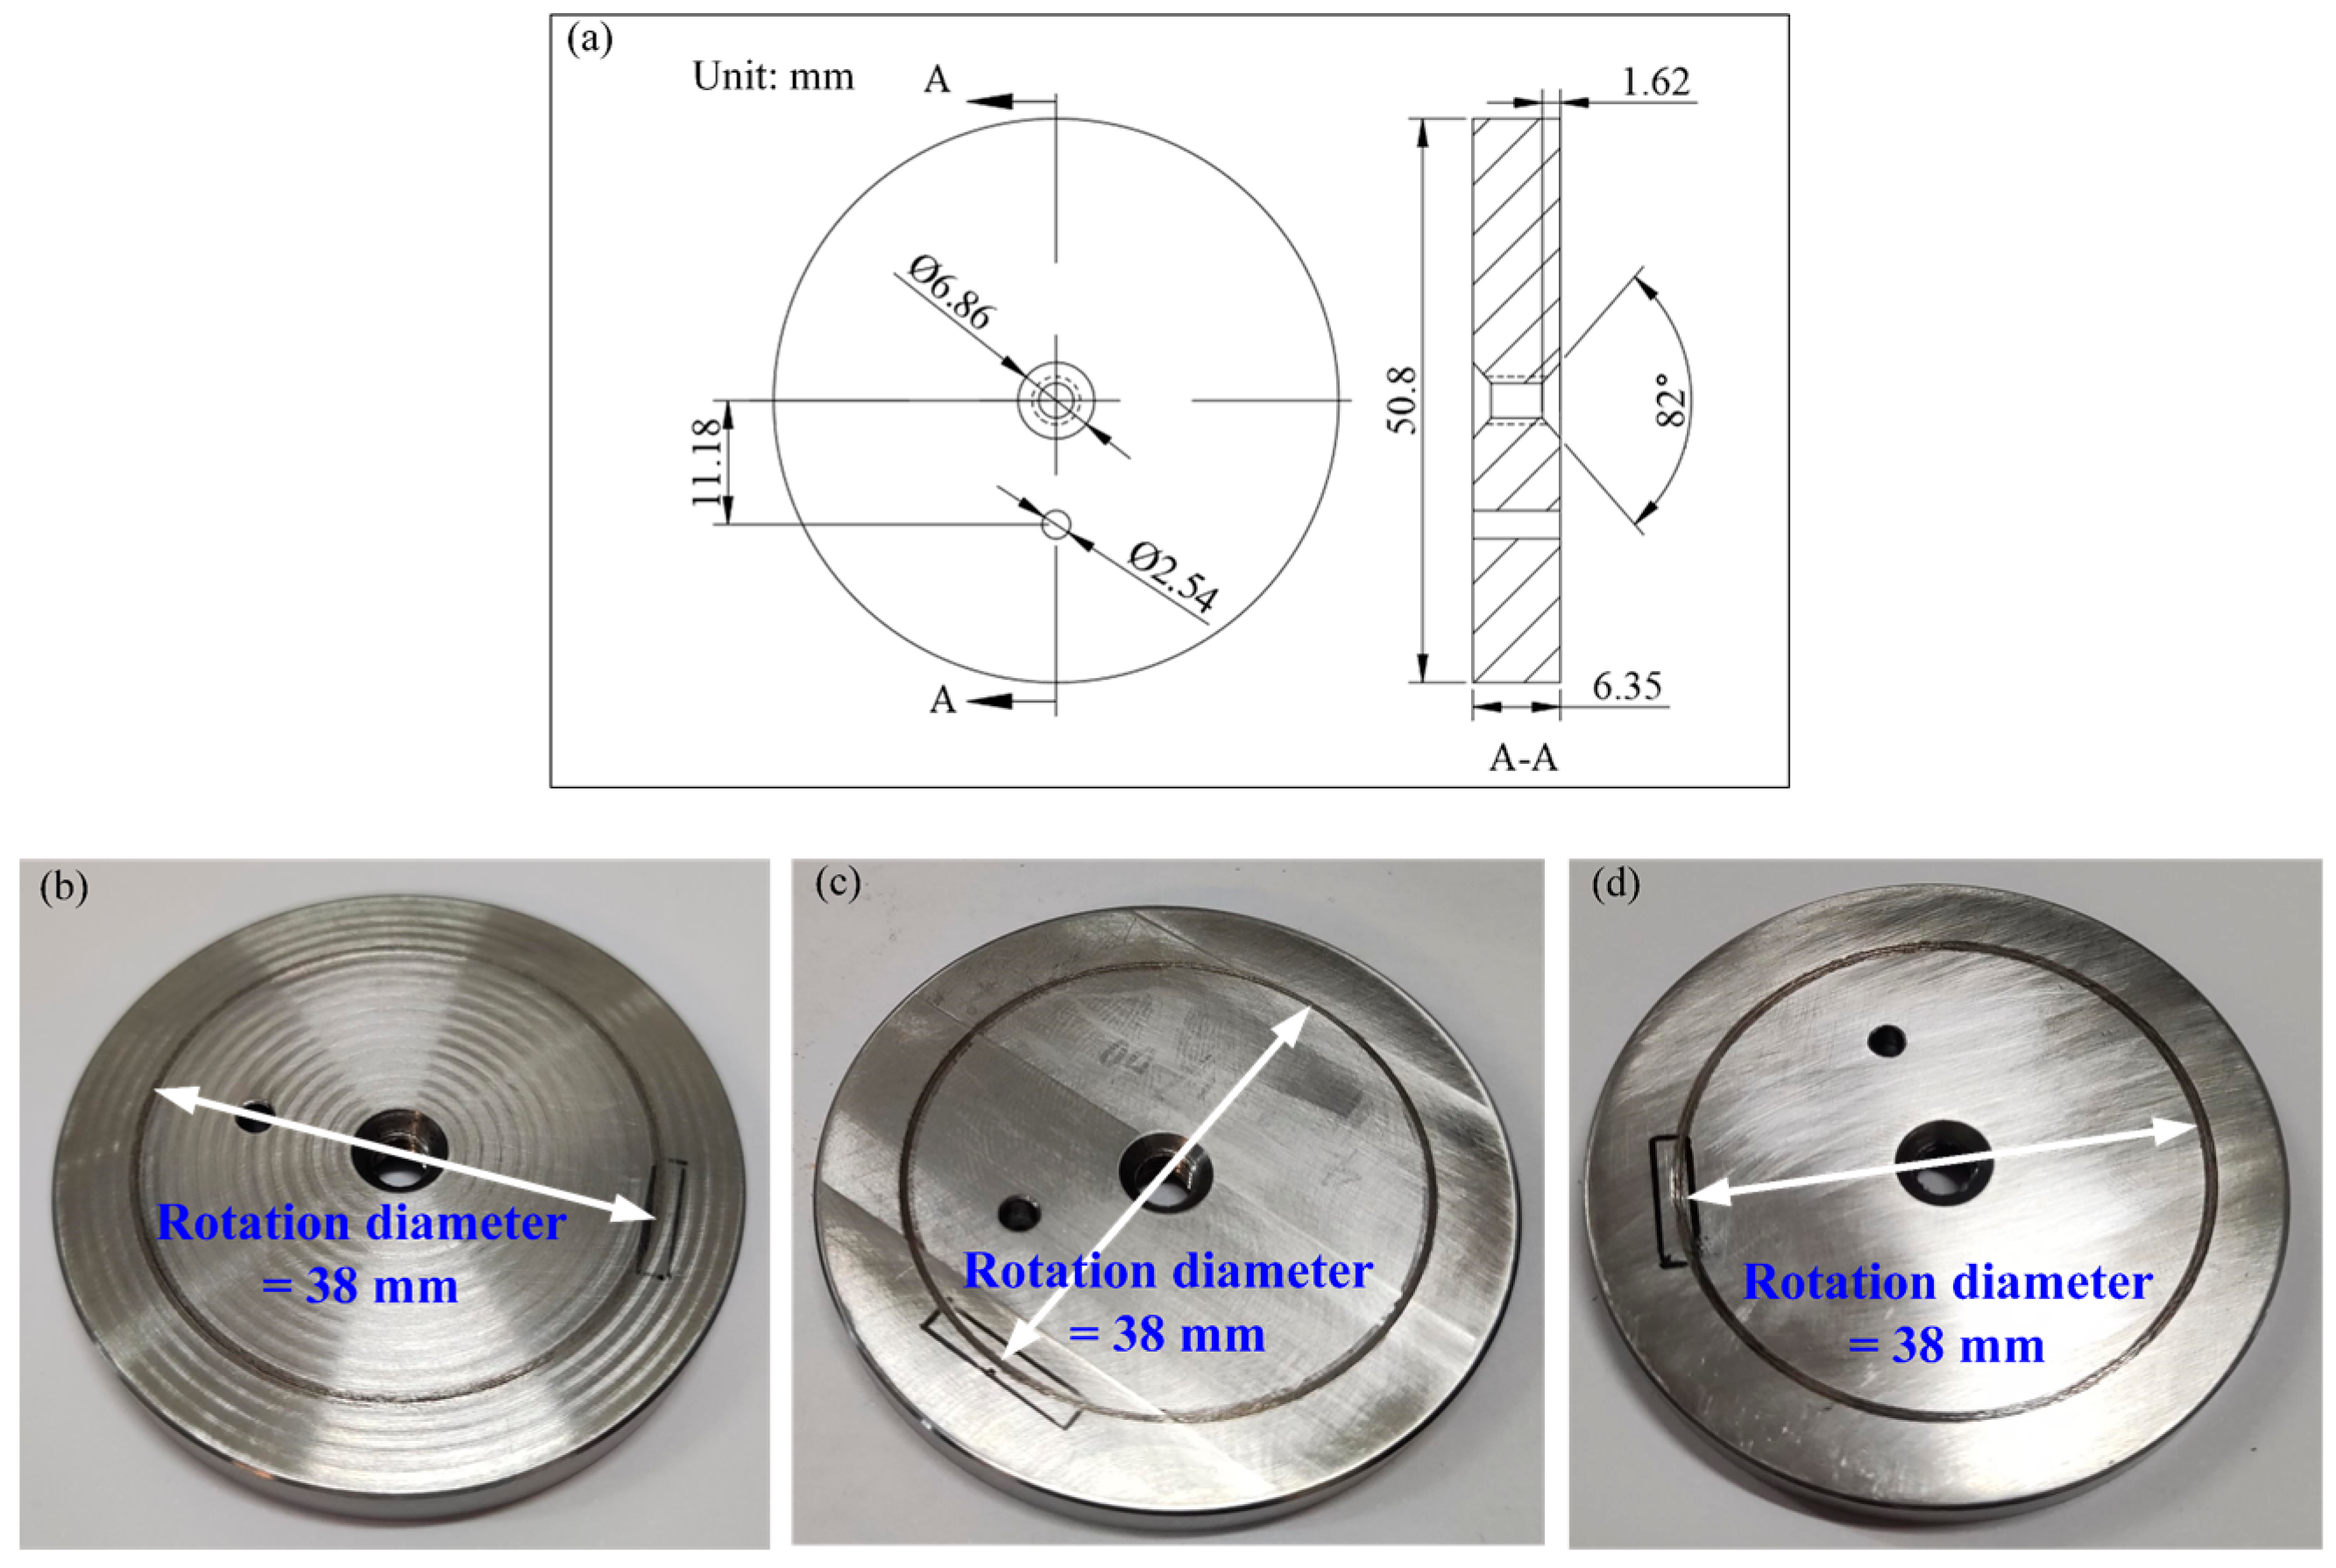
2.1. Materials
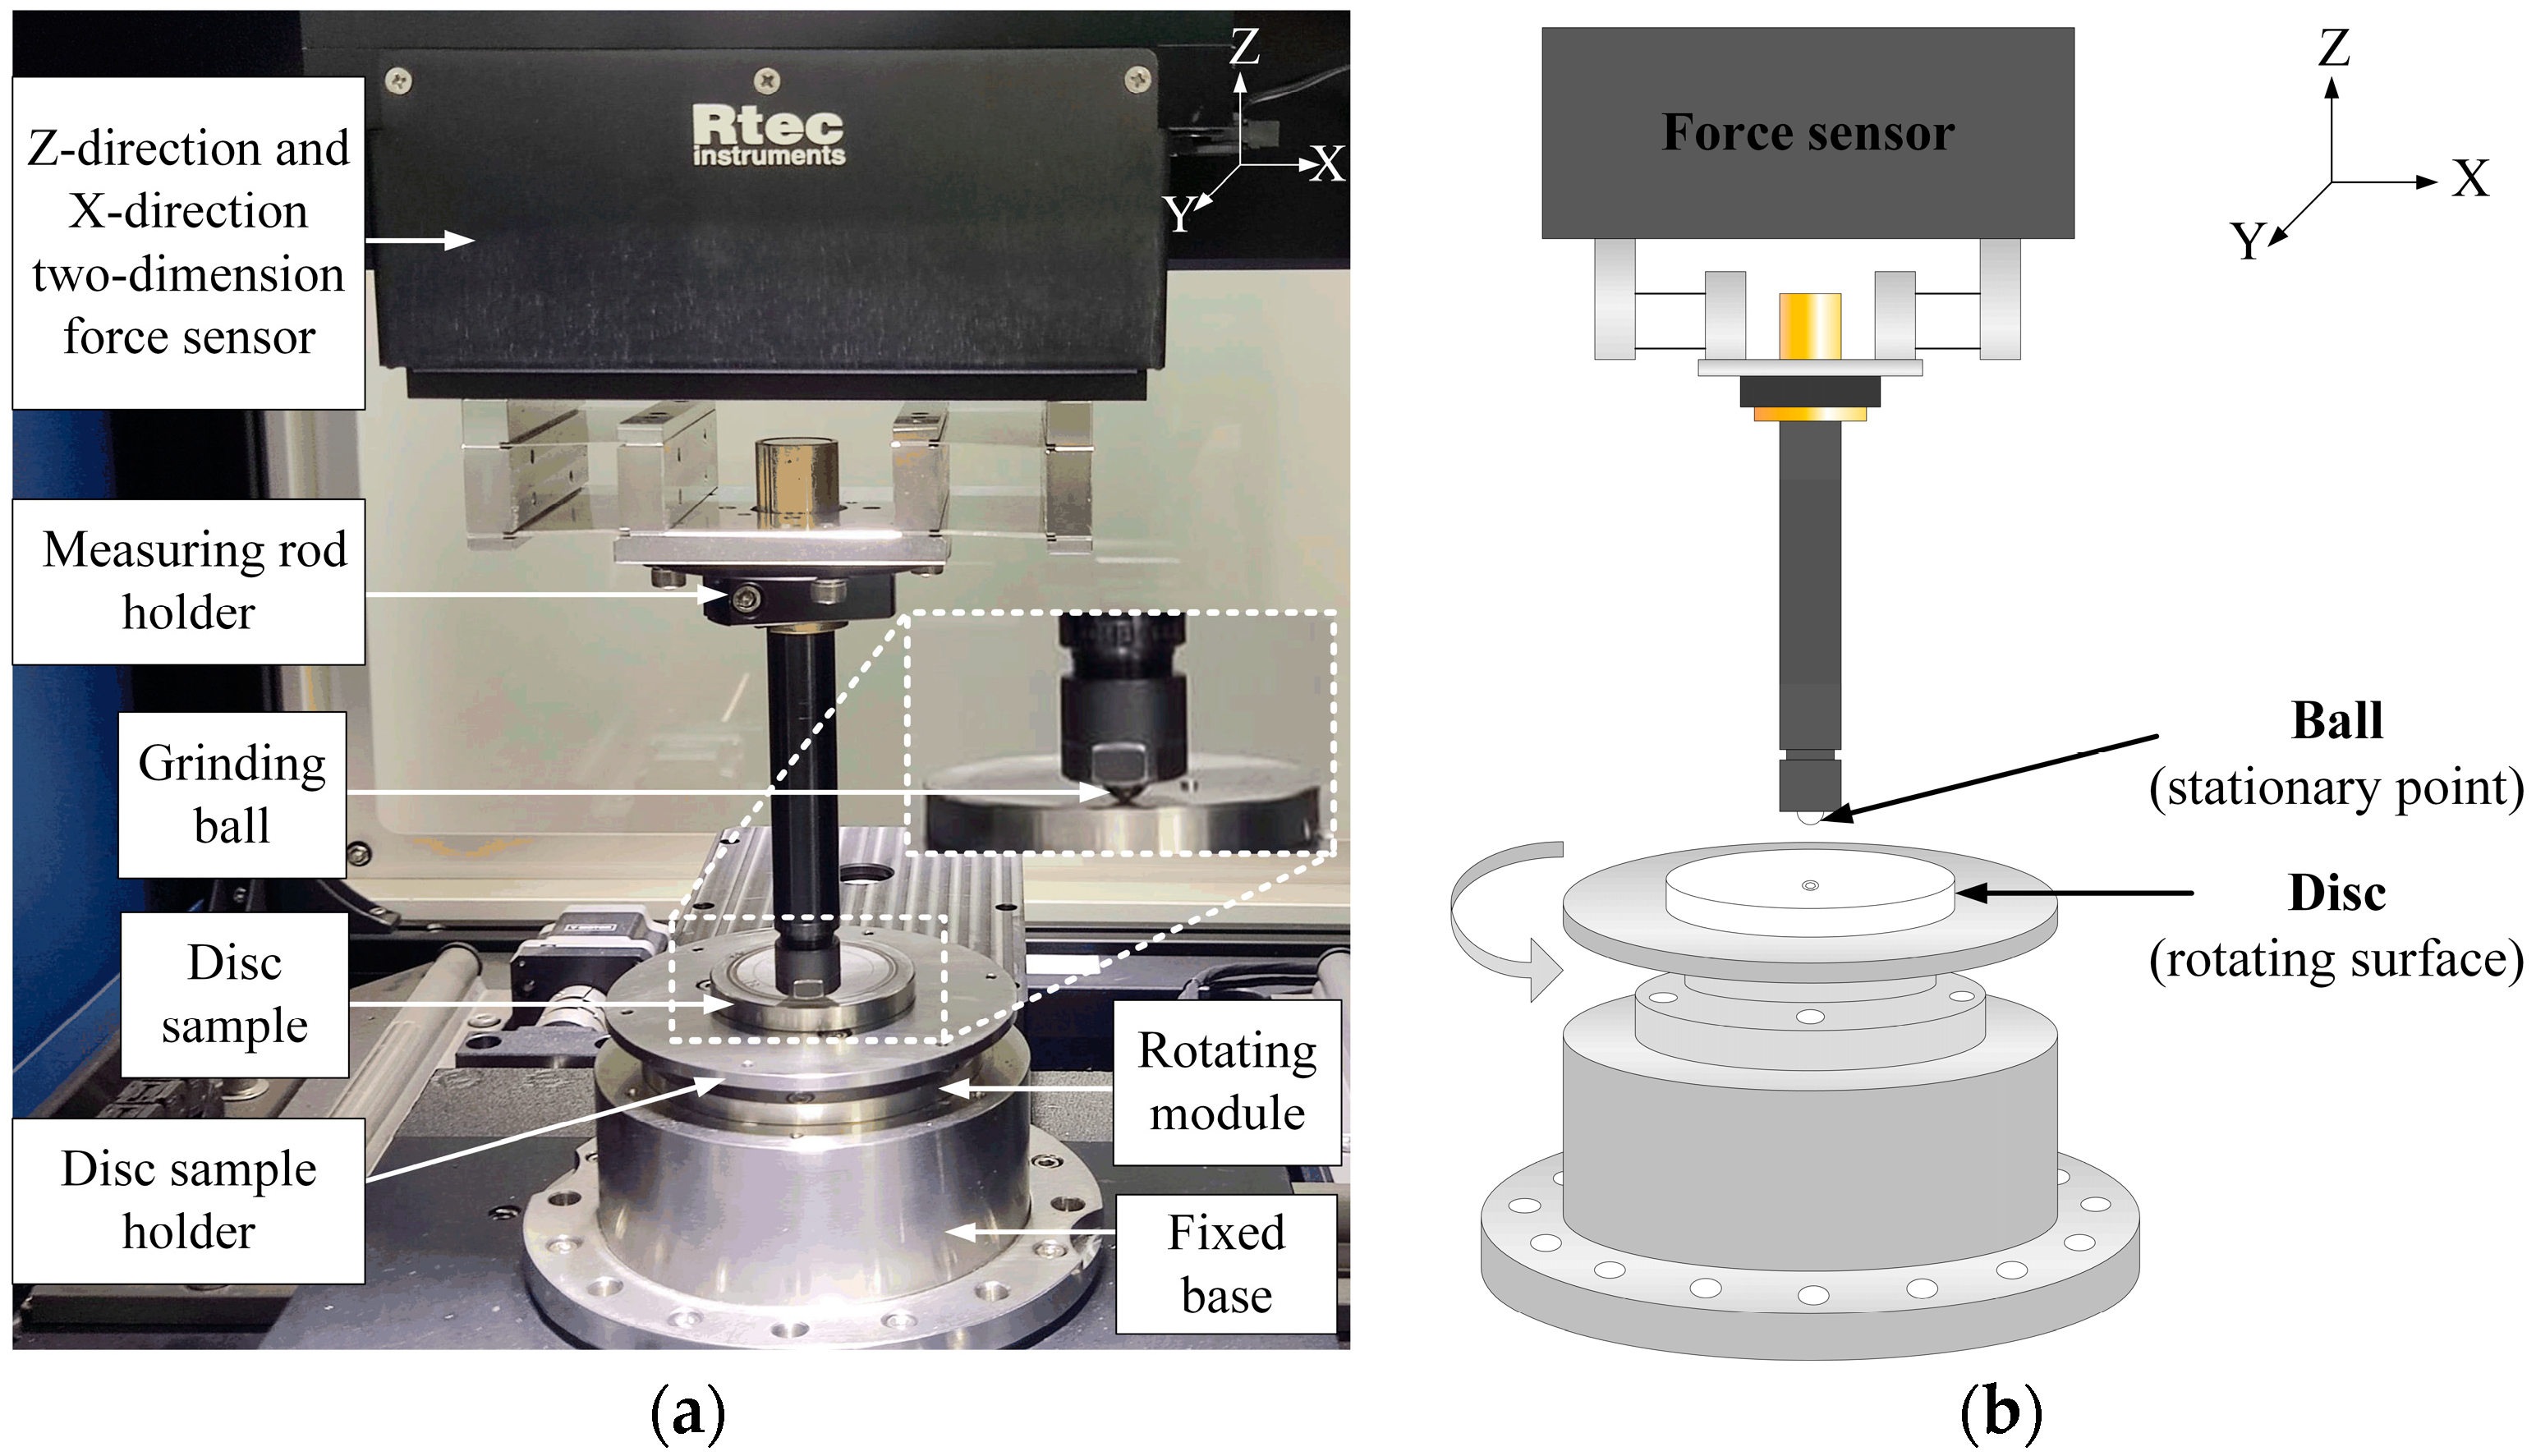
2.2. Test Equipment
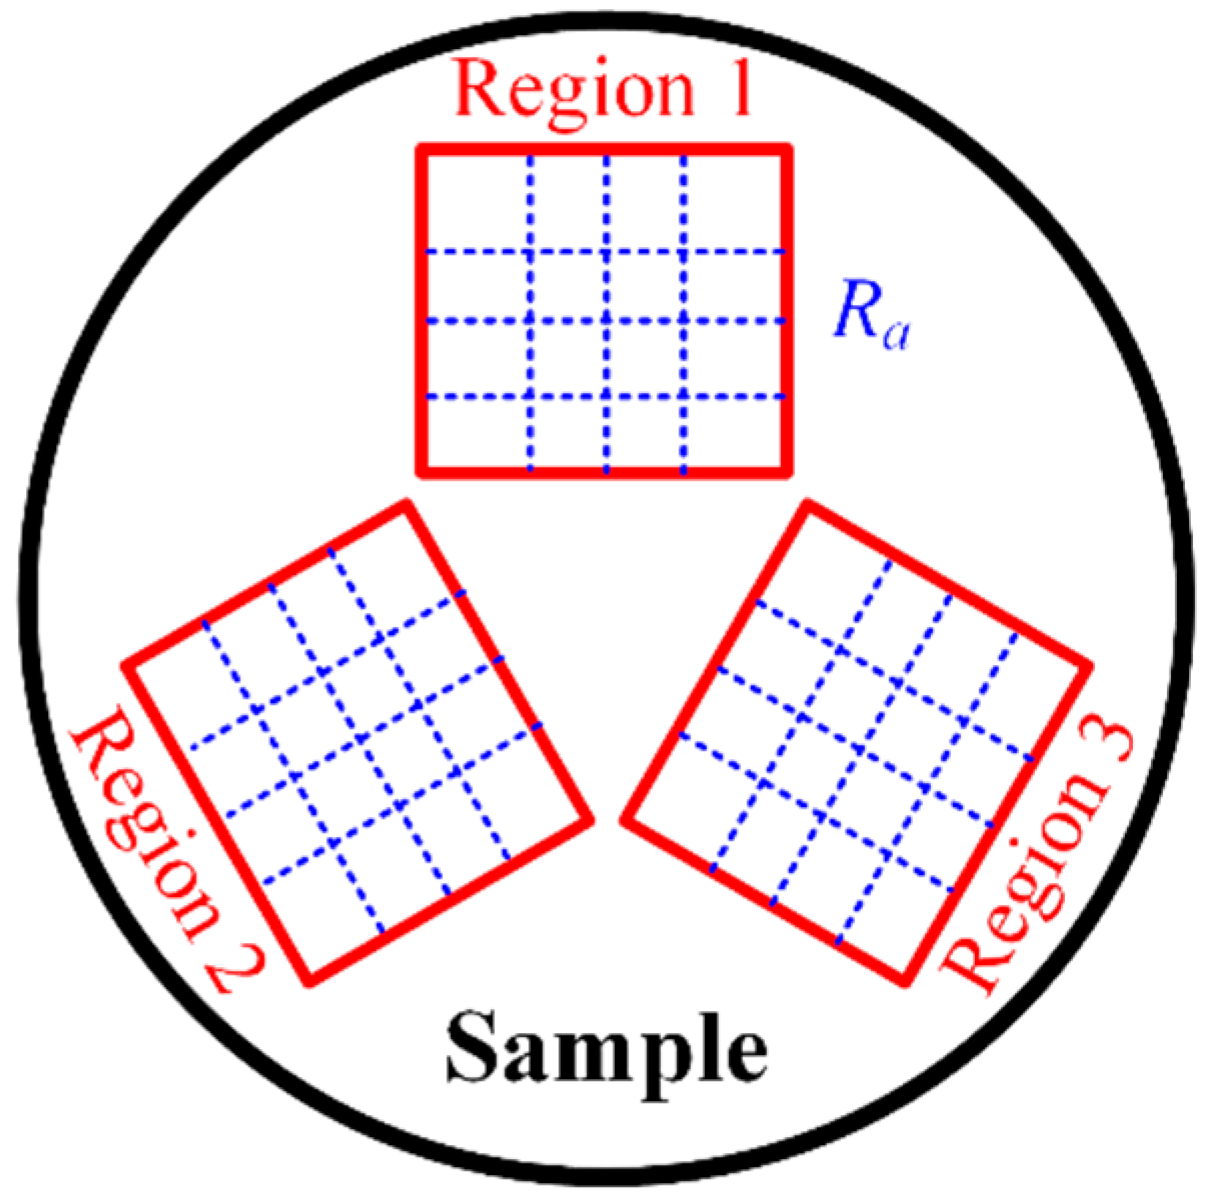
2.3. Experimental Arrangement
3. Results and Discussion
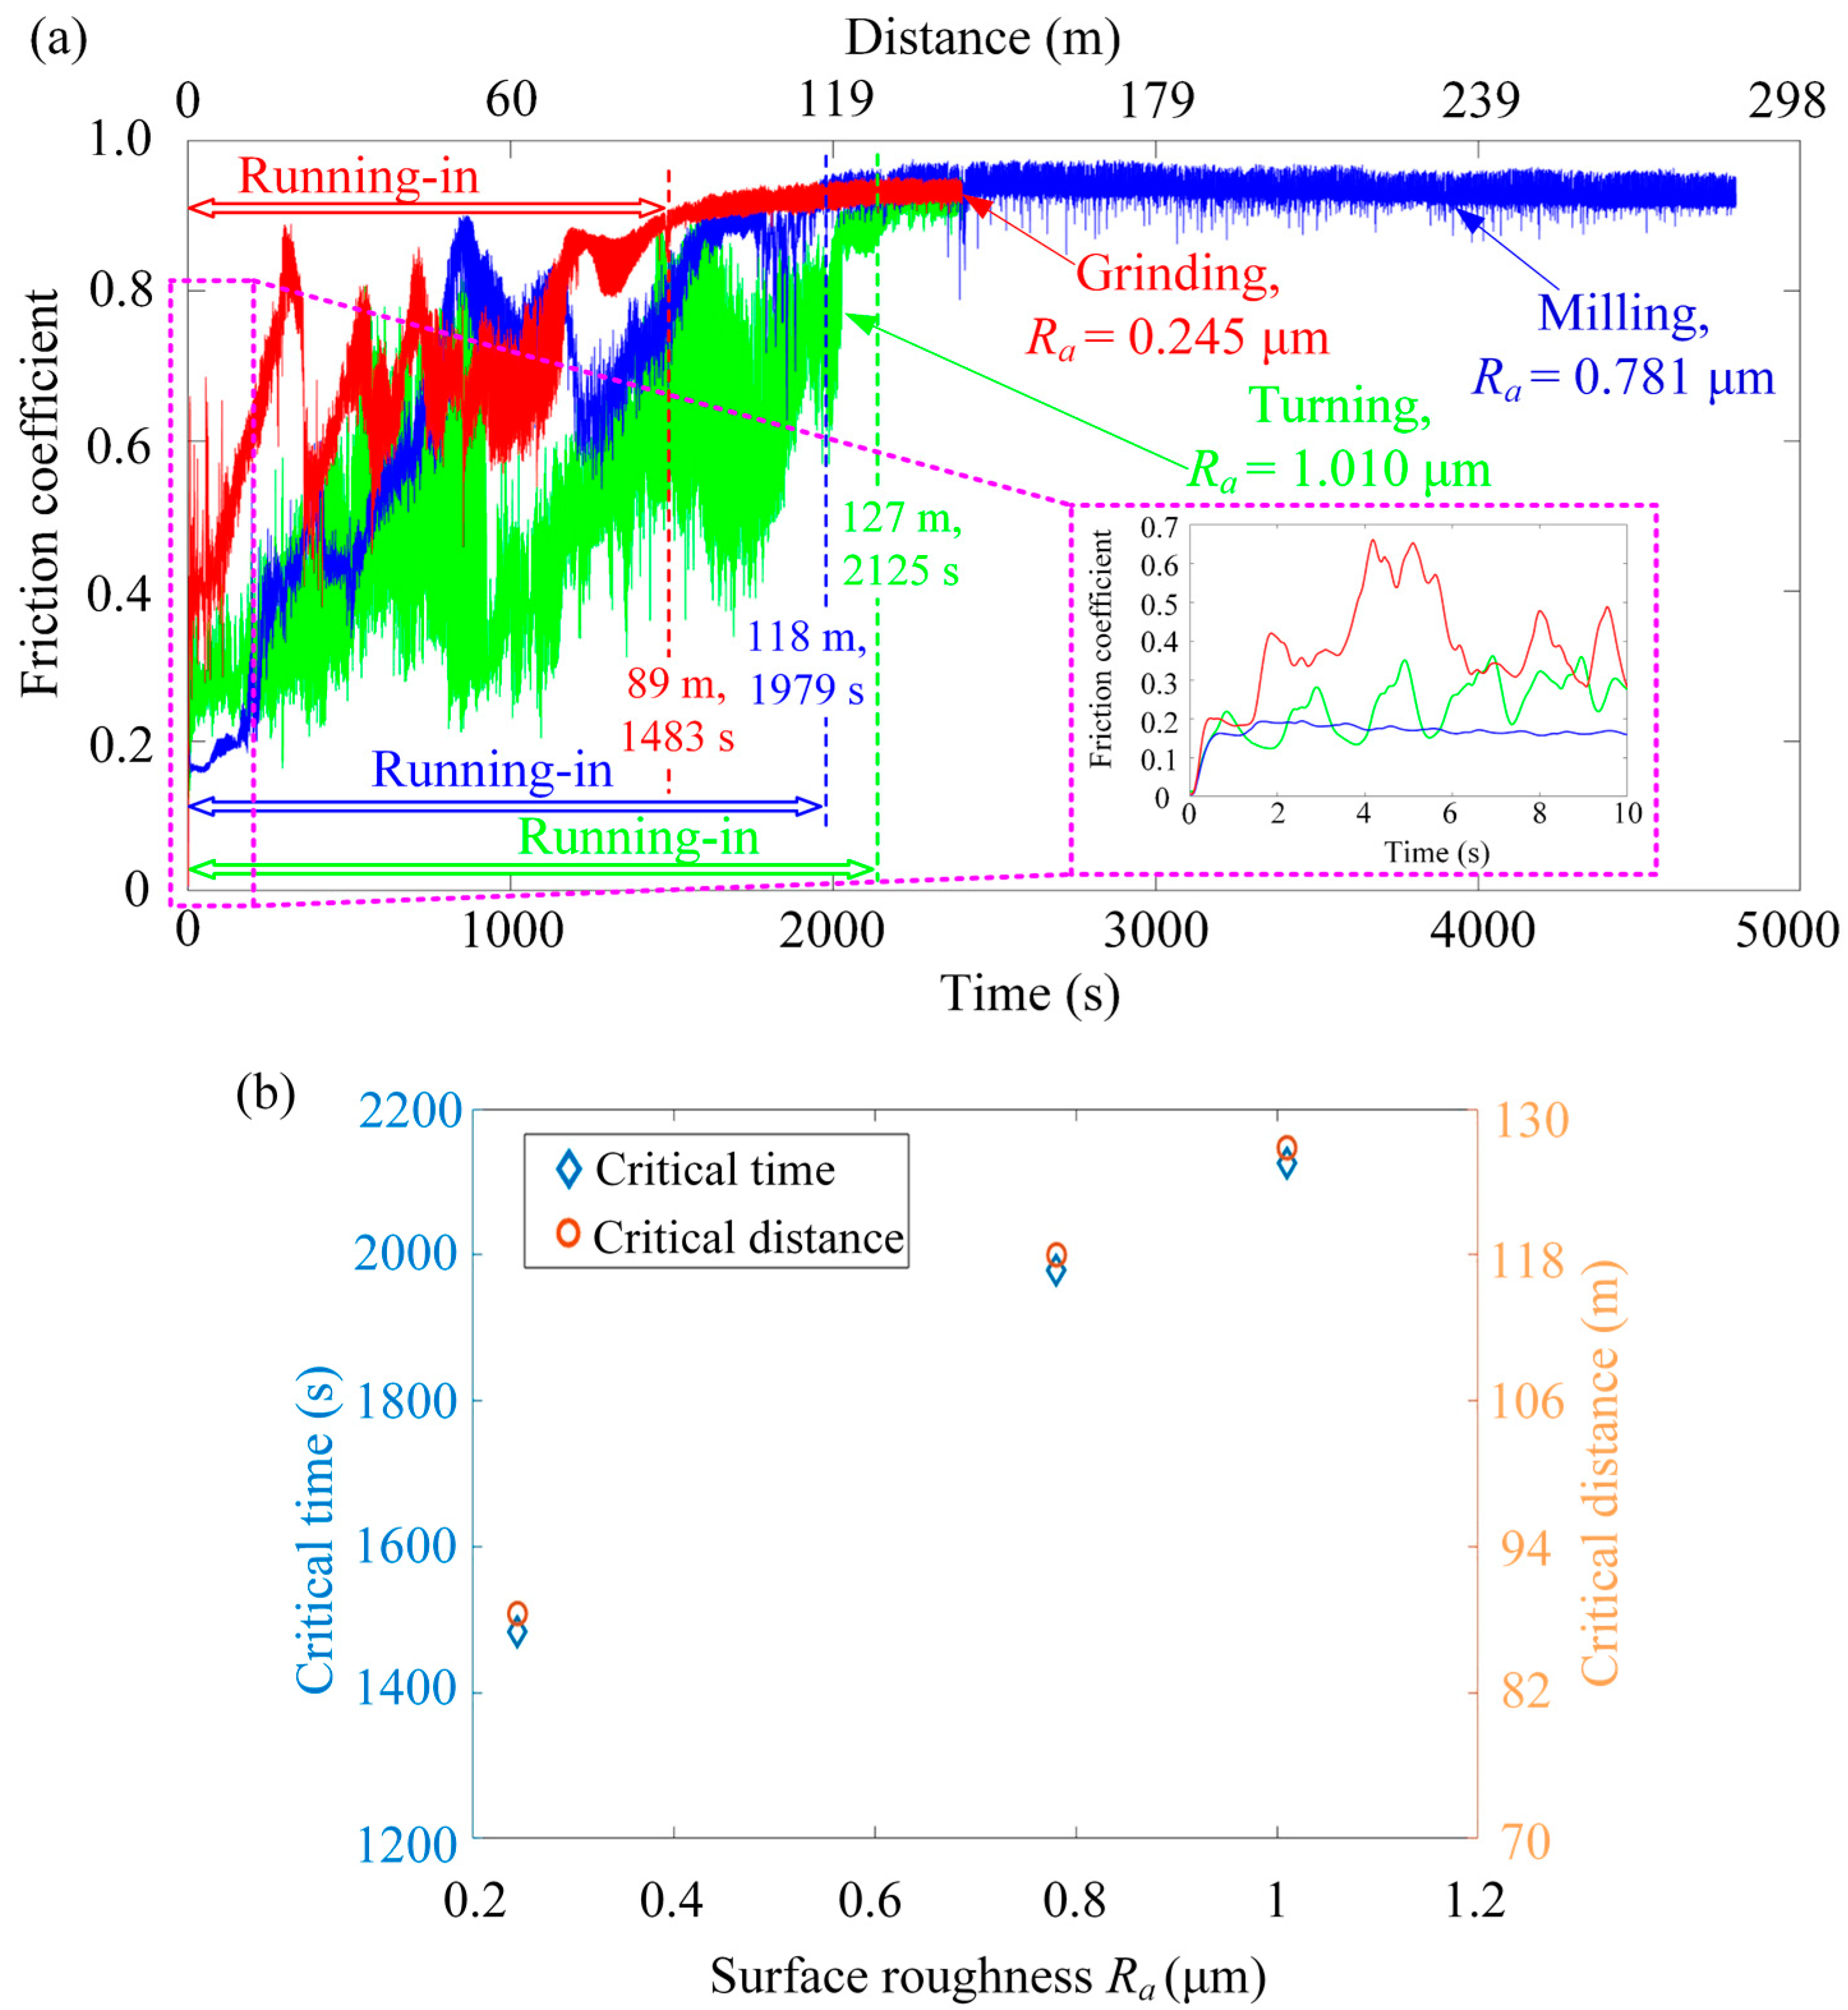
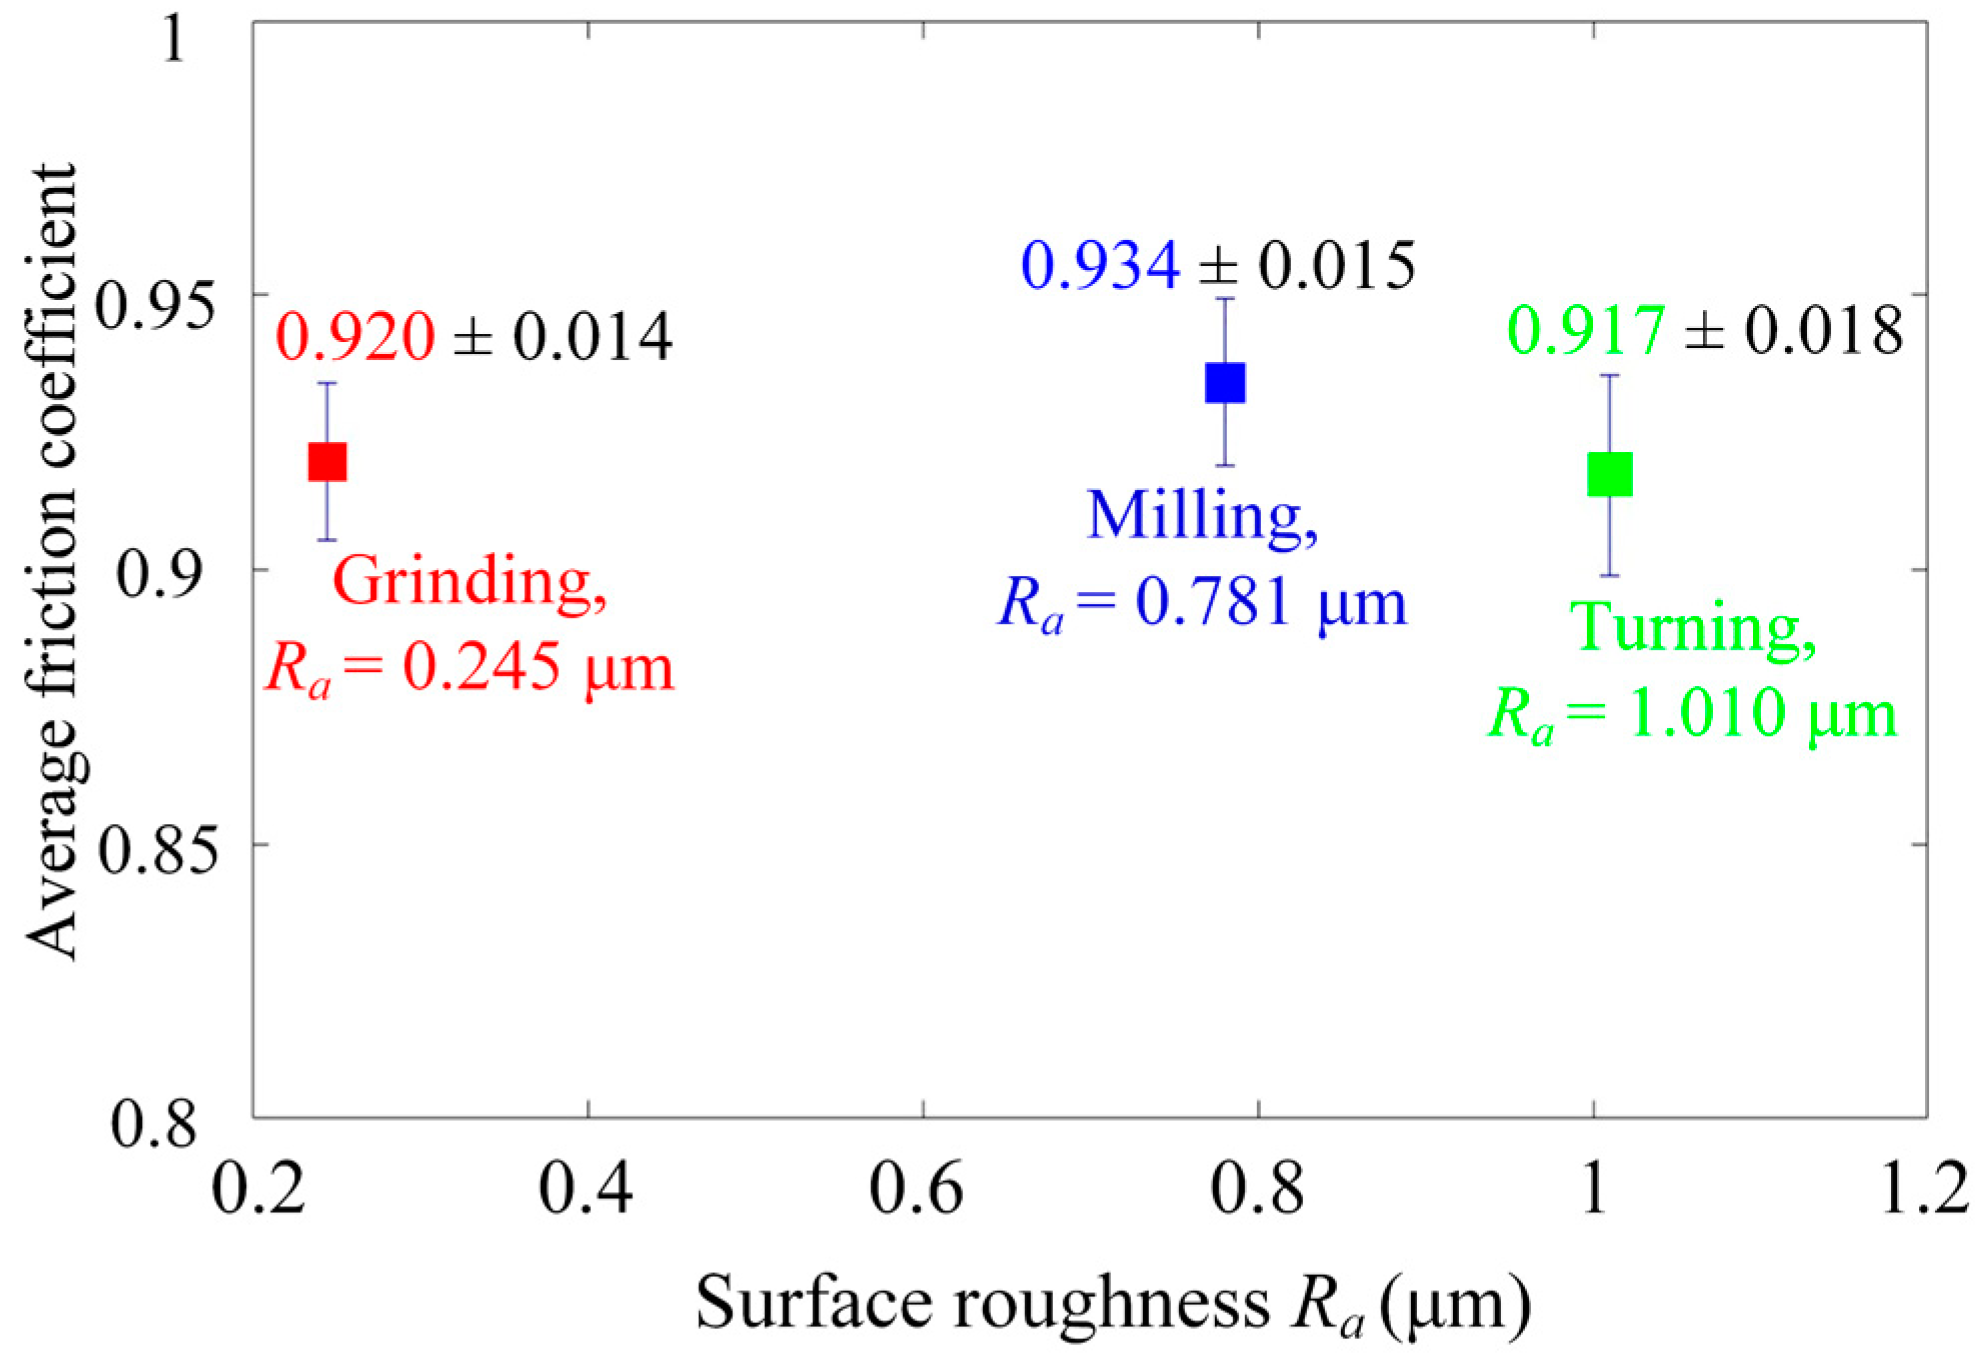
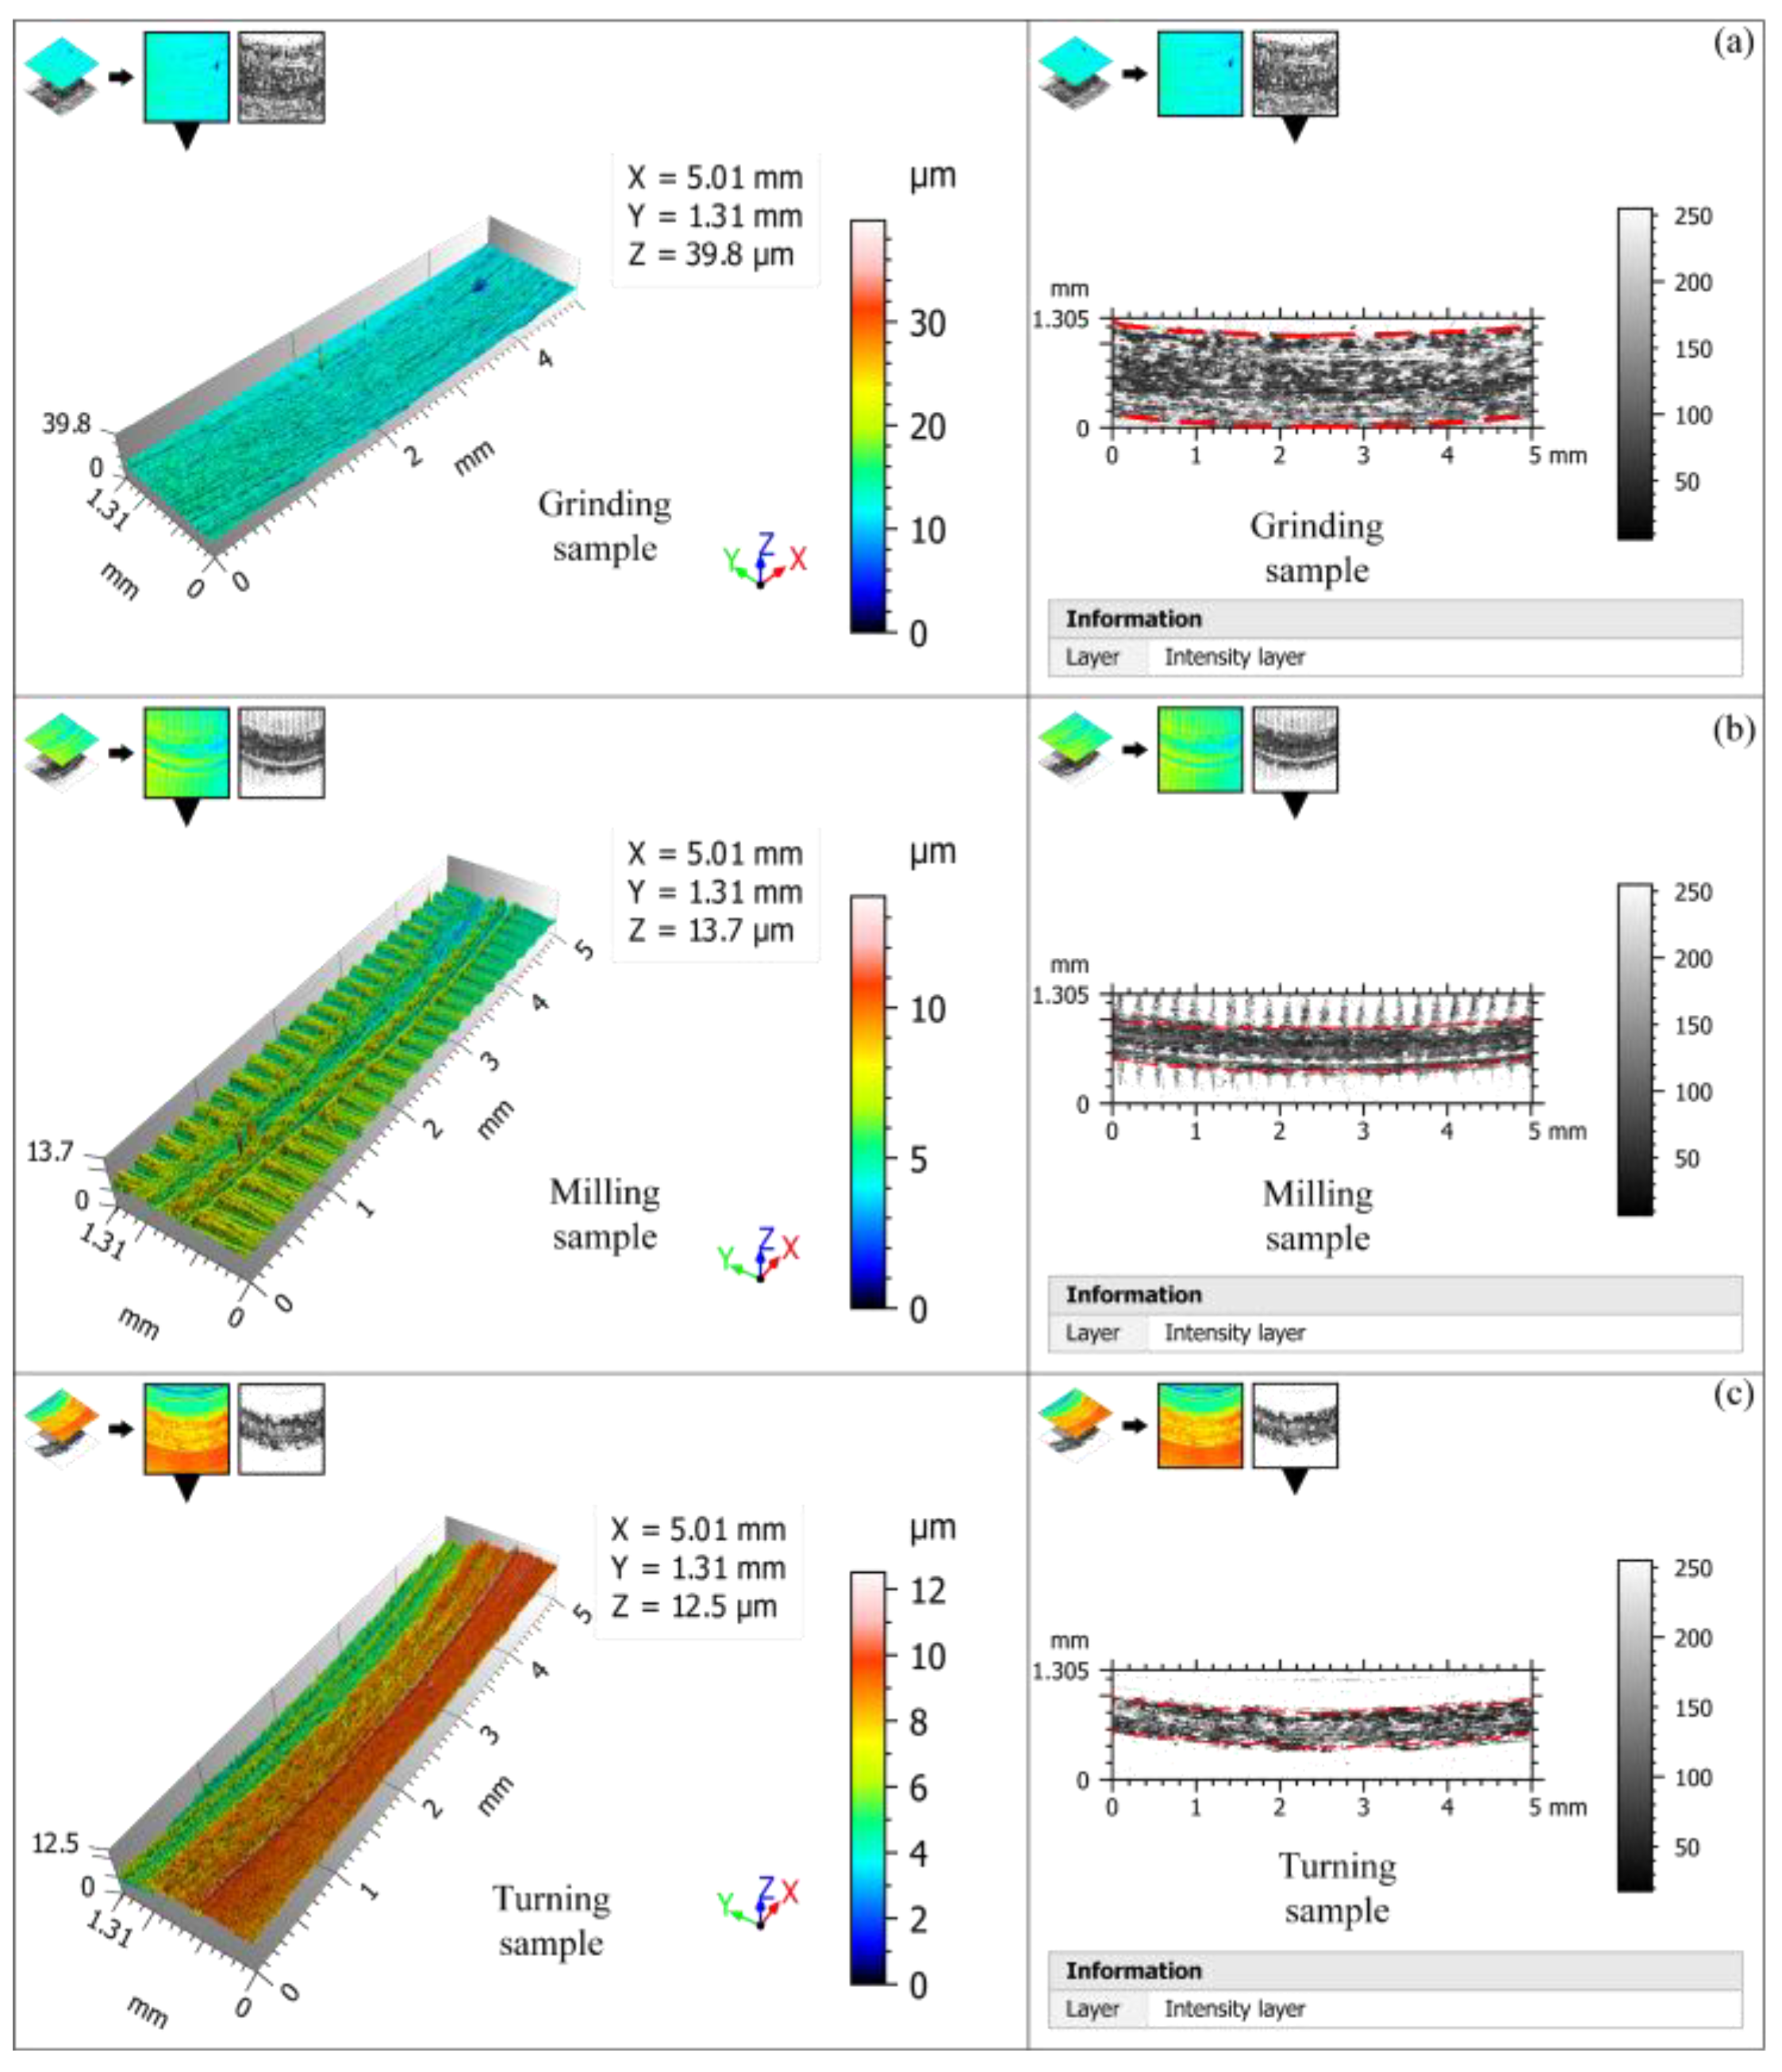
3.1. Effects of Surface Roughness on Friction Coefficient
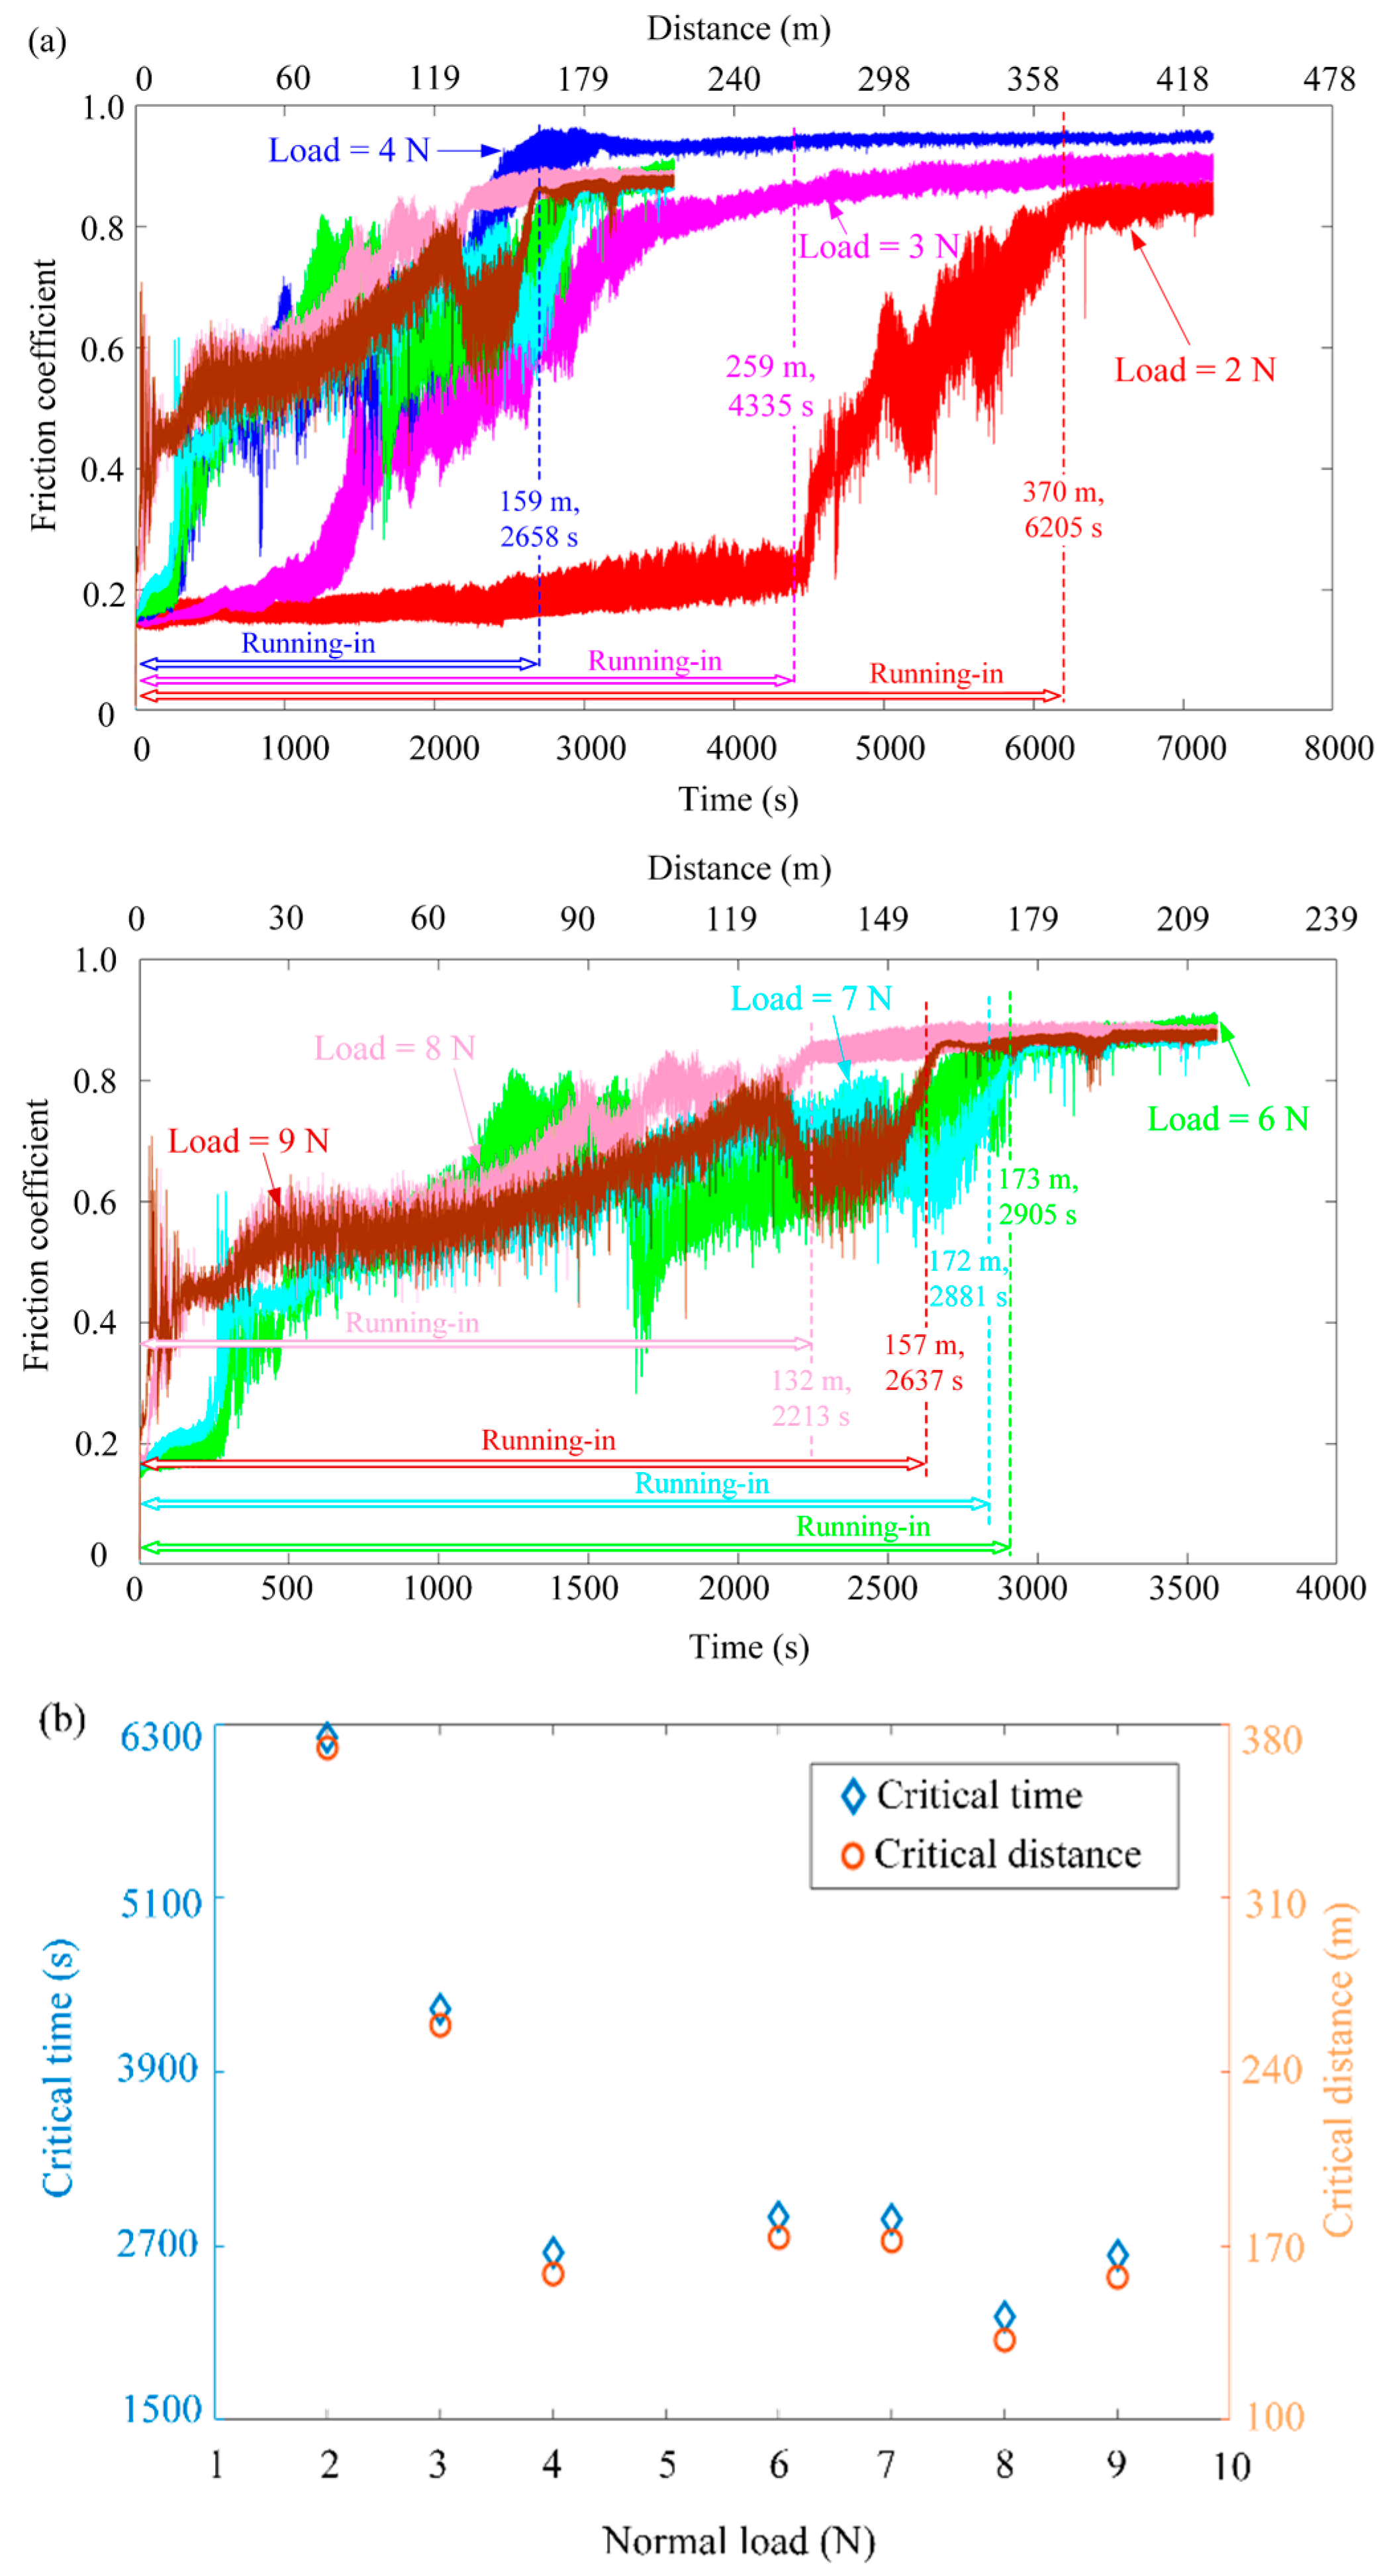
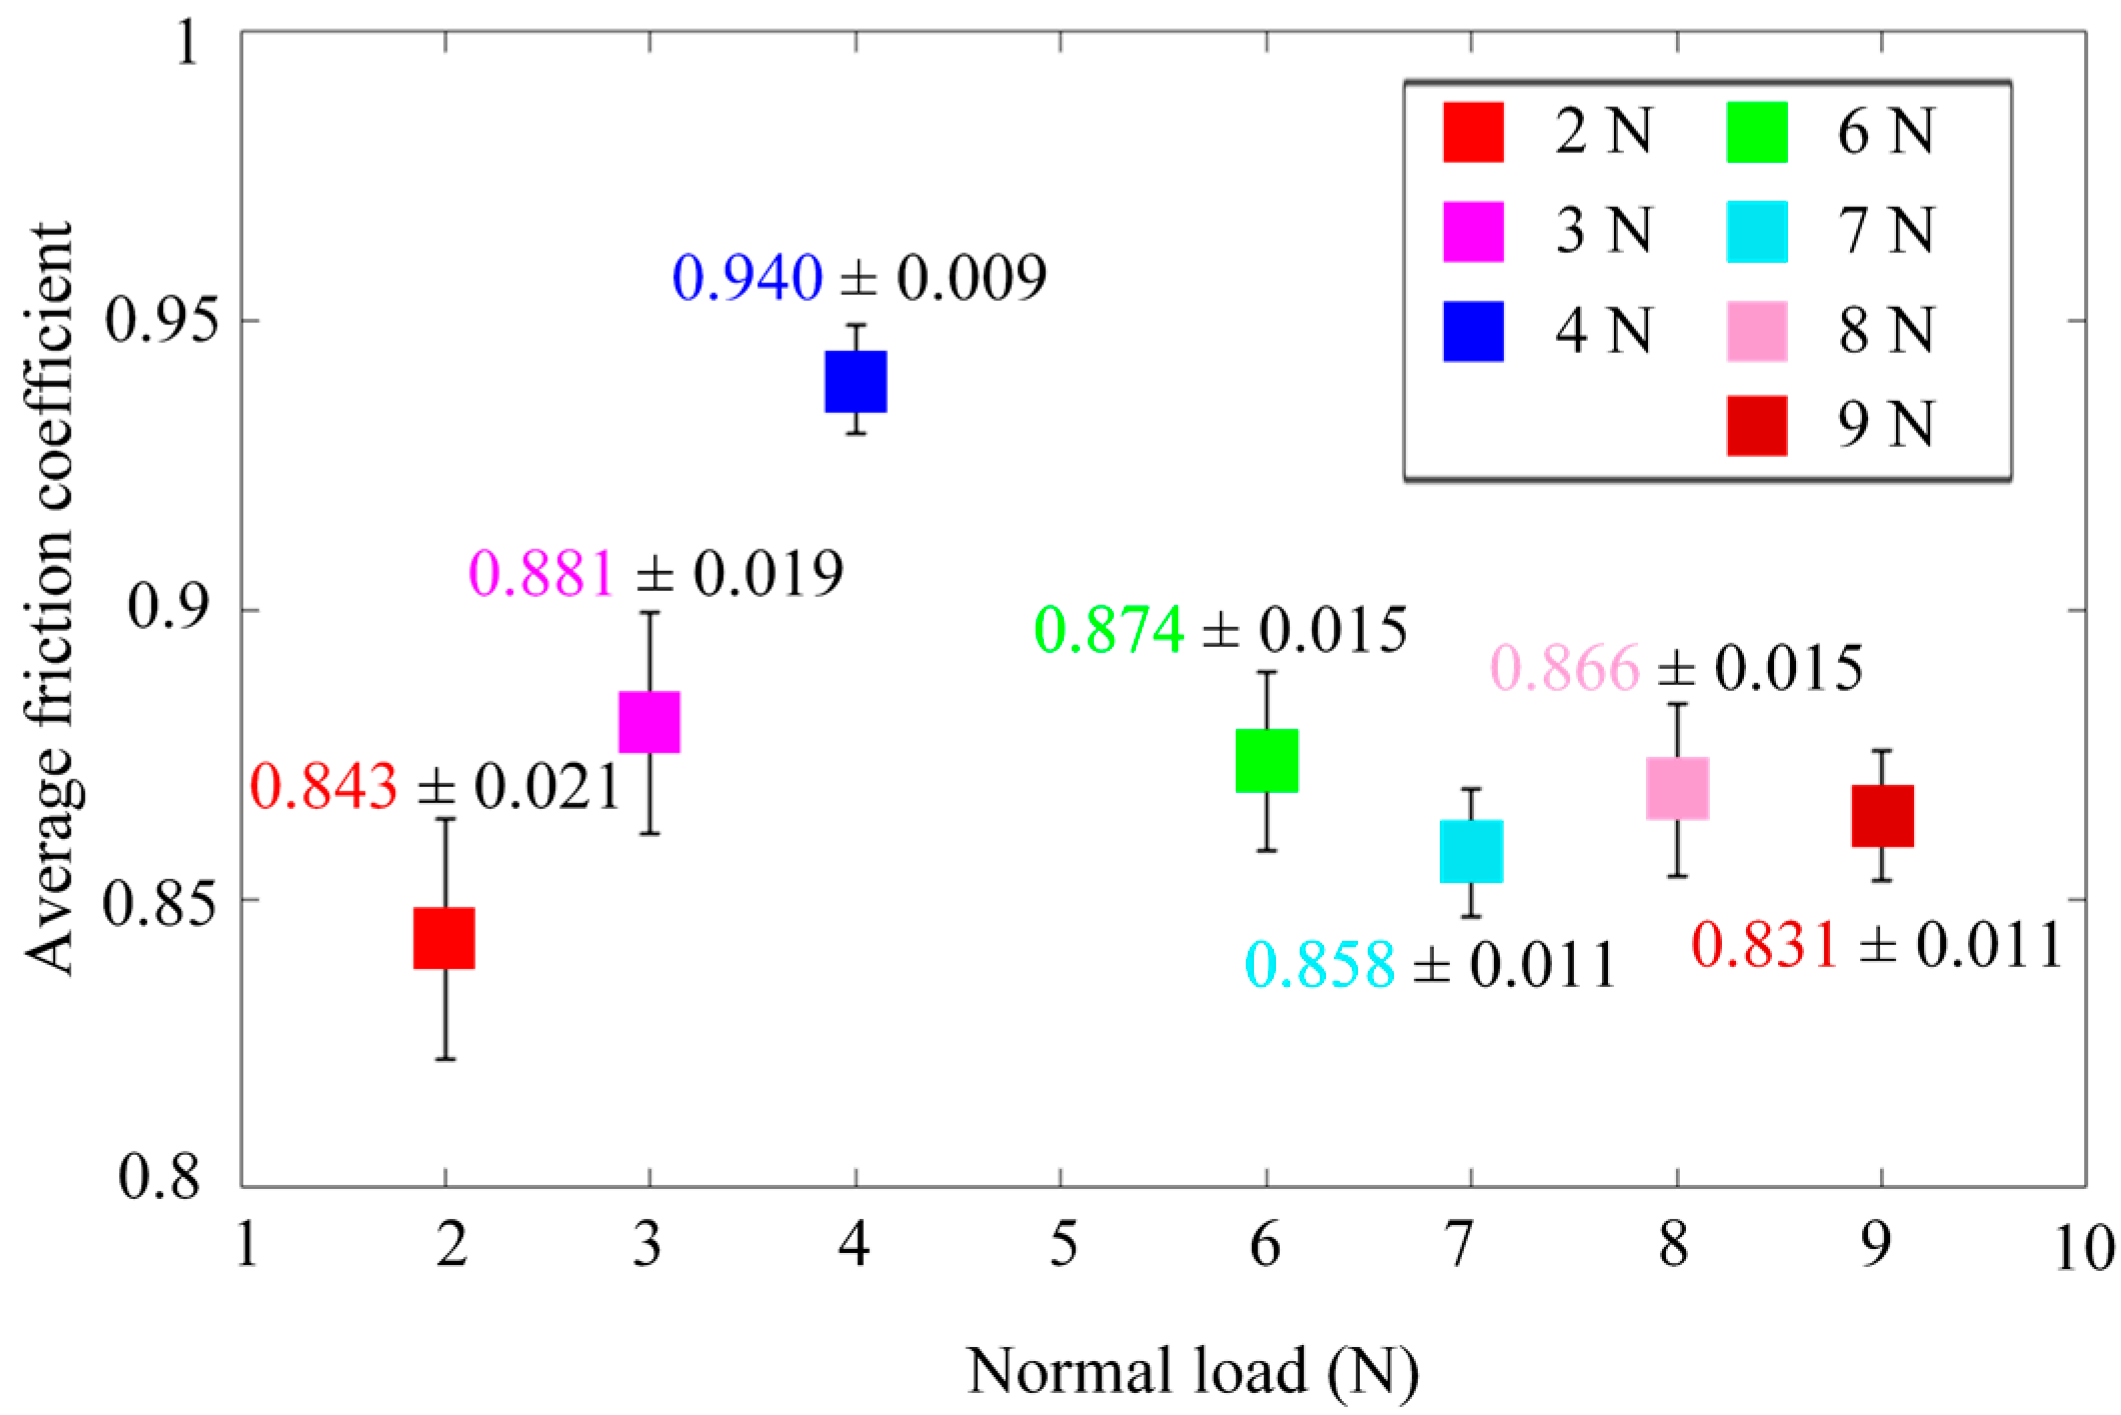
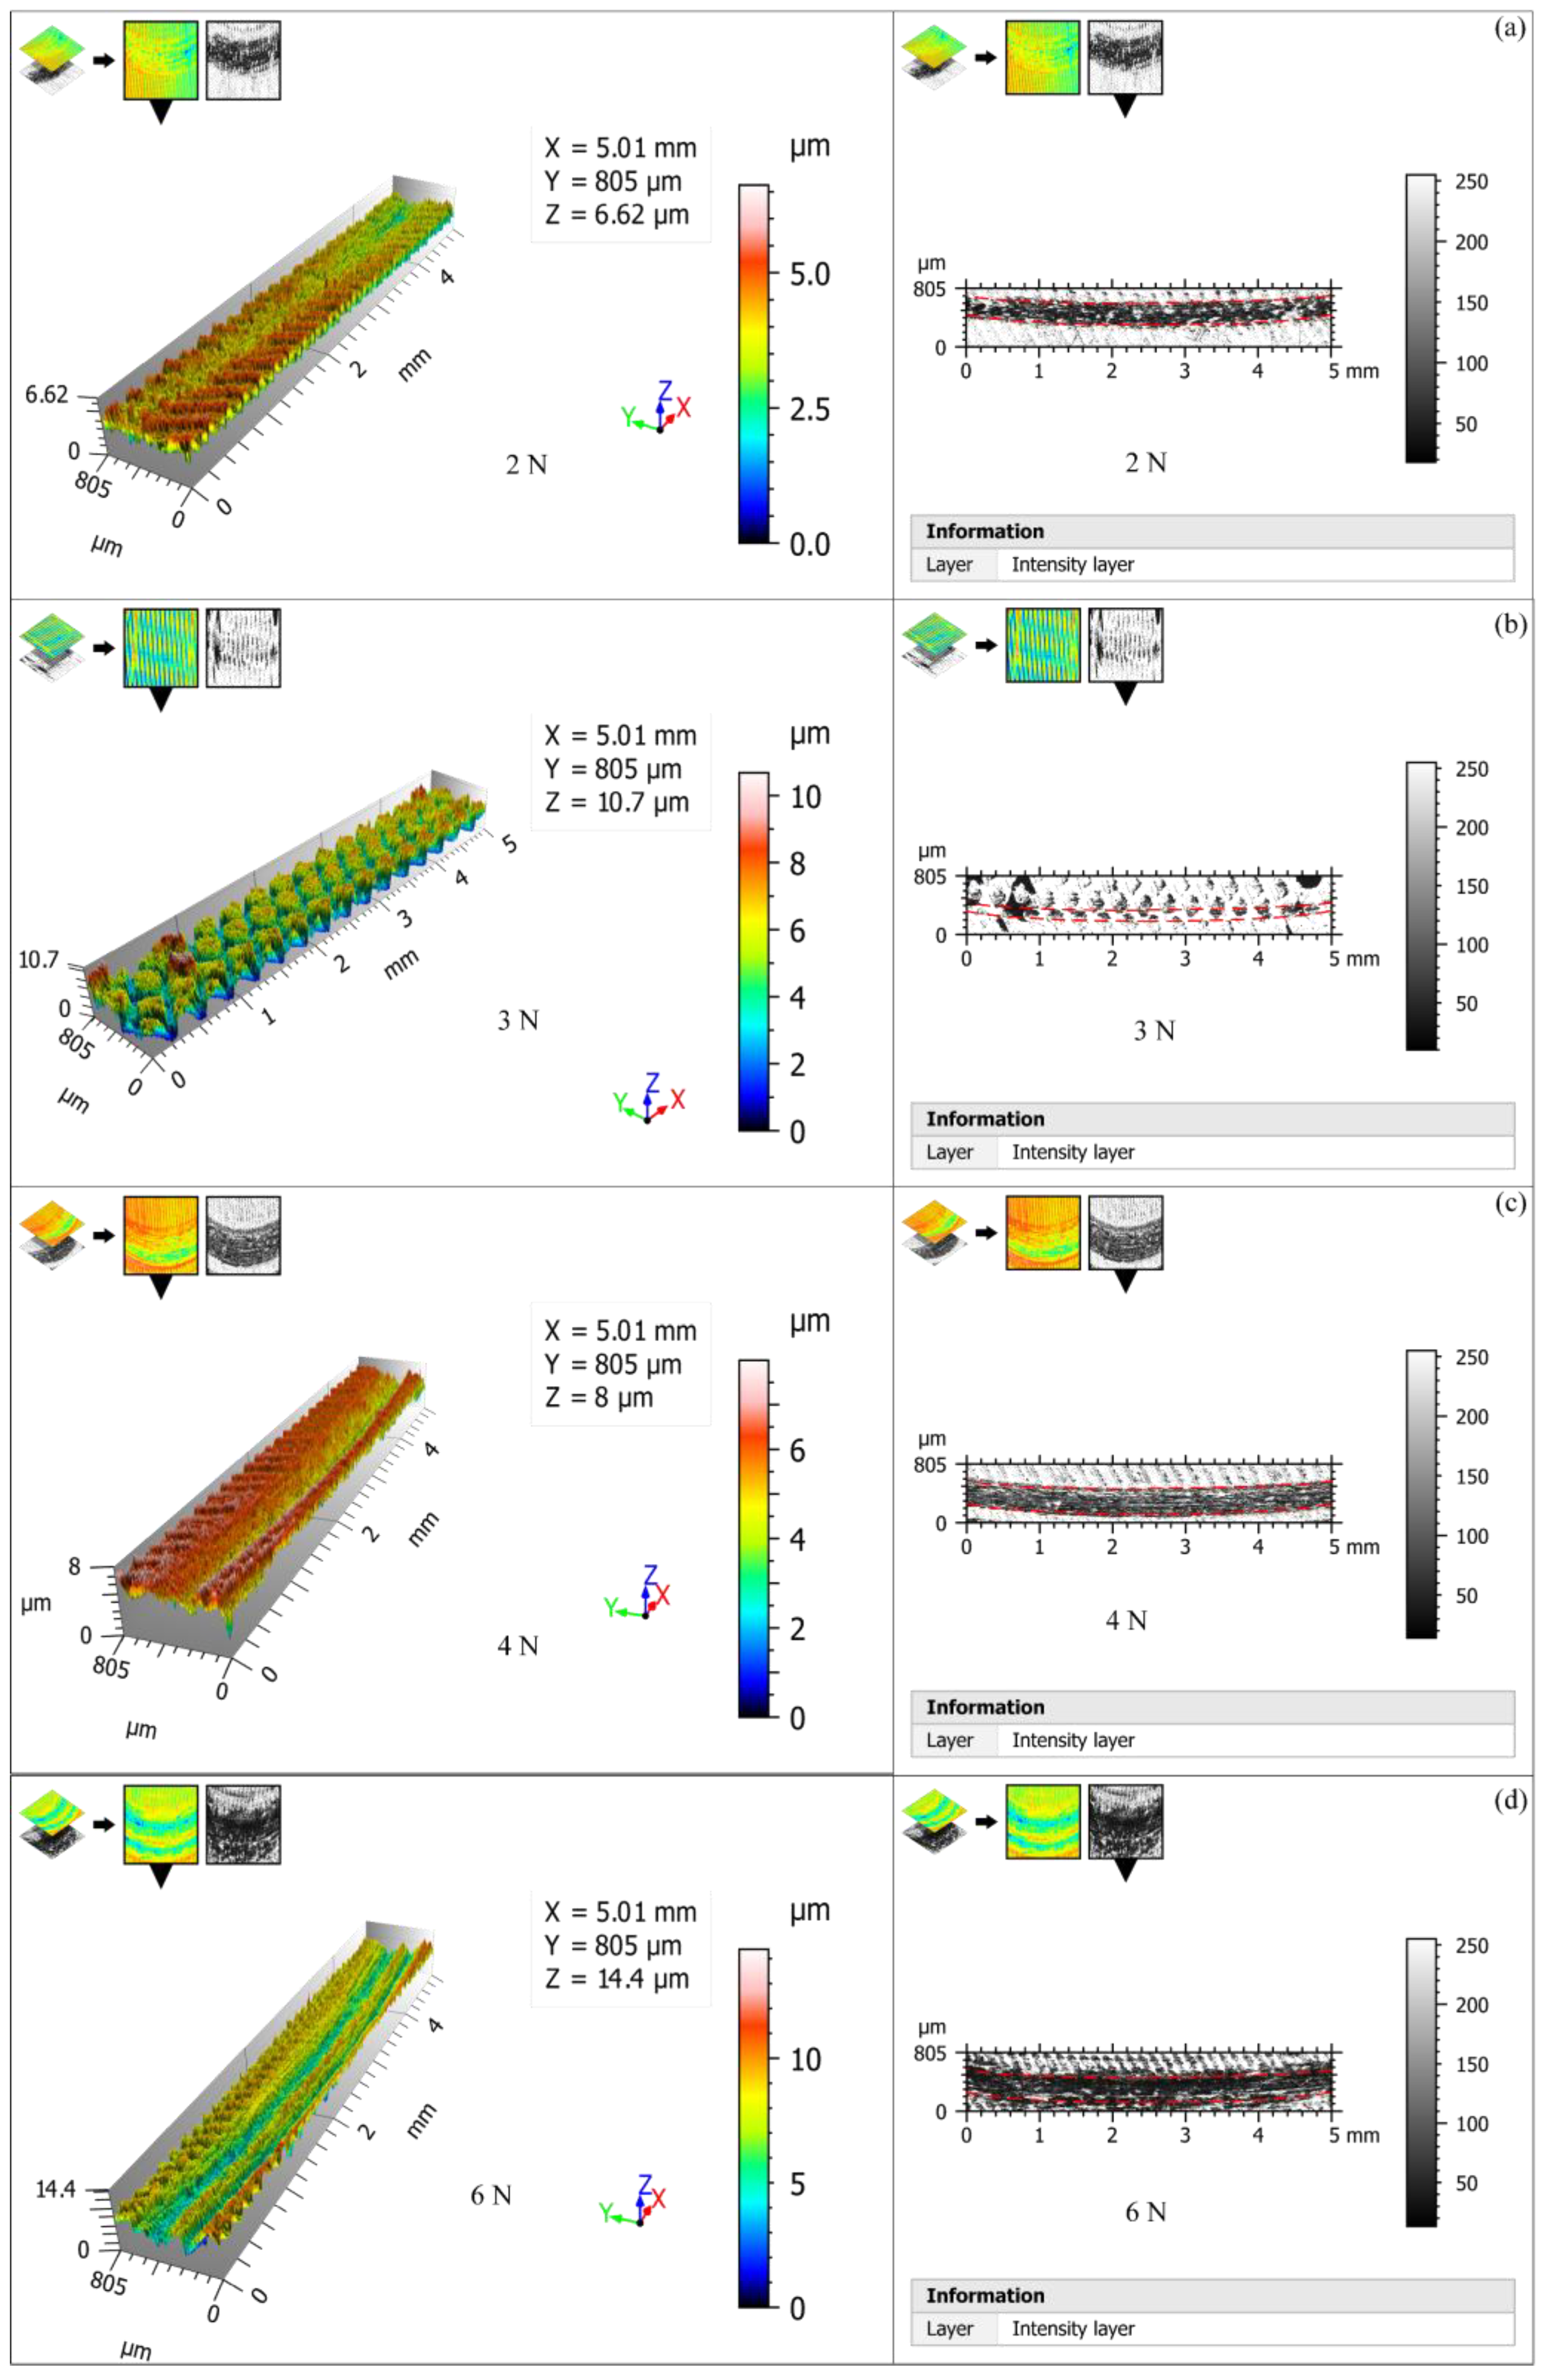
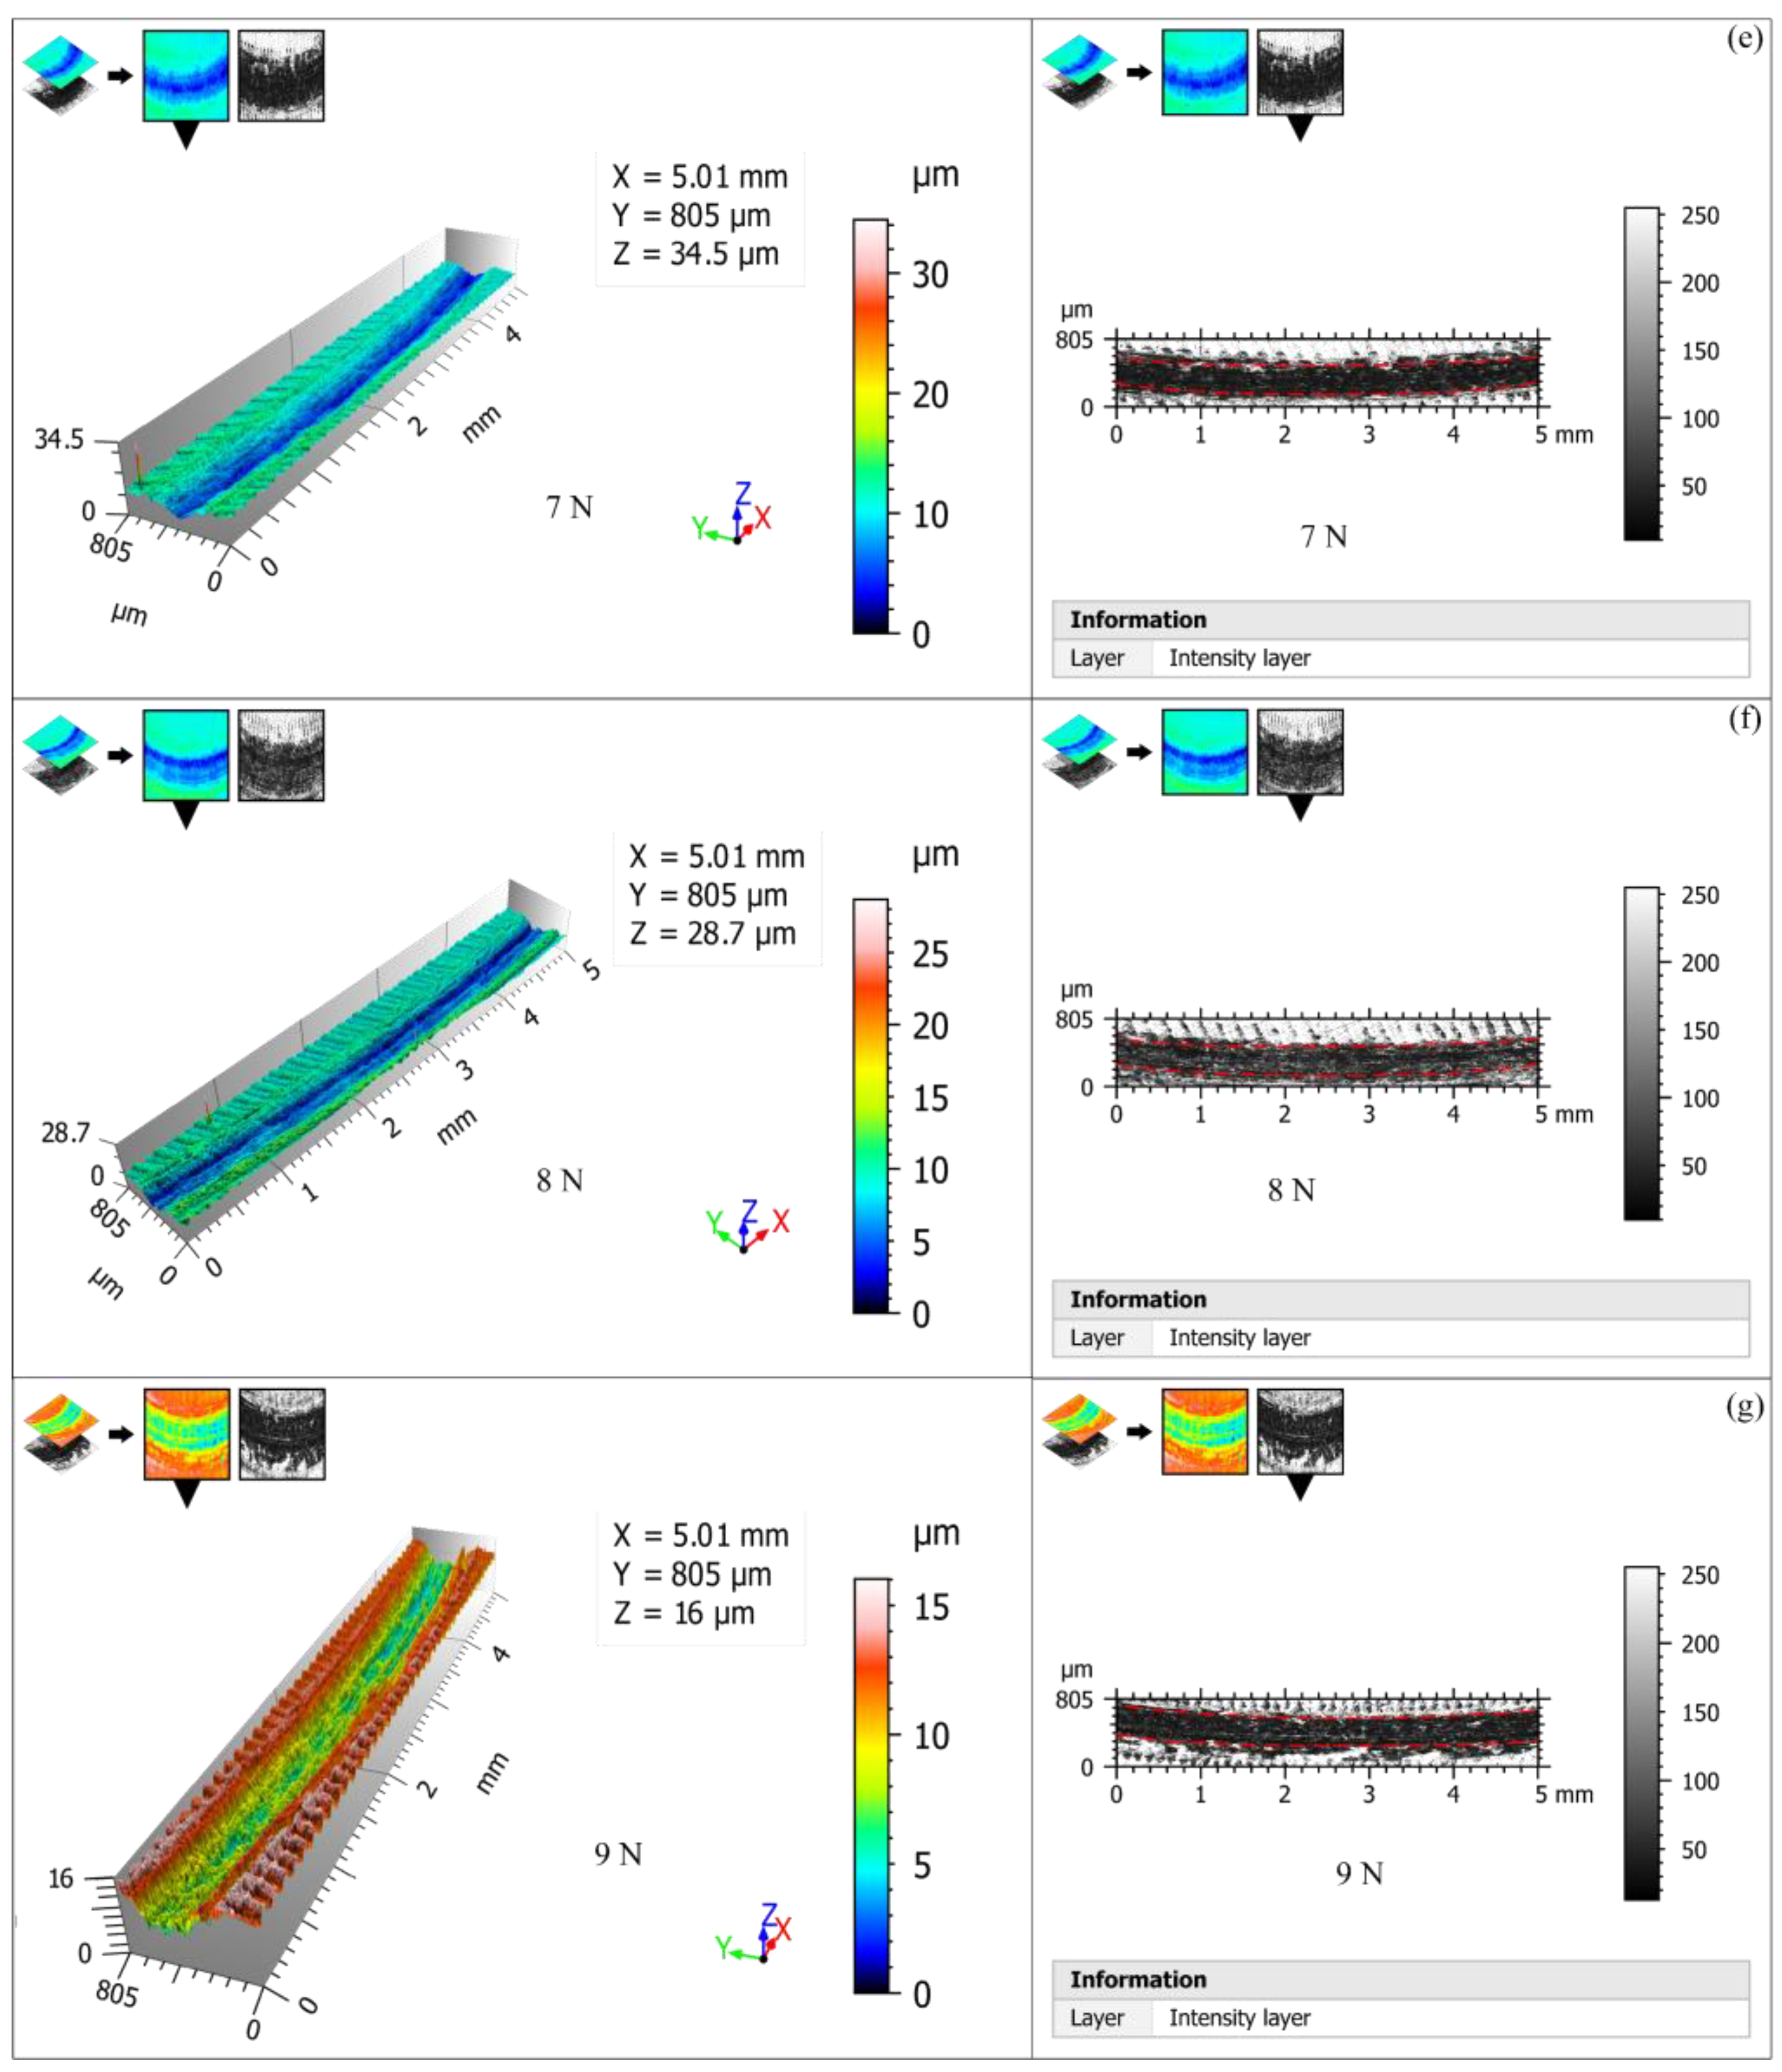
3.2. Effects of Normal Load on Friction Coefficient
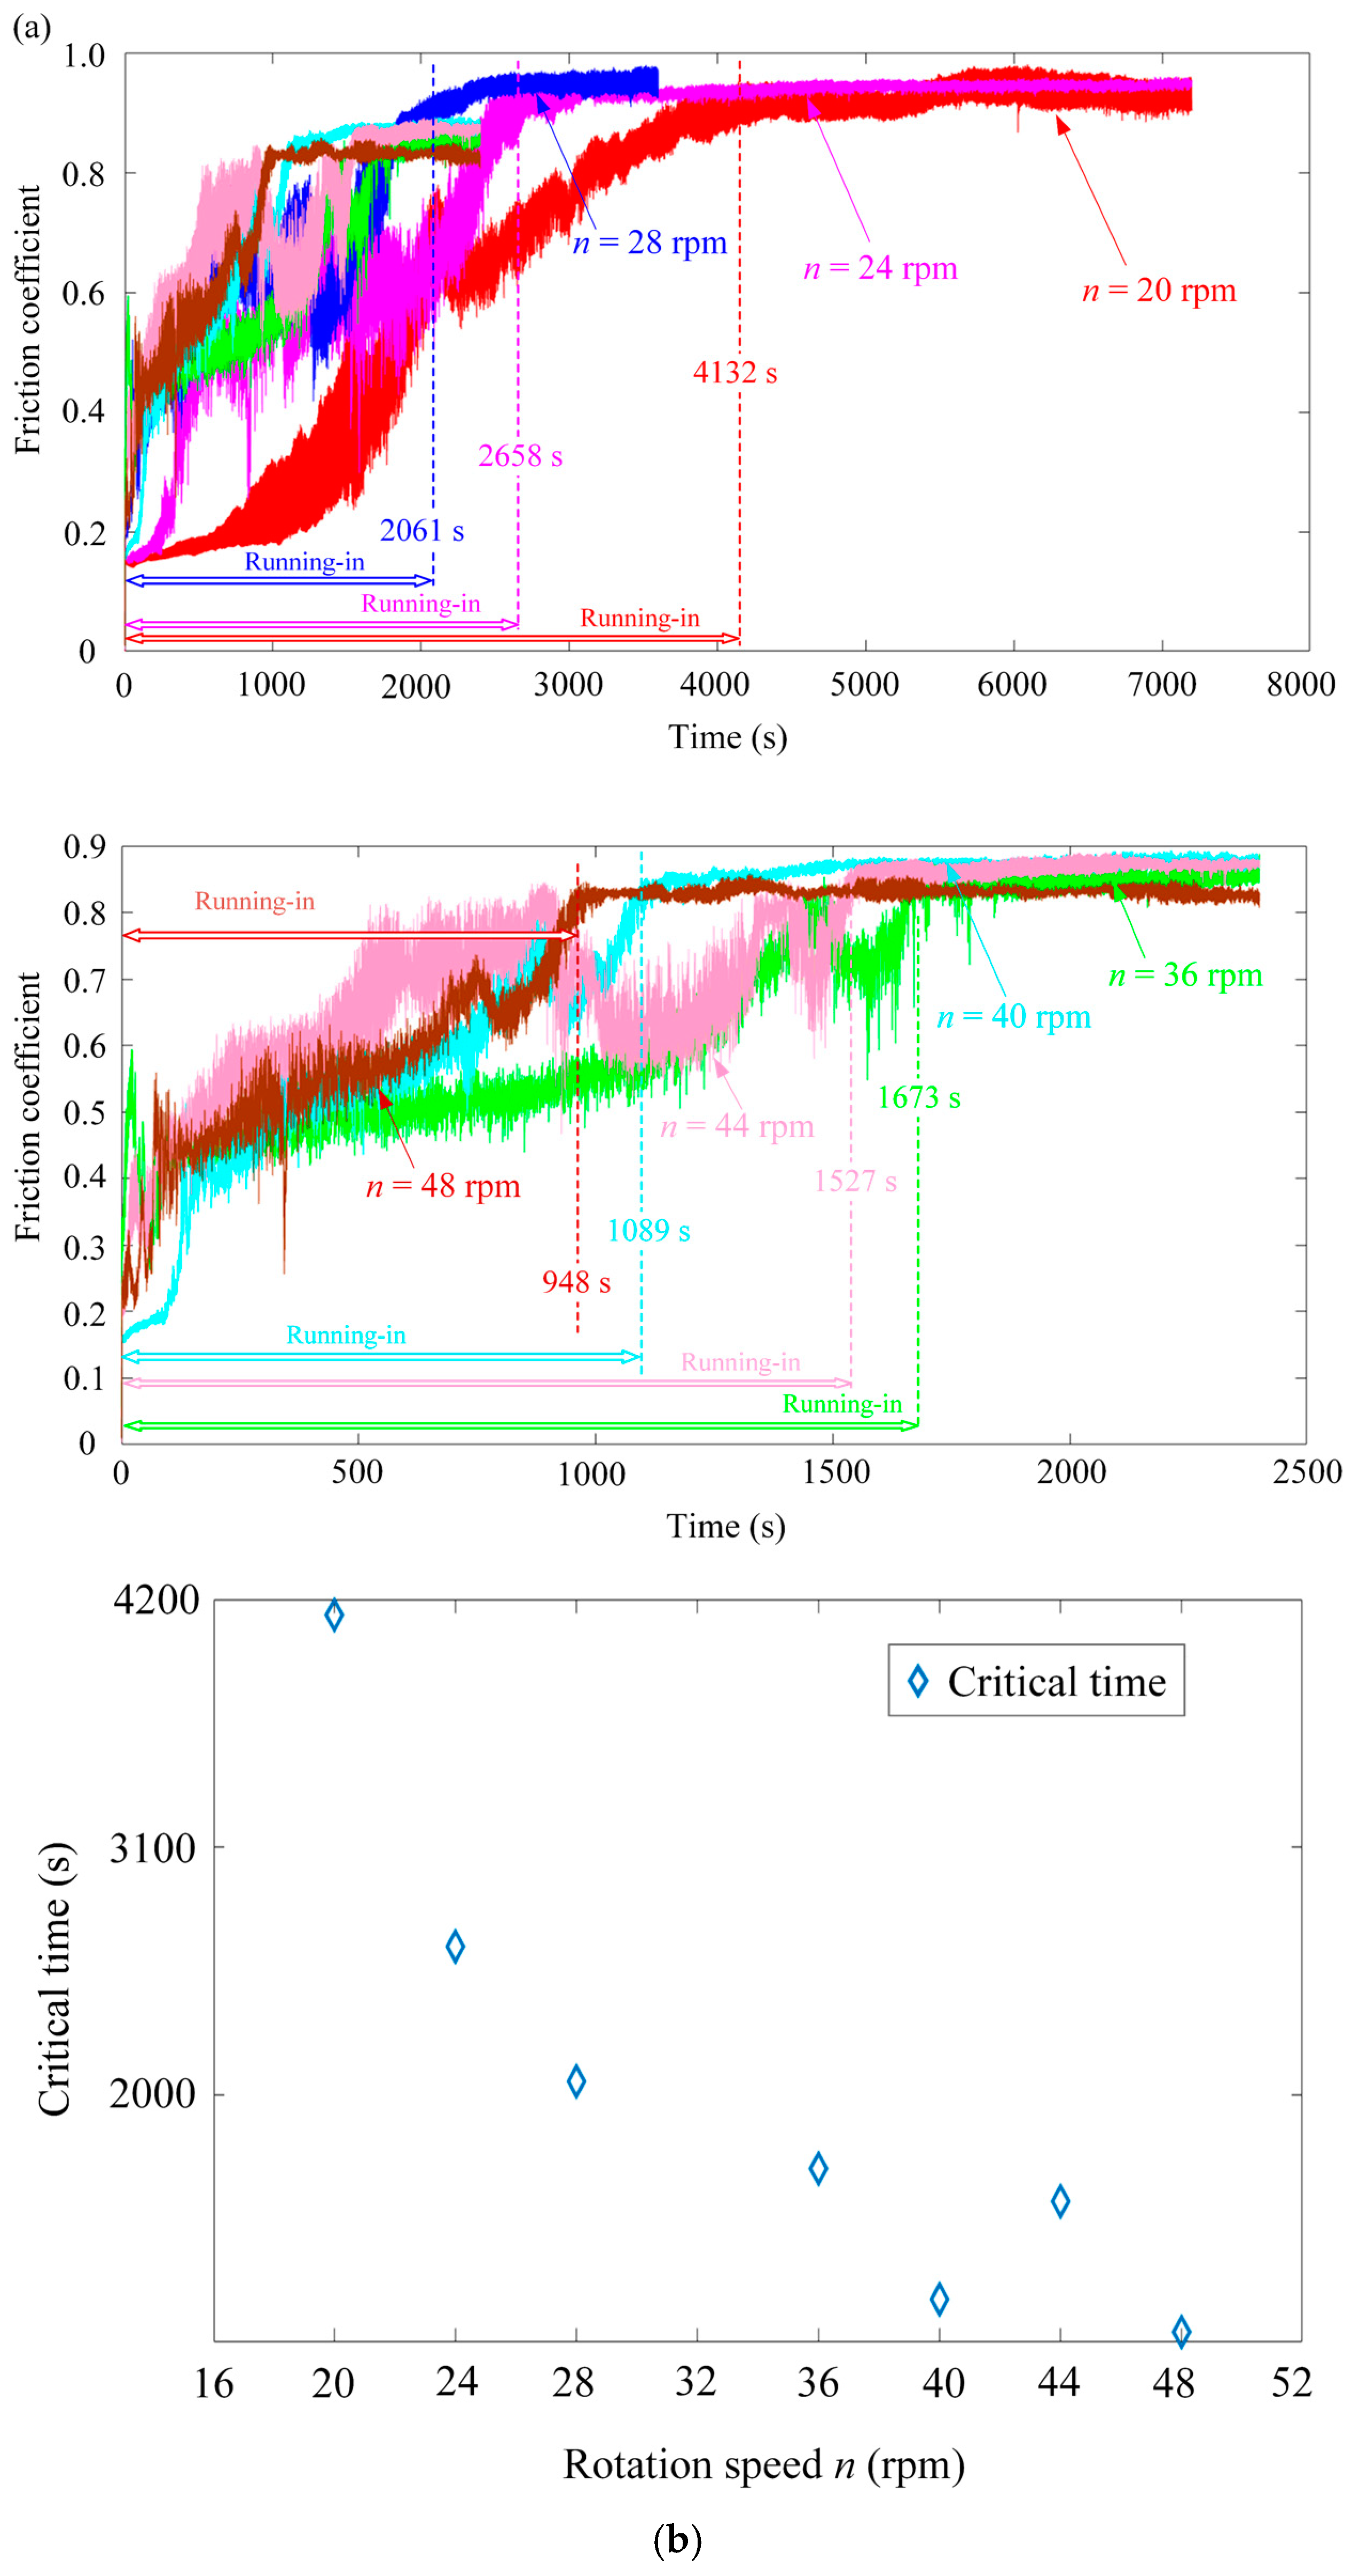
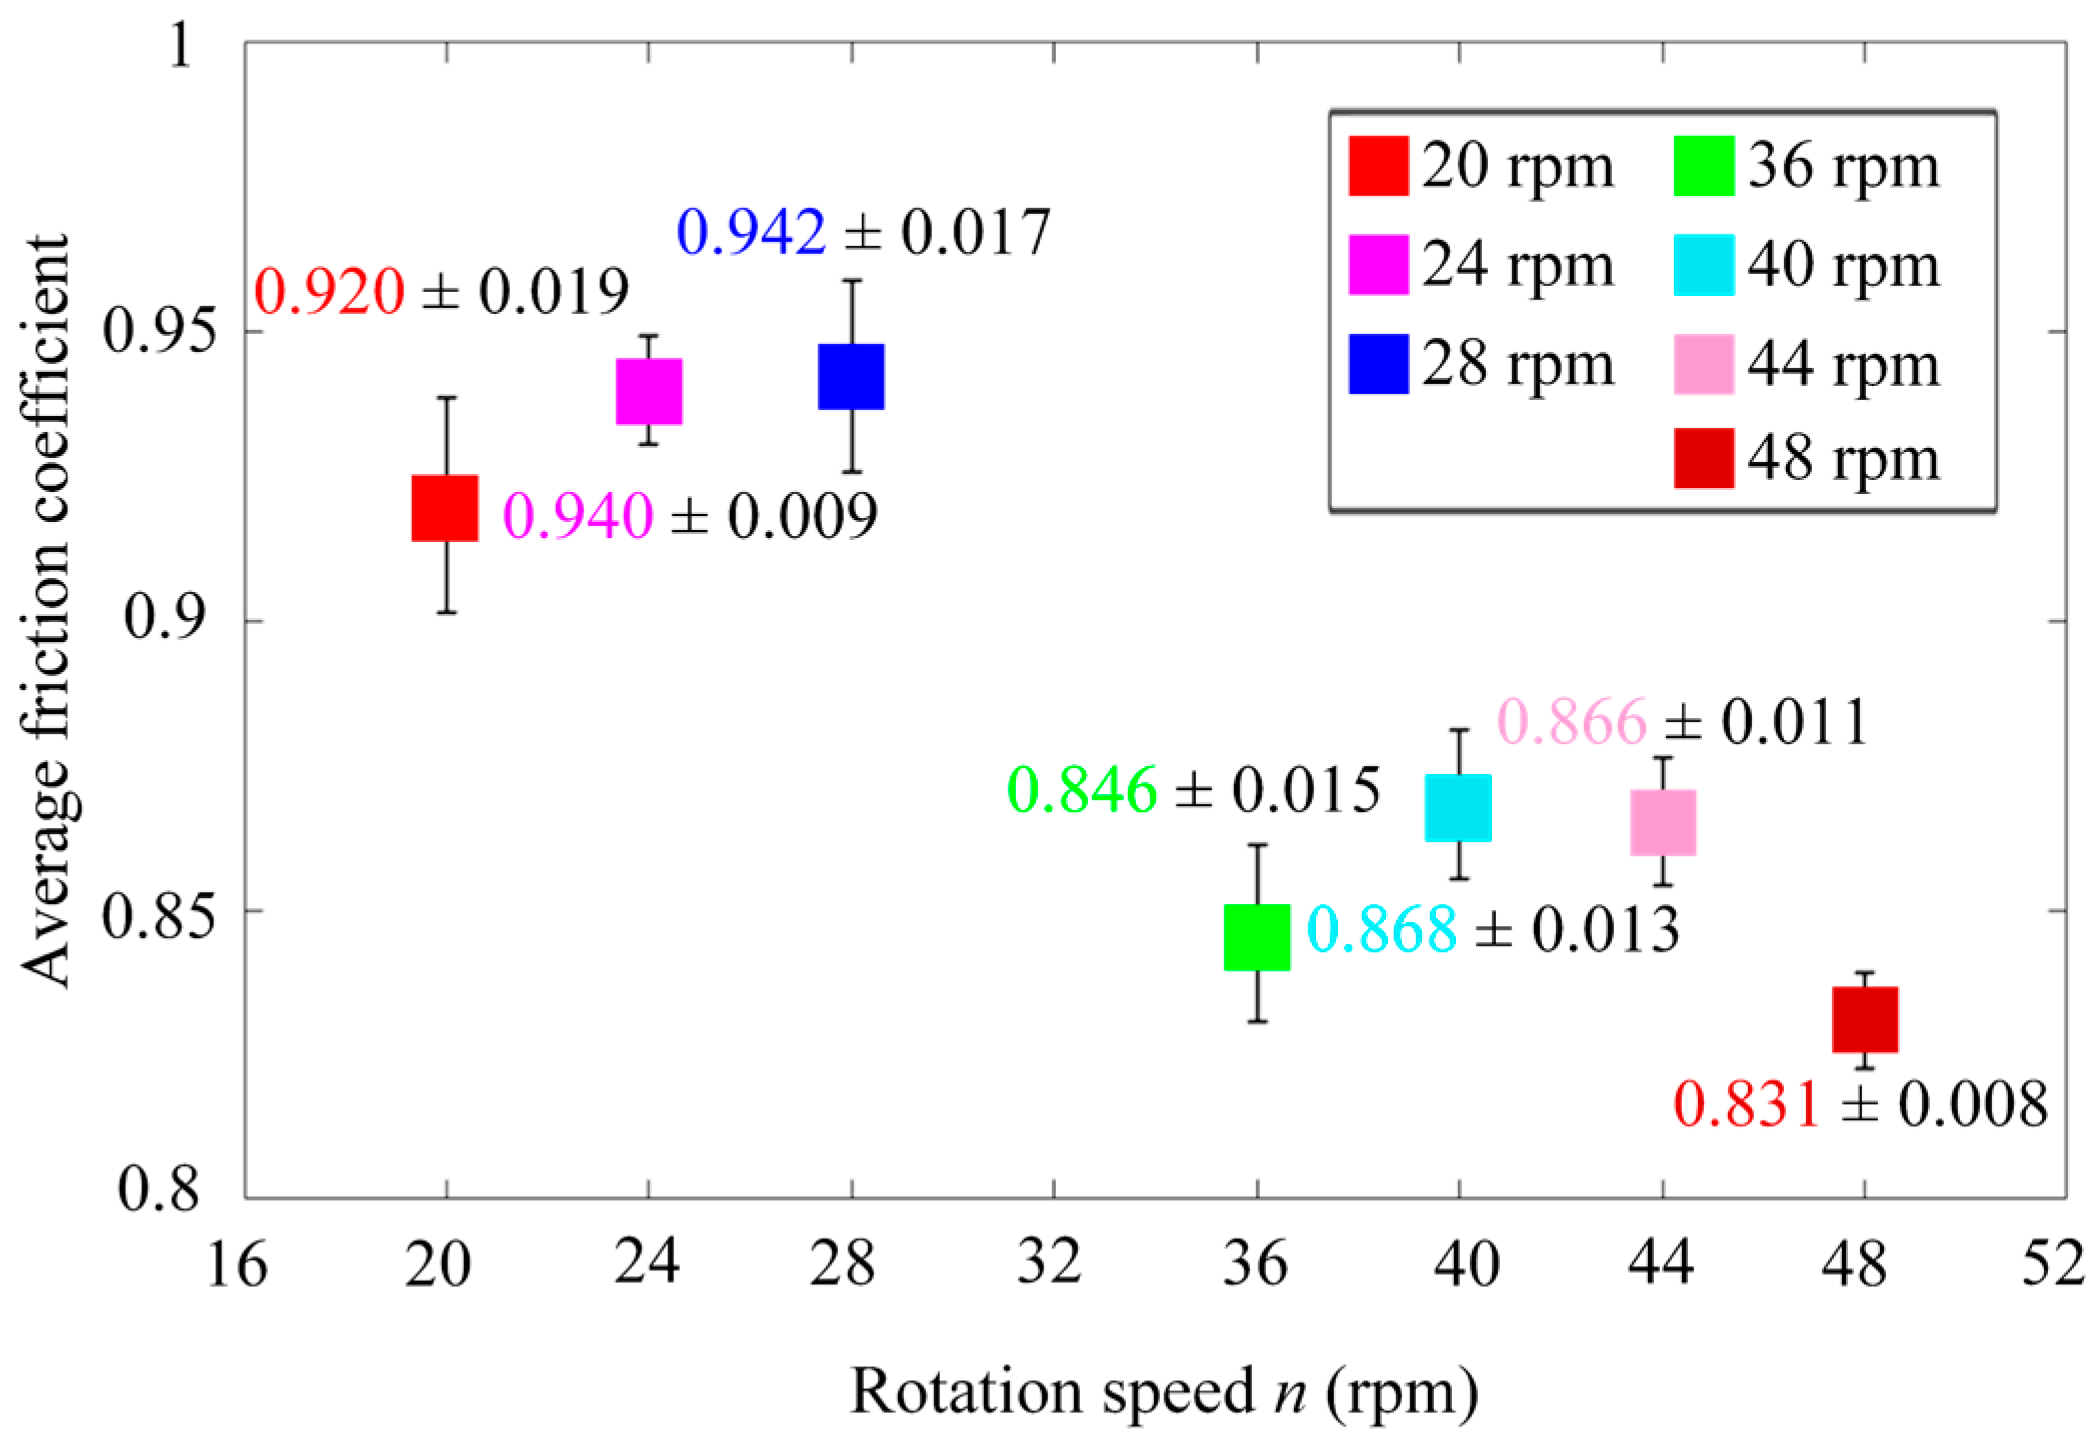
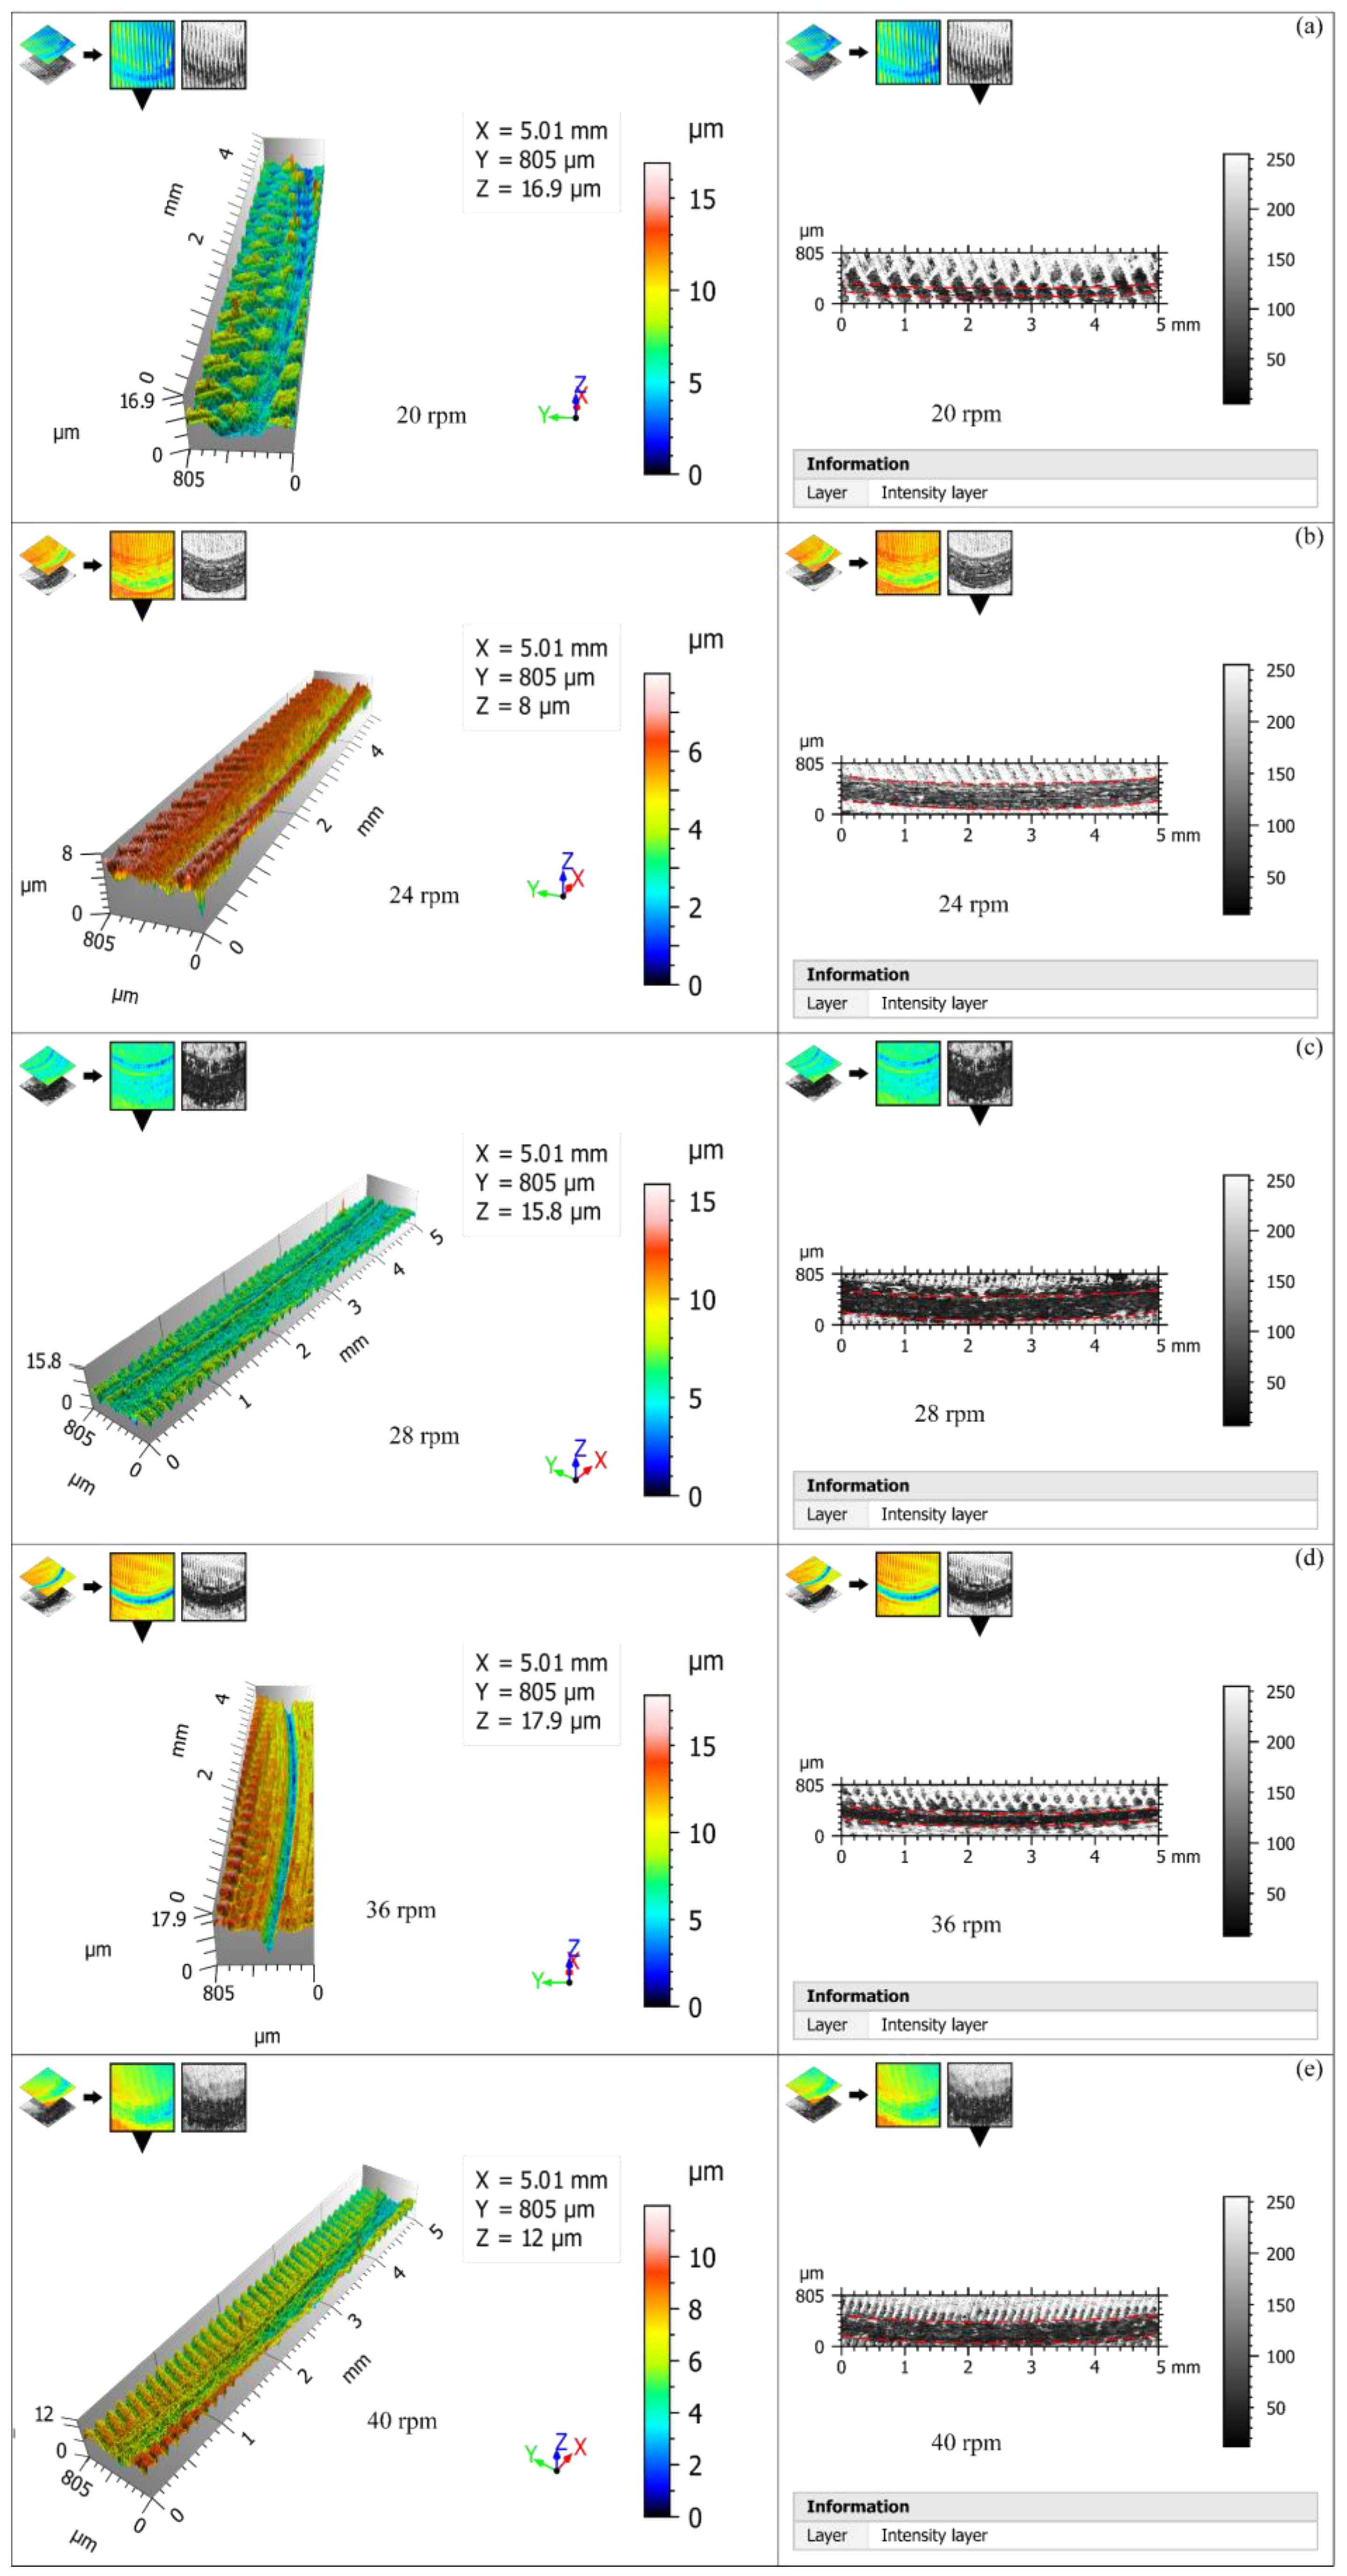
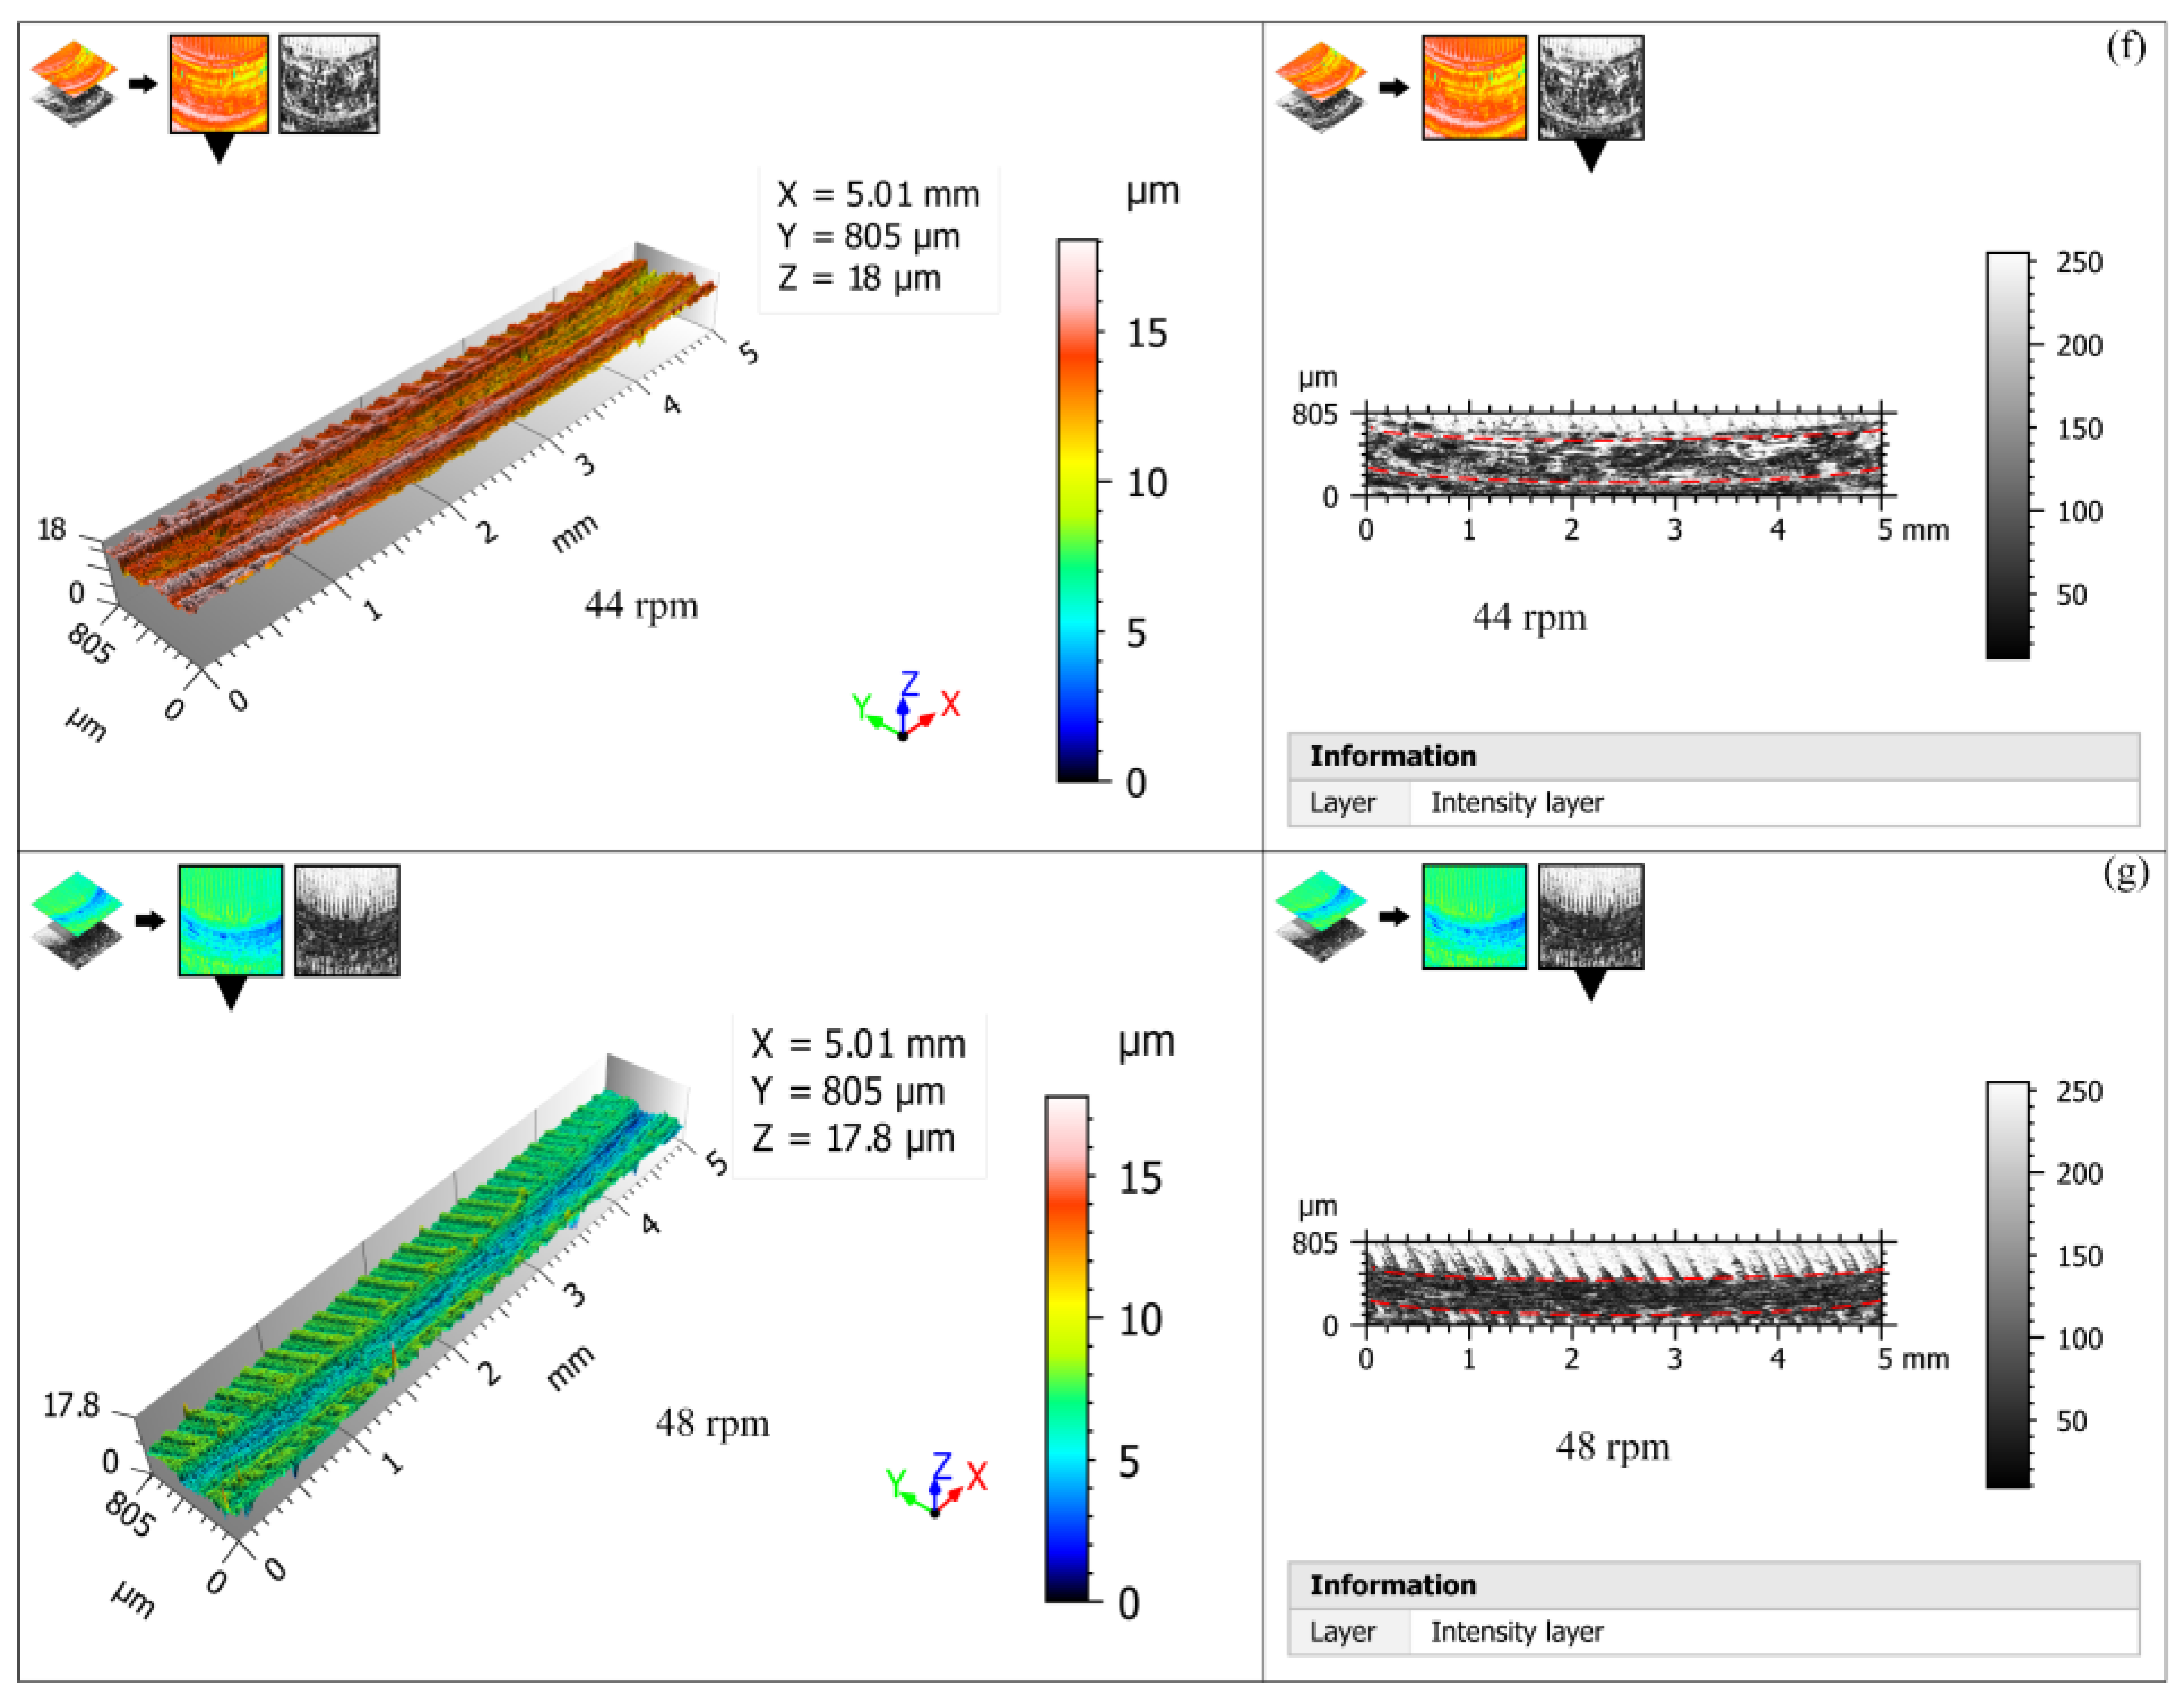
3.3. Effects of Rotation Speed on Friction Coefficient
4. Conclusions
Author Contributions
Funding
Data Availability Statement
Conflicts of Interest
References
- Khonsari, M.M.; Ghatrehsamani, S.; Akbarzadeh, S. On the running-in nature of metallic tribo-components: A review. Wear 2021, 474–475, 203871. [Google Scholar] [CrossRef]
- Yu, X.; Sun, Y.Y.; Wu, S.J. Multi-stage contact model between fractal rough surfaces based on multi-scale asperity deformation. Appl. Math. Model. 2022, 109, 229–250. [Google Scholar] [CrossRef]
- Yu, X.; Sun, Y.Y.; Li, H.G.; Wu, S.J. An improved meshing stiffness calculation algorithm for gear pair involving fractal contact stiffness based on dynamic contact force. Eur. J. Mech. Solids 2022, 94, 104595. [Google Scholar] [CrossRef]
- Liang, X.M.; Wang, G.F. A friction model of fractal rough surfaces accounting for size dependence at nanoscale. Acta Mech. 2022, 233, 69–81. [Google Scholar] [CrossRef]
- Wu, B.Z.; Qin, D.T.; Hu, J.J.; Liu, Y.G. Experimental data mining research on factors influencing friction coefficient of wet clutch. J. Tribol. 2021, 143, 121802. [Google Scholar] [CrossRef]
- Vukelic, D.; Todorovic, P.; Simunovic, K.; Miljojkovic, J.; Simunovic, G.; Budak, I.; Tadic, B. A novel method for determination of kinetic friction coefficient using inclined plane. Tehnicki Vjesnik—Tech. Gaz. 2021, 28, 447–455. [Google Scholar]
- Zhang, X.G.; Zhang, Y.L. Numerical investigation of sliding friction behaviour and mechanism of engineering surfaces. Ind. Lubr. Tribol. 2019, 71, 205–211. [Google Scholar] [CrossRef]
- Zhang, Z.G.; Zou, L.; Liu, H.; Chen, Y.L.; Zhang, B.Z. Simulation and modeling of dynamic friction coefficient of wet clutch during engagement. Int. J. Automot. Technol. 2022, 23, 125–134. [Google Scholar] [CrossRef]
- Kraus, M.; Lenzen, M.; Merklein, M. Contact pressure-dependent friction characterization by using a single sheet metal compression test. Wear 2021, 476, 203679. [Google Scholar] [CrossRef]
- Zhou, C.J.; Hu, B.; Qian, X.L.; Han, X. A novel prediction method for gear friction coefficients based on a computational inverse technique. Tribol. Int. 2018, 127, 200–208. [Google Scholar] [CrossRef]
- Ghatrehsamani, S.; Akbarzadeh, S.; Khonsari, M.M. Experimentally verified prediction of friction coefficient and wear rate during running-in dry contact. Tribol. Int. 2022, 170, 107508. [Google Scholar] [CrossRef]
- Li, G.A.; Hao, S.J.; Gao, W.L.; Lu, Z. The effect of applied load and rotation speed on wear characteristics of Al-Cu-Li alloy. J. Mater. Eng. Perform. 2022, 31, 5875–5885. [Google Scholar] [CrossRef]
- Pan, R.; Zhong, B.; Chen, D.J.; Wang, Z.Z.; Fan, J.W.; Zhang, C.Y.; Wei, S.N. Modification of tool influence function of bonnet polishing based on interfacial friction coefficient. Int. J. Mach. Tools Manuf. 2018, 124, 43–52. [Google Scholar] [CrossRef]
- Galda, L.; Sep, J.; Olszewski, A.; Zochowski, T. Experimental investigation into surface texture effect on journal bearings performance. Tribol. Int. 2019, 136, 372–384. [Google Scholar] [CrossRef]
- Xu, L.Q.; Lu, Y.H.; Liu, Q.R.; Lin, L.K.; Mu, J.H. Experimental study on frictional pairs of piston pumps. J. Fail. Anal. Prev. 2022, 22, 738–749. [Google Scholar] [CrossRef]
- Xia, J.S.; Zhao, J.; Dou, S.S. Friction characteristics analysis of symmetric aluminum alloy parts in warm forming process. Symmetry 2022, 14, 166. [Google Scholar] [CrossRef]
- Wang, W.R.; Zhao, Y.Z.; Wang, Z.M.; Hua, M.; Wei, X.C. A study on variable friction model in sheet metal forming with advanced high strength steels. Tribol. Int. 2016, 93, 17–28. [Google Scholar] [CrossRef]
- Pei, X.; Pu, W.; Zhang, Y.; Huang, L. Surface topography and friction coefficient evolution during sliding wear in a mixed lubricated rolling-sliding contact. Tribol. Int. 2019, 137, 303–312. [Google Scholar] [CrossRef]
- Liang, G.X.; Schmauder, S.; Lyu, M.; Schneider, Y.L.; Zhang, C.; Han, Y. An Investigation of the Influence of Initial Roughness on the Friction and Wear Behavior of Ground Surfaces. Materials 2018, 11, 237. [Google Scholar] [CrossRef] [PubMed] [Green Version]
- Dzierwa, A. Influence of surface preparation on surface topography and tribological behaviours. Arch. Civ. Mech. Eng. 2017, 17, 502–510. [Google Scholar] [CrossRef]
- Sedlaček, M.; Podgornik, B.; Vižintin, J. Influence of surface preparation on roughness parameters, friction and wear. Wear 2009, 266, 482–487. [Google Scholar] [CrossRef]
- Zhang, X.G.; Zhang, Y.L.; Wang, J.M.; Sheng, C.X.; Li, Z.X. Prediction of sliding friction coefficient based on a novel hybrid molecular-mechanical model. J. Nanosci. Nanotechnol. 2018, 18, 5551–5557. [Google Scholar] [CrossRef] [PubMed]
- Wang, Z.S.; Li, S.H.; Sun, J.; Wang, J.H.; Wang, Y.H.; Xia, Z.X.; Wei, C. Experimental study on the effect of load and rotation speed on dry sliding of silicon nitride. Ind. Lubr. Tribol. 2021, 73, 809–816. [Google Scholar] [CrossRef]


| Machining Method | ISO 25178 Standard Parameter | Region 1 | Region 2 | Region 3 | Mean | Deviation |
|---|---|---|---|---|---|---|
| Turning | Arithmetical mean height of surface (Sa/μm) | 1.69 | 1.60 | 1.63 | 1.64 | 0.046 |
| Root mean square height of surface (Sq/μm) | 2.06 | 1.94 | 1.97 | 1.99 | 0.062 | |
| Skewness of surface (Ssk) | −0.202 | −0.341 | −0.372 | −0.305 | 0.091 | |
| Kurtosis of surface (Sku) | 2.76 | 2.59 | 2.55 | 2.633 | 0.112 | |
| Milling | Sa/μm | 1.01 | 0.852 | 1.12 | 0.994 | 0.135 |
| Sq/μm | 1.23 | 1.02 | 1.30 | 1.183 | 0.146 | |
| Ssk | −0.577 | −0.299 | 0.134 | −0.247 | 0.358 | |
| Sku | 2.76 | 2.54 | 2.07 | 2.457 | 0.352 | |
| Grinding | Sa/μm | 0.468 | 0.380 | 0.393 | 0.414 | 0.048 |
| Sq/μm | 0.602 | 0.482 | 0.496 | 0.527 | 0.066 | |
| Ssk | −0.346 | 0.501 | −0.027 | 0.043 | 0.428 | |
| Sku | 5.18 | 37.9 | 3.23 | 15.437 | 19.478 |
| Machining Method | Region 1 | Region 2 | Region 3 | Mean Value of Surface Roughness Ra (μm) | Deviation of Surface Roughness Ra (μm) |
|---|---|---|---|---|---|
| Turning | 1.24 | 1.08 | 0.861 | 1.010 | 0.173 |
| 1.22 | 1.06 | 0.617 | |||
| 1.01 | 1.03 | 0.898 | |||
| 1.18 | 0.73 | 1.04 | |||
| 1.14 | 0.905 | 1.05 | |||
| 1.21 | 0.832 | 1.07 | |||
| Milling | 1.08 | 0.665 | 0.948 | 0.781 | 0.241 |
| 0.87 | 0.867 | 1.24 | |||
| 0.5 | 0.981 | 0.872 | |||
| 0.854 | 0.451 | 0.85 | |||
| 0.850 | 0.456 | 0.757 | |||
| 0.89 | 0.288 | 0.631 | |||
| Grinding | 0.331 | 0.218 | 0.174 | 0.245 | 0.068 |
| 0.347 | 0.181 | 0.175 | |||
| 0.326 | 0.228 | 0.202 | |||
| 0.326 | 0.223 | 0.192 | |||
| 0.325 | 0.206 | 0.186 | |||
| 0.359 | 0.231 | 0.182 |
| Normal Load (N) | Rotation Speed (n/rpm) |
|---|---|
| 2 | 20 |
| 3 | 24 |
| 4 | 28 |
| 6 | 36 |
| 7 | 40 |
| 8 | 44 |
| 9 | 48 |
Publisher’s Note: MDPI stays neutral with regard to jurisdictional claims in published maps and institutional affiliations. |
© 2022 by the authors. Licensee MDPI, Basel, Switzerland. This article is an open access article distributed under the terms and conditions of the Creative Commons Attribution (CC BY) license (https://creativecommons.org/licenses/by/4.0/).
Share and Cite
Wen, Q.; Liu, M.; Zhang, Z.; Sun, Y. Experimental Investigation into the Friction Coefficient of Ball-on-Disc in Dry Sliding Contact Considering the Effects of Surface Roughness, Low Rotation Speed, and Light Normal Load. Lubricants 2022, 10, 256. https://0-doi-org.brum.beds.ac.uk/10.3390/lubricants10100256
Wen Q, Liu M, Zhang Z, Sun Y. Experimental Investigation into the Friction Coefficient of Ball-on-Disc in Dry Sliding Contact Considering the Effects of Surface Roughness, Low Rotation Speed, and Light Normal Load. Lubricants. 2022; 10(10):256. https://0-doi-org.brum.beds.ac.uk/10.3390/lubricants10100256
Chicago/Turabian StyleWen, Qi, Mingming Liu, Zenglei Zhang, and Yunyun Sun. 2022. "Experimental Investigation into the Friction Coefficient of Ball-on-Disc in Dry Sliding Contact Considering the Effects of Surface Roughness, Low Rotation Speed, and Light Normal Load" Lubricants 10, no. 10: 256. https://0-doi-org.brum.beds.ac.uk/10.3390/lubricants10100256