1. Introduction
In times of a continuously increasing population and energy demand as well as more environmental consciousness (global warming), new approaches to reduce energy consumption, thus increasing sustainability, have become more important than ever before. In this regard, tribology, which includes friction, wear, and lubrication, plays an important role since this topic is directly connected to transportation and industrial processes. Considering the automotive industry, recent studies have demonstrated that about 30% of the entire fuel energy is wasted to overcome friction and wear [
1,
2]. Similar values have been extrapolated in other industrial branches such as the mining and paper industry [
3,
4]. These numbers reflect the tremendous potential in terms of energy and sustainability by reducing tribology-related losses [
5].
There are several ways to efficiently reduce friction and wear. The easiest solution is to use oil between both rubbing surfaces, thus separating them and changing the friction mode from dry to lubricated friction. This approach becomes further complicated due to legal restrictions related to the use of certain elements (Zn, P, S among others), which are commonly used in base oils as lubricant additives [
6]. Another way to lower friction and wear is to deposit a coating on one or both rubbing surfaces. This coating has a low shear strength thus reducing the resulting friction force. However, the applicability of this approach largely depends on the geometry of the tribological contact as well as on the material pairing [
7].
Over the last decade, considerable effort has been put in the usage of nanoparticles to reduce friction and wear. They can be used as solid lubricants, lubricant additives and reinforcement phases in composite materials thus contributing in different ways to improved tribological characteristics [
8,
9,
10]. Especially, the use of carbon-based nanoparticles such as graphene and its derivatives as well as carbon nanotubes, carbon onions among others have gained notable attention in the tribological community due to promising results obtained regarding friction and wear reduction [
11,
12]. Irrespective of being used as a solid lubricant, additive, or reinforcement phase, it is of utmost importance to explore the underlying friction and wear mechanisms responsible for the observed improvements. Hence, a detailed chemical, morphological and microstructural characterization of the tribological interfaces and nanoparticles prior to and after the tribological experiment is essential. In this context, tribological experiments can be considered fairly complicated since the energy-dissipating processes occur in the tribological interface, which is normally not accessible with any further characterization technique. Additionally, both rubbing surfaces have a stochastic surface roughness, which establishes the tribological contact at distinct surface asperities [
13]. Typical length scales involved in this asperity–asperity contact are on the order of nanometers or even sub-nanometers. This, in turn, induces high local contact pressures on the order of
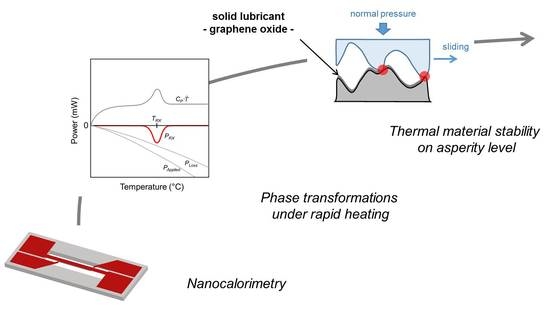
GPa. Moreover, tribological processes always involve a certain relative motion of both rubbing surfaces with respect to each other leading to highly dynamic processes. The relative motion of both contacting surfaces in combination with the high contact pressures creates high interfacial temperatures on the asperity level. Depending on the relative velocity of the counter bodies with respect to each other, the material is heated up with high rates of up to several tens of thousands °C/s. The combination of high contact pressures, small contact areas, relative sliding motion and rapid heating up of both the counter bodies on the asperity level defines the material properties which are required at the contacting interface.
Structural and chemical material alterations during service are of utmost interest because they substantially affect friction for a given tribo-system in early as well as late stages. Examples under dry sliding conditions encompass deformation layer formation and grain growth in metals [
14,
15] and non-equilibrium mixing instabilities in alloys [
16]. Considering lubricated conditions, analogical transformations can be anticipated in the sliding contact area crucially affecting the frictional behavior. Hence, improving the frictional performance of additives (e.g., solid lubricants) in the contact zone requires the exploration of the latter transformations. These are primarily induced by the combination of mechanical deformation with high contact pressures and rapid heating up to elevated temperatures.
As mentioned earlier, the usage of solid lubricants is an emerging approach to tailor friction. An important group of carbon-based solid lubricants is graphene, graphene oxide (GO), and their derivatives, which started to play an increasing role. In this study, we chose GO as a commonly used model solid lubricant. The thermal stability of solid lubricants is an important property, i.e., when analyzing their ability to improve the frictional performance over time. GO’s thermal stability is also crucial for the synthesis of graphene via so-called thermal exfoliation. As a consequence, studies can be found in the literature for slow and fast heating of GO (see e.g., [
17,
18]). During thermal exfoliation, GO layers undergo temperature-induced reactions generating sheets of reduced GO (rGO) and eventually graphene. Hence, when utilized as a solid lubricant, GO might also undergo thermally induced chemical and structural changes during rubbing. However, studies employing methods that are capable to mimic the thermal stimulus on the asperity level with the appropriate size and time scale are lacking.
We propose chip- or nanocalorimetry (NC) to explore these thermally-induced changes. Generally, NC is designed for the thermal characterization of transformations and reactions in small-scale materials, such as thin films (μm-scale) or nanoparticles. Since sample masses are in the order of tens of nano-grams, high heating rates of up to 1,000,000 °C/s are possible in NC experiments. Typical temperatures during an NC experiment achieve values up to 1000 °C. Hence, NC is a rapid method for thermal characterization of small quantities, e.g., the quantification of heat capacities or heat of reactions. To achieve maximal sensitivity for monitoring released or consumed heat, NC utilizes micro-fabricated chips, in which tens or hundreds of nano-meter thick insulating membrane carries heating and sensing structures as well as the sample. These chips are capable of measuring heat capacities and heat of reactions with a resolution better than 1 nJ/K and 1 µJ, respectively. To perform experiments with maximal resolution, differential NC set-ups have been developed in which an NC sensor with a sample is differentially measured against an empty reference sensor. For comprehensive overviews, the reader is referred to the latest review articles [
19,
20] and books [
21].
In this article, we will introduce the NC technique with a special emphasis on quasi-adiabatic calorimetry, which is relevant for research work conducted. Afterwards, we will present an initial NC study for GO to demonstrate its general suitability and potential to characterize the response of carbon-based nanoparticles to a given temperature stimulus, which may be connected to the thermal situation occurring in tribo-contacts in a future scene. As an outlook, we emphasize the potential of NC coupled with advanced material characterization in the field of tribology, particularly solid lubricants, based upon the results presented.
2. Materials and Methods
To change the amount of oxygen functional groups and the C/O ratio of the nanoparticles, graphene oxide with low (denoted as GO-LO) and high oxidation degree (denoted as GO-HO) has been synthesized. Following the Hummers’ approach [
22], graphite as a raw material has been oxidized using KMnO
4 and NaNO
3 in concentrated sulfuric acid. To change the oxidation degree, the graphite/KMnO
4 mass ratio has been changed, followed by an annealing of the GO solution at 50 and 95 °C for 30 min.
The present study explores GO in isochronal experiments. The sample temperature is rapidly increased up to a target temperature of 650 °C with a heating rate of about 1000 °C/s. The choice of the target temperature of 650 °C bases upon data from the literature, which let expect a reaction runaway of GO upon rapid heating. Literature reports ignition between 200 and 300 °C (see Discussion Section and the references therein). In order to track the full reaction runaway, we decided to measure up to significantly higher temperatures than the ignition temperature. Preliminary tests showed us that 650 °C was a reasonable target temperature in order to follow the main transformations.
Since the masses (heat capacities) of membrane, heater, and sample are small, samples can be heated with rates of up to 10
6 °C/s [
23]. Most nanocalorimeters use resistance heating elements to heat the sample. Depending on the chip design, temperature sensing during the experiment occurs either via the temperature dependence of the heater resistance or via separate thermopiles. This concept allows performing non-adiabatic and quasi-adiabatic calorimetric measurements. Here, we used a typical setup for quasi-adiabatic NC with chips based upon the design of Allen and co-workers [
24,
25], which is schematically depicted in
Figure 1a. The chip was a 0.5 × 1.4 cm
2 silicon frame carrying a 50-nm-thick, 0.5-mm-wide Pt heater strip on a 300-nm-thick SiN
x-membrane. Two voltage probes contacted the heater strip with a spacing of 3.7 mm. The section of the heater between the voltage probes was the region of interest (“measurement area”). The temperature was recorded during an experiment enabling us to detect sample changes. The sample (in this study graphene oxide (GO)) was typically deposited onto the downside of the SiN
x directly below the heater in the “measurement area”, see
Figure 1a. The positioning of the sample is a crucial step for the experiments to ensure optimal thermal contact. In the present study, we poured a given amount of GO on the downside of the sensor in the measurement area and aligned the powder appropriately underneath the heater (see
Figure 1a).
Figure 1b shows the circuit, which controlled the nanocalorimeter sensor. A current pulse
I from a source measuring unit (SMU) resistively heated the Pt-strip, and therefore, indirectly the sample.
I was measured and recorded via a shunt. The voltage drop Δ
Vchip =
V+chip −
V−chip between the voltage probes was used for (1) temperature measurement and (2) calculation of the applied power
PApplied during the experiment. Knowing the resistance–temperature relationship
R(
T) of the Pt-strip, which was carefully calibrated for every chip prior to the experiment, the temperature
T of the sensor could be calculated via
where
R(
T) = Δ
Vchip/
I.
PApplied could be calculated according to
PApplied was the first contribution to the full thermal description of the nanocalorimeter chip, which is given in Equation (2).
Equation (2) allowed to quantify thermodynamic data, such as the heat of reaction
PRX or the sample´s heat capacity
Cp.
PLoss denotes the heat losses and
is the heating rate.
PLoss arises from conduction, radiation and convection (in the case of non-vacuum measurements) and is a function of temperature, but not rate. Equation (2) describes the response of the sample in terms of
Cp and
(left-hand side of Equation (2)) when the applied power, heat losses, and reaction power (right hand side of Equation (2)) change.
Figure 2 schematically shows this balance as a function of temperature for a NC measurement with an exothermic reaction/transformation at the temperature
TRX.
3. Results
As outlined in the introduction, NC is suggested to provide a more detailed insight into the temperature effects on material properties where high temperatures and high heating rates affect the initial material characteristics. NC enables us to heat up small volumes of material typically up to about 1000 °C with heating rates of up to 106 °C/s. To our best knowledge, NC studies on 2-D nanomaterials, such as graphene or graphene oxide, have not been presented yet.
Figure 3 shows light microscopy images prior to and after the experiment. The comparison reveals a substantial redistribution of the GO powder. Whereas the GO was initially aligned under the Pt-heater (see
Figure 3a), the powder is randomly scattered after the experiment (see
Figure 3b) indicating a combustion or runaway reaction. Therefore, we assume that, once ignited, the reaction can no longer be interrupted and becomes self-sustaining.
Figure 4a shows a temperature-vs.-time plot where GO with different oxidation degrees (GO-LO and GO-HO) is heated up to about 650 °C with a heating rate of ≈1000 °C/s. The external temperature pulse is approximated by the dotted line in
Figure 4a. Independent of the C/O ratio, both graphene oxides undergo an exothermic reaction at about 317 °C. The samples release heat, which causes an additional temperature rise. During the reaction, the sample heats temporally up to about 700 °C, which is above the target temperature of 650 °C.
A closer look in
Figure 4a reveals additional pre- and post-ignition reactions below and above 317 °C, respectively. The pre-ignition reactions are indicated by the small deviations from the baseline. To better analyze the transformations, we develop the apparent-
Cp-vs.-temperature plot given in
Figure 4b. The apparent
Cp is calculated using Equation (2). Since the heat losses are not known for the present study, the
Cp data include the response from the sample, as well as that from the sensor, and
Cp becomes therefore apparent. Nonetheless, the apparent-
Cp-vs.-temperature plot allows for better visualization of the pre-ignition reactions below 317 °C.
Figure 4b reveals significant differences in the signal for GO-HO and GO-LO, respectively (the dotted line is a guide to the eyes and serves as the baseline for the apparent
Cp evolution without low-temperature reactions). GO-LO exhibits one large exotherm at 75 °C with a shoulder at around 110 °C and one exothermic reaction at around 250 °C. In contrast, GO-HO shows three distinct exothermic reactions between 80 and 125 °C. No further reactions are detectable up to ignition at 317 °C.
Figure 4b additionally reveals differences in the ignition and runaway behavior for temperatures >317 °C. Whereas GO-LO exhibits a spontaneous, abrupt runaway at 317 °C, GO-HO shows a more gradual transition to the self-propagating reaction. At 450 °C (GO-LO) and 475 °C (GO-HO), the reaction retards before it runs off again.
Figure 4a shows the retardation as a step whereas apparent
Cp (see
Figure 4b) exhibits a strong peak in the endothermic direction at the respective temperatures.
4. Discussion
Although experimental studies under uncontrolled heating with rates up to several thousand °C/s have been reported to demonstrate the self-propagating reaction (see, e.g., hot plate or soldering iron tests in [
26]), GO has never been thermally analyzed and characterized under controlled heating with rates greater than 33.3 °C/s (the maximum we found in [
27]). Our 1000-°C/s-NC experiments revealed (1) low-temperature reactions, which depend on the preparation conditions (degree of oxidation) and (2) a reaction runaway at about 317 °C, which is independent of the degree of oxidation (C/O ratio). Lipatov et al. explored the low-temperature reduction of GO and found in temperature-programmed desorption measurements that in the temperature range between 90 and 165 °C mainly H
2O, CO, and CO
2 are desorbed [
28]. A similar temperature range for the desorption of intercalated species had already been earlier confirmed by Eigler et al. [
29,
30]. Hence, we suggest that the exothermic reactions below 250 °C in
Figure 4b may indicate desorption of intercalated species from the GO layers such an H
2O and/or OH
− groups and subsequent formation of CO or CO
2. A potential effect of the oxidation degree and types of oxygen-bearing functional groups cannot be conclusively explained solely based upon NC experiments.
A self-sustaining reaction has already been documented for GO [
26,
27,
31,
32,
33,
34]. For instance, Krishnan et al. demonstrated the energetic nature of GO by hot-plate ignition experiments at 300 °C. During heating, they observed the release of water at low temperatures. At elevated temperatures close to 300 °C, the GO sample exhibited a runaway reaction with remaining scattered reduced GO (please refer to
Figure 2 in [
26]). Although being uncontrolled heating experiments, the sequence of reactions in the hot-plate experiment, thus, qualitatively corroborates our findings. However, a quantitative investigation is lacking. We have not found studies performing a thermal analysis of the runaway reaction of GO under appropriate heating rates larger than several thousand °C/s (maximal heating rate 33.3 °C/s [
27]). Hence, the presented 1000-°C/s-study presents for the first time a thermal analysis under these conditions. The ignition temperature in the presented study is about 317 °C at a heating rate of 1000 °C/s and matches that found for GO on the hot plate. Qiu studied the energetic behavior of GO in a heating rate range up to 27 °C/s [
27]. For 2 °C/s, they observed in a DSC experiment a runaway at around 200 °C. Moreover, they verified that the ignition temperature depends on the applied heating rate. Qiu et al. also performed a kinetic DSC study to determine the activation energy for the thermal decomposition of GO [
32]. In the heating rate range up to 0.16 °C/s, they calculated activation energy of 142 kJ/mol. Using their kinetic data, we can use Kissinger’s equation to estimate a potential ignition temperature at 1000 °C/s. The calculation reveals 350 °C, which is in reasonable agreement with our measured ignition temperature of 317 °C (noting that we extrapolate for the heating rate over nearly four orders of magnitude). Therefore, we conclude that the measured temperature for thermal decomposition/reaction runaway represents a reasonable value. Due to the high exothermicity of the runaway, the sample rapidly self-heats up to temperature above 500 °C. According to [
18], reactions of elemental C and O
2 can occur under experiments in air. Hence, we cannot exclude the reaction to CO
2 (at least partially) at higher temperatures. The small step in the temperature-vs.-time plot around 450 °C (
Figure 4a) and the corresponding peak in the apparent
Cp (
Figure 4b) signal for both the samples may be an indicator of that.
5. Conclusions and Outlook
In order to optimize the friction and wear response of a tribo-system, it is of utmost importance to know the dynamic material’s properties and behavior under certain conditions such as high pressures and temperatures, since both can lead to chemical, morphological and microstructural changes. This, in turn, can significantly alter the material’s behavior, and therefore, the friction and wear properties. The involved contact pressures and sliding velocities can lead to rather high local temperatures (on the asperity level), which go hand in hand with high heating and cooling rates. In this perspective, we propose nanocalorimetry as a method to quantitatively explore the thermally-induced material evolution, which has the overall potential to be correlated with processes going on in a tribological contact on the asperity level. We rationalize the choice of nanocalorimetry by the ability to perform systematic experiments under the relevant heating rates, temperatures, and length scales.
In order to present the potential of this technique, we have performed 1000-°C/s-experiments on graphene oxide with a low and high degree of oxidation, i.e., different C/O ratios, which is commonly used as a solid lubricant. Between 75 and 125 °C, nanocalorimetry revealed the release of several exothermic reactions, which correspond to the release of intercalated species. In this regard, the thermal response precisely depends on the degree of oxidation of the sample. Further heating induces an exothermic runaway reaction at 317 °C independent of the degree of oxidation. The runaway reaction subsequently increases the sample’s temperature temporally up to about 700 °C, for which CO2 may have been formed.
In order to shed more light on the involved sequence of reactions, to identify the species involved or to gain more structural information during heating, deeper insight from experiments employing complementary methods in the considered temperature range is required. Examples encompass thermo-Raman spectroscopy or temperature programmed deposition coupled with mass-spectroscopy [
8], which will be addressed in follow-up studies based upon this initial work.
Generally speaking, tribological experiments gain coupled insight into the material’s evolution induced by the mechanical and temperature stimulus and, mostly, the question towards the dominating driver cannot be answered. Hence, it is of prime interest to perform experiments for which mechanical and thermal effects are decoupled. Based on the findings of the present study, we think that nanocalorimetry may be the method of choice to provide decoupled information on the thermal response of materials in tribo-contacts, such as solid lubricants. For instance, NC can be used to mimic the temperature history in conjunction with separate numerical efforts and/or further advanced materials characterization to study thermal influences on the material on the asperity level. Integrating decoupled experiments into tribological studies is considered to be an innovative way to provide additional data for effective tailoring of materials in tribo-contacts.


