Energy Efficiency, Emissions, Tribological Challenges and Fluid Requirements of Electrified Passenger Car Vehicles


School of Engineering, University of Central Lancashire, Preston PR1 2HE, UK
Lubricants 2021, 9(7), 66; https://0-doi-org.brum.beds.ac.uk/10.3390/lubricants9070066
Submission received: 24 May 2021
/
Revised: 15 June 2021
/
Accepted: 18 June 2021
/
Published: 22 June 2021
(This article belongs to the Special Issue Tribology in Mobility)
Abstract
:The motivations for the move to electrified vehicles are discussed with reference to their improved energy efficiency, their potential for lower CO2 emissions (if the electricity system is decarbonized), their lower (or zero) NOx/particulate matter (PM) tailpipe emissions, and the lower overall costs for owners. Some of the assumptions made in life-cycle CO2 emissions calculations are discussed and the effect of these assumptions on the CO2 benefits of electric vehicles are made clear. A number of new tribological challenges have emerged, particularly for hybrid vehicles that have both a conventional internal combustion engine and a battery, such as the need to protect against the much greater number of stop-starts that the engine will have during its lifetime. In addition, new lubricants are required for electric vehicle transmissions systems. Although full battery electric vehicles (BEVs) will not require engine oils (as there is no engine), they will require a system to cool the batteries—alternative cooling systems are discussed, and where these are fluid-based, the specific fluid requirements are outlined.
1. Introduction
Many countries around the world have signed up to the legally binding international treaty on climate change agreed at COP 21 in Paris 2015 [1]. The goal of the treaty (an agreement within the United Nations Framework Convention on Climate Change (UNFCCC)), which entered into force in November 2016, is to limit global warming to well below 2 °C, and preferably to 1.5 °C, compared to pre-industrial levels. Each signatory to the agreement develops increasingly ambitious 5-year plans for climate action, known as Nationally Defined Contributions (NDCs). Since passenger cars in developed countries account for approximately 10–20% of global CO2 emissions [2,3,4,5], and since the sector is relatively easier to decarbonize than others (such as shipping and aviation), it has been a key focus of many countries in their early plans to reduce their CO2 emissions. Initially, different regions, such as Europe, Japan, and China have introduced tough fuel consumption targets for passenger car vehicle fleets. Up until around 2021, most of these targets can and have been met by original equipment manufacturers (OEMs) developing more efficient conventional gasoline and diesel engines, with a small number of electric vehicles (either full battery electric vehicles (BEVs), plug-in hybrid electric vehicles (PHEVs) or mild hybrid electric vehicles (MHEVs)). Mild hybrid cars are those which have a relatively small battery that is charged up by the internal combustion engine, such as the original Toyota Prius. However, future anticipated fuel consumption targets for Europe (for 2025) and China will not be met without significant electrification of the passenger car fleet.
In addition to CO2 targets, local air pollution is also an issue in some countries and cities, and in such locations, electric vehicles are being favoured due to the lower tailpipe emissions of NOx and particulate matter. In some cities, older conventional vehicles that do not meet current emissions standards have either been banned entirely or face significant costs to enter parts of the city (for example, in Central London, at the time of writing, a daily charge of GBP 12.50 is payable by drivers of passenger cars, unless their vehicles meet Ultra Low Emission Zone standards—and this is in addition to a daily “congestion” charge that is in operation from 0700–2200. Drivers of electric vehicles would generally not need to pay the emissions charge [6]).
This paper discusses in some detail (1) the energy efficiency benefit of electric vehicles, (2) the potential CO2 benefits of electric vehicles, and how these benefits are calculated using life cycle analysis (3) the lower tailpipe emissions of electric vehicles, (4) the various tribological challenges that will need to be overcome regarding electrified vehicles (particularly hybrid electric vehicles, in which there is both a conventional engine and a battery), and finally (5) the different fluid requirements of such vehicles are outlined.
2. The Motivations for Electrification of the Passenger Car Fleet
The main motivations for electrifying the passenger car fleet are (1) much improved energy efficiency, (2) the potential for lower CO2 emissions (provided the electricity system is sufficiently decarbonized), (3) reduced or zero particulate matter (PM) and NOx emissions (zero emissions if it is a BEV, and potentially reduced emissions if it is a PHEV, depending on how much the engine in the hybrid vehicle is used), (4) the potential for lower total cost of ownership, and (5) the rapid recent improvements in battery technology. These different motivations are discussed in more detail below:
2.1. Energy Efficiency
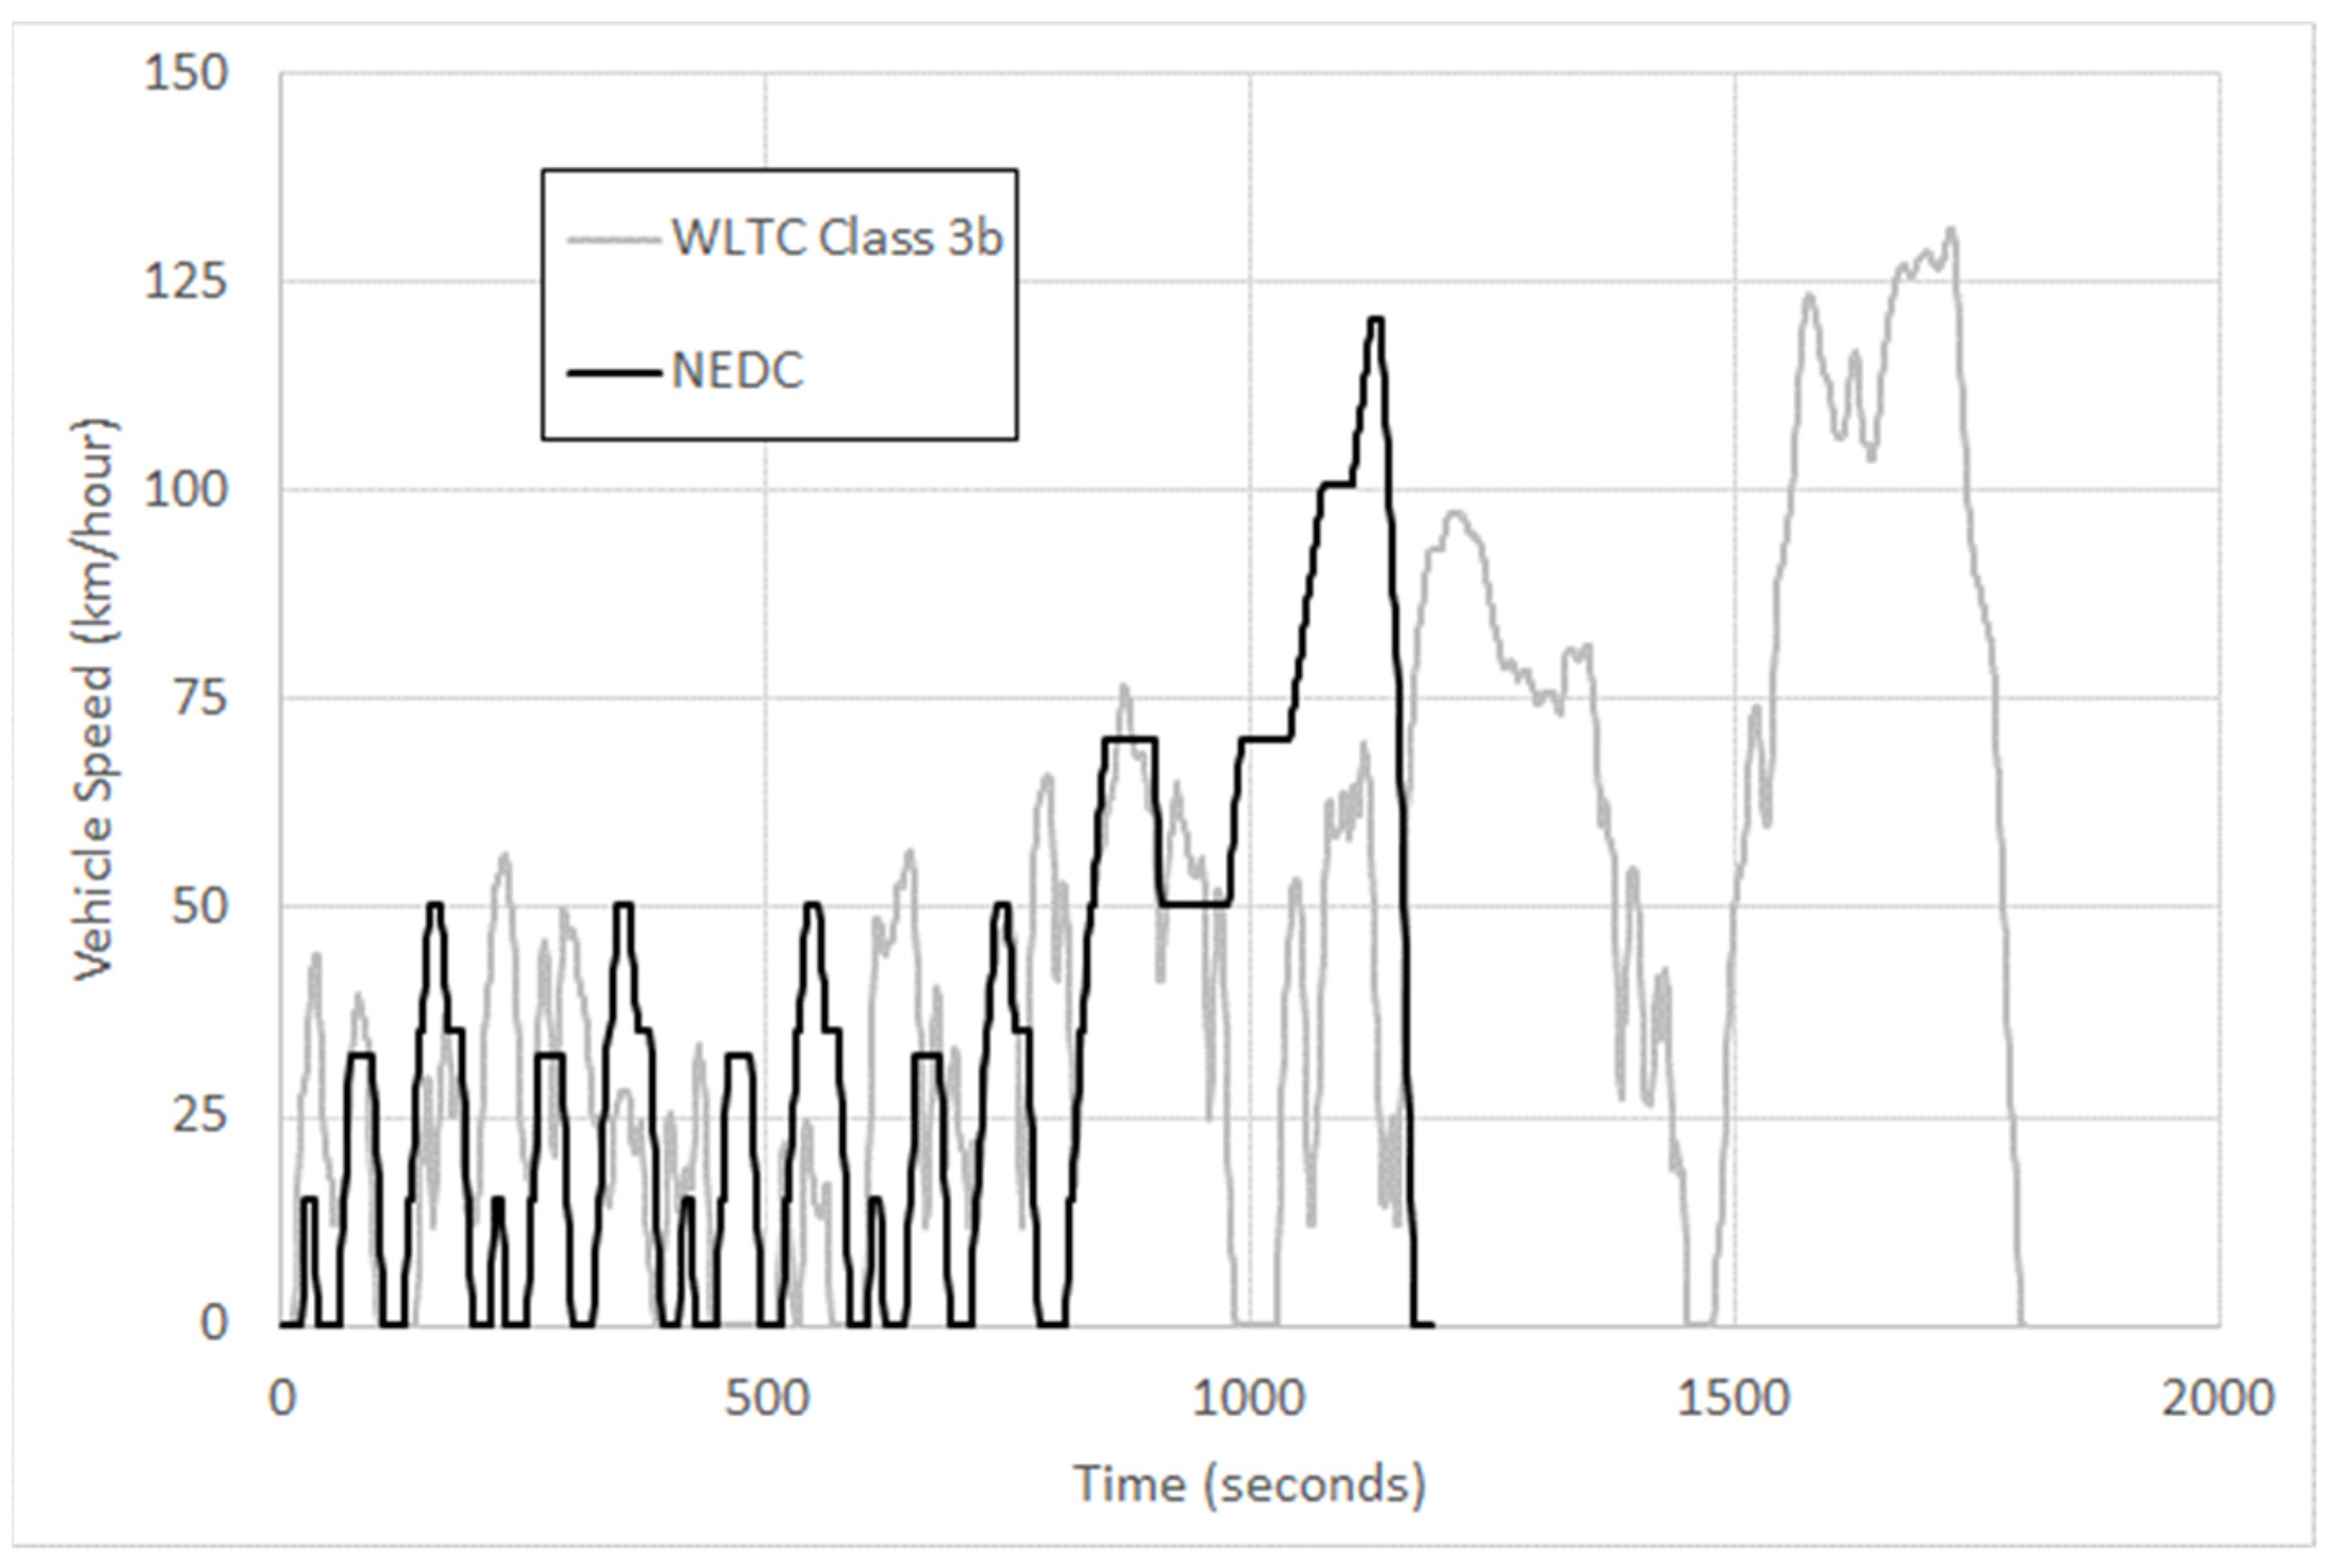
OEMs that manufacture and sell electric vehicles are required to give information on how much energy is needed for the vehicle to travel 100 km. These energy efficiency figures will have been obtained on standardized driving cycles, such as the older NEDC driving cycle used in Europe until 2017, or the more recent WLTC driving cycle or their US equivalents. Figure 1 shows the vehicle speed versus time profile of some typical European standard driving cycles. Based on these driving cycles, electric vehicle manufacturers report energy efficiency figures of between 15 and 25 kWh of energy to travel 100 km (with heavier vehicles requiring more energy to travel 100 km) [7,8]. This can be contrasted with a fuel-efficient passenger car that is powered by a gasoline engine. For the sake of argument, assume the gasoline car has a fuel consumption of 6 L/100 km (which is the equivalent to about 47 miles per (imperial) gallon). The energy content of 1 litre of gasoline is approximately 34 MJ [9], and so the energy needed for the car to travel 100 km is about 204 MJ, which is about 57 kWh. Therefore, a BEV is typically between 2 and 3 times more energy efficient than a conventional gasoline car. (In fact, since most gasoline cars on the road are likely to have significantly higher fuel consumption (i.e., higher than 6 L/100 km), BEVs could be even more energy efficient than this simple estimate suggests).
Just for clarification, it should be noted that vehicles with the same mass, driven on the same driving cycle, will have exactly the same power requirements at the wheel, irrespective of whether the car is electric or driven by a conventional gasoline engine. The only difference between an electric vehicle and a conventional gasoline vehicle is the amount of useful power that gets to the wheels from the propulsion unit (the engine or battery). In the case of an electric vehicle, approximately 70–80% of the power in the battery is available at the wheels, compared to a conventional gasoline engine, in which only 10–20% of the power contained in the gasoline gets to the wheels [10] (for a typical driving cycle, such as the New European Driving Cycle (NEDC), the average power required at the wheels, assuming a car mass of 1200 kg, is only about 4 kW). The NEDC cycle has a duration of approximately 20 min, and the distance travelled is 10.93 km. If it is assumed that the battery uses 15 kWh for 100 km of travel, and that 80% of this energy gets to the wheels, then for a distance of 10.93 km, the energy at the wheels is about 1.3 kWh, and if we divide this by 1/3 h (the duration of the driving cycle), the average power at the wheels is 3.9 kW. For a gasoline engine, the energy required from the fuel to travel 10.93 km is approximately 6.2 kWh, but only 20% of this gets to the wheels [8], about 1.24 kWh, which gives an average power at the wheels, of 3.72 kW, in reasonable agreement with the calculation for the electric vehicle.
2.2. The Potential for Lower CO2 Emissions
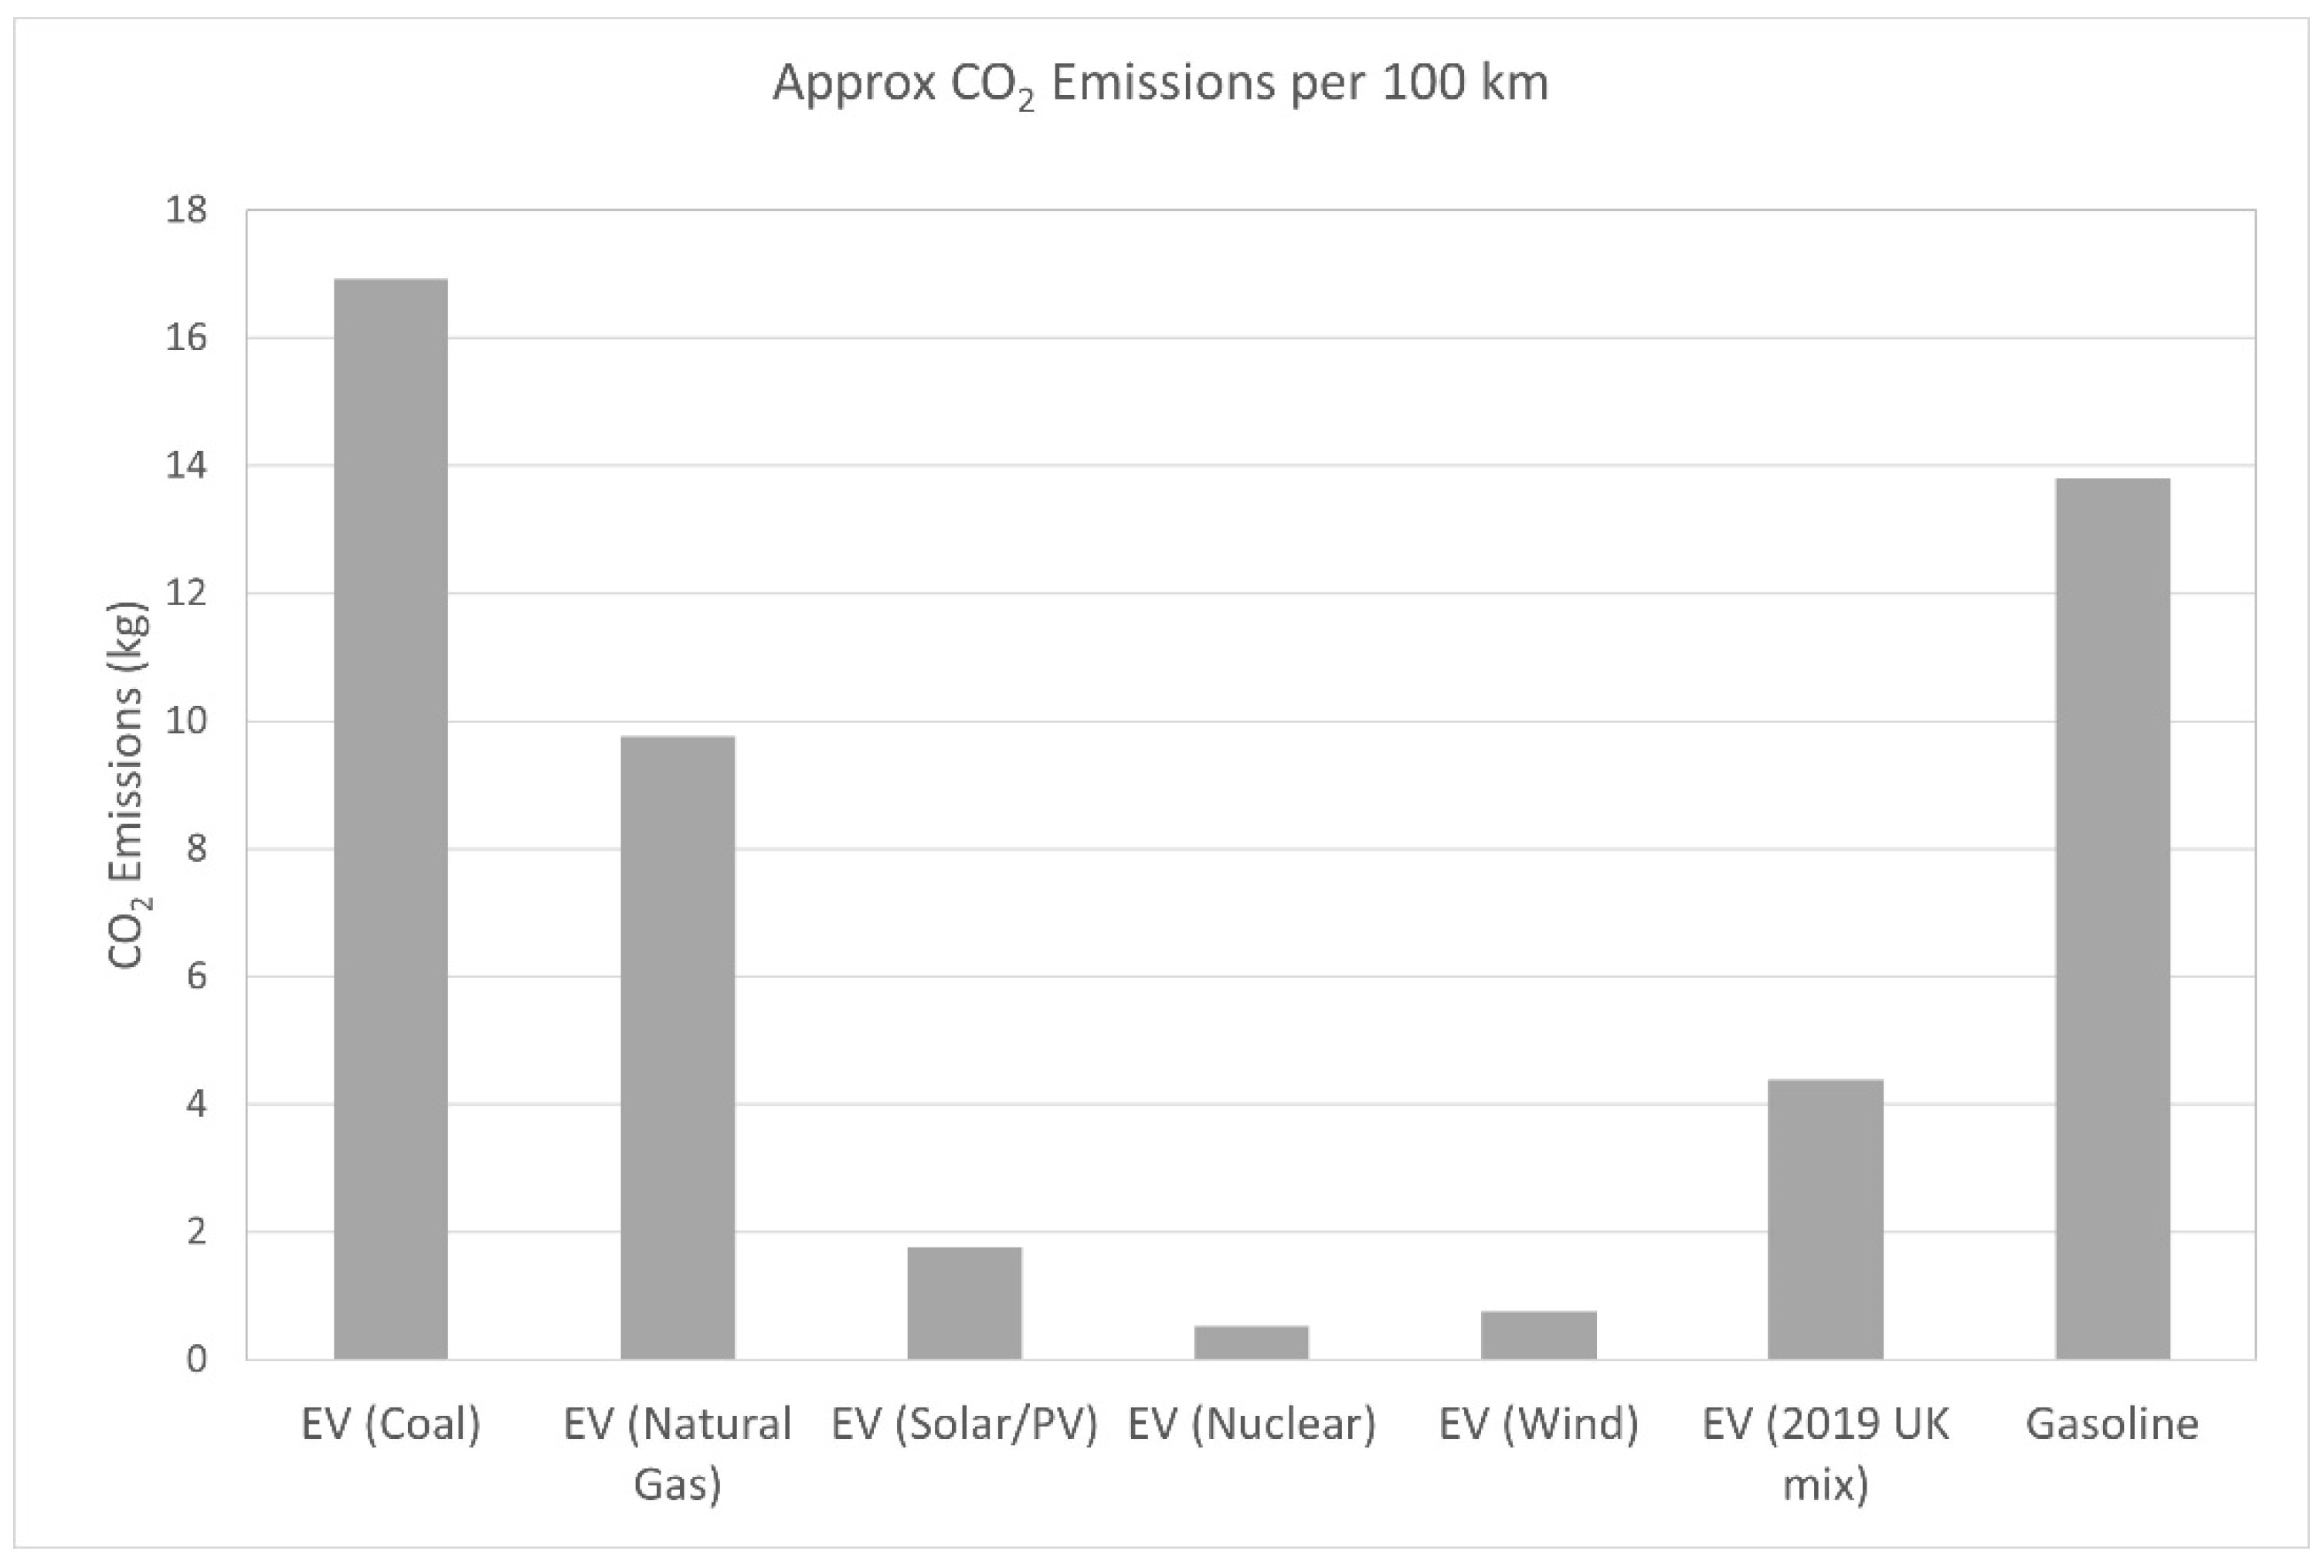
BEVs clearly have no local CO2 emissions, but CO2 will be emitted at the power station that generates the electricity. In addition, CO2 emissions generated during vehicle manufacturing should also be accounted for. Useful data on the CO2 content of different fuels used to generate electricity are found in reference [11]. Figure 2 shows the estimated CO2 emissions from BEVs running on electricity from different types of fuel, using the data of [11], and compares them to a gasoline vehicle (in this case, the gasoline vehicle was assumed to have a fuel consumption of 6 L/100 km). Figure 2 shows that if electricity is generated from coal, the “in use” CO2 emissions are actually higher than those from a gasoline car. On the other hand, if electricity is generated from natural gas, or even better, solar, wind or nuclear energy, significant reductions in CO2 emissions are potentially achievable.
The CO2 emissions of the various types of fuel used to generate electricity, as reported in [11], are summarized in Table 1.
A more detailed, total life cycle calculation of CO2 emissions that compares electric and conventional cars needs to account for the greater CO2 emissions involved in the manufacture of electric vehicles, and also needs to make assumptions about the lifetime mileage of such vehicles, and what happens to the batteries at the end of vehicle life. This is discussed in more detail in Section 3.
2.3. Reduced Particulate Matter (PM) and NOx Emissions
Although CO2 emissions are of global concern, at a local level, air pollution can be a significant issue. Conventional cars, particularly those containing diesel engines, can emit high levels of both particulate matter (PM) and various oxides of nitrogen (generally referred to as NOx). Although different regions around the world have limits on these tailpipe emissions, it has recently transpired that some manufacturers designed their emission control systems so that vehicles would meet the legislated limits on the official test cycles, but that the emissions could be significantly higher in real world driving situations. This has led to a number of cities (particularly in Europe) imposing bans on older vehicles (with higher emissions) and/or the payment of fees to enter certain regions. Clearly, BEVs will emit no PM or NOx, and so should help to improve local air quality. PHEVs will emit no PM or NOx when the car is driving in electric-only mode, but will emit these pollutants when it is driving using the conventional engine, and so the emissions of PHEVs will depend on how much of the time the car drives in electric only-mode compared to driving using the engine.
2.4. The Potential for Lower Total Cost of Ownership
BEVs generally have fewer parts than those of conventional cars and need less servicing—no oil/oil filter changes are needed, for example. Clearly, tyres, brakes, and transmissions still need servicing, but in general, servicing costs would be expected to be lower than those for conventional vehicles.
In addition, at the time of writing, electricity costs are substantially cheaper compared to the cost of gasoline or diesel (particularly in Europe, where fuels are heavily taxed). Returning to the example of a conventional car travelling 100 km, where it was assumed that the conventional car had a fuel consumption of 6 L/100 km. At the time of writing, the cost of the fuel needed for this 100 km journey would be approximately GBP 7.20 (assuming a gasoline cost of GBP 1.20 per litre). On the other hand, using a typical UK electricity price (GBP 0.18 per kWh), the cost of the journey (using an average energy consumption of 20 kWh per 100 km) would be just GBP 3.60, roughly half the cost. In fact, if the electric vehicle is charged up at home via solar panels, or using cheaper overnight electricity tariffs, the cost savings could be even higher. Clearly, if the majority of the car fleet becomes electrified, governments may, in the future, have to introduce a car mileage tax to recover lost tax revenues (from lower fuel duties). Although this calculation has been performed using UK figures, studies from other countries (such as the USA) have also calculated a lower total cost of ownership (despite the fact fuel is taxed at a much lower rate in the USA) [13].
Even though, at the time of writing, electric vehicles are more expensive to purchase than conventional vehicles, the total cost of ownership over the lifetime of the vehicle can be lower for electric vehicles, provided the vehicle mileage is sufficiently high (>100,000 miles) to offset the higher purchase cost of the vehicle. It is anticipated that electric vehicles will become cheaper to manufacture than conventional vehicles in the 2025–2030 timeframe [14].
2.5. Rapid Improvements in Battery Technology
In the last 10–20 years, battery technology has improved by such an extent that the cost of battery electric vehicles is now rapidly approaching that of conventional vehicles that use an internal combustion engine. For example, in 2010, a lithium-ion battery pack cost approximately USD 1200 per kWh, whereas, in 2020, the cost was around USD 156 per kWh. Given a 60 kWh battery in an electric vehicle, the cost of the battery pack would have been USD 72,000 in 2010, compared to USD 9400 today. Bloomberg have forecast battery pack prices of USD 100 per kWh in 2024 and USD 60 per kWh in 2030 [15]. Similarly, the energy density of lithium-ion batteries has also improved substantially. In 1990, energy densities were approximately 90 Wh/kg, and these improved to 150 Wh/kg in 2000 and 250 Wh/kg in 2010. A 60 kWh battery pack would have weighed 670 kg in 1990, 400 kg in 2000 and 231 kg in 2010 (this compares to the weight of a typical 2.0 litre gasoline engine of 80–100 kg). Further decreases in battery pack price and increases in battery energy density will help to ensure that battery electric vehicles become more and more competitive compared to conventional gasoline engine vehicles. Some commentators [14,15] believe that it will be cheaper for manufacturers to make electric cars (compared to conventional vehicles) by 2025—this is partly also due to the fact the cost to make an emissions-compliant conventional vehicle will likely rise (as more and more complex, and costly, aftertreatment systems will be needed to meet lower future emissions requirements).
3. Deeper Dive into Life Cycle CO2 Emissions of Electric Vehicles
3.1. Life Cycle CO2 Emissions
The previous section demonstrated that in-use CO2 emissions are substantially decreased for electric cars that use electricity from low carbon fuels (in particular, solar, wind and nuclear energy). However, the energy used to manufacture an electric car is often greater than that used to manufacture a conventional car. Therefore, life cycle analysis is used to better understand the CO2 emissions of electric vehicles and conventional vehicles over their entire lifetime. Two recent papers reported useful data [16,17]. Holmberg and Erdemir [16] calculated both in-use CO2 emissions and CO2 emissions arising from vehicle manufacture. For a conventional vehicle that uses a gasoline engine (and the authors assumed a fuel consumption of 7 L/100 km), it was estimated that total CO2 emissions were 224 g per km, of which 31 g originated from vehicle manufacturing, maintenance, and recycling, 30 g is from the gasoline production stage, and 163 g is from CO2 emissions from the combustion of gasoline. For an electric vehicle, Holmberg and Erdemir [16] estimated a higher level of emissions from the vehicle manufacturing stage (48 g per km). The emissions from electricity generation were quoted as being 180 g/km for electricity generated by coal, 84 g/km for electricity generated from gas, and only 8 g per km if electricity is generated from solar or wind (these figures for gas, solar and wind are comparable to those from reference [11]). The authors also commented that the emissions from electricity generation would be 60 g per km for an electric car using electricity generated from the average “mix” in the EU, giving total life cycle emissions of 108 g/km (compared to 224 g/km for a conventional gasoline car). It is believed that the total vehicle mileage used in these calculations was 200,000 km.
Qiao et al. [17] reported similar data for Chinese electric vehicles. They assumed a lifetime mileage of 150,000 km, and assumed a 27 kWh capacity battery in the electric vehicle. CO2 emissions for vehicle manufacture were quoted as being approximately 10.5 tonnes for the conventional vehicle and 13 tonnes for the electric vehicle (with about 3.2 tonnes being due to battery manufacture). Since lifetime mileage was assumed to be 150,000 km, the CO2 emissions from manufacture were thus approximately 87 g/km (as compared to the figure from Holmberg and Erdemir [16] of 48 g/km). The total life cycle greenhouse gas emissions of an electric vehicle in China were estimated to be 41 tonnes CO2eq in 2015, decreasing to about 34 tonnes CO2eq in 2020, compared to emissions from a conventional vehicle of around 50 tonnes CO2eq. This is based on the electricity generation mix in China. The authors also noted that further reductions in greenhouse gas emissions were possible if batteries could be recycled (or re-used in other applications) at the end of the vehicle’s life.
It is worth pointing out that a major assumption in these life cycle calculations is the lifetime mileage of the vehicle. If the CO2 emissions from the manufacture of an electric vehicle were to be averaged over 250,000 km, the manufacturing CO2 emissions would only be 52 g/km, whilst Qiao et al. [17] assumed a lifetime mileage of 150,000 km, which corresponded to around 87 g/km. If, on the other hand, the owner of the electric vehicle only travelled 75,000 km during the vehicle’s lifetime, the manufacturing CO2 emissions would be 173 g/km!
As Qiao et al. [17] also mentioned, if EV batteries can be recycled at the end of vehicle’s life (or re-used), then this would mean that the CO2 emissions from battery manufacture could be spread over a longer time period, which would further reduce CO2 emissions from electric vehicles.
3.2. Decarbonization of Electricity Generation
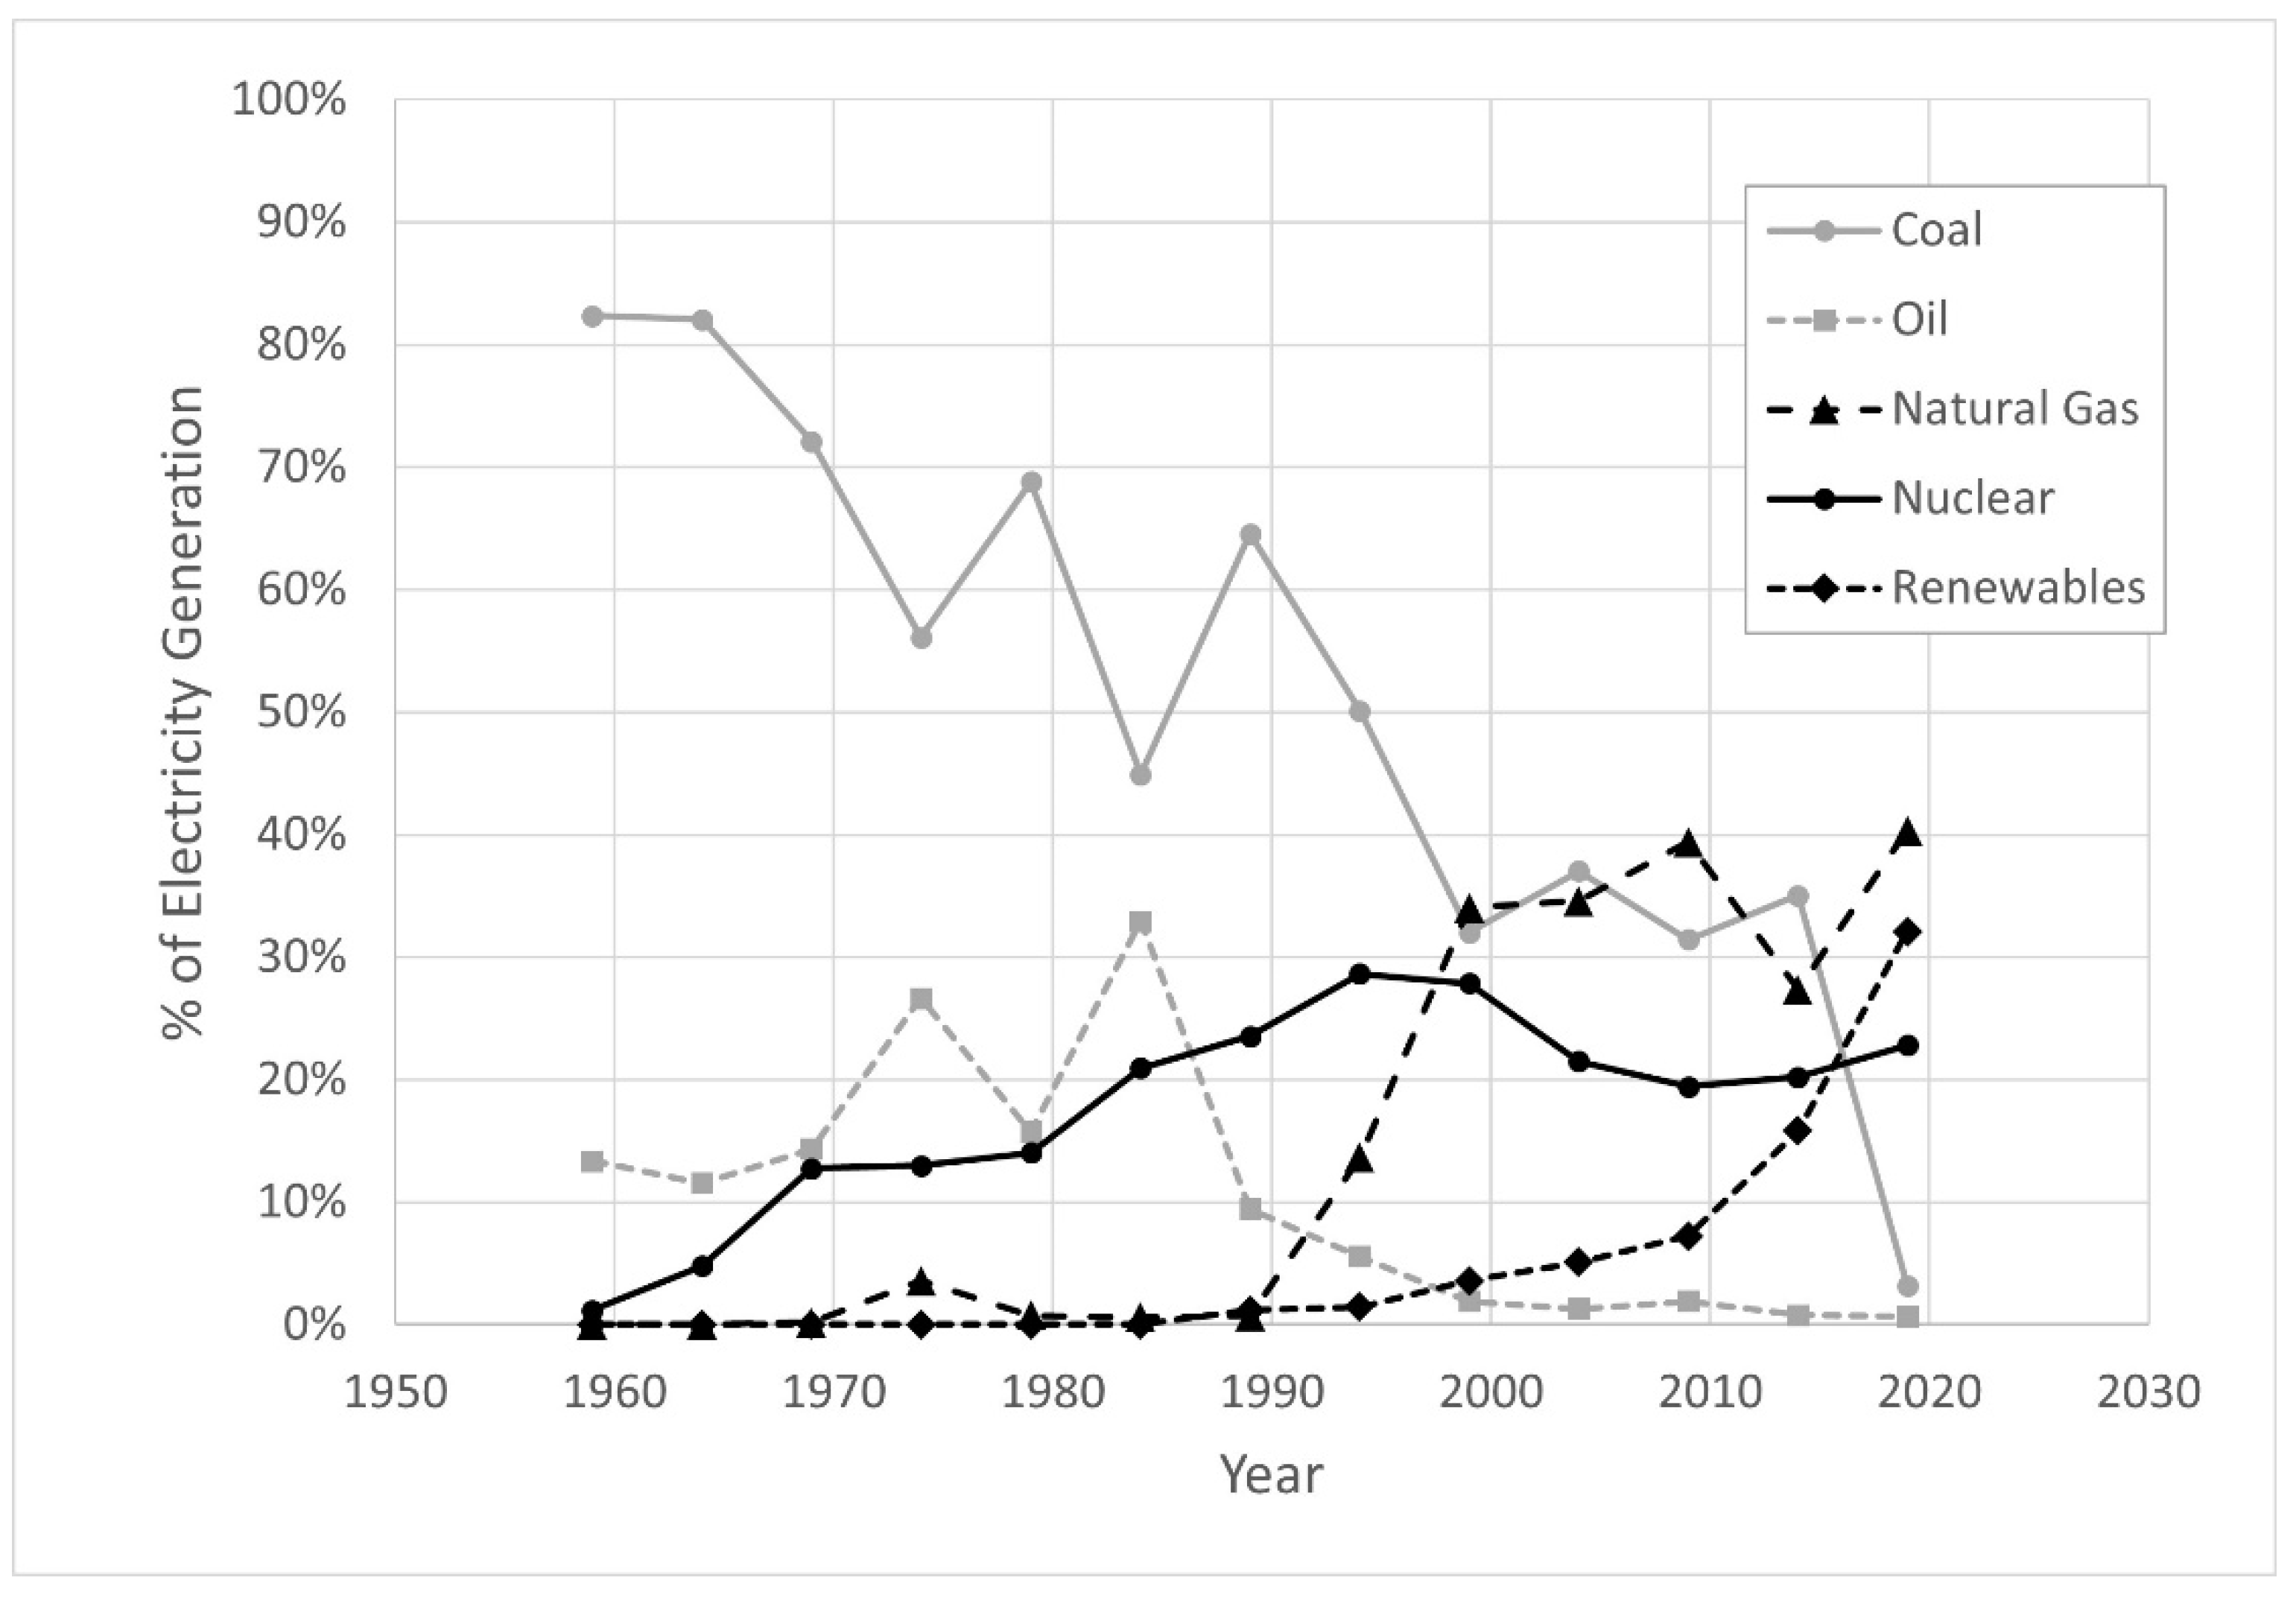
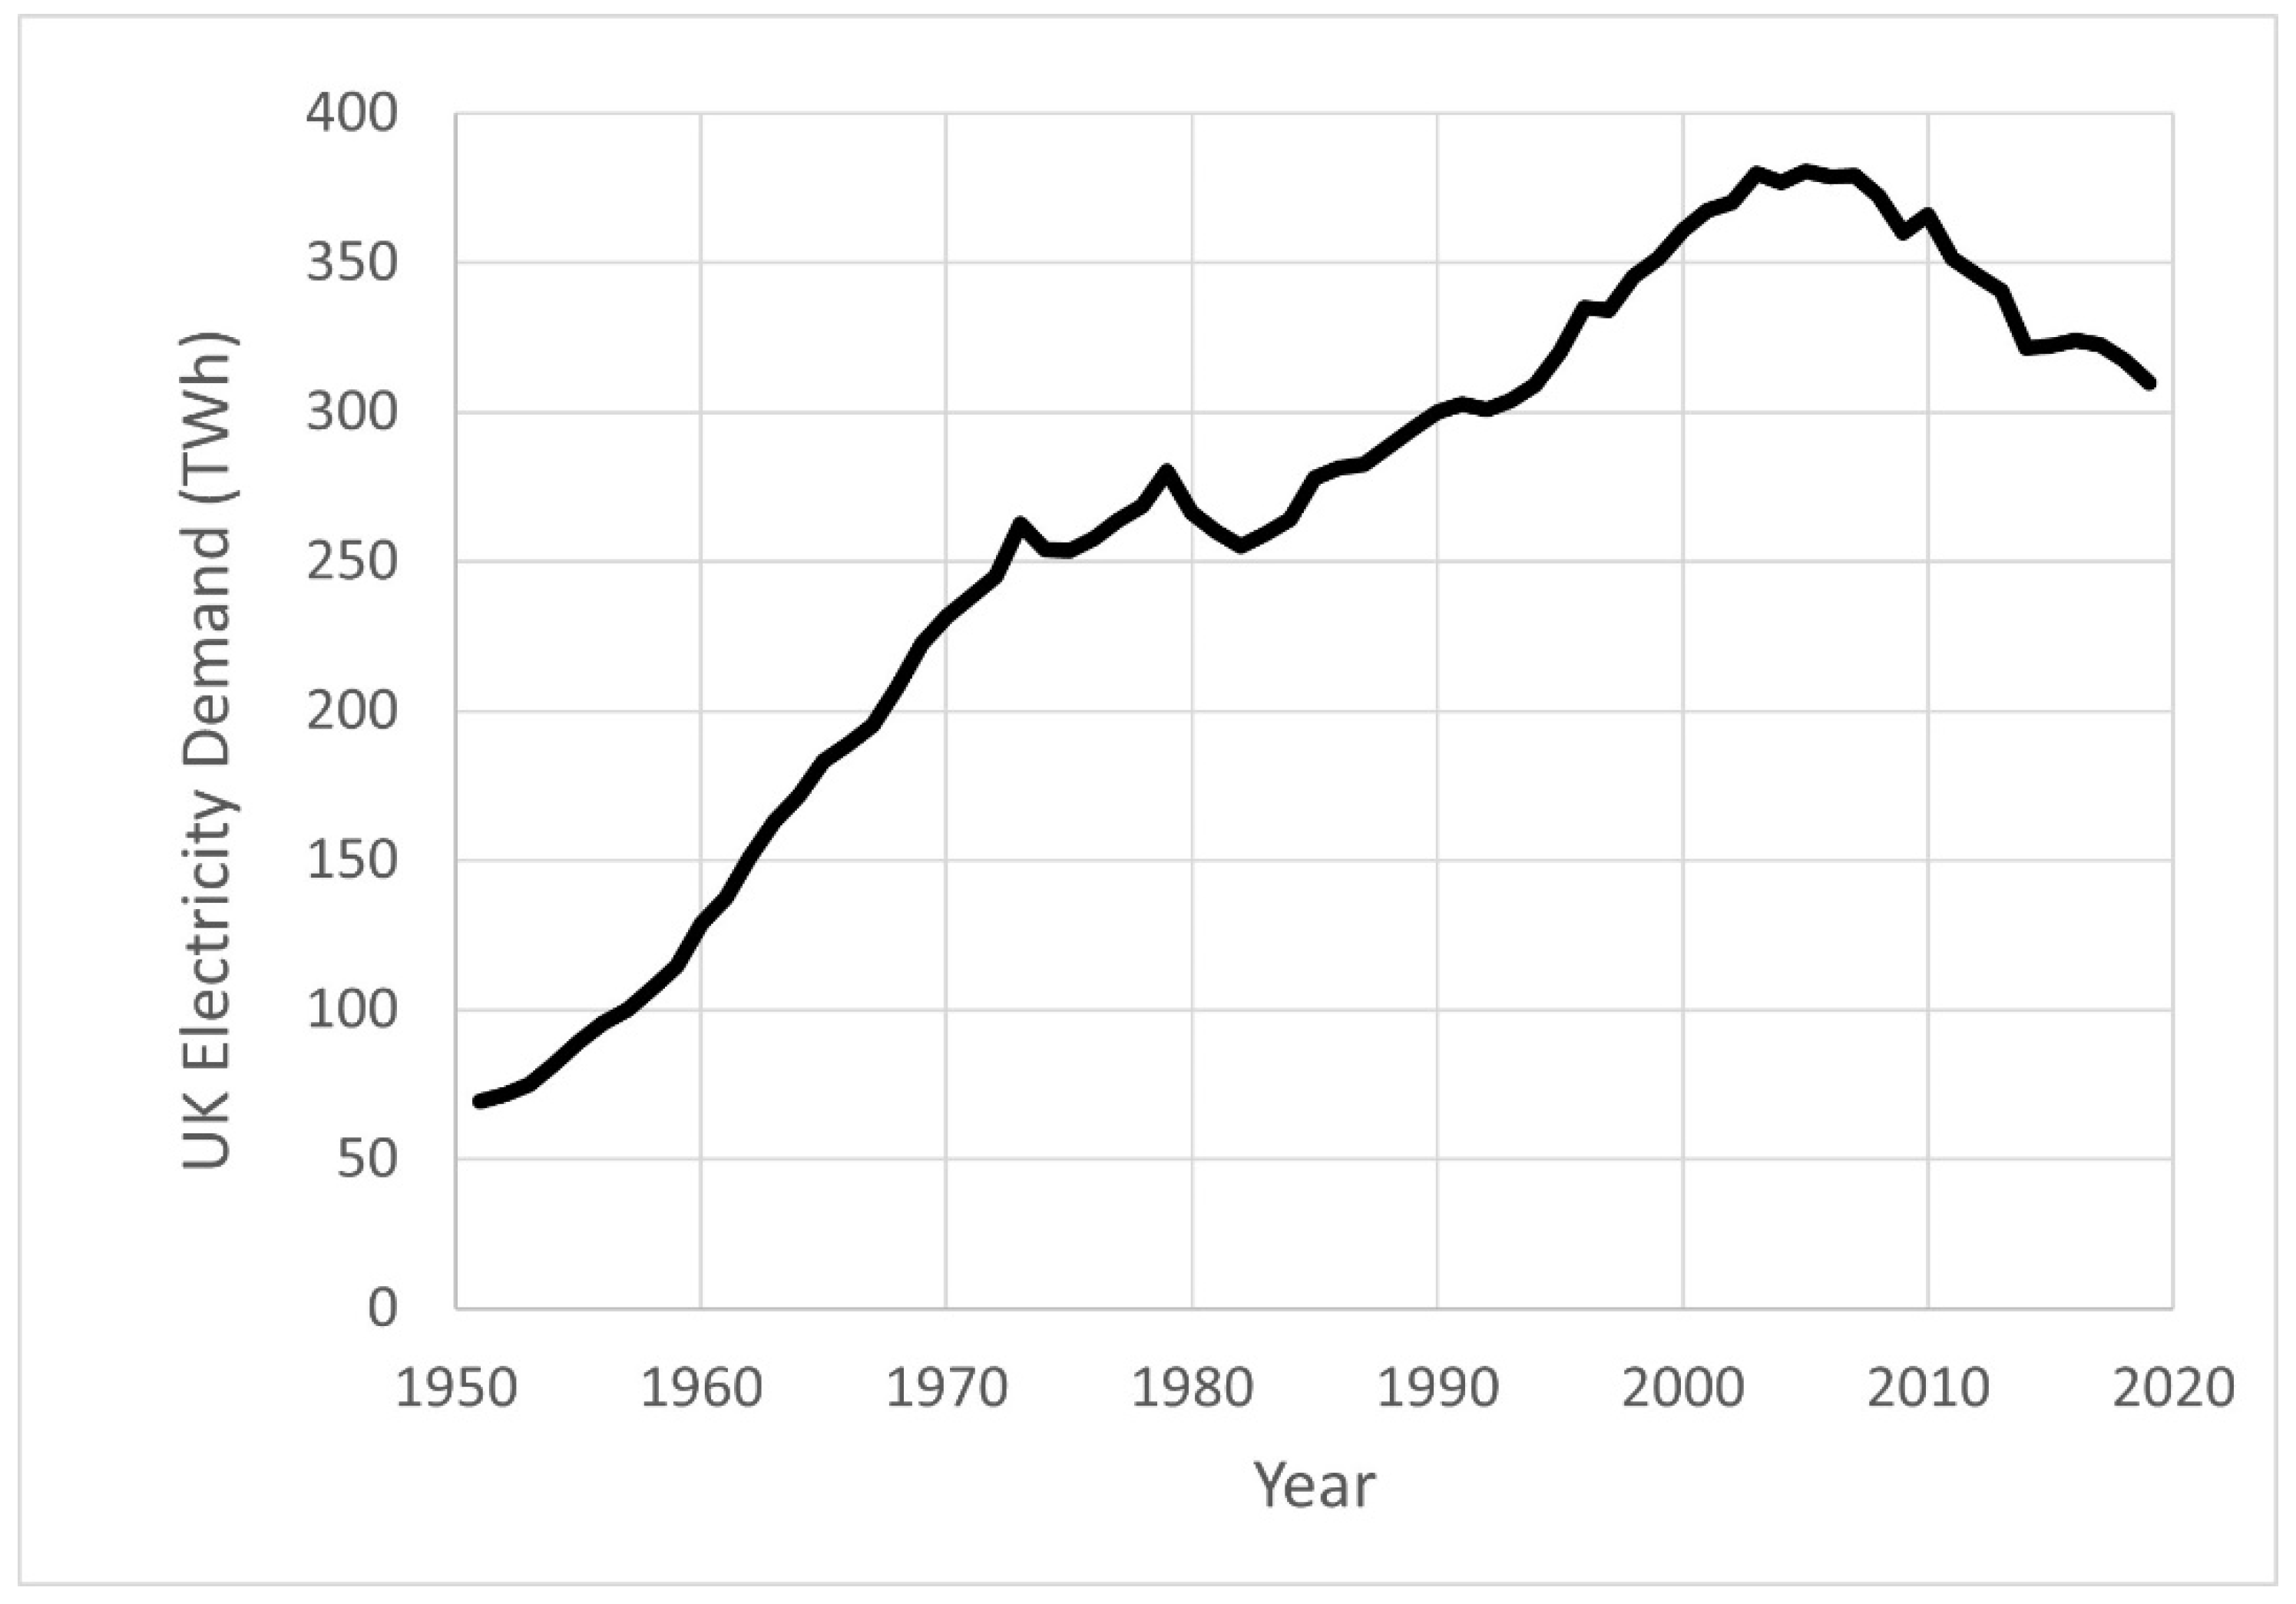
It is clear that significant CO2 reductions can potentially be achieved by the widespread use of electric vehicles, provided that electricity is generated from low-carbon sources. Useful historic data on electricity generation in the UK are available from reference [18]. Figure 3 shows how the source of electricity generation in the UK has changed over the last few decades. Table 2 summarizes the mix of UK electricity generation types from 2018 [18], when for the first time, low carbon electricity generation exceeded 50%. Finally, Figure 4 shows how UK electricity generation has varied over the last few decades. One concern regarding electric vehicles is that much new electricity generation capacity is needed for the anticipated future demand. What Figure 4 shows is that, in fact, over the last 20 years, electricity demand in the UK has decreased substantially from its peak (which occurred in the early 2000s). A full analysis of why there has been a drop in UK electricity demand from 2005 to the present day is beyond the scope of this paper, but it is likely to be a combination of (1) widespread use of energy efficient appliances and low energy lighting, and (2) the move in the UK from heavy industrial manufacturing to more of a service-based economy. Since there will not be a sudden transition to everyone suddenly having an electric vehicle, there will potentially be time to build up electricity generation capacity in line with increased EV ownership.
3.3. CO2 Emissions of Plug-In Hybrid Electric Vehicles
Although most of this section has dealt with BEVs in which there is no internal combustion engine, it is well known that there are many hybrid vehicles in use. PHEVs have both a conventional engine and a battery. In many cases, the battery is typically large enough to allow an electric only driving range of around 50 km (for example, in the current Mitsubishi Outlander PHEV, a 13.8 kWh battery is installed which allows for 45 km of electric only driving). The reader may well ask how the fuel consumption of such a vehicle can be calculated. Roughly speaking, the vehicle is driven on the standard driving cycle on the internal combustion engine only, and fuel consumption Fengine (litres per 100 km) is measured in the usual way. Then, the vehicle is driven in electric model only, and the maximum range, R (in km) that can be driven in electric-only mode is calculated. The overall fuel consumption, Foverall (litres per 100 km) is then calculated as:
Foverall = Fengine/(1 + R/25)
More details may be found in reference [20].
For example, the previous model of the Mitsubishi Outlander PHEV, when run on the older NEDC driving cycle (which was used in Europe until recently), had a measured fuel consumption of 6.4 L per 100 km (approximately 44.1 miles per imperial gallon). It also had a range R of 54 km. Using Equation (1) above, the calculated overall fuel consumption is 2.03 L per 100 km (approximately 139 miles per imperial gallon). Clearly, these figures assume that owners regularly charge up the battery in their PHEV. If such vehicles are only ever run on the engine only, then the official fuel consumption will greatly underestimate their CO2 emissions. “Super credits” were available to vehicle manufacturers that sold PHEVs that had CO2 emissions (calculated by the method above) less than 50 g/km. A wide selection of PHEV vehicles were previously available in Europe when the older NEDC driving cycle was used to estimate CO2 emissions. Now that the new WLTP driving cycle is in use, fewer PHEV models are available, since it is more difficult to develop a PHEV with CO2 emissions less than 50 g/km. This is because the fuel consumption of the internal combustion engine is higher on the WLTP test cycle, and also because the range that the vehicle can go in “electric-only” mode is lower for the WLTP test cycle.
3.4. e-Fuels and Green Hydrogen
There has been much recent discussion about the use of renewable electricity to create e-fuels (from hydrogen, oxygen, and CO2) or green hydrogen. As has been pointed out by Mackay [21] and more recently by Cebon [22], if renewable electricity is used to create hydrogen, approximately four times as much electrification would be needed, compared to simply using renewable electricity directly in batteries. As for e-fuels (which are also known as synthetic fuels), there are significant doubts as to whether these could be manufactured economically and sold at a price attractive to consumers. In addition, there is a significant reduction in energy efficiency from e-fuels, compared to simply using the renewable electricity directly in electric vehicle batteries. As an example, assume there is 100 kWh of renewable electricity available. If used directly in the battery of an electric vehicle, this could propel the electric vehicle over a distance of 400–600 km. If, however, it is assumed that 50 kWh of renewable electricity was used to make an e-fuel, the energy content of this e-fuel (the remaining 50 kWh) would only propel the conventional vehicle a distance of around 88 km. In addition, of course, there would be CO2 emissions from the vehicle during driving, from the combustion of the e-fuel. Although these considerations suggest that e-fuels and hydrogen may not be sensible for passenger cars, there may be other “harder to decarbonize” sectors (such as shipping, aviation, heavy duty transport) in which these find their niche.
4. Tribological Challenges with Electric Vehicles
4.1. Electric Vehicle Transmissions
Electric vehicle transmissions are quite different from those in conventional cars. In a modern conventional car, an automatic transmission may have as many as 8, 9, or even 10 gears. However, in an electric vehicle, there are only three gears at most, so shaft speeds in an EV gearbox will generally be higher than those found in a conventional car (Gangaopadhyay [23] noted that shaft speeds could be 15,000 rpm or greater). In addition, of course, there is the possibility in some EV gearboxes that the lubricant may come into contact with copper wiring. Therefore, lubricants for EV gearboxes need to be formulated to protect against lubricant aeration and foaming and require improved copper compatibility. In addition, Gahagan [24] and Beyer et al. [25] also reported that lubricant electrical and thermal properties need to be chosen carefully. Beyer et al. [25] also noted that the formulation balance is not straightforward, since additives that impart friction durability, and anti-wear additives tend to be antagonistic towards copper, and also tend to increase electrical conductivity.
4.2. Mild Hybrid and PHEV Engine Lubrication
For MHEVs and PHEVs, there is both an engine and a battery. In a mild hybrid vehicle, the battery is charged up via the engine only, and the battery tends to be relatively small (for the first-generation Toyota Prius XW30, from 2012 to 2016, the battery size was only 4.4 kWh). In a PHEV, the battery tends to be larger (12–15 kWh), and the vehicle can typically travel around 50 km in electric-only mode. In addition, in a PHEV, the battery can be charged externally. A very recent review that contains data on the different battery sizes, in kWh, for different vehicles can be found in reference [26].
Both MHEVs and PHEVs have engines that are generally fitted with stop-start systems (so that when the vehicle is stationary with the parking brake engaged, the engine will stop). This means there will be many more stop-starts than for conventional vehicles, potentially leading to higher levels of wear. Fan et al. [27] found that when the PHEV was run in electric-only mode, the engine could still engage if accelerations were high and/or if the battery charge level became too low. The intermittent nature of engine operation can lead to lower engine oil temperatures (compared to that typical of conventional engines). In addition, Fan et al. [27] found higher levels of fuel dilution in the lubricant (more details are given in Section 5). They also noted that tailpipe emissions (NOx and PM) could be higher since the aftertreatment systems were not always at optimum operating temperature. There is also the danger that the engine could start operating when the vehicle is at high speed on a motorway if the battery charge level is too low. If this happens and the oil pump has not sufficiently distributed oil to key components (such as pistons and valve trains), then the components could be operating at high speed with insufficient lubricant. The car manufacturer would need to ensure that the oil pump operates before the engine starts in such conditions to avoid this possibility.
When the engine is operating in electric-only mode, the engine is constantly being vibrated but no lubricant is flowing around the engine. Niizato, of Honda, highlighted that this could lead to fretting wear of the main engine bearings [28].
It should be noted that there are different configuration possibilities for hybrid electric vehicles. In a vehicle such as the Mitsubishi Outlander, the engine is connected directly to the wheels, and operates essentially as a conventional combustion engine, and conventional engine oils are used for engine lubrication. On the other hand, there are vehicles (such as those using Nissan’s e-Power technology [29]) in which the engine operates only as a generator for the battery (and the engine is not connected to the vehicle wheels). In this type of system, the battery does not need external charging, yet impressive vehicle fuel consumption figures can be achieved (Nissan’s Note e-Power Nismo S is quoted as having a fuel consumption of 2.9 L per 100 km [30], equivalent to 97.4 miles per imperial gallon). In this type of design, the engine will operate over a much more restricted range of engine speeds and loads (compared to a conventional engine), and in principle, an engine lubricant could be optimized just for this operating cycle, the formulation of which could differ substantially from that of a conventional engine lubricant.
5. Fluid Requirements for Electric Vehicles
BEVs will clearly not need engine oil, but will still need transmission oil, will need grease (both for the electric motors and other grease lubricated parts of the vehicle), and will also potentially need thermal fluid for the battery.
5.1. Thermal Fluids for Control of Battery Temperature
At vehicle start-up, the thermal fluid will need to warm the battery up, and for high ambient temperatures, and/or for when the battery is being charged, the thermal fluid will need to cool the battery. The battery works optimally in a temperature range of about 20–40 °C. If the battery is too cold, the electric vehicle’s range will decrease substantially. If the battery becomes too hot, there is a possibility of a thermal runaway reaction, which could lead to a battery fire. Good recent reviews of (fast) battery charging and cooling methods for batteries can be found in references [31,32].
As discussed in reference [32], some electric vehicles (such as the Nissan Leaf) are air cooled—they simply rely on the flow of air through the battery cells to cool the battery (some cars rely on the motion of the vehicle for airflow through the battery, whereas others actively pump the external air so that it flows faster through the battery cells). However, this is not entirely satisfactory as the air ambient temperature can vary widely. Many electric vehicles use indirect cooling, in which the batteries are in contact with a surface that is cooled (via the flow of a fluid). In a Tesla vehicle, thin pipes run through the battery cells, whilst a 50:50 propylene glycol/water mixture is pumped through the pipes, enabling heat to be removed from the battery. In a Tesla, the coolant volume is 7 L. In other vehicles (such as BMW electric vehicles), the bottom surface of the vehicle is cooled by a refrigerant (the same fluid as used in the air conditioning system, R1234yf) and the battery cells sit on top of this cooled surface.
Direct (or immersive) cooling of batteries is thought to be the best solution but requires a redesign of the battery cell so that the insulating thermal fluid can flow directly over the battery cells. This thermal fluid would be in direct contact with the battery cells, and the amount of cooling (or heating) could be controlled by changing the flow rate. At the time of writing, no commercial electric vehicles available today use this technology, although it is used in some Formula E racecars.
Thermal fluids are commercially available from a number of suppliers, such as 3M (Novec fluid [33]), Solvay (Galden perfluorpolyether (PFPE), [34]), MIVolt [35], and established lubricant companies such as Shell and Castrol are jointly working with direct immersion cooling companies (such as Kreisel Electric [36] and XING Mobility [37]) to develop thermal fluids based on hydrocarbon base oils. Some of these thermal fluids have also found application in direct immersion cooling of server circuit boards (resulting in significant electricity savings in server data centres). The final choice of fluid used will generally depend on a combination of density, thermal conductivity, heat capacity, flash-point, cost, and environmental friendliness.
Finally, it should also be mentioned that some research is ongoing into the use of phase-change materials for electric battery cooling. Such materials rely on the large latent heat of vaporization that occurs during a phase change (for example, when a wax melts to become a liquid). Further information on work in this area may be found in references [38,39,40].
5.2. Electric Vehicle Transmission Lubricants
As pointed out in [41], the requirements of electric vehicle transmission lubricants are quite different from those of conventional automatic transmission fluids (ATFs). The specific requirements depend on whether the electric motor is in contact with the lubricant or not (wet e-motor or dry e-motor). The requirements relating to the fluid are set by the different electric vehicle transmission manufacturers, and there is, as yet, no industry standard specification. The key performance requirements for the transmission fluid in electric vehicle transmissions are copper compatibility, electrical insulation, thermal properties (as the fluids need to cool e-motors), foam control and thermal stability. Friction control, which is key for standard ATFs, is of lesser importance for EV transmission fluids.
5.3. Engine Oils for PHEVs and MHEVs
Generally, both MHEVs and PHEVs have used conventional engine oils for their lubrication. There is no separate industry standard lubricant specification in place for hybrid electric vehicle engine oils at the present time. The Toyota Prius has been a popular MHEV (over 5 million of these vehicles have been sold worldwide) and in the USA and Japan, the engine oil used is a standard API or ILSAC specification lubricant (whilst in Europe, a standard ACEA lubricant is used). There have only been a few studies on the impact of engine lubricant on hybrid electric vehicle lubrication. In 2014, Clarke [42] reported field trial data from Toyota hybrid vehicles used in a taxi service in New York City (taxi type operation is generally regarded as the most severe type of driving for a passenger car). The vehicles in the trial used ILSAC GF-5 quality engine oils. It was found that hybrid vehicle operation resulted in cooler lubricant operating temperatures, and more frequent engine starts. However, engine teardowns after more than 250,000 miles, for two vehicles, did not find significant wear issues, and there were no issues with wear metals or oxidation, with 10,000-mile oil drain intervals. There was some evidence of sludge, varnish, and lacquer in some of the vehicles.
Fan et al. [27] recently investigated the impact of oil viscosity and driving mode (hybrid versus conventional) on fuel dilution of the lubricant and emissions (including particle number) for different drive cycles (WLTC, the World-Wide Harmonized Light Duty Driving Test Cycle, and the continuous, ECE-15 portion of the New European Driving Cycle, NEDC). For hybrid operation, the state of charge of the battery was controlled at a low level (10–13%) to ensure more engine starts. It was found in both driving cycles that frequent engine starts resulted in high particulate number (PN) and unburned hydrocarbon emissions. Lower oil operating temperatures were also reported. For the ECE-15 driving cycle, the oil temperature for conventional engine operation at the end of the driving cycle was approximately 95 °C, whereas for hybrid engine operation, in the same driving cycle, the final oil temperature was slightly under 80 °C. Fuel dilution was measured for both conventional and hybrid vehicle operation during continuous driving (using repeats of the ECE-15 cycle). After around ten ECE-15 cycles, the fuel dilution for conventional driving levelled off at around 1.5%. However, for hybrid operation, fuel dilution kept increasing as the number of ECE-15 cycles increased, and after twenty ECE-15 cycles, the fuel dilution increased to over 3%. The work showed that fuel dilution is potentially a critical issue for PHEV vehicles. The work by Fan et al. [27] used Geely vehicles equipped with a 1.5 litre turbo-charged direct injection (TGDI) engine. In the work, engine oils with viscosity grade SAE 0W-20 and SAE 5W-30 were tested, and, as expected, use of the SAE 0W-20 lubricant viscosity grade gave lower fuel consumption figures.
Some lubricant manufacturers market lubricants which are claimed to be optimized for stop-start operation. However, since there are no industry standard tests for stop-start operation, these claims are based on in-house tests. It is possible that as the numbers of hybrid vehicles increase, some OEMs may start to consider whether a separate lubricant specification should be developed.
In the work referenced above, both types of vehicle contained engines that were directly connected to the vehicle wheels, and so essentially operated as conventional engines, over a wide range of speeds and loads. There are vehicles available that operate differently, in which the engine in the hybrid vehicle is not connected to the wheels, and essentially operates as a generator for the electric battery (the vehicles that Nissan have in the e-Power range operate like this [29]). In this case, the engine operates over a much narrower range of speeds and loads than a conventional engine, and there would be potential benefits of developing an optimized lubricant for this specific type of operation.
5.4. Greases for Electric Vehicles
Electric vehicles are already affecting greases. Since electric vehicles generally use lithium-ion batteries, the demand for lithium is rapidly increasing, leading to higher lithium prices, which impacts the costs of lithium complex greases. Therefore, there has been a surge of interest in developing alternative greases that do not contain lithium [43] (see, for example, the recent increased interest in the development of calcium complex greases [44]). For electric vehicle application, low noise greases are desirable (due to the lower overall noise level in an electric vehicle). In addition, there is increased interest in the performance of lubricants (and greases) in the presence of electric fields, as discussed in two recent reviews [45,46].
6. Conclusions
Some of the motivations behind the increasing electrification of the passenger car vehicle fleet have been discussed, with the main ones being much improved energy efficiency, the potential for lower CO2 emissions, lower (or zero) local emissions of NOx and particulate matter, lower overall total costs of ownership, and the rapid progress being made in battery technologies.
In Europe, there has been increasing decarbonization of the electricity systems, and examples have been given of how the UK electricity system has transitioned to lower carbon fuel sources in the last ten to twenty years.
With BEVs and PHEVs come new tribological challenges particularly for electric vehicle transmissions and the engine that is used in a hybrid electric vehicle. To overcome these challenges, new fluids are needed for these applications, and even though a BEV will not need engine oil, it will generally need thermal fluid (to ensure that the battery stays within an optimum temperature range during both driving and fast charging).
The changing vehicle landscape will continue to provide challenges for tribologists and fluid developers, and there will be increasing interest, in the future, in how lubricants and fluids are impacted in the presence of electric and magnetic fields.
Funding
This research received no external funding.
Data Availability Statement
Data in this paper can be found in the various references listed.
Conflicts of Interest
The authors declare no conflict of interest.
References
- Paris Agreement. United Nations Treaty Collection. Available online: https://treaties.un.org/Pages/ViewDetails.aspx?src=TREATY&mtdsg_no=XXVII-7-d&chapter=27&clang=_en (accessed on 21 June 2021).
- González, R.M.; Marrero, G.; Rodríguez-López, J.; Marrero, A.S. Analyzing CO2 emissions from passenger cars in Europe: A dynamic panel data approach. Energy Policy 2019, 129, 1271–1281. [Google Scholar] [CrossRef]
- King, J. The King Review of Low Carbon Cars. 2007. Available online: https://www.zemo.org.uk/assets/presentations/Julia%20King.pdf (accessed on 21 June 2021).
- Nejat, P.; Jomehzadeh, F.; Taheri, M.M.; Gohari, M.; Majid, M.Z.A. A Global Review of Energy Consumption, CO2 Emissions and Policy in the Residential Sector (with an Overview of the Top Ten CO2 Emitting Countries). Renew. Sustain. Energy Rev. 2015, 43, 843–862. [Google Scholar] [CrossRef]
- CO2 Emissions from Cars Facts and Figures (Infographics). Available online: https://www.europarl.europa.eu/news/en/headlines/society/20190313STO31218/co2-emissions-from-cars-facts-and-figures-infographics (accessed on 21 June 2021).
- Congestion Charge. Available online: https://tfl.gov.uk/modes/driving/congestion-charge (accessed on 21 June 2021).
- Electric Car EPA Fuel Economy. Available online: https://en.wikipedia.org/wiki/Electric_car_EPA_fuel_economy (accessed on 21 June 2021).
- Most Efficient Electric Vehicle. Available online: https://ev-database.org/compare/efficiency-electric-vehicle-most-efficient (accessed on 21 June 2021).
- Fossil and Alternative Fuels Energy Content. Available online: https://www.engineeringtoolbox.com/fossil-fuels-energy-content-d_1298.html (accessed on 21 June 2021).
- Electric Vehicles. UK Houses of Parliament Parliamentary Office of Science & Technology PostNote, Number 365. October 2010. Available online: https://www.parliament.uk/globalassets/documents/post/postpn365_electricvehicles.pdf (accessed on 21 June 2021).
- Carbon Footprint of Electricity Generation. Houses of Parliament Parliamentary Office of Science and Technology, Postnote Update, Number 383. June 2011. Available online: https://www.parliament.uk/globalassets/documents/post/postpn_383-carbon-footprint-electricity-generation.pdf (accessed on 21 June 2021).
- Learn the Facts: Fuel Consumption and CO2. Available online: https://www.nrcan.gc.ca/sites/www.nrcan.gc.ca/files/oee/pdf/transportation/fuel-efficient-technologies/autosmart_factsheet_6_e.pdf (accessed on 21 June 2021).
- Electric Vehicle Ownership Costs: Today’s Electric Vehicles Offer Big Savings for Consumers. Consumer Reports. 2020. Available online: https://advocacy.consumerreports.org/wp-content/uploads/2020/10/EV-Ownership-Cost-Final-Report-1.pdf (accessed on 21 June 2021).
- EVs Will Be Cheaper Than Petrol Cars in All Segments by 2027, BNEF Analysis Finds. Available online: https://www.transportenvironment.org/press/evs-will-be-cheaper-petrol-cars-all-segments-2027-bnef-analysis-finds (accessed on 21 June 2021).
- Batteries for Electric Cars Speed Toward a Tipping Point. Available online: https://www.bloomberg.com/news/articles/2020-12-16/electric-cars-are-about-to-be-as-cheap-as-gas-powered-models (accessed on 21 June 2021).
- Holmberg, K.; Erdemir, A. The Impact of Tribology on Energy Use and CO2 Emissions Globally and in Combustion Engine and Electric Vehicles. Tribol. Int. 2019, 135, 389–396. [Google Scholar] [CrossRef]
- Qiao, Q.; Zhao, F.; Liu, Z.; He, X.; Hao, H. Life Cycle Greenhouse Gas Emissions of Electric Vehicles in China: Combining the Vehicle Cycle and Fuel Cycle. Energy 2019, 177, 222–233. [Google Scholar] [CrossRef]
- UK Historical Electricity Data (from 1920 to 2019). Available online: https://www.gov.uk/government/statistical-data-sets/historical-electricity-data (accessed on 21 June 2021).
- UK Energy Statistics, 2018 & Q4 2018. Department for Business, Energy & Industrial Strategy Press Notice. 28 March 2019. Available online: https://assets.publishing.service.gov.uk/government/uploads/system/uploads/attachment_data/file/791297/Press_Notice_March_2019.pdf (accessed on 21 June 2021).
- Too Low to Be True? How to Measure Fuel Consumption and CO2 Emissions of Plug-In Hybrid Vehicles, Today, and in the Future. ICCT Briefing Paper. July 2017. Available online: http://www.theicct.org/file/2942 (accessed on 21 June 2021).
- MacKay, D. Sustainable Energy—Without the Hot Air; UIT: Cambridge, UK, 2008. [Google Scholar]
- Cebon, D. Blog: Should Lorries be Powered by Hydrogen. 25 June 2018. Available online: http://www.csrf.ac.uk/2018/06/should-lorries-be-powered-by-hydrogen (accessed on 21 June 2021).
- Gangopadhyay, A. Next Generation Driveline Lubricants for Electrified Vehicles; STLE: Park Ridge, IL, USA, 2018. [Google Scholar]
- Gahagan, M. Lubricant Technology for Hybrid Electric Automatic Transmissions; SAE: Warrendale, PA, USA, 2017. [Google Scholar]
- Beyer, M.; Brown, G.; Gahagan, M.; Higuchi, T.; Hunt, G.; Huston, M.; Jayne, D.; McFadden, C.; Newcomb, T.; Patterson, S.; et al. Lubricant Concepts for Electrified Vehicle Transmissions and Axles. Tribol. Online 2019, 14, 428–437. [Google Scholar] [CrossRef] [Green Version]
- Sanguesa, J.A.; Torres-Sanz, V.; Garrido, P.; Martinez, F.J.; Marquez-Baria, J.M. A Review on Electric Vehicles: Technologies and Challenges. Smart Cities 2021, 4, 372–404. [Google Scholar] [CrossRef]
- Fan, Q.; Wang, Y.; Xiao, J.; Wang, Z.; Li, W.; Jia, T.; Zheng, B.; Taylor, R. Effect of Oil Viscosity and Driving Mode on Oil Dilution and Transient Emissions Including Particle Number in Plug-In Hybrid Electric Vehicle; SAE: Warrendale, PA, USA, 2020. [Google Scholar]
- Niizato, T. Tribology in Power-Train Tribology; TTRF-Taiho International Tribology Symposium: Nagoya, Japan, 2017. [Google Scholar]
- e-Power. Available online: https://www.nissan-global.com/EN/TECHNOLOGY/OVERVIEW/e_power.html (accessed on 21 June 2021).
- Nissan Note e-Power Nismo S Is the Future of Hot Hatches. Available online: https://www.roadandtrack.com/reviews/a35821860/nissan-note-e-power-nismo-s-is-the-future-of-hot-hatches (accessed on 21 June 2021).
- Tomaszewska, A.; Chu, Z.; Feng, X.; O’Kane, S.; Liu, X.; Chen, J.; Ji, C.; Endler, E.; Li, R.; Liu, L.; et al. Lithium-Ion Battery Fast Charging: A Review. eTransportation 2019, 1, 1–28. [Google Scholar] [CrossRef]
- Offer, G.; Patel, Y.; Hales, A.; Bravo Diaz, L.; Marzook, M. Cool Metric for Lithium-Ion Batteries Could Spur Progress. Nature 2020, 582, 485–487. [Google Scholar] [CrossRef] [PubMed]
- Direct Contact Cooling Using 3M™ Novec™ Engineered Fluids for xEV Battery. Available online: https://www.3m.com/3M/en_US/oem-tier-us/applications/propulsion/ev-battery/novec-for-ev-battery (accessed on 21 June 2021).
- Solvay Spotlights Materials for Battery Packs and Immersion Cooling. Available online: https://www.solvay.com/en/press-release/solvay-spotlights-materials-battery-show-0 (accessed on 21 June 2021).
- Dielectric Fluids for the Direct Immersion Cooling of Electrical Systems. Available online: https://mivoltcooling.com (accessed on 21 June 2021).
- Shell and Kreisel Electric form Strategic Alliance to Offer High-Performance Electric Battery Solution. Available online: https://www.shell.com/business-customers/lubricants-for-business/news-and-media-releases/2020/shell-and-kreisel-electric-form-strategic-alliance-to-offer-high-performance-electric-battery-solution.html (accessed on 21 June 2021).
- Castrol and Xing Mobility Announce Partnership. Available online: https://www.castrol.com/en_gb/united-kingdom/home/castrol-story/newsroom/press-releases/castrol-and-xing-mobility.html (accessed on 21 June 2021).
- Liu, C.; Xu, D.; Weng, J.; Zhou, S.; Li, W.; Wan, Y.; Jiang, S.; Zhou, D.; Wang, J.; Huang, Q. Phase Change Materials Application in Battery Thermal Management System: A Review. Materials 2020, 13, 4622. [Google Scholar] [CrossRef] [PubMed]
- Zhao, Y.; Zou, B.; Li, C.; Ding, Y. Active Cooling Based Battery Thermal Management Using Composite Phase Change Materials. Energy Procedia 2019, 158, 4933–4940. [Google Scholar] [CrossRef]
- Landini, S.; Leworthy, J.; O’Donovan, T.S. A Review of Phase Change Materials for the Thermal Management and Isothermalization of Lithium-Ion Cells. J. Energy Storage 2019, 25, 100887. [Google Scholar] [CrossRef]
- Electric Vehicle Fluids. Available online: https://www.shell.com/promos/shell-efluids-white-paper/_jcr_content.stream/1557393426168/21d420a180929299e6513272f519fd1d87d240df/shell-white-paper.pdf (accessed on 21 June 2021).
- Clarke, D. Understanding Lubricant Requirements of Hybrid-Electric Vehicles; SAE: Warrendale, PA, USA, 2014. [Google Scholar]
- Tribology & Lubrication Technology. The Future of Lubricating Greases in the Electric Vehicle Era; STLE: Park Ridge, IL, USA, 2019. [Google Scholar]
- Tribology & Lubrication Technology. Calcium Sulphonate Complex Greases; STLE: Park Ridge, IL, USA, 2016. [Google Scholar]
- Krim, J. Controlling Friction with External Electric or Magnetic Fields: 25 Examples. Front. Mech. Eng. 2019, 5. [Google Scholar] [CrossRef]
- Spikes, H.A. Triboelectrochemistry: Influence of Applied Electric Potentials on Friction and Wear of Lubricated Contacts. Tribol. Lett. 2020, 68, 90. [Google Scholar] [CrossRef]
Figure 1.
Typical standard driving cycles used for evaluation of vehicle energy efficiency (either in kWh per 100 km for an electric vehicle, or litres of fuel consumed per 100 km, for a conventional vehicle). Cars would generally start these cycles from cold (20–25 °C). The NEDC cycle is the older driving cycle (NEDC = New European Driving Cycle) which was in use until 2017, but has now been superseded by the WLTC cycle (WLTC = Worldwide Harmonized Light Vehicle Test Cycle) which is thought to be more representative of real life driving conditions (for Europe and Asia, the WLTC Class 3b test cycle would generally be used).

Figure 2.
CO2 emissions (in kg) for a car travelling 100 km. The electric vehicle emissions were in accordance with an assumed energy consumption of 20 kWh per 100 km, and for the gasoline car, it was assumed that the fuel consumption was 6 L/100 km. The data in Figure 1 use the equivalent CO2 emissions per kWh from reference [11] and assume that 2.3 kg of CO2 is emitted per litre of gasoline consumed [12].

Figure 3.
Graph showing mix of UK electricity over time. From the 1950s until 2000, coal was dominant (although in 2020 is now much less than 5%). In 2020, natural gas, wind/solar and nuclear were the main sources of electricity in the UK.
Figure 3.
Graph showing mix of UK electricity over time. From the 1950s until 2000, coal was dominant (although in 2020 is now much less than 5%). In 2020, natural gas, wind/solar and nuclear were the main sources of electricity in the UK.

Figure 4.
Graph showing UK electricity demand (in TWh) over time. Note the peak demand was around 2005 at approximately 380 TWh, compared to the 2020 demand of about 300 TWh. Data are from reference [18].
Figure 4.
Graph showing UK electricity demand (in TWh) over time. Note the peak demand was around 2005 at approximately 380 TWh, compared to the 2020 demand of about 300 TWh. Data are from reference [18].


Table 1.
Equivalent CO2 emissions per kWh for different sources of electricity generation [11].
Table 1.
Equivalent CO2 emissions per kWh for different sources of electricity generation [11].
| Source of Electricity Generation | gCO2eq/kWh |
|---|---|
| Coal | 846 |
| Natural Gas | 488 |
| Solar Photovoltaic (PV) | 88 |
| Wind | 38 |
| Nuclear | 26 |
| UK average (2019) | 219 |
Table 2.
UK electricity mix in 2018. For the first time, low carbon sources constituted more than 50% of the total [19].
Table 2.
UK electricity mix in 2018. For the first time, low carbon sources constituted more than 50% of the total [19].
| Source of Electricity Generation | % |
|---|---|
| Coal | 5 |
| Natural Gas | 39.4 |
| Nuclear | 19.5 |
| Renewables | 33.3 |
| Oil and Other | 2.8 |
Publisher’s Note: MDPI stays neutral with regard to jurisdictional claims in published maps and institutional affiliations. |
© 2021 by the author. Licensee MDPI, Basel, Switzerland. This article is an open access article distributed under the terms and conditions of the Creative Commons Attribution (CC BY) license (https://creativecommons.org/licenses/by/4.0/).
Share and Cite
MDPI and ACS Style
Taylor, R.I. Energy Efficiency, Emissions, Tribological Challenges and Fluid Requirements of Electrified Passenger Car Vehicles. Lubricants 2021, 9, 66. https://0-doi-org.brum.beds.ac.uk/10.3390/lubricants9070066
AMA Style
Taylor RI. Energy Efficiency, Emissions, Tribological Challenges and Fluid Requirements of Electrified Passenger Car Vehicles. Lubricants. 2021; 9(7):66. https://0-doi-org.brum.beds.ac.uk/10.3390/lubricants9070066
Chicago/Turabian StyleTaylor, Robert Ian. 2021. "Energy Efficiency, Emissions, Tribological Challenges and Fluid Requirements of Electrified Passenger Car Vehicles" Lubricants 9, no. 7: 66. https://0-doi-org.brum.beds.ac.uk/10.3390/lubricants9070066
Note that from the first issue of 2016, this journal uses article numbers instead of page numbers. See further details here.