Article

Preparation and Physical Properties of High-Belite Sulphoaluminate Cement-Based Foam Concrete Using an Orthogonal Test

1
School of Civil Engineering, Qingdao University of Technology, Qingdao 266033, China
2
Collaborative Innovation Center of Engineering Construction and Safety in Shandong Blue Economic Zone, Qingdao University of Technology, Qingdao 266033, China
3
Center for Infrastructure Engineering, School of Computing, Engineering and Mathematics, Western Sydney University, Sydney, NSW 2751, Australia
4
School of Architecture Engineering, Qingdao Agricultural University, Qingdao 266109, China
*
Authors to whom correspondence should be addressed.
Submission received: 27 February 2019 / Revised: 13 March 2019 / Accepted: 17 March 2019 / Published: 25 March 2019
(This article belongs to the Special Issue Sustainability in Construction and Building Materials)

Abstract

:
Prefabricated building development increasingly requires foam concrete (FC) insulation panels with low dry density (ρd), low thermal conductivity coefficient (kc), and a certain compressive strength (fcu). Here, the foam properties of a composite foaming agent with different dilution ratios were studied first, high-belite sulphoaluminate cement (HBSC)-based FCs (HBFCs) with 16 groups of orthogonal mix proportions were subsequently fabricated by a pre-foaming method, and physical properties (ρd, fcu, and kc) of the cured HBFC were characterized in tandem with microstructures. The optimum mix ratios for ρd, fcu, and kc properties were obtained by the range analysis and variance analysis, and the final optimization verification and economic cost of HBFC was also carried out. Orthogonal results show that foam produced by the foaming agent at a dilution ratio of 1:30 can meet the requirements of foam properties for HBFC, with the 1 h bleeding volume, 1 h settling distance, foamability, and foam density being 65.1 ± 3.5 mL, 8.0 ± 0.4 mm, 27.9 ± 0.9 times, and 45.0 ± 1.4 kg/m3, respectively. The increase of fly ash (FA) and foam dosage can effectively reduce the kc of the cured HBFC, but also leads to the decrease of fcu due to the increase in mean pore size and the connected pore amount, and the decline of pore uniformity and pore wall strength. When the dosage of FA, water, foam, and the naphthalene-based superplasticizer of the binder is 20 wt%, 0.50, 16.5 wt%, and 0.6 wt%, the cured HBFC with ρd of 293.5 ± 4.9 kg/m3, fcu of 0.58 ± 0.02 MPa and kc of 0.09234 ± 0.00142 W/m·k is achieved. In addition, the cost of HBFC is only 39.5 $/m3, which is 5.2 $ lower than that of ordinary Portland cement (OPC)-based FC. If the surface of the optimized HBFC is further treated with water repellent, it will completely meet the requirements for a prefabricated ultra-light insulation panel.

1. Introduction

Since ‘sustainability’ was widely adopted as a key criterion for the assessment of construction materials and buildings [1,2,3], researchers around the world have realized the growing demand for lightweight, economical, easy-to-use, and environmentally sustainable building materials in the future [4,5,6,7,8]. Foam concrete (FC) products with low self-weight, high specific strength, and excellent thermal insulation performance become very attractive in the application of prefabricated building panels [7,9]. FC products can effectively reduce dead loads on the structure and foundation, contribute to energy conservation, and lower the labor cost during construction [10,11]. Nowadays, FC has been commonly used in construction applications in different countries such as Germany, UK, Philippines, Turkey, Thailand, and China [12,13].
FC is generally produced with cement, filler, water, and a liquid chemical under controlled conditions, and the liquid chemical can be diluted by water and aerated to foaming [14,15,16,17,18,19,20,21,22]. Although the dry density (ρd) and thermal conductivity coefficient (kc) of FC is lower than that of ordinary concrete, its insufficiency of high porosity, multiple connected pores, and low strength limits its widespread development. Recently, a lot of research has been done to further improve the performance of FC [23,24,25,26,27,28,29,30,31]. Kearsley and Wainwright found that replacing cement with a high content of fly ash (FA) could enhance the late strength of FC [26]. Khan et al. found that polypropylene fiber (PP) could increase the flexural strength (fb) and tensile strength (ft) of FC, but it had no effect on compressive strength (fcu), while basalt fiber could greatly increase fcu, fb, and ft of FC, which was better than PP [27]. Luo et al. reported that adding multi-walled carbon nanotubes (CNTs) to FC could improve pore structure and reduce average pore size [28]. Yakovlev et al. found that adding CNTs to FC could significantly increase its fcu and effectively improve its heat insulation [29]. Szelag introduced CNTs dispersion and sodium dodecyl sulfate (SDS) into the cement slurry and found that a large amount of foam was generated after fast stirring due to the foaming characteristics of SDS, which greatly reduced the density, and concluded that CNTs reinforced cement paste with SDS was expected to be used in the production of lightweight concrete [30]. Sun et al. explored the effects of a synthetic surfactant, plant surfactant, and animal glue/blood-based surfactant on the properties of FC and found that FC prepared by the synthetic surfactant had a higher fcu and smaller shrinkage [31].
From the findings of the above studies, the performance of FC is still does not meet the requirements for a prefabricated insulation wall. In addition, due to the slow setting feature of ordinary Portland cement (OPC), it is difficult to match the defoaming time of the foam [3,17], frequently resulting in the collapse of the FC. Moreover, the early-stage strength of FC prepared with OPC increases slowly, which is not conducive to its application in the prefabricated industry and affects the engineering efficiency [32]. Unlike sulphoaluminate cement (SAC), which uses a lot of expensive bauxite, high-belite sulphoaluminate cement (HBSC) can be mostly calcined by construction and industrial waste, which is consistent with the concept of sustainability [33,34,35,36,37,38,39]. HBSC has many advantages, such as fast setting, fast hardening, early strength, high strength, small expansion, low dry shrinkage, anti-freezing, anti-permeability, anti-corrosion, and so on [36]. Indeed, nowadays HBSC is widely used, allowing that HBSC-based FC (HBFC) has better thermal insulation performance than ordinary concrete and can be used for insulation panels to realize the energy-saving efficiency of buildings [20].
HBFC can be used to control the stability of bubbles in FC, and high strengths can be attained in the initial stages of curing. Therefore, the preparation of FC with HBSC is conducive to the optimization of properties.
There are two techniques that could be used in the FC process; the pre-foaming method and mix-foaming method [40,41,42,43]. The pre-foaming method is to make the foam before mixing it with slurry and, after mixing evenly, the FC slurry is poured into the mold to form an FC product. The mix-foaming method is to prepare a slurry containing a foaming agent first, then pre-cast the slurry and complete the foaming during incubation [36]. The fresh FC prepared by the pre-foaming method has good fluidity and can be pumped to a long distance, which meets the prefabricated process, while the mix-foaming method is generally not used for pumping and just for on-site pouring.
Orthogonal experiments can be used to effectively explore the relative importance of various factors on the performance of HBSC-based FC (HBFC). The optimum level of different factors can be determined by orthogonal arrays. The use of an orthogonal design can significantly reduce the cost and time of the experiment [44,45]. The mixture ratio of HBFC with stable and excellent properties can be selected more accurately by using an analysis of means (ANOM) and variances (ANOVA) [14,28,29].
Here, in order to seek the optimum mixture ratio of HBFCs meeting the performance requirements of modern prefabricated lightweight panels, mix proportions of 16 groups HBFCs were designed with an orthogonal experiment, and the HBFCs were fabricated by the pre-foaming method. The corresponding ρd, fcu, and kc were characterized and analyzed by ANOM and ANOVA, the optimization verification of the mix ratio and economic cost of HBFC were also evaluated.

2. Materials and Methods

2.1. Raw Materials

The HBSC, acquired from Polar Bear Building Material Co., Ltd. (Tangshan, China), was produced with solid waste. Grade-II fly ash (FA) was obtained from the Shandong Huadian power plant (Qingdao, China). The chemical composition and mineral composition of the HBSC clinker and the chemical composition of FA were characterized by X-ray powder diffraction (XRD, D8 Advance type, Bruker Corp., Leipzig, Germany) and an X-ray fluorescence spectrometer (XRF, XRF-1800 type, Shimadzu Corp., Kyoto, Japan), listed in Table 1 and Table 2. The composite foaming agent was bought from Guangzhou Haofeng chemical company (Guangzhou, China). The naphthalene-based superplasticizer (NSP) was bought from Shanghai Chenqi chemical company (Shanghai, China). The tap water was used.

2.2. Mix Proportion and Orthogonal Experimental Design

The dosage to binder of FA, water, foam, and the naphthalene-based superplasticizer (WFA, W/B, wFOAM, and wNSP) are the main parameters separately or jointly affecting the physical performances (ρd, fcu, and kc) of HBFC. The mix proportions of FCs were designed using an orthogonal experiment with four parameters wFA, W/B, wFOAM, and wNSP as the main factors. Sixteen different mixtures of HBFCs were prepared by varying (1) FA replacement for HBSC (wFA) from 0 to 20 wt% with a 5 wt% gradient, (2) water to binder ratio (W/B) from 0.40 to 0.55 with a 0.05 gradient, (3) foam fraction of binder (wFOAM) from 13.5 to 16.5 wt% with a 1 wt% gradient, (4) NSP fraction of binder (wNSP) from 0 to 1.0 wt% with a 0.2 wt% gradient.
The kc of FA is lower than cement, which can improve the thermal insulation of FC, and its pozzolanic effect can improve the long-term strength of FC. The superplasticizer can improve the workability of the fresh FC slurry, reduce the W/B, and eventually improve the fcu of FC. The amount of foam affects the ρd and fcu of the FC—the greater the wFOAM, the greater the pore volume and the lower the kc of the FC. Four levels were taken for each factor, as listed in Table 3 and Table 4 [28]. The ρd, fcu, and kc were used as evaluation indicators and the optimal mix ratio was finally achieved by the ANOM and ANOVA methods.

2.3. Preparation Procedures of HBFC

First, the HBSC, FA, and NSP were weighed according to the designed mix ratio and dry-mixed in a rotating mortar mixer (JJ-5 type, Wuxi, China) for 1 min. Then, the weighed water was added into the mixer to prepare the slurry. Meanwhile, the appropriate weight of foam was generated by a foam generator (BL168-8 type, Hefei Baile Energy Equipment Company, Hefei, China) and immediately added to the slurry mixture. The foam was mixed with the slurry and stirred for some time until there was no physical indication of the foam on the surface and all the foam was evenly distributed and incorporated into the mixture [36].
Fresh HBFC slurry was poured into six cubic molds with sizes of 100 × 100 × 100 mm3 and three prism molds with sizes of 300 mm × 300 mm × 60 mm. Unlike a normal concrete casting process, the HBFC slurry should not be subjected to any form of compaction or vibration. The specimens were cast in molds covered with plastic film to prevent moisture loss. Once demolded after 24 h, the specimens were kept in a standard curing room (temperature 22 ± 2 °C, relative humidity ≥95%) up to the day of testing. The schematic fabricating process of HBFC is shown in Figure 1.

3. Property Characterizations

3.1. Properties of Foam

Taking into consideration the cost of the foaming agent and its foaming performance, it was necessary to select an appropriate dilution ratio to configure the foaming agent solution, which was used to produce HBFC [35]. In this study, the above-mentioned composite foaming agent was used to conduct four tests with varied dilution ratios of 1:10, 1:20, 1:30, and 1:40, respectively, and its foam properties were tested using a foam performance measuring instrument (YJ-1 type, foam tester for FC, Tianjian Instrument Co., Ltd., Cangzhou, China), shown in Figure 2.
The foam properties were characterized in accordance with criterion JG/T 266-2011 (Beijing, China). The volume of the ⑤capacity cylinder is VF, and its mass was recorded as ma after being measured. The foam was directly sprayed into the ⑤capacity cylinder through the aspiration pipe of the foam generator. The excess foam on the top of the ⑤capacity cylinder was scrapped and the total mass of the foam and the ⑤capacity cylinder mb was weighed. The foam density (ρF) can be calculated by Equation (1) and the foamability can be calculated by Equation (2):
ρ F = m b m a V F
M = V F ( m b m a ) / ρ
where M is the foamability of the foam, VF is the volume of the foam, mb is the total mass of the foam and the capacity cylinder, ma is the mass of the foam, ρF is the foam density, and ρ is the density of the foaming agent solution.
After measuring the ρF and M, the capacity cylinder filled with foam was placed on top of the ①steel tray. After 1 h, the 1 h settling distance of foam in the ⑤capacity cylinder and 1 h bleeding volume of foam in the ⑦bleeding capacity bottle were recorded as Sv and Bv, respectively. The foam properties of each foam agent dilution ratio were measured 3 times.

3.2. Dry Density

The cubic specimens were weighed after they were dried at 55 ± 5 °C to constant weights within an oven drier (BG2-140 type, vacuum oven, Shanghai Boyi Equipment Factory, Shanghai, China), then the ρd of the specimen was calculated from the weight to volume ratio and three duplicates for each group were conducted.

3.3. Compressive Strength

Since the strengths of HBFC were relatively low, these cubic specimens were crushed using a microelectronic control testing machine (YAW-3000 type, Jinan Nusino Industrial Testing System Co., Ltd., Jinan, China) with 1.0 mm/min cross head speed and nearest 0.01 N precision [11], and three duplicates for each group were conducted. The fcu was acquired from Equation (3):
fcu = F/Ac
where fcu is the compressive strength of the HBFC specimen at 7 d age, F is the maximum failure load, and Ac is the initial pressure area of the test specimen.

3.4. Thermal Conductivity

The kc of the material is the heat transferred per unit of area and per unit of time when the temperature difference between the two sides is 1°C under stable heat transfer conditions. Here, the prism HBFC panels (300 mm × 300 mm × 60 mm) were dried at 55 ± 5 °C to a constant weight in order to eliminate the influence of moisture on kc then polished on both sides to achieve good contacts between specimens and hot (or cold) plates. An automatic double plane thermal conductivity tester (SSX-DR300 type, thermal conductivity measuring instrument, Beijing Sansixing Measurement and Control Technology Co., Ltd., Beijing, China) was employed to measure kc of HBFC. The HBFC specimen was placed between two plates, the temperatures of the hot and cold plates were set as 40 °C and 20 °C, and the heat flow rate was measured when the equilibrium condition was reached after about 3 h [36]. The temperature difference between hot and cold plates was controlled by a control unit [37]. Three duplicates for each group were examined, and the kc of the HBFC can be calculated by Equation (4):
k c = φ × d S × Δ T
where, kc is the thermal conductivity (W/m·k), φ is heat flow rate (J/s), d is average thickness of the specimen (m), S is average area of the specimen (m2), and ΔT is temperature difference between the hot and cold plates (°C).

3.5. Macroscopic and Microscopic Observation

The pore sizes, distributions, and pore structure in the macroscopic and microscopic scale of HBFC were observed by a digital camera (EOS 800D type, Canon (China), Beijing, China) and field emission scanning microscope (FEG-SEM, JSM 7500f type, Jeol, Tokyo, Japan), respectively.

4. Results

4.1. Foam Properties

The mean results and deviations of the foam properties of composite foam agents under different dilution ratios are revealed in Table 5. The basic requirements for the performance index of the foam agent can refer to criterion JG/T 266-2011 (Beijing, China), also shown in Table 5.
As shown in Table 5 and 
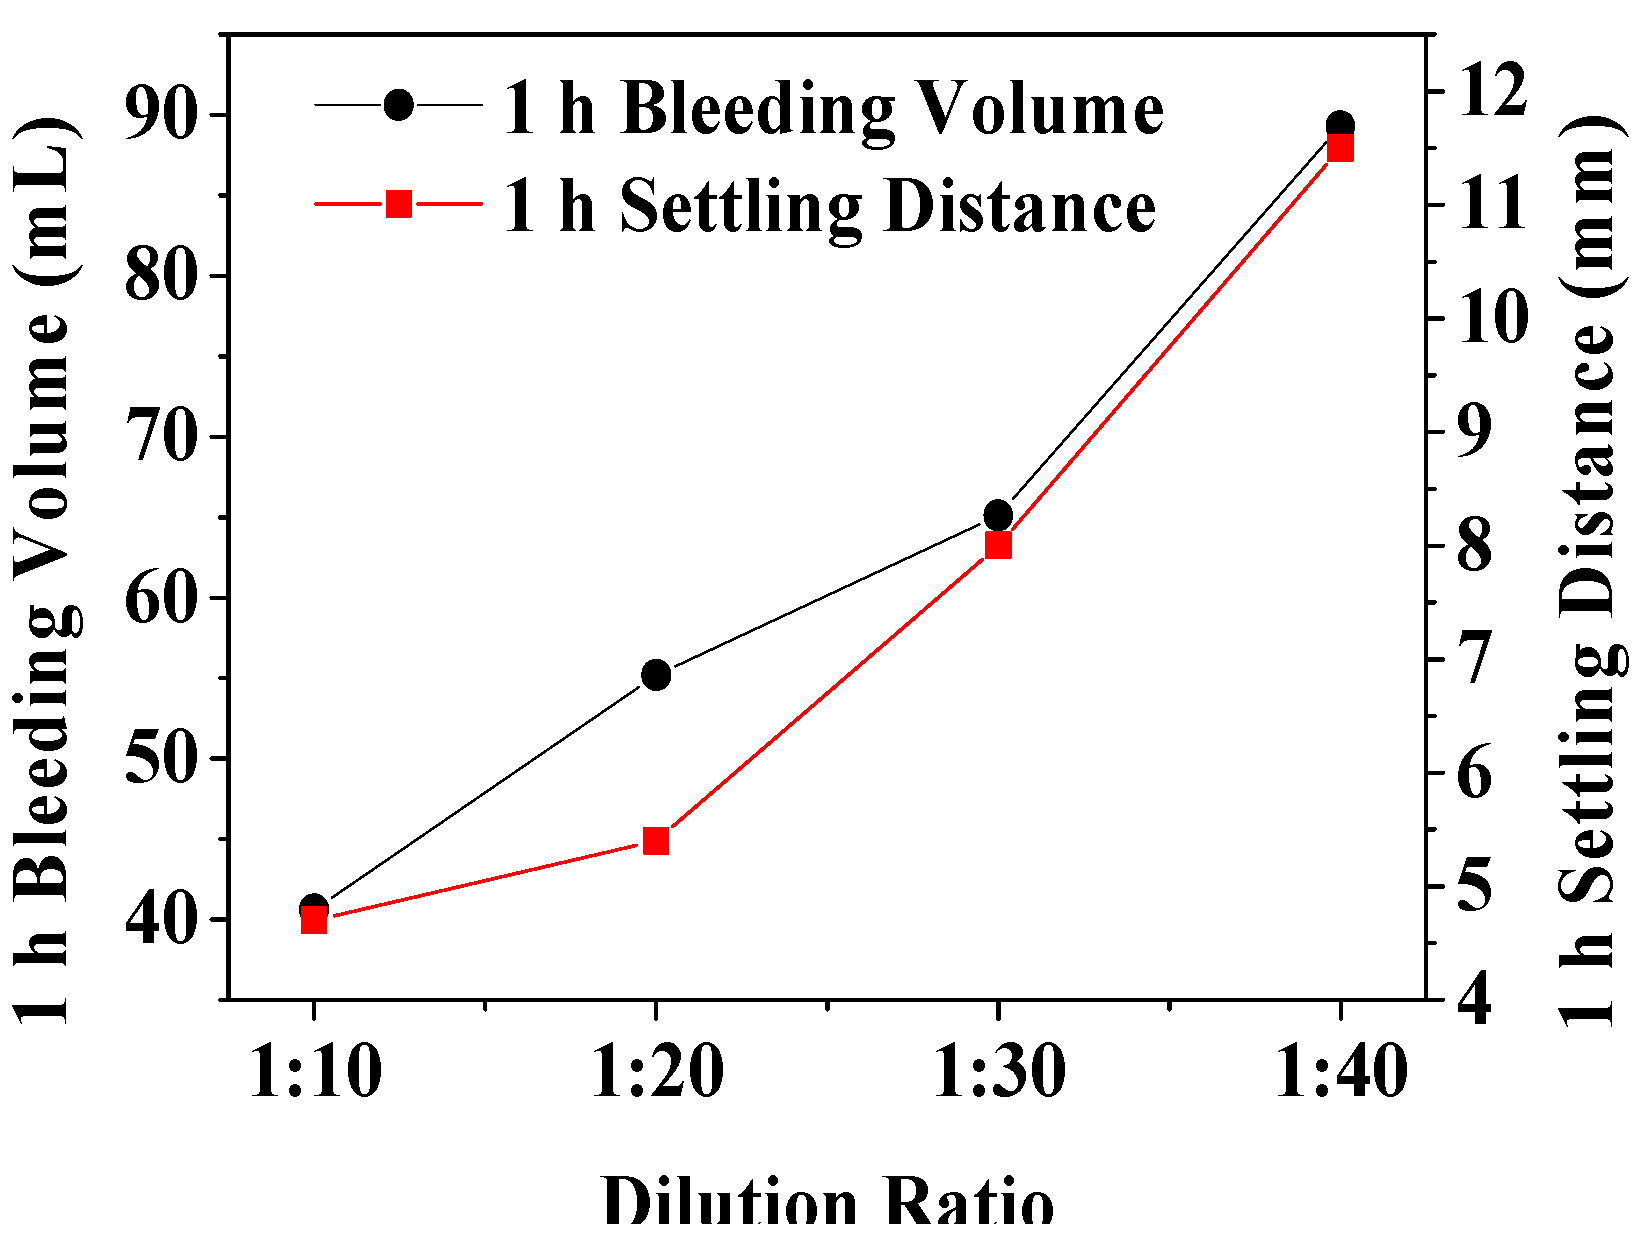
Figure 3, the 1 h bleeding volume and the 1 h settling distance were lowest (40.6 ± 2.1 mL and 4.7 ± 0.3 mm) and highest (89.3 ± 4.0 mL and 11.5 ± 0.6 mm) when the dilution ratio was 1:10 and 1:40, respectively. With the increase of dilution ratio, the 1 h bleeding volume and 1 h settling distance of the foam steadily increased, as shown in Figure 3. In fact, as the dilution ratio increased, the water content of the foam liquid membrane also increased and the tenacity of the liquid membrane decreased, cracking and bleeding were thus more likely to occur—resulting in defoaming [43].
Foamability was highest (35.1 ± 1.2 times) and lowest (23.7 ± 1.4 times)—and the foam density was the lowest (29.5 ± 0.9 kg/m3) and highest (49.1 ± 1.4 kg/m3)—when the dilution ratio was 1:10 and 1:40, respectively, as demonstrated in Table 5 and Figure 4. With the increase of dilution ratio, foamability gradually decreased and the foam density gradually increased, as shown in Figure 4. Indeed, as the dilution ratio increased, the concentration of the foam solution decreased, resulting in an increase in the surface tension of the liquid and a decrease in the foamability [44,45]. The water content in the foam liquid membrane increased and its density increased accordingly.
Thus, considering the cost and performance requirements of composite foam agents, the dilution ratio was selected at 1:30 to produce the foam for HBFC.

4.2. Physical Properties and Orthogonal Range Analysis

The mean results and deviations of the physical properties of 16 groups of HBFCs are revealed in Table 6. An ANOM of the orthogonal test and mix proportion optimization of HBFC are shown accordingly in Table 7.
From the physical properties and the corresponding ANOM shown in Table 6 and Table 7, the optimal mix proportion can be obtained with the primary and secondary factors wFOAM and wNSP, respectively. The optimal ratio to reach the lowest ρd is A2B1C4D1 with wFA, W/B, wFOAM, and wNSP as 10 wt%, 0.4, 16.5 wt%, and 0 wt%, respectively.
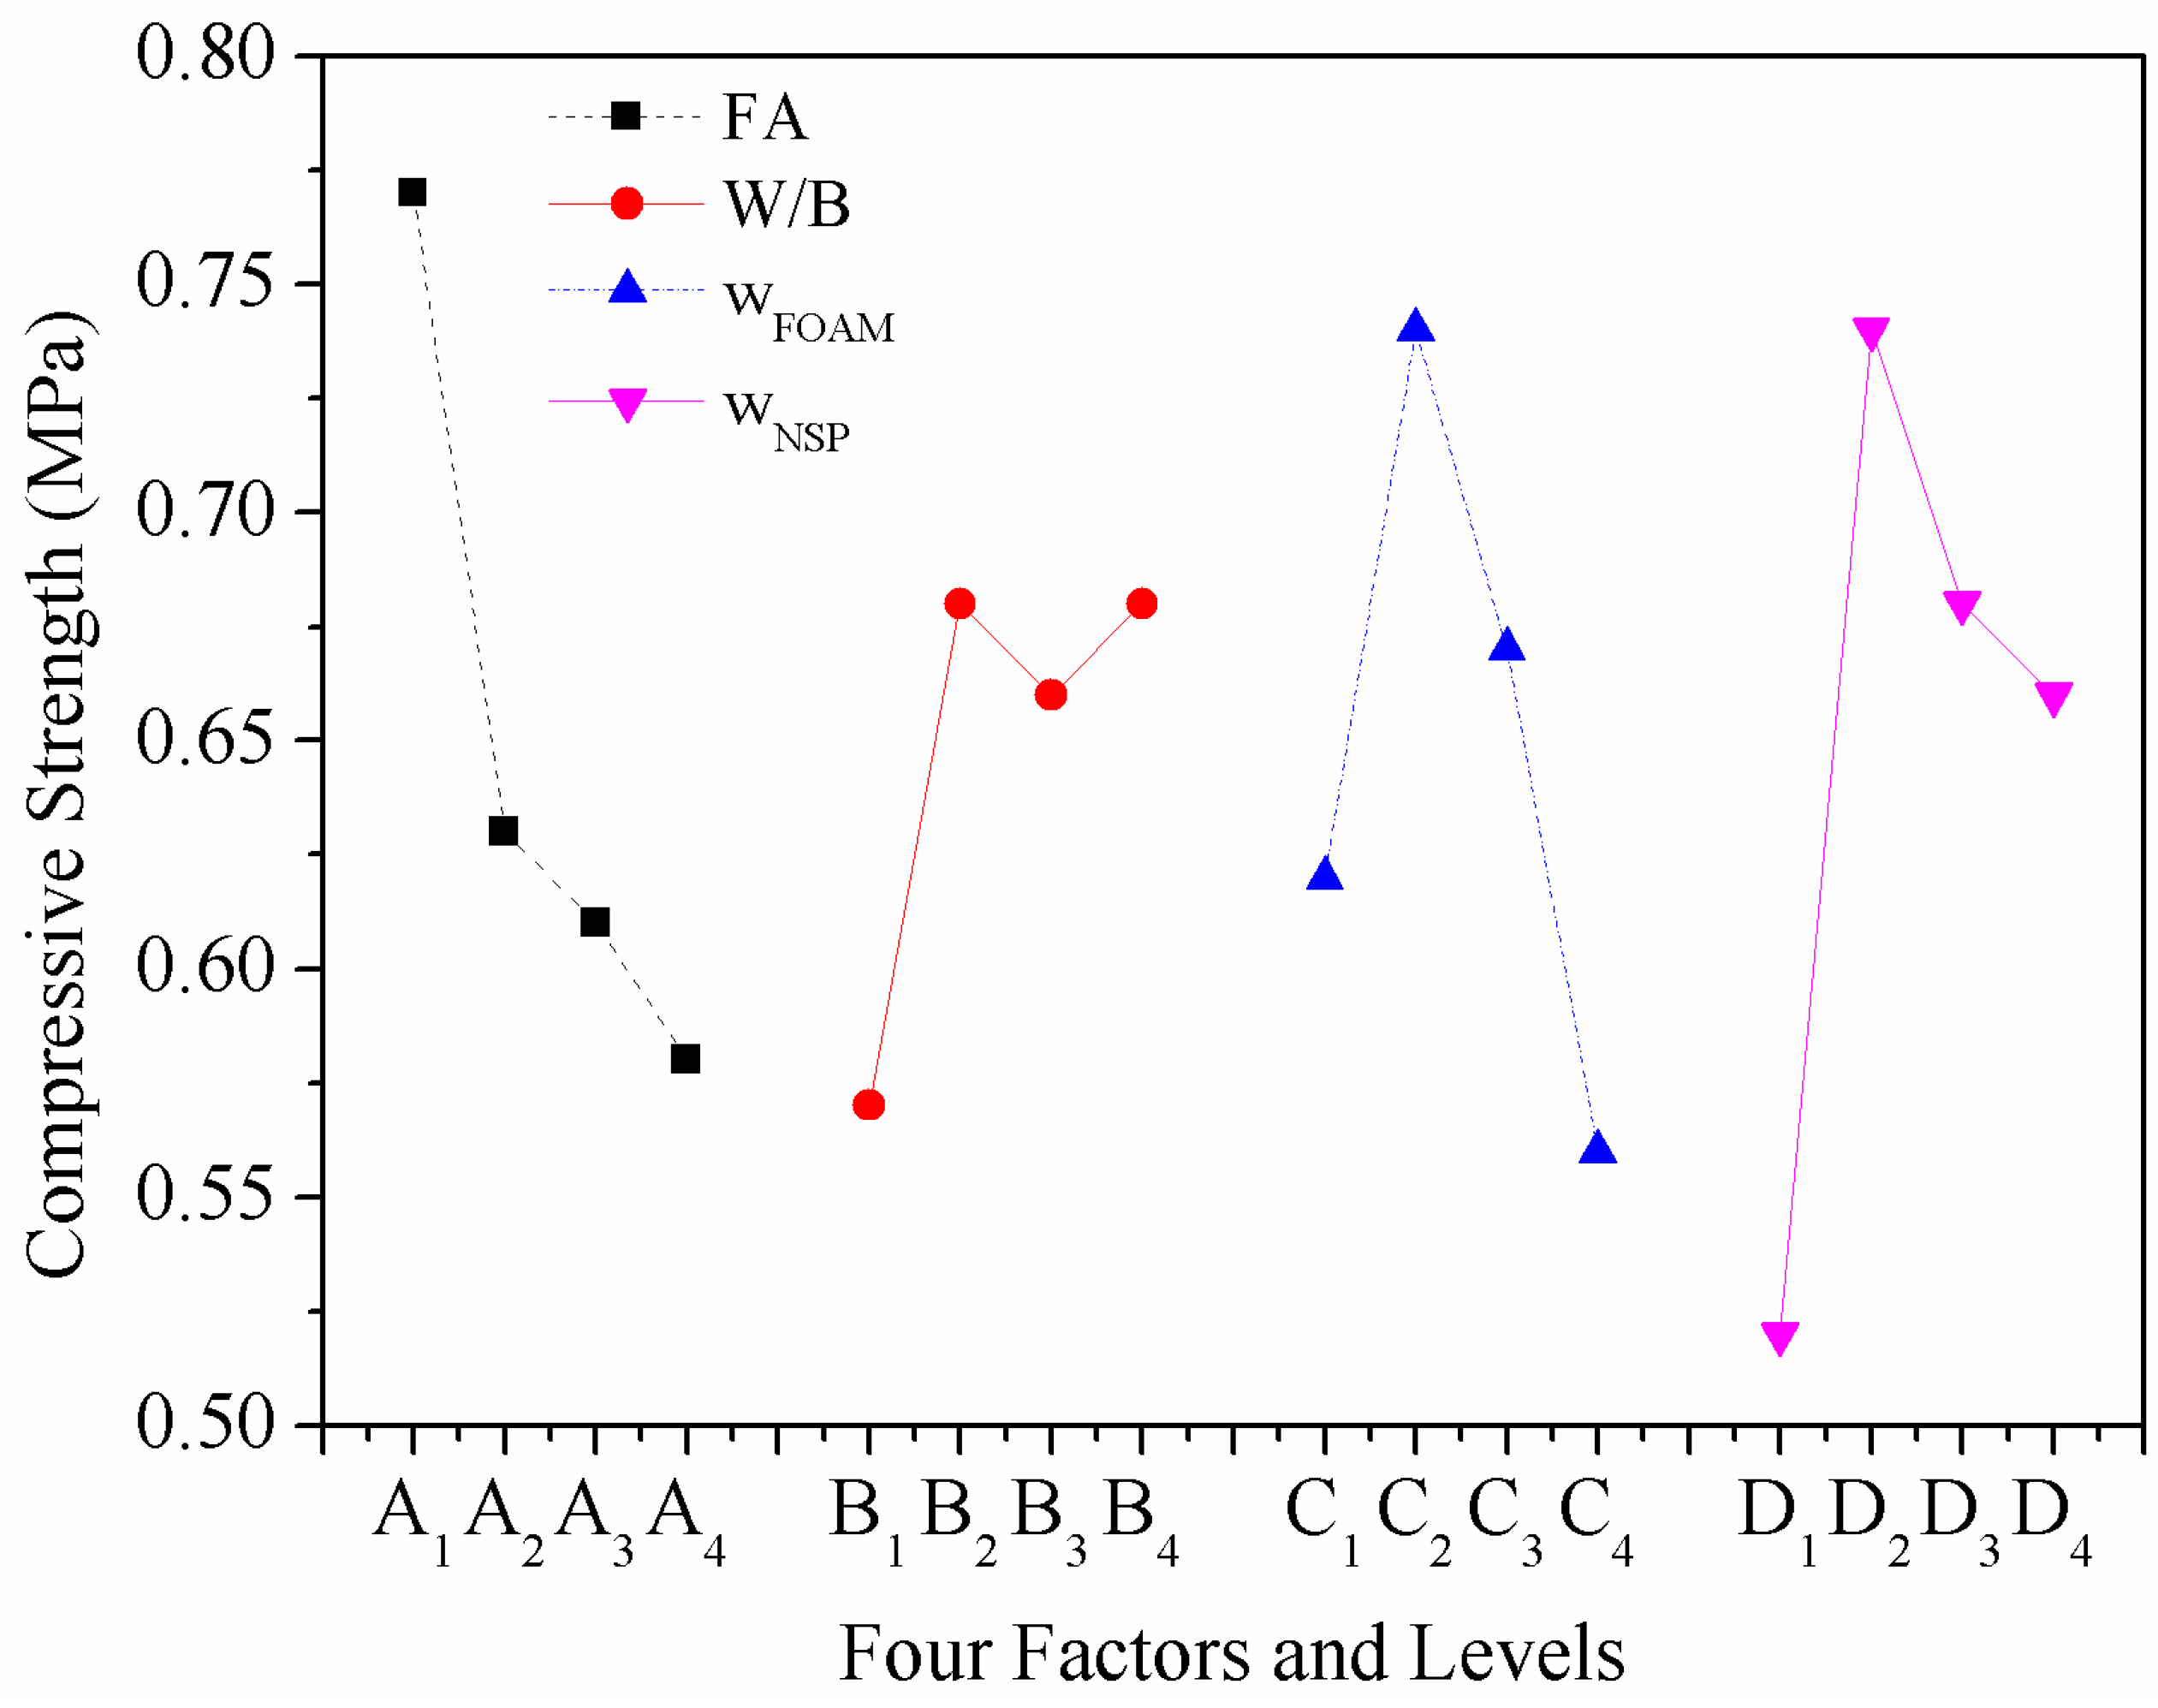
After ANOM calculations, the order of the factors affecting fcu is obtained, which can be ranked in order of importance as D > A > C > B. Finally, optimal mix proportion can be obtained at A1B2C2D2 with the value of four factors as 0 wt%, 0.45, 14.5 wt%, and 0.6 wt%, respectively.
From the ANOM, the optimal level of kc can be obtained, optimal mix proportion is A4B3C4D1 with wFA, W/B, wFOAM, and wNSP as 20 wt%, 0.5, 16.5 wt%, and 0 wt%, respectively, which can be ranked in order of importance as A > C > D > B.
Specific analysis on each indicator is further demonstrated as follows.

4.3. Effect of Various Factors on Dry Density

The relationship between ρd and four factors is shown in Figure 5. Even though the mix proportion of HBFC is designed based on the predetermined ρd value of 350 kg/m3, the minimum density can be obtained within this narrow density range. The HBFC has the lowest ρd when wFA is 10 wt% because the setting time of the binder just matches the foam stabilization time, which minimizes defoaming [40]. It can be seen from Figure 5 that ρd first increased and then decreased with the increase of W/B. With the increase of water, the bubble of the foam gradually tends to be saturated, and much of the foam with thin bubble walls will burst due to the unbearable pressure, resulting in a decrease in the amount of complete foam and an increase in ρd. When the water continues to increase however, the burst foam does not continue to increase as the bubbles have already saturated. Water’s participation in the hydration is certain, the extra water will only serve as free water to prop up part of the volume which can be evaporated after drying, thus ρd will be reduced. The ρd of HBFC also first increased and then decreased with wFOAM. Obviously, the foam made up most of the volume of HBFC, wFOAM was found to be the most influential factor on ρd, as revealed from the ANOM in Table 7.
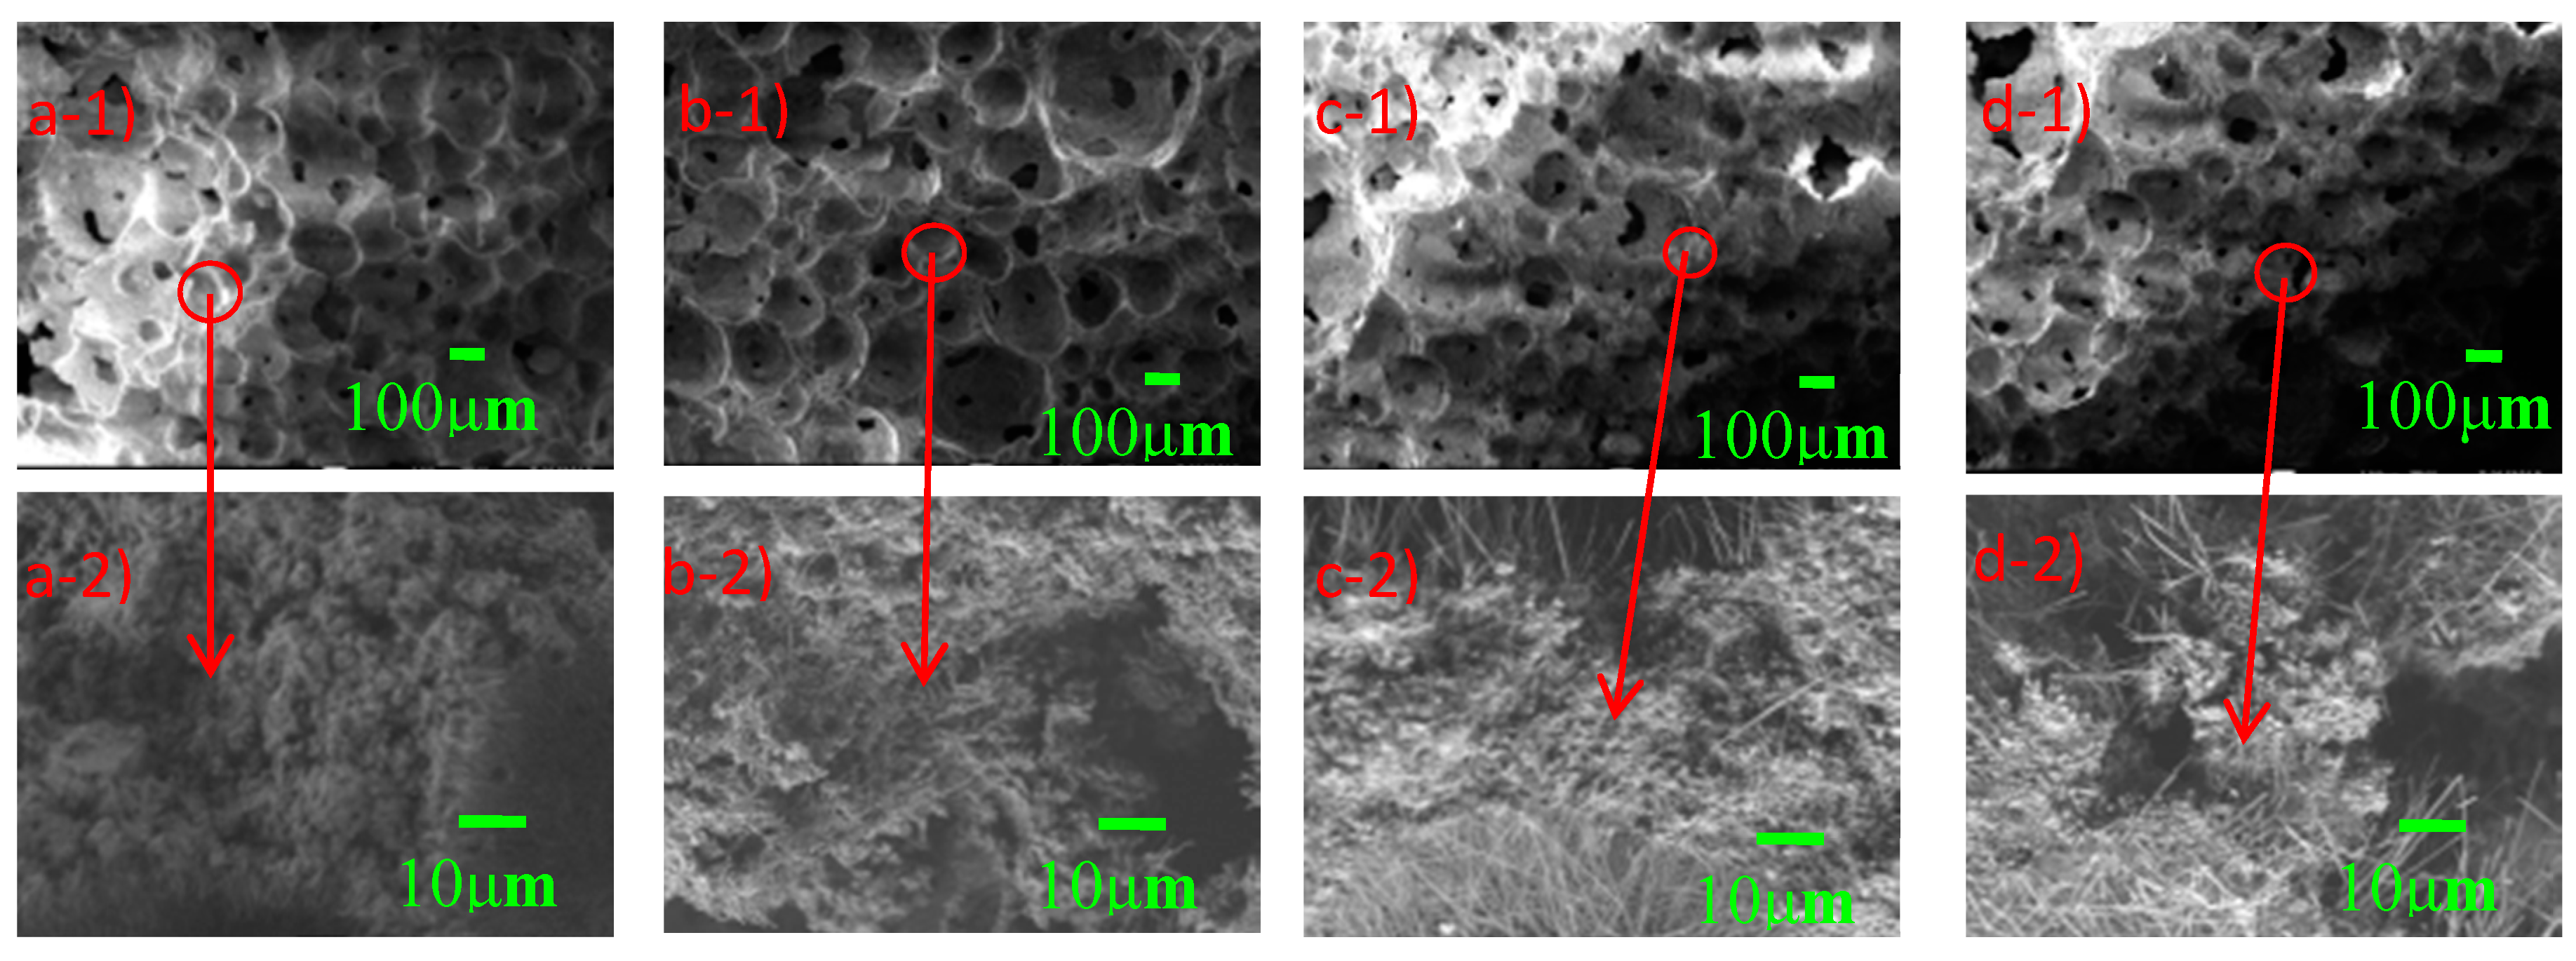
This phenomenon can be explained by the SEM images of microscopic pore structure in Figure 6. When the wFOAM was 14.5 wt%, the average pore size was smallest within 180 μm and the size distribution was uniform. When the wFOAM was 13.5 wt% and 15.5 wt%, the average pore size was 220 μm and 200 μm, respectively. When the wFOAM was 16.5 wt%, relatively large pores appeared within the largest one of 450 μm and pore sizes differed greatly. The average pore diameter of HBFC first increased and then decreased with the increase of wFOAM, which meant that the pore volume in HBFC first increased and then decreased, resulting in the fluctuating trend of ρd with wFOAM [37]. With the increase of wNSP, the ρd of HBFC shows a similar fluctuating trend as with wFOAM. As reported, appropriate wNSP can maintain good stability of the foam by improving slurry fluidity, but it will reduce the plastic viscosity of the slurry, resulting in broken air bubbles [37]. When wNSP was 0.6 wt%, only the plastic viscosity of the slurry was reduced, but the fluidity was not effectively improved, which caused a large number of broken bubbles and the ρd of HBFC eventually increased. However, the fluidity of the slurry improved and the slurry hardness decreased as wNSP continued to increase, resulting in a decrease in the amount of broken bubbles and a decrease in ρd.

4.4. Effect of Various Factors on Compressive Strength

As shown in Figure 7, the fcu decreased with the increase of wFA. The phenomenon is similar to that of ordinary concrete. The early strength of HBFC is mainly controlled by cement and the 7d strength of HBSC can reach about 90% of its final strength due to its fast hardening and early high strength properties [11].
Thus, the higher the content of HBSC in HBFC, the higher the fcu will be. This rule can also be explained by the microstructure of HBFC—when the binder is only HBSC, the pores of FC are almost closed, there are few connected pores, and the structure of the pore walls is very tight and ductile. With the wFA increase, the number of damaged connected pores tended to increase and the structure of the pore wall gradually became loose, as shown in Figure 8. Thus, fcu decreased as wFA increased.

4.5. Effect of Various Factors on Thermal Conductivity

Figure 9 presents the effect of four factors and levels on the kc of HBFC. Among the four factors, wFA has the most significant influence on kc, as shown in Table 7 and Figure 9. The kc shows a significant decline with the increase of wFA. There are two mechanisms on the kc reduction of FC by adding FA: (1) FA itself has lower kc than cement; (2) the FA dosage can make the pores in FC more uniform, which is helpful for reducing the kc [45]. It can be seen from Figure 8 that with the increase of wFA—although the connected holes increase and the pore diameter does not change too much—the pore wall becomes thinner, which makes the pores more compact and increases the porosity. Since the kc of air is lower than that of other building materials, the higher the porosity, the lower the kc is. Therefore, based on the above reasons, the kc of HBFC decreases with the increase of wFA. With the increase in wFOAM, the pore size first decreased and then increased, but the number of close pores when the wFOAM was 14.5 wt% was more than when the wFOAM was 13.5 wt%. Previous researches have reported that porosity accounts for the main volume of FC and that the quality of pores affects the thermal insulation, with larger pore volume and finer pores contributing to better insulation [34,36]. Therefore, in general, with the increase of wFOAM, the kc of HBFC gradually decreases with the increase of W/B and wNSP, and the kc of HBFC arrives to an inflection point, as shown in Figure 7. When the W/B is 0.5 and wNSP is 0.8%, a uniform and stable FC can be obtained, and the bubble can be distributed uniformly and retain stable to a maximum extent, rendering low kc.

4.6. Analysis of Variances Comprehensive Evaluation on the Optimal Ratio

In order to investigate which factor significantly affects the ρd, fcu, and kc values and select the optimal ratio of HBFC, the ANOVA were studied and the results shown in Table 8.
The number of levels (4) subtracted by 1 gave the degree of freedom (DOF). The sum of squares (SSi) is acquired by Equation (5) [25]:
S S i = 4 ( ( k 1 i k ) 2 + ( k 2 i k ) 2 + ( k 3 i k ) 2 + ( k 4 i k ) 2 ) ( i = A , B , C , D )
where SSi stands for the sum of squares and k stands for the 16 mean values. Sum of squares divided by the degree of freedom produced mean squares (Mi).
As demonstrated in Table 8, the minimum mean square (Mimin = 243.0) is chosen as error, other Mi divided by Mimin gives the variance ratios (VRi) of ρd. Here, because of 1.00 < 1.19 < 3.37 < 3.67 < F0.1(3,3) = 5.39, the effects of these four factors on ρd are not significant, and the order of importance is C > B > A > D.
As shown in Table 7 and Figure 5, the difference in ρd of HBFC under different factors and levels is little, but when factor A is at level 2, factor B is at level 1, factor C is at level 4, and factor D is at level 1, the minimum ρd can be obtained, which are 314.8 kg/m3, 308.0 kg/m3, 307.2 kg/m3, and 319.0 kg/m3, respectively.
Consequently, the optimum parameters for ρd are wFA at 10 wt%, W/B at 0.4, wFOAM at 16.5 wt%, and wNSP at 0 wt%. As for fcu, the minimum mean square (Mimin = 0.011) is chosen as the error, other Mi divided by Mimin gives the VRi of fcu. As 1.00 < 2.09 < 2.64 < 3.36 < F0.1(3,3) = 5.39, the effects of these four factors on fcu are also not significant, and the order of importance is D > A > C > B. From Table 7 & Figure 5, the optimum parameters for fcu can be obtained, which are wFA at 0 wt%, W/B at 0.45, wFOAM at 14.5 wt%, and wNSP at 0.6 wt%. The minimum mean square (Mimin = 4.89 × 10⁻⁵) is chosen as the error, other Mi divided by Mimin gives the VRi of kc. As 20.86 > F0.05(3,3) = 9.28 and 174.23 > F0.01(3,3) = 29.46, factor A is the most significant factor on kc, and factor C is more significant than factors B and D. Similarly, the optimum parameters for fcu can be obtained, which are wFA at 20 wt%, W/B at 0.5, wFOAM at 16.5 wt%, and wNSP at 0 wt%. The optimal solution based on each performance of HBFC is shown in Table 9.
It can be seen from the ANOVA in Table 8, the effect of wFA and wFOAM on the kc of HBFC is particularly significant. The order of importance of the three performance indictors is kc > fcu > ρd. A comprehensive evaluation will be used to seek the optimal proportion for simultaneously satisfying the properties of the three types.
Factor A: For factor A, the optimal levels to satisfy three performances are A2, A1, and A4, respectively, with no overlapping levels as shown in Table 9. The kc is more important than the other two properties. It can be seen from Table 7, the kc at A4 level is 0.11604 W/m·k, which is better than levels A1 and A2. FA is cheaper than cement and conforms to the concept of green environmental protection. Level A4 satisfies the requirements of ρd and fcu, which are 322.9 kg/m3 and 0.58 MPa, respectively, as shown in Table 7. After comprehensive consideration, level A4 (wFA = 20 wt%) will be selected.
Factor B: The kc of level B3 is 0.15581 W/m·k, which is better than levels B1 and B2. As shown in Table 7, the fcu of levels B2 and B3 are very similar, which are higher than level B1. And the ρd meet the requirements. Thus, level B3 (W/B = 0.5) is the optimal level.
Factor C: It can be seen from Table 9, there are two performance indicators inclined to level C4. The kc and ρd under level C4 condition are better than C2, and the fcu also meets the requirements. Therefore, level C4 (wFOAM = 16.5 wt%) will be selected as the optimal level after comprehensive assessment.
Factor D: As shown in Table 9, there are two performance indicators inclined to level D1. But the fcu of level D2 is 0.74 MPa, which is higher than level D1 whose fcu is 0.52 MPa, and the kc of levels D1 and D2 is almost equal. The ρd under level D3 also meets the requirement. Hereby, level D2 (wNSP = 0.6 wt%) is selected as the optimal level.
After comprehensive assessment, the optimal proportion of HBFC is ultimately chosen as A4B3C4D2. The verification test demonstrates that, the kc, fcu, and ρd are 0.09234 ± 0.00142 W/m·k, 0.58 ± 0.02 MPa, and 293.5 ± 4.9 kg/m3, respectively, which effectively meet the requirements of ultra-light thermal insulation panels.

4.7. Cost and Scalability of HBFC

The raw materials for preparation of HBFC are HBSC, grade-II FA, a composite foaming agent, water, and NSP, and their market prices are 111.7 $/ton, 14.9 $/ton, 1,489.4 $/ton, 0.5 $/ton, and 4,468.3 $/ton. The production of 1 m3 HBFC that meets the performance criteria requires 200 kg of HBSC cement, 50 kg of grade-II FA, 6.5 kg of composite foaming agent, 80 kg of water, and 1.5 kg of NSP, and the total cost is about 39.54 $/1m3. As far as we know, the key to make ultra-light FC is to achieve the matching of binder condensation and foam defoaming. If OPC and FA are used to make FC that meets the above requirements for fcu and ρd, it is necessary to add an appropriate amount of accelerator and foam stabilizer, with the common-used fractions as 0.3 wt% and 0.6 wt% of the binder. The price of the OPC, accelerator, and foam stabilizer are 74.5 $/ton, 29,788.5 $/ton, and 4,468.3 $/ton, respectively. The total cost of 1 m3 OPC-based FC that meets the properties is about 44.7 $/m3.
Therefore, both in terms of physical properties and cost, the HBFC has superior advantages and cost-effectiveness than of OPC-based FC, and the pre-foaming method in this study is also helpful to scalability preparation of HBFC.

5. Conclusions

The 1h bleeding volume and 1 h settling distance of the foam increase with the dilution ratio of the foam. The foamability gradually decreases and the foam density gradually increases with the increase of dilution ratio. When the dilution ratio is higher than 1:30, the foam properties can meet the requirements. When the dilution ratio is 1:10, the foam stability is best, with 1 h bleeding volume and 1 h settling distance of the foam as 40.6 ± 2.1 mL and 4.7 ± 0.3 mm, respectively.
The ρd shows no regular trend with the change of four factors. In the mixing and curing process, the less the foam is broken, the higher the porosity of HBFC, and the lower the ρd of HBFC. In 16 groups of HBFCs, the minimum ρd is 294.4 ± 5.6 kg/m3. In general, the higher the ρd, the higher the fcu of HBFC. When the pore size of HBFC is small, the pore wall is thick, the connected pores are few, and the pore wall structure is strong, the fcu of HBFC is more favorable. The highest fcu can reach 1.05 ± 0.12 MPa. With the increase of wFA and wFOAM, the porosity of HBFC can be improved, thus significantly reducing the kc of HBFC. The lowest kc in 16 groups can reach 0.09385 ± 0.00117 W/m·k.
From ANOM and ANOVA, the order of the factors affecting the ρd, fcu, and kc can be ranked in order of importance as C > B > A > D (W/B > wFOAM > wFA > wNSP, D > A > C > B, and A > C > D > B, respectively. Optimal mix proportion of ρd, fcu, and kc of HBFC based on orthogonal experimental are A2B1C4D1, A1B2C2D2, and A4B3C4D1, respectively.
With the increase in wFOAM, the micropore size increases and the uniformity deteriorates. When the wFOAM is 16.5 wt%, the largest pore diameter can reach 450 μm, which undoubtedly improves the porosity of HBFC and is beneficial to reduce the ρd and kc of HBFC. With the increase of wFA, the number of connected pores increases and the pore structures become looser, which is bad for the fcu.
Through comprehensive assessment, the optimal mix ratio of HBFC is A4B3C4D2. The kc, fcu, and ρd are 0.09234 ± 0.00142 W/m·k, 0.58 ± 0.02 MPa, and 293.5 ± 4.9 kg/m3, respectively, and the corresponding cost of HBFC is about 39.5 $/m3.
Future studies will focus on surface water repellent treatment of HBFC, to achieve lower kc, and effectively meet the thermal insulation requirements of prefabricated ultra-light building panels.

Author Contributions

Methodology, formal analysis, data curation, and writing—original draft, C.L.; conceptualization, supervision, and writing—review and editing, J.L.; visualization and funding acquisition, Q.L.; validation, S.G.; resources, Z.J.; software, S.L.; project administration, P.Z.; investigation, S.C.

Funding

This research was funded by grants from National Natural Science Foundation of China (No. 51878364, 51578297, and 51878366), Natural Science Foundation of Shandong Province (No. ZR2018MEE043 and ZR2017ZC0737), Qingdao Municipal Government Procurement Project (No. 402019201700013), and the National“111” project.

Acknowledgments

This research was funded by grants from National Natural Science Foundation of China (No. 51878364, 51578297, and 51878366), Natural Science Foundation of Shandong Province (No. ZR2018MEE043 and ZR2017ZC0737), Qingdao Municipal Government Procurement Project (No. 402019201700013), and the National“111” project.

Conflicts of Interest

The authors declare no conflict of interest.

Abbreviations

The following abbreviations are used in this manuscript:
FCFoam concrete
HBSCHigh-belite sulphoaluminate cement
HBFCHBSC-based FC
OPCOrdinary Portland cement
FAFly ash
PPPolypropylene fiber
CNTCarbon nanotube
SDSSodium dodecyl sulfate
SACSulphoaluminate cement
ANOMAnalysis of means
ANOVAAnalysis of variances
NSPNaphthalene-based superplasticizer
W/BWater-binder ratio
DOFDegree of freedom
VRVariance ratio

References

  1. Hung, M.K.; Johnson, A.U.; Zamin, J.M. Bond properties of lightweight concrete—A review. Constr. Build. Mater. 2016, 112, 478–496. [Google Scholar]
  2. Ma, C.; Chen, B. Properties of foamed concrete containing water repellents. Constr. Build. Mater. 2016, 124, 106–114. [Google Scholar] [CrossRef]
  3. Huang, Z.; Zhang, T.; Wen, Z. Proportioning and characterization of Portland cement-based ultra-lightweight foam concretes. Constr. Build. Mater. 2015, 79, 390–396. [Google Scholar] [CrossRef]
  4. Jones, M.R.; Mc Carthy, A. Preliminary views on the potential of foamed concrete as a structural material. Mag. Concr. Res. 2005, 57, 21–31. [Google Scholar] [CrossRef]
  5. Chen, B.; Liu, J.Y. Properties of lightweight expanded polystyrene concrete reinforced with steel fiber. Cem. Concr. Res. 2004, 34, 1259–1263. [Google Scholar] [CrossRef]
  6. Ali, S.A.; Juan, T.V.; Thomas, N.R.; Charles, C.G. Effects of expanded polystyrene (EPS) particles on fire resistance, thermal conductivity and compressive strength of foamed concrete. Constr. Build. Mater. 2016, 112, 716–724. [Google Scholar]
  7. Chen, B.; Zhen, W. Experimental research on properties of high-strength foamed concrete. J. Mater. Civil Eng. 2012, 32, 240–246. [Google Scholar]
  8. Zhang, P.; Hou, D.S.; Liu, Q.; Liu, Z.L.; Yu, J. Water and chloride ions migration in porous cementitious materials: An experimental and molecular dynamics investigation. Cem. Concr. Res. 2017, 102, 161–174. [Google Scholar] [CrossRef]
  9. Ma, C.; Chen, B. Properties of a foamed concrete with soil as filler. Constr. Build. Mater. 2015, 76, 61–69. [Google Scholar]
  10. Tikalsky, P.J.; Pospisil, J.; MacDonald, W. A method for assessment of the freeze–thaw resistance of preformed foam cellular concrete. Cem. Concr. Res. 2004, 34, 889–893. [Google Scholar] [CrossRef]
  11. Kunhanandan Nambiar, E.K.; Ramamurthy, K. Influence of filler type on the properties of foam concrete. Cem. Concr. Compos. 2006, 28, 475–480. [Google Scholar] [CrossRef]
  12. Weigler, H.; Karl, S. Structural lightweight aggregate concrete with reduced density-lightweight aggregate foamed concrete. Int. J. Cem. Compos. Lightweight. Concr. 1980, 2, 101–104. [Google Scholar] [CrossRef]
  13. Mydin, M.A.O.; Wang, Y.C. Structural performance of lightweight steel-foamed concrete–steel composite walling system under compression. J. Steel. Constr. 2011, 49, 66–76. [Google Scholar]
  14. Luo, J.L.; Hou, D.S.; Li, Q.Y.; Wu, C.F.; Zhang, C.W. Comprehensive performances of carbon nanotube reinforced foam concrete with ethyl silicate impregnation. Constr. Build. Mater. 2017, 131, 512–516. [Google Scholar] [CrossRef]
  15. Kearsley, E.P.; Wainwright, P.J. The effect of high fly ash content on the compressive strength of foamed concrete. Cem. Concr. Res. 2001, 31, 105–112. [Google Scholar] [CrossRef]
  16. Berry, E.E.; Hemmings, R.T.; Zhang, M.H.; Cornelius, B.J.; Golden, D.M. Hydration in high-volume fly ash concrete binders. ACI Mater. J. 1994, 91, 382–389. [Google Scholar]
  17. Ramamurthy, K.; Kunhanandan Nambiar, E.K.; Indu Siva Ranjani, G. A classification of studies on properties of foam concrete. Cem. Concr. Compos. 2009, 31, 388–396. [Google Scholar] [CrossRef]
  18. Stuart, K.D.; Anderson, D.A.; Cady, P.D. Compressive strength studies on Portland cement mortars containing fly ash and superplasticizers. Cem. Concr. Res. 1980, 10, 823–832. [Google Scholar] [CrossRef]
  19. Wang, Y.; Cao, Y.; Zhang, P.; Ma, Y.; Zhao, T.; Wang, H.; Zhang, Z. Water absorption and chloride diffusivity of concrete under coupling effect of uniaxial compressive load and freeze-thaw cycles. Constr. Build. Mater. 2019, 209, 566–576. [Google Scholar] [CrossRef]
  20. Jasinski, R.; Drobiec, L.; Mazur, W. Validation of selected non-destructive methods for determining the compressive strength of masonry units made of autoclaved aerated concrete. Materials 2019, 12, 389. [Google Scholar] [CrossRef]
  21. Lee, H.S.; Ismail, M.A.; Woo, Y.J.; Min, T.B.; Choi, H.K. Fundamental study on the development of structural lightweight concrete by using normal coarse aggregate and foaming agent. Materials 2014, 7, 4536–4554. [Google Scholar] [CrossRef] [PubMed]
  22. Lai, Z.Y.; Hu, Y.; Fu, X.J.; Lu, Z.Y.; Lv, S.Z. Preparation of porous materials by magnesium phosphate cement with high permeability. Adv. Mater. Sci. Eng. 2018, 12, 5910560. [Google Scholar]
  23. Amran, Y.H.M.; Farzadnia, N.; Ali, A.A.A. Properties and applications of foamed concrete—A review. Constr. Build. Mater. 2015, 101, 990–1005. [Google Scholar] [CrossRef]
  24. Karl, S.; Woerner, J.D. Foamed Concrete-Mixing and Workability, Workability of Special Fresh Concretes; Chapman and Hall: London, UK, 1994; p. 217. [Google Scholar]
  25. Zulkarnain, F.; Ramli, M. Durability of performance foamed concrete mix design with silica fume for housing development. J. Mater. Sci. Eng. 2011, 5, 518–527. [Google Scholar]
  26. Kearsley, E.P.; Wainwright, P.J. The effect of porosity on the strength of foamed concrete. Cem. Concr. Res. 2002, 32, 233–239. [Google Scholar] [CrossRef]
  27. Khan, M.I. Experimental Investigation on Mechanical Characterization of Fiber Reinforced Foamed Concrete. Master’s Thesis, University of Akron, Akron, OH, USA, 2014. [Google Scholar]
  28. Luo, J.L.; Li, Q.Y.; Zhao, T.J.; Gao, S.; Sun, S.W.; Chen, L. Thermal and electrical resistances of carbon nanotube-reinforced foamed concrete. Nanosci. Nanotech. Lett. 2014, 6, 72–79. [Google Scholar] [CrossRef]
  29. Yakovlev, G.; Keriene, J.; Gailius, A.; Girniene, I. Cement based foam concrete reinforced by carbon nanotubes. Mater. Sci. 2006, 12, 147–151. [Google Scholar]
  30. Szelag, M. Mechano-physical properties and microstructure of carbon nanotube reinforced cement paste after thermal load. Nanomaterials 2017, 7, 267. [Google Scholar] [CrossRef]
  31. Sun, C.; Zhu, Y.; Guo, J.; Zhang, Y.M.; Sun, G.X. Effects of foaming agent type on the workability, drying shrinkage, frost resistance and pore distribution of foamed concrete. Constr. Build. Mater. 2018, 186, 833–839. [Google Scholar] [CrossRef]
  32. Sugama, T.; Brothers, L.E.; Putte, T.R.V.D. Air-foamed calcium aluminate phosphate cement for geothermal wells. Cem. Concr. Compos. 2005, 27, 758–768. [Google Scholar] [CrossRef]
  33. Lim, S.K.; Tan, C.S.; Li, B.; Ling, T.C.; Hoaaain, M.U.; Poon, C.S. Utilizing high volumes quarry wastes in the production of lightweight foamed concrete. Constr. Build. Mater. 2017, 151, 441–448. [Google Scholar] [CrossRef]
  34. Mounanga, P.; Gbongbon, W.; Poullain, P.; Turcry, P. Proportioning and characterization of lightweight concrete mixtures made with rigid polyurethane foam wastes. Cem. Concr. Compos. 2008, 30, 806–814. [Google Scholar] [CrossRef]
  35. Zhang, B.Y.; Poon, C.S. Use of furnace bottom ash for producing lightweight aggregate concrete with thermal insulation properties. J. Clean. Prod. 2015, 99, 94–100. [Google Scholar] [CrossRef]
  36. Zhang, Z.H.; Provia, J.L.; Reid, A.; Wang, H. Mechanical, thermal insulation, thermal resistance and acoustic absorption properties of geopolymer foam concrete. Cem. Concr. Compos. 2015, 62, 97–105. [Google Scholar] [CrossRef] [Green Version]
  37. Jiang, J.; Lu, Z.Y.; Niu, Y.H.; Li, J.; Zhang, Y.P. Study on the preparation and properties of high-porosity foamed concretes based on ordinary Portland cement. Mater. Des. 2016, 92, 949–959. [Google Scholar] [CrossRef]
  38. Li, M.; Wu, Z. Orthogonal experimental study on the aerated concrete basing on the compressive strength. Cem. Wapno Beton 2011, 16, 115–119. [Google Scholar]
  39. Li, Y.; Chen, B. New type of super-lightweight magnesium phosphate cement foamed concrete. J. Mater. Civ. Eng. 2015, 27, 04014112. [Google Scholar]
  40. Luo, J.L.; Zhu, G.X.; Zhang, F.F.; Li, Q.Y.; Zhao, T.J.; Zhu, X.Q. Orthogonal experimentation for optimization of TiO2 nanoparticles hydrothermal synthesis and photocatalytic property of TiO2/concrete composite. RSC Adv. 2015, 5, 6071–6078. [Google Scholar] [CrossRef]
  41. Wu, X.; Leung, D.Y.C. Optimization of biodiesel production from camelina oil using orthogonal experiment. Appl. Energ. 2011, 88, 3615–3624. [Google Scholar] [CrossRef]
  42. Martin, A.; Grolle, K.; Bosh, M. Network foaming properties of various proteins adsorbed at the air/water interface in relation to foam stability. Colloid Interface Sci. 2002, 254, 175–183. [Google Scholar] [CrossRef]
  43. Kramer, C.; Schauerte, M.; Kowald, T.L.; Trettin, R.H.F. Three-phase-foams for foam concrete application. Mater. Charact. 2015, 102, 173–179. [Google Scholar] [CrossRef]
  44. Tarameshloo, A.; Kani, E.N.; Allahverdi, A. Performance evaluation of foaming agents in cellular concrete based on foamed alkali-activated slag. Can. J. Civ. Eng. 2017, 44, 893–898. [Google Scholar] [CrossRef]
  45. Lazniewska-Piekarczyk, B.; Szwabowski, J. The Influence of the type of anti-foaming admixture and superplasticizer on the properties of self-compacting mortar and concrete. J. Civ. Eng. Manag. 2012, 18, 408–415. [Google Scholar] [CrossRef]
Figure 1. Schematic preparing process of HBFC.
Materials 12 00984 g001
Figure 2. A foam tester for FC: , Steel tray; , long scale tube; , catheter clip; , base; , capacity cylinder (enlarged green square); , support bar; , bleeding capacity bottle; , aluminum plate.
Materials 12 00984 g002
Figure 3. The relationship between 1 h bleeding volume, 1 h settling distance, and dilution ratio.
Materials 12 00984 g003
Figure 4. The relationship between foamability, foam density, and dilution ratio.
Materials 12 00984 g004
Figure 5. The influence of four factors on the dry density of HBFC.
Materials 12 00984 g005
Figure 6. Pore size and naked surface images of HBFC under different wFOAM observed by SEM and digital camera: (a) 13.5 wt%, (b) 14.5 wt%, (c) 15.5 wt%, and (d) 16.5 wt%.
Materials 12 00984 g006
Figure 7. The influence of four factors on the compressive strength of HBFC.
Materials 12 00984 g007
Figure 8. SEM morphology of pore wall structures of HBFC with different wFA: (a) 0 wt%, (b) 10 wt%, (c) 15 wt%, and (d) 20 wt%.
Materials 12 00984 g008
Figure 9. The influence of four factors on the thermal conductivity coefficient of HBFC.
Materials 12 00984 g009
Table 1. Chemical compositions and mineral compositions of HBSC.
Chemical CompositionCaOSiO2Al2O3Fe2O3MgOSO3TiO2SumLoss
51.5413.8015.341.522.0814.210.7199.580.38
Mineral Composition C 4 A 3 S ¯ C2Sf-CaSO4C4AFf-CaOCT
29.3538.0613.645.081.841.11
Table 2. Chemical compositions of grade-II FA.
IngredientSiO2Al2O3Fe2O3CaOMgOSO3Na2OK2OLoss
FA54.9125.826.918.742.050.610.320.100.54
Table 3. Factors and levels on preparation of HBFC.
FactorA wFA (wt%)B W/BC wFOAM (wt%)D wNSP (wt%)
Level
100.4013.50
2100.4514.50.6
3150.5015.50.8
4200.5516.51.0
Table 4. L16(44) Orthogonal experimental array on mix proportion of HBFC.
FactorA_wFA (wt%)B_W/BC_wFOAM (wt%)D_wNSP (wt%)
Item No.
d10 (1)0.40 (1)13.5 (1)0% (1)
d20 (1)0.45 (2)14.5 (2)0.6% (2)
d30 (1)0.50 (3)15.5 (3)0.8% (3)
d40 (1)0.55 (4)16.5 (4)1% (4)
d510 (2)0.40 (1)14.5 (2)0.8% (3)
d610 (2)0.45 (2)13.5 (1)1% (4)
d710 (2)0.50 (3)16.5 (4)0% (1)
d810 (2)0.55 (4)15.5 (3)0.6% (2)
d915 (3)0.40 (1)15.5 (3)1% (4)
d1015 (3)0.45 (2)16.5 (4)0.8% (3)
d1115 (3)0.50 (3)13.5 (1)0.6% (2)
d1215 (3)0.55 (4)14.5 (2)0% (1)
d1320 (4)0.40 (1)16.5 (4)0.6% (2)
d1420 (4)0.45 (2)15.5 (3)0% (1)
d1520 (4)0.50 (3)14.5 (2)1% (4)
d1620 (4)0.55 (4)13.5 (1)0.8% (3)
Table 5. Foam properties of composite foam agents under different dilution ratios.
Dilution RatioBv (mL)Sv (mm)MρF (kg/m3)
1:1040.6 ± 2.14.7 ± 0.335.1 ± 1.229.5 ± 0.9
1:2055.2 ± 2.85.4 ± 0.329.0 ± 1.636.7 ± 1.1
1:3065.1 ± 3.58.0 ± 0.427.9 ± 0.945.0 ± 1.4
1:4089.3 ± 4.011.5 ± 0.623.7 ± 1.449.1 ± 1.4
JG/T 266-2011<80<10 > 20-
Table 6. Physical performances of HBFC based on the orthogonal test.
Item No.ρd (kg/m3)fcu (MPa)kc (W/m·k)
d1307.3 ± 3.50.49 ± 0.040.22368 ± 0.00121
d2387.0 ± 4.91.05 ± 0.120.21544 ± 0.00098
d3341.0 ± 5.00.82 ± 0.090.21098 ± 0.00144
d4294.4 ± 5.60.73 ± 0.090.18131 ± 0.00109
d5305.7 ± 4.80.67 ± 0.050.19903 ± 0.00209
d6325.5 ± 7.00.63 ± 0.020.21098 ± 0.00087
d7306.8 ± 3.30.47 ± 0.020.15835 ± 0.00174
d8321.2 ± 4.00.73 ± 0.040.18920 ± 0.00113
d9321.0 ± 2.90.62 ± 0.060.13561 ± 0.00103
d10329.7 ± 3.90.54 ± 0.010.11446 ± 0.00144
d11339.2 ± 6.50.69 ± 0.040.12552 ± 0.00069
d12339.9 ± 7.00.59 ± 0.020.12001 ± 0.00144
d13298.0 ± 4.10.50 ± 0.020.09385 ± 0.00117
d14322.0 ± 3.30.51 ± 0.020.10492 ± 0.00069
d15342.5 ± 4.40.65 ± 0.060.12837 ± 0.00095
d16329.1 ± 6.60.67 ± 0.040.13703 ± 0.00126
Table 7. ANOM of the orthogonal test and optimization of the mix proportion of HBFC.
IndexFactorABCD
ρd (kg/m3)k1332.4308.0325.3319.0Optimal mix proportion:
A2B1C4D1
k2314.8341.1343.8336.4
k3332.5332.4326.3326.4
k4322.9321.2307.2320.9
Range17.6533.0536.5517.35
Optimal level2141
Factor orderC > B > A > D
fcu (MPa)k10.770.570.620.52Optimal mix proportion:
A1B2C2D2
k20.630.680.740.74
k30.610.660.670.68
k40.580.680.560.66
Range0.190.110.180.23
Optimal level1222
Factor orderD > A > C > B
kc (W/m·k)k10.207850.163040.174300.15174Optimal mix proportion:
A4B3C4D1
k20.189390.161450.165710.15600
k30.12390.155810.160180.16537
k40.116040.156890.136990.16407
Range0.091810.007230.037310.01364
Optimal level4341
Factor orderA > C > D > B
Table 8. ANOVA results according to ρd, fcu, and kc shown in Table 4 and Table 6.
IndexFactorABCDError
ρd (kg/m3)DOF33333
SSi869.72456.62674.2729.1729.1
Mi289.9818.9891.4243.0243.0
VRi1.193.373.671.001.00
fcu (MPa)DOF33333
SSi0.0870.0340.0700.1100.034
Mi0.0290.0110.0230.0370.011
VRi2.641.002.093.361.00
kc (W/m·k)DOF33333
SSi2.55 × 10−21.47 × 10−43.06 × 10−35.11 × 10−41.47 × 10−4
Mi8.52 × 10−34.89 × 10−51.02 × 10−31.70 × 10−44.89 × 10−5
VRi174.23 **1.0020.86 *3.481.00
Noting that, F0.1(3,3) = 5.39, F0.01(3,3) = 29.46; *, ** represent significant, more significant factor, respectively.
Table 9. Optimal solutions of various factors based on the performance of HBFC.
PerformanceFactors and Level
ρdA2B1C4D1
fcuA1B2C2D2
kcA4B3C4D1

