Improvement of the Physical Properties of Guided Bone Regeneration Membrane from Porcine Pericardium by Polyphenols-Rich Pomace Extract


Abstract
:1. Introduction
2. Results
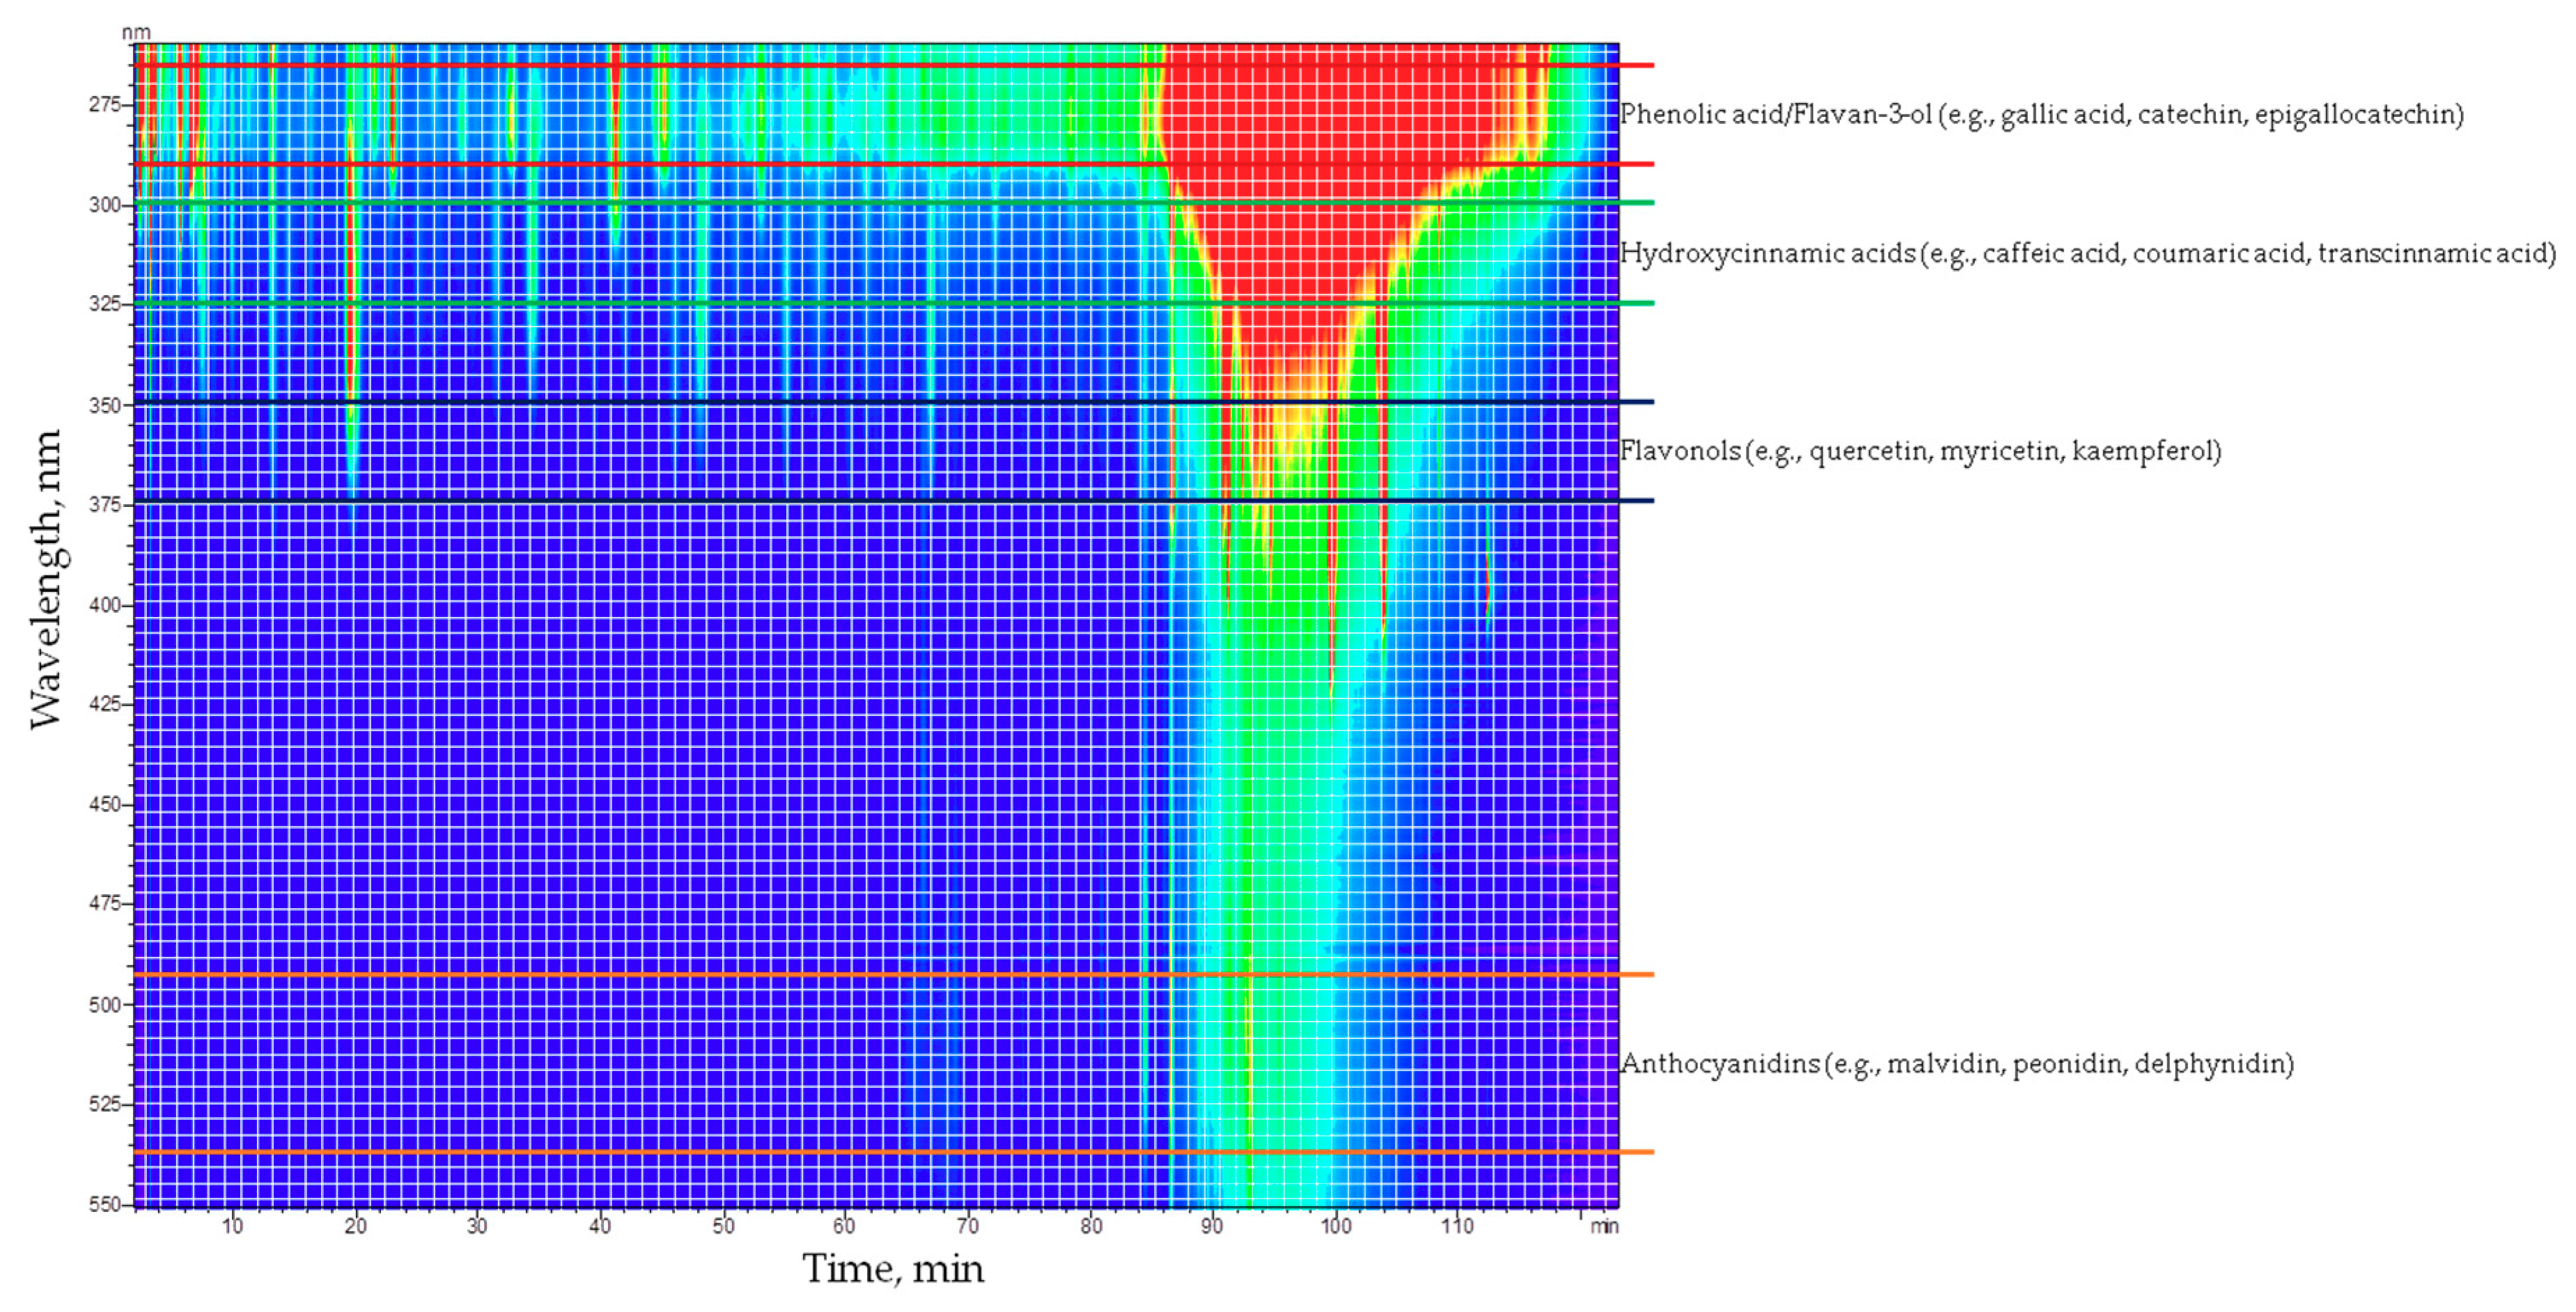
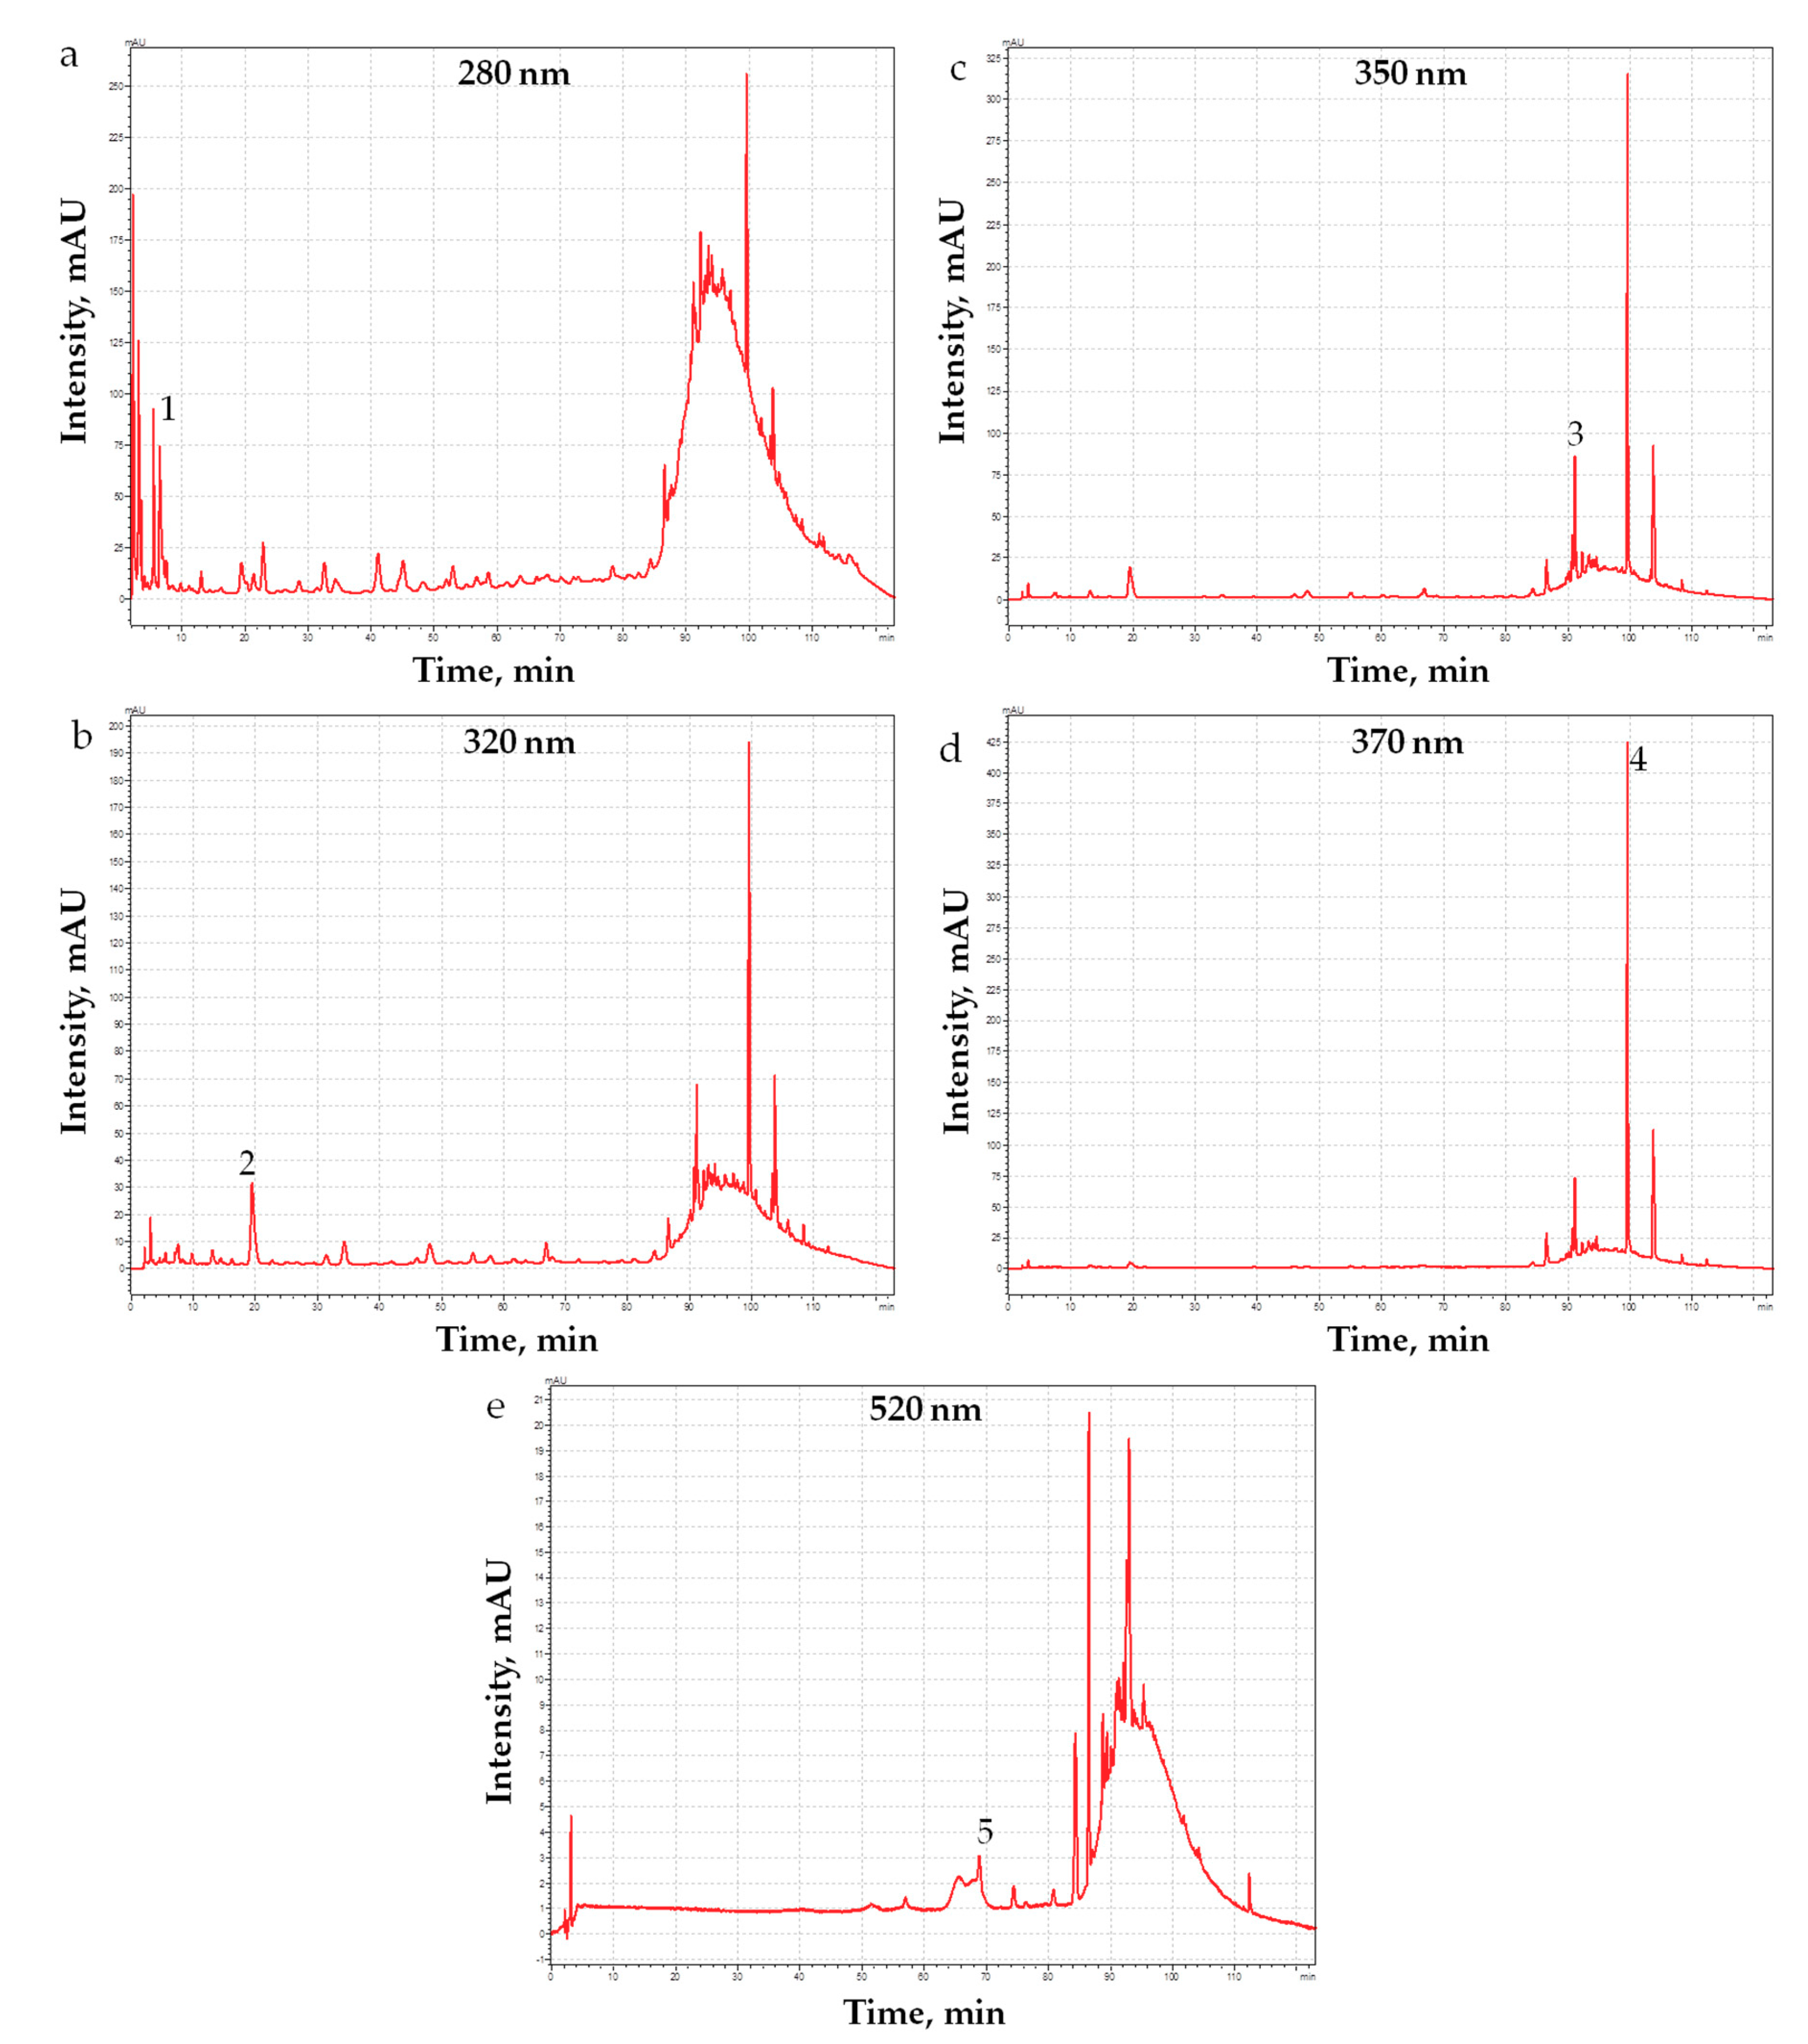
2.1. PRPE Characterization
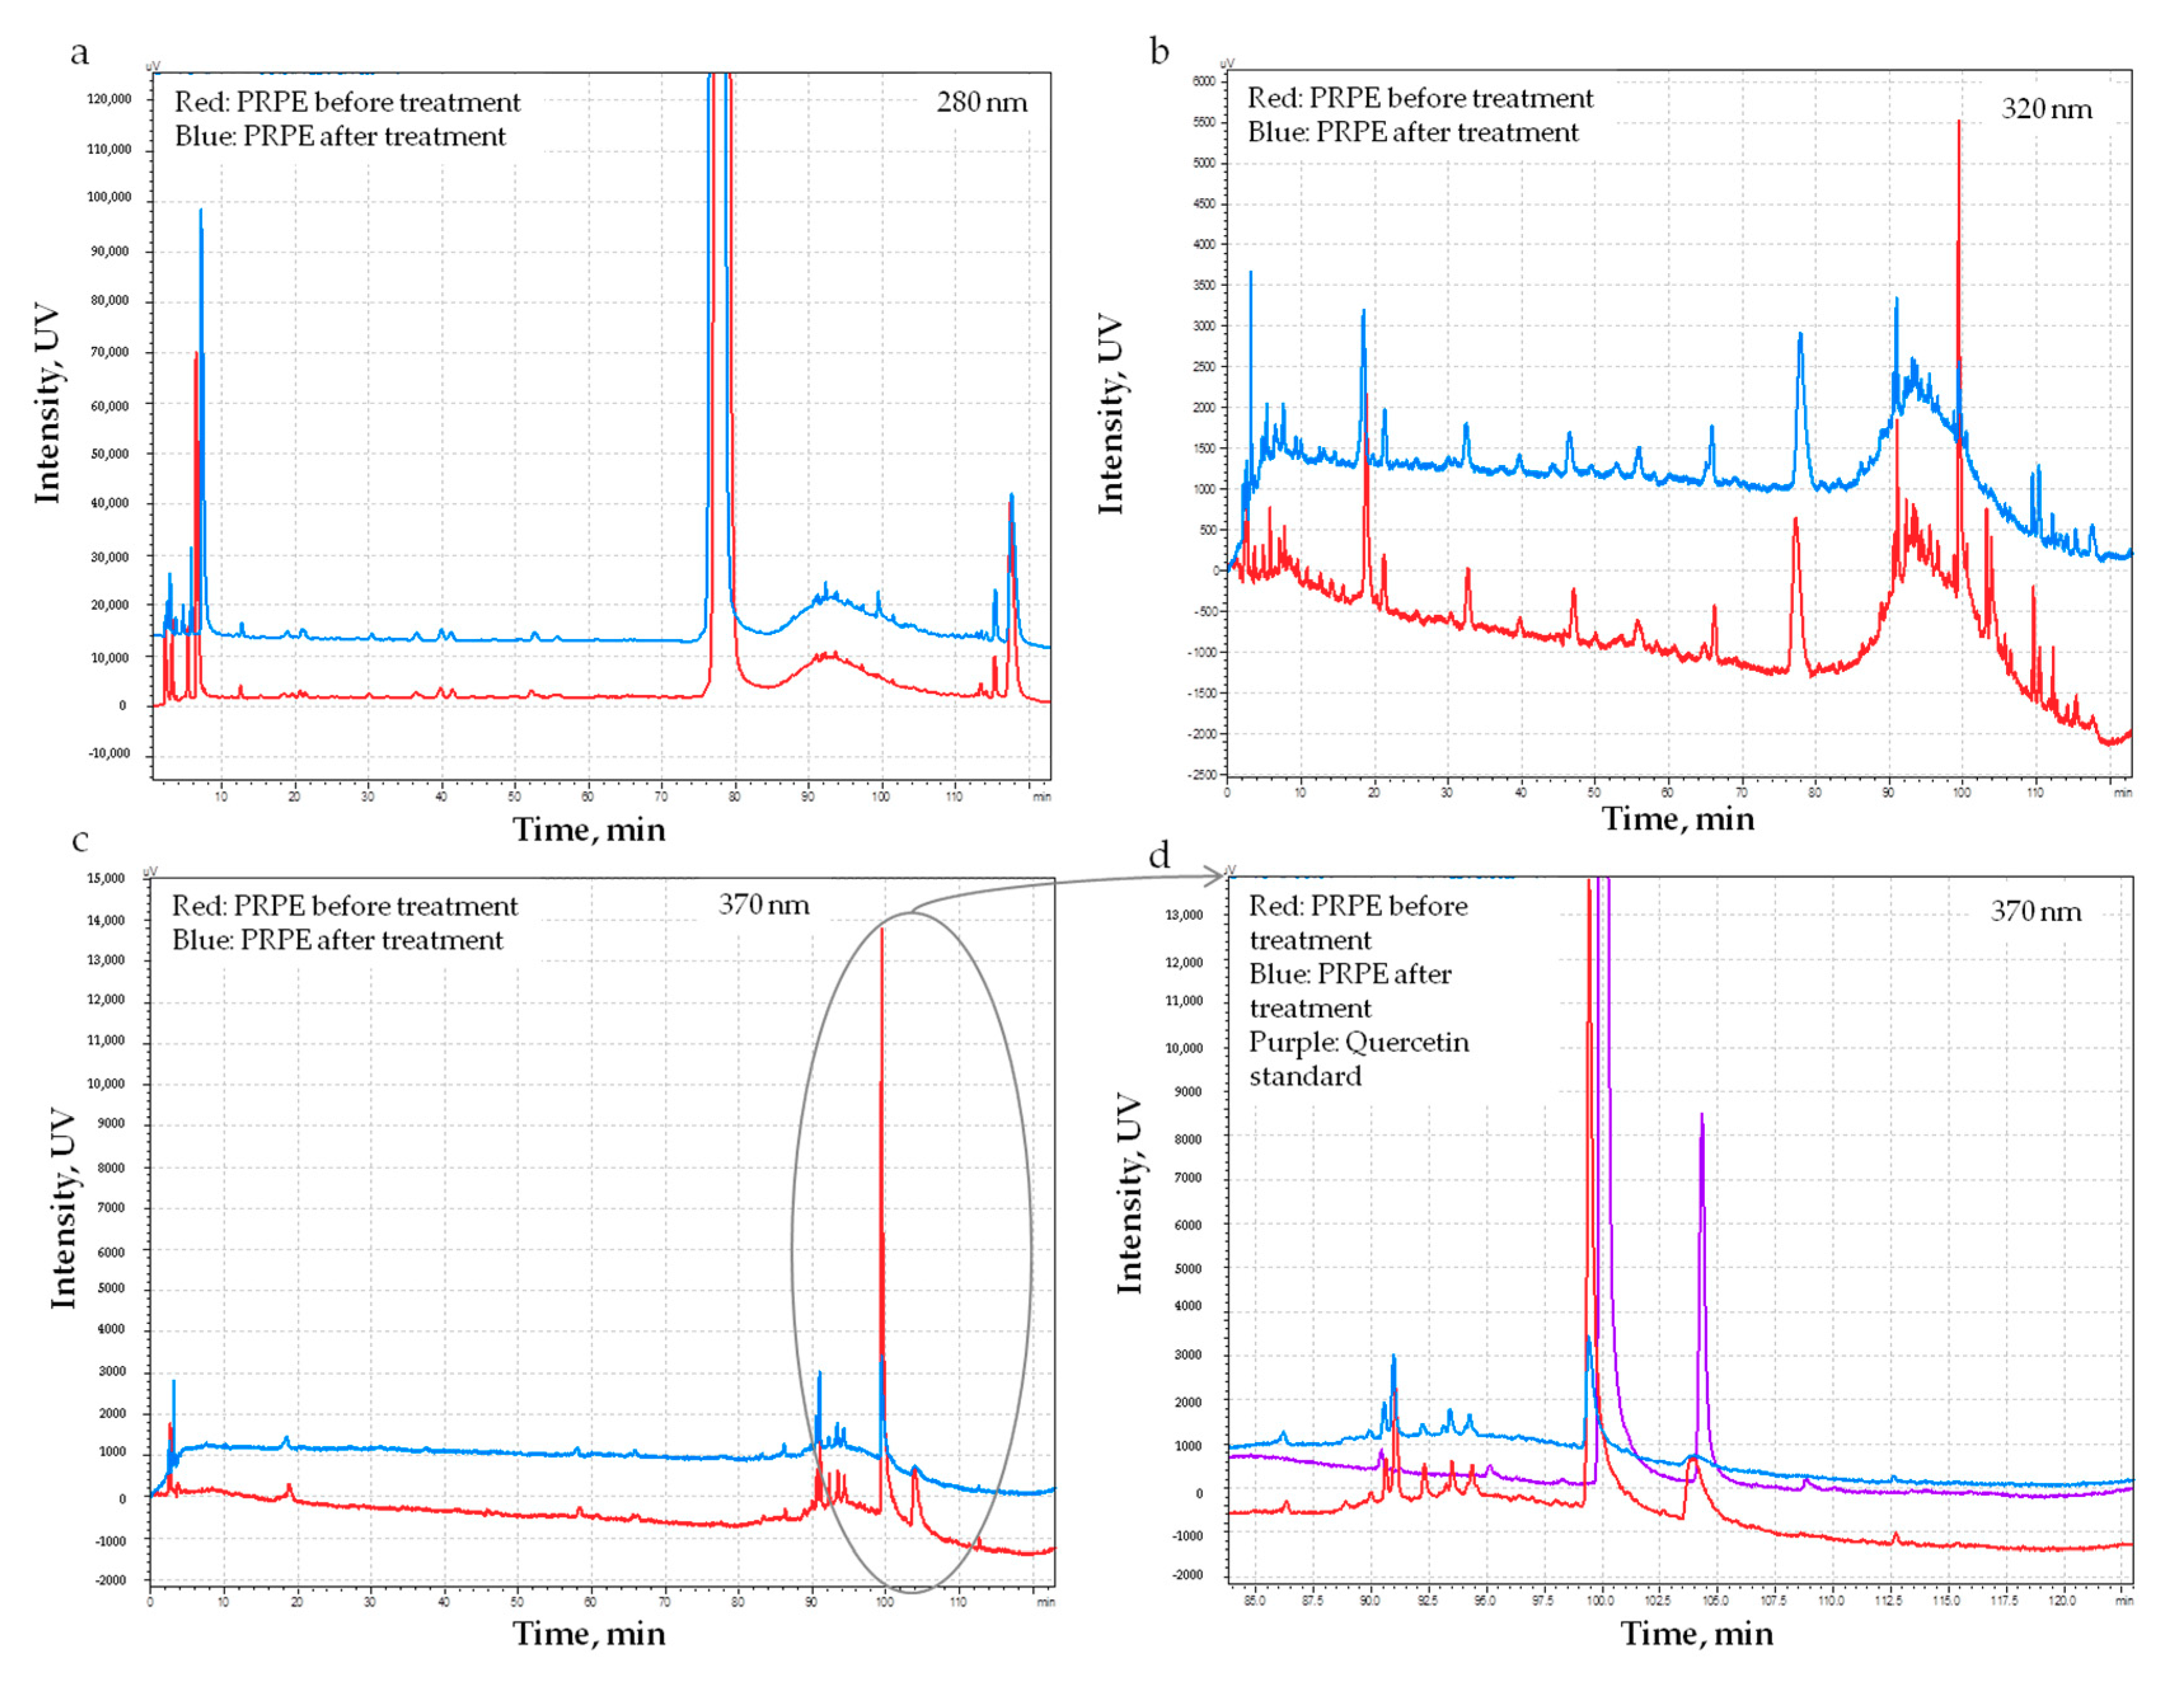
2.2. Polyphenols Content of Pericardium Treated with Polyphenols (P_PRPE)
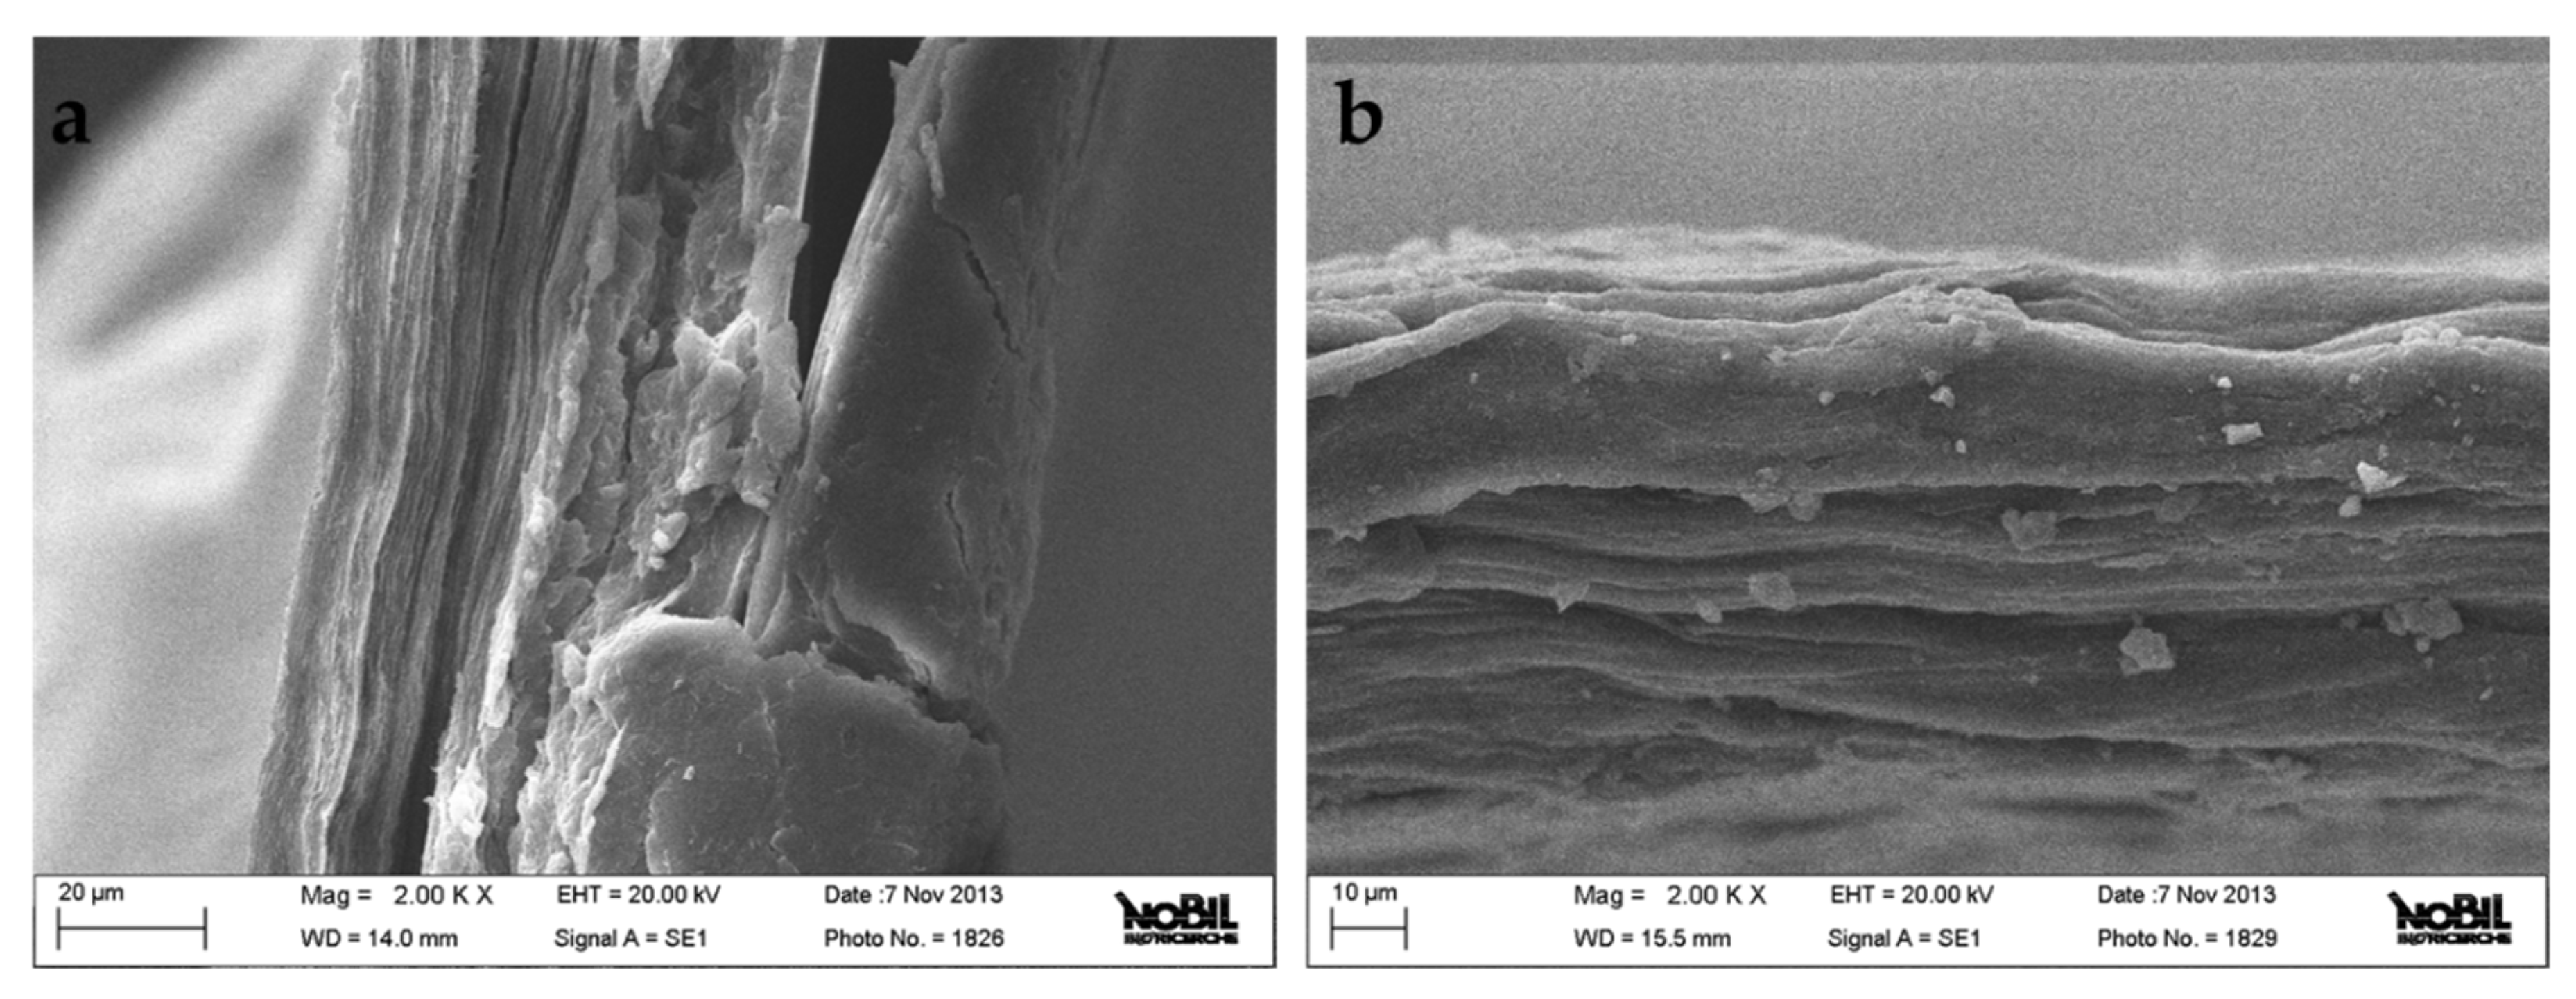
2.3. Scanning Electron Microscopy
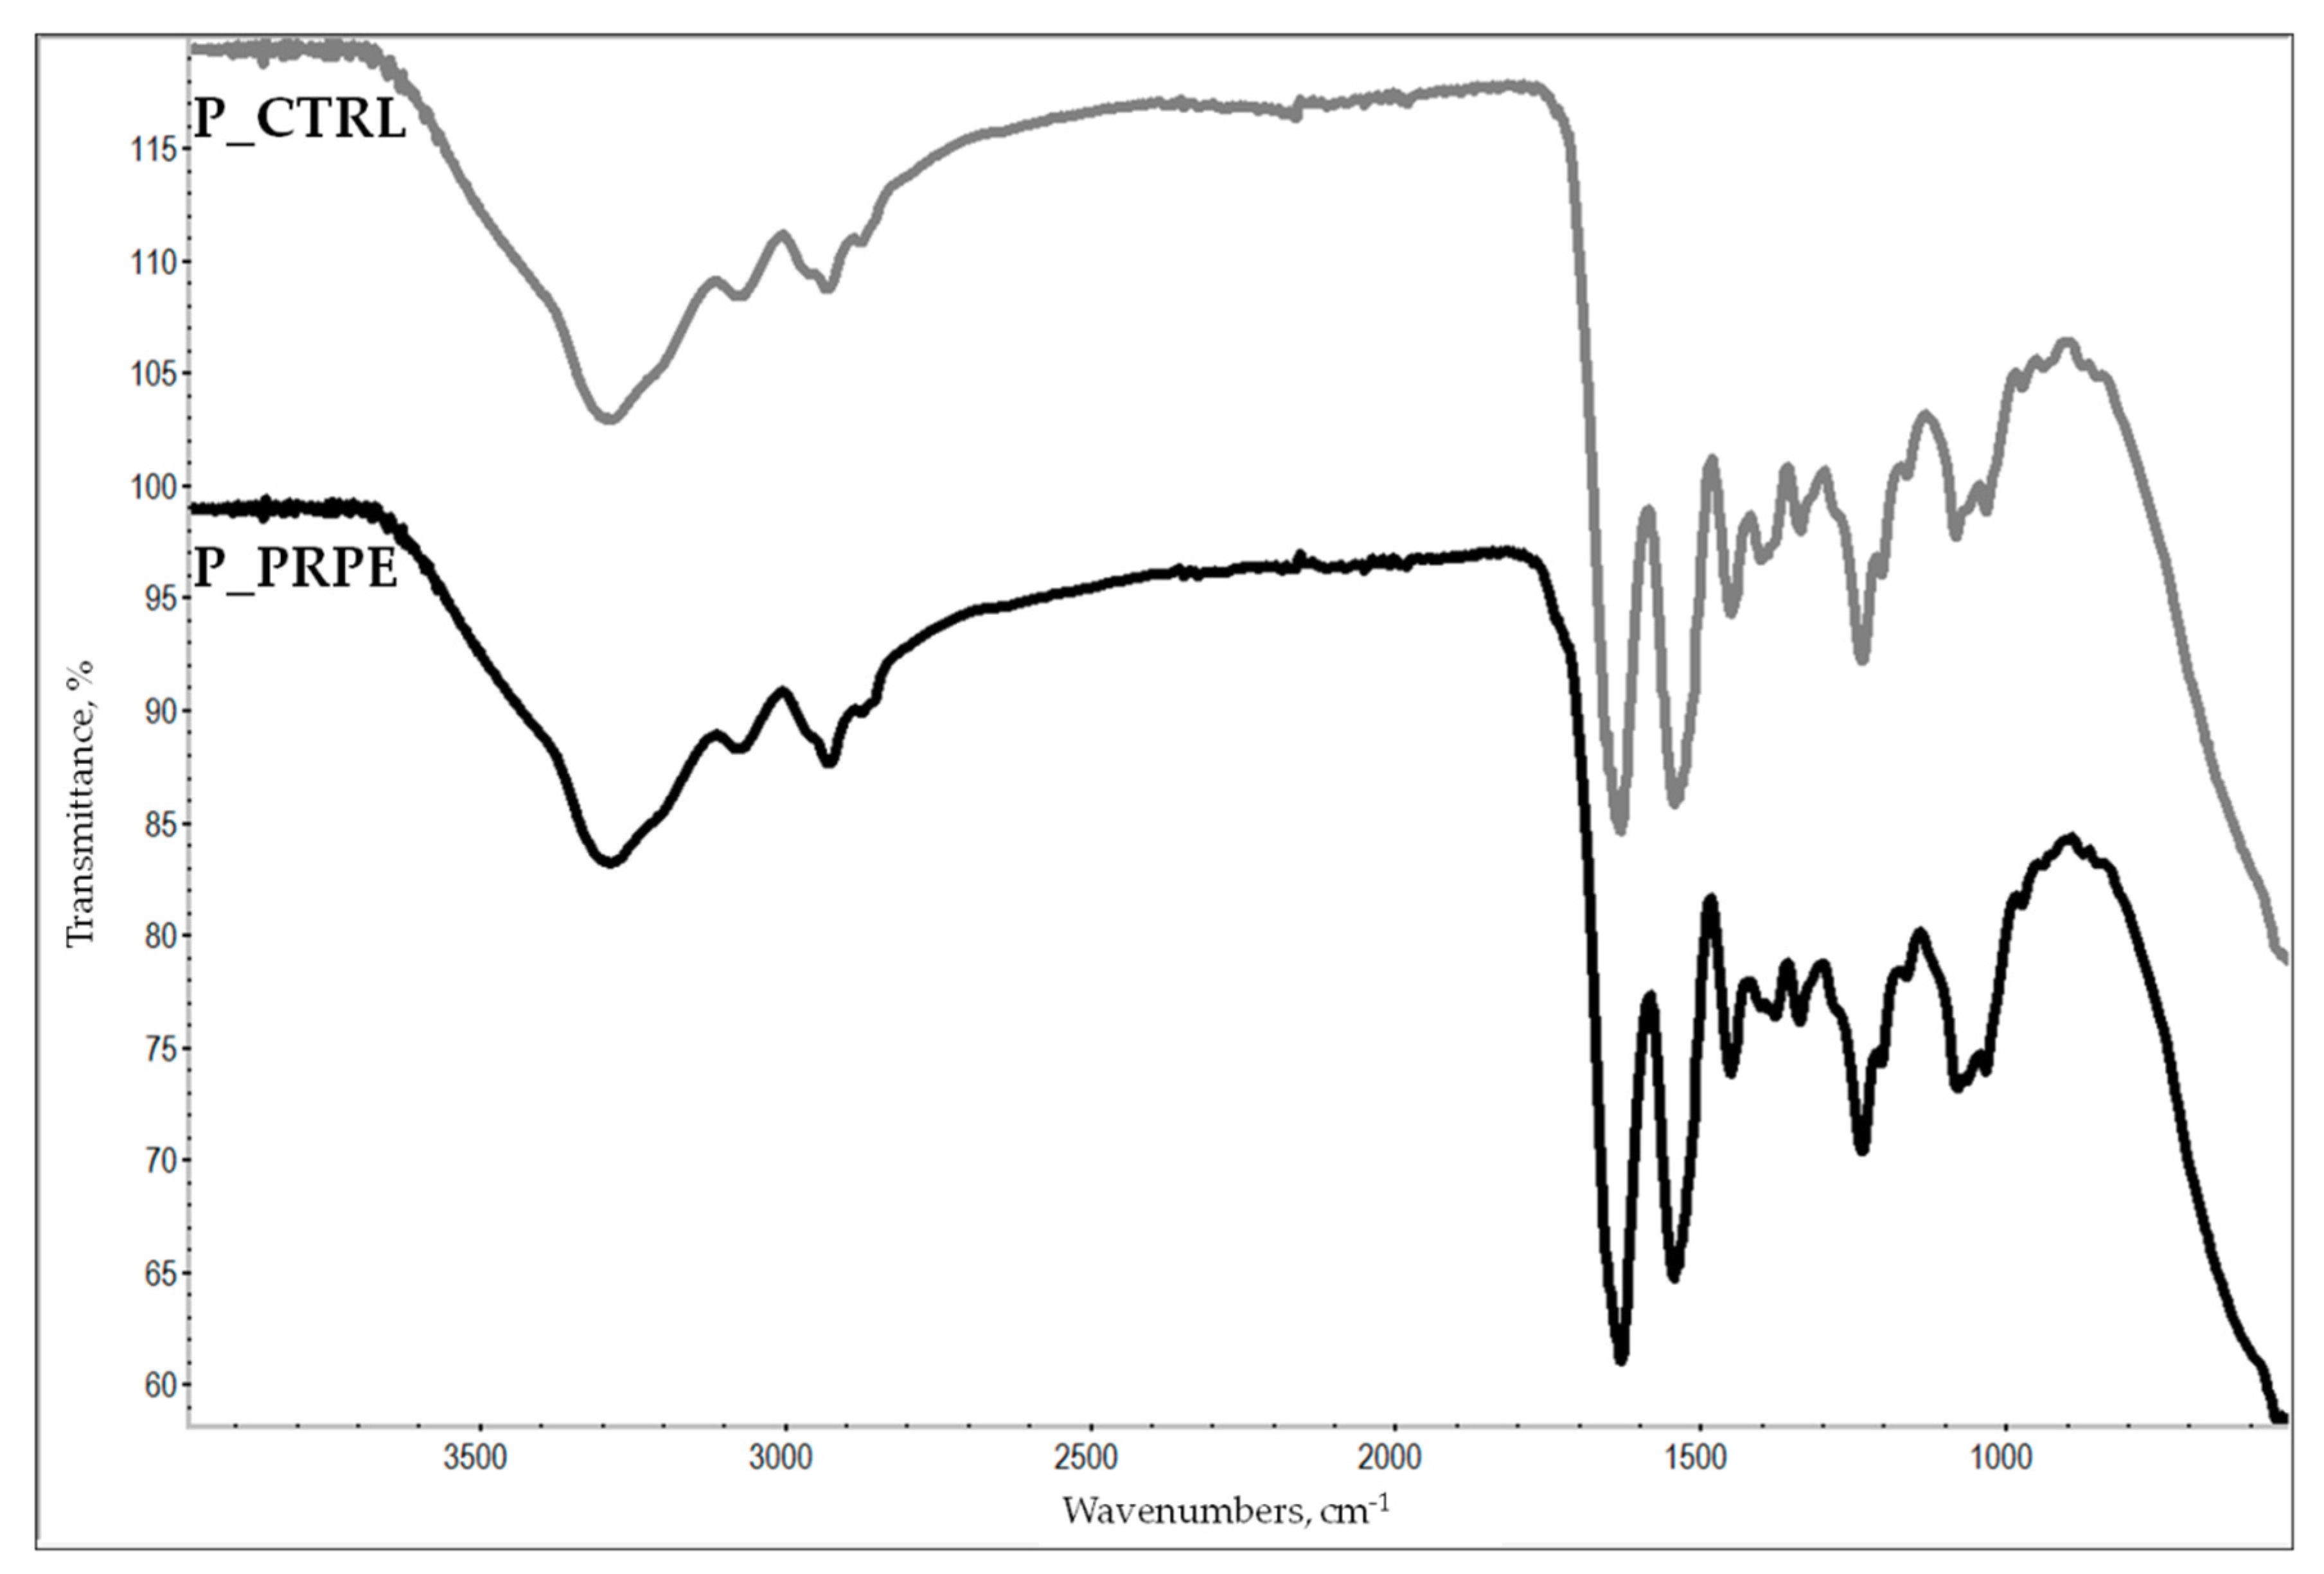
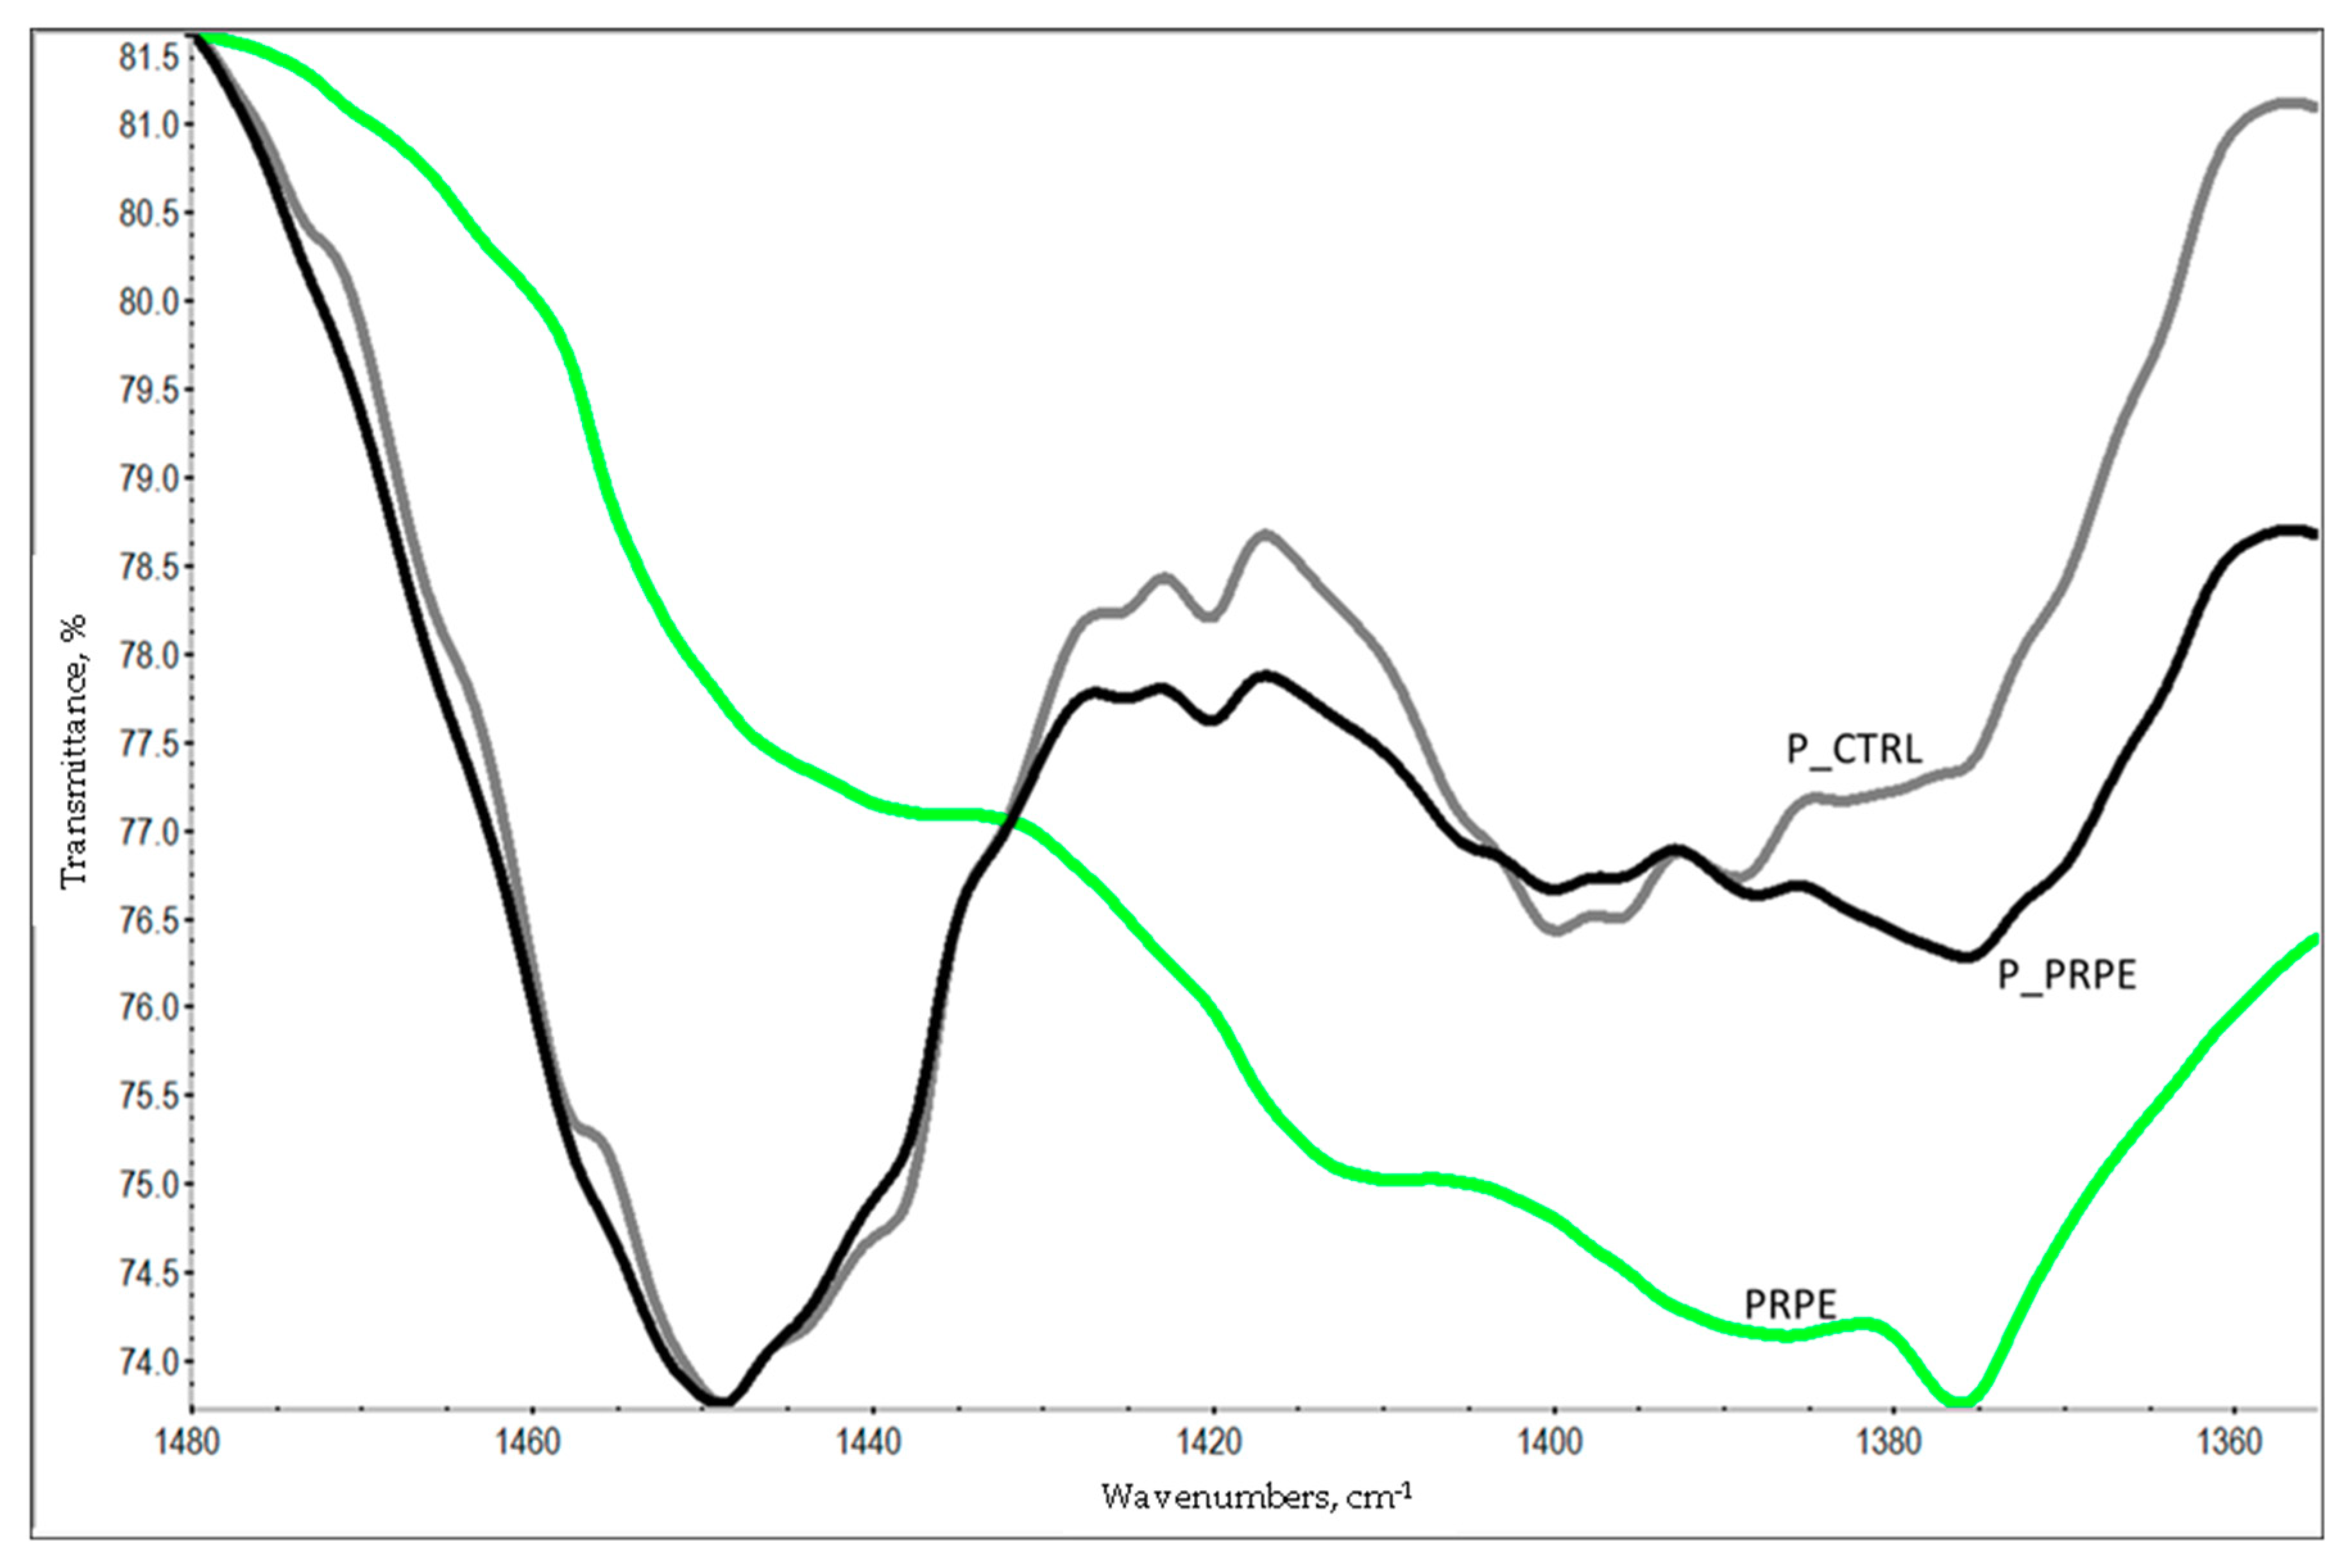
2.4. Attenuated Total Reflectance Infrared Spectroscopy (ATR-IR)
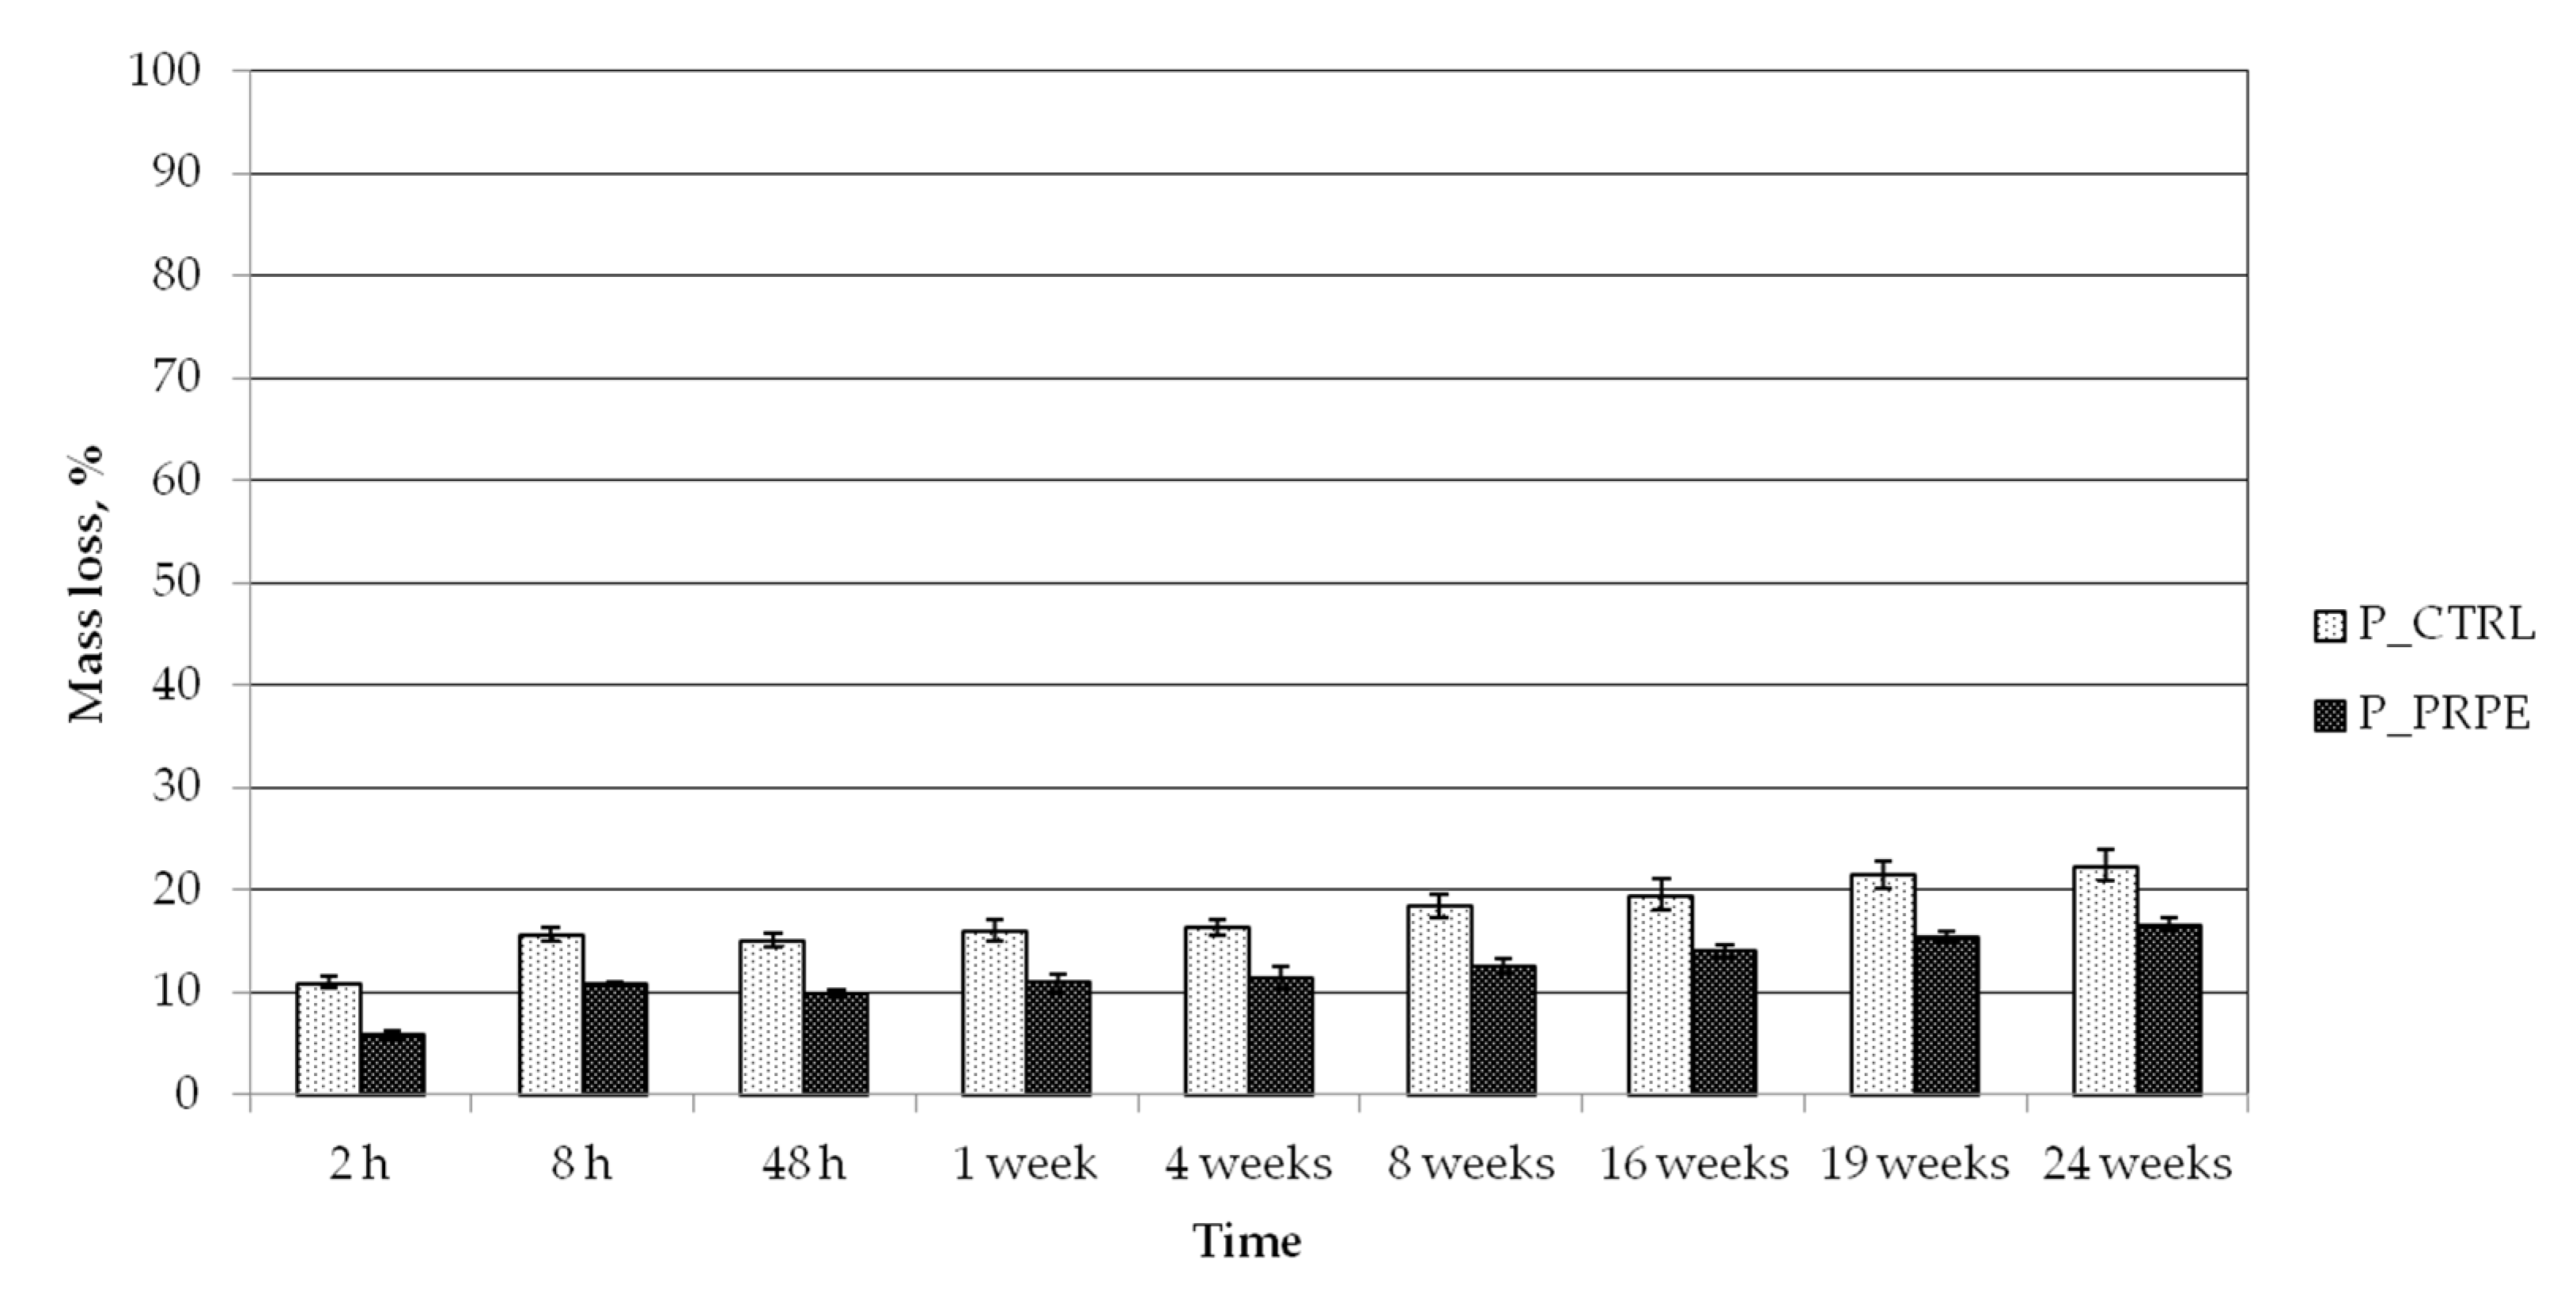
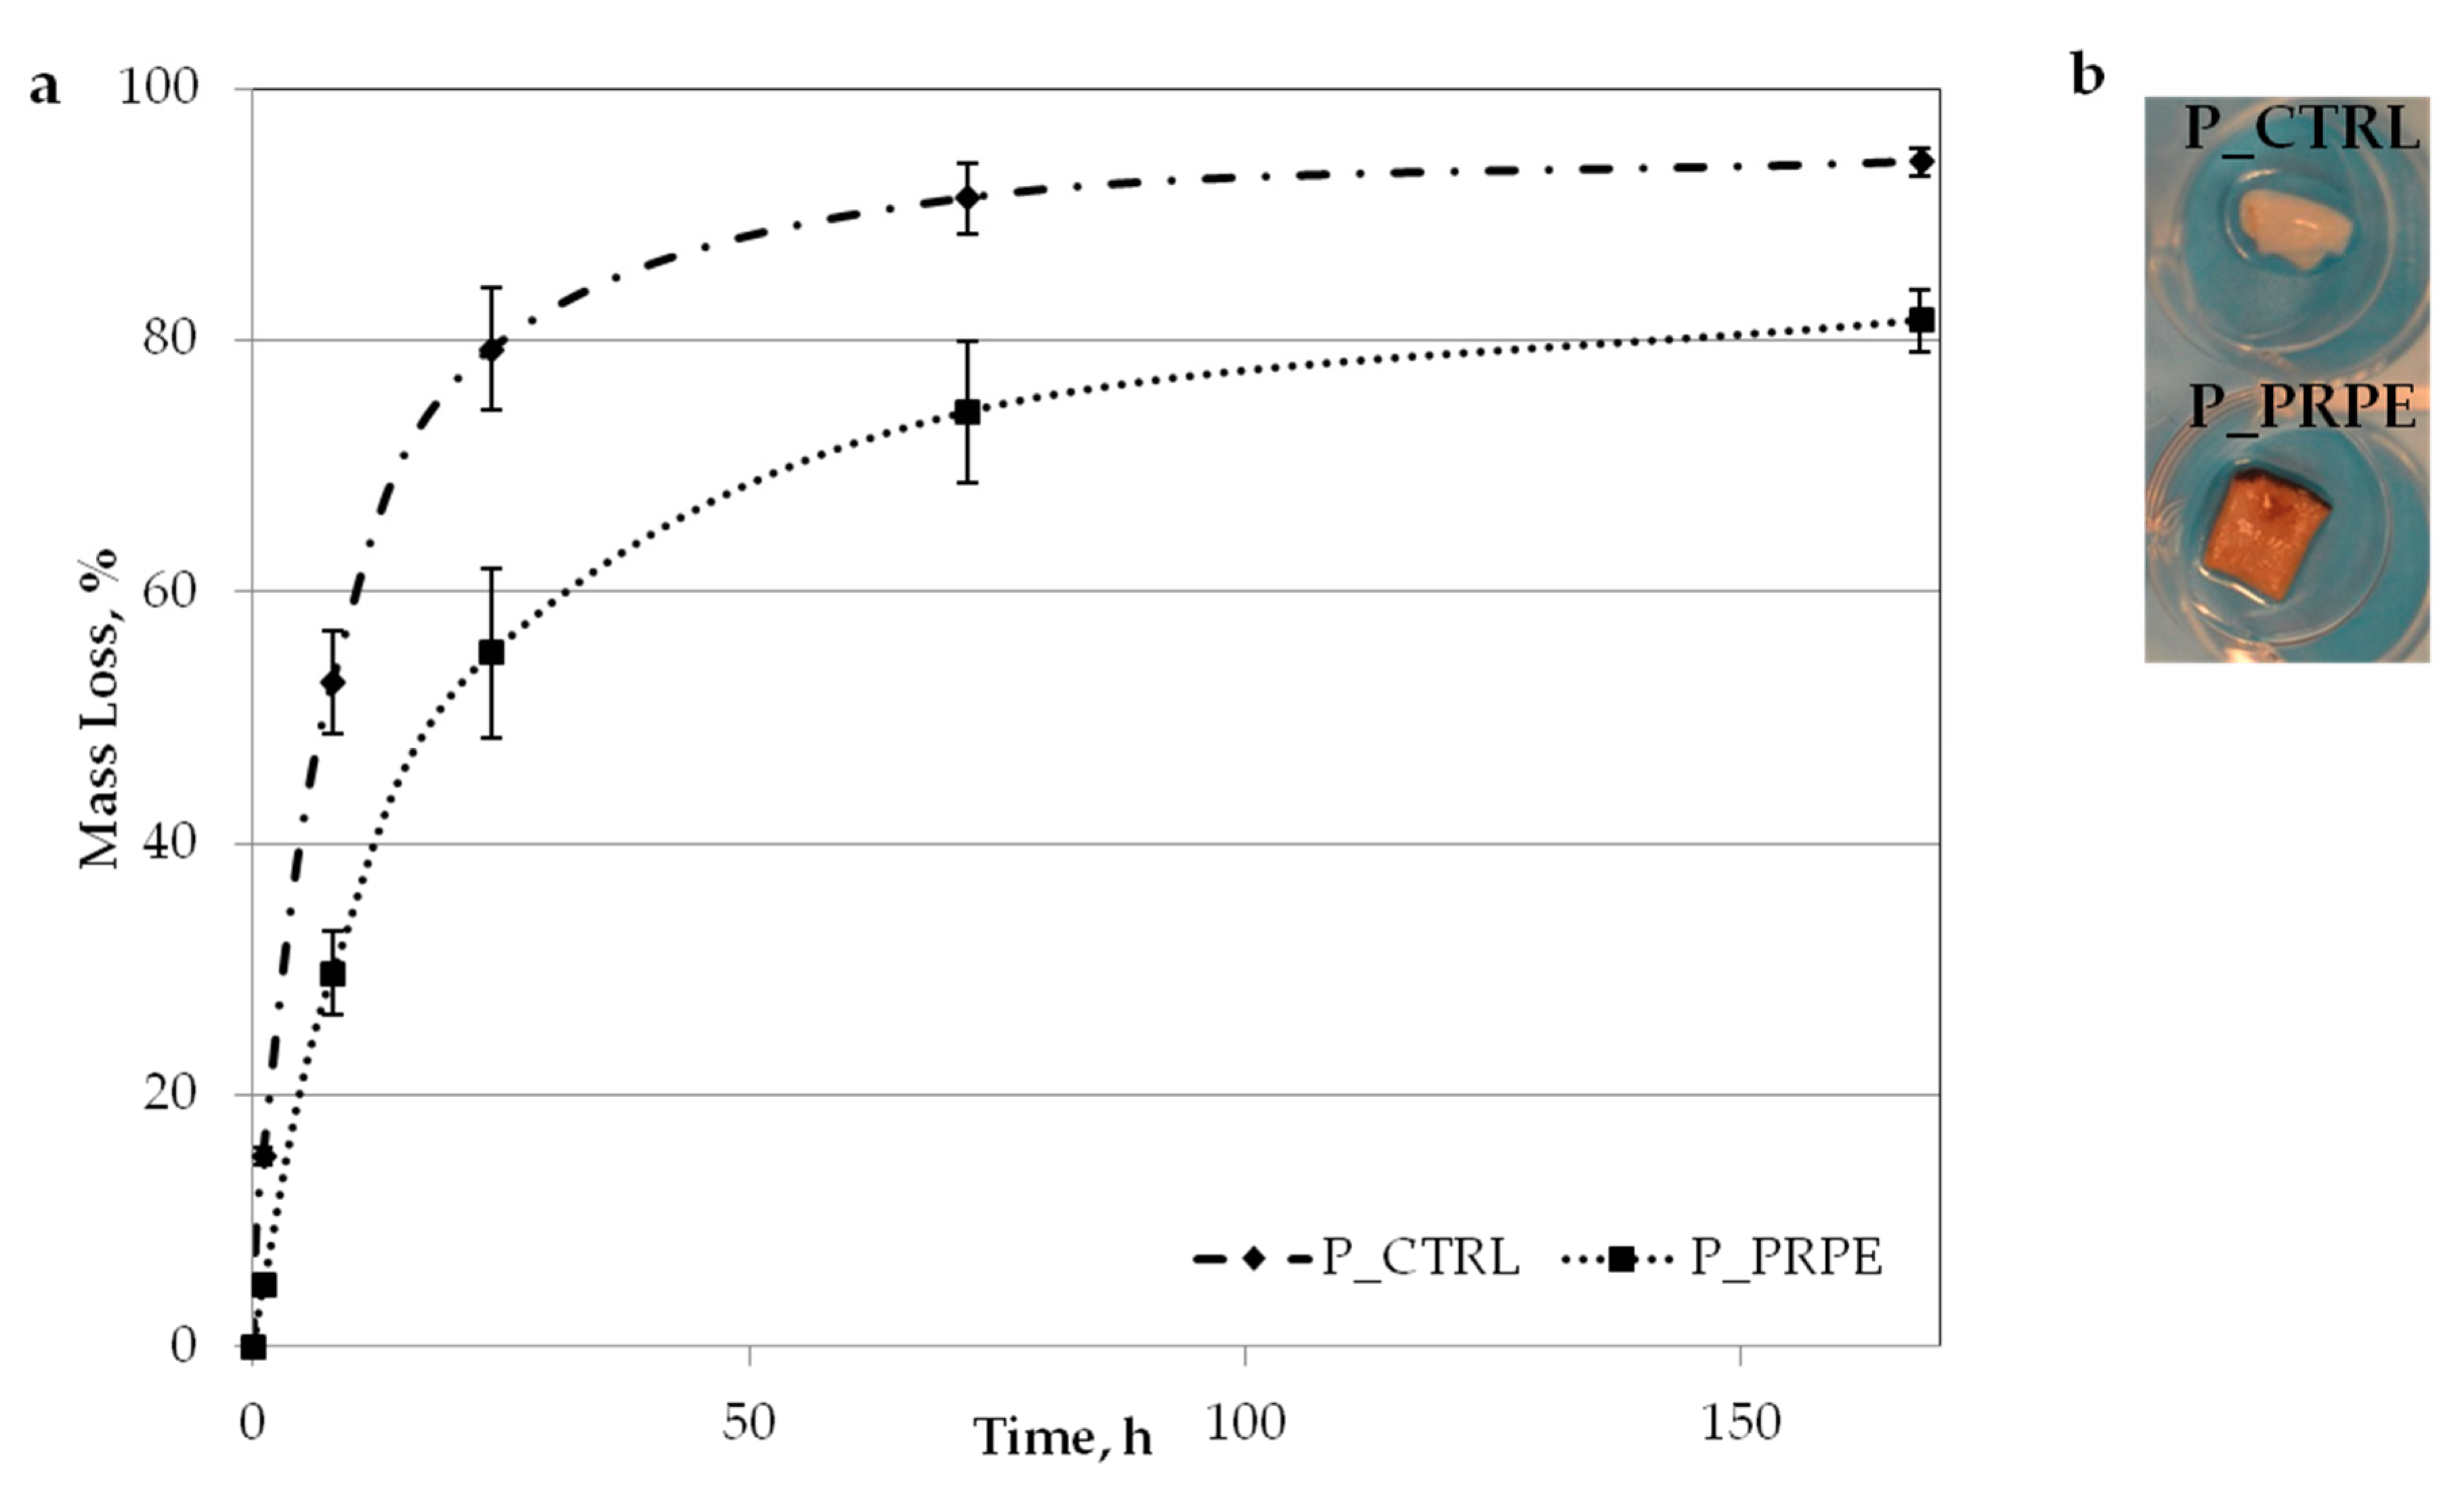
2.5. Degradation Study
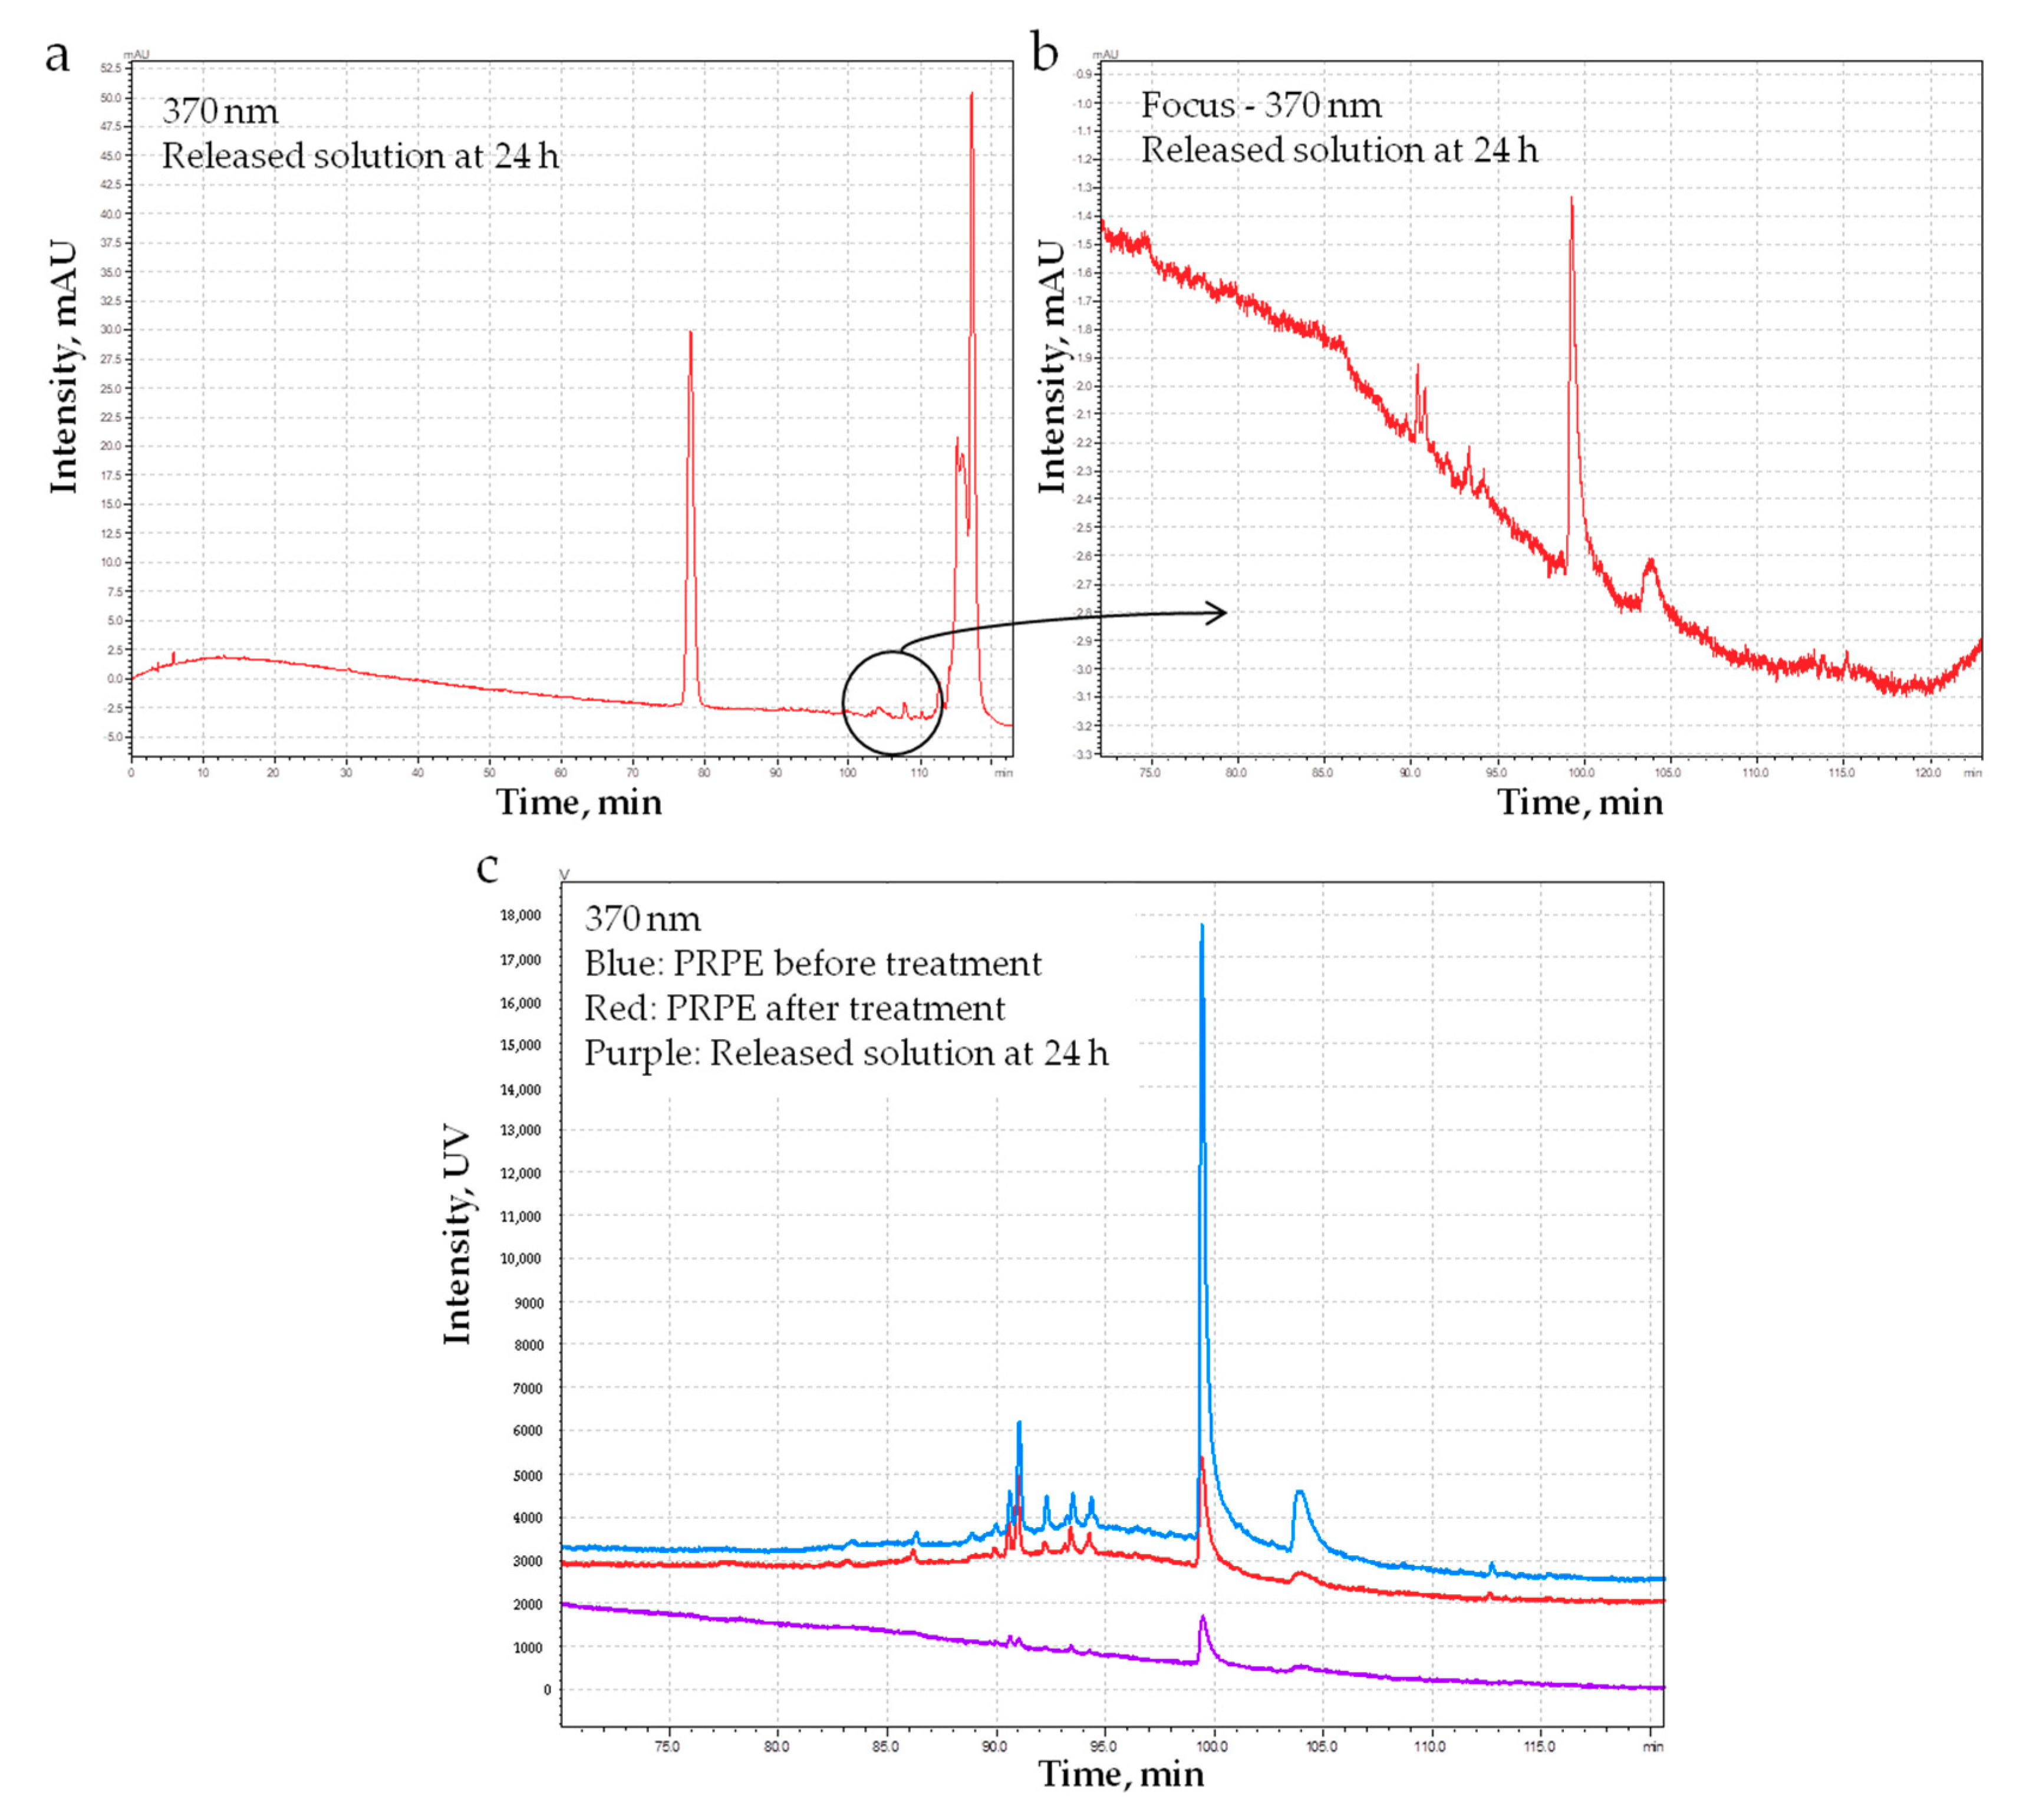
2.6. Pph Release from P_PRPE Membrane
2.7. Mechanical Characterization
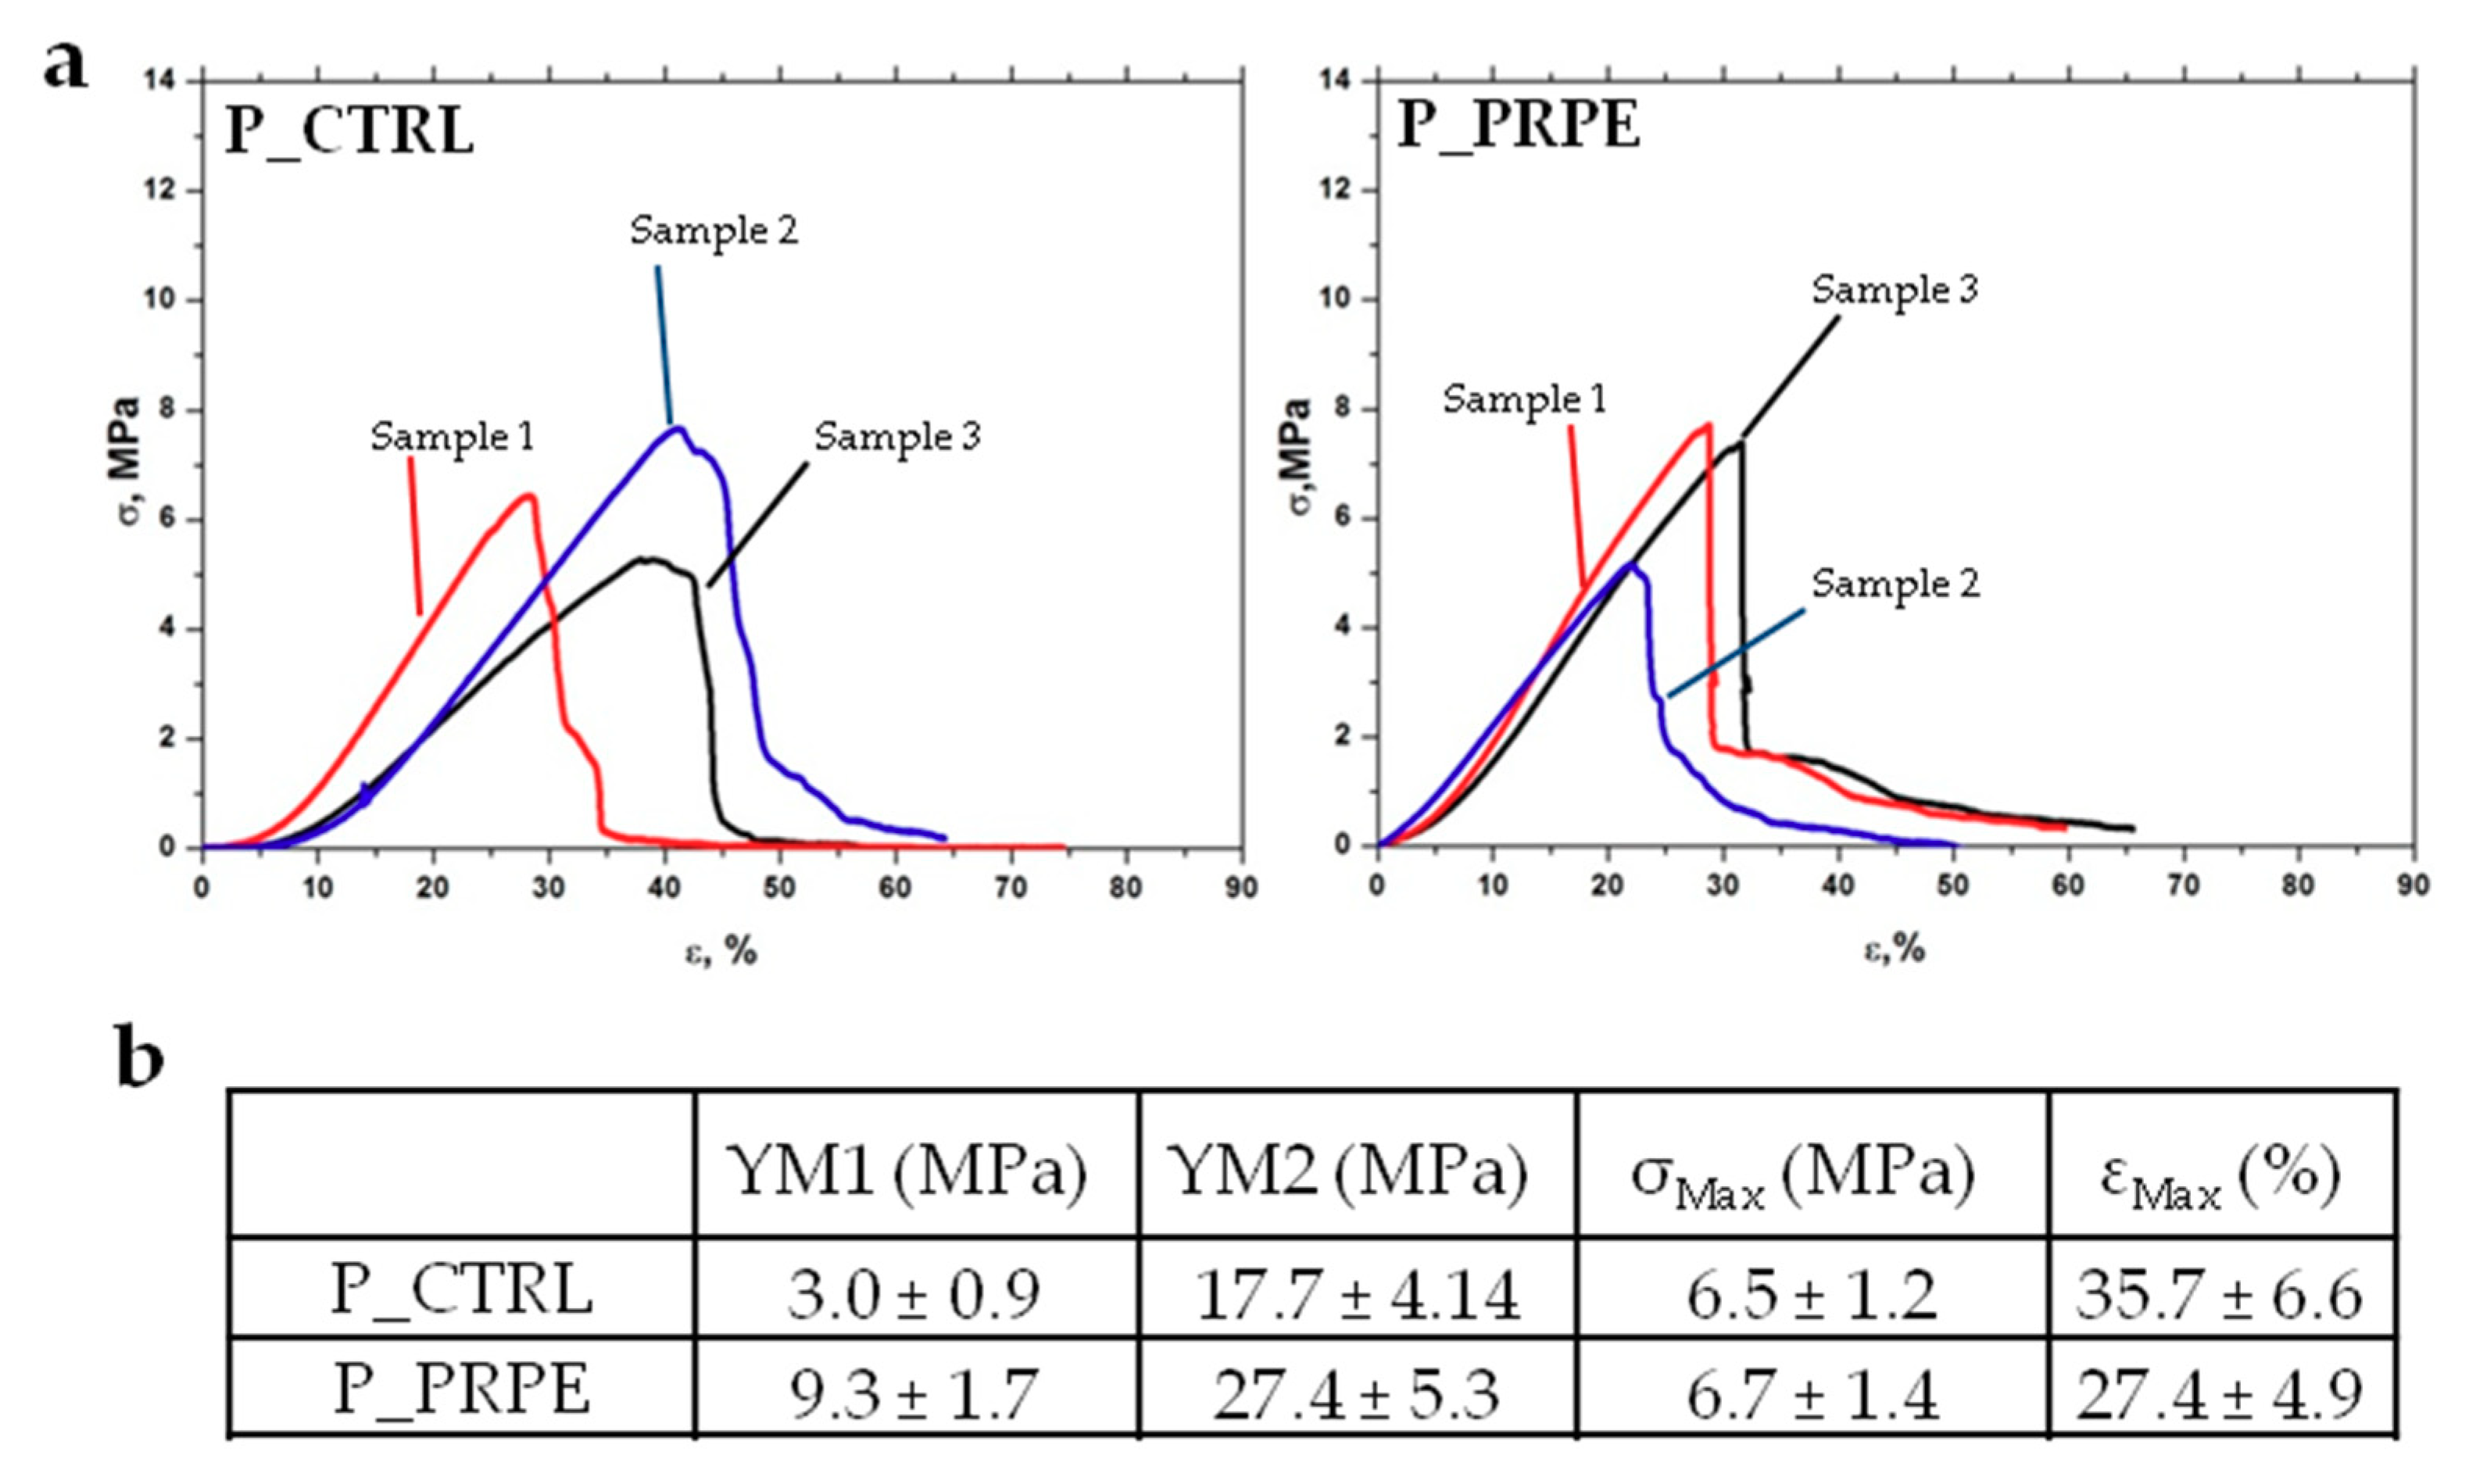
2.7.1. Tensile Test
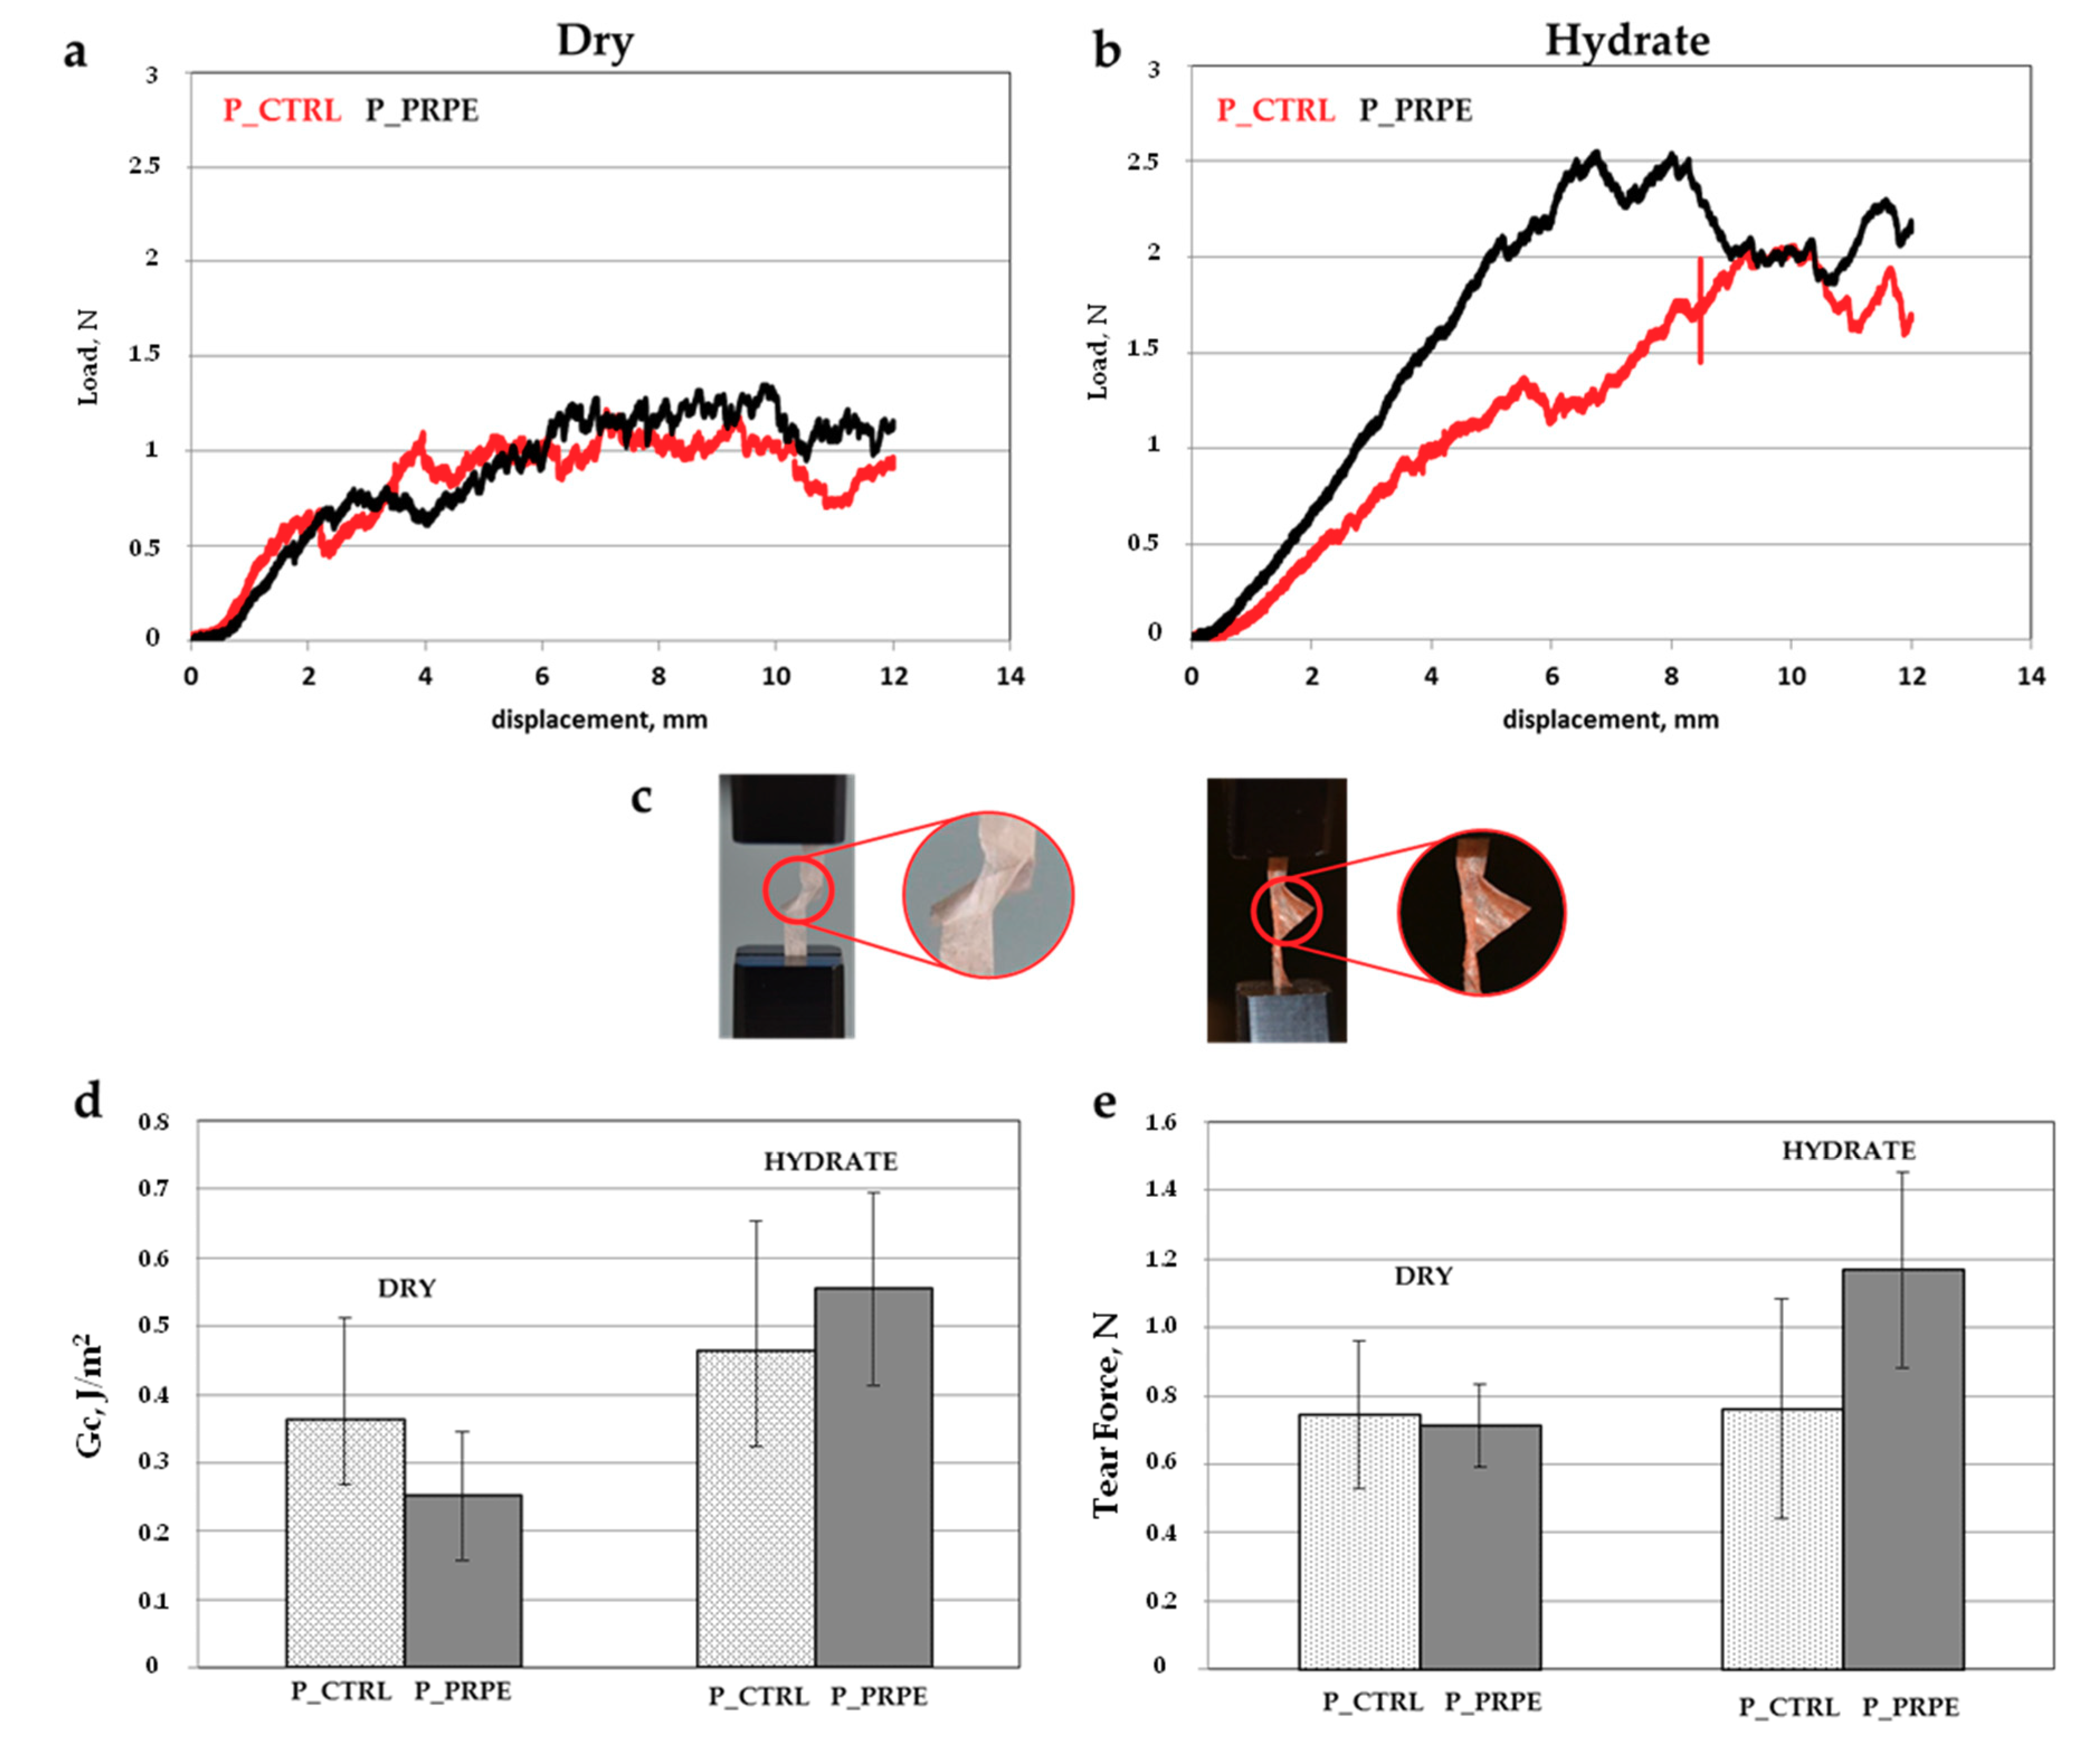
2.7.2. Tear Test
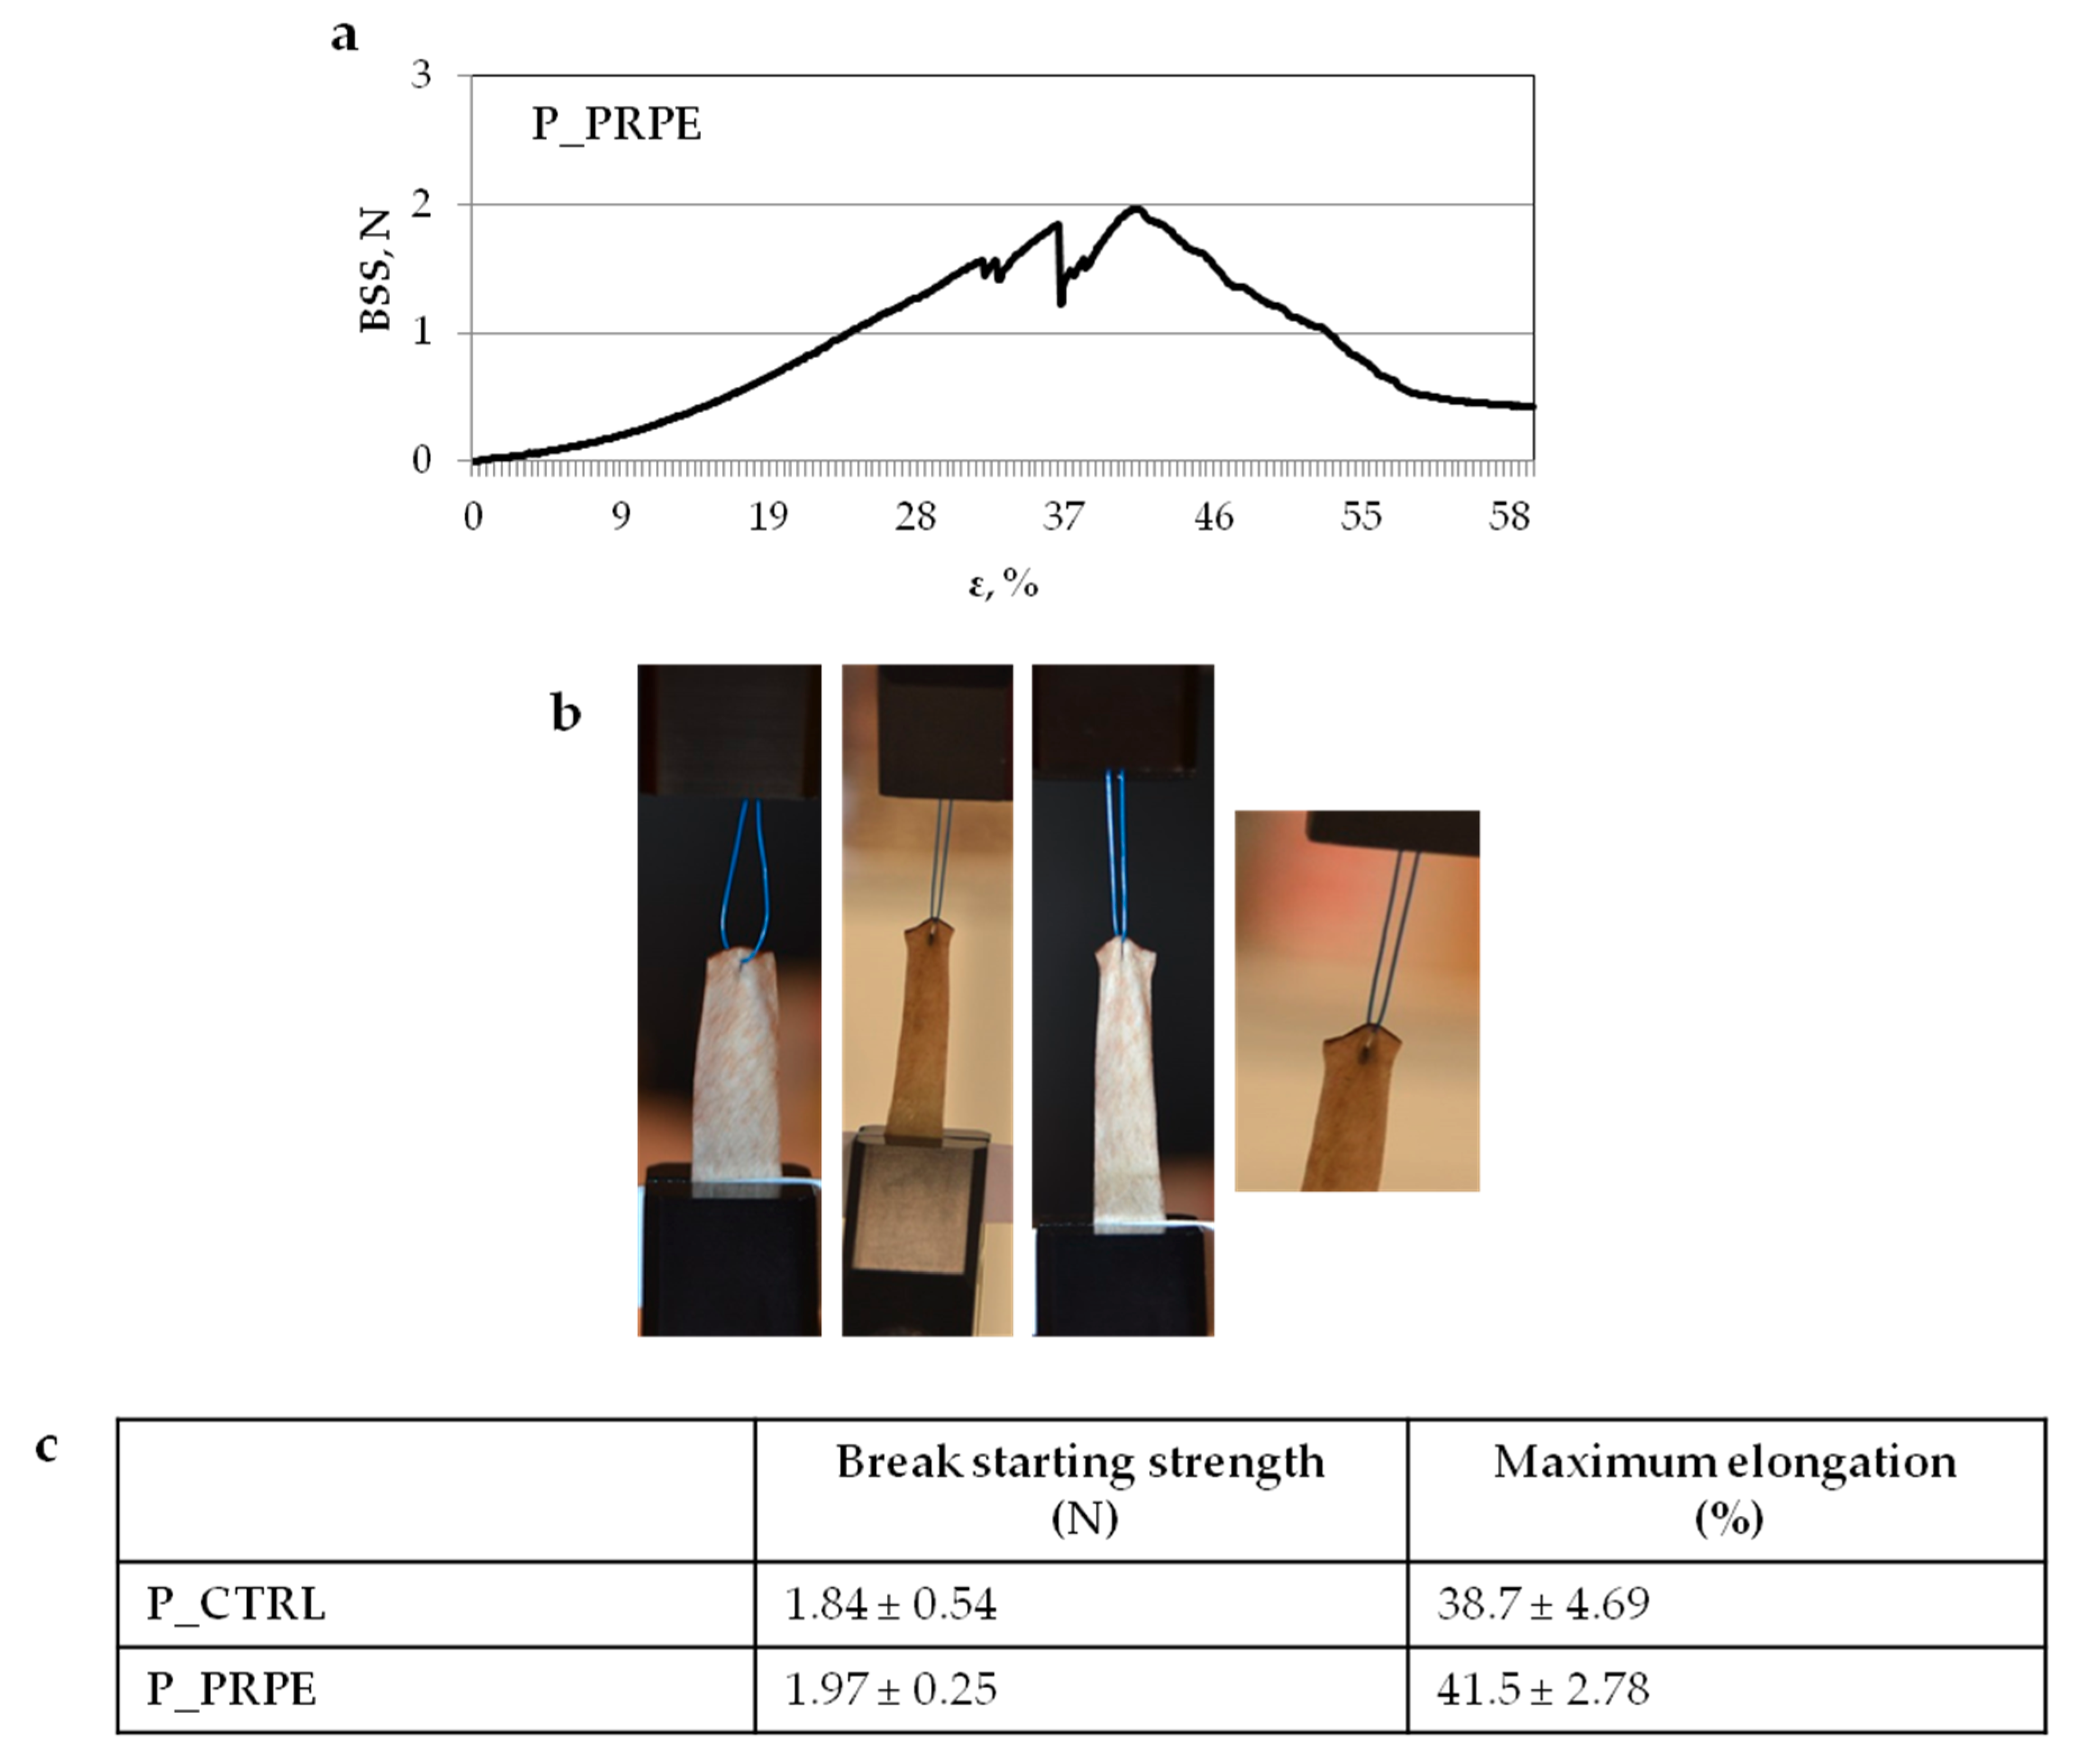
2.7.3. Suture Retention Strength Test
3. Discussion
4. Materials and Methods
4.1. Materials
4.2. Preparation of Polyphenol-Rich Pomace Extracts (PRPE)
4.3. Preparation of PRPE Crosslinked Porcine Pericardium Membranes
4.4. HPLC Analysis
4.5. Phenolic Content of PRPE
4.6. Antioxidant Power of PRPE
4.7. Determination of Anthocyanins in PRPE
4.8. Scanning Electron Microscopy
4.9. ATR-IR
4.10. Degradation Study
4.11. Release Study
4.12. Mechanical Characterization
4.12.1. Tensile Test
4.12.2. Tear Stress Test
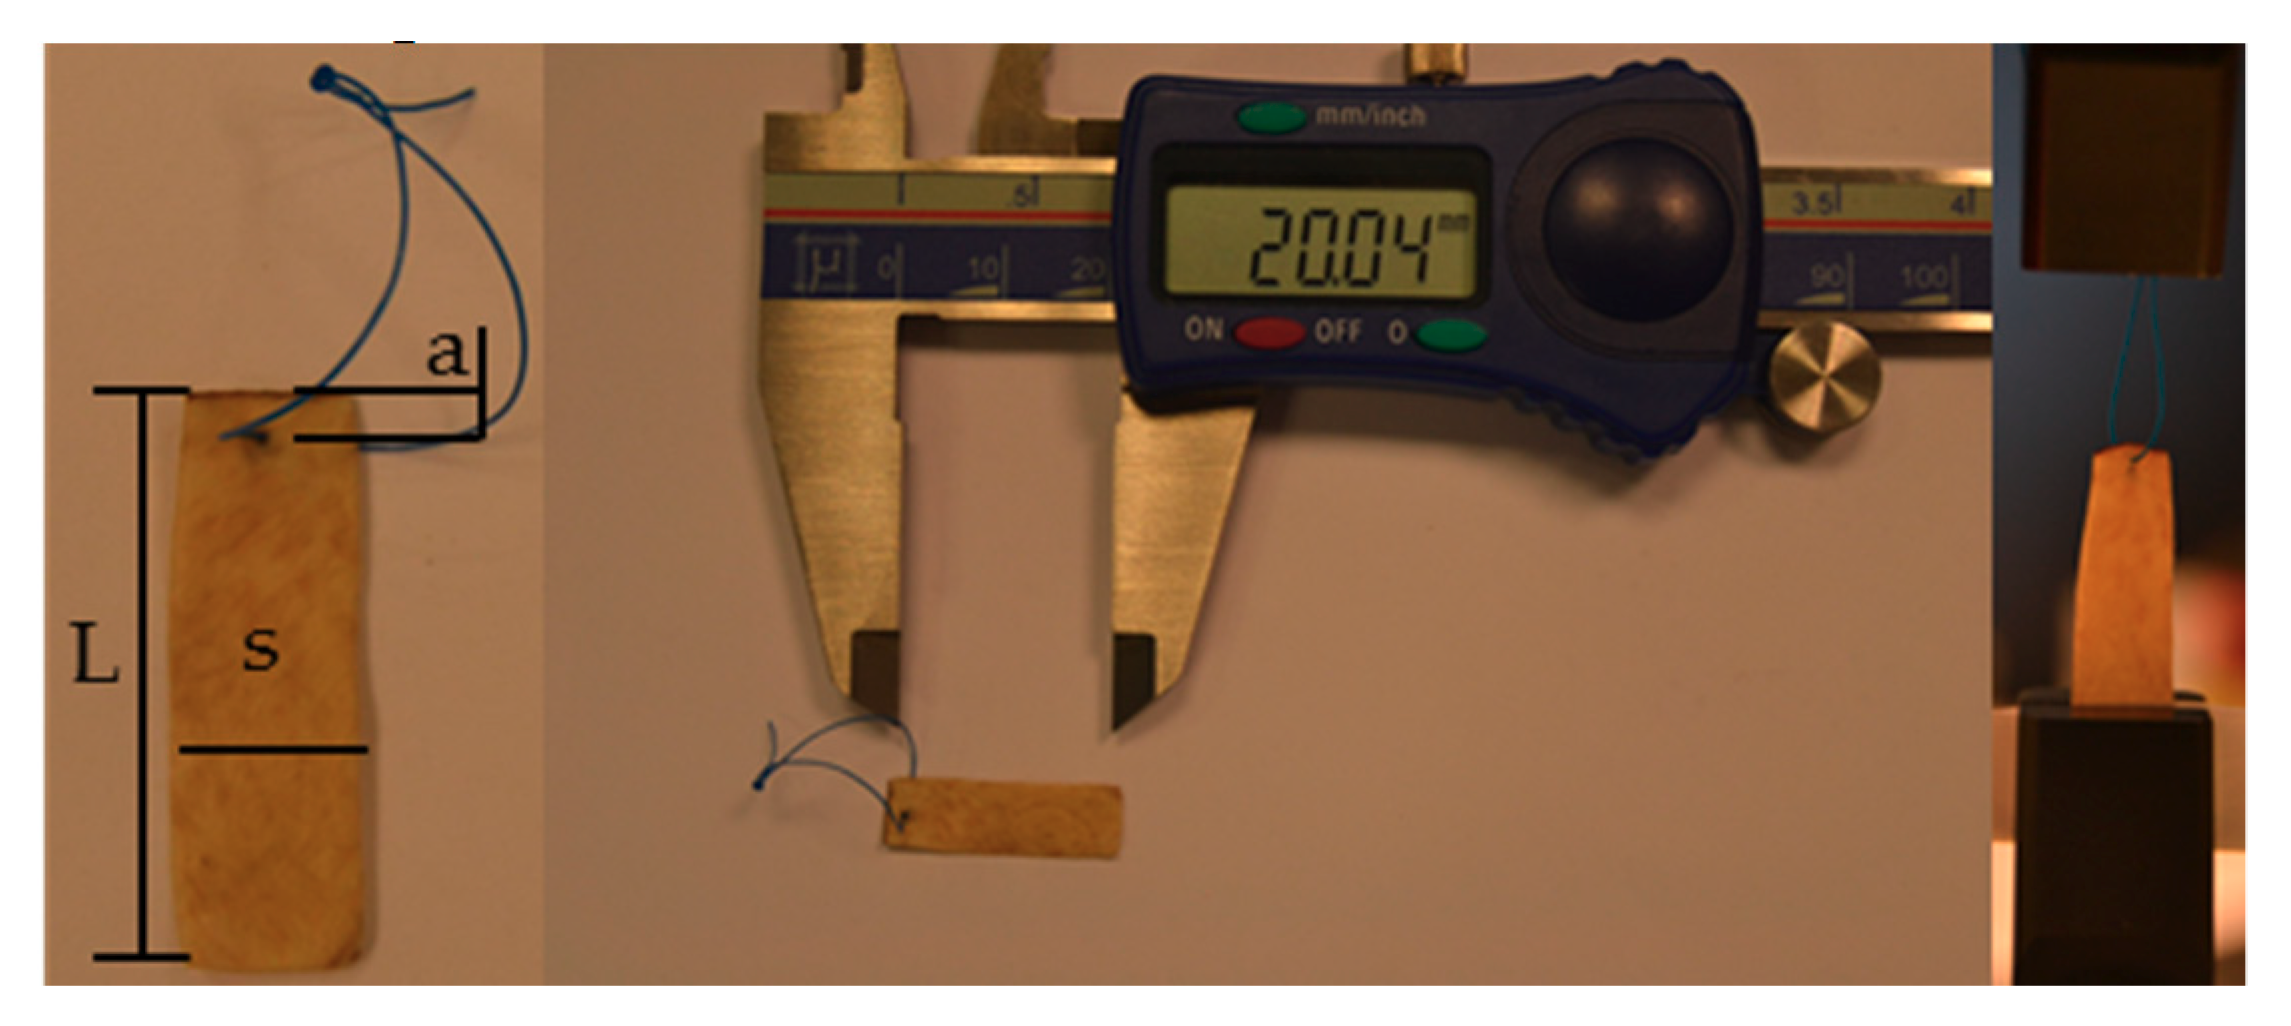
4.12.3. Suture Retention Strength
5. Conclusions
Author Contributions
Funding
Conflicts of Interest
References
- Chen, F.M.; Jin, Y. Periodontal tissue engineering and regeneration: current approaches and expanding opportunities. Tissue Eng. Part B Rev. 2010, 16, 219–255. [Google Scholar] [CrossRef] [PubMed]
- Kao, R.T.; Nares, S.; Reynolds, M.A. Periodontal Regeneration of Intrabony Defects: A Systematic Review. J. Periodontol. 2015, 86, S77–S104. [Google Scholar] [CrossRef]
- Perry, E.R. Surgical periodontal therapy. J. Miss. Dent. Assoc. 1967, 23, 90–91. [Google Scholar] [CrossRef] [PubMed]
- Proestakis, G.; Soderholm, G.; Bratthall, G.; Kullendorff, B.; Grondahl, K.; Rohlin, M.; Attstrom, R. Gingivectomy Versus Flap Surgery-the Effect of the Treatment of Infrabony Defects-a Clinical and Radiographic Study. J. Clin. Periodontol. 1992, 19, 497–508. [Google Scholar] [CrossRef] [PubMed]
- Pihlstrom, B.L.; Michalowicz, B.S.; Johnson, N.W. Periodontal diseases. Lancet 2005, 366, 1809–1820. [Google Scholar] [CrossRef] [Green Version]
- Meffert, R.M. Periodontitis vs.peri-implantitis: the same disease?the same treatment? Crit. Rev. Oral Biol. Med. 1996, 7, 278–291. [Google Scholar] [CrossRef] [PubMed]
- Manuel, F.; Illueca, A.; Vera, P.B.; Cabanilles, P.D.G.; Fernandez, V.F.; José, F.; Loscos, G.; Manuel, F.; Illueca, A. Periodontal regeneration in clinical practice. Med Oral Patol Oral Cir Bucal 2006, 11, 382–392. [Google Scholar]
- Raitapuro-Murray, T.; Molleson, T.I.; Hughes, F.J. The prevalence of periodontal disease in a Romano-British population c. 200-400 AD. Br. Dent. J. 2014. [Google Scholar] [CrossRef] [PubMed]
- Becker, S.T.; Beck-broichsitter, B.E.; Graetz, C.; Dörfer, C.E.; Wiltfang, J.; Häsler, R. Peri-Implantitis versus Periodontitis: Functional Differences Indicated by Transcriptome Profiling. Clin. Implant Dent. Relat. Res. 2014, 16, 401–411. [Google Scholar] [CrossRef] [PubMed]
- Munksgaard, B. Structure of periodontal tissues in health and disease. Periodontology 2000 2006, 40, 11–28. [Google Scholar]
- Munksgaard, B. Periodontal diagnoses and classification of periodontal diseases. Periodontology 2000 2004, 34, 9–21. [Google Scholar]
- Gaviria, L.; Salcido, J.P.; Guda, T.; Ong, J.L. Current trends in dental implants. J. Korean Assoc. Oral Maxillofac. Surg. 2014, 40, 50. [Google Scholar] [CrossRef] [PubMed]
- Gupta, A.; Dhanraj, M.; Sivagami, G. Status of surface treatment in endosseous implant: A literary overview. Indian J. Dent. Res. 2010, 21, 433–438. [Google Scholar] [CrossRef] [PubMed]
- Draenert, F.G.; Huetzen, D.; Neff, A.; Mueller, W.E.G. Vertical bone augmentation procedures: Basics and techniques in dental implantology. J. Biomed. Mater. Res. Part A 2014, 102, 1605–1613. [Google Scholar] [CrossRef] [PubMed]
- Wang, L.; Shi, H.; Chen, Y.; Xue, J.; Chen, Y.; Liao, Y. Healing of acute alveolar bone dehiscence following treatment with porous biphasic calcium phosphate in beagle dogs. Clin. Oral Investig. 2011, 15, 983–991. [Google Scholar] [CrossRef] [PubMed]
- Engler, W.O.; Ramfjord, S.P.; Hiniker, J.J. Healing following simple gingivectomy. A tritiated thymidine radioautographic study. I. Epithelialization. J. Periodontol. 1966, 37, 298–308. [Google Scholar] [CrossRef] [PubMed]
- Melcher, A.H. On the repair potential of periodontal tissues. J. Periodontol. 1976, 47, 256–260. [Google Scholar] [CrossRef] [PubMed]
- Bashutski, J.D.; Wang, H.L. Periodontal and Endodontic Regeneration. J. Endod. 2009, 35, 321–328. [Google Scholar] [CrossRef] [PubMed]
- Karring, T.; Nyman, S.; Gottlow, J.; Laurell, L. Development of the biological concept of guided tissue regeneration—animal and human studies. Periodontology 2000 1993, 1, 26–35. [Google Scholar] [CrossRef]
- Nyman, S.; Gottlow, J.; Lindhe, J.; Karring, T.; Wennstrom, J. New attachment formation by guided tissue regeneration. J. Periodontal Res. 1987, 22, 252–254. [Google Scholar] [CrossRef]
- Singh, A.K. GTR membranes: The barriers for periodontal regeneration. DHR Int. J. Med. Sci. 2013, 4, 31–38. [Google Scholar]
- Aurer, A. Membranes for Periodontal Regeneration. Acta Stomatol. Croat. 2005, 39, 107–112. [Google Scholar]
- Taschieri, S.; Del Fabbro, M.; Testori, T.; Saita, M.; Weinstein, R. Efficacy of guided tissue regeneration in the management of through-and-through lesions following surgical endodontics: A preliminary study. Int. J. Periodontics Restor. Dent. 2008, 28, 265–271. [Google Scholar]
- Iviglia, G. Design, Development and Characterization of Novel Biomaterials for Periodontal Tissue Engineering. Ph.D. Thesis, Politecnico di Torino, Iviglia, Spain, 2016. [Google Scholar] [CrossRef]
- Carbonell, J.M.; Martin, I.S.; Santos, A.; Pujol, A.; Sanz-Moliner, J.D.; Nart, J. High-density polytetrafluoroethylene membranes in guided bone and tissue regeneration procedures: A literature review. Int. J. Oral Maxillofac. Surg. 2014, 43, 75–84. [Google Scholar] [CrossRef] [PubMed]
- Stoecklin-Wasmer, C.; Rutjes, A.W.S.; da Costa, B.R.; Salvi, G.E.; Jüni, P.; Sculean, A. Absorbable collagen membranes for periodontal regeneration: A systematic review. J. Dent. Res. 2013, 92, 773–781. [Google Scholar] [CrossRef] [PubMed]
- Bunyaratavej, P.; Wang, H. Collagen Membranes: A Review. J. Periodontol. 2001, 71, 215–229. [Google Scholar] [CrossRef]
- Zilberman, M.; Elsner, J.J. Antibiotic-eluting medical devices for various applications. J. Control. Release 2008, 130, 202–215. [Google Scholar] [CrossRef] [PubMed]
- Pruitt, B.A.; Levine, N.S. Characteristics and uses of biologic dressings and skin substitutes. Arch. Surg. 1984, 119, 312–322. [Google Scholar] [CrossRef]
- Trafny, E.A.; Kowalska, K.; Grzybowski, J. Adhesion of Pseudomonas aeruginosa to collagen biomaterials: Effect of amikacin and ciprofloxacin on the colonization and survival of the adherent organisms. J. Biomed. Mater. Res. 1998, 41, 593–599. [Google Scholar] [CrossRef]
- Wu, X.; Black, L.; Santacana-Laffitte, G.; Patrick, C.W. Preparation and assessment of glutaraldehyde-crosslinked collagen-chitosan hydrogels for adipose tissue engineering. J. Biomed. Mater. Res. Part A 2007, 81, 59–65. [Google Scholar] [CrossRef]
- Gough, J.E.; Scotchford, C.A.; Downes, S. Cytotoxicity of glutaraldehyde crosslinked collagen/poly(vinyl alcohol) films is by the mechanism of apoptosis. J. Biomed. Mater. Res. 2002, 61, 121–130. [Google Scholar] [CrossRef]
- Park, J.Y.; Jung, I.H.; Kim, Y.K.; Lim, H.C.; Lee, J.S.; Jung, U.W.; Choi, S.H. Guided bone regeneration using 1-ethyl-3-(3-dimethylaminopropyl) carbodiimide (EDC)-cross-linked type-I collagen membrane with biphasic calcium phosphate at rabbit calvarial defects. Biomater. Res. 2015, 19, 15. [Google Scholar] [CrossRef]
- Shavandi, A.; Bekhit, A.E.D.A.; Saeedi, P.; Izadifar, Z.; Bekhit, A.A.; Khademhosseini, A. Polyphenol uses in biomaterials engineering. Biomaterials 2018, 167, 91–106. [Google Scholar] [CrossRef]
- He, L.; Mu, C.; Shi, J.; Zhang, Q.; Shi, B.; Lin, W. Modification of collagen with a natural cross-linker, procyanidin. Int. J. Biol. Macromol. 2011, 48, 354–359. [Google Scholar] [CrossRef]
- Choi, Y.; Kim, H.J.; Min, K.S. Effects of proanthocyanidin, a crosslinking agent, on physical and biological properties of collagen hydrogel scaffold. Restor. Dent. Endod. 2016, 41, 296. [Google Scholar] [CrossRef]
- Yamaguchi, M.; Ma, Z.J. Effect of Polyphenols on Calcium Content and Alkaline Phosphatase Activity in Rat Femoral Tissues in Vitro. Biol. Pharm. Bull. 2001, 24, 1437–1439. [Google Scholar] [CrossRef]
- Hämäläinen, M.; Nieminen, R.; Vuorela, P.; Heinonen, M.; Moilanen, E. Anti-inflammatory effects of flavonoids: Genistein, kaempferol, quercetin, and daidzein inhibit STAT-1 and NF-κB activations, whereas flavone, isorhamnetin, naringenin, and pelargonidin inhibit only NF-κB activation along with their inhibitory effect on i. Mediators Inflamm. 2007, 2007. [Google Scholar] [CrossRef]
- Miyake, M.; Arai, N.; Ushio, S.; Iwaki, K.; Ikeda, M.; Kurimoto, M. Promoting Effect of Kaempferol on the Differentiation and Mineralization of Murine Pre-osteoblastic Cell Line MC3T3-E1. Biosci. Biotechnol. Biochem. 2003, 67, 1199–1205. [Google Scholar] [CrossRef]
- Yamaguchi, M.; Arbiser, J.L.; Weitzmann, M.N. Honokiol stimulates osteoblastogenesis by suppressing NF-κB activation. Int. J. Mol. Med. 2011, 28, 1049–1053. [Google Scholar] [CrossRef]
- Prouillet, C.; Mazière, J.C.; Mazière, C.; Wattel, A.; Brazier, M.; Kamel, S. Stimulatory effect of naturally occurring flavonols quercetin and kaempferol on alkaline phosphatase activity in MG-63 human osteoblasts through ERK and estrogen receptor pathway. Biochem. Pharmacol. 2004, 67, 1307–1313. [Google Scholar] [CrossRef]
- Torre, E. Molecular signaling mechanisms behind polyphenol-induced bone anabolism. Phytochem. Rev. 2017, 16, 1183–1226. [Google Scholar] [CrossRef]
- Rodriguez, I.A.; Selders, G.S.; Fetz, A.E.; Gehrmann, C.J.; Stein, S.H.; Evensky, J.A.; Green, M.S.; Bowlin, G.L. Barrier membranes for dental applications: A review and sweet advancement in membrane developments. Mouth Teeth 2018, 2, 1–9. [Google Scholar] [CrossRef]
- Santos, J.; Oliveira, M.B.P.P.; Ibáñez, E.; Herrero, M. Phenolic profile evolution of different ready-to-eat baby-leaf vegetables during storage. J. Chromatogr. A 2014, 1327, 118–131. [Google Scholar] [CrossRef] [Green Version]
- Mozetič, B.; Tomažič, I.; Škvarč, A.; Trebše, P. Determination of polyphenols in white grape berries cv. Rebula. Acta Chim. Slov. 2006, 53, 58–64. [Google Scholar]
- Ma, J.; Kitti, U.; Teronen, O.; Sorsa, T.; Husa, V.; Laine, P.; Rönkä, H.; Salo, T.; Lindqvist, C.; Konttinen, Y.T. Collagenases in different categories of peri-implant vertical bone loss. J. Dent. Res. 2000, 79, 1870–1873. [Google Scholar] [CrossRef]
- Khodzhimetov, T.A. Measuring devices for monitoring parodontium resistance and endurance towards chewing load. Biomed. Eng. 1997, 31, 56–58. [Google Scholar] [CrossRef]
- Coïc, M.; Placet, V.; Jacquet, E.; Meyer, C. Mechanical properties of collagen membranes used in guided bone regeneration: A comparative study of three models. Rev. Stomatol. Chir. Maxillofac. 2010, 111, 286–290. [Google Scholar] [CrossRef]
- Ortolani, E.; Quadrini, F.; Bellisario, D.; Santo, L.; Polimeni, A.; Santarsiero, A. Mechanical qualification of collagen membranes used in dentistry. Ann. Ist. Super. Sanita 2015, 51, 229–235. [Google Scholar] [CrossRef]
- Yang, W.; Sherman, V.R.; Gludovatz, B.; Schaible, E.; Stewart, P.; Ritchie, R.O.; Meyers, M.A. On the tear resistance of skin. Nat. Commun. 2015, 6. [Google Scholar] [CrossRef]
- Pensalfini, M.; Meneghello, S.; Lintas, V.; Bircher, K.; Ehret, A.E.; Mazza, E. The suture retention test, revisited and revised. J. Mech. Behav. Biomed. Mater. 2018, 77, 711–717. [Google Scholar] [CrossRef]
- Yang, X.; Wu, D.; Du, Z.; Li, R.; Chen, X.; Li, X. Spectroscopy Study on the Interaction of Quercetin with Collagen. J. Agric. Food Chem. 2009, 57, 3431–3435. [Google Scholar] [CrossRef]
- Torre, E.; Iviglia, G.; Cassinelli, C.; Morra, M. Potentials of polyphenols in bone-implant devices. In Polyphenols; Janica, W., Ed.; IntechOpen: London, UK, 2018. [Google Scholar] [CrossRef]
- Caballé-Serrano, J.; Sawada, K.; Miron, R.J.; Bosshardt, D.D.; Buser, D.; Gruber, R. Collagen barrier membranes adsorb growth factors liberated from autogenous bone chips. Clin. Oral Implants Res. 2017, 28, 236–241. [Google Scholar] [CrossRef]
- Hoornaert, A.; D’Arros, C.; Heymann, M.F.; Layrolle, P. Biocompatibility, resorption and biofunctionality of a new synthetic biodegradable membrane for guided bone regeneration. Biomed. Mater. 2016, 11. [Google Scholar] [CrossRef]
- Sionkowska, A. Modification of collagen films by ultraviolet irradiation. Polym. Degrad. Stab. 2000, 68, 147–151. [Google Scholar] [CrossRef]
- Wu, K.J.; Wang, C.Y.; Lu, H.K. Effect of glutaraldehyde on the humoral immunogenicity and structure of porcine dermal collagen membranes. Arch. Oral Biol. 2004, 49, 305–311. [Google Scholar] [CrossRef]
- Brunel, G.; Piantoni, P.; Elharar, F.; Benque, E.; Marin, P.; Zahedi, S. Regeneration of rat calvarial defects using a bioabsorbable membrane technique: Influence of collagen cross-linking. J. Periodontol. 1996, 67, 1342–1348. [Google Scholar] [CrossRef]
- Quteish, D.; Dolby, A.E. The use of irradiated-crosslinked human collagen membrane in guided tissue regeneration. J. Clin. Periodontol. 1992, 19, 476–484. [Google Scholar] [CrossRef]
- Liu, R.R.; Fang, M.; Zhang, L.; Tang, C.F.; Dou, Q.; Chen, J.H. Anti-proteolytic capacity and bonding durability of proanthocyanidin-biomodified demineralized dentin matrix. Int. J. Oral Sci. 2014, 6, 168–174. [Google Scholar] [CrossRef] [Green Version]
- Velmurugan, P.; Singam, E.R.A.; Jonnalagadda, R.R.; Subramanian, V. Investigation on interaction of tannic acid with type i collagen and its effect on thermal, enzymatic, and conformational stability for tissue engineering applications. Biopolymers 2014, 101, 471–483. [Google Scholar] [CrossRef]
- Tang, H.R.; Covington, A.D.; Hancock, R.A. Structure-Activity Relationships in the Hydrophobic Interactions of Polyphenols with Cellulose and Collagen. Biopolymers 2003, 70, 403–413. [Google Scholar] [CrossRef]
- Dölz, R.; Heidemann, E. Influence of different tripeptides on the stability of the collagen triple helix. I. Analysis of the collagen sequence and identification of typical tripeptides. Biopolymers 1986, 25, 1069–1080. [Google Scholar] [CrossRef]
- Sin, B.Y.; Kim, H.P. Inhibition of collagenase by naturally-occurring flavonoids. Arch. Pharm. Res. 2009, 28, 1152–1155. [Google Scholar] [CrossRef]
- Kagan, H.M.; Jordan, R.E.; Lerch, R.M.; Mukherjee, D.P.; Stone, P.; Franzblau, C. Factors Affecting the Proteolytic Degradation of Elastin. In Elastin and Elastic Tissue. Advances in Experimental Medicine and Biology; Sandberg, L.B., Gray, W.R., Franzblau, C., Eds.; Springer: Boston, MA, USA; Volume 79. [CrossRef]
- Tixier, J.M.; Godeau, G.; Robert, A.M.; Hornebeck, W. Evidence by in vivo and in vitro studies that binding of pycnogenols to elastin affects its rate of degradation by elastases. Biochem. Pharmacol. 1984, 33, 3933–3939. [Google Scholar] [CrossRef]
- Pang, J.L.; Ricupero, D.A.; Huang, S.; Fatma, N.; Singh, D.P.; Romero, J.R.; Chattopadhyay, N. Differential activity of kaempferol and quercetin in attenuating tumor necrosis factor receptor family signaling in bone cells. Biochem. Pharmacol. 2006, 71, 818–826. [Google Scholar] [CrossRef]
- Steigmann, M. Pericardium membrane and xenograft particulate grafting materials for horizontal alveolar ridge defects. Implant Dent. 2006, 15, 186–191. [Google Scholar] [CrossRef]
- Ahn, Y.S.; Kim, S.G.; Kim, C.S.; Oh, J.S.; Lim, S.C. Effect of guided bone regeneration with or without pericardium bioabsorbable membrane on bone formation. Oral Surg. Oral Med. Oral Pathol. Oral Radiol. 2012, 114. [Google Scholar] [CrossRef]
- Fu, J.H.; Oh, T.J.; Benavides, E.; Rudek, I.; Wang, H.L. A randomized clinical trial evaluating the efficacy of the sandwich bone augmentation technique in increasing buccal bone thickness during implant placement surgery: I. Clinical and radiographic parameters. Clin. Oral Implants Res. 2014, 25, 458–467. [Google Scholar] [CrossRef]
- Bagchi, D.; Sen, C.K.; Ray, S.D.; Das, D.K.; Bagchi, M.; Preuss, H.G.; Vinson, J.A. Molecular mechanisms of cardioprotection by a novel grape seed proanthocyanidin extract. Mutat. Res. Fundam. Mol. Mech. Mutagenesis 2003, 523–524, 87–97. [Google Scholar] [CrossRef]
- Courtman, D.W.; Pereira, C.A.; Kashef, V.; McComb, D.; Lee, J.M.; Wilson, G.J. Development of a pericardial acellular matrix biomaterial: Biochemical and mechanical effects of cell extraction. J. Biomed. Mater. Res. 1994, 28, 655–666. [Google Scholar] [CrossRef]
- Wittenauer, J.; MäcKle, S.; Sußmann, D.; Schweiggert-Weisz, U.; Carle, R. Inhibitory effects of polyphenols from grape pomace extract on collagenase and elastase activity. Fitoterapia 2015, 101, 179–187. [Google Scholar] [CrossRef]
- Brand-Williams, W.; Cuvelier, M.E.; Berset, C. Use of a free radical method to evaluate antioxidant activity. LWT Food Sci. Technol. 1995, 28, 25–30. [Google Scholar] [CrossRef]
- Ribéreau-Gayon, P. Le dosage des anthocyanes dans le vins rouges. Bull. Soc. Chim. Fr. 1965, 9, 2649–2652. [Google Scholar] [CrossRef]
- ANSI/AAMI/ISO 7198: 2016 Cardiovascular Implants and Extracorporeal Systems—Vascular Prostheses—Tubular Vascular Grafts and Vascular Patches; Association for the Advancement of Medical Instrumentation (AAMI): Arlington, VA, USA, 2016.


| PRPE | GAE (g/mL) | Reduction (%) | Anthocyanins (µg/mL) |
|---|---|---|---|
| Nebbiolo | 3.44 | 44.3 | 74.4 |
| PRPE | Gallic Acid (mg/L) | Quercetin (mg/L) | Rutin (mg/L) | Malvidin-3-Glucoside (mg/L) |
|---|---|---|---|---|
| Nebbiolo | 19.43 | 66.46 | 38.45 | 3.76 |
| Phenolic Content (mg/mL GAE) | Antioxidant Power (%) |
|---|---|
| 0.2 ± 0.12 | 3.2 ± 0.6 |
| Time (min) | MPA (%) | MPB (%) |
|---|---|---|
| 0–35 | 100 → 95 | 0 → 5 |
| 35–80 | 95 → 80 | 5 → 20 |
| 80–110 | 80 → 0 | 20 → 100 |
| 110–113 | 0 | 100 |
| 113–123 | 0 → 100 | 100 → 0 |
© 2019 by the authors. Licensee MDPI, Basel, Switzerland. This article is an open access article distributed under the terms and conditions of the Creative Commons Attribution (CC BY) license (http://creativecommons.org/licenses/by/4.0/).
Share and Cite
Russo, N.; Cassinelli, C.; Torre, E.; Morra, M.; Iviglia, G. Improvement of the Physical Properties of Guided Bone Regeneration Membrane from Porcine Pericardium by Polyphenols-Rich Pomace Extract. Materials 2019, 12, 2564. https://0-doi-org.brum.beds.ac.uk/10.3390/ma12162564
Russo N, Cassinelli C, Torre E, Morra M, Iviglia G. Improvement of the Physical Properties of Guided Bone Regeneration Membrane from Porcine Pericardium by Polyphenols-Rich Pomace Extract. Materials. 2019; 12(16):2564. https://0-doi-org.brum.beds.ac.uk/10.3390/ma12162564
Chicago/Turabian StyleRusso, Nazario, Clara Cassinelli, Elisa Torre, Marco Morra, and Giorgio Iviglia. 2019. "Improvement of the Physical Properties of Guided Bone Regeneration Membrane from Porcine Pericardium by Polyphenols-Rich Pomace Extract" Materials 12, no. 16: 2564. https://0-doi-org.brum.beds.ac.uk/10.3390/ma12162564