Article

Effect of Metal Surface Topography on the Interlaminar Shear and Tensile Strength of Aluminum/Polyamide 6 Polymer-Metal-Hybrids

1
Materials and Surface Engineering Group, Faculty of Mechanical Engineering, Chemnitz University of Technology, D-09107 Chemnitz, Germany
2
Micromanufacturing Technology Group, Faculty of Mechanical Engineering, Chemnitz University of Technology, D-09107 Chemnitz, Germany
*
Author to whom correspondence should be addressed.
Submission received: 26 August 2019 / Revised: 6 September 2019 / Accepted: 10 September 2019 / Published: 12 September 2019

Abstract

:
Mechanical interlocking has been proven to be an effective bonding mechanism for dissimilar material groups like polymers and metals. Therefore, this contribution assesses several surface pretreatments for the metallic adherent. Blasting, etching, combined blasting and etching, thermal spraying, and laser structuring processes are investigated with regard to the achievable interlaminar strength and the corresponding surface roughness parameters. The experiments are carried out on EN AW-6082/polyamide 6 polymer-metal-hybrids, utilizing a novel butt-bonded hollow cylinder specimen geometry for determining the shear and tensile strength. The experimental results indicate that the surface roughness slope has a major impact on the interlaminar strength. A laser-generated pin structure is found to provide the best mechanical performance as well as the highest surface slope of all investigated structuring methods.

1. Introduction

Thermoplastic polymer-metal-hybrids (PMH) offer great potential for automotive applications due to their quick processability and high strength/stiffness-to-weight ratio. In this context, a key challenge is to develop cost and time efficient techniques for creating a well-adhering interface in-between both dissimilar materials. One promising approach is adhesion by micro-scale mechanical interlocking. During joining, the polymer itself is used as the adhesive, as it infiltrates the roughness features of the metallic surface and interlocks them.
For this purpose, various joining techniques can be applied to produce mechanically interlocked PMH. In most cases, metal and polymer are placed together under pressure, while the contact area between both adherents is heated up until the polymer starts to melt. Katayama and Kawahito [1] as well as Bergmann and Stambke [2] generated the thermal energy by a laser beam, whereas Mitschang et al. [3] used induction heating. Wagner et al. [4] as well as Steinert et al. [5] utilized ultrasonic oscillations for melting the polymer. Flock [6] as well as Haberstroh and Sickert [7] applied direct heat conduction to the metallic adherent. Another approach is the direct infiltration of the metallic surface with molten thermoplastic by injection molding. Ramani [8] as well as Kleffel and Drummer [9] achieved a considerable interlaminar tensile strength when employing this method.
Besides the influence of the selected joining process, the level of achievable adhesion is directly connected to the surface characteristics of the metallic adherent. Therefore, a roughly structured and undercut surface of the metallic partner drastically increases the bonding strength compared to an untreated surface. Grit blasting is the most widely used structuring method, since it provides satisfactory adhesion with low effort and can be easily implemented in industrial applications. Consequently, it is often used as a benchmark for other structuring processes. Pan et al. [10] conducted a parameter study with different abrasive particle sizes on magnesium/carbon fiber-reinforced polymer (Mg/CFRP) laminates, concluding that larger particles create a rougher surface with a slightly increased shear strength. Etching processes offer the possibility of structuring large surfaces within a short duration, usually reaching an interlaminar strength slightly below the blasted equivalent. Mitschang et al. [11] achieved good adhesion with acidic pickling in nitric acid (HNO3) for an aluminum/fiber-reinforced polyamide (Al/FRPA) hybrid, whereas Nestler et al. [12] obtained the best results with alkaline pickling in a sodium hydroxide (NaOH) solution for a similar Al/FRPA hybrid. Laser structuring offers a high degree of freedom in designing the roughness features. Therefore, the highest adhesion can be obtained, although this technique is usually expensive and time consuming. Heckert and Zaeh [13] compared different laser manufactured structure sizes, wherein a kerf structure with a distance and depth of 200 µm provided the best adhesion between Al and FRPA. Steinert et al. [5] presented a self-organizing pin structure with a height of approximately 40 µm and a distance between the pins of 20 µm that reached a lap shear strength that was around 2.5 times higher than that of a blasted surface in an Al/FRPA hybrid. As an additive structuring method, thermal spraying provides an irregular, rough, and undercut surface. Utilizing a NiAl5 coating, Lindner et al. [14] reported a lap shear strength that was around 1.35 times higher than that of a blasted surface within an Al/FRPA hybrid.
As the shape of the microstructure is so important to the interface properties, proper surface characterization is mandatory for predicting the possible interlaminar strength. The most commonly used characterization method is the surface roughness measurement since it is a quick, inexpensive and widely standardized approach. Chen et al. [15] investigated the relation between various roughness parameters and the achieved shear strength of a steel/bone cement joint. Spacing (correlation length β) and amplitude parameters (arithmetical average roughness Ra) gave no accordance, whereas the root mean square slope RΔq that considers the relation between amplitude and spacing gave a good accordance. However, no relation between the investigated roughness parameters and the achievable tensile strength was given.
Regarding the contributions of different authors, a significant shortcoming is the missing comparability of the obtained test results due to the different test methods that have been used. Saborowski et al. [16] reported that especially the very popular lap shear test massively underestimates the shear strength for single lap joints of metal and unreinforced thermoplastics. Therefore, Saborowski et al. [17] adapted a test method which was initially proposed by Mahnken and Schlimmer [18] for testing adhesives. Thereby, butt-bonded hollow cylinders were utilized for interlaminar strength testing. The determined shear strength values were found to be way more precise than the results of the lap shear test. Moreover, tensile strength testing can be accomplished with the same specimen geometry.
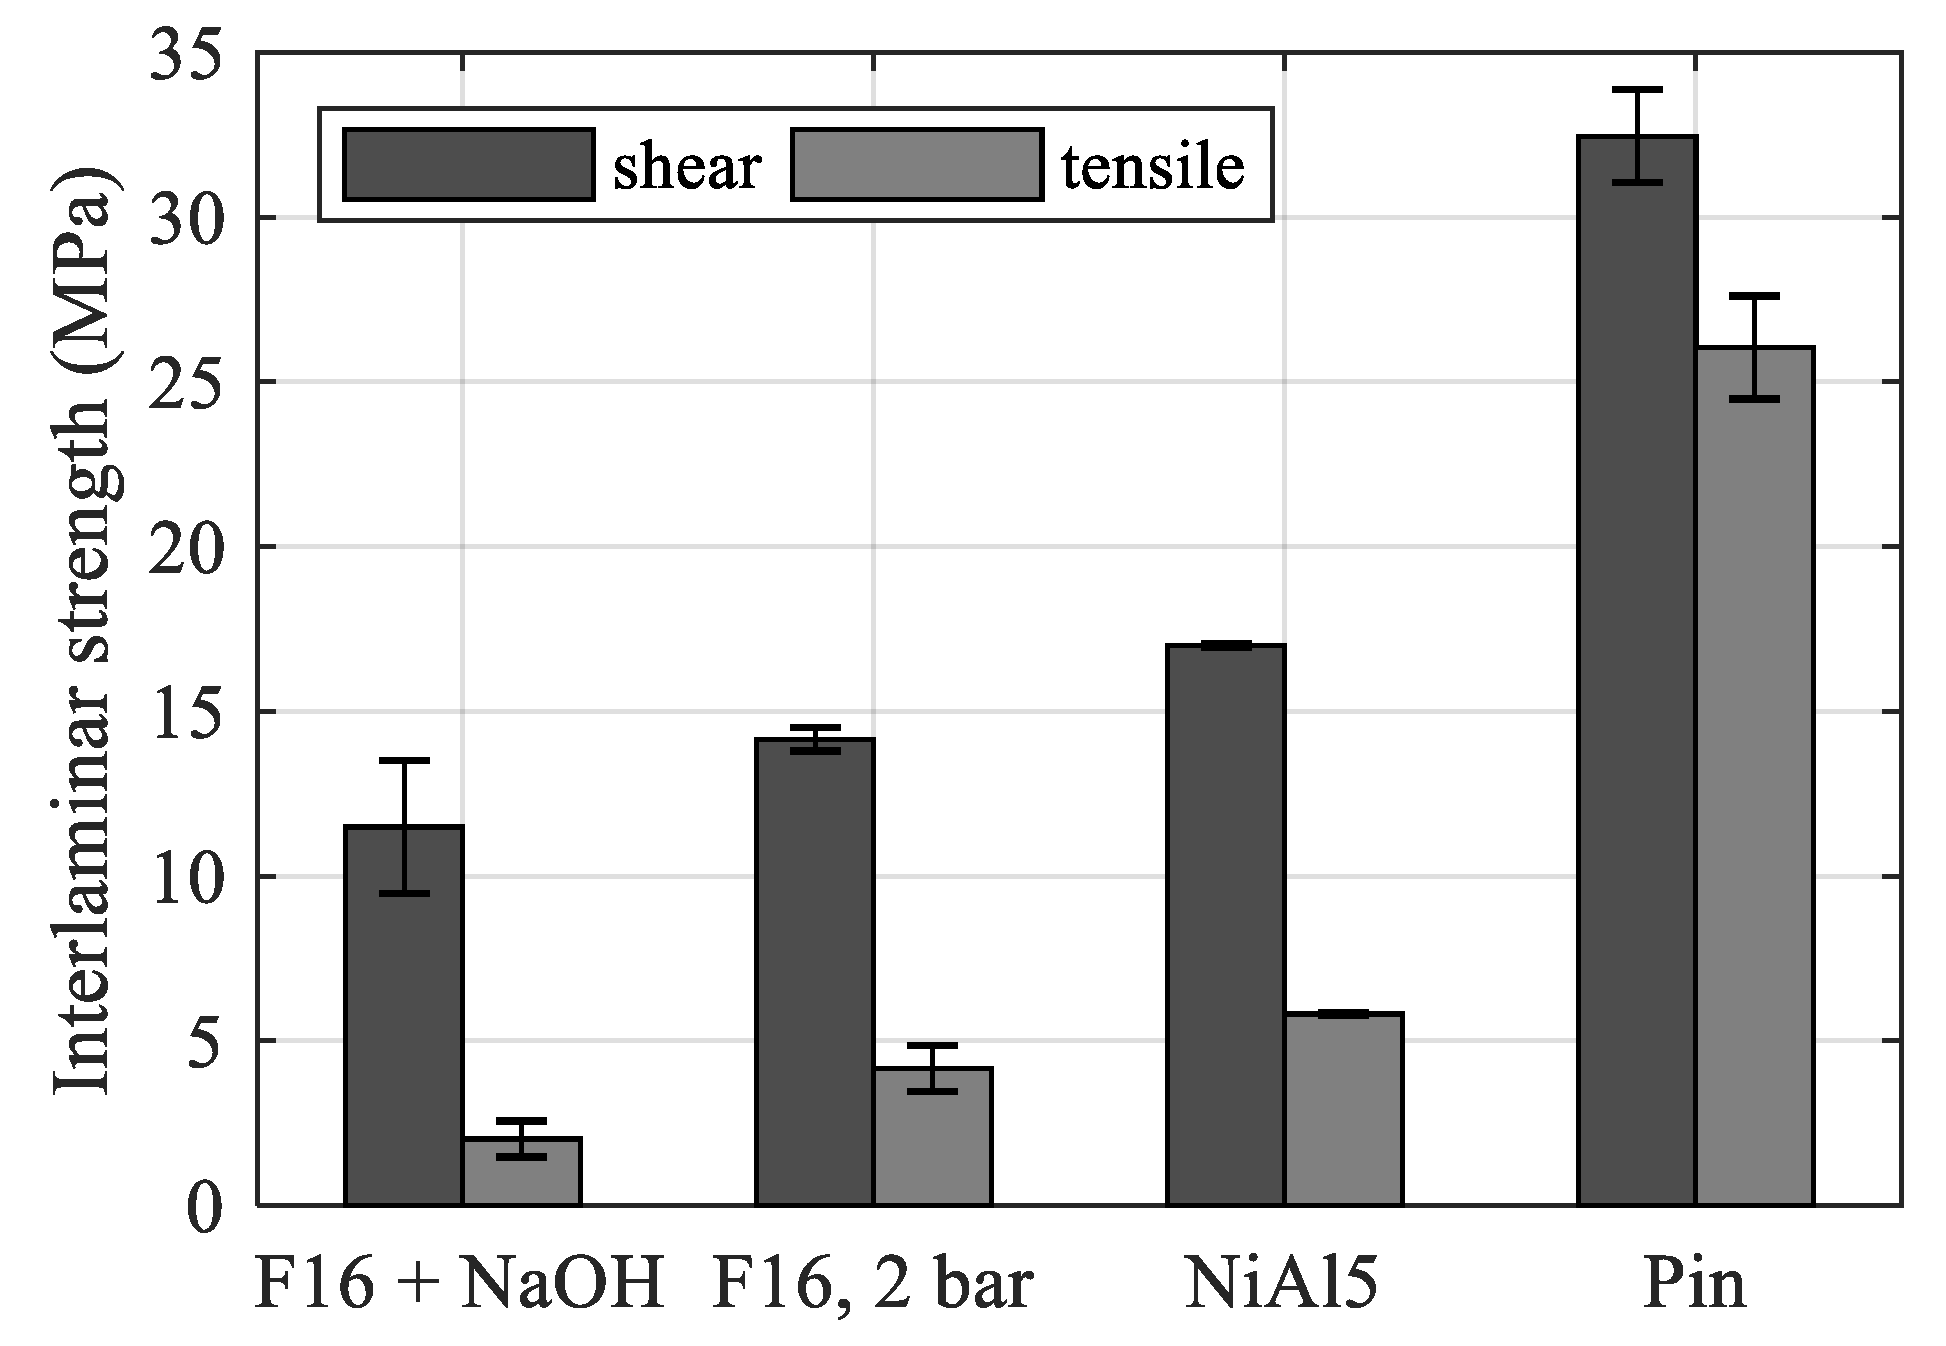
The aim of this contribution is to investigate the correlation of different roughness parameters with the interlaminar shear and tensile strength of EN AW-6082/polyamide 6 (PA6) hybrids. For this reason, several state-of-the-art surface structuring methods are applied and the surface roughness parameters Rz (average maximum profile height) and tanθ (surface roughness slope) are evaluated. Reliable strength values are obtained by using the butt-bonded hollow cylinder specimen geometry. Preliminary lap shear tests are performed to determine strength-optimized processing parameters for grit blasting, etching, and combined blasting and etching processes for the selected PMH. Optimized laser structuring as well as thermal spraying parameters are deduced from previous investigations conducted by Steinert et al. [5] and Saborowski et al. [
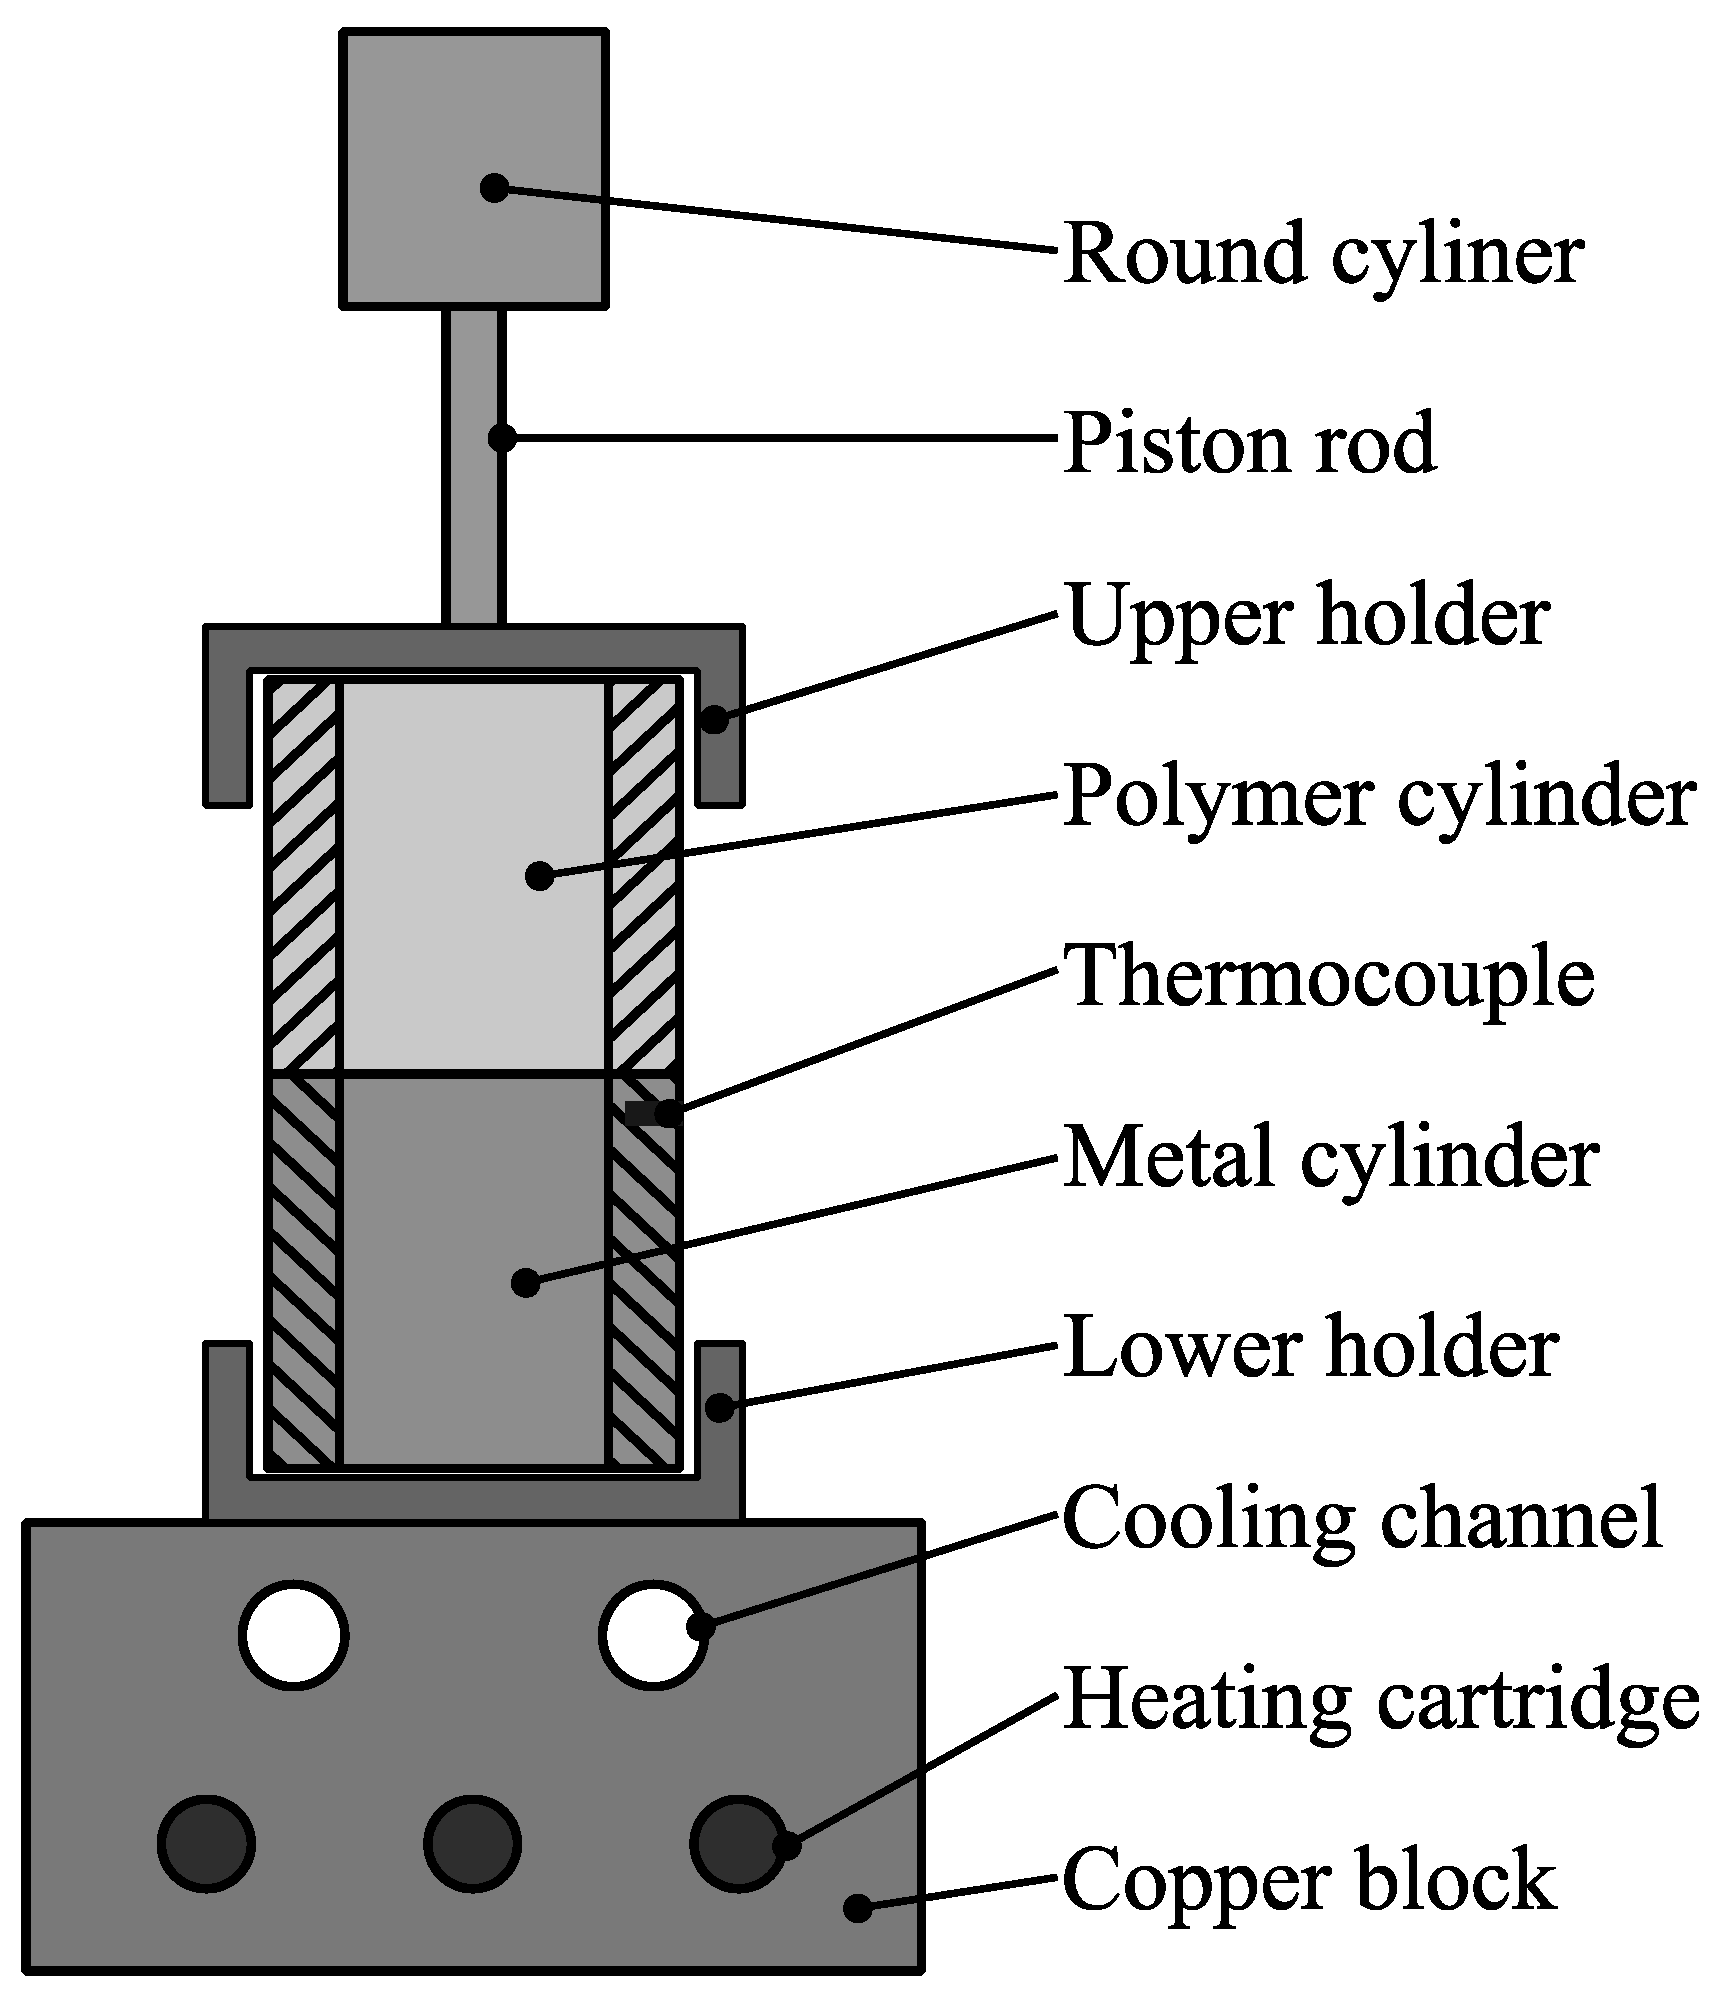
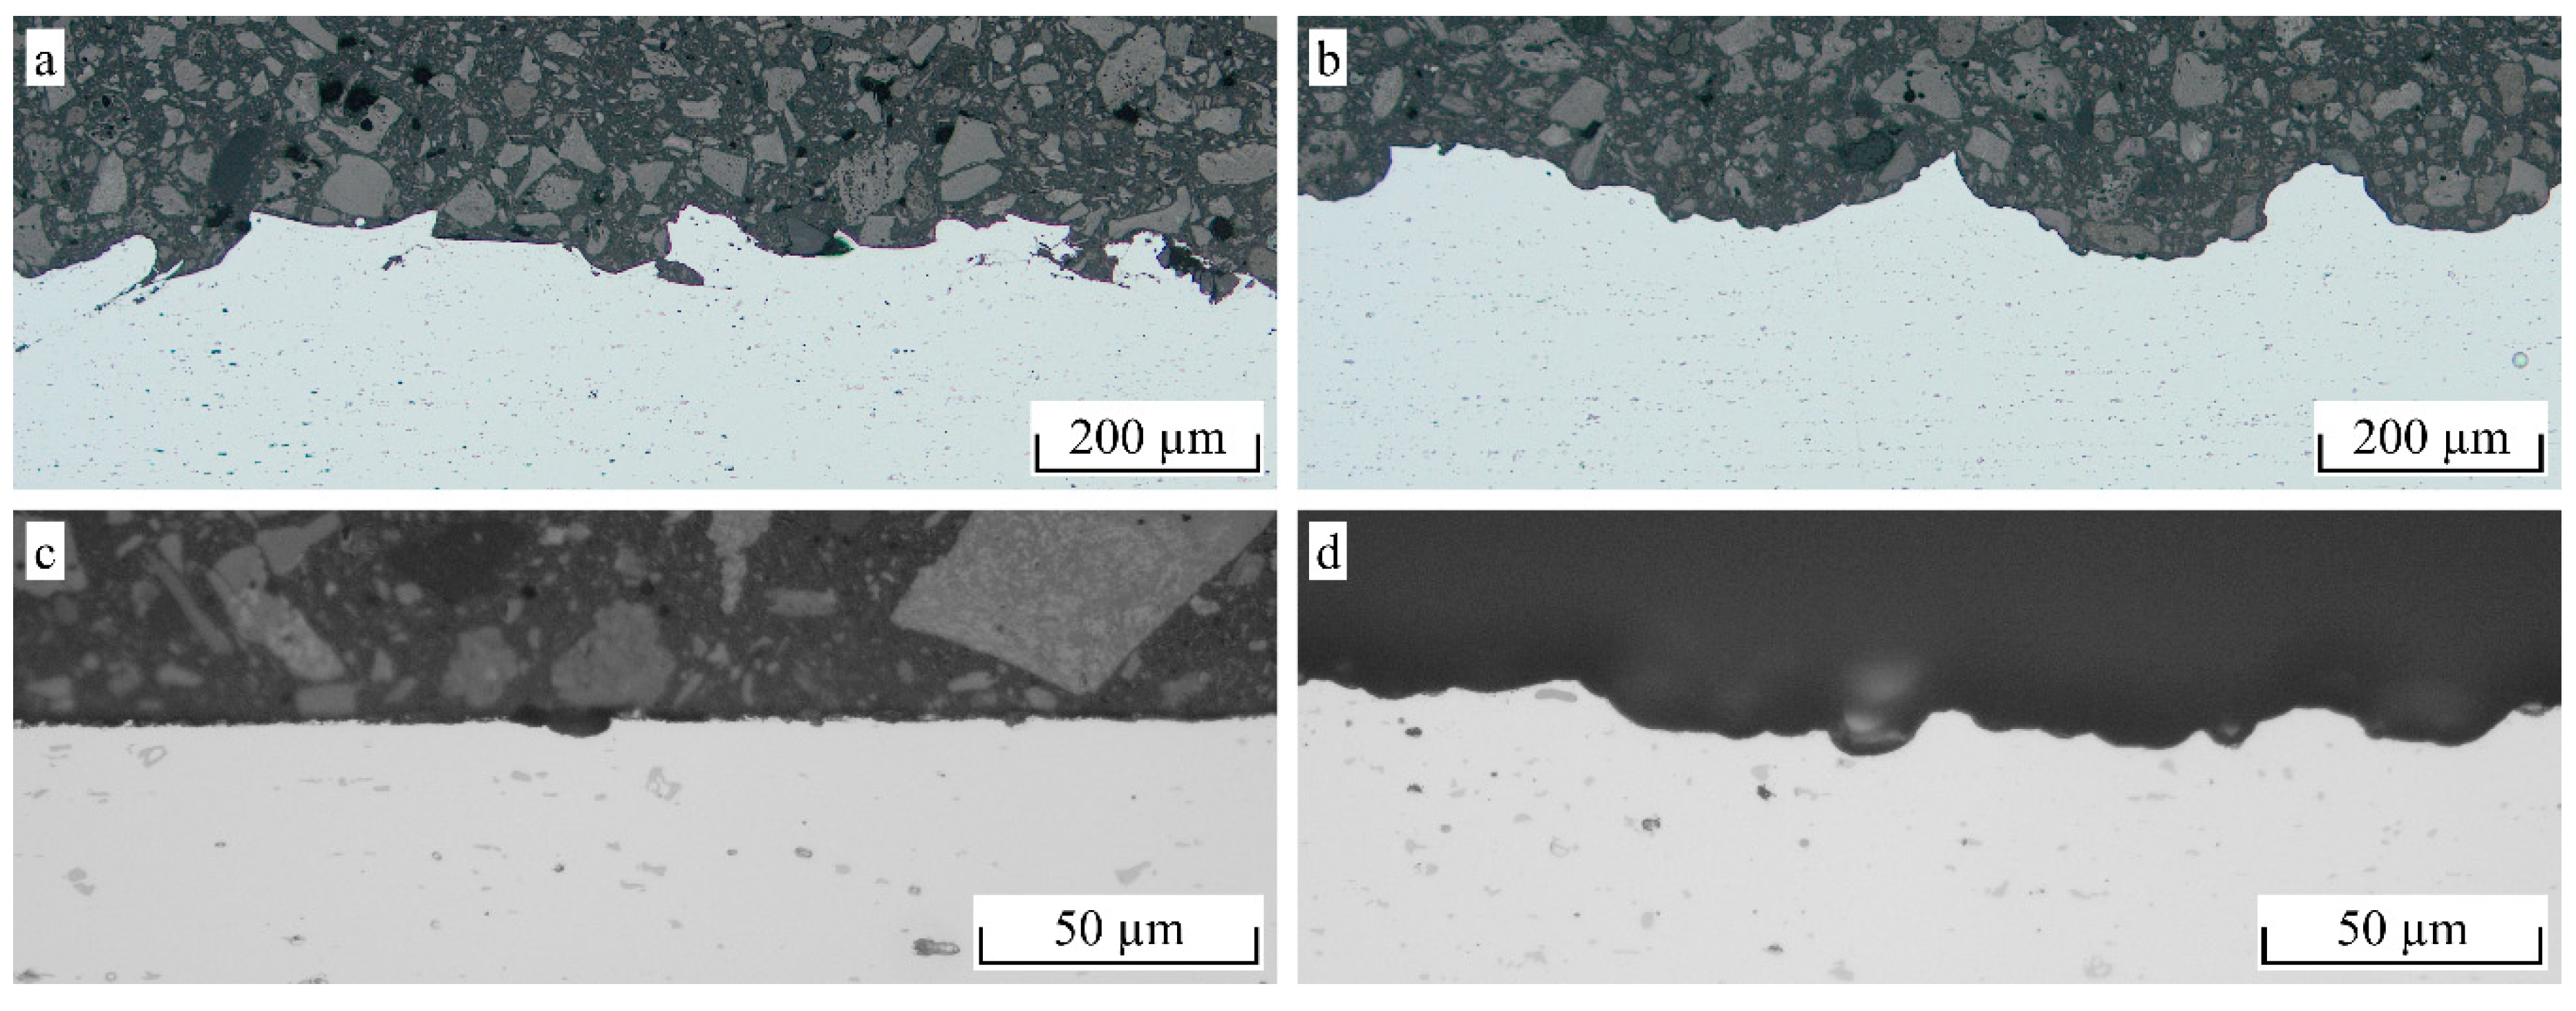
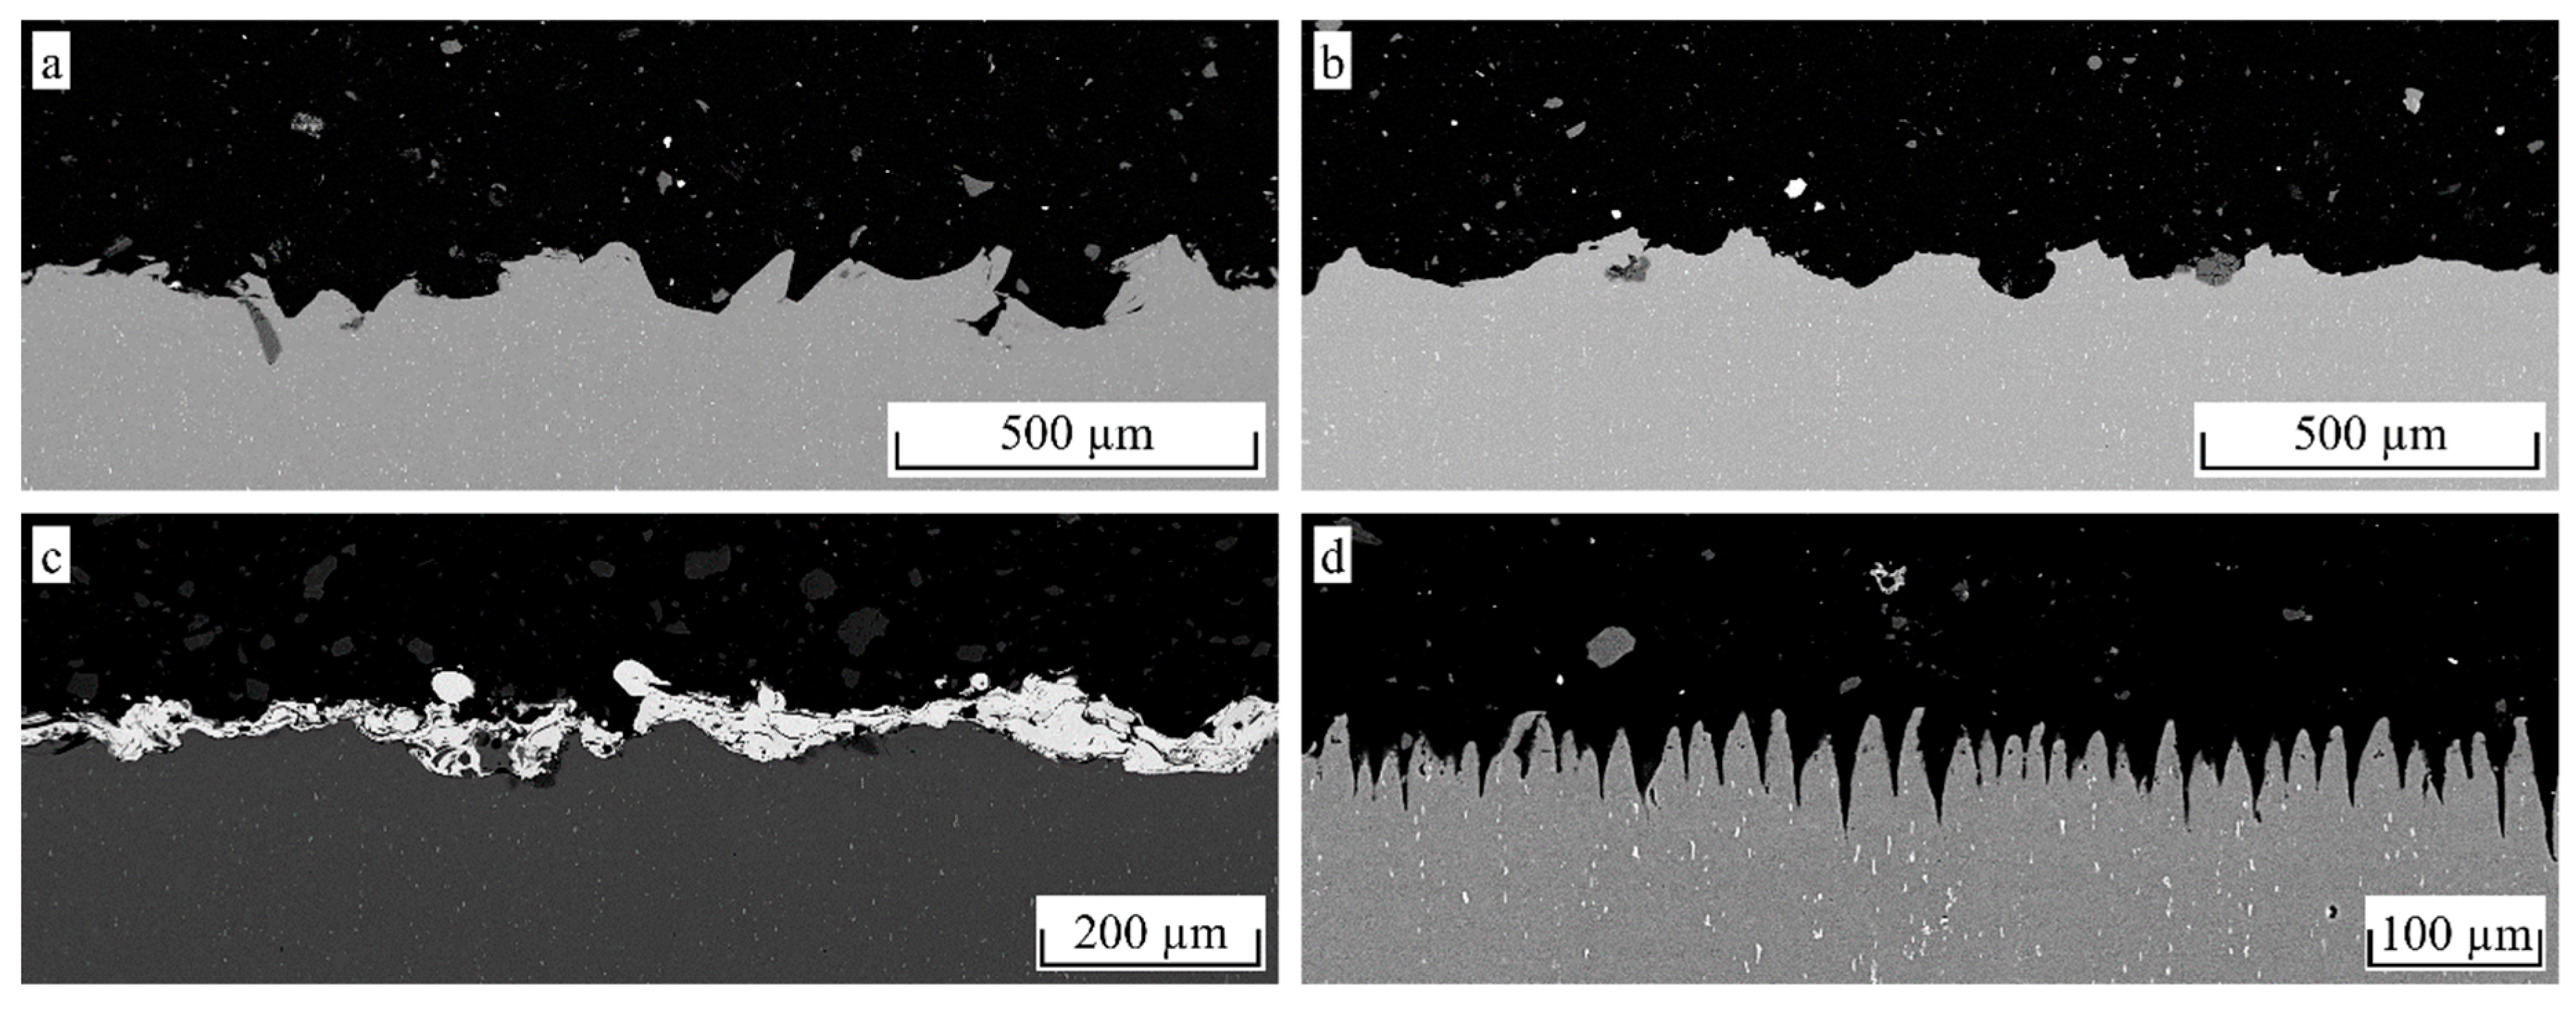
17], respectively. The specimens are manufactured by heat conduction hot pressing. Finally, the fracture surfaces are characterized in terms of their morphology and topography in order to investigate the relation between interlaminar strength and load direction as well as the failure mode depending on the applied structuring method.

2. Materials and Methods

2.1. Materials

The investigated metal-thermoplastic hybrid consists of Ultramid® B3 PA6 (BASF, Ludwigshafen, Germany) and EN AW-6082 aluminum alloy. Table 1 shows the material properties. The parameters for the PA6 are given for a humid condition, which is achieved by conditioning the material according to ISO 1110 at 343 K and 62% relative humidity. The PA6 was conditioned before testing following this standard.

2.2. Testing Methods

2.2.1. Lap Shear Test

The lap shear specimen illustrated in Figure 1 consists of two overlapping plates of height h (indices: m = metal, p = polymer), width w and overlapping length lo. The clamping length is given by lc and the free length is given by lf.
The geometrical parameters can be seen in Table 2. The experiments were carried out utilizing an Allround-Line 20 kN testing machine (Zwick/Roell, Ulm, Germany) with a crosshead speed of 1 mm/min. Five specimens were tested for each surface treatment.
The specimen was loaded with a tensile force perpendicular to the joining zone, causing a shear stress within the interface. The lap shear strength τl,max was calculated from the fracture force Fmax divided by the overlap area Ao.
τ l , max = F max A o = F max l o w

2.2.2. Butt-Bonded Hollow Cylinder Test

The specimen illustrated in Figure 2 consists of two butt-bonded hollow cylinders with the outer diameter do and the inner diameter di.
The specimen was tested with a PTT 250 K1 hydraulic testing machine (Carl Schenck AG, Darmstadt, Germany). ER40 - 472E collets according to ISO 15488 were utilized for clamping. A steel plug was put into the polymer cylinder to support it against squeezing when the collet was tightened. The geometrical parameters of the hollow cylinder specimens are listed in Table 3. Five specimens were tested for each load case and surface treatment.
For determining the interlaminar shear strength, the joint was loaded with a torsional moment, which caused an almost pure shear stress within the interface. The specimen was twisted until it fractured, with an angular velocity of 15°/min. The shear strength τmax was calculated from the maximum torque Tmax divided by the polar section modulus Wp.
τ max = T max W P = 16 T max d o π ( d o 4 d i 4 )
For identifying the tensile strength, the specimen was loaded with a tensile force, causing an almost pure normal stress within the interface. The specimen was pulled until it fractured, with a crosshead speed of 0.36 mm/min. The tensile strength σmax was calculated from the maximum tensile force Fmax divided by the overlapping area Ao.
σ max = F max A o = 4 F max π ( d o 2 d i 2 )

2.3. Surface Pretreatment

2.3.1. Grit Blasting

The morphology of grit blasted surfaces depends on the particle type, particle size, blasting angle, blasting distance, blasting pressure and blasting time. A corundum (Al2O3) particle type, a blasting distance of 100 mm and a treatment time of 10 s were utilized. Amada and Hirose [19] as well as Mohammedi et al. [20] found that a blasting angle of 75° provided the best adhesion for thermally sprayed ceramic coatings on a metallic substrate. Since these coatings also mainly adhere by mechanical interlocking, the same blasting angle was used here. Four different particle sizes (Wiwox F120 (90–125 µm), Wiwox F54 (250–355 µm), WFA F24 (600–850 µm) and WFA F16 (1000–1400 µm)) with three different pressures (1 bar, 2 bar and 3 bar) were investigated.

2.3.2. Etching

The etching processes are based on the findings of Nestler et al. [12], who identified alkaline (NaOH) and acidic (HNO3) treatment to provide strong adhesion between EN AW-6082 and fiber-reinforced PA6. Alkaline etching was carried out with 2% NaOH solution at 343 K. Afterwards, the sheets were dipped into 50% HNO3 solution at ambient temperature for 2 min to remove reaction products from the surface. For acidic etching, the sheets were dipped for 1 min into 3% NaOH solution at 323 K in order to remove the oxide layer from the aluminum. Afterwards, the sheets were treated with 50% HNO3 solution. Treatment times of 1 min, 3 min, 10 min, and 20 min were investigated.

2.3.3. Grit Blasting and Alkaline Etching

According to the findings of Nestler et al. [12], corundum blasting (cb) with a F24 grit size at 2 bar creates a surface roughness approximately six times higher than alkaline etching in 2% NaOH solution at 343 K for 10 min. Combined corundum blasting and etching is motivated by forming small etching structures on the much coarser blasting structures. Thereby, the additional specific surface area and fracturing of the surface should further enhance the interlaminar strength. Three different particle sizes (Wiwox F54 and WFA F24/F16, 3 bar each) and a subsequent NaOH treatment (2%, 343 K, 5 min) were investigated.

2.3.4. Thermal Spraying

The thermal spraying process is based on the findings of Lindner et al. [14] and Saborowski et al. [17], who identified a NiAl5 coating suitable for creating good adhesion between aluminum and PA6. The resulting surface is characterized by a high roughness as well as the formation of undercuts. A strong adhesion of the coating onto the aluminum is achieved by corundum blasting. WFA F24 Al2O3 particles are applied with a pressure of 2 bar, an angle of 75° and a distance of 100 mm. The coating is applied by electric wire arc spraying, utilizing a VisuArc 350 spraying system (Oerlikon Metco, Pfäffikon, Switzerland). The spraying parameters are summarized in Table 4.

2.3.5. Laser Structuring

The laser processing of the cylinder specimens was carried out by a nanosecond laser system (Spectra Physics®, Santa Clara, CA, USA) with the specifications shown in Table 5.
During laser processing, the material behavior significantly depends on the energy input into the surface. In accordance with the work of Baburaj [21], pin microstructures can be manufactured by applying a defined energy input above the material-specific threshold laser fluency. In preliminary experiments reported by Steinert et al. [5], it was found that the conditions for the generation of pin microstructures prevail in the range of a laser intensity of I ≈ 3–6 J/cm². These intensities are realized by using a defocused laser spot measuring 55 µm in diameter. The energy input leads to pin structures with an average structure height of about 40 µm and a maximum structure height of about 80 µm.

2.4. Specimen Production

The specimens were produced by heat conduction hot pressing. Beforehand, the PA6 was dried at 343 K. This avoided the formation of interfacial cavities by evaporating water during the hot pressing process. Moreover, the metallic surfaces were ultrasonically cleaned and degreased in ethanol. Figure 3 illustrates the hot pressing tool used for producing the hollow cylinder specimens.
Note, that the lap shear specimens were manufactured using the same tool with adapted specimen holders. According to the optimized production parameters determined by Haberstroh and Sickert [7], a constant interfacial joining pressure of 0.2 MPa was chosen. The maximum joining temperature was set to 508 K, which is just slightly above the melting temperature of the polyamide, in order to prevent excessive melting. Subsequently, the copper block was cooled down with an air cooling system until the temperature dropped below 373 K. Figure 4 illustrates the interfacial temperature over time during the joining process.
The temperature in the interface was observed by a thermocouple placed inside a drill-hole slightly below the metal surface. The complete hot pressing procedure can be summarized as follows:
(1)
Application of joining pressure (0.2 MPa);
(2)
Activation of heating cartridges (480 W in total) for heat generation;
(3)
Deactivation of heating cartridges when joining temperature (508 K) is reached;
(4)
Activation of air cooling;
(5)
Cooling down to 373 K;
(6)
Removal of joining pressure;
(7)
Removal of joined specimen;
The joined hollow cylinder specimens are reworked by turning on the inner and outer surface in order to ensure the necessary centricity for testing.

2.5. Roughness Evaluation

The average maximum profile height Rz as well as the roughness slope tanθ are evaluated in this contribution. Assuming scale-independent material behavior and complete penetration of the molten polymer into the structured surface, the interlaminar strength should also be independent of the scale. An alteration in the load-bearing cross-sectional area for one profile element is exactly balanced out by a corresponding alteration in the total number of profile elements. Consequently, Rz should not show a meaningful accordance with the interlaminar strength as it is only a measure for the scale, but not for the shape, for the profile elements.
On the other hand, the slope angle θ should have a direct relation to the interlaminar strength for two reasons: Firstly, a higher slope indicates the occurrence of more roughness features in relation to the roughness profile height. This leads to an enlarged specific surface and, therefore, to more possibilities for the polymer to interlock with the metallic surface. Secondly, the slope angle is directly related to micro-friction forces between metal and polymer. Figure 5 shows a shear force Fs (e.g., induced by a shear load or polymer shrinkage) pressing the polymer against the metallic roughness feature. The resulting normal force Fn = Fs sinθ and the tangential force Ft = Fs cosθ. An increase in θ leads to an increase in Fn. Hence, the maximum friction force µFn hindering the polymer from slipping is increased. µ denotes the friction coefficient between the polymer and metal. Additionally, Ft which forces the polymer to slip is decreased.
The roughness measurements were carried out according to ISO 4287, using a Hommel-Etamic® T8000 stylus profiler (JENOPTIK AG, Jena, Germany) with a 5 µm/90° stylus tip for the lap shear specimens and a 2 µm/60° stylus tip for the hollow cylinder specimens. Rz describes the average maximum profile height of the roughness features (Figure 6) within five times the sampling length lr (5lr equals the total evaluation length ln). Accordingly,
R z = 1 5 i = 1 5 R zi .
Assuming a simplified symmetrical wedge shape of the roughness profile, as shown in Figure 5,
tan θ = 2 R z RSm   with   RSm = 1 m i = 1 m x si ,
where RSm denotes the average width of the roughness features xs within one sampling length (Figure 6).
Usually, the actual roughness profile does not consist of symmetrical, repeating wedges, but of shapes very different in terms of the horizontal and vertical extent. Therefore, ISO 4287 proposes a minimum segment length of 0.01lr and a minimum segment height of 0.1Rz for the peaks that constitute one profile element. Peaks below this threshold are treated as noise and considered a part of the preceding peak. Depending on the measured Rz value as well as the chosen sampling length and threshold values the resulting RSm value can vary within a certain range. Another approach is presented by NASA Tech Brief 70-10722 [22], where the recorded output signal from the surface roughness tester is used to calculate
tan θ = 1 l n 0 l n | dy dx | dx ,
where y is the profile height signal as a function of distance x within the evaluation length ln. This approach yields the exact same value of tanθ when applied to the simplified profile shape shown in Figure 5. Applied to an actual roughness profile, a clear value is received, being independent from arbitrarily chosen threshold values like those of the 2Rz/RSm approach. Consequently, Equation (6) was chosen for roughness slope evaluation within this study.

3. Results and Discussion

3.1. Lap Shear Specimens

Figure 7a illustrates the results for the corundum blasted surfaces obtained by the lap shear tests. Despite considerable differences in the pressure, particle size and achieved roughness, the results only vary in a range of 9.98–12.17 MPa. The corresponding surface parameters for the highest strength values achieved with each particle size are shown in Table 6.
Despite a drastic difference in the average maximum profile height, the lap shear strength as well as the slope values are relatively close together. Except for the F24 treated surfaces, the lap shear strength increases with an increasing particle size. However, a clear correlation between the blasting pressure and strength is not observed. A higher pressure increases Rz as well as tanθ but also forces the embedding of corundum particles into the aluminum surface. Embedded particles may come loose when a load is applied to the interface. However, they are also considered roughness features when performing the surface roughness evaluation. Hence, the interlaminar strength in relation to tanθ decreases.
Figure 7b shows the lap shear strength for the etched surfaces. For the alkaline etching with NaOH, the strength (8.65–10.26 MPa), Rz and tanθ increase with the treatment time. For the acidic etching with HNO3, no noticeable structuring effect could be observed, and the obtainable lap shear strength is thus quite low and almost equal for all investigated treatment times.
The results for the combined blasting and etching treatment are shown in Figure 7a. The change in strength as well as in roughness values is shown in Table 7.
The additional etching leads to a considerable decrease in the lap shear strength for F54 blasted aluminum, whereas for F24 and F16, the difference is rather small. Since the difference in the maximum profile height between F54 blasted and NaOH etched aluminum is not as pronounced as for larger particle sizes, the etching causes a leveling of smaller roughness features rather than an additional structuring effect. For the F16 particle size, an additional structuring effect is more obvious, as shown in the cross-sections in Figure 8b. The small roughness features created by the etching treatment (Figure 8d) are clearly pronounced on the much larger roughness features created by the blasting treatment (Figure 8a). However, a leveling of sharp edges, as well as a loss of undercuts, are observed, leading to a decrease in the micro-clamping area. For the F16 particle size, the additional etching led to a slight decrease in the lap shear strength, whereas a slight increase is noted for the F24 particle size. Therefore, no final statement can be made on whether additional etching is beneficial to the interlaminar strength.
It is noteworthy that a completely untreated aluminum surface was not able to create adhesion to PA6. The specimens delaminated in the climate chamber. Therefore, no results can be provided.
In Figure 9a, the lap shear strength data for the different treatment conditions is related to the determined Rz value. For all of the tested treatment techniques, a clear correlation of Rz and the lap shear strength is not observed and both values are rather randomly distributed. Only the surfaces that show a low Rz value show a correspondingly low lap shear strength (HNO3 treatment 1–20 min/NaOH treatment 1 min). In Figure 9b, the lap shear strength is related to the tanθ value. In contrast to Rz, an acceptable correlation between the lap shear strength and tanθ is observed. However, the measured data still shows considerable scattering. Possible influencing factors are as follows:
  • Omission of undercuts when recording the roughness profile;
  • Embedding of corundum particles;
  • Scale-dependent material behavior.
  • Poon et al. [23] reported an underestimation of vertical roughness parameters and the loss of submicron details due to the stylus tip size of the surface roughness tester. Therefore, more detail in relation to the structure’s size is lost for surfaces with smaller Rz, leading to a stronger underestimation of tanθ.
  • Fluctuations due to the used test method, differences in meltdown in the overlapping area and in the overlapping length due to the tolerances of the sheets, and misalignment between the sheets due to play in the specimen holders have a negative influence on the overall specimen quality.
For the hollow cylinder tests, differences in geometry can be almost excluded by turning the specimens to uniform diameters. Additionally, the surface roughness measurements will be carried out with a 2 µm stylus tip size instead of a 5 µm size for increasing the precision of the deduced roughness parameters.

3.2. Hollow Cylinder Specimens

Figure 10 shows the interlaminar shear and tensile strength obtained from the hollow cylinder tests. The laser-generated pin structure created the best adhesion by far, followed by the NiAl5 thermal spray coating and the F16 blasted surface. The lowest strength values were achieved with the combined F16 blasting and NaOH etching treatment.
The ratio τmax/σmax decreases homogeneously when increasing the overall strength. When looking at the corresponding roughness values in Table 8, it is obvious that Rz does not allow a prediction of the possible interlaminar strength. In example, the pin structure provides the highest interlaminar strength by far, but shows the lowest Rz value.
However, tanθ shows much better accordance, as illustrated by Figure 11. The interlaminar shear and tensile strength increase homogeneously with tanθ, showing a huge gap between the NiAl5 coating and pin structure.
It is noteworthy that the actual tanθ of the pin structure is obviously much higher than the measured value. Assuming an average structure height of 40 µm and an average structure width of 20 µm, as shown in Figure 12d, the resulting tanθ according to Equation (5) would be approximately 4. Since the measuring line does not hit every peak and Equation (6) is applied to the resulting profile, the actual tanθ should be a bit lower, but still much higher than the measured 0.778. When comparing the measured roughness profile shown in Figure 13b with the cross-section in Figure 12d, the loss of detail due to the missing penetration of the stylus tip can clearly be seen. However, when comparing the measured profile of the F16 blasted structure in Figure 13a with the corresponding cross-section in Figure 12a, the loss of detail is far less pronounced.
When comparing the morphology of the corundum blasted surfaces in Figure 12a,b and Figure 14a,b, respectively, the indentations created by the additional etching treatment are clearly pronounced. On the other hand, there is an obvious loss of undercuts and all sharp submicron features. In particular, the loss of undercuts may cause the drastic decrease of 51% in σmax, whereas τmax only decreased by 19%. The NiAl5 coating illustrated in Figure 12c and Figure 14c, respectively, shows a high amount of small splats that function as undercut features. Hence, the achieved interlaminar strength is higher than that obtained from corundum blasting treatment only. The laser treatment illustrated in Figure 12d and Figure 14d, respectively, causes the formation of steep, pin-like structural elements arranged in a high spatial density. Undercuts are provided by molten together or crooked pins as well as submicron roughness features of the almost perpendicular pins. In consequence, a high interlaminar strength for both the tensile and the shear load is achieved.
The fractured surfaces of the tensile as well as the shear-loaded hollow cylinder specimens are depicted in Figure 15. Dark areas indicate the residing polymer, since the images were taken using the back-scattering detector (BSD). For all the tested joints and surface pretreatment conditions, polymer residues are present at the metallic adherent. However, almost no polymer residues are present at the fractured surfaces of the blasted and subsequently etched specimens (a, e). Additionally, a higher number of coarse residues are found at the shear-loaded, just-blasted specimen (b), whereas nearly no residues are observed for the corresponding tensile load case (f). In contrast, a high number of comparably small residues are located at the fractured surface of the shear-loaded thermal spray coating (c) and likewise, significantly less residues of a once again reduced size are found for the tensile load case (g).
Generally, an increasing content of polymer residues is observed along with an increasing joint strength and fragmentation of the treated surfaces, respectively (Figure 15a–c,e–g). Further, the difference in the number of residues in-between the shear and tensile load case is explained by the orientation of the roughness features that predominantly provide undercuts against shear rather than tensile loads.
For the tested laser pin structure, the BSD images for both load cases show that an outstandingly high amount of residing polymer is located in-between the structure. Figure 16 provides a detailed view of these fractured surfaces. For the shear (a, b) and the tensile (c, d) load case, failure takes places in the polymeric adherent. However, different types of failure, like failure above the pins oriented parallel to the surface (a) as well as clearly plastically deformed polymeric residues (b–d) can be found.

4. Conclusions

Based on the experimental results and analyzes performed in the present work, the following conclusions can be drawn:
  • Corundum blasting creates considerable adhesion between PA6 and EN AW-6082, even with a smaller grit size and low pressure. There is no evidence that a higher blasting pressure leads to better adhesion.
  • A combination of corundum blasting and alkaline etching treatment decreases the adhesion compared to corundum blasting only due to the loss of undercuts and submicron roughness features.
  • A thermally-sprayed NiAl5 coating creates better adhesion than corundum blasting.
  • A self-organized, laser-generated pin structure creates the highest adhesion by far due to its high spatial density of roughness features.
  • The torsion and tension test using butt-bonded hollow cylinders allows for a more meaningful determination of interlaminar strength values than the lap shear test. Additionally, all load directions can be tested with one specimen geometry.
  • The interlaminar strength in the shear as well as tensile direction is strongly related to the surface roughness slope tanθ.
  • Roughness evaluation with a stylus profiler leads to an underestimation of tanθ due to the missing penetration of tight roughness profile valleys as well as the loss of submicron details. This effect increases with an increasing structure density and decreasing structure size. A stylus tip size as small as possible should be used.
  • There is no meaningful relation between the average maximum profile height Rz and the interlaminar strength for structure sizes within the investigated range (1.26 µm < Rz < 142 µm).
  • The fracture analysis of the hollow cylinder specimens reveals that the interlaminar strength is strongly related to the number of polymer residues in the surface structure. A higher interlaminar strength leads to more residues. Shear testing leads to more residues than tensile testing.

Author Contributions

Conceptualization, E.S.; data curation, E.S.; investigation, E.S., A.D., P.S., and T.L. (Thomas Lindner); methodology, E.S., P.S., and T.L. (Thomas Lindner); project administration, T.L. (Thomas Lampke); software, E.S.; Supervision, T.L. (Thomas Lindner), I.S., A.S., and T.L. (Thomas Lampke); validation, E.S.; visualization, E.S.; writing—original draft, E.S., A.D., and P.S.; writing—review and editing, E.S., A.D., P.S., T.L. (Thomas Lindner), and T.L. (Thomas Lampke).

Funding

This study was supported by the Federal Cluster of Excellence EXC 1075 “MERGE Technologies for Multifunctional Lightweight Structures”. The publication costs were funded by the German Research Foundation/DFG-392676956 and the Technische Universität Chemnitz as part of the funding programme Open Access Publishing.

Acknowledgments

The support by Christoph Wollschläger, Torsten Rabes, Michael Zychski, Paul Clauß, Christian Loos, and Steffen Clauß (all from the Institute of Materials Science and Engineering) is gratefully acknowledged.

Conflicts of Interest

The authors declare no conflicts of interest.

References

  1. Katayama, S.; Kawahito, Y. Laser direct joining of metal and plastic. Scr. Mater. 2008, 59, 1247–1250. [Google Scholar] [CrossRef]
  2. Bergmann, J.P.; Stambke, M. Potential of Laser-manufactured Polymer-metal hybrid Joints. Phys. Procedia 2012, 39, 84–91. [Google Scholar] [CrossRef] [Green Version]
  3. Mitschang, P.; Velthuis, R.; Didi, M. Induction Spot Welding of Metal/CFRPC Hybrid Joints. Adv. Eng. Mater. 2013, 15, 804–813. [Google Scholar] [CrossRef]
  4. Wagner, G.; Balle, F.; Eifler, D. Ultrasonic Welding of Aluminum Alloys to Fiber Reinforced Polymers. Adv. Eng. Mater. 2013, 15, 792–803. [Google Scholar] [CrossRef]
  5. Steinert, P.; Dittes, A.; Schimmelpfennig, R.; Scharf, I.; Lampke, T.; Schubert, A. Design of high strength polymer metal interfaces by laser microstructured surfaces. IOP Conf. Ser. Mater. Sci. Eng. 2018, 373, 012015. [Google Scholar] [CrossRef]
  6. Flock, D. Heat Conduction Bonding of Plastic-Metal Hybrid Parts; RWTH Aachen: Aachen, Germany, 2011; pp. 81–86. [Google Scholar]
  7. Haberstroh, E.; Sickert, M. Thermal Direct Joining of Hybrid Plastic Metal Components. Kmutnb Int. J. Appl. Sci. Technol. 2014, 7, 29–34. [Google Scholar] [CrossRef] [Green Version]
  8. Ramani, K.; Moriarty, B. Thermoplastic bonding to metals via injection molding for macro-composite manufacture. Polym. Eng. Sci. 1998, 38, 870–877. [Google Scholar] [CrossRef]
  9. Kleffel, T.; Drummer, D. Investigating the suitability of roughness parameters to assess the bond strength of polymer-metal hybrid structures with mechanical adhesion. Compos. Part B Eng. 2017, 117, 20–25. [Google Scholar] [CrossRef]
  10. Pan, Y.; Wu, G.; Huang, Z.; Li, M.; Ji, S.; Zhang, Z. Effect of surface roughness on interlaminar peel and shear strength of CFRP/Mg laminates. Int. J. Adhes. Adhes. 2017, 79, 1–7. [Google Scholar] [CrossRef]
  11. Mitschang, P.; Velthuis, R.; Emrich, S.; Kopnarski, M. Induction Heated Joining of Aluminum and Carbon Fiber Reinforced Nylon 66. J. Compos. Mater. 2009, 22, 767–801. [Google Scholar] [CrossRef]
  12. Nestler, D.; Arnold, S.; Jung, H.; Wielage, B.; Kroll, L. Untersuchung geeigneter Oberflächenbehandlungsverfahren der Metallkomponente thermoplastbasierter hybrider Laminate. In Schriftenreihe Werkstoffe und werkstofftechnische Anwendungen, Proceeding of the 17th Werkstofftechnisches Kolloquium; Technische Universität Chemnitz: Chemnitz, Germany, November 2014; pp. 208–216. [Google Scholar]
  13. Heckert, A.; Zaeh, M.F. Laser surface pre-treatment of aluminum for hybrid joints with glass fiber reinforced thermoplastics. J. Laser Appl. 2015, 27, S29005. [Google Scholar] [CrossRef] [Green Version]
  14. Lindner, T.; Saborowski, E.; Scholze, M.; Zillmann, B.; Lampke, T. Thermal Spray Coatings as an Adhesion Promoter in Metal/FRP Joints. Metals 2018, 8, 769. [Google Scholar] [CrossRef]
  15. Chen, C.Q.L.; Scott, W.; Barker, T.M. Effect of metal surface topography on mechanical bonding at simulated total hip stem–cement interfaces. J. Biomed. Mater. Res. 1999, 48, 440–446. [Google Scholar] [CrossRef]
  16. Saborowski, E.; Scholze, M.; Lindner, T.; Lampke, T. A numerical and experimental comparison of test methods for the shear strength in hybrid metal/thermoplastic-compounds. IOP Conf. Ser. Mater. Sci. Eng. 2017, 181, 12031. [Google Scholar] [CrossRef] [Green Version]
  17. Saborowski, E.; Kießling, R.; Dittes, A.; Paczkowski, G.; Ihlemann, J.; Lampke, T. Determination of the strength of polymer-metal interfaces under mixed mode loading using butt-bonded hollow cylinders. Int. J. Adhes. Adhes. 2019, 89, 30–39. [Google Scholar] [CrossRef]
  18. Mahnken, R.; Schlimmer, M. Simulation of strength difference in elasto-plasticity for adhesive materials. Int. J. Numer. Methods Eng. 2005, 63, 1461–1477. [Google Scholar] [CrossRef]
  19. Amada, S.; Hirose, T. Influence of grit blasting pre-treatment on the adhesion strength of plasma sprayed coatings: fractal analysis of roughness. Surf. Coat. Technol. 1998, 102, 132–137. [Google Scholar] [CrossRef]
  20. Mohammadi, Z.; Ziaei-Moayyed, A.A.; Mesgar, A.S.M. Grit blasting of Ti–6Al–4V alloy. J. Mater. Process. Technol. 2007, 194, 15–23. [Google Scholar] [CrossRef]
  21. Baburaj, E.; Starikov, D.; Evans, J.; Shafeev, G.; Bensaoula, A.; Shafeev, G. Enhancement of adhesive joint strength by laser surface modification. Int. J. Adhes. Adhes. 2007, 27, 268–276. [Google Scholar] [CrossRef]
  22. Cassidy, J.F.; Donner, H.C. Measurement of Surface Roughness Slope. NASA Tech Brief. 1970, 70, 10722. [Google Scholar]
  23. Poon, C.Y.; Bhushan, B. Comparison of surface roughness measurements by stylus profiler, AFM and non-contact optical profiler. Wear 1995, 190, 76–88. [Google Scholar] [CrossRef]
Figure 1. Lap shear specimen geometry.
Materials 12 02963 g001
Figure 2. Hollow cylinder specimen geometry.
Materials 12 02963 g002
Figure 3. Hot pressing tool.
Materials 12 02963 g003
Figure 4. Interfacial temperature during the joining process (hollow cylinder specimens).
Materials 12 02963 g004
Figure 5. Roughness slope and resulting forces.
Materials 12 02963 g005
Figure 6. Schematic representation of the surface profile.
Materials 12 02963 g006
Figure 7. Lap shear test results for (a) blasting and combined treatment and (b) etching treatment.
Materials 12 02963 g007
Figure 8. Cross-sections for (a) blasting (F16, 3 bar) (b) combined blasting (F16, 3 bar) and etching (5 min NaOH) (c) acidic etching (20 min HNO3) and (d) alkaline etching (20 min, NaOH) treatment applied to EN AW-6082 sheets.
Materials 12 02963 g008
Figure 9. Lap shear strength (a) over Rz and (b) over tanθ, both with a 5 µm tip diameter.
Materials 12 02963 g009
Figure 10. Interlaminar strength of hollow cylinder specimens.
Materials 12 02963 g010
Figure 11. Shear and tensile strength over tanθ (2 µm tip diameter).
Materials 12 02963 g011
Figure 12. Representative cross-sectional images (SEM) of hollow cylinder specimens, scale normalized to image width/Rz = 1/15 (a) F16, 2 bar (b) F16, 3 bar + 5 min NaOH (c) NiAl5 coating and (d) pin structure.
Materials 12 02963 g012
Figure 13. Roughness profiles (2 µm tip), equal axis scaling (a) F16, 2 bar and (b) pin structure.
Materials 12 02963 g013
Figure 14. SEM images of hollow cylinder specimens, 60° tilt, 25 kV (a) F16, 2 bar (b) F16, 3 bar + 5 min NaOH (c) NiAl5 coating and (d) pin structure.
Materials 12 02963 g014
Figure 15. Fracture analysis (SEM-images back-scattering detector (BSD) contrast) of the tested hollow cylinder specimens. Shear- (ad) and tensile- (eh) loaded specimens are depicted for the differently structured surfaces: (a,e) F16, 3 bar + 5 min NaOH, (b,f) F16, 2 bar (c,g) NiAl5 coating and (d,h) pin structure.
Materials 12 02963 g015
Figure 16. SEM images of the fractured surface of the pin-structured hollow cylinder specimens (a,b) shear load and (c,d) tensile load.
Materials 12 02963 g016
Table 1. Material properties.
EN AW-6082PA6 (humid)
Density (kg/m³)2.71.14
Elastic modulus (MPa)700001800
Poisson’s ratio (-)0.34-
Yield strength (MPa)26060
Ultimate strength (MPa)310-
Elongation to failure (%)7200
Melting temperature (K)933496
Thermal expansion coefficient (10−6/K)23.470
Thermal conductance (W/(m·K))170–2200.23
Specific heat (J/(kg·K))8981700
Table 2. Geometrical parameters of the lap shear specimens.
w (mm)lo (mm)lc,m (mm)lf,m (mm)lf,p (mm)lc,p (mm)hm (mm)hp (mm)
2554550403533
Table 3. Geometrical parameters of butt-bonded hollow cylinder specimens.
di (mm)do (mm)lc,m (mm)lf,m (mm)lc,p (mm)lf,p (mm)
232820203030
Table 4. Feedstock material and parameters used for the thermal spraying process.
Chemical CompositionCurrent (A)Voltage (V)Spraying Distance (mm)Air Pressure (bar)Feed Speed (m/s)Row Spacing (mm)
Ni–95%/Al–5%150301303.50.65
Table 5. Parameters used for the laser structuring process.
Laser MediumWavelength (nm)Pulse Duration (ns)Max Mean Power (W)Focus Diameter (µm)
Nd:YVO4532101315
Table 6. Highest test results and roughness parameters (5 µm tip) for blasting treatment.
Treatmentτl,max (MPa)Rz (µm)tanθ
F120, 3 bar10.76260.325
F54, 1 bar11.62320.364
F24, 2 bar10.87810.459
F16, 2 bar12.171110.503
Table 7. Change in test results and roughness parameters (blasting (3 bar) → combined blasting (3 bar) and etching (5 min, NaOH) treatment, 5 µm tip).
Treatmentτl,max (MPa)Rz (µm)tanθ
F5411.47 → 9.4445 → 430.397 → 0.365
F2410.87 → 11.4691 → 870.478 → 0.467
F1611.63 → 10.75142 → 1310.542 → 0.531
Table 8. Interlaminar strength and roughness parameters (2 µm tip) of hollow cylinder specimens.
Treatmentτmax (MPa)σmax (MPa)τmaxmaxRz (µm)tanθ
F16 + NaOH11.492.025.691240.557
F16, 2 bar14.154.163.401310.590
NiAl517.005.812.93800.616
Pin32.4626.041.25460.778

