Influences of Chemical Composition and Fineness on the Development of Concrete Strength by Curing Conditions


Technology Research and Development Institute, Daelim Industrial, Jongno-Gu, Seoul 03152, Korea
*
Author to whom correspondence should be addressed.
Materials 2019, 12(24), 4061; https://0-doi-org.brum.beds.ac.uk/10.3390/ma12244061
Submission received: 19 November 2019
/
Revised: 2 December 2019
/
Accepted: 3 December 2019
/
Published: 5 December 2019
Abstract
:In this study, the influences of chemical composition and fineness on the development of concrete strength by curing conditions were investigated through performance evaluation of high SO3 Portland cement (HSPC) and ordinary Portland cement (OPC). At the same fineness (3800 cm2/g), the initial and final setting times of HSPC were 92 and 98 min less than OPC. Early mortar compressive strength was approximately 176% higher after 24 h. After curing for 15 h, 18 h, and 24 h, the maturity of HSPC concrete (107.4%, 109.6%, and 111.7%) and early compressive strength (146.4%, 170.7%, and 154.5%) were higher than measured for OPC concrete. HSPC fineness was 111.8% higher than OPC, leading to early activation of the hydration reaction. By X-ray fluorescence analysis, the SO3 content of HSPC was 107.9% that of OPC. The applicable time for HSPC concrete form removal was shorter than that for OPC concrete. The relationships y = −10.57 ln(x) + 47.30 and y = −9.84 ln(x) + 44.05 were estimated for predicting the early-age strength OPC and HSPC concrete. Therefore, applying HSPC concrete to an actual construction site is expected to shorten the construction period and reduce the heating curing cost in winter compared to OPC concrete.
1. Introduction
Concrete is the most commonly used construction material because of its excellent strength and durability [1,2]. After a concrete structure has cured, the removal of the forms used to hold its shape during hardening is the most important part of the management process at construction sites that must adhere to the standards determined during the audit process. Therefore, predicting the early-age strength of concrete by calculating the relationship between the curing temperature and mechanical strength is becoming an increasingly important part of concrete research [3,4]. Several recent publications have employed the maturity method to estimate the compressive strength of different types of concrete, including mass concrete [5,6], steel fiber reinforced concrete [7], sprayed concrete [8], and eco-concrete [9,10,11]. However, to the best of our knowledge, no previous studies have estimated the compressive strength of field applicable high SO3 Portland cement (HSPC).
The contribution of cement particles to the strength of the concrete is closely related to their size [12,13]. Specifically, cement particle size controls the degree of hydration in the early hydration stage; i.e., finer cement particles lead to higher heat of hydration [14,15], with extremely fine cement particles being completely hydrated within 24 h [16]. Conversely, finer cement grains can affect the generation of early-age cracks in the cement matrix [17,18]. This study evaluated the performance of cement with a higher degree of fineness than ordinary Portland cement (OPC).
Superplasticizers are also applied to cementitious materials and concrete fabrication to realize significant improvements in machinability, mechanical properties, porosity, and durability. They can provide excellent workability while substantially reducing the water/binder ratio [19,20,21,22] and increasing strength. This takes place up to a point beyond which low water/binder ratios can lead to other problems. For example, the degree of hydration of cement minerals may be significantly reduced. Consequently, their ability to directly contribute to cement performance will also be reduced; therefore, the plasticizer addition level must be optimized [23].
Portland cement CEM I is a powdered material made of clinker and gypsum [24]. Gypsum is used to control the hardening time of cement [25], and the mechanical properties (strength, shrinkage, and expansion) of cement can change depending on the amount of gypsum in the matrix [26,27]. Gypsum may be present in small proportions as anhydrite (CaSO4) but, owing to instability, rarely as the hemihydrate (CaSO4∙1/2H2O). Gypsum is present in cement as calcium sulfate dihydrate (CaSO4∙2H2O) and is expressed in terms of trioxide sulfate (SO3) levels [28]. The SO3 content should be less than 4% according to European standard EN 197-1 [29] because, in cementitious systems, low SO3 content cannot guarantee sufficient condensation delay, whereas high SO3 content has a significant effect on the cement strength and dimensional stability. Optimal SO3 content ensures maximum strength and minimum shrinkage of the matrix without excessive expansion in water [26,30,31].
According to Kurdowski [32], the optimum SO3 content (%) can be calculated using one of the following formulas:
% SO3(Optimum) = 0.556∙Na2O2 + 0.0017659∙Fineness + 0.1072∙Fe2O3 − 3.6004
% SO3(Optimum) = 0.093∙Al2O3 + 1.71∙Na2O2 + 0.94∙K2O + 1.23
% SO3(Optimum) = 6.810−5∙Fineness∙C3A
% SO3(Optimum) = 1.841 + 0.095∙C3A + 1.6364∙Na2O2.
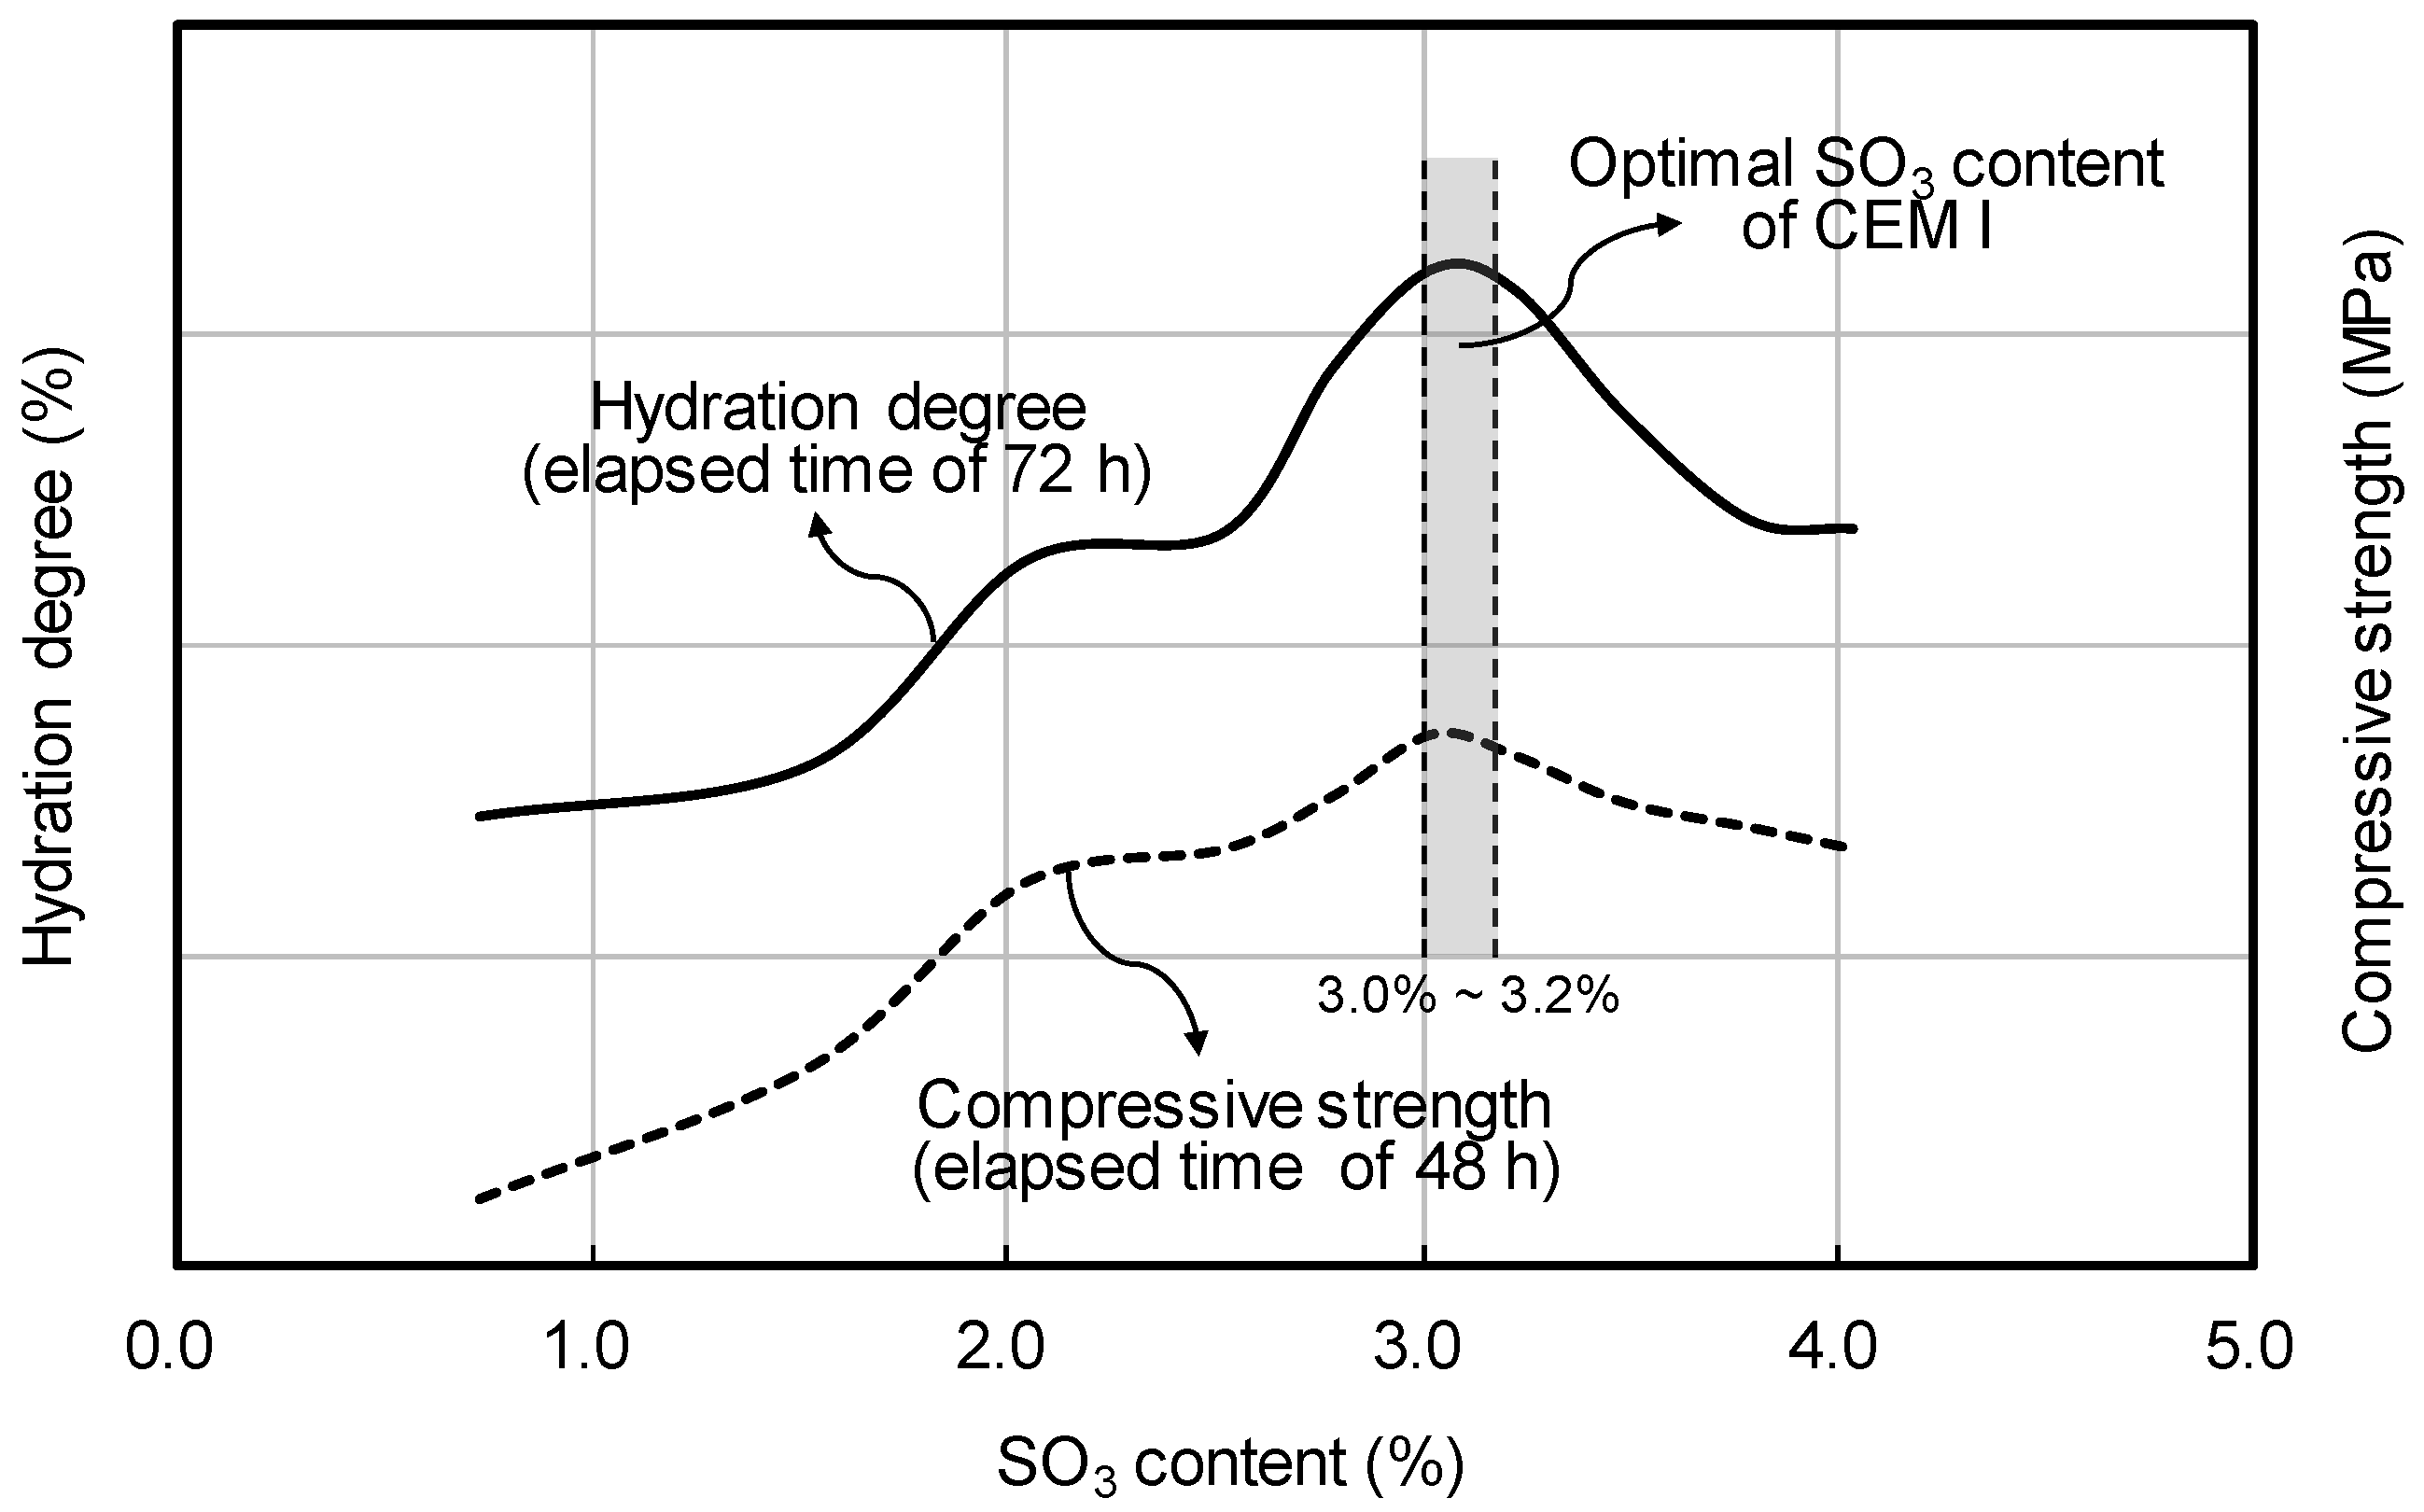
However, as reported by Mohammed and Safiullah [33], and shown in Figure 1, it has been proven through testing that the maximum hydration degree (elapsed time of 72 h) and compressive strength (elapsed time of 48 h) are increased when SO3 content is approximately 3.0%–3.2%.
To maximize early compressive strength and apply the findings to construction sites, the research team added gypsum to OPC clinker, increasing SO3 to 3.1% and improving fineness by 111.8% (400 cm2/g on 3400 cm2/g). In this study, the new HSPC was evaluated against OPC by setting time and early compressive strength according to cement fineness and type in a mortar test (Series I), and slump and air content according to cement fineness and type in a concrete test (Series II). Early compressive strength and maturity were evaluated in the Series II testing. The strength prediction of concrete and the possibility of removing the vertical formwork according to the heat of hydration were applied to the in-place curing of concrete samples in a field test structure.
2. Experimental Procedure
2.1. Materials
Ordinary type 1 Portland cement and type 2 fly ash (FA) that met the KS L 5201 standard (Portland cement) [34] were used as binders (Table 1). HSPC cement with fineness increased to approximately 111.8% (400 cm2/g) was prepared by adding gypsum to a level of 3.1% SO3 content to ensure the development of early compressive strength. Washed sea sand (40%) and crushed sand (60%) were mixed for use as the fine aggregate. Crushed granite aggregate was used as the coarse aggregate. Polycarboxylic superplasticizer was applied to both OPC and HSPC, as the only admixture used.
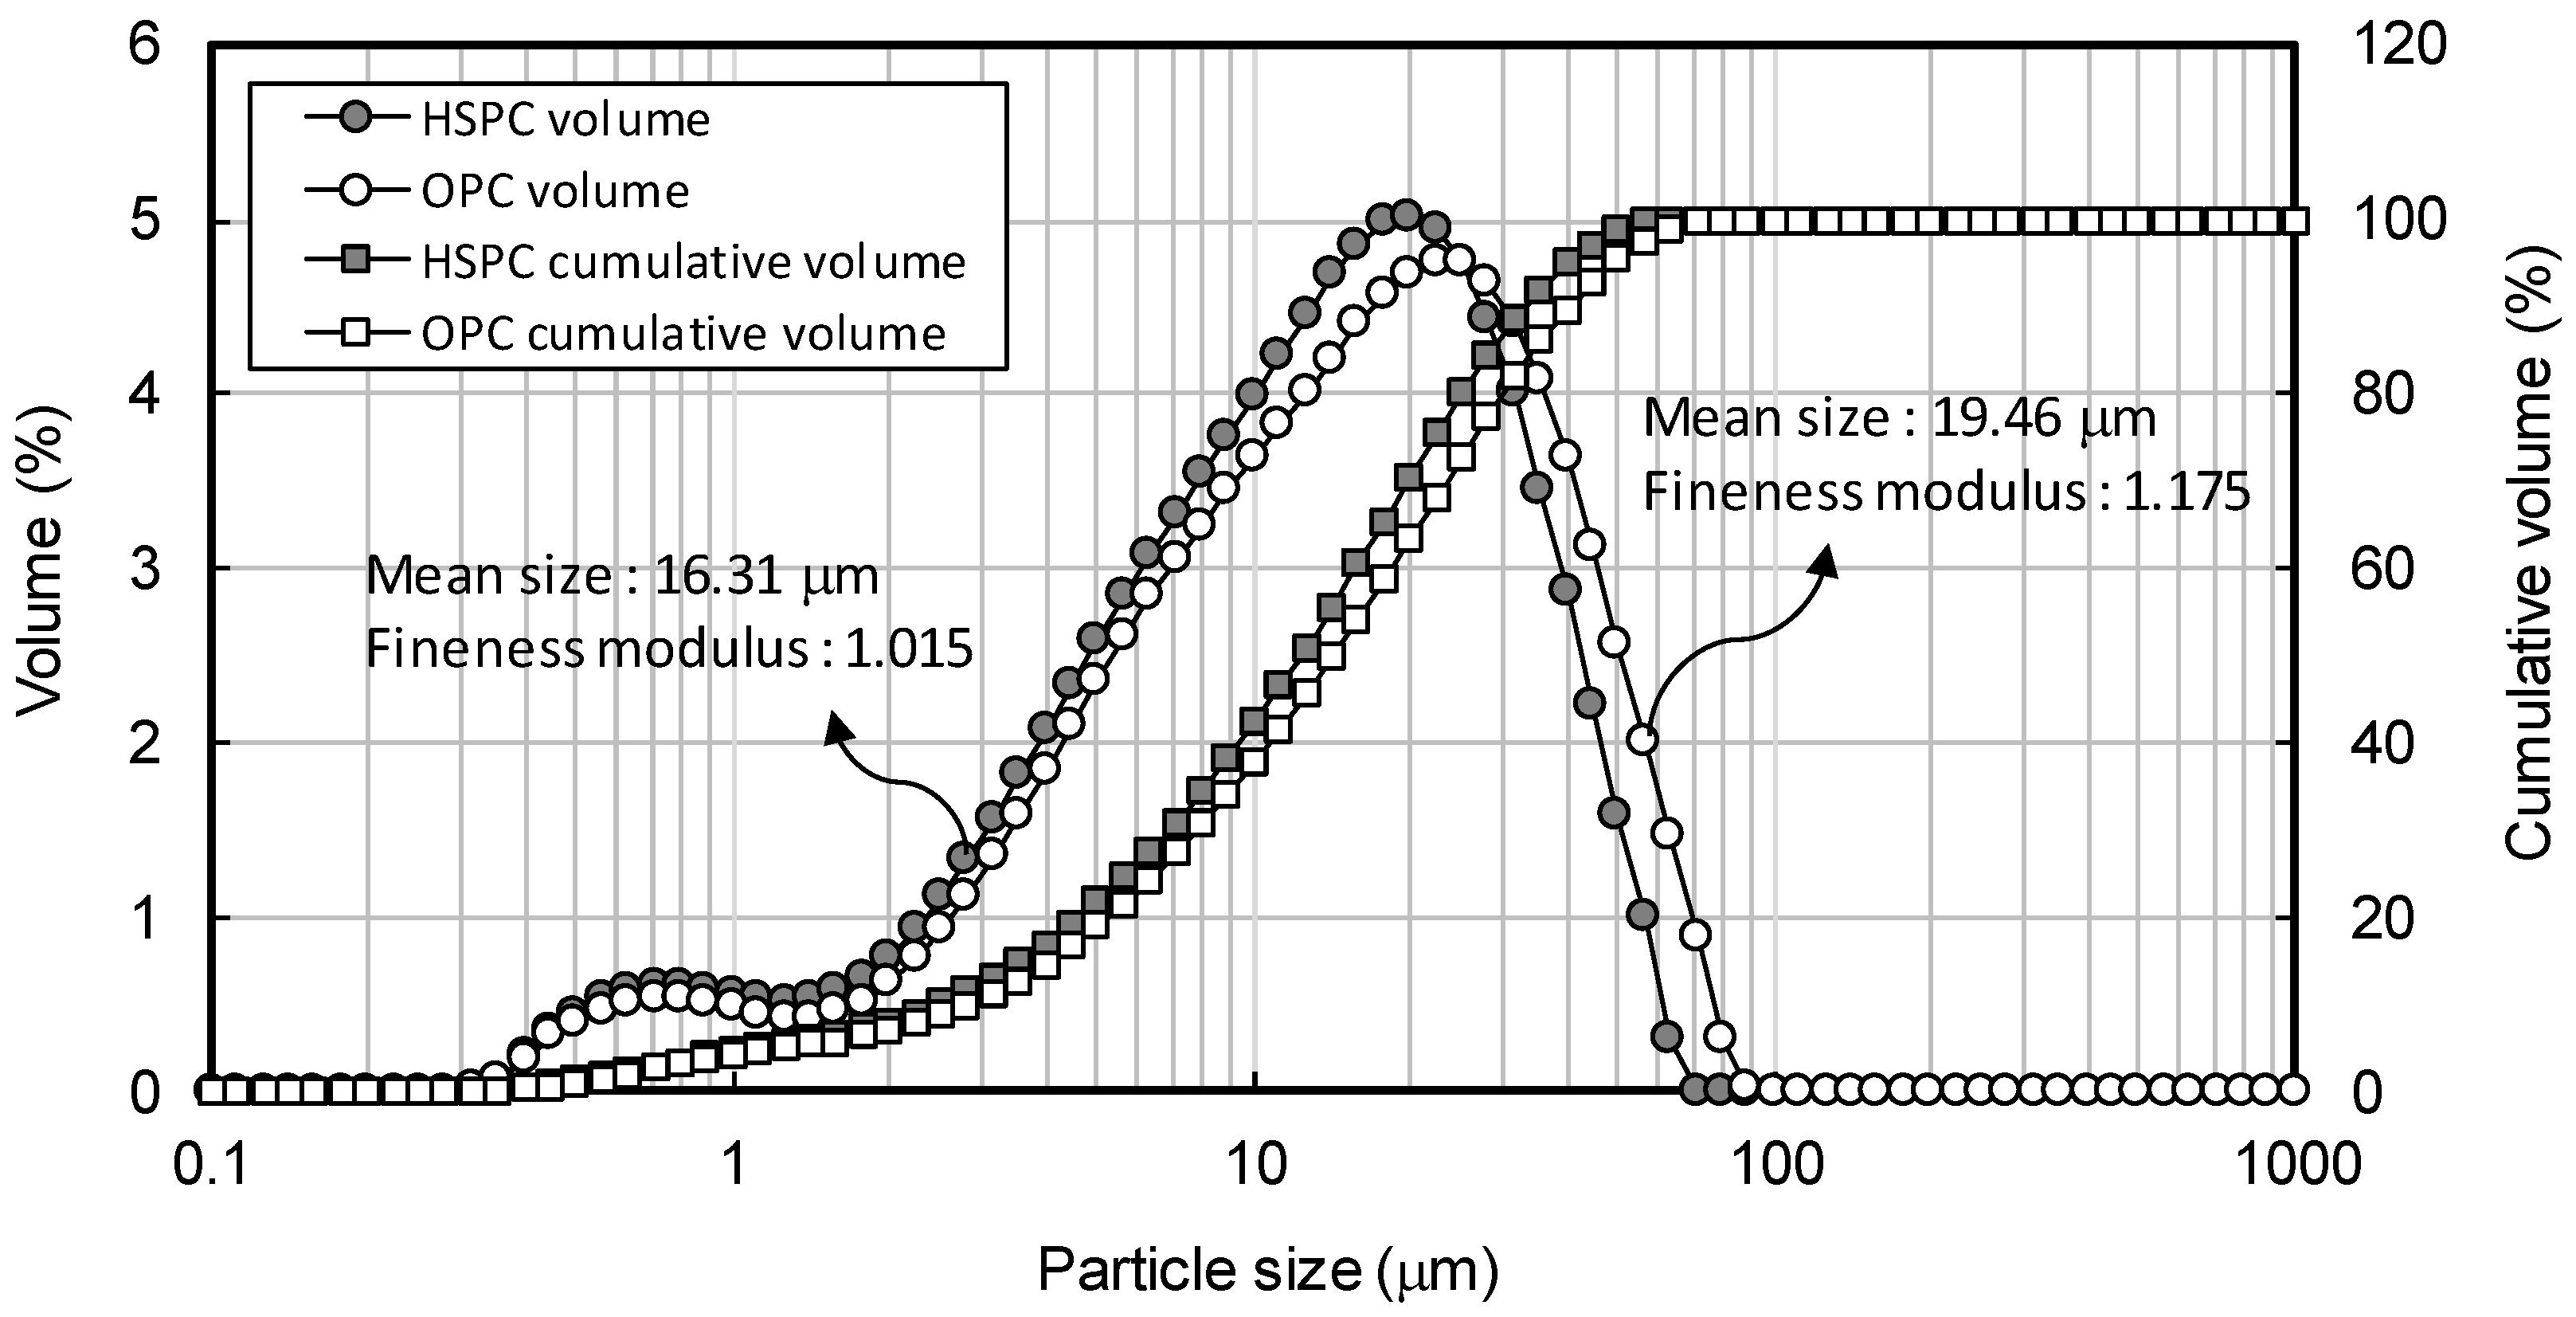
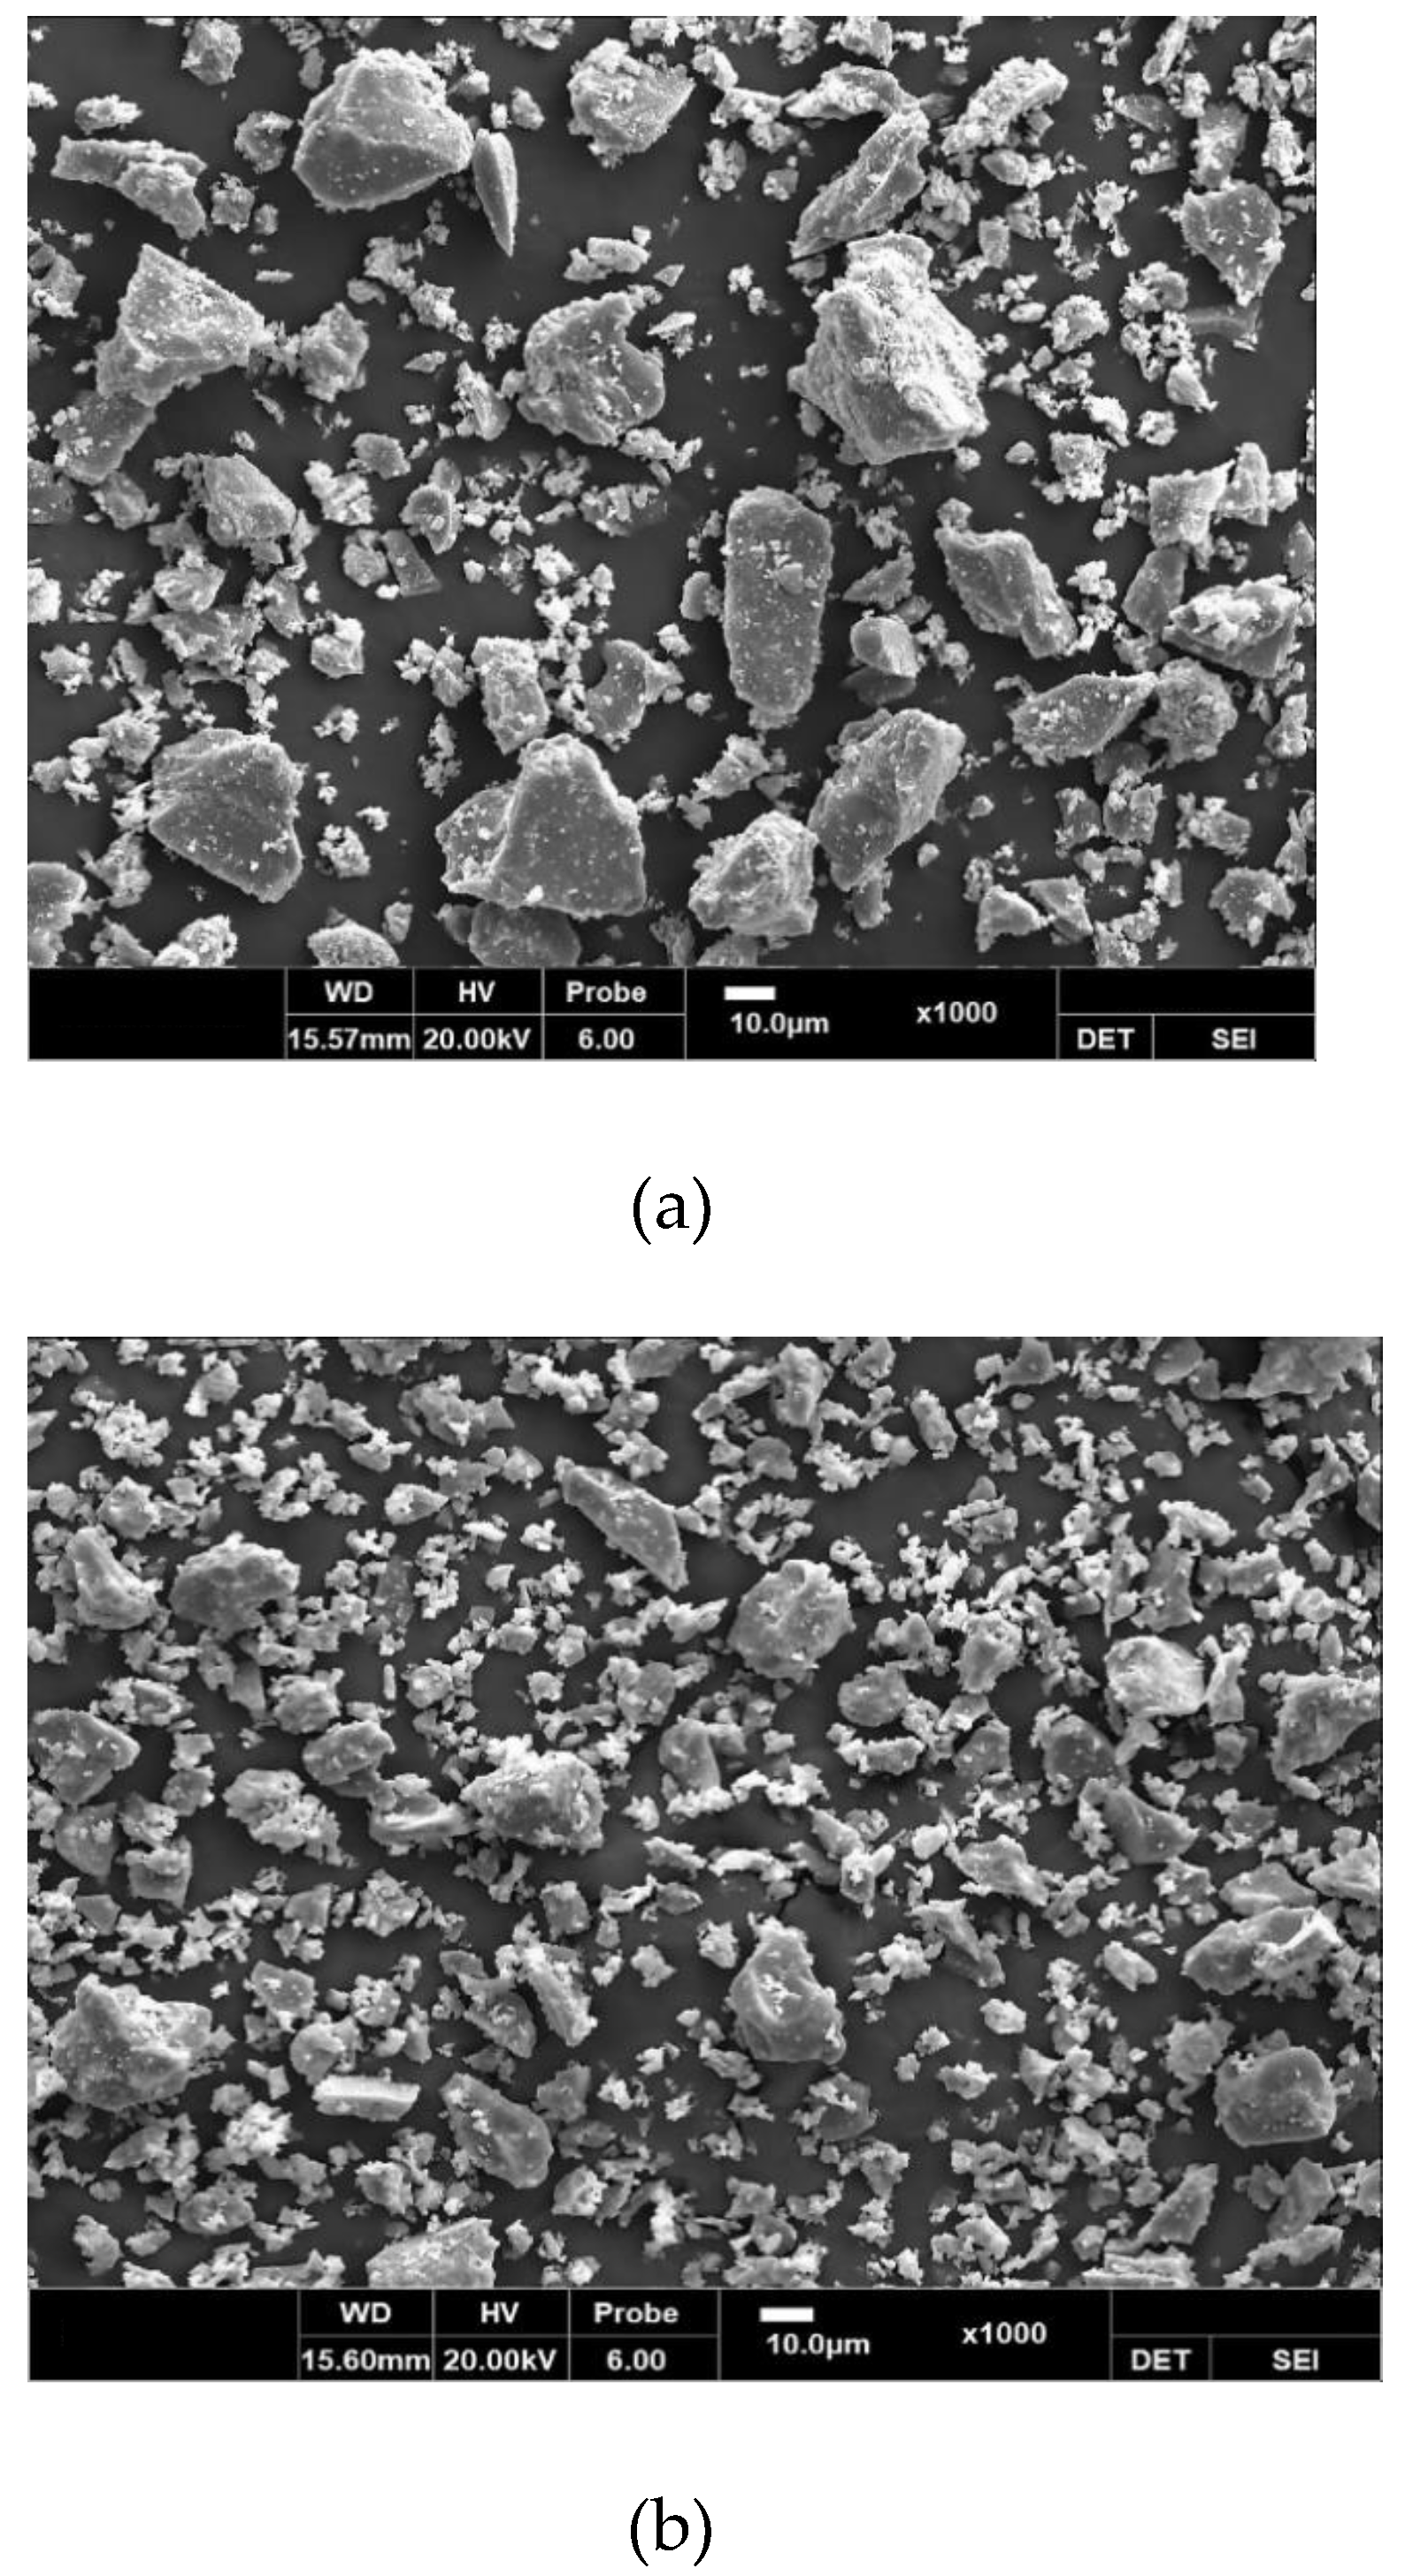
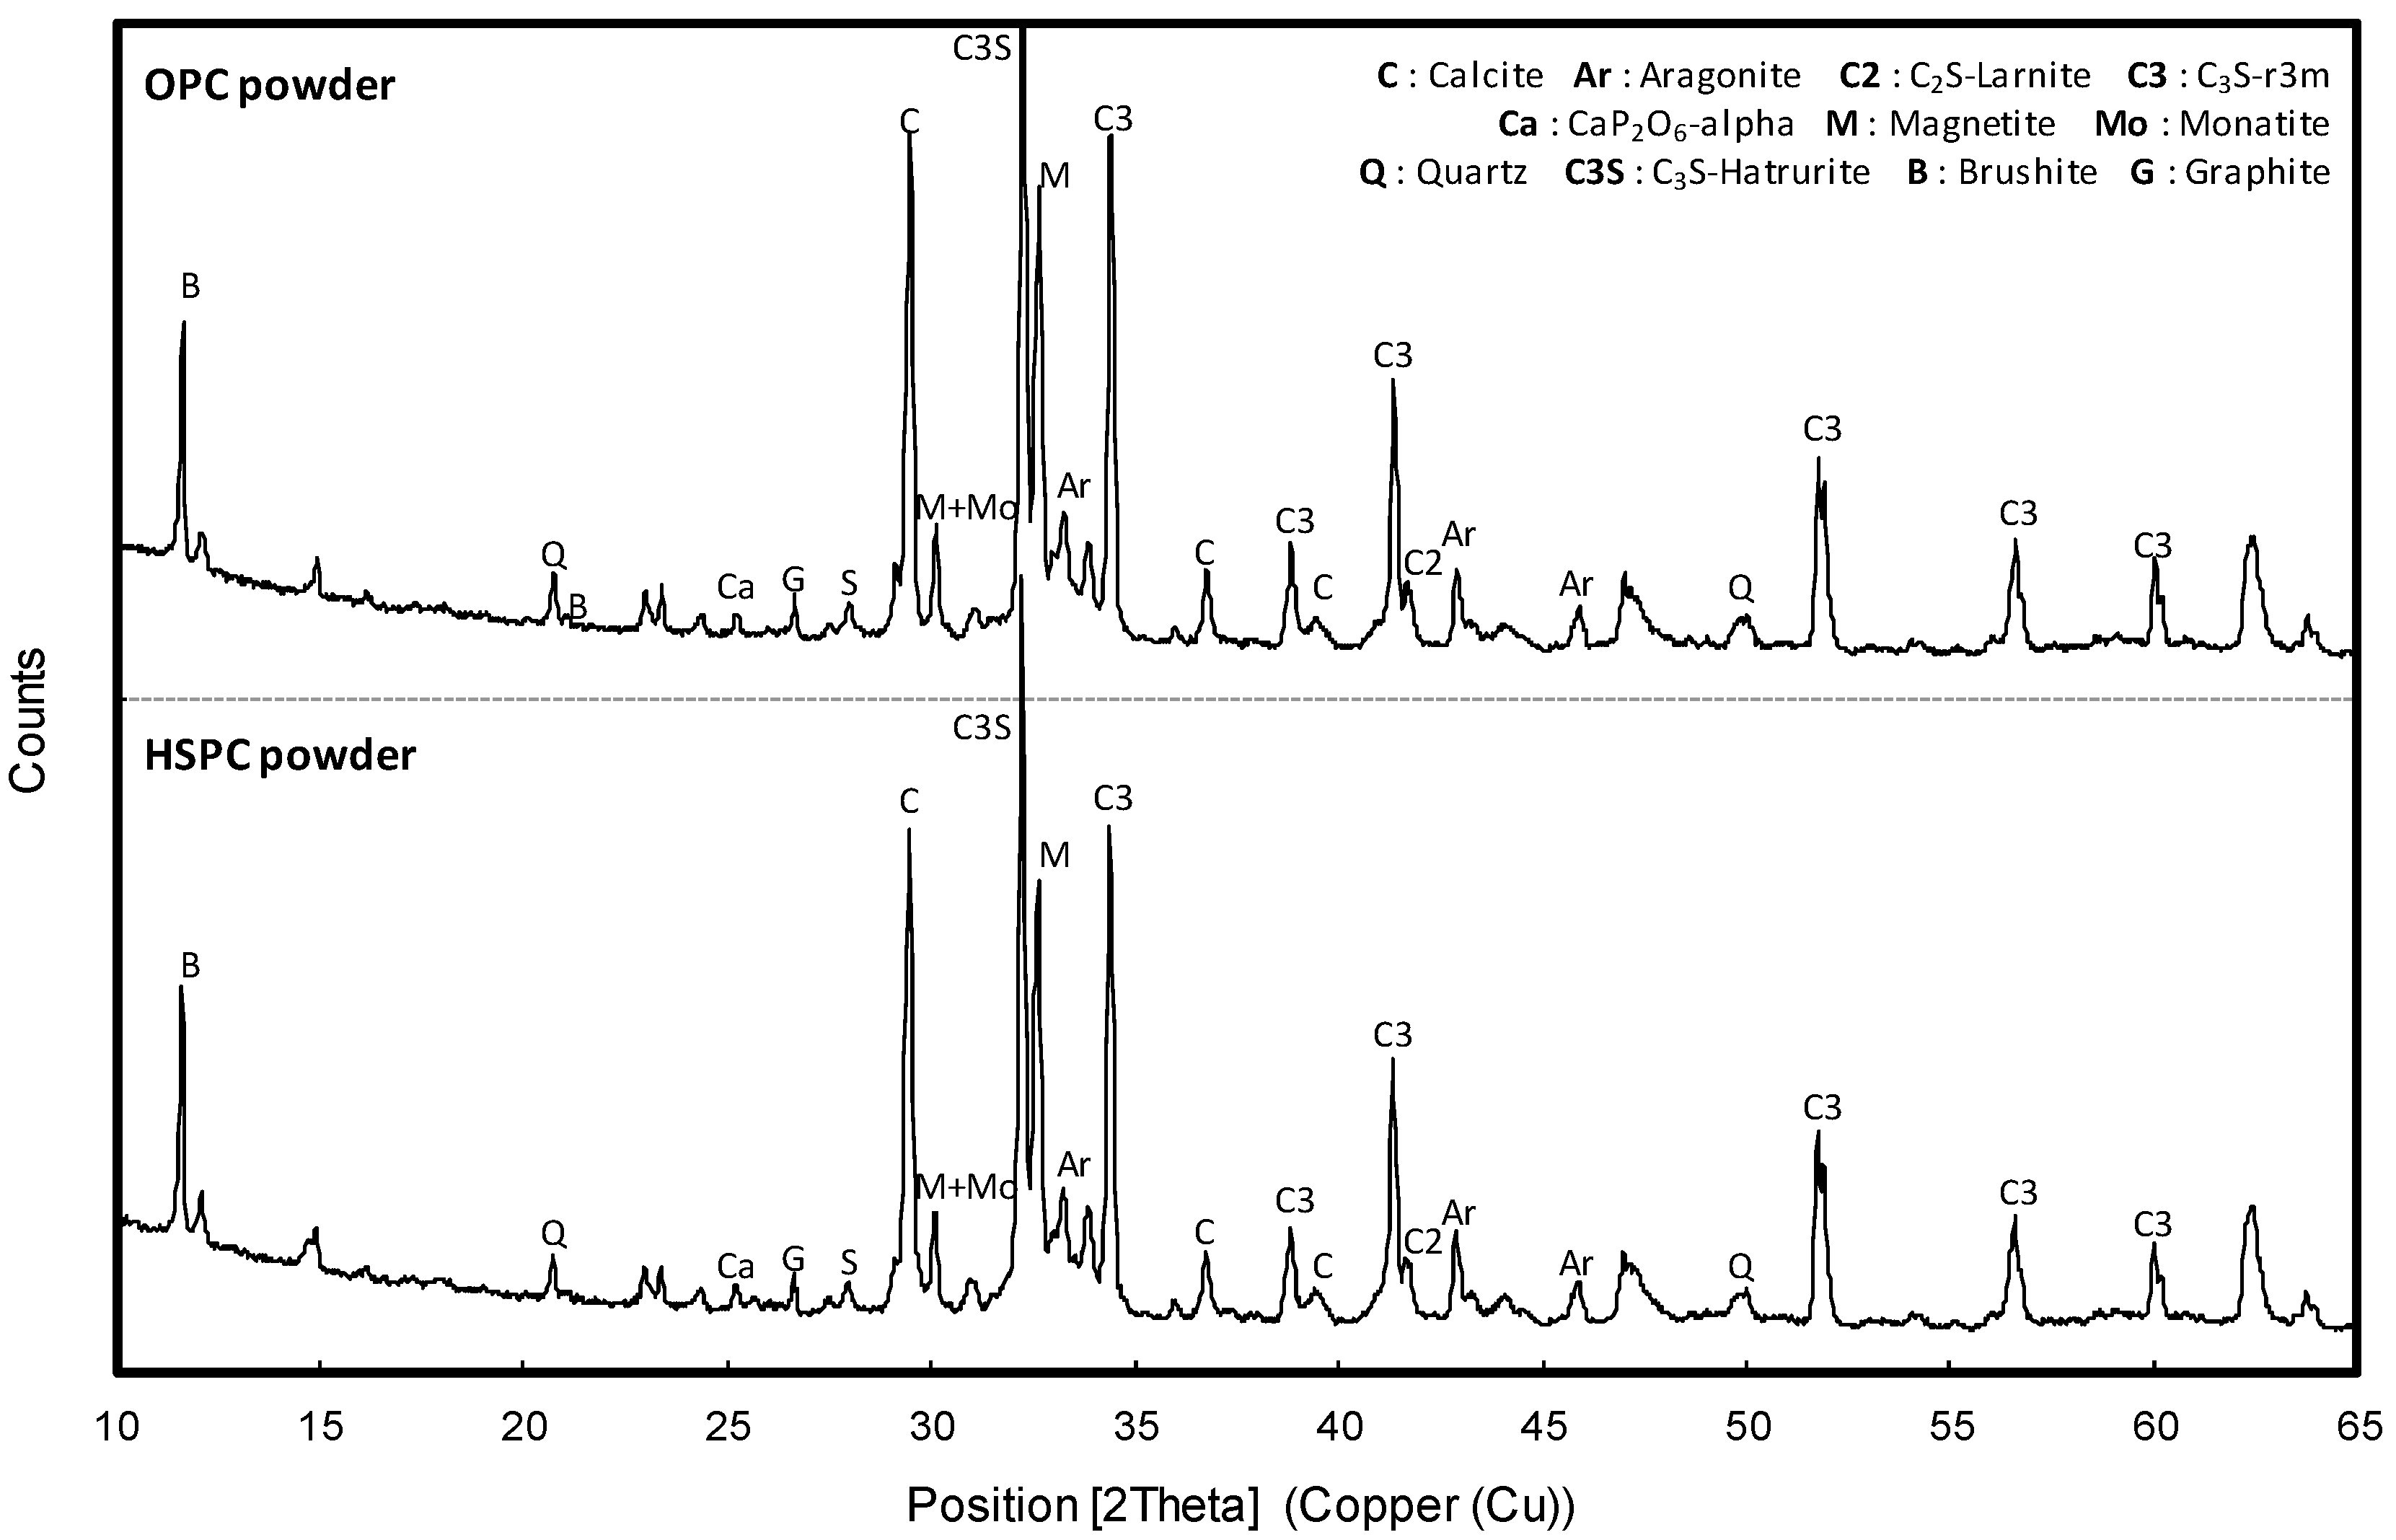
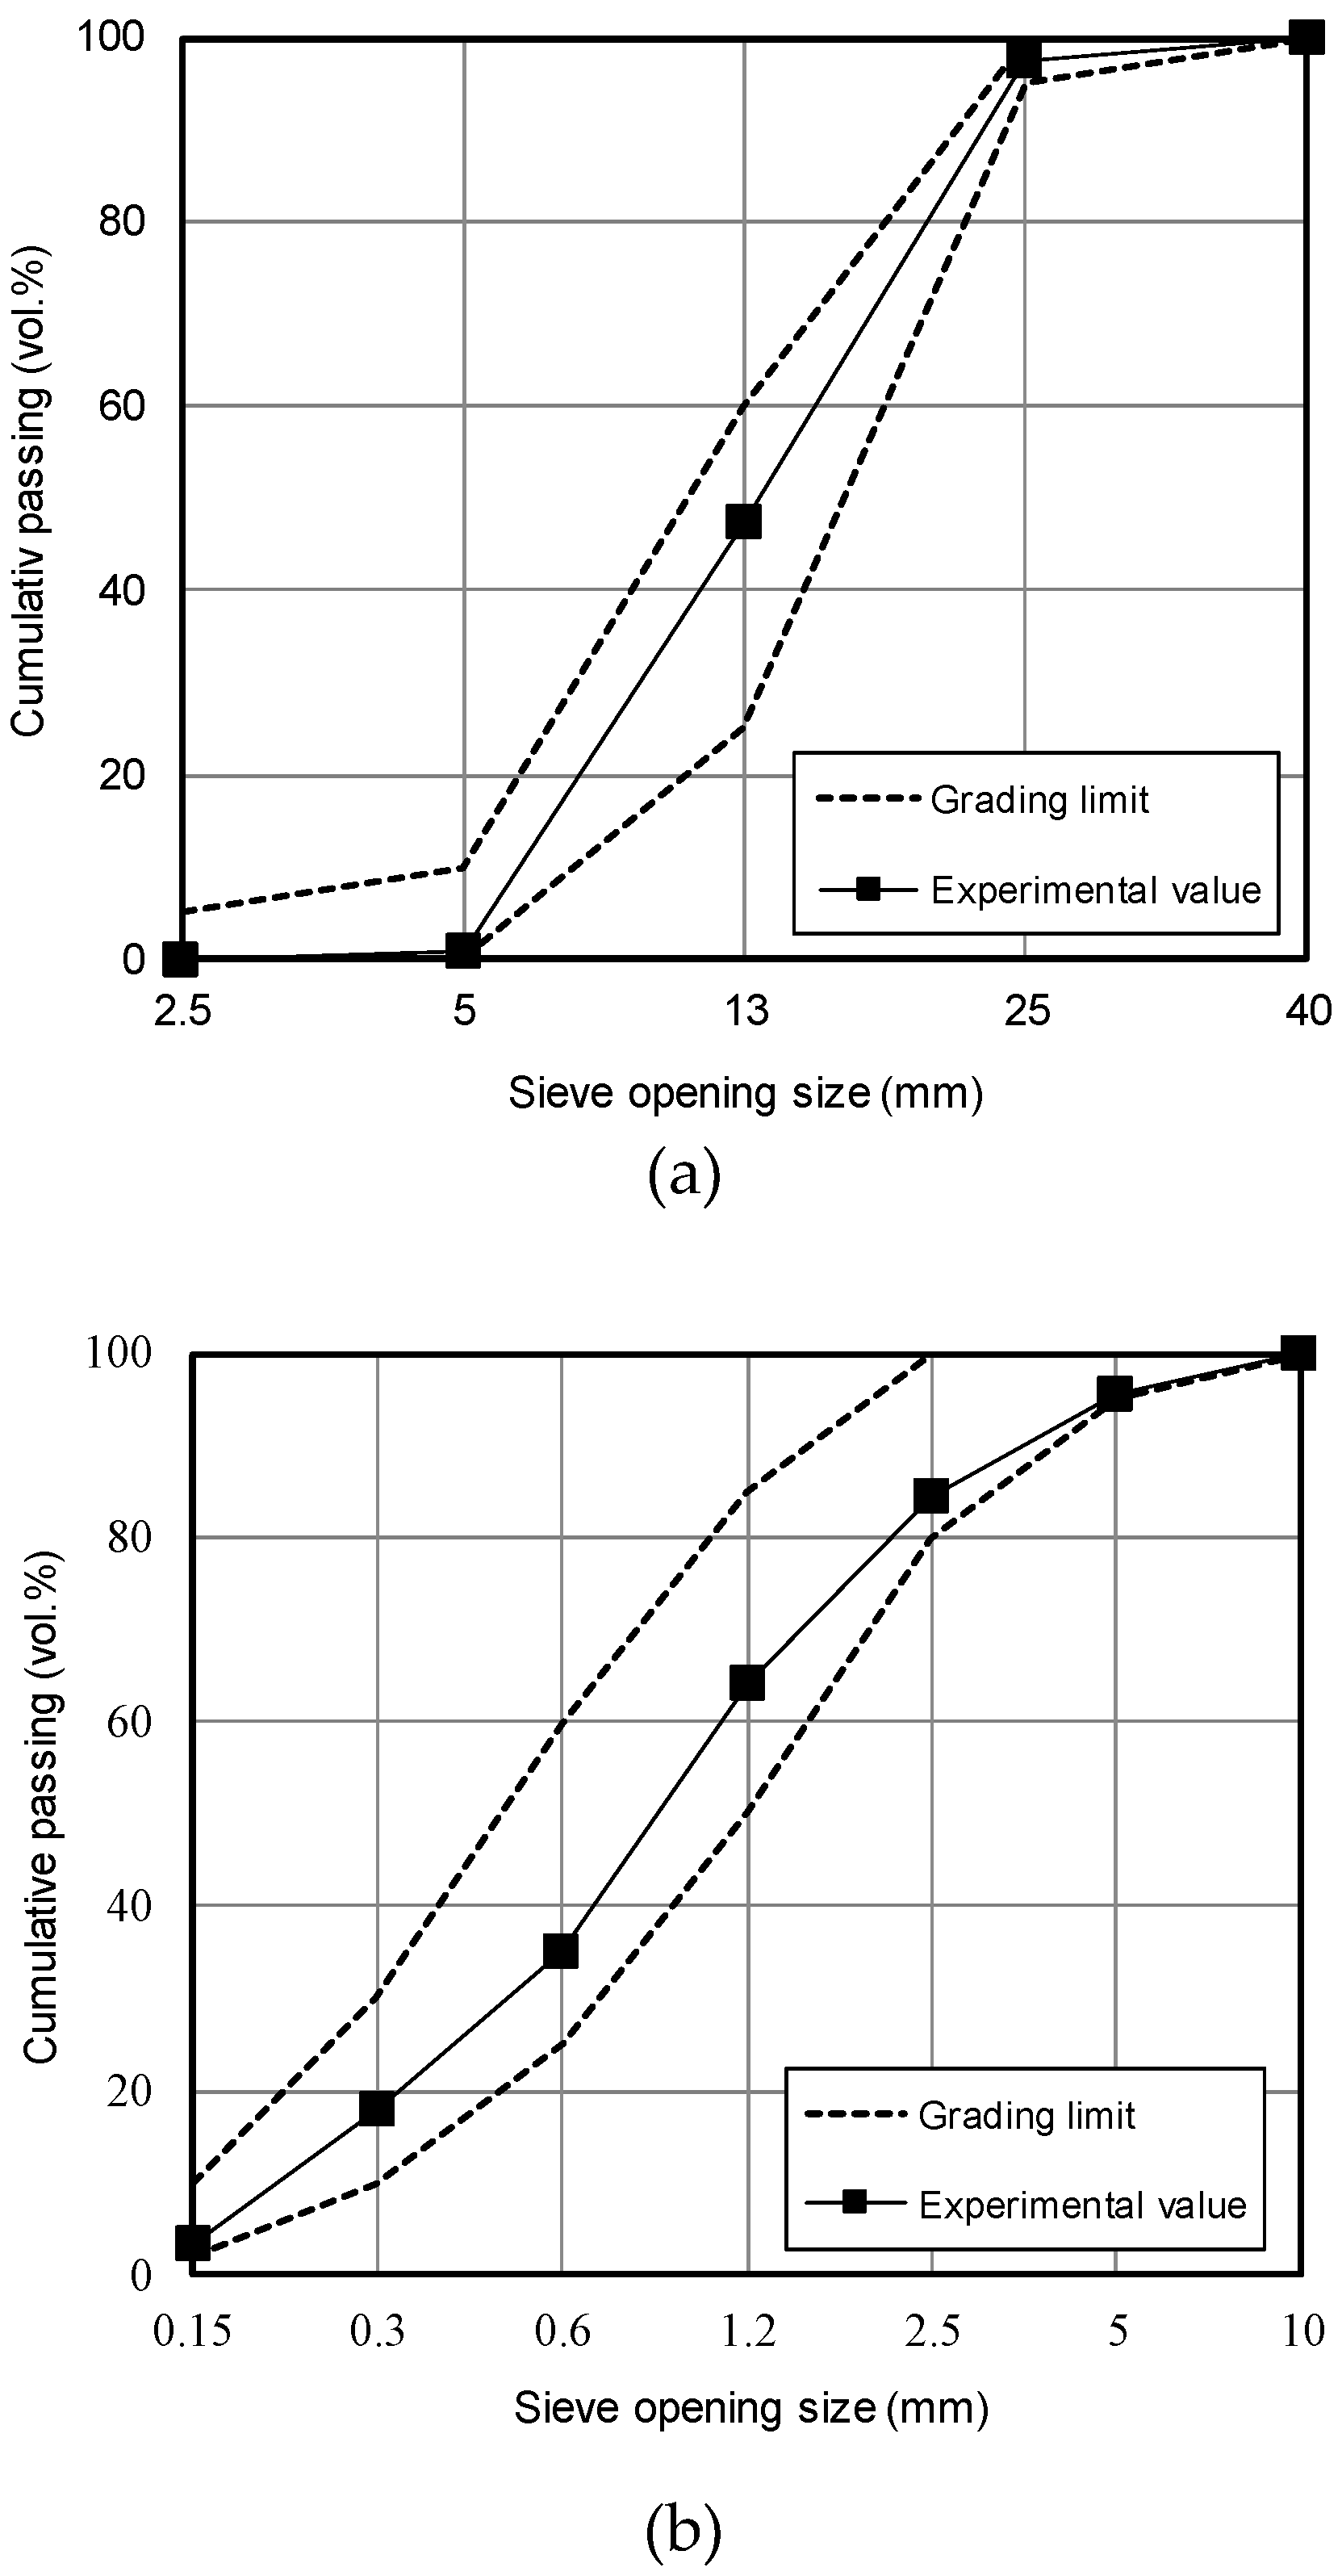
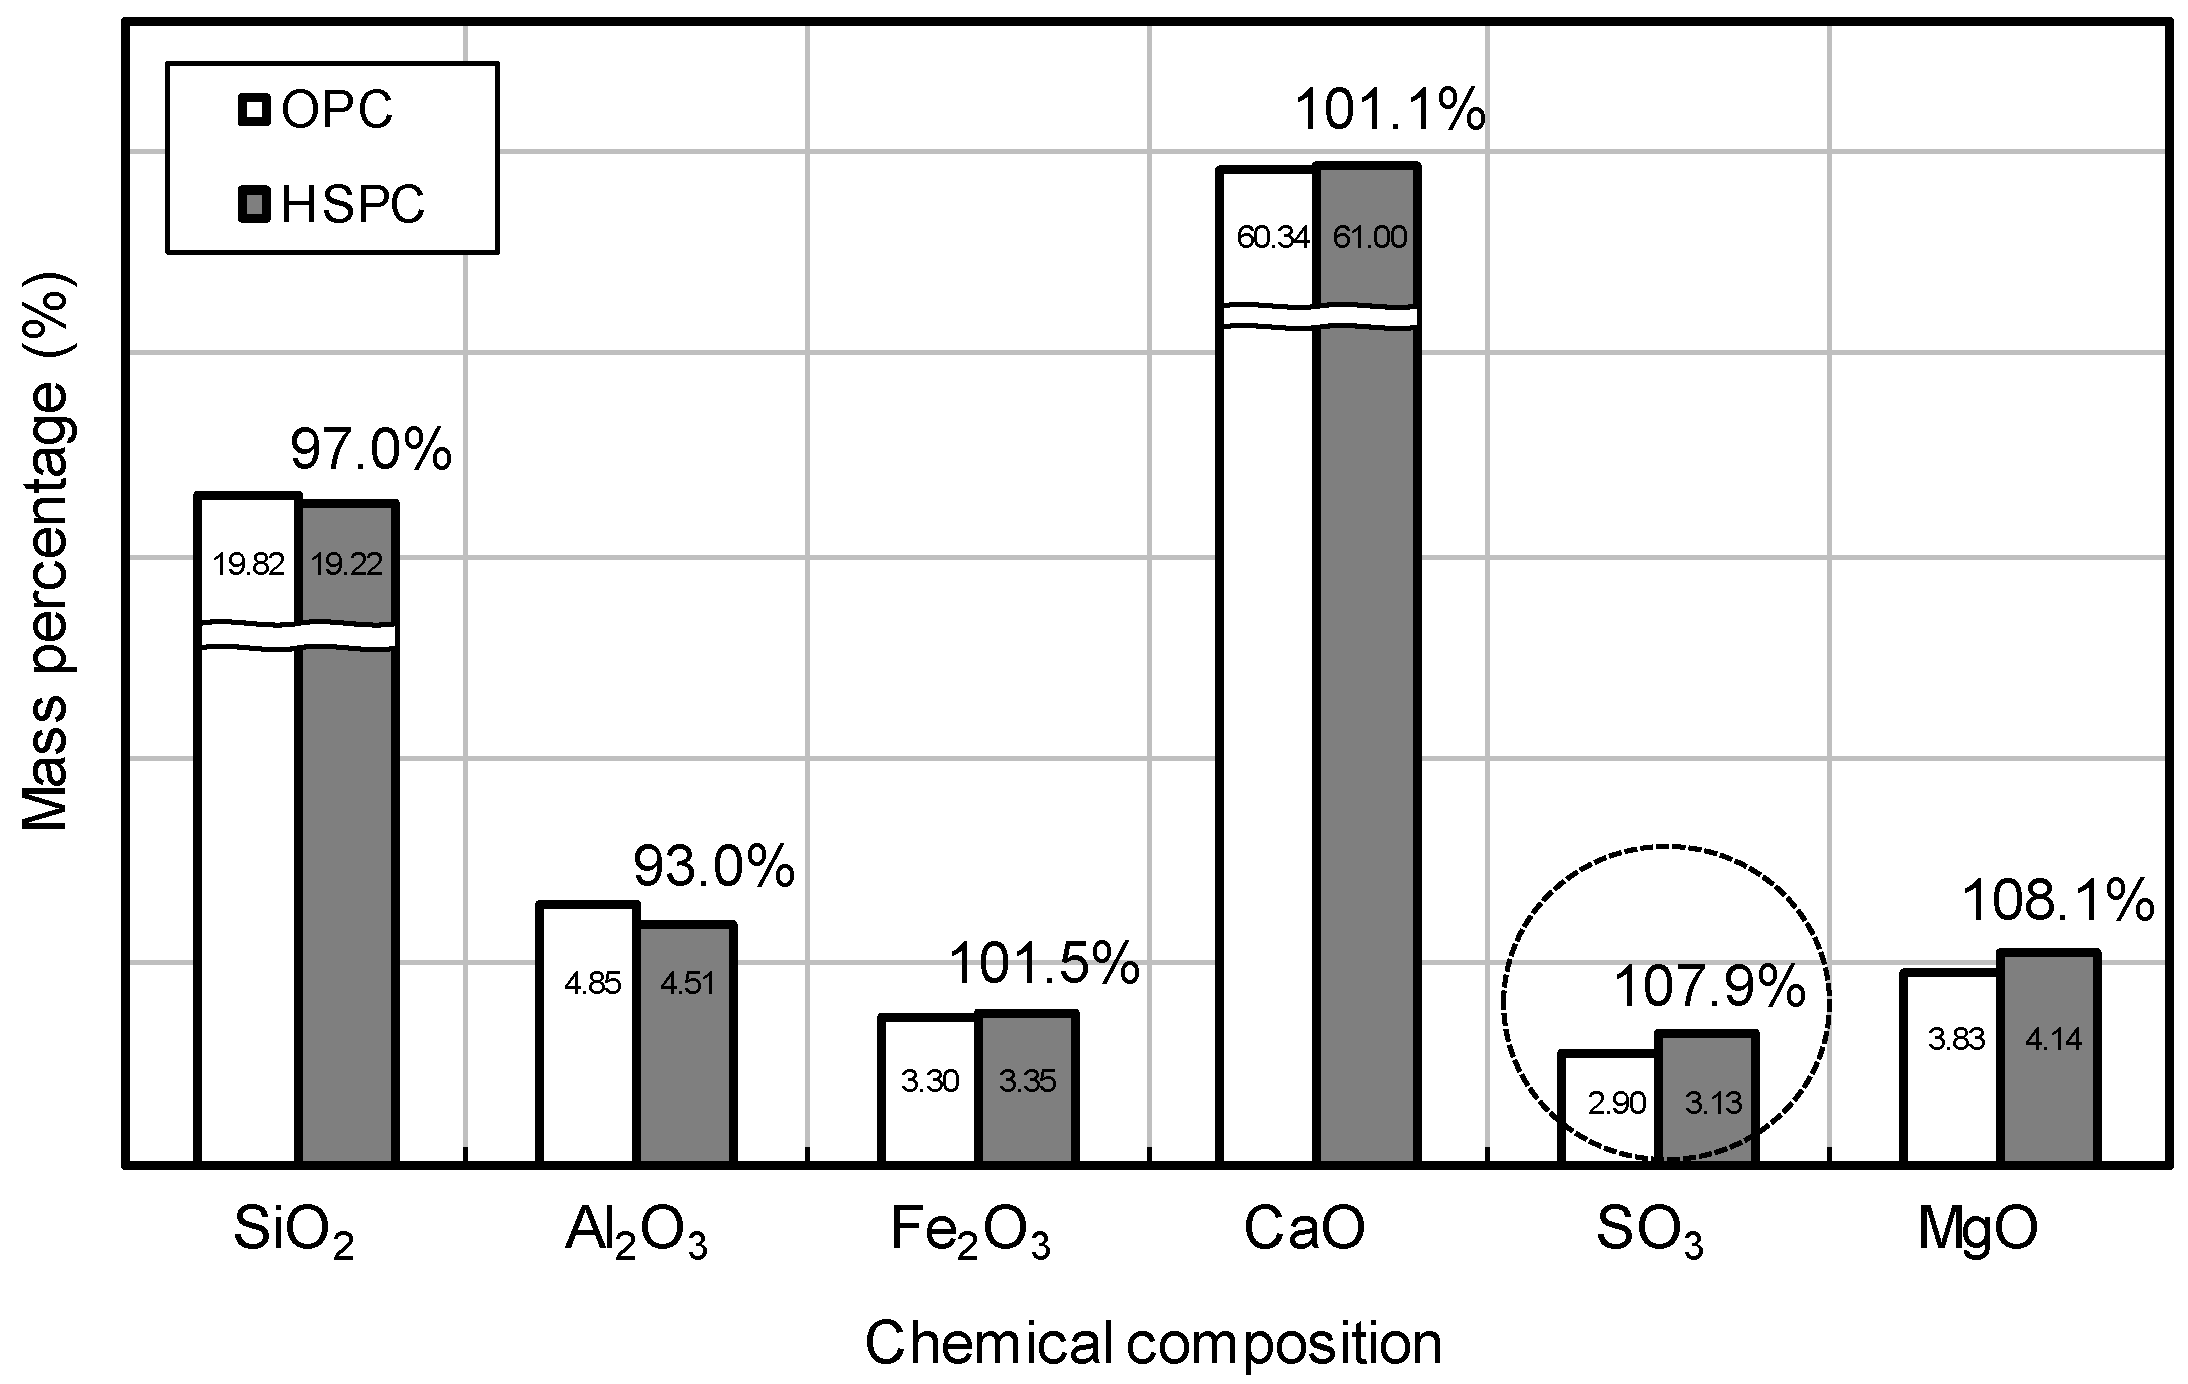
Table 2 shows the chemical composition of binders used in the tests. HSPC was characterized by higher SO3 content (3.13%) and loss on ignition (L.O.I.) than OPC. The particle size distributions, obtained using a Mastersizer 2000 (Malvern Panalytical, Seongnam-si, Korea), are shown in Figure 2. The HSPC cement had a mean diameter of 16.31 μm and fineness modulus 1.015, while OPC had a diameter of 19.46 μm and fineness 1.175; i.e., HSPC had a smaller and finer particle size distribution than OPC. Analysis using a Genesis-2020 scanning electron microscope (SEM, Emcrafts, Gwangju-si, Korea) (Figure 3) confirmed this result, revealing similarly shaped particles, but smaller in the case of HSPC. Crystallinity was analyzed by X-ray diffraction (X’pert3 Powder PW 3050, Malvern Panalytical, Seongnam-si, Korea) (Figure 4); the samples had a very similar crystal structure, except that OPC contained more brushite. Figure 5 shows the particle size distribution curves of the aggregates used in this study.
2.2. Experimental Parameters
Two series of setting time and early compressive strength tests were carried out: Series I (mortar test); Series II (concrete tests). The tests, fineness level settings, and concrete curing conditions for the two types of cement are shown in Table 3. In Series II, cement curing was set to level 3 (chamber, indoor, sealed). All experiments were performed in an environment with air temperature 20 ± 2 °C and relative humidity 30%–40%, as recommended by the National Conference of Standards Laboratories–International (NCSLI). The Series I mortar mixing proportions are summarized in Table 4. Water/cement (W/C) and cement/sand (C/S) ratios (ASTM C778) [35] were set identically for the two types of cement, and the same cement, water, and superplasticizer (admixture, AD) masses were used to make the samples. The Series II concrete mixing proportions are shown in Table 5. The quantities in these were likewise set identically. The binder unit content was fixed at 330 kg/m3, which corresponded to the compressive strength most commonly used for a typical apartment floor (24 MPa). The ready-mixed concrete was produced by Remicon S companies (Busan, Korea), which delivered the concrete to the construction sites. Ten percent of the total binder quantity was replaced with fly ash to improve durability and long-term strength, by increasing cement mix fluidity, and a polycarboxylic superplasticizer-based admixture was used.
2.3. Experimental Procedure
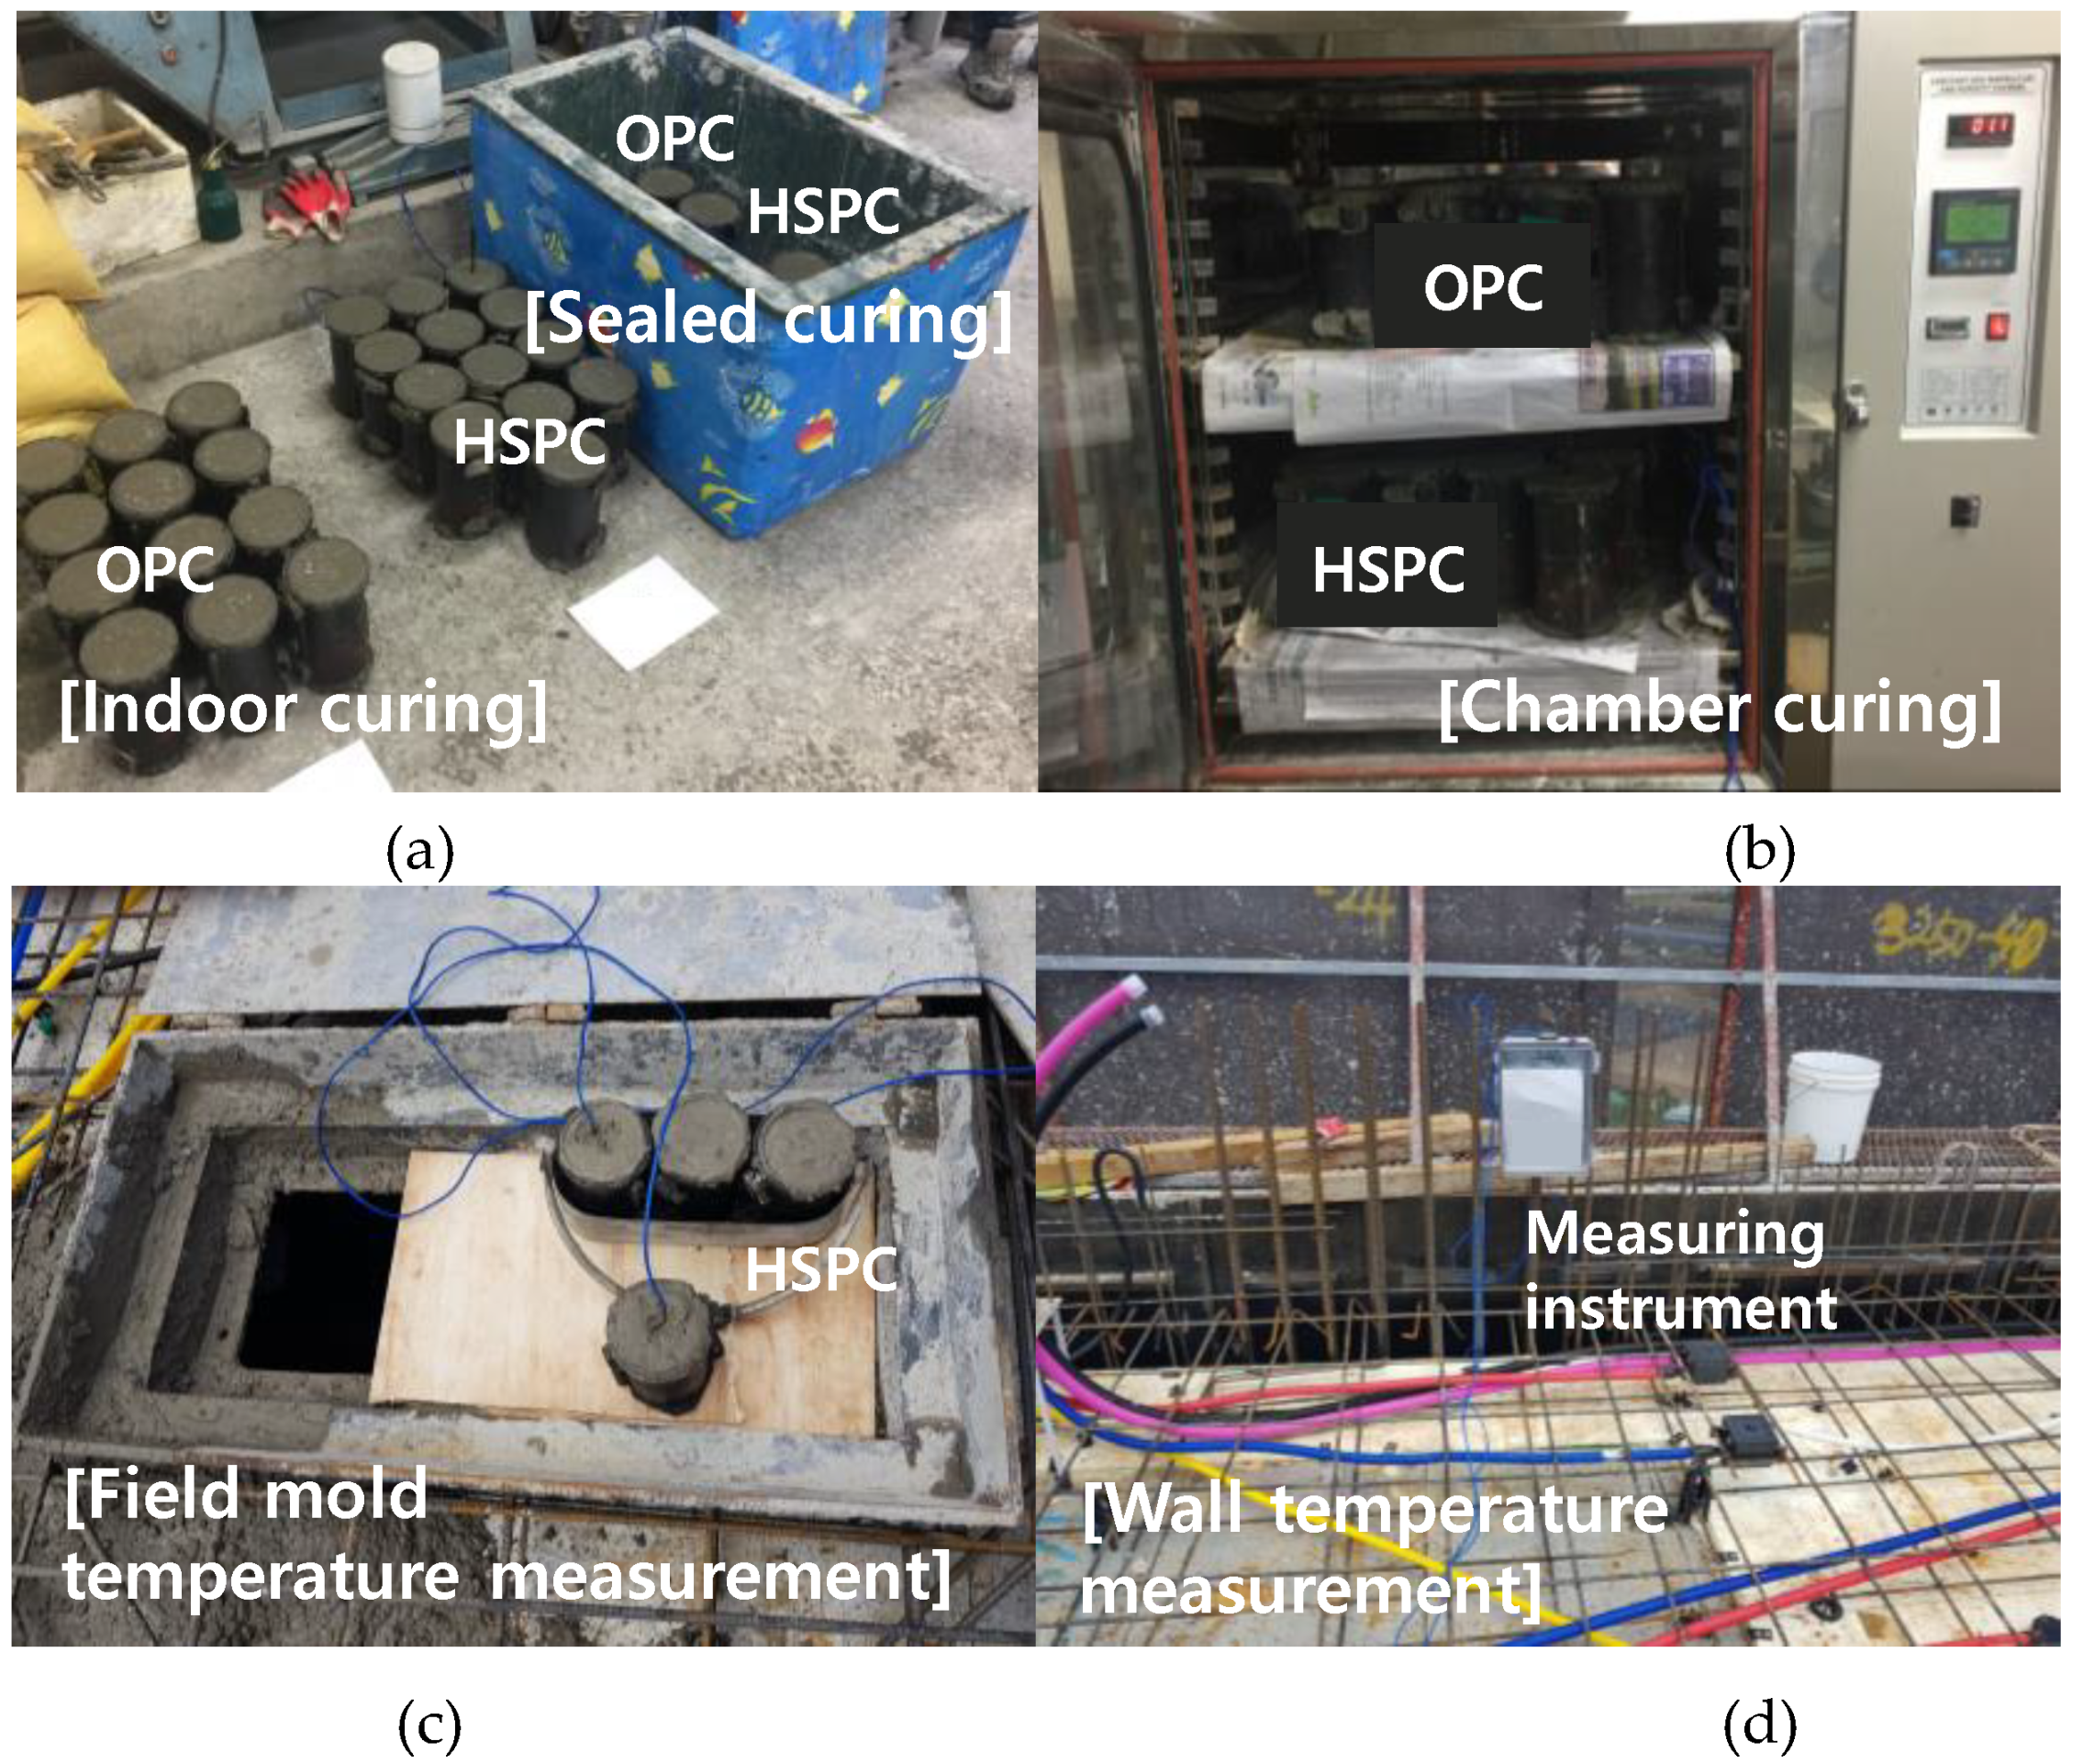
In Series I, the mortar flow test was performed according to ASTM C1437 [36], and the mortar setting test according to ASTM C403/C403M [37]. The compressive strength of mortar was measured at the age specified by ASTM C109/C109M [38]. In Series II, the concrete slump test was conducted in accordance with standard ASTM C143/C143M [39], and the air content test in accordance with ASTM C231/C231M [40]. Cylindrical specimens for compressive strength (Ø: 100 × 200 mm) were fabricated in accordance with the “Standard Test Method for Compressive Strength of Cylindrical Concrete Specimens”, described in ASTM C39/C39M [41], and the compressive strength by elapsed time was measured. As shown in Figure 6, T-type thermocouples were installed to measure the temperature history of the specimens under each curing condition using a data logger. The model proposed in ASTM C873/C873M [42] was installed to measure the compressive strength of concrete samples and record the actual history of hydration at an early age.
Equation (5), a functional formula proposed by Nurse–Saul, was used to calculate the sample maturity according to ASTM C1074 [43,44,45]. Maturity theory is closely related to the strength improvement of Portland cement concrete and was first proposed by Saul in 1951, who calculated the maturity index based on the lowest temperature at which the strength could be improved [46]. Maturity theory was further refined by Bergström [47].
where M is the maturity index (°C∙h), T is the average concrete temperature (°C) during the time interval Δt (h), T0 is the datum temperature (typically −10 °C), and t is the elapsed time (h).
Equation (6) was used to predict the early-age strength. It is a functional formula proposed by Plowman in 1956, based on the hypothesis that the compressive strength of concrete is close to linear when expressed as a logarithmic function of maturity using the Nurse–Saul equation [48]. As this simple equation has only two constants to be determined, it is generally applicable [49]:
where fc is the compressive strength (MPa), M is the maturity index (°C∙h), and a and b are regression constants.
fc = a + b∙ln(M)
3. Results and Discussion
3.1. Setting Time and Early Strength Properties of Mortar
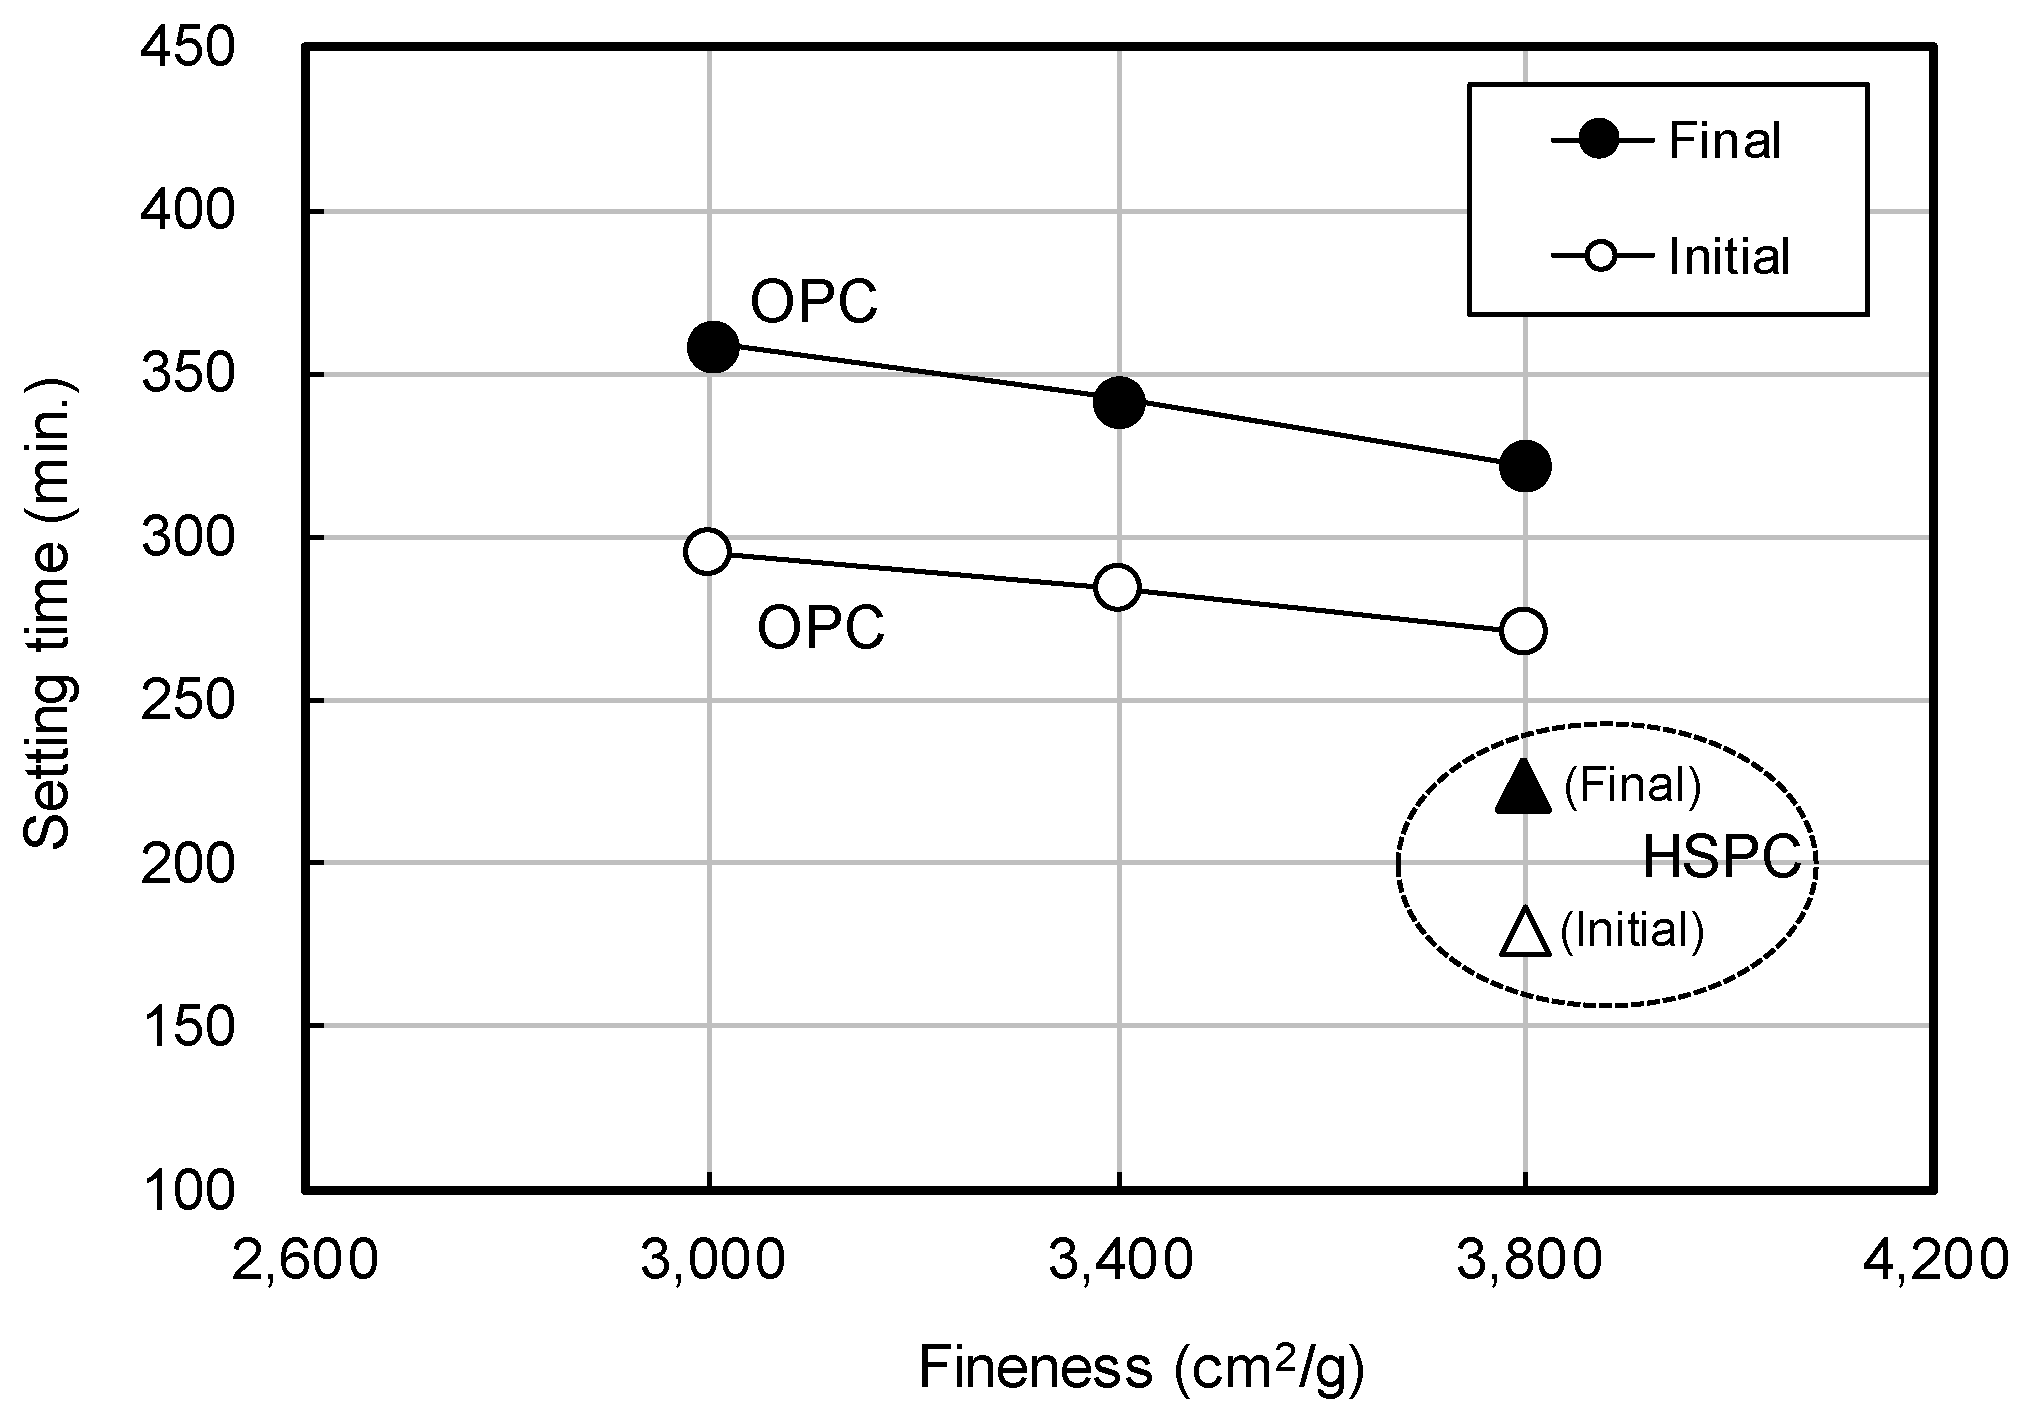
Figure 7 shows the OPC setting time by fineness. Initial setting time decreased by approximately 3 min, with fineness increased by 100 cm2/g, and the final setting time was reduced by 4 min 38 s. At the same fineness (3800 cm2/g), HSPC initial and final setting times were less than those of OPC by 92 and 98 min, respectively.
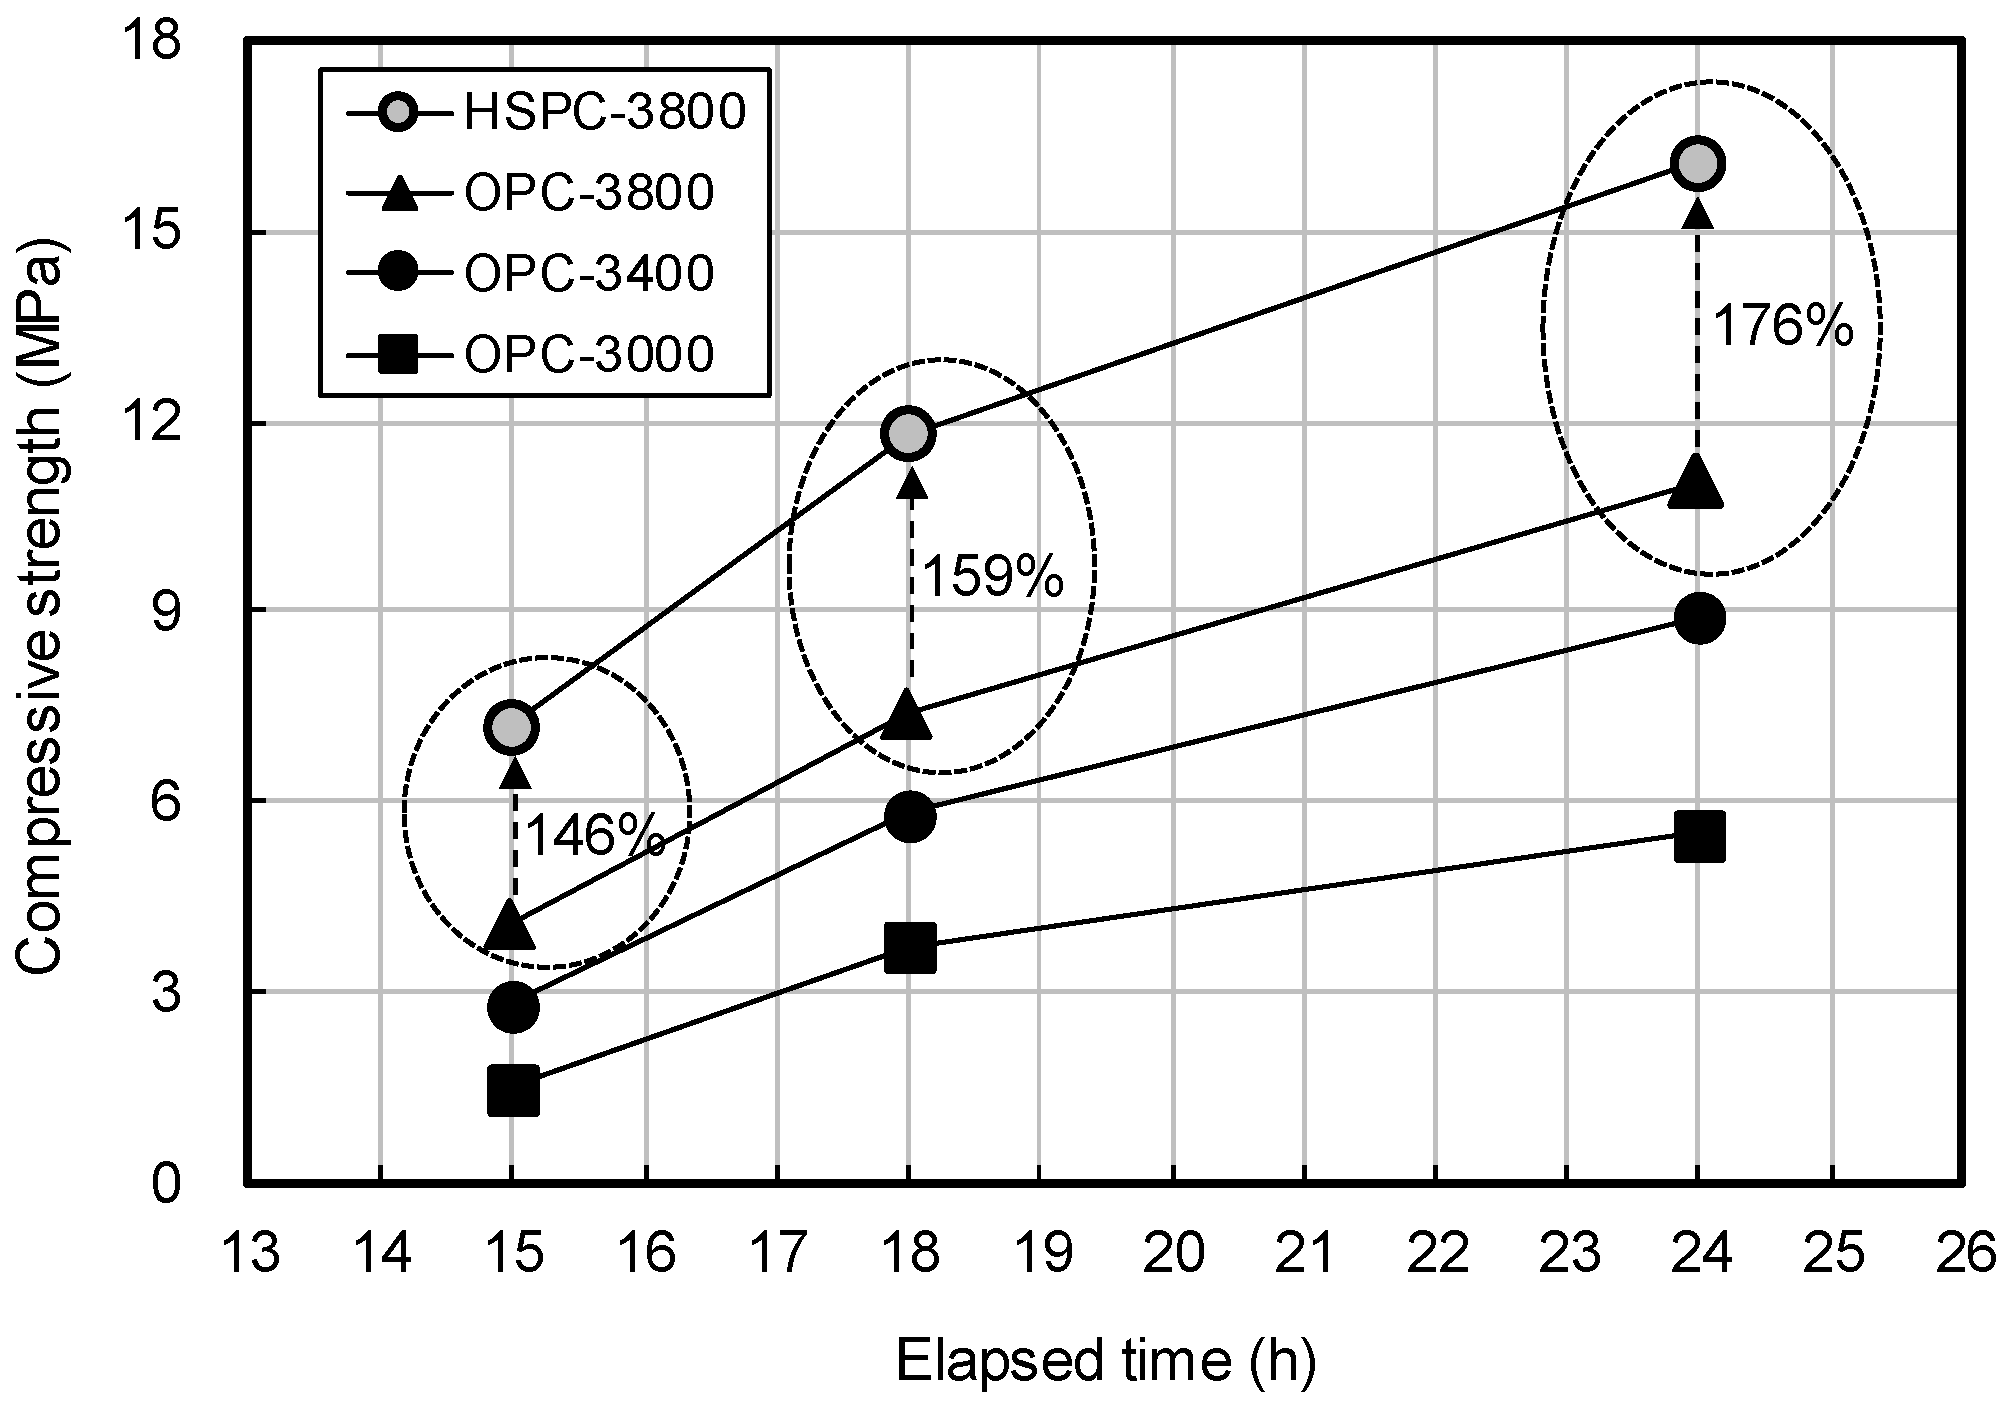
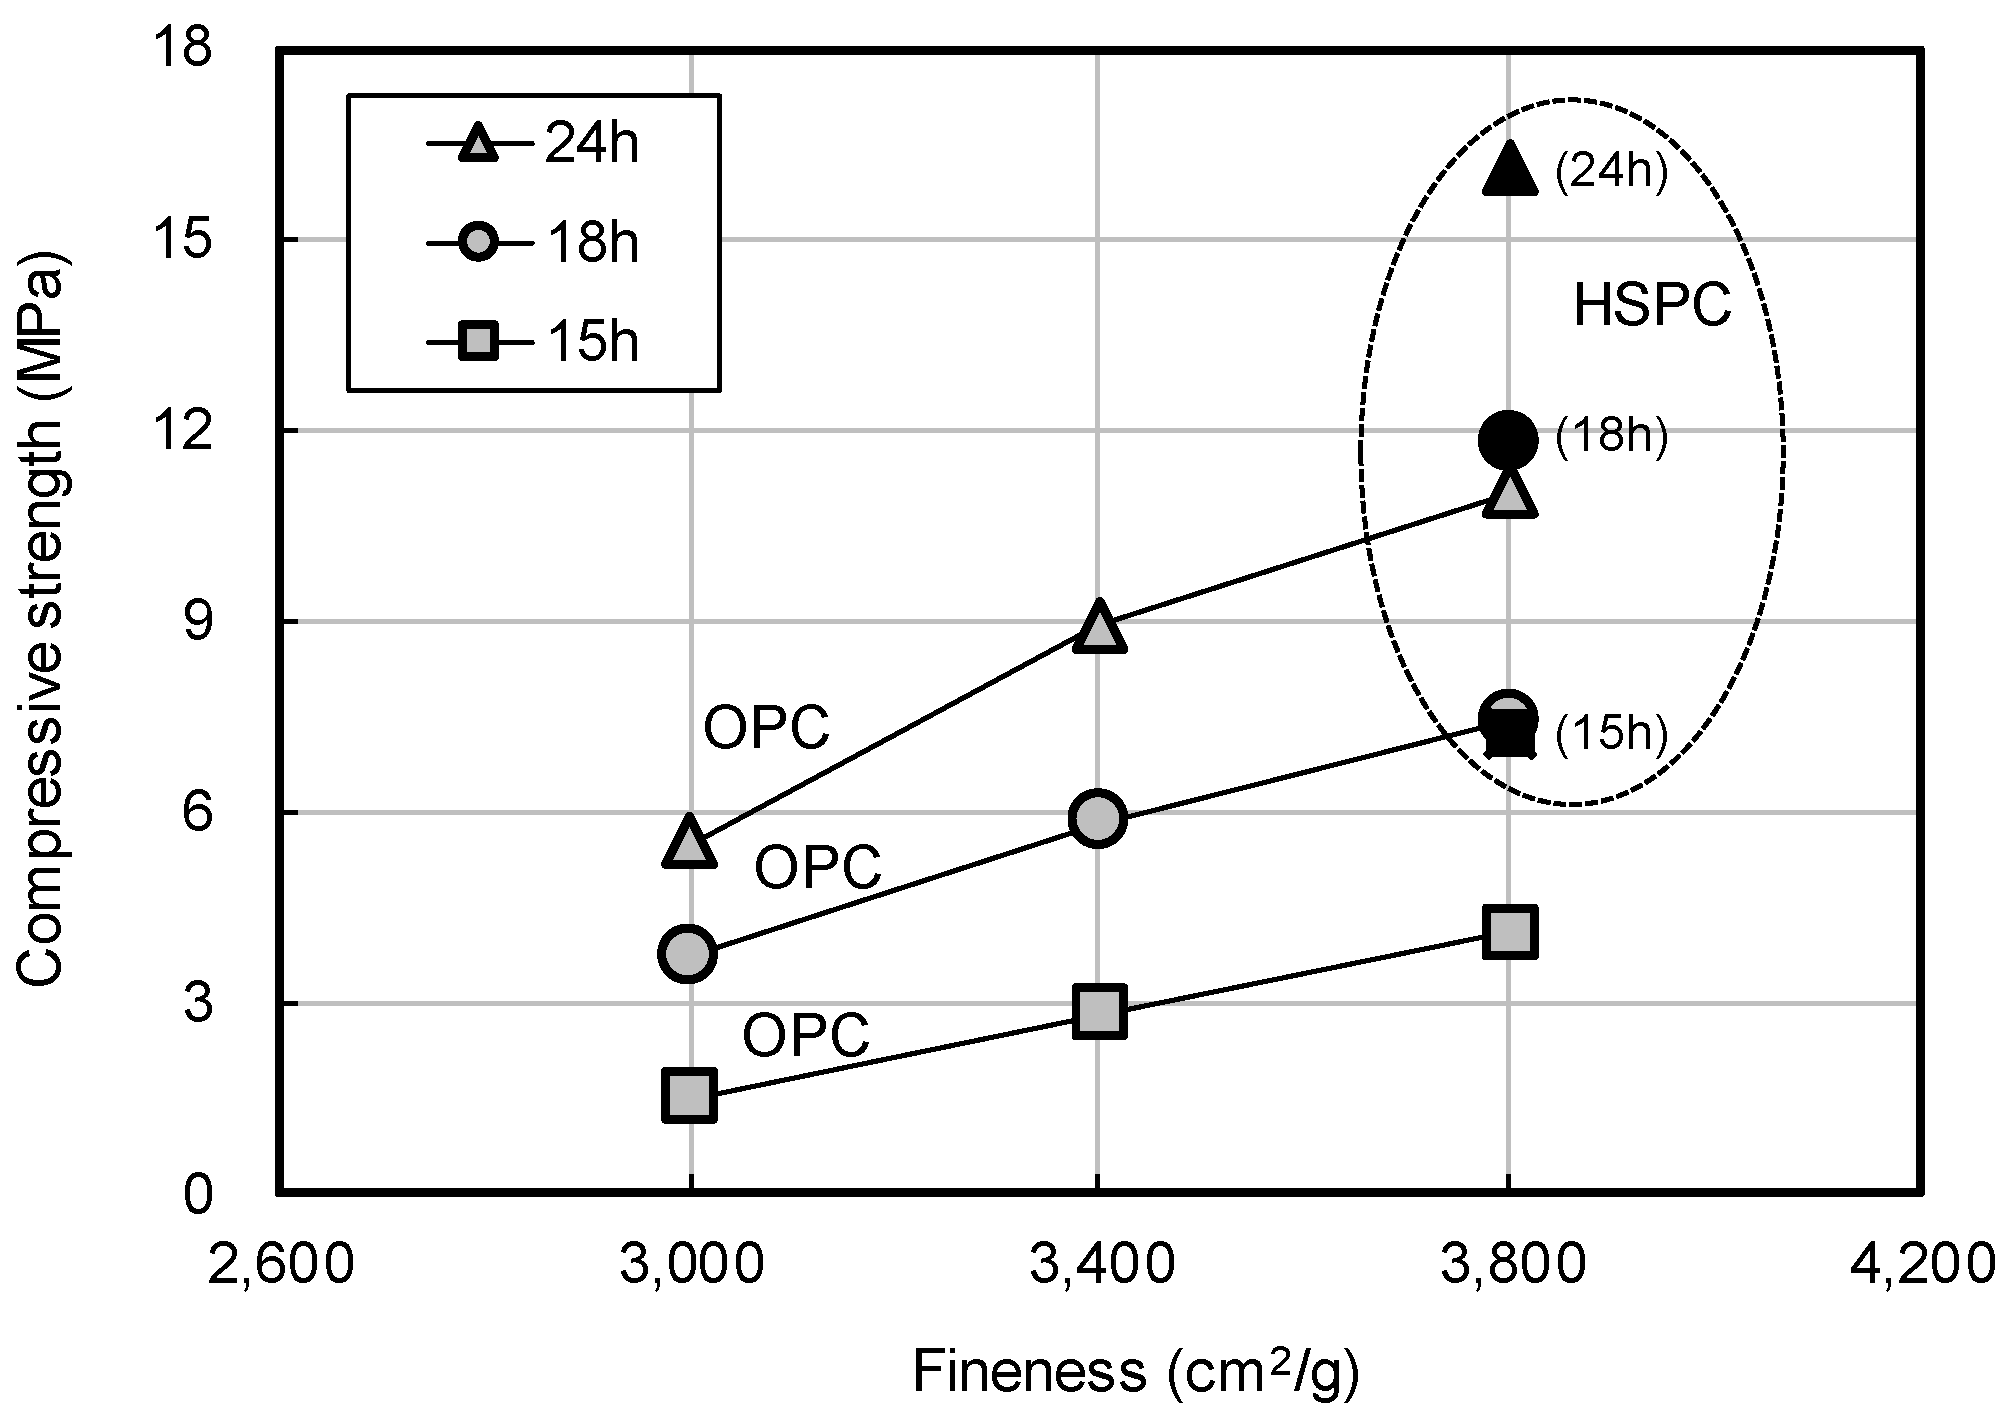
Figure 8 shows the early compressive strength of OPC and HSPC by elapsed time. At the same fineness (3800 cm2/g), the compressive strength of HSPC was higher by 146%, 159%, and 176% after 15 h, 18 h, and 24 h, respectively. Figure 9 shows the early compressive strength of OPC by fineness. Early compressive strength increased with the degree of fineness. Strength improvements of 0.33 MPa, 0.46 MPa, and 0.69 MPa were observed at 15 h, 18 h, and 24 h of elapsed time, per 100 cm2/g increase in fineness.
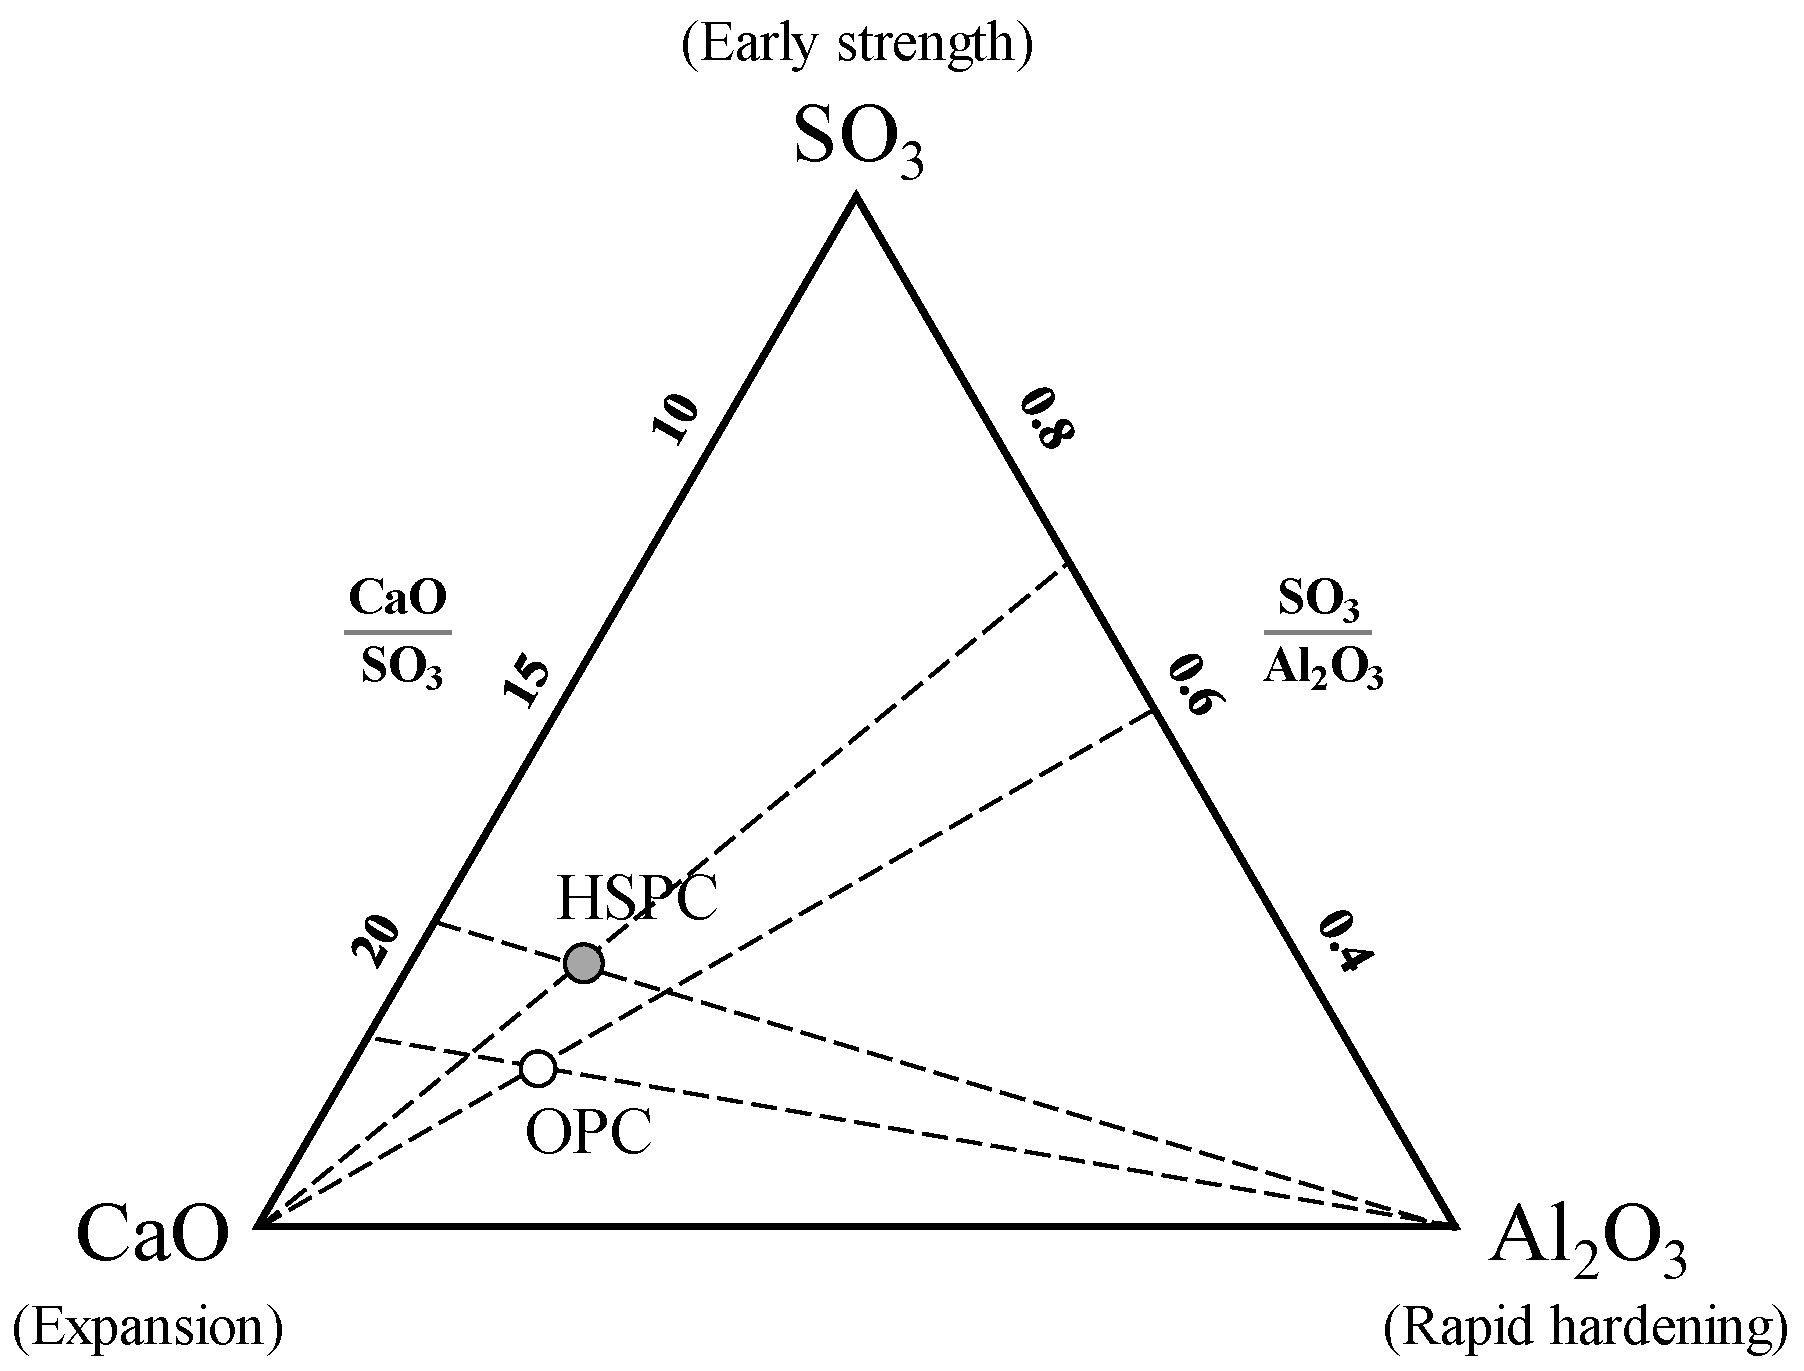
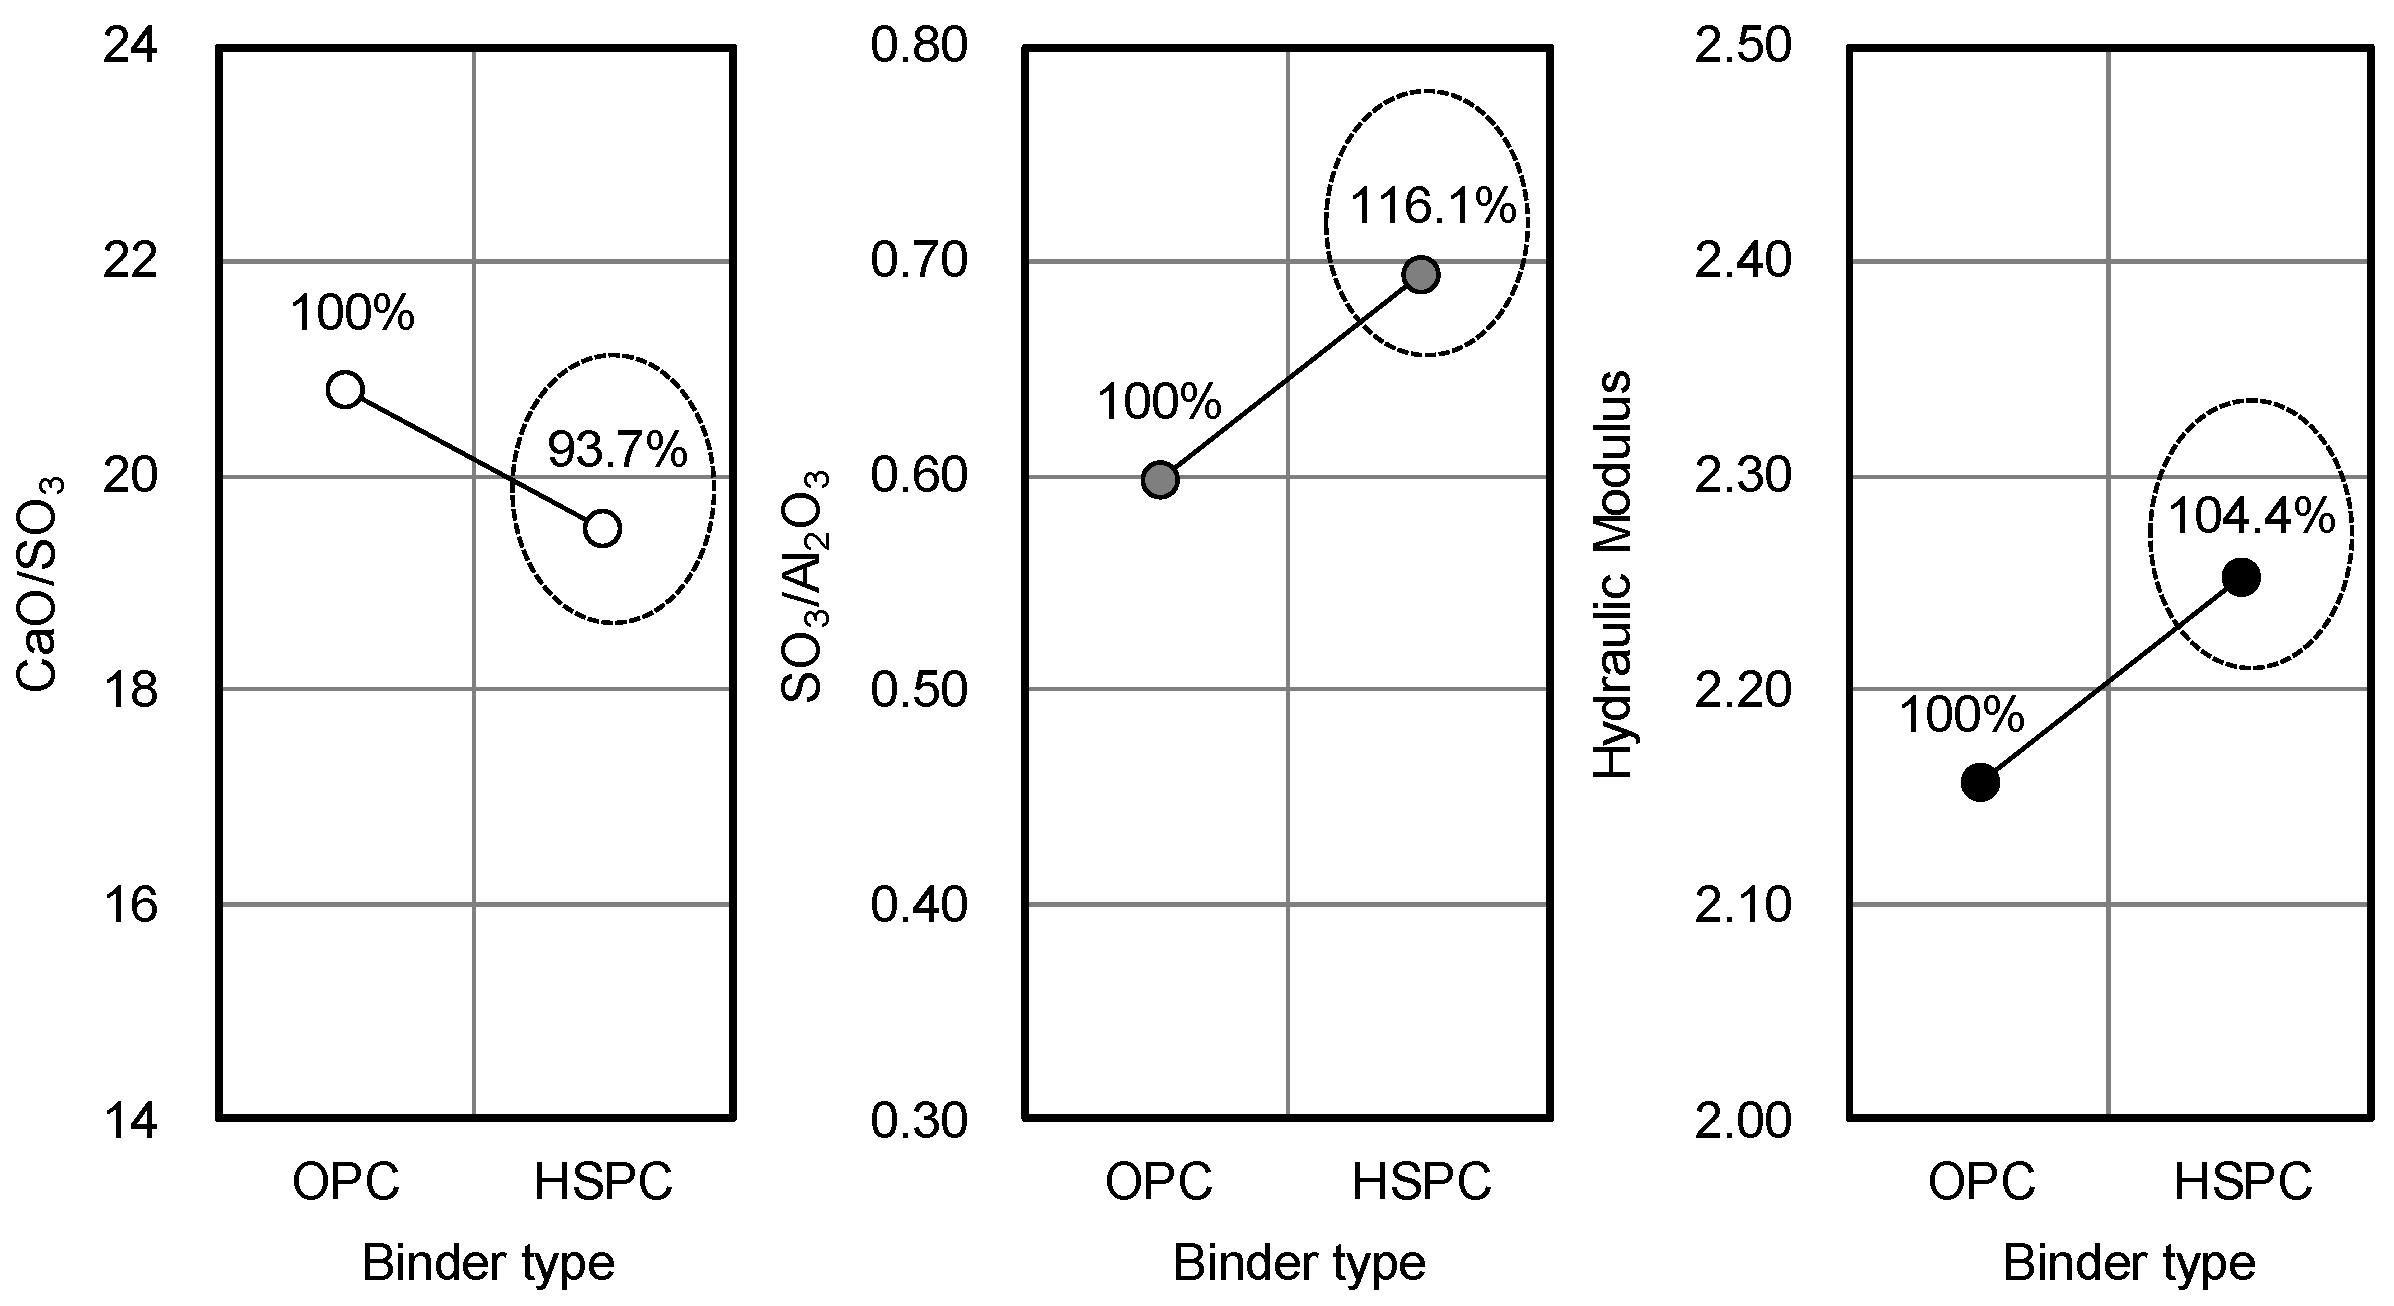
Taken together, the results of Figure 7, Figure 8 and Figure 9 showed that as the fineness of cement increased, setting time decreased, and early compressive strength increased. This might be due to enhanced activation of the initial hydration reaction with increasing fineness. However, at the same level of fineness, HSPC exhibited a faster setting time and higher early compressive strength than OPC. For this reason, the molar ratios CaO/SO3 and SO3/Al2O3 and the hydraulic moduli of OPC and HSPC were reviewed (Figure 10 and Figure 11). For HSPC relative to OPC, the CaO/SO3 ratio was lower (93.7%), the SO3/Al2O3 ratio was higher (116.1%), and the hydraulic modulus (CaO/(SIO2 + Al2O3 + Fe2O3)) was also higher (104.4%). These differences have implied correspondence with the faster setting time and higher early compressive strength of HSPC at the same fineness.
3.2. Early Strength Properties of Concrete
Fresh OPC and HSPC were produced from the batchers at Remicon S. The initial air content and slump values after production were compared with those obtained one hour after production. The test results revealed that both OPC and HSPC met the target slump and air content values of 180 ± 25 mm and 4.5 ± 1.5%, respectively (Table 6).
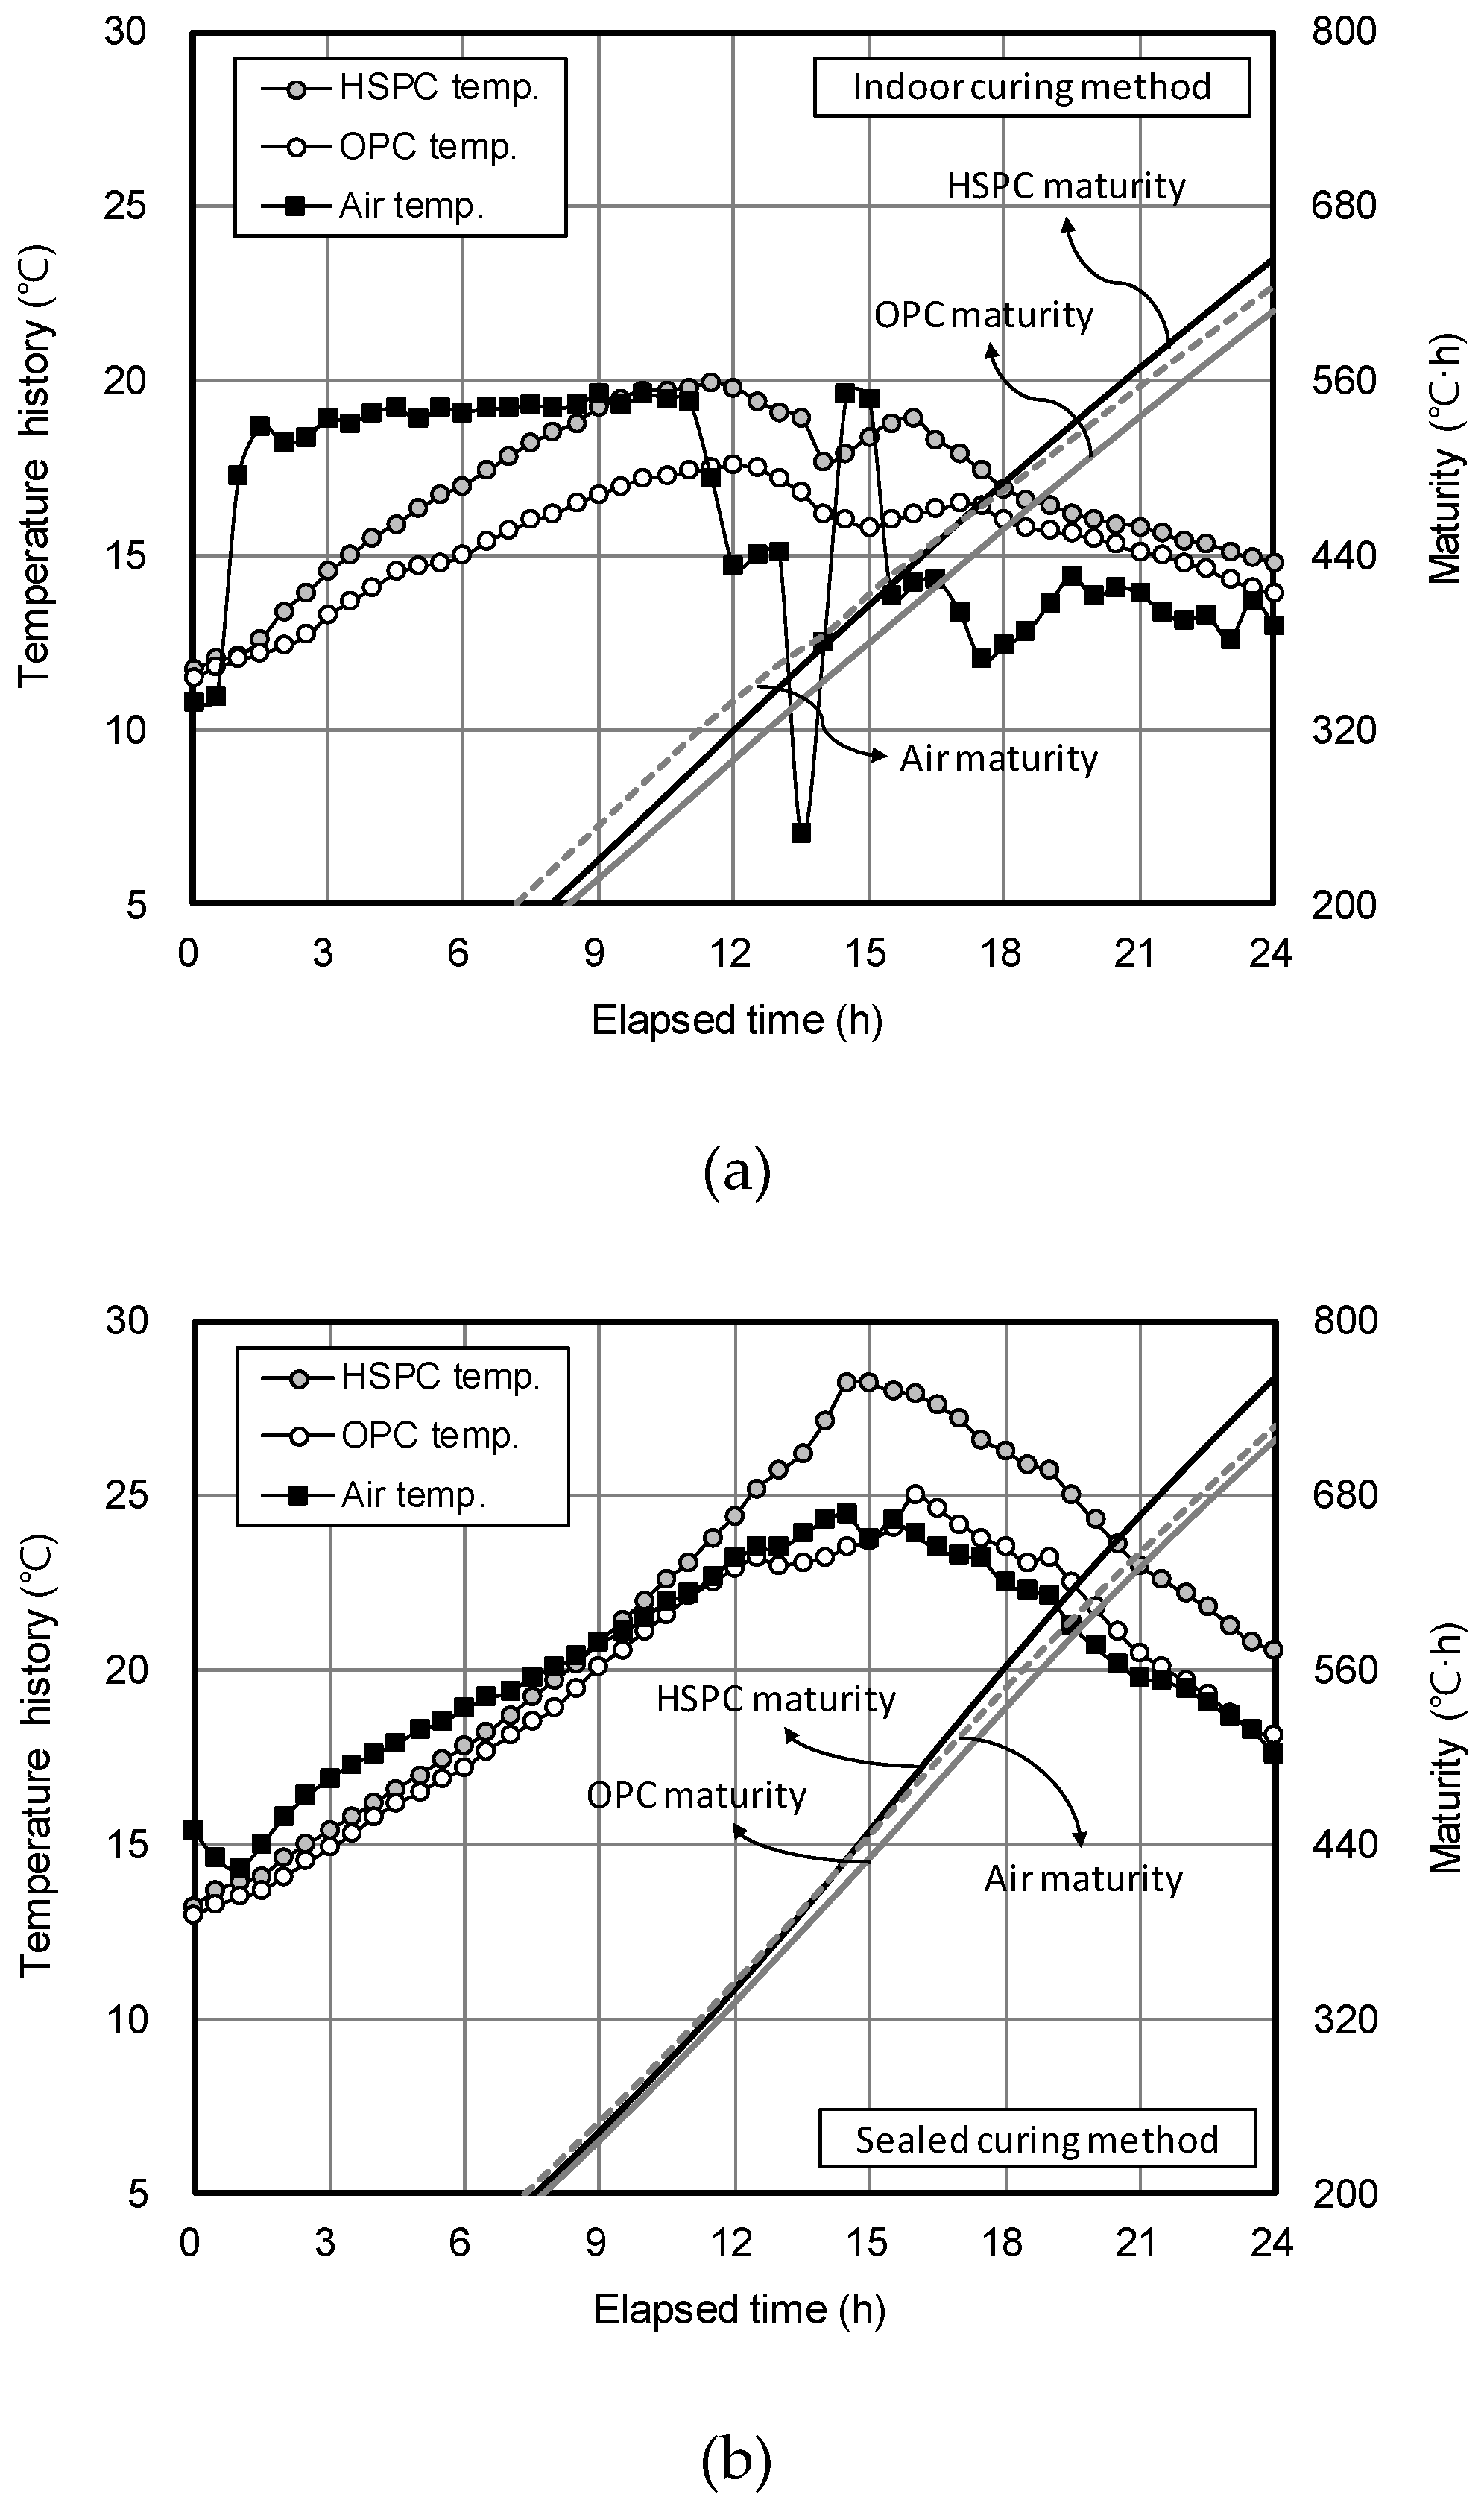
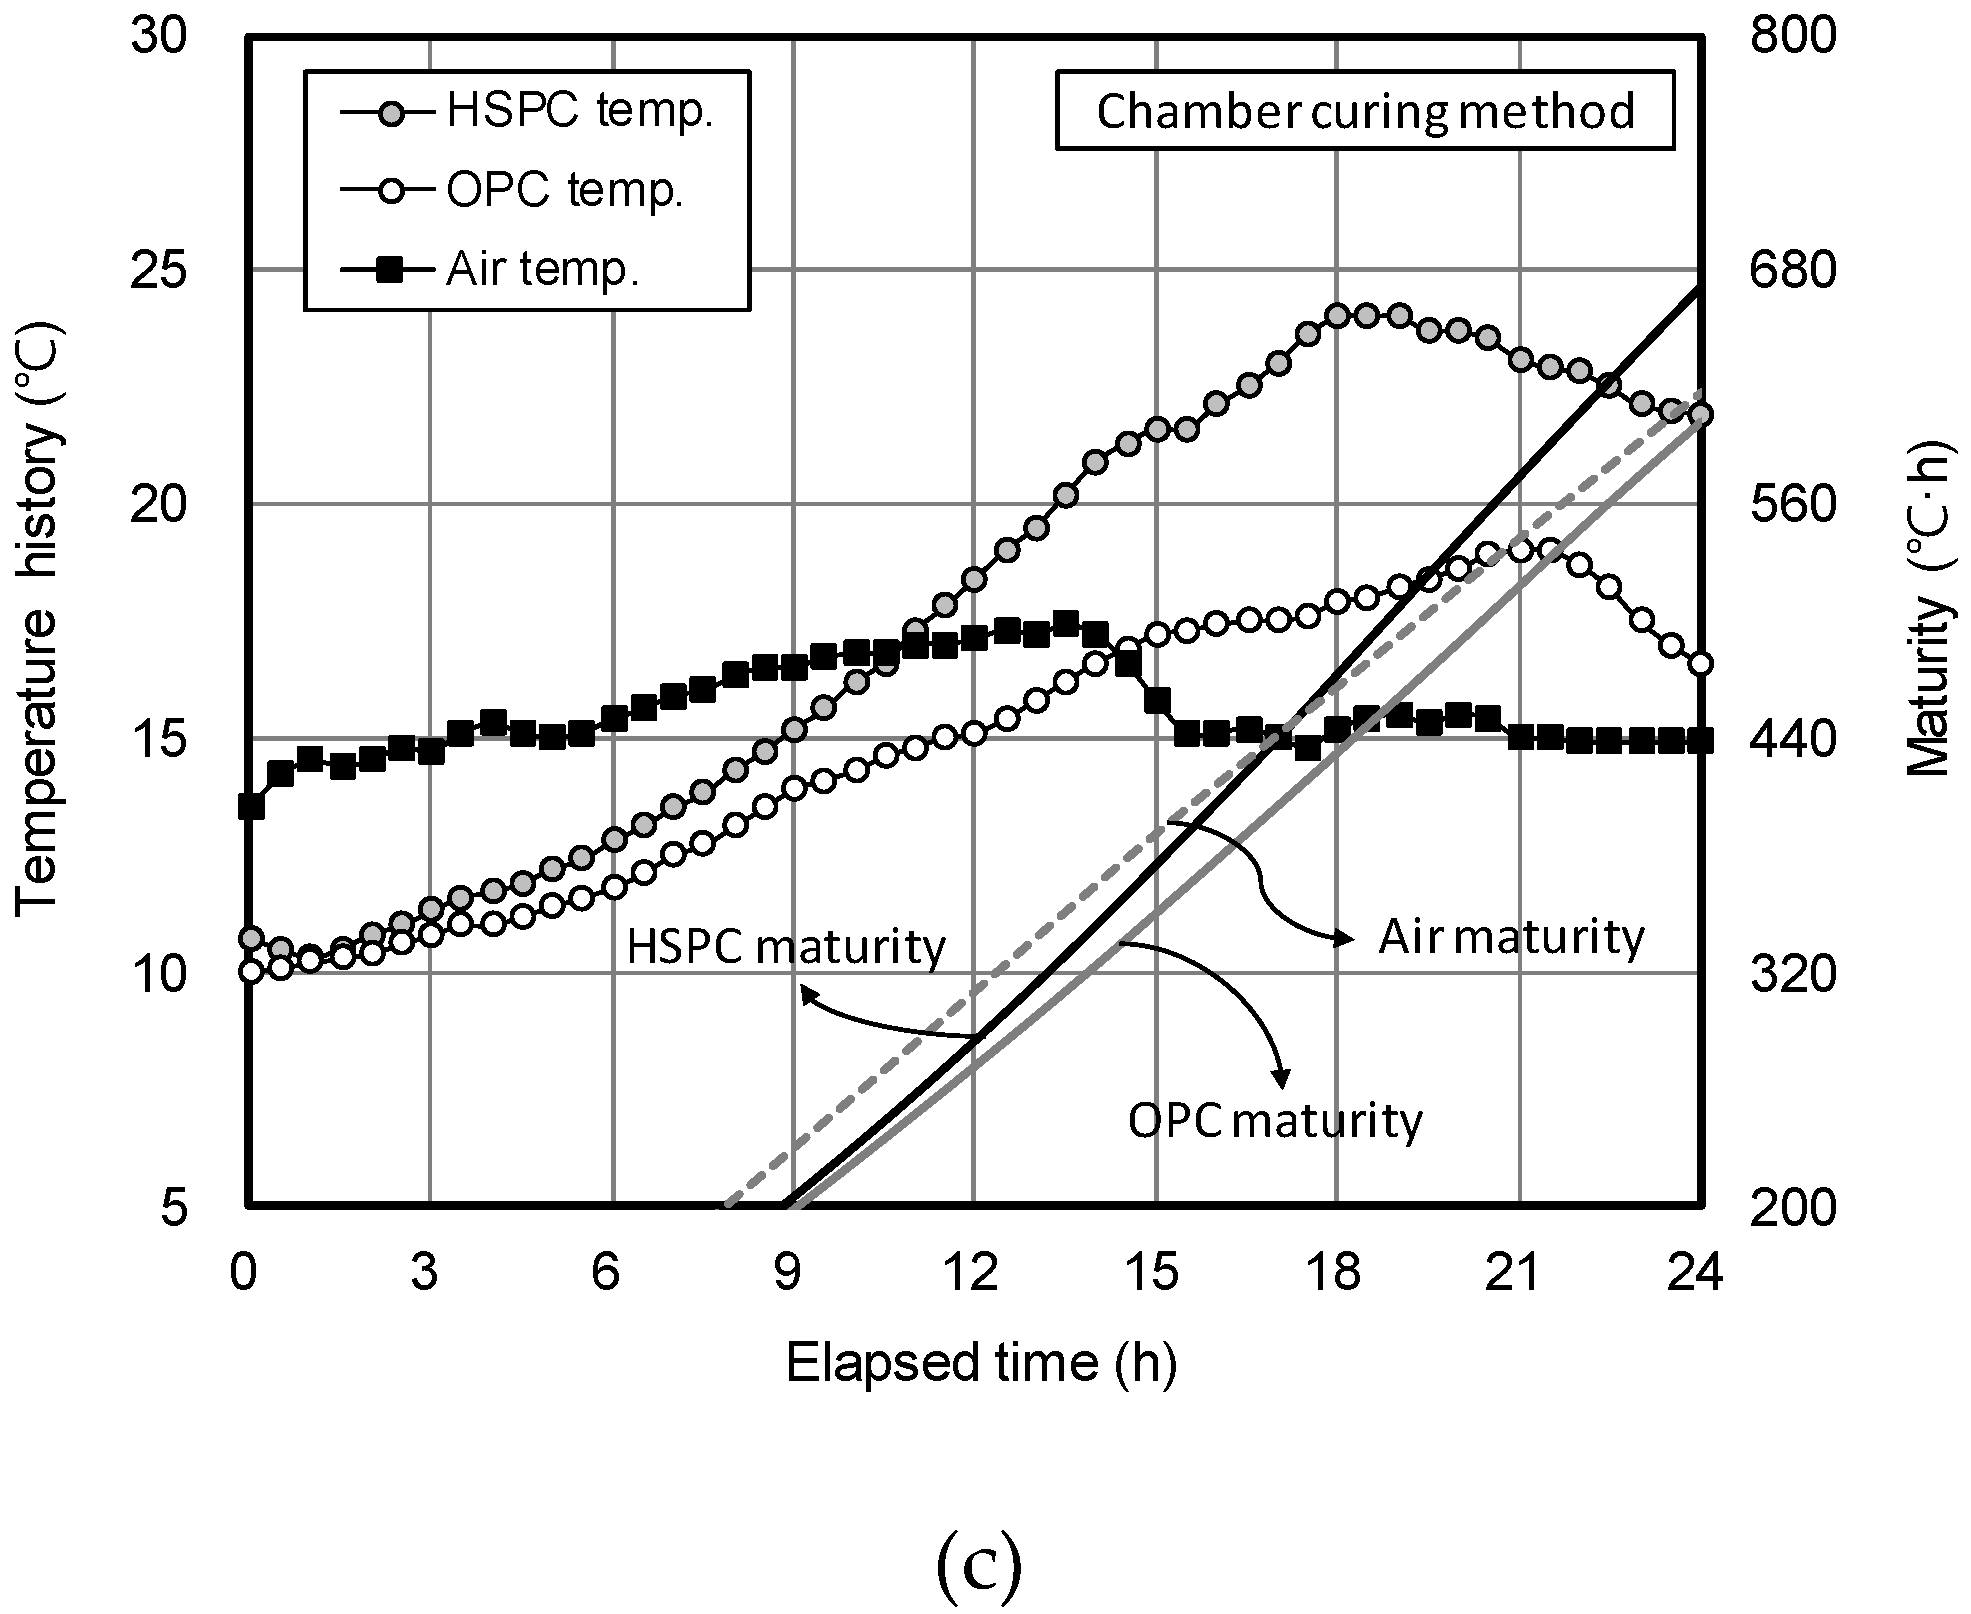
Figure 12 shows the curing temperature history and maturity for concrete samples under the three curing methods. The order of maturity after 24 h was HSPC concrete > Air > OPC concrete, regardless of the method. The indoor curing results after 24 h (Figure 12a) showed that HSPC concrete maturity (644.6 °C·h) was 103% higher than air (625.8 °C·h), whereas OPC concrete (608.6 °C·h) was as low as 97.2%. The sealed curing results after 24 h (Figure 12b) showed that HSPC concrete maturity (762.5 °C·h) was 104.6% higher than air (729.2 °C·h), whereas OPC concrete (719.2 °C·h) was at 98.6%. The chamber curing results after 24 h (Figure 12c) showed that HSPC concrete maturity (672.7 °C·h) was 108.8% higher than air (618.6 °C·h), while OPC concrete (602.1 °C·h) was 97.3% of the air value.
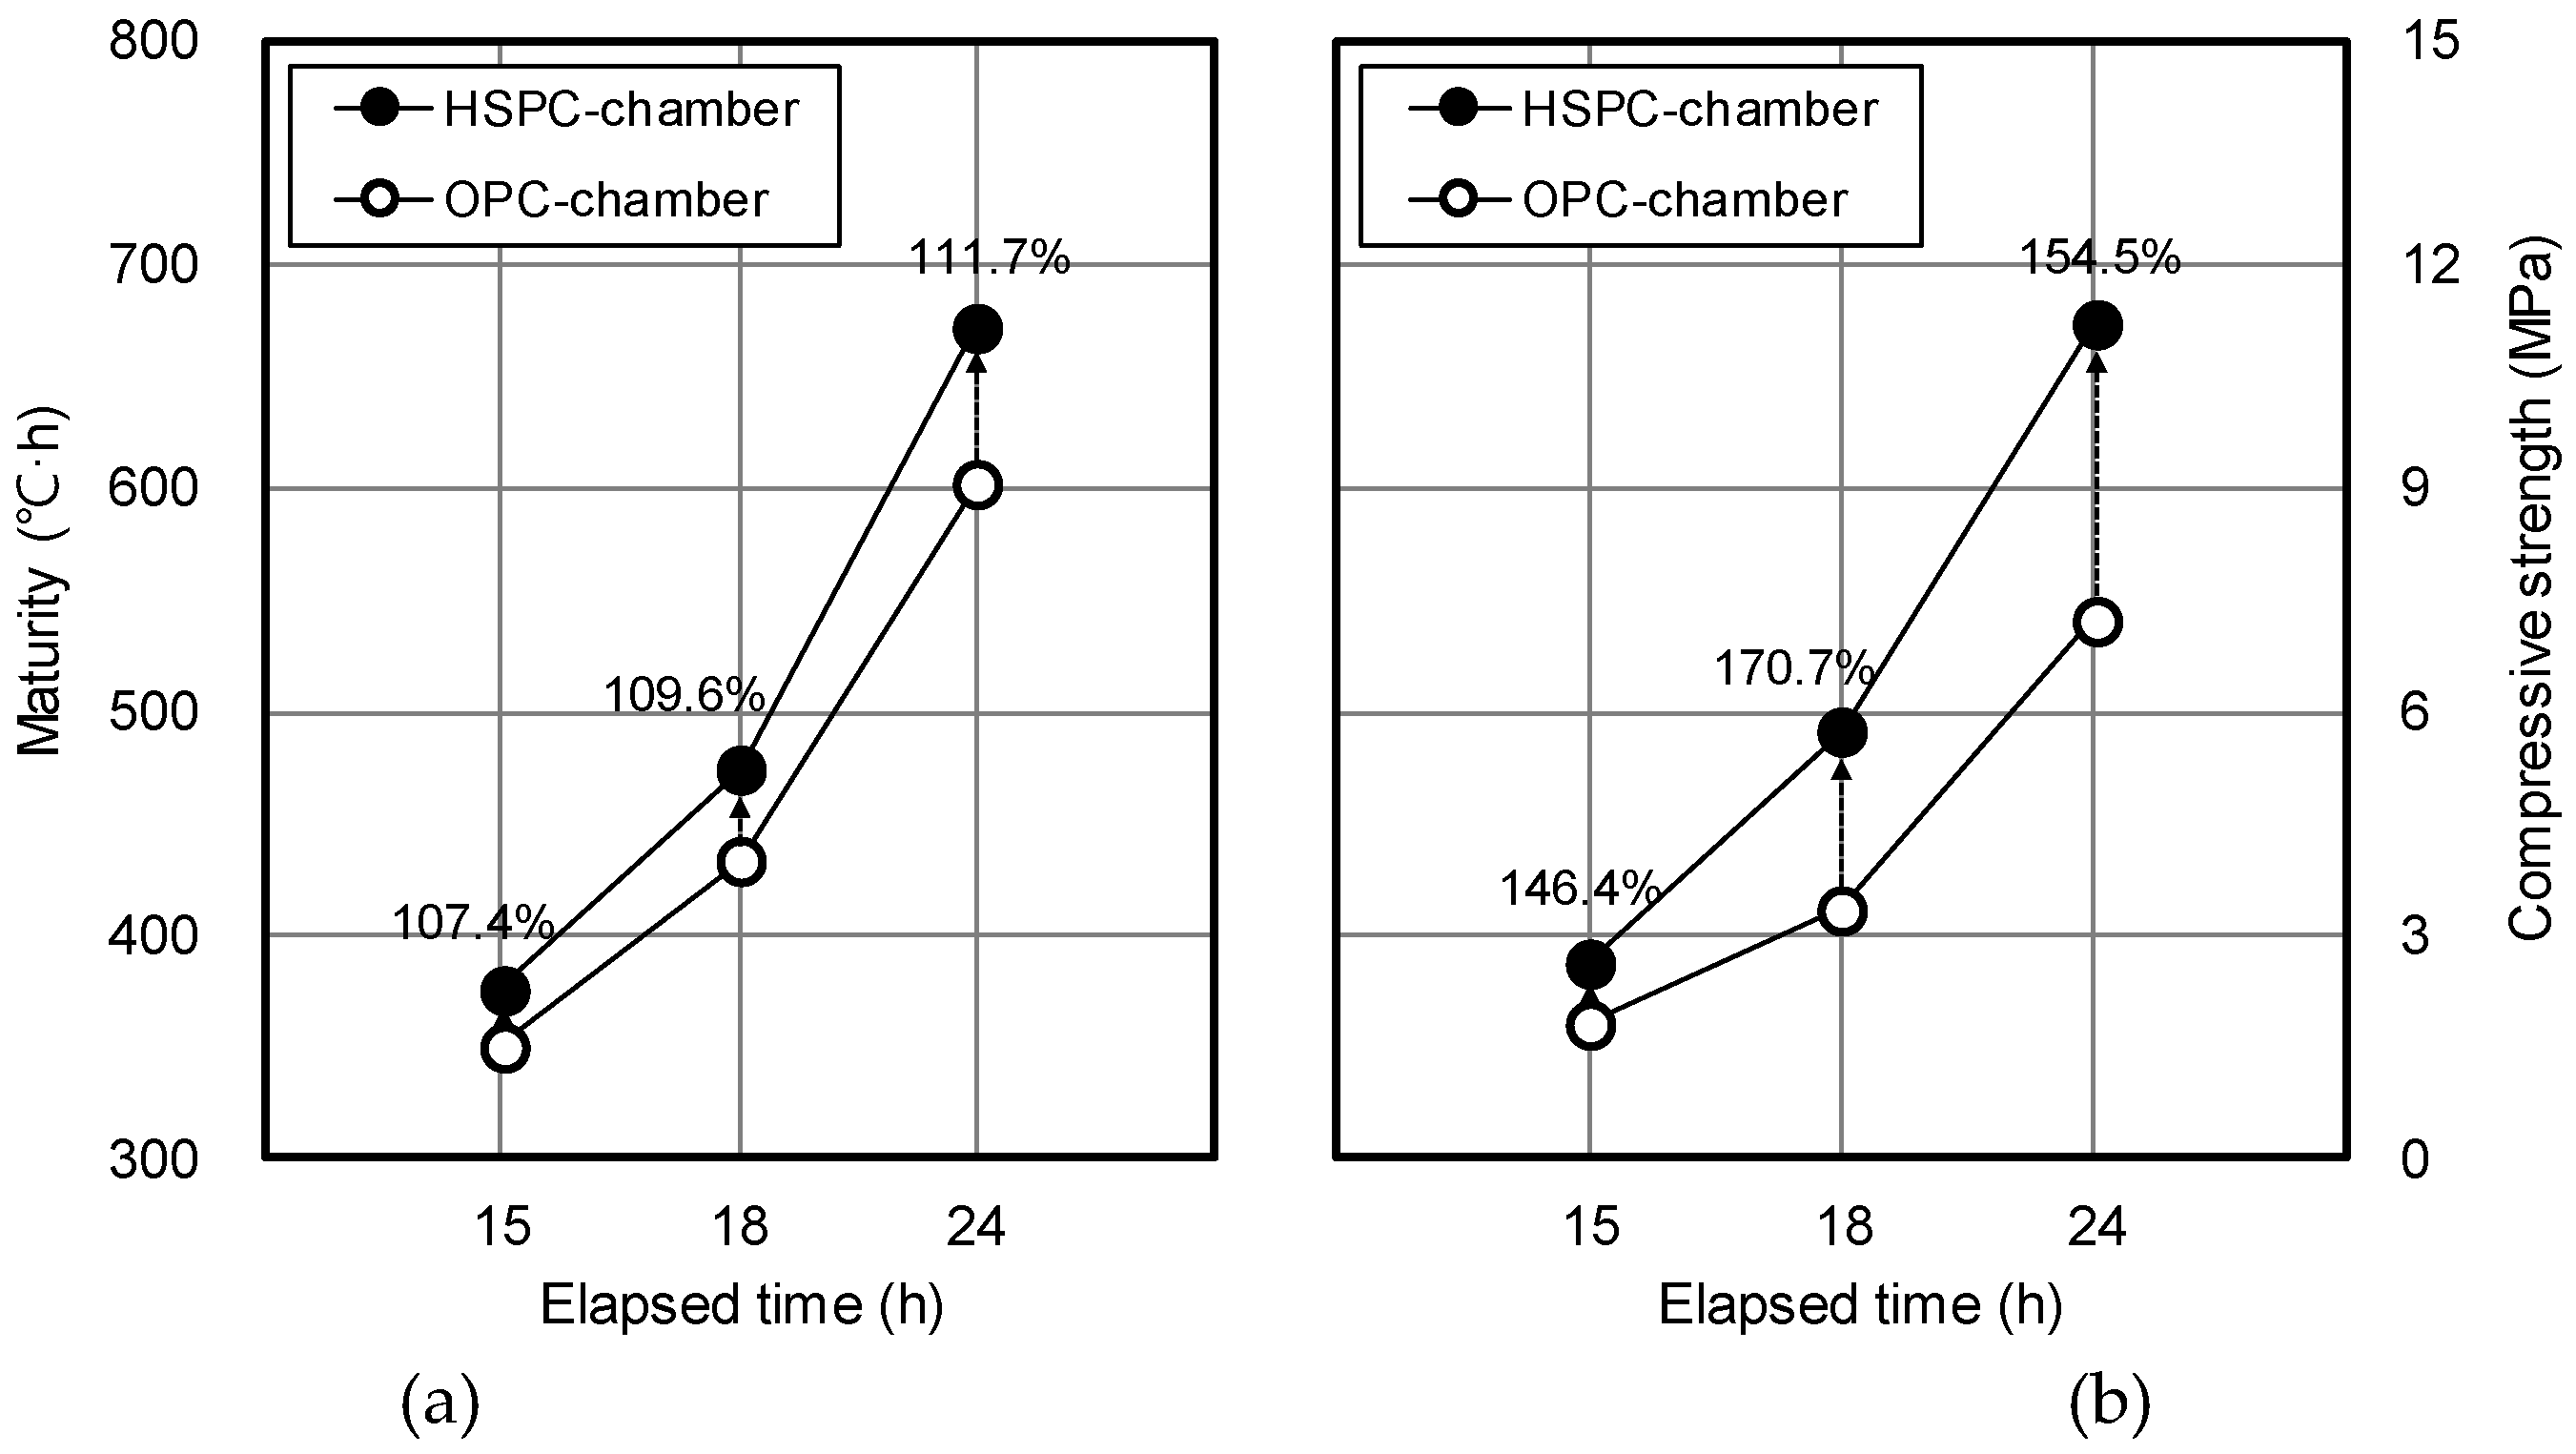
Figure 13 compares the maturity and early strength of OPC and HSPC concrete. At elapsed times of 15 h, 18 h, and 24 h, the maturity of HSPC concrete was 107.4%, 109.6%, and 111.7% higher than that of OPC concrete, and the early compressive strength was 146.4%, 170.7%, and 154.5% higher. The differences in HSPC over OPC were, firstly, higher fineness (111.8%), leading to early activation of the hydration reaction; secondly, higher SO3 content (107.9%) as measured by X-ray fluorescence analysis (Figure 14); thirdly, CaO/SO3 was low, and SO3/Al2O3 and hydraulic modulus were high (Figure 10 and Figure 11). As a result, the heat of hydration and maturity of HSPC concrete were higher than those of OPC under the same mixing and curing conditions (Figure 12), leading to higher early compressive strength.
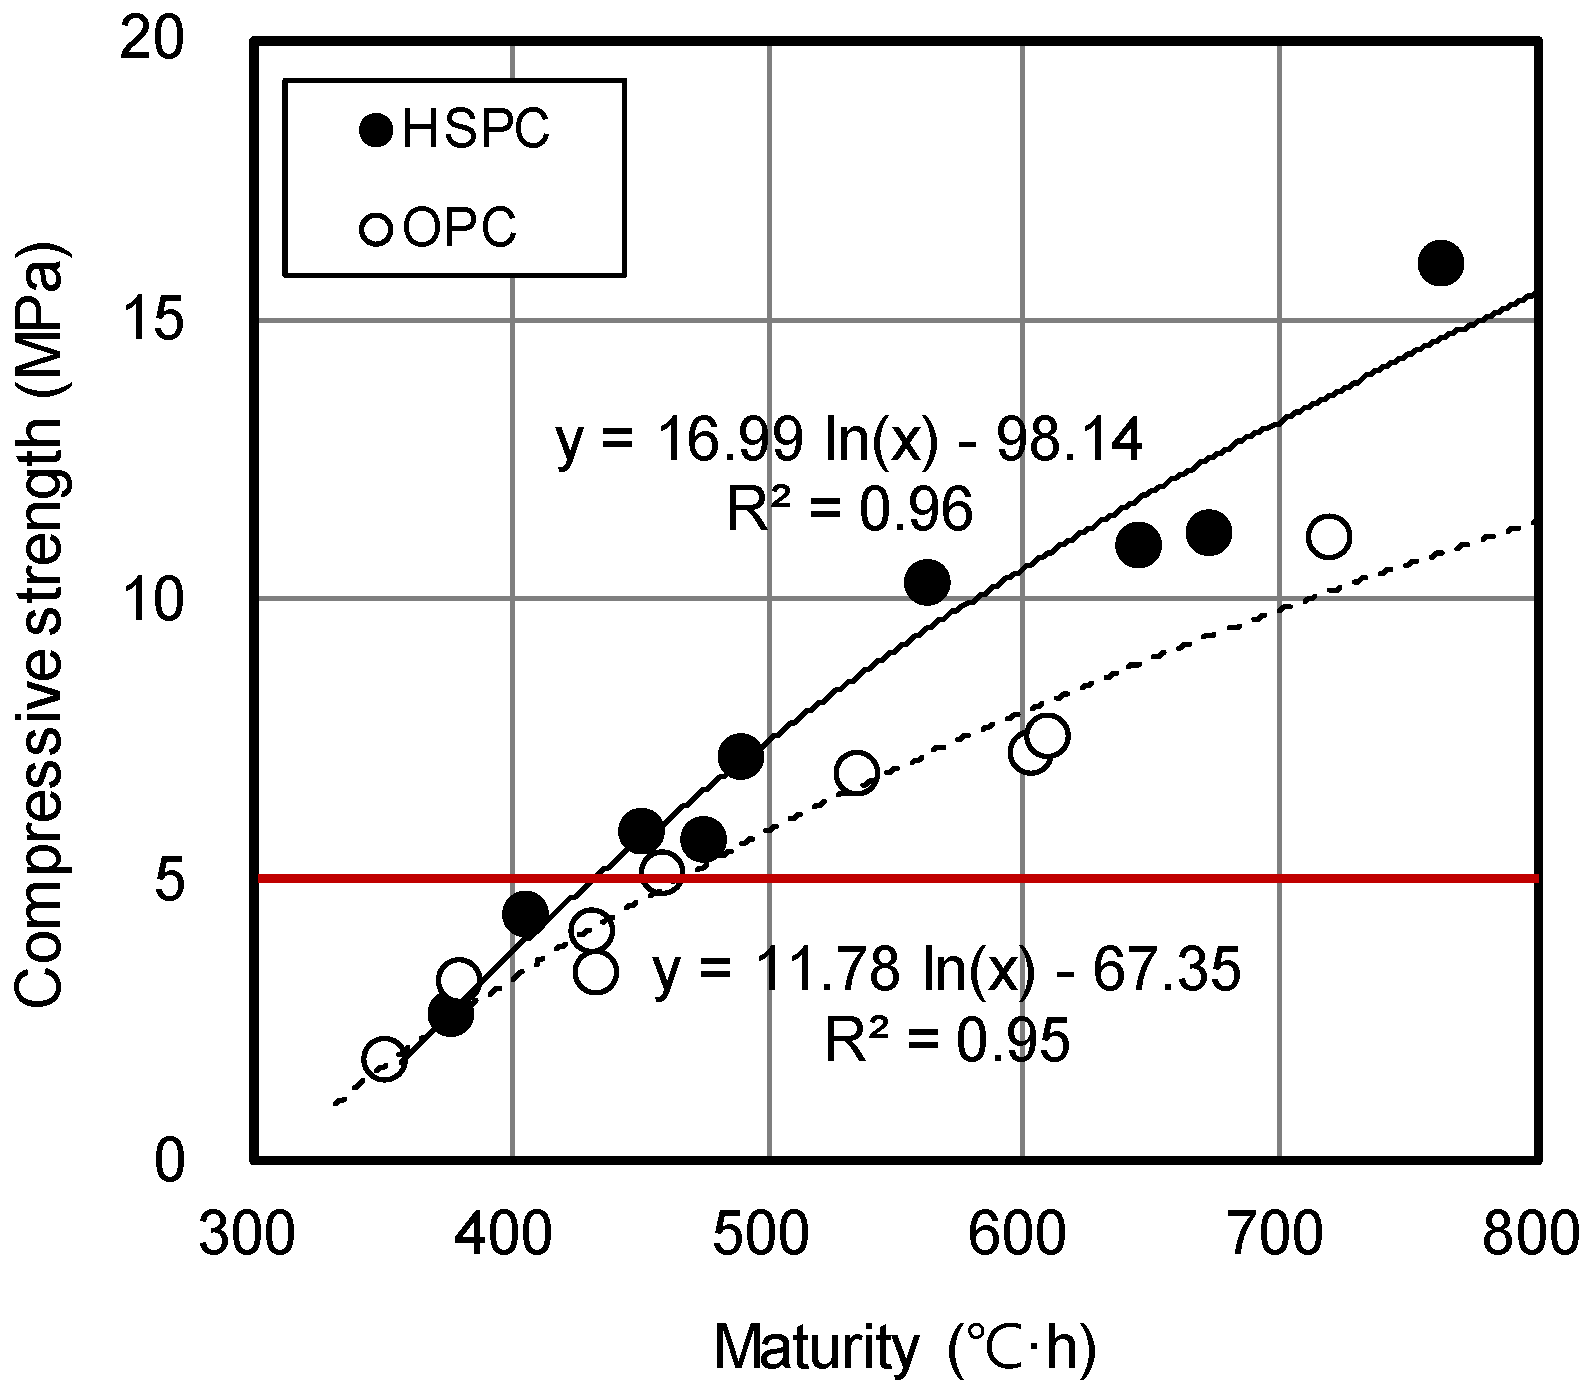
Figure 15 shows the strength enhancement curves for OPC and HSPC concrete, derived by applying the functional formula proposed by Plowman (Equation (6)). The strength enhancement curves for OPC and HSPC are modeled as y = 11.78 ln(x) − 67.35 and y = 16.99 ln(x) − 98.14, respectively, with high correlations of 95% and 96%. At the maturity of 400–800 °C·h, the slope of the HSPC concrete strength enhancement curve was 144.2% that of OPC concrete. The most important element for reducing the number of cycles per floor for a typical apartment construction site is the time required to reach a compressive strength of 5 MPa, at which point form removal is possible [50]. OPC concrete reached 5 MPa at 465 °C·h, and HSPC concrete reached 5 MPa at 433 °C·h maturity; therefore, the application of HSPC to actual construction sites could enable form removal at approximately 6.9% lower maturity than OPC.
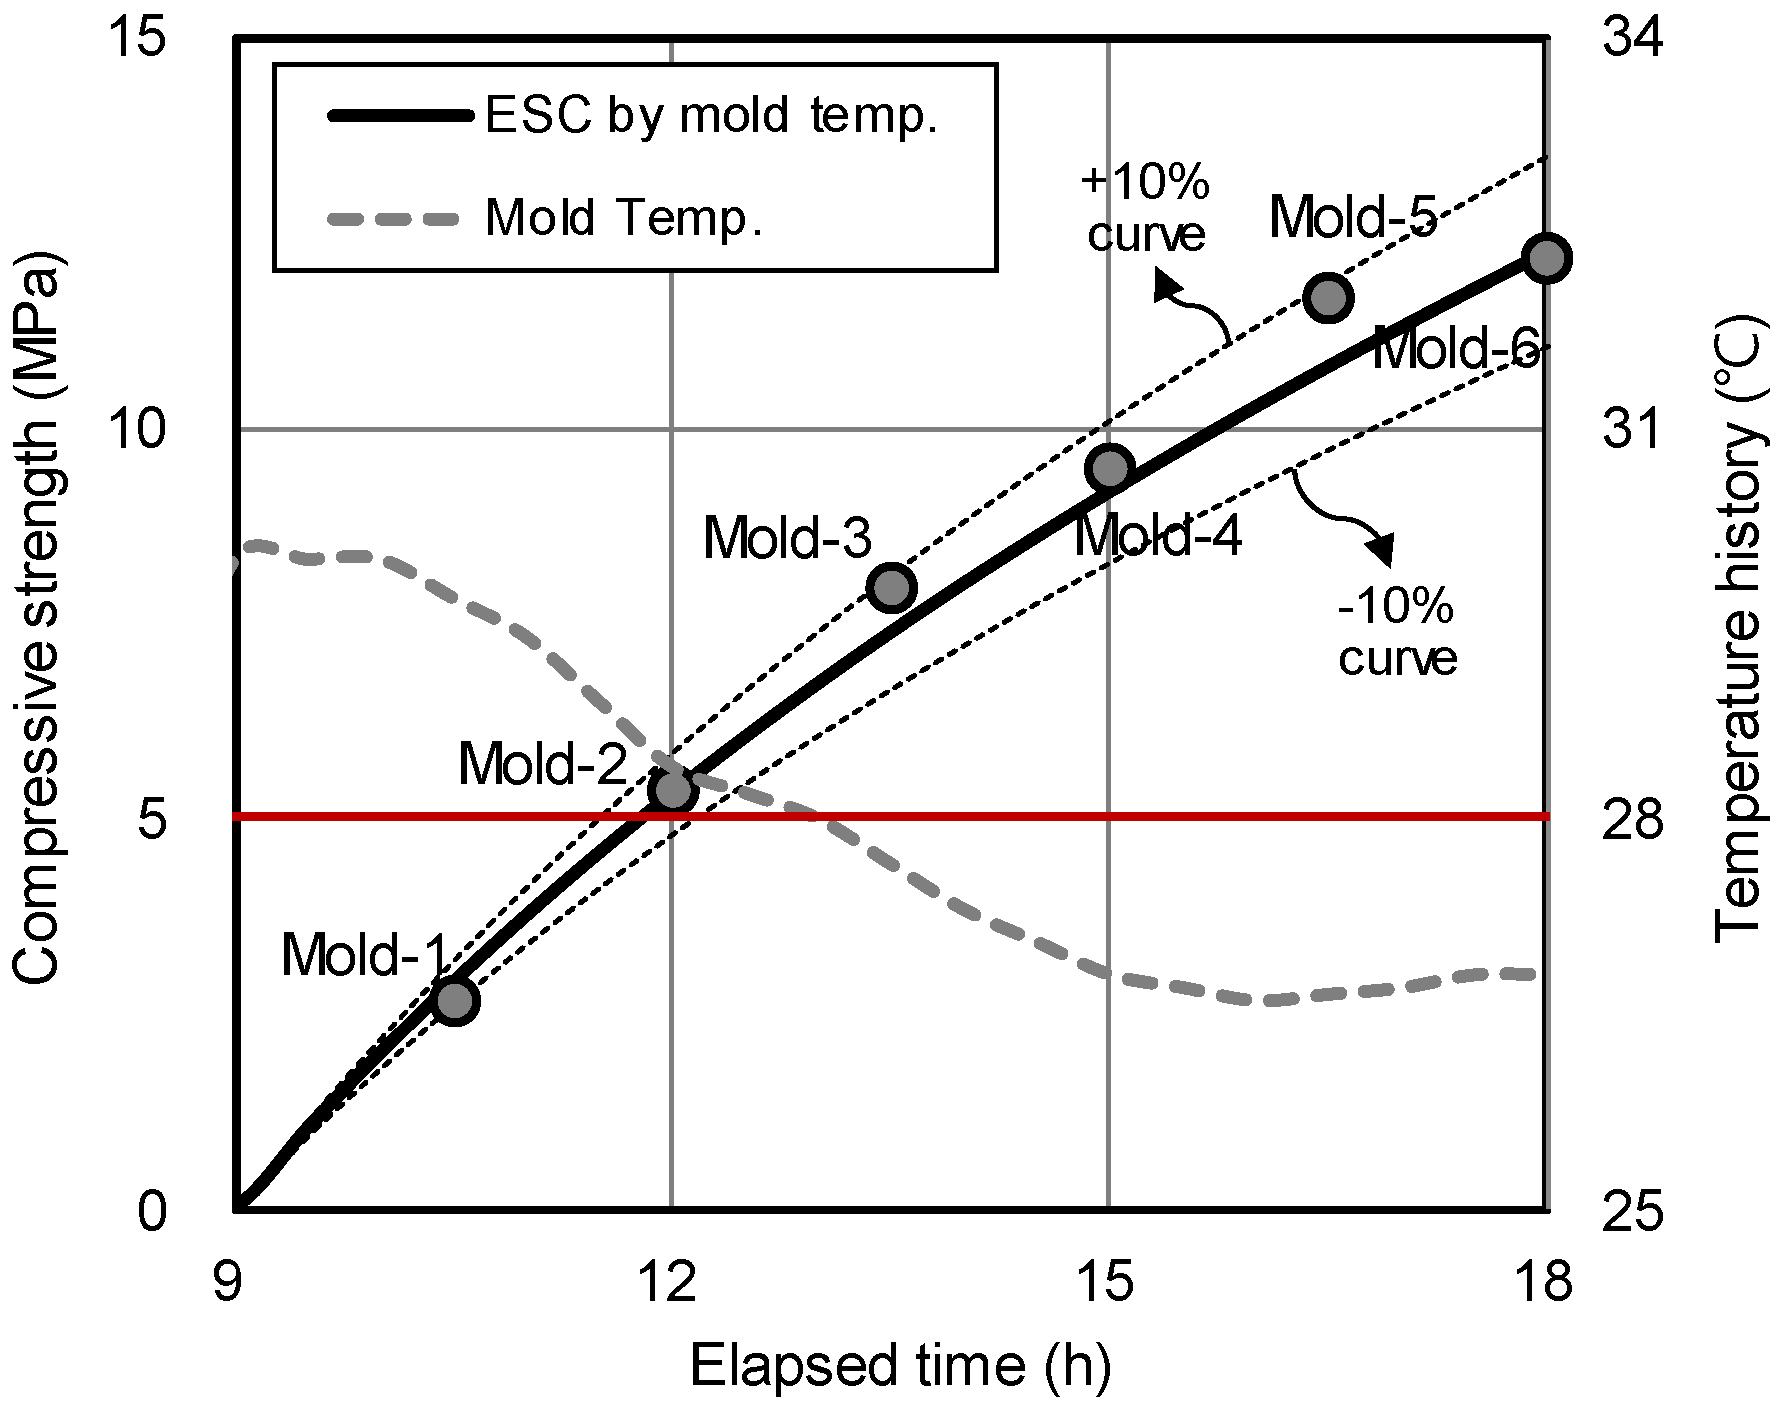
Figure 16 compares the estimated strength curve (ESC) for HSPC concrete, based on the temperature history curve of the field molds, with the measured compressive strength of the field molds. The actual compressive strengths of all six field molds of HSPC were within ±10% of the ESC. Therefore, the reliability of the ESC for HSPC concrete was assumed to be 90% or higher.
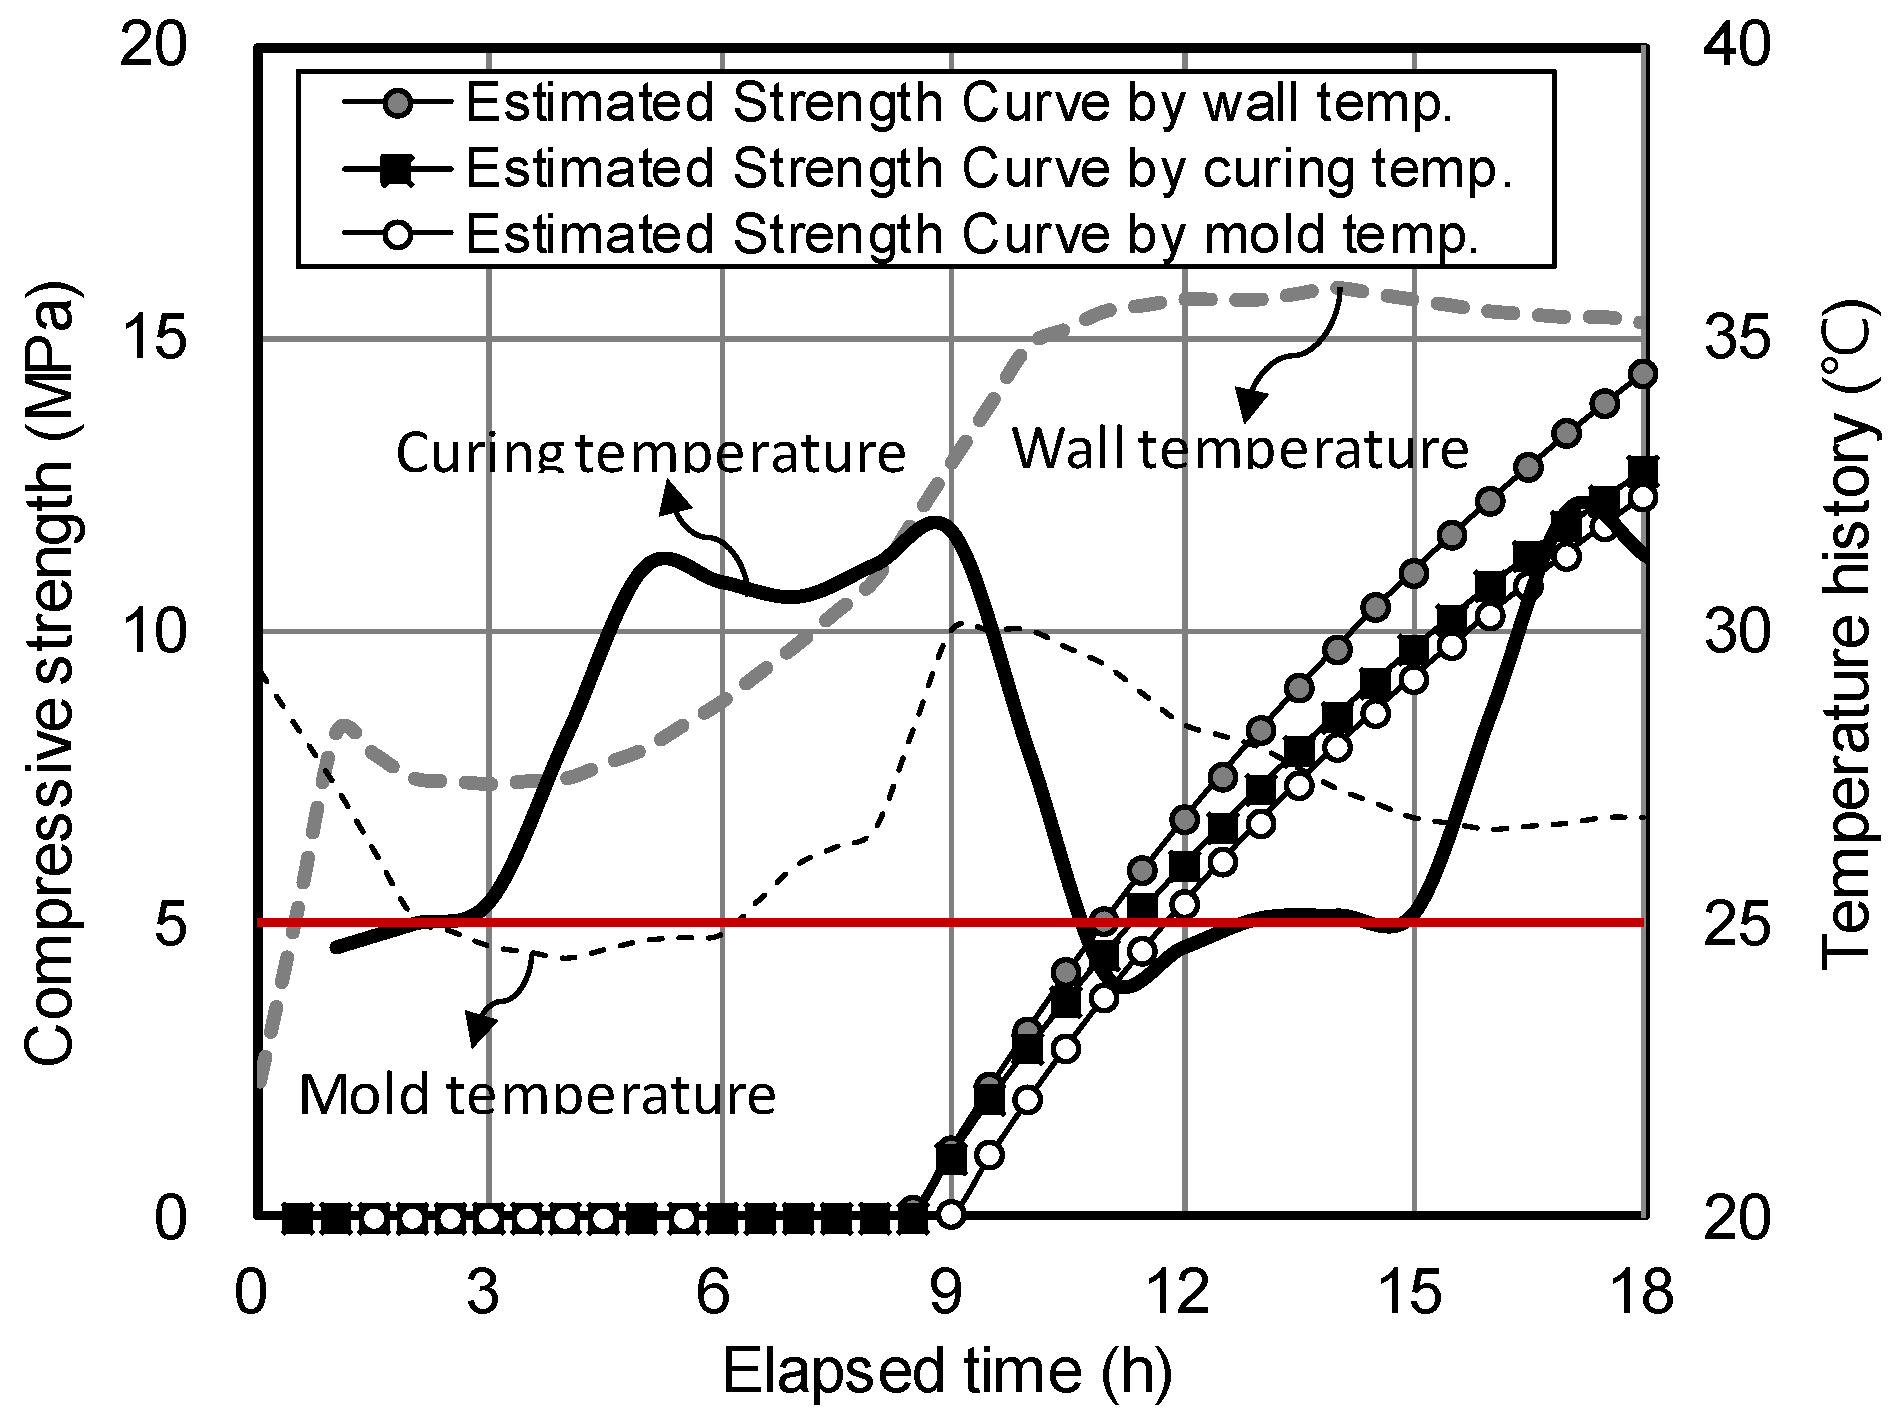
Figure 17 shows the ESC for the HSPC concrete samples according to the temperatures of the mold, curing air, and structure wall (200 mm thick). For a curing time of 9–18 h, the average maturity values of the field mold, curing air, and structure wall were 496 °C·h (96.6%), 514 °C·h (100%), and 550 °C·h (107%), indicating that curing in the structure wall resulted in approximately 10.8% higher hydration heat than the mold. Therefore, a safety factor of approximately 10.8% could be assumed if vertical form removal is performed at a time based on the attainment of 5 MPa compressive strength in the mold. The compressive strengths of the field mold, curing air, and structure wall reached 5 MPa after 11.8 h, 11.3 h, and 11 h, indicating that the applicable time of form removal for the structure wall was approximately 48 min earlier than that of the mold (i.e., without the 10.8% safety factor).
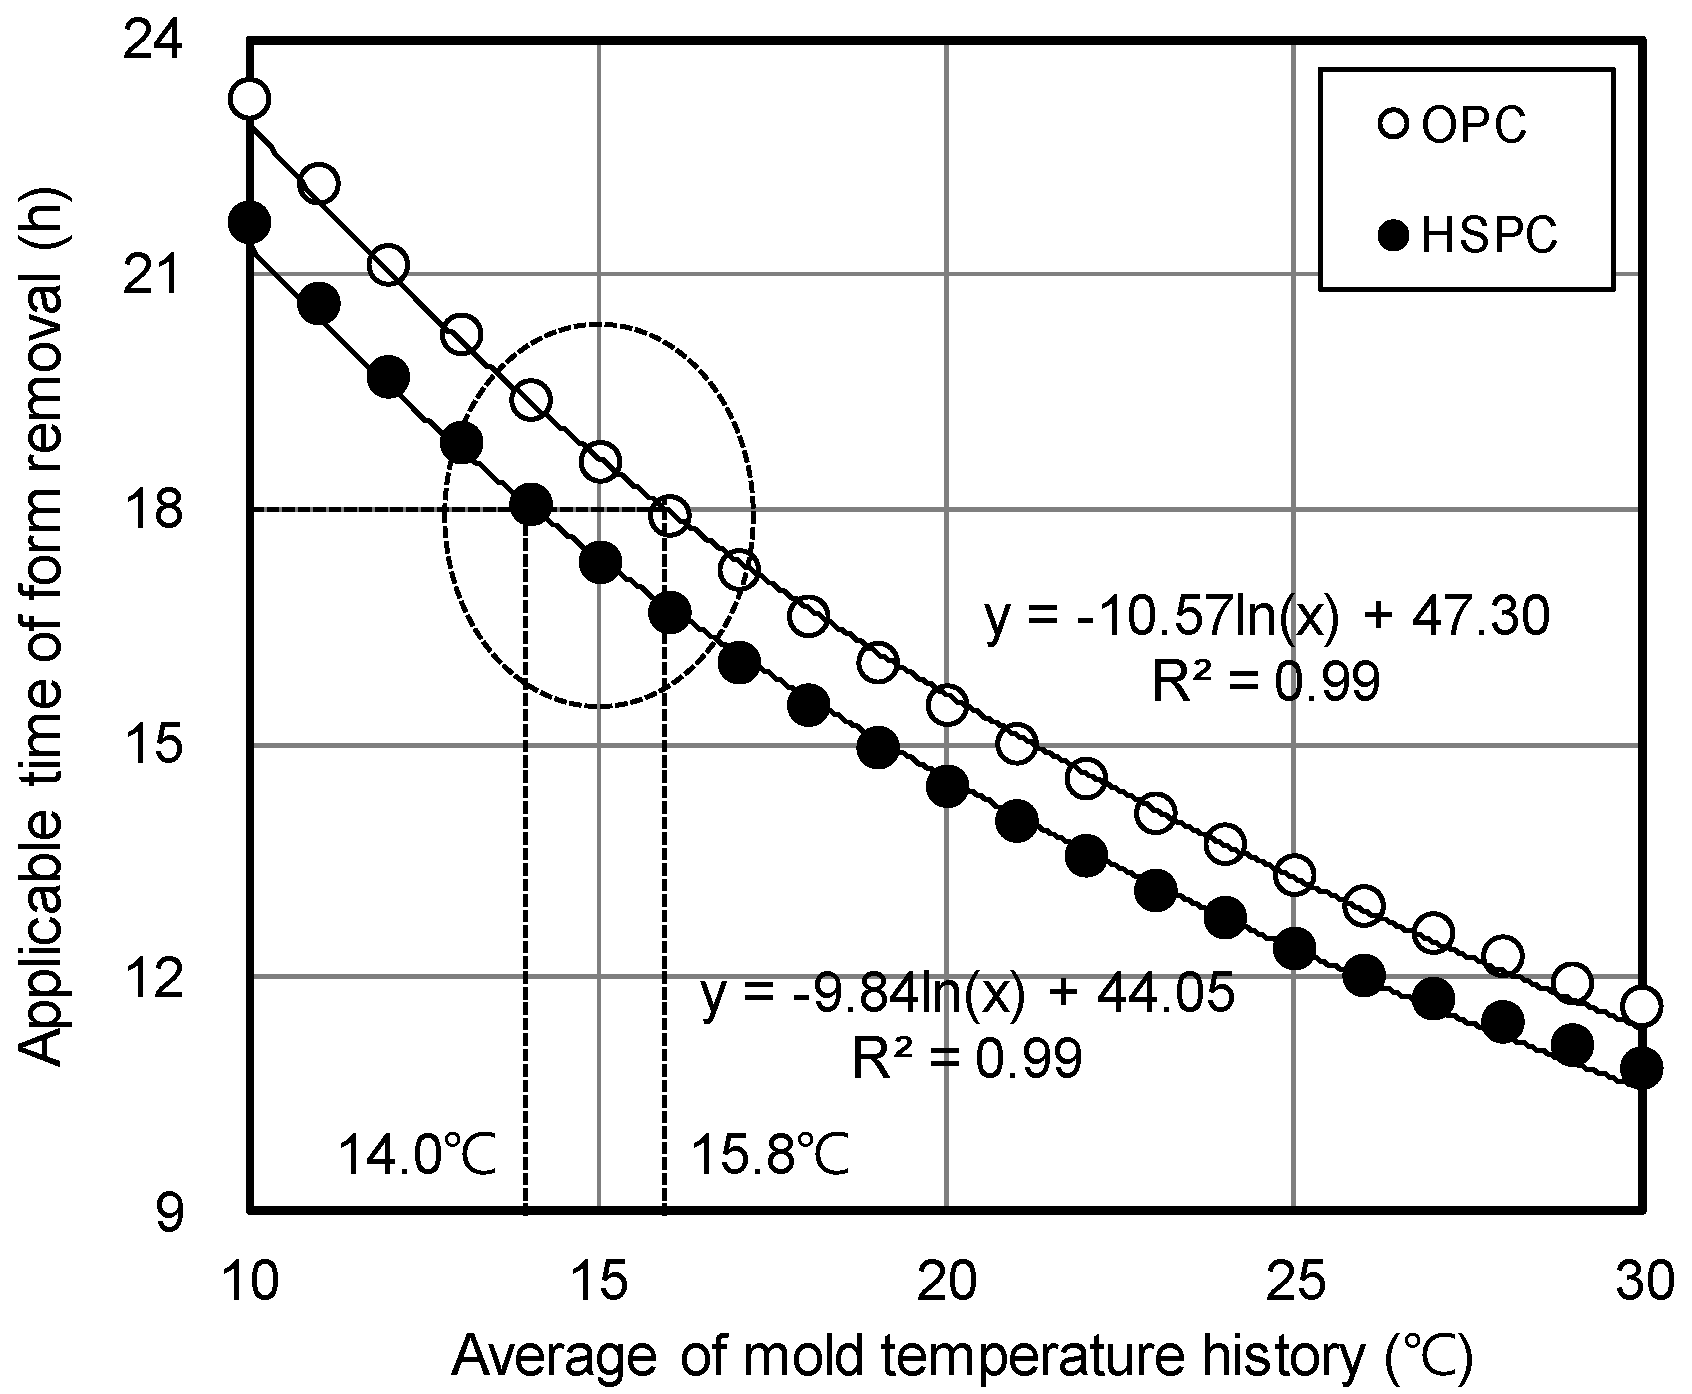
Figure 18 shows the estimated applicable time of form removal according to the average temperature history of the concrete. Relationships of y = −10.57 ln(x) + 47.30 and y = −9.84 ln(x) + 44.05 were estimated for OPC and HSPC, respectively, with high correlations of 99.4% calculated for both. ACI 347R Guide to Formwork for Concrete [51] requires that the wall vertical formwork be retained for 12 h under conditions where the temperature of the air surrounding the concrete is above 50 °F (10 °C). However, in the case of domestic construction sites, the wall vertical formwork is often removed at 8 am the day after the ready-mixed concrete is poured, which is normally completed by 2 pm. Therefore, this study assumed that the target vertical form removal time was 18 h after concrete pouring. This required an average curing temperature greater than 15.8 °C for OPC and 14 °C for HSPC. Therefore, the strength required for form removal could be achieved at a 1.8 °C lower curing temperature by employing HSPC concrete. As the curing temperature might be reduced during construction in winter, this would enable a reduction of heat curing costs.
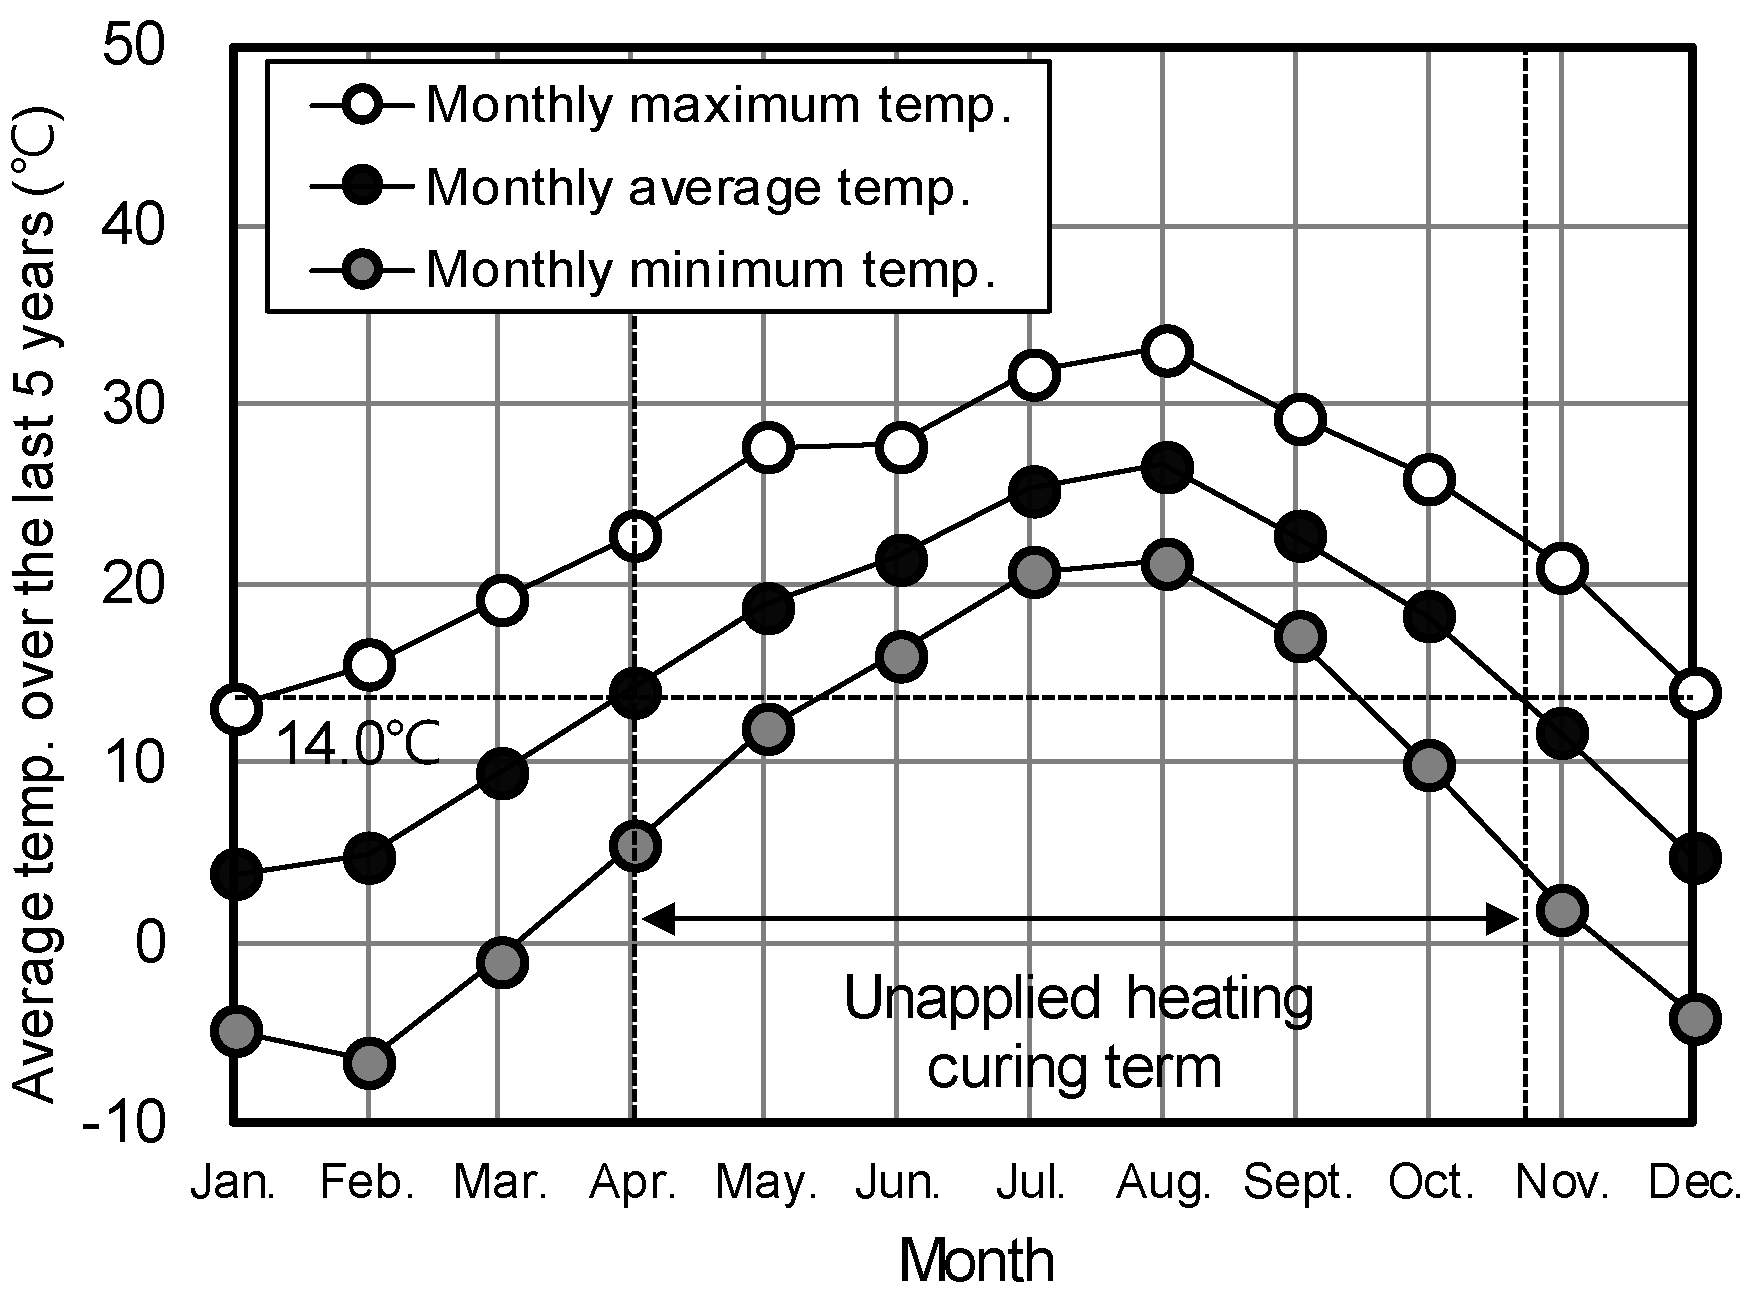
Figure 19 illustrates the length of time for which heat curing would not be required to ensure the strength needed for form removal (5 MPa) within 18 h after concrete pouring by applying HSPC. This length of time was calculated by analyzing the monthly average temperatures of Busan in Korea for the last five years. Busan is a metropolitan city in the south of Korea and has a project that will actually apply HSPC. It was found that heat curing would not be necessary from early April to the end of October (approximately 6.8 months) when using HSPC; however, measures, such as heat curing, would be required for the remaining 5.2 months to ensure an average curing temperature of 14 °C or higher.
4. Conclusions
In this study, the influences of chemical composition and fineness on the development of concrete strength by curing conditions were investigated through the performance evaluation of HSPC and OPC. The early compressive strength of HSPC was predicted, and its application to actual construction sites was examined. The main conclusions are as follows.
- (1)
- According to the Series I (mortar) test, increasing the fineness of OPC resulted in faster setting time and early compressive strength. At the same fineness (3800 cm2/g), the initial and final setting times of HSPC were 92 and 98 min less than OPC, and the early compressive strength was approximately 176% higher after 24 h curing.
- (2)
- HSPC CaO/SO3 molar ratio was lower (93.7%), SO3/Al2O3 was higher (116.1%), and the hydraulic modulus was 104.4% higher than OPC.
- (3)
- According to the Series II (concrete) test, the maturity at elapsed time 24 h was HSPC > Air > OPC, regardless of the curing method. At elapsed times of 15 h, 18 h, and 24 h, the maturity of HSPC concrete was 107.4%, 109.6%, and 111.7% higher than OPC concrete, and the early compressive strengths were 146.4%, 170.7%, and 154.5% higher.
- (4)
- The reasons for the improvement were that the fineness of HSPC was approximately 111.8% (400 cm2/g increase) greater than OPC, leading to early activation of the hydration reaction, and by the results of X-ray fluorescence analysis, HSPC had 107.9% higher SO3 content. The heat of hydration and maturity of HSPC were higher than that of OPC under the same mixing and curing conditions.
- (5)
- The applicable time of form removal was estimated according to the average temperature history of the field molds. Relationships of y = −10.57 ln(x) + 47.30 and y = −9.84 ln(x) + 44.05 were estimated for OPC and HSPC concrete, respectively. The average curing temperature must be 15.8 °C or higher for OPC and 14 °C or higher for HSPC to ensure 5 MPa within 18 h after concrete pouring.
Based on the monthly average temperatures in Busan, Korea, for the last five years, heat curing would not be required from early April to the end of October (approximately 6.8 months). During the remaining months, measures, such as heat curing, would be required to maintain average curing temperatures of 14 °C or higher for HSPC.
In future studies, the performance impact of HSPC according to mineralogical composition would be investigated, and the effects of the construction period and cost reduction effects would be examined when HSPC is applied to actual construction sites.
Author Contributions
Conceptualization, J.L. and T.L.; investigation, J.L. and T.L.; resources, J.L.; writing—original-draft, J.L.; writing—review and editing, J.L. and T.L.
Funding
This research received no external funding.
Conflicts of Interest
The authors declare no conflict of interest.
References
- Amudhavalli, N.K.; Mathew, J. Effect of silica fume on strength and durability parameters of concrete. Int. J. Eng. Sci. Emerg. Technol. 2012, 3, 28–35. [Google Scholar]
- Golewski, G.L. The influence of microcrack width on the mechanical parameters in concrete with the addition of fly ash: Consideration of technological and ecological benefits. Constr. Build. Mater. 2019, 197, 849–861. [Google Scholar] [CrossRef]
- Laplante, P.; Roussel, S.; Lecrux, S. Technique maturométrique: La loi d’Arrhenius au service des chantiers. In International RILEM Conference on Concrete: From Material to Structure; RILEM Publications SARL: Bagneux, France, 1996; pp. 323–342. [Google Scholar]
- Kang, S.H.; Lee, J.H.; Hong, S.G.; Moon, J. Microstructural investigation of heat-treated ultra-high performance concrete for optimum production. Materials 2017, 10, 1106. [Google Scholar] [CrossRef] [PubMed] [Green Version]
- Yikici, T.A.; Chen, H.L.R. Use of maturity method to estimate compressive strength of mass concrete. Constr. Build. Mater. 2015, 95, 802–812. [Google Scholar] [CrossRef]
- Li, X.F.; Fu, Z.; Luo, Z.; Li, S. Concrete strength estimation using the maturity method. In Advanced Materials Research; Trans Tech Publications: Zurich, Switzerland, 2014; Volume 857, pp. 35–41. [Google Scholar]
- Kamkar, S.; Eren, Ö. Evaluation of maturity method for steel fiber reinforced concrete. KSCE J. Civ. Eng. 2018, 22, 213–221. [Google Scholar] [CrossRef]
- Galobardes, I.; Cavalaro, S.H.; Goodier, C.I.; Austin, S.; Rueda, Á. Maturity method to predict the evolution of the properties of sprayed concrete. Constr. Build. Mater. 2015, 79, 357–369. [Google Scholar] [CrossRef] [Green Version]
- Xu, G.; Tian, Q.; Miao, J.; Liu, J. Early-age hydration and mechanical properties of high volume slag and fly ash concrete at different curing temperatures. Constr. Build. Mater. 2017, 149, 367–377. [Google Scholar] [CrossRef]
- Carette, J.; Staquet, S. Monitoring and modelling the early age and hardening behaviour of eco-concrete through continuous non-destructive measurements: Part II. Mechanical behaviour. Cem. Concr. Compos. 2016, 73, 1–9. [Google Scholar] [CrossRef]
- Akasaki, J.; Moraes, M.; Silva, C.; Fioriti, C.; Tashima, M. Assessment the maturity concept in concrete with the addition of rice husk ash. Revista Ingeniería de Construcción 2016, 31, 175–182. [Google Scholar] [CrossRef] [Green Version]
- Zhang, Y.M.; Napier-Munn, T.J. Effects of particle size distribution, surface area and chemical composition on Portland cement strength. Powder Technol. 1995, 83, 245–252. [Google Scholar] [CrossRef]
- Tiecher, F.; Gomes, M.; Dal Molin, D.; Hasparyk, N.; Monteiro, P. Relationship between degree of deformation in quartz and silica dissolution for the development of alkali-silica reaction in concrete. Materials 2017, 10, 1022. [Google Scholar] [CrossRef] [PubMed] [Green Version]
- Celik, I.B. The effects of particle size distribution and surface area upon cement strength development. Powder Technol. 2009, 188, 272–276. [Google Scholar] [CrossRef]
- Lee, J.H.; Lee, T.G. Effects of high CaO fly ash and sulfate activator as a finer binder for cementless grouting material. Materials 2019, 12, 3664. [Google Scholar] [CrossRef] [Green Version]
- Mindess, S.; Young, J.F.; Darwin, D. Concrete; Prentice-Hall: Englewood Cliffs, NJ, USA, 1981; p. 481. [Google Scholar]
- Szeląg, M. Properties of cracking patterns of multi-walled carbon nanotube-reinforced cement matrix. Materials 2019, 12, 2942. [Google Scholar] [CrossRef] [Green Version]
- Bentz, D.P.; Sant, G.; Weiss, J. Early-age properties of cement-based materials. I: Influence of cement fineness. J. Mater. Civ. Eng. 2008, 20, 502–508. [Google Scholar] [CrossRef] [Green Version]
- Zhang, Y.; Kong, X. Correlations of the dispersing capability of NSF and PCE types of superplasticizer and their impacts on cement hydration with the adsorption in fresh cement pastes. Cem. Concr. Res. 2015, 69, 1–9. [Google Scholar] [CrossRef]
- Zhang, Y.R.; Kong, X.M.; Lu, Z.B.; Lu, Z.C.; Hou, S.S. Effects of the charge characteristics of polycarboxylate superplasticizers on the adsorption and the retardation in cement pastes. Cem. Concr. Res. 2015, 67, 184–196. [Google Scholar] [CrossRef]
- Tan, H.; Zou, F.; Ma, B.; Liu, M.; Li, X.; Jian, S. Effect of sodium tripolyphosphate on adsorbing behavior of polycarboxylate superplasticizer. Constr. Build. Mater. 2016, 126, 617–623. [Google Scholar] [CrossRef]
- Tan, H.; Ma, B.; Li, X.; Jian, S.; Yang, H. Effect of competitive adsorption between sodium tripolyphosphate and naphthalene superplasticizer on fluidity of cement paste. J. Wuhan Univ. Technol. Mater. Sci. Ed. 2014, 29, 334–340. [Google Scholar] [CrossRef]
- Škvára, F.; Kolář, K.; Novotný, J.; Zadák, Z. The effect of cement particle size distribution upon properties of pastes and mortars with low water-to-cement ratio. Cem. Concr. Res. 1981, 11, 247–255. [Google Scholar] [CrossRef]
- Sabir, B.B.; Wild, S.; Bai, J. Metakaolin and calcined clays as pozzolans for concrete: A review. Cem. Concr. Compos. 2001, 23, 441–454. [Google Scholar] [CrossRef]
- Lee, B.K.; Kim, G.Y.; Nam, J.S.; Lee, K.H.; Kim, G.T.; Lee, S.K.; Shin, K.S.; Koyama, T. Influence of α-calcium sulfate hemihydrate on setting, compressive strength, and shrinkage strain of cement mortar. Materials 2019, 12, 163. [Google Scholar] [CrossRef] [PubMed] [Green Version]
- Soroka, I.; Abayneh, M. Effect of gypsum on properties and internal structure of PC paste. Cem. Constr. Res. 1986, 16, 495–504. [Google Scholar] [CrossRef]
- Kim, J.H.; Lee, H.S. Improvement of early strength of cement mortar containing granulated blast furnace slag using industrial byproducts. Materials 2017, 10, 1050. [Google Scholar] [CrossRef] [Green Version]
- Mardani-Aghabaglou, A.; Boyaci, O.C.; Hosseinnezhad, H.; Felekog˘lu, B.; Ramyar, K. Effect of gypsum type on properties of cementitious materials containing high range water reducing admixture. Cem. Concr. Compos. 2016, 68, 15–26. [Google Scholar] [CrossRef]
- European Committee for Standardization. EN 197-1 Cement—Part 1: Composition, Specifications and Conformity Criteria for Common Cements; CEN/TC 51: Brussels, Belgium, 2000. [Google Scholar]
- Liu, F.; Lan, M.Z. Effects of gypsum on cementitious systems with different mineral mixtures. Key Eng. Mater. 2012, 509, 20–25. [Google Scholar] [CrossRef]
- Lee, J.H.; Kim, G.Y.; Kim, Y.R.; Mun, K.J.; Nam, J.S. Engineering properties and optimal conditions of cementless grouting materials. Materials 2019, 12, 3059. [Google Scholar] [CrossRef] [Green Version]
- Kurdowski, W. Chapter 4: Cement Hydration. In Cement and Concrete Chemistry; Springer Science & Business: New York, NY, USA, 2014; pp. 205–277. [Google Scholar]
- Mohammed, S.; Safiullah, O. Optimization of the SO3 content of an Algerian Portland cement: Study on the effect of various amounts of gypsum on cement properties. Constr. Build Mater. 2018, 164, 362–370. [Google Scholar] [CrossRef]
- Korean Industrial Standards. Portland Cement. KS L 5201; Korean Agency for Technology and Standards: Seoul, Korea, 2016. [Google Scholar]
- American Society for Testing and Materials. ASTM C778 Standard Specification for Standard Sand; ASTM: West Conshohocken, PA, USA, 2017. [Google Scholar]
- American Society for Testing and Materials. ASTM C1437 Standard Test Method for Flow of Hydraulic Cement Mortar; ASTM: West Conshohocken, PA, USA, 2015. [Google Scholar]
- American Society for Testing and Materials. ASTM C403/C403M Standard Test Method for Time of Setting of Concrete Mixtures by Penetration Resistance; ASTM: West Conshohocken, PA, USA, 2016. [Google Scholar]
- American Society for Testing and Materials. ASTM C109/C109M Standard Test Method for Compressive Strength of Hydraulic Cement Mortars; ASTM: West Conshohocken, PA, USA, 2017. [Google Scholar]
- American Society for Testing and Materials. ASTM C143/C143M Standard Test Method for Slump of Hydraulic-Cement Concrete; ASTM: West Conshohocken, PA, USA, 2015. [Google Scholar]
- American Society for Testing and Materials. ASTM C231/C231M Standard Test Method for Air Content of Freshly Mixed Concrete by the Pressure Method; ASTM: West Conshohocken, PA, USA, 2017. [Google Scholar]
- American Society for Testing and Materials. ASTM C39/C39M Standard Test Method for Compressive Strength of Cylindrical Concrete Specimens; ASTM: West Conshohocken, PA, USA, 2018. [Google Scholar]
- American Society for Testing and Materials. ASTM C873/C873M Standard Test Method for Compressive Strength of Concrete Cylinders Cast in Place in Cylindrical Molds; ASTM: West Conshohocken, PA, USA, 2015. [Google Scholar]
- American Society for Testing and Materials. ASTM C1074 Standard Practice for Estimating Concrete Strength by the Maturity Method; ASTM: West Conshohocken, PA, USA, 2019. [Google Scholar]
- Carino, N.J.; Lew, H.S. Maturity method: From theory to application. In Reprinted from the Proceedings of the 2001 Structures Congress & Exposition, Washington, DC, USA, 21–23 May 2001; Peter, C., Ed.; American Society of Civil Engineers: Reston, VA, USA, 2001. [Google Scholar]
- Soutsos, M.N.; Turu’allo, G.; Owens, K.; Kwasny, J.; Barnett, S.J.; Basheer, P.A.M. Maturity testing of lightweight self-compacting and vibrated concretes. Constr. Build. Mater. 2013, 47, 118–125. [Google Scholar] [CrossRef] [Green Version]
- Saul, A.G.A. Principles underlying the steam curing of concrete at atmospheric pressure. Mag. Concr. Res. 1951, 2, 127–140. [Google Scholar] [CrossRef]
- Bergström, S.G. Curing temperature, age and strength of concrete. Mag. Concr. Res. 1953, 5, 61–66. [Google Scholar] [CrossRef]
- Plowman, J. Maturity and the strength of concrete. Mag. Concr. Res. 1956, 8, 13–22. [Google Scholar] [CrossRef]
- Jin, N.J.; Seung, I.; Choi, Y.S.; Yeon, J. Prediction of early-age compressive strength of epoxy resin concrete using the maturity method. Constr. Build. Mater. 2017, 152, 990–998. [Google Scholar] [CrossRef]
- Korean Construction Specification. Formwork and Construction Work General. KCS 21 50 05; Korean Construction Standards Center: Seoul, Korea, 2018. [Google Scholar]
- American Concrete Institute Committee 347. ACI347-04 Guide to Formwork for Concrete; ACI: Farmington Hills, MI, USA, 2004. [Google Scholar]
Figure 1.
Preliminary test results of the compressive strength of fine cement according to binder weight and curing temperature.
Figure 1.
Preliminary test results of the compressive strength of fine cement according to binder weight and curing temperature.

Figure 2.
The particle size distribution of OPC (ordinary Portland cement) and HSPC (high SO3 Portland cement).
Figure 2.
The particle size distribution of OPC (ordinary Portland cement) and HSPC (high SO3 Portland cement).

Figure 3.
Scanning electron microscope micrograph: (a) OPC; (b) HSPC.

Figure 4.
X-ray diffraction patterns of OPC and HSPC.

Figure 5.
Particle distribution curves of aggregates used: (a) Coarse aggregates; (b) Fine aggregates.
Figure 5.
Particle distribution curves of aggregates used: (a) Coarse aggregates; (b) Fine aggregates.

Figure 6.
Photographs of the concrete curing test methods: (a) Indoor and sealed curing; (b) Chamber curing; (c) Mold temperature measurement; (d) Wall temperature measurement.
Figure 6.
Photographs of the concrete curing test methods: (a) Indoor and sealed curing; (b) Chamber curing; (c) Mold temperature measurement; (d) Wall temperature measurement.

Figure 7.
Setting time of OPC by fineness.

Figure 8.
Early compressive strength of OPC and HSPC by elapsed time.

Figure 9.
Early compressive strength of OPC by fineness.

Figure 10.
CaO/SO3 and SO3/Al2O3 molar ratios in OPC and HSPC.

Figure 11.
CaO/SO3, SO3/Al2O3, and hydraulic modulus molar ratios in OPC and HSPC.

Figure 12.
Concrete curing temperature history and maturity for different curing methods: (a) Indoor curing method; (b) Sealed curing method; (c) Chamber curing method.
Figure 12.
Concrete curing temperature history and maturity for different curing methods: (a) Indoor curing method; (b) Sealed curing method; (c) Chamber curing method.


Figure 13.
Comparison of maturity and early strength of OPC and HSPC concrete: (a) Maturity; (b) Early compressive strength.
Figure 13.
Comparison of maturity and early strength of OPC and HSPC concrete: (a) Maturity; (b) Early compressive strength.

Figure 14.
X-ray fluorescence analysis results of OPC and HSPC.

Figure 15.
Derived strength enhancement curves of OPC and HSPC concrete.

Figure 16.
Comparison of the estimated strength curve (ESC) and measured compressive strength of the field mold of HSPC concrete.
Figure 16.
Comparison of the estimated strength curve (ESC) and measured compressive strength of the field mold of HSPC concrete.

Figure 17.
Estimated strength curve and temperature history for the structure wall, field mold, and curing air according to the curing elapsed time of HSPC concrete.
Figure 17.
Estimated strength curve and temperature history for the structure wall, field mold, and curing air according to the curing elapsed time of HSPC concrete.

Figure 18.
Applicable time of form removal according to the average temperature history of field mold.
Figure 18.
Applicable time of form removal according to the average temperature history of field mold.

Figure 19.
Months when heat curing would not be required in Busan due to using HSPC concrete.


Table 1.
Physical properties of the materials used in the tests. (OPC, ordinary Portland cement; HSPC, high SO3 Portland cement.).
Table 1.
Physical properties of the materials used in the tests. (OPC, ordinary Portland cement; HSPC, high SO3 Portland cement.).
| Materials | Physical Properties |
|---|---|
| OPC | Ordinary Portland cement (density: 3.15 g/cm3, fineness: 3400 cm2/g) |
| HSPC | High SO3 Portland cement (density: 3.13 g/cm3, fineness: 3800 cm2/g) |
| FA | Fly ash (density: 2.20 g/cm3, fineness: 3850 cm2/g) |
| Fine aggregate | Crushed sand 60% (density: 2.63 g/cm3, absorption: 1.30%) |
| Washed sea sand 40% (density: 2.60 g/cm3, absorption: 1.34%) | |
| Coarse aggregate | Crushed granitic aggregate (size: 25 mm, density: 2.65 g/cm3, absorption: 0.89%) |
| Admixture | Polycarboxylic superplasticizer-based type (density: 1.26 g/cm3) |
Table 2.
Chemical composition of binders used in the tests. (OPC, ordinary Portland cement; HSPC, high SO3 Portland cement.).
Table 2.
Chemical composition of binders used in the tests. (OPC, ordinary Portland cement; HSPC, high SO3 Portland cement.).
| Materials | Chemical Composition (%) | L.O.I. (1) | |||||||
|---|---|---|---|---|---|---|---|---|---|
| SiO2 | Al2O3 | Fe2O3 | CaO | MgO | SO3 | K2O | Other | ||
| OPC | 19.82 | 4.85 | 3.30 | 60.34 | 3.83 | 2.90 | 1.08 | 0.86 | 3.02 |
| HSPC | 19.22 | 4.51 | 3.35 | 61.00 | 4.14 | 3.13 | 1.04 | 0.79 | 2.82 |
(1) L.O.I.: Loss on ignition.
Table 3.
Experimental parameters for setting time and early compressive strength tests using ordinary Portland cement (OPC) and high SO3 Portland cement (HSPC).
Table 3.
Experimental parameters for setting time and early compressive strength tests using ordinary Portland cement (OPC) and high SO3 Portland cement (HSPC).
| Series | Type | Experimental Factors | Experimental Levels | Measured Parameters |
|---|---|---|---|---|
| I | Mortar | Cement fineness and type | 3000 cm2/g (OPC) | Setting time (h) Compressive strength (MPa) |
| 3400 cm2/g (OPC) | ||||
| 3800 cm2/g (OPC, HSPC) | ||||
| II | Concrete | Cement fineness and type | 3400 cm2/g (OPC) | Slump (mm) Air content (%) Compressive strength (MPa) Maturity (°C·h) |
| 3800 cm2/g (HSPC) | ||||
| Curing type | Chamber (15 °C) | |||
| Indoor (variable temperature) | ||||
| Sealed (variable temperature) |
Table 4.
Mixing proportions for mortar tests.
| Series | W/C (%) | C:S (1) | Cement (g) | Water (g) | AD (2) (B×%) | |
|---|---|---|---|---|---|---|
| I (Mortar) | OPC | 50 | 1:3 | 450 | 225 | 0.7 |
| HSPC | 50 | 1:3 | 450 | 225 | 0.7 | |
(1) C:S = Cement:sand (ISO standard sand); (2) AD: Admixture. W/C: water/cement.
Table 5.
Mixing proportions for concrete tests.
| Series | W/B (1) (%) | S/a (2) (%) | Unit Weight(kg/m3) | AD (8) (B×%) | ||||||||
|---|---|---|---|---|---|---|---|---|---|---|---|---|
| B (3) | W (4) | OPC | HSPC | FA | S1 (5) | S2 (6) | G (7) | |||||
| II (Concrete) | OPC | 50 | 49.2 | 330 | 165 | 300 | 0 | 30 | 541 | 361 | 932 | 0.8 |
| HSPC | 50 | 49.2 | 330 | 165 | 0 | 300 | 30 | 541 | 361 | 932 | 0.8 | |
(1) W/B: Water/Binder; (2) S/a: Sand/aggregates; (3) B: Binder; (4) W: Water; (5) S1: Crushed sand; (6) S2: Sea sand; (7) G: Gravel; (8) AD: Polycarboxylic superplasticizer-based type admixture.
Table 6.
Properties of fresh concrete.
| Series | Air (%) | Slump (mm) | |||
|---|---|---|---|---|---|
| Initial | 1 h | Initial | 1 h | ||
| II (Concrete) | OPC | 4.6 | 4.3 | 165 | 170 |
| HSPC | 3.8 | 3.5 | 185 | 185 | |
© 2019 by the authors. Licensee MDPI, Basel, Switzerland. This article is an open access article distributed under the terms and conditions of the Creative Commons Attribution (CC BY) license (http://creativecommons.org/licenses/by/4.0/).
Share and Cite
MDPI and ACS Style
Lee, J.; Lee, T. Influences of Chemical Composition and Fineness on the Development of Concrete Strength by Curing Conditions. Materials 2019, 12, 4061. https://0-doi-org.brum.beds.ac.uk/10.3390/ma12244061
AMA Style
Lee J, Lee T. Influences of Chemical Composition and Fineness on the Development of Concrete Strength by Curing Conditions. Materials. 2019; 12(24):4061. https://0-doi-org.brum.beds.ac.uk/10.3390/ma12244061
Chicago/Turabian StyleLee, Jaehyun, and Taegyu Lee. 2019. "Influences of Chemical Composition and Fineness on the Development of Concrete Strength by Curing Conditions" Materials 12, no. 24: 4061. https://0-doi-org.brum.beds.ac.uk/10.3390/ma12244061
Note that from the first issue of 2016, this journal uses article numbers instead of page numbers. See further details here.