Prediction of RC Bridge Member Resistance Decreasing in Time under Various Conditions in Slovakia


1
Department of Structures and Bridges, Faculty of Civil Engineering, University of Žilina, 010 26 Žilina, Slovakia
2
Laboratory of Civil Engineering, University of Žilina, 010 26 Žilina, Slovakia
*
Author to whom correspondence should be addressed.
Materials 2020, 13(5), 1125; https://0-doi-org.brum.beds.ac.uk/10.3390/ma13051125
Submission received: 30 December 2019
/
Revised: 19 February 2020
/
Accepted: 28 February 2020
/
Published: 3 March 2020
(This article belongs to the Section Corrosion)
Abstract
:Reliability is one of the most significant requirements for structures given in Eurocodes. Thus, the specific level of safety, serviceability, and durability have to be satisfied to fulfill the reliability of structures. In the case of reinforced concrete (RC) members, the corrosion of reinforcement is not assumed in the stage of structure design, which is in contrast with the structures in service, where the corrosion of reinforcement can significantly decrease their diameter ø in time. In these cases, the moment resistance in time MRd(t) decreases during the designed lifetime Td of a structure. The corrosion speed is as a basis for the calculation of moment resistance in time MRd(t), i.e., a first-year corrosion rate rcorr and a corrosion model as well. The corrosion itself is a very complicated issue, so the first-year corrosion rate rcorr and also the corrosion model can be different under various conditions in Slovakia. The paper is focused not only to determine the corrosion speed (first-year corrosion rate rcorr and the corrosion model) and parametric study of the moment resistance in time MRd(t) under various conditions in Slovakia but also shows an overview on some parameters that may influence the corrosion process.
1. Introduction
All structures shall be designed with an adequate level of reliability. The reliability covers safety, serviceability, robustness, and durability of construction and may be expressed with a reliability margin G, see Equation (1), or in the ration form (2). The actual standard approach [1] assumes that the reliability margin G has not be changed during the designed lifetime Td of any structural member. It means that the random variable load effects E and the random variable member´s resistance R have the same level in the time of structure operation, as well as at the end of the designed lifetime of a structure [2]. From that,
or
follows, where G is the reliability margin, R is the random variable resistance, and E is the random variable load effects. R and E are not usually listed with units (according to [1]), but have a unit depending on the stressing of the element; for instance [kN.m], if the element is subjected to bending, or [kN] if the element is subjected to normal force or shear force, and so on. Consequently, G has the same units as R and E in the case of the differential form (Equation (1)), or G is unit-free in the case of the ratio form (Equation (2)).
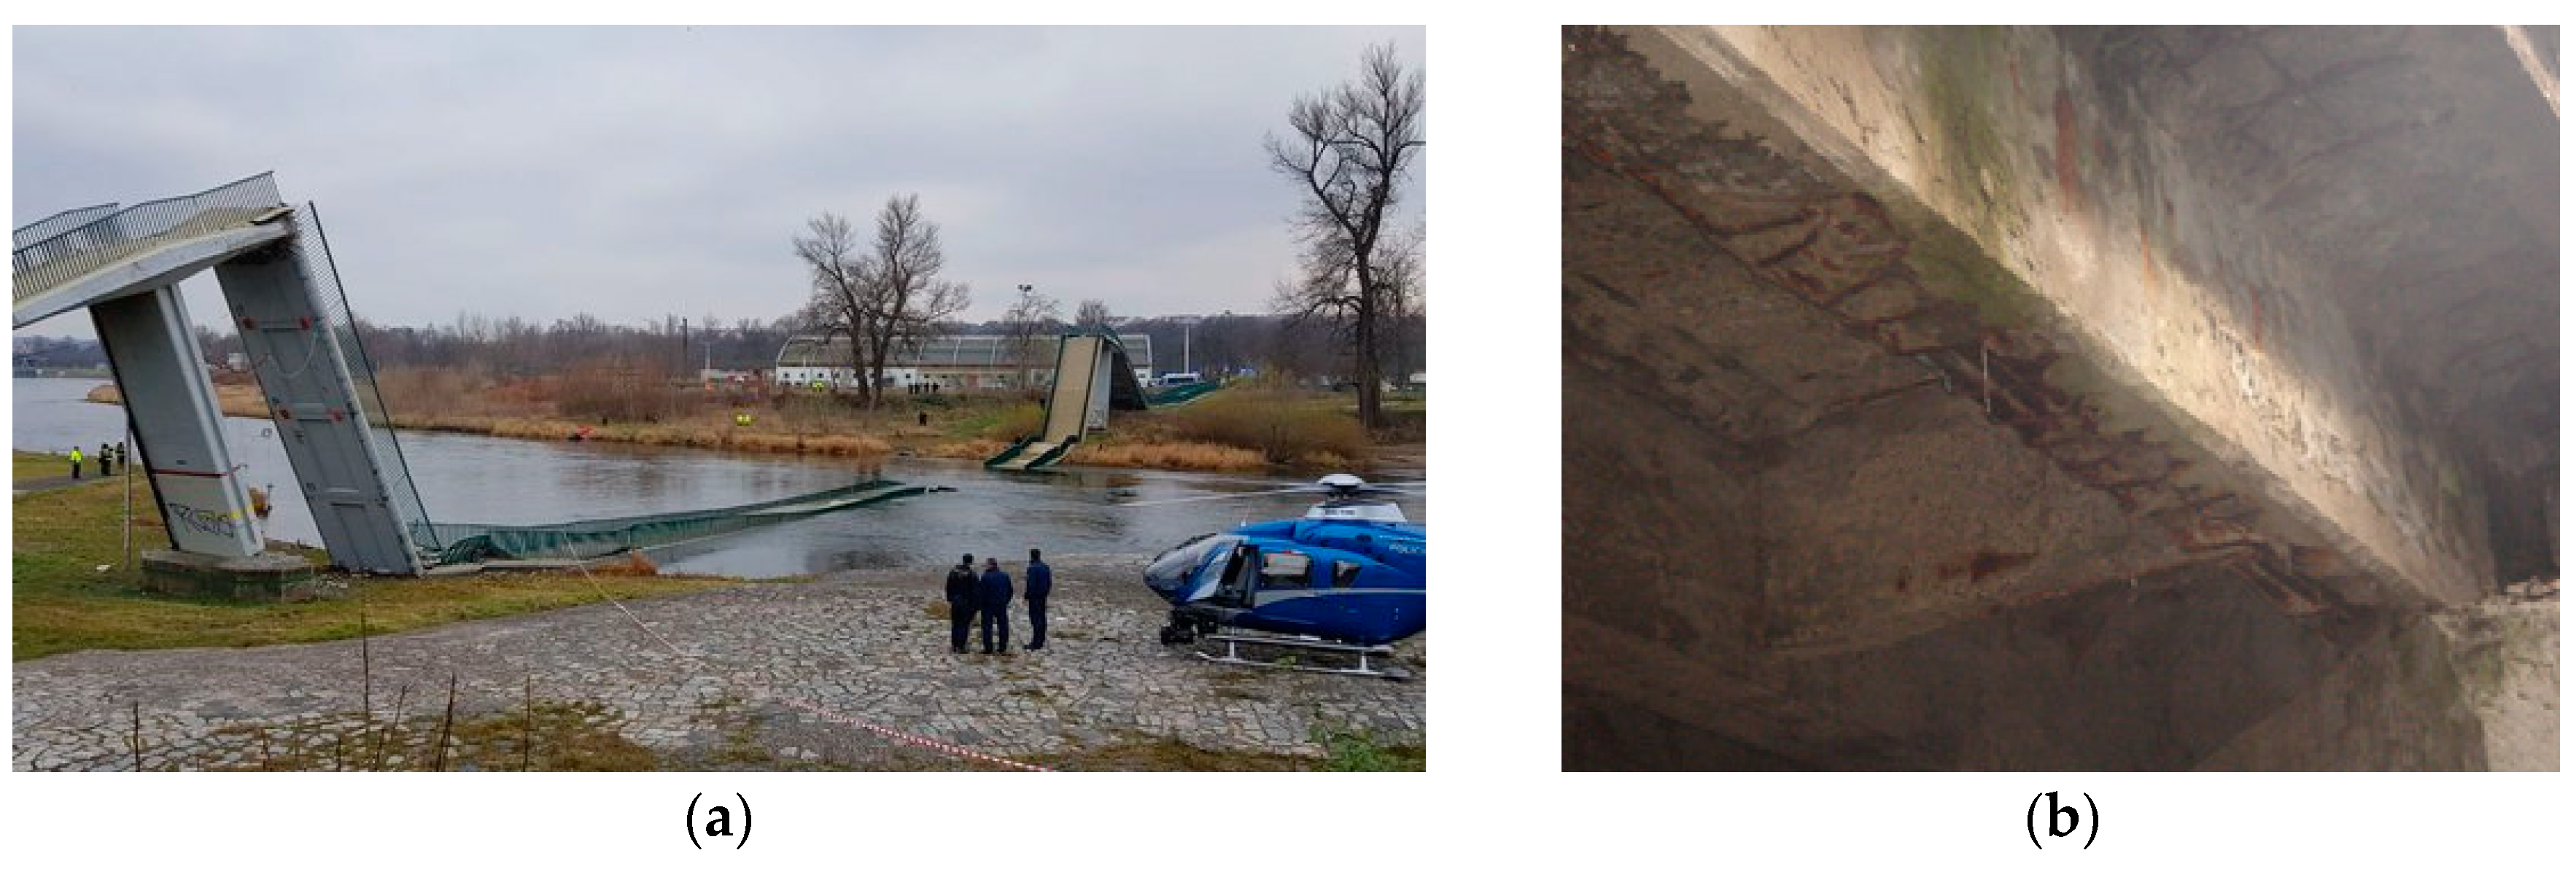
As can be seen in the real structures in service, the random variable resistance R is not a constant parameter in time, and many factors may affect it (corrosion, degradation of materials, unexpected cracking, change of static schema, etc.). One of the most general factors from them is the corrosion of the carbon steel, which can lead up to collapse of the structure, for example, as it was in the case of a prestressed pedestrian bridge in the Czech Republic (Figure 1a, [3]). The corrosion of embedded reinforcement in reinforced concrete (RC) members is also a very significant issue; see Figure 1b.
There are many factors that may influence the speed of corrosion, i.e., corrosion depth (the distance between an initial surface of a metal and the nearest concrete surface in time, after corrosion). These factors can be either endogenous such as chemical or physical homogeneity of the surface, composition of the metal, surface treatment or exogenous factors, namely, formation of corrosion products on the surface of metal, time of wetness, air pollution (like CO2, SO2, Cl−), or climatic data (like temperature, precipitation, wind, etc.). Variability of the factors that affect the corrosion process leads to the various classifications of the corrosion e.g., according to shape of corroding surface (uniform corrosion, pitting corrosion, galvanic corrosion, crevice corrosion), type of the environment (atmospheric corrosion, bacterial corrosion, microbial corrosion, underground corrosion, gaseous corrosion), electrochemical, or chemical corrosion [4,5,6,7]. The most widespread type of corrosion is uniform (or pitting) corrosion under atmospheric conditions’ so-called atmospheric corrosion.
The corrosion of reinforcement does not influence only the resistance (bending, shear) of member—Ultimate Limit States (ULS) [8,9,10], but it also influences the durability of members [11,12] and crack development—Serviceability Limit States (SLS) [13]. The research activities are also focused on the influence of corrosion on mechanical properties of steel reinforcement [14,15].
In the case of RC member, the embedded reinforcement is protected by surrounding concrete during the so-called passive stage (0, t0). During this stage, the reinforcement does not corrode, and this stage should remain during the entire designed lifetime of a structure. Hence, the corrosion of reinforcement is not taken into account in the design according to EN 1992-1-1 [16] and EN 1992-2 [17], and, if it occurs (so-called active stage (t0, Td)), the reliability margin G is automatically decreased in time, so it should be denoted as G(t). Moreover, the random variable load effects are also changed in time E(t) due to various impacts (for instance, increase or decrease of action on bridges). Thus, it is possible to define the reliability margin in time G(t) by the following equations:
or
where G(t) is the reliability margin changed in time, R(t) is the random variable resistance changed in time, and E(t) is the random variable load effects changed in time. Units of G, R, and E are mentioned after Equation (2).
As was mentioned above, the corrosion may occur on structures during their lifetime, so it is significant to know how the corrosion affects the reliability margin in time G(t). The base for this calculation is the level of the damage of the reinforcement bars in time by corrosion.
The article is focused on the decreasing of the RC member moment resistance in time MRd(t) based on the corrosion of the reinforcement. For this reason, the first-year corrosion rate rcorr [μm/year] of carbon steel in various areas of Slovakia, as well as two types of corrosion models, were selected. According to research, it is shown that, in some cases, there is a more correct linear model (in the case of splashing transport mechanism) and power-linear model (in the case of inland areas and spraying transport mechanism) in the paper.
2. Change of Moment Resistance in Time Due to Corrosion
The typical structural member of the bridges is a horizontal element (e.g., slab, longitudinal girder, transverse girder, and box girder) primarily subjected to bending and shear (among other stressing due to torsion, fatigue, and so on). The paper is focused on moment resistance MRd.
The moment resistance of the RC bridge member according to Eurocode EN 1992-2 [17] outgoing from EN 1992-1-1 [16] is
where
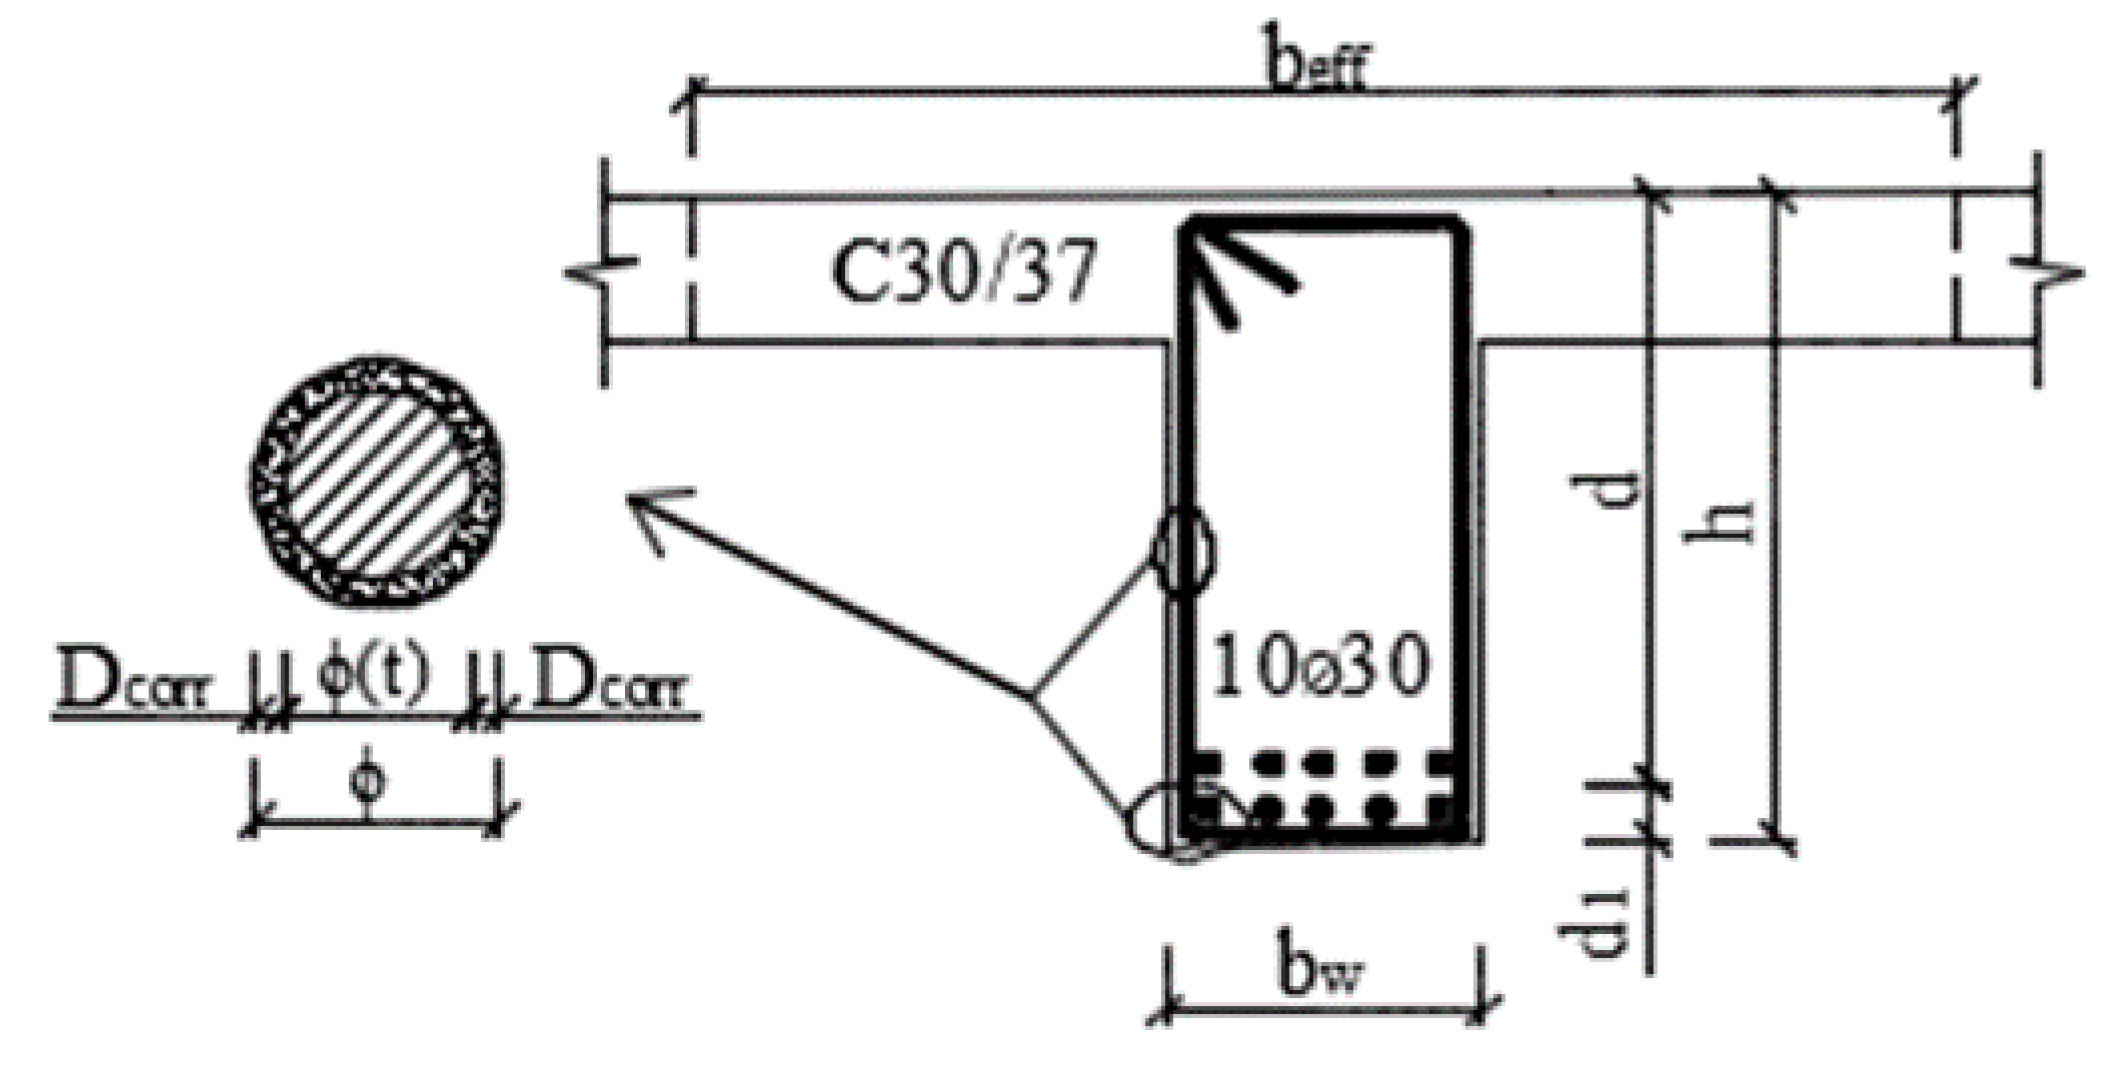
where MRd is the ultimate resistance moment of cross-section [kN m], As1 is the area of longitudinal tensioned reinforcement [m2], ø is the initial reinforcement diameter [mm], n is the number of reinforcement bars, fyd is the design value of reinforcement yield strength [N mm−2], d is the effective depth of the cross-section [m], b or beff is the effective width of cross-section (slab – b = 1.0 m, T-beam – beff) [m], and fc is the design value of the compressive strength of concrete [N mm−2].
Formulas (5) and (6) do not take into account the degradation of materials in time t during the lifetime. The most important degradation parameter changing the material and geometrical parameters of RC cross-section member in time is a reinforcement corrosion, which causes the change of reinforcement diameter ø(t) or reinforcement cross-section As1(t) in time t. Considering the reinforcement corrosion, formula (6) is changed to form
and formula (5) is transformed into
where MRd(t) is the ultimate resistance moment of cross-section changed in time [kN m], As1(t) is the area of longitudinal tensioned reinforcement changed in time [m2], ø(t) is the initial reinforcement diameter changed in time [mm].
From formula (7), it follows that the basic parameter we need to know is information about how the reinforcement diameter ø(t) changes in time. Thus, it is needed to determine the model of corrosion losses Dcorr. Because the corrosion is a relatively complicated issue, there may be various types of corrosion models. Some of them described below.
The linear model of corrosion loss Dcorr recommended for reinforcement in reinforced concrete members, during the active stage, was described by Thoft-Christensen [18]
Or, according to Andrade, Sarria and Alonso [19],
where Dcorr is the corrosion loss [µm] (in various literature can be described by various symbols D, ∆ø, ∆ø(t), R, Rcorr, dcorr, x, y, etc.), rcorr is the first-year corrosion rate [μm/year], icorr is the corrosion current density [μA/cm2] (1 μA/cm2 is equal to 11.6 μm/year of corrosion, so the convection is ), and tas is the length of the active stage, (equal to t minus t0) [years].
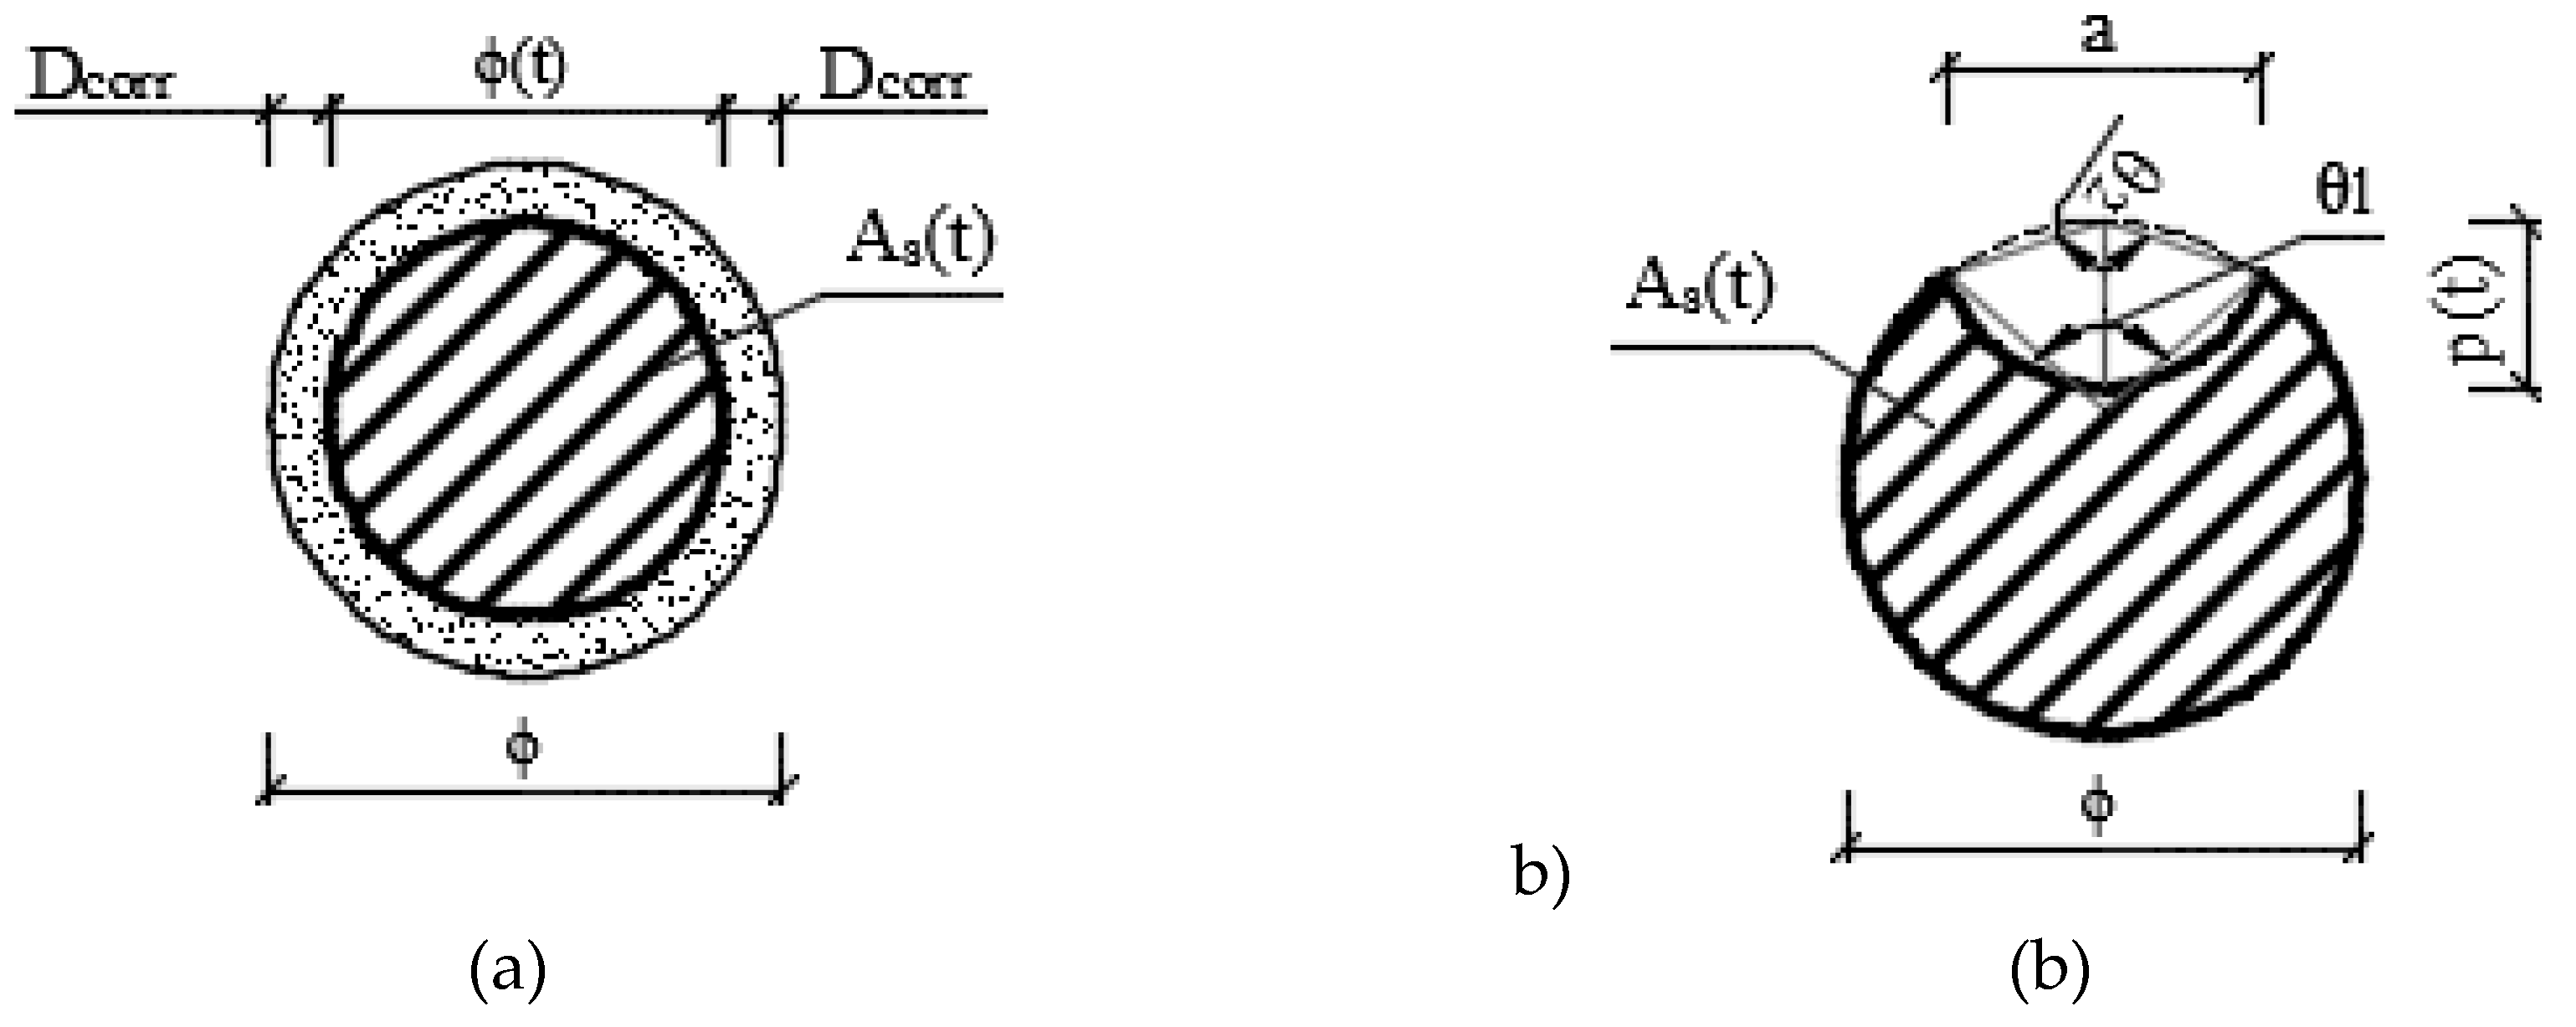
Thus, the diameter of a reinforcement bar in time ø(t), for uniform corrosion (Figure 2a), can be calculated according to the following equations [18]:
or, according to [19],
where ø is the initial reinforcement diameter [mm], ø(t) is the reinforcement diameter changed in time [mm], t is the exposure time of structure [years], and t0 is the length of the passive stage [years].
Power function model according to [20] assumes the corrosion on the flange of the I-shape of a structural steel member
where A1 is the constant [–].
The above-mentioned power model of corrosion is recommended for structural steel members. Since structural steel and reinforcement are both carbon steels (according to EN 9224 [21]), it is assumed that the power model can also be used for reinforcement in some cases as shown later.
Moreover, the last significant model according to the actual standard approach [21] has the combination of the previous two models. The functions of the power-linear model are
where b is the metal-environment-specific time exponent for steel [–].
This corrosion model assumes the creating of the corrosion products on the surface of the material that protects the original metal and slows down the corrosion losses. This protective layer, during the first twenty years represented by a power function of the corrosion loss Dcorr(tas ≤ 20) (14), then follows the linear function of the corrosion loss Dcorr(tas > 20) (15). The exponent b can be calculated either by a chemical composition of a metal or the recommended value for carbon steel is b = 0.523. In both cases, the value of metal-environment-specific time exponent b is closer to 0.5 rather than to 1.0, and this exponent may be increased by ∆b in areas with a higher concentration of chloride deposition rate Cl− [21] described by equation
where ∆b is the increasing of the exponent b [–], and Cl− is the chloride deposition rate [mg/(m2·day)].
Now, it is possible to modify Equation (8), taking into account the linear corrosion model, into final form for moment resistance [22] depending only on time
For more information and a description of each variable, see [22]. The model takes into account the change of reinforcement diameter ø(t) (decreasing) in time using rcorr or icorr, which are reflected in the parameters km1 to km4.
Moment resistance of a cross-section in time MRd(t) described by the power-linear function of the corrosion loss Dcorr, and by the modifying of formula (8) is given by the following formulas:
where
where km1–km9 are the parameters depending on materials’ and geometrical’ characteristic in time, A, B are the parameters constant in time
The models take into account only the increase of the rust volume and the reduction of the cross-section of the reinforcement, but do not take into account the spalling of the concrete cover. To do any calculation of moment resistance changing in time MRd(t), it is necessary to know the values of corrosion rate rcorr as an input parameter.
3. First-Year Corrosion Rate rcorr of Carbon Steel
The standard EN ISO 9223 [23] describes the designation of the yearly corrosion rate for the first year of exposure by two methods. The first method is based on a determination of the first-year corrosion rate rcorr using measurements on standard specimens (specimens under outdoor environment). The second method is based on the determination of the first-year corrosion rate rcorr using environmental information obtained from a net of meteorological measurement stations and using the dose–response functions (see paragraph 3.1). The first method is very time and money consuming, so the second method is preferred and used in a general way.
3.1. Dose–Response Functions According to the Actual Standard Approach
There have been many dose–response functions of carbon steel created during the years; see [24]. Nowadays, the actual standard [23] describes the dose–response functions for standard materials like carbon steel, zinc, copper, and aluminum. These functions have been based on climatic parameters like temperature T, relative humidity Rh, Sulphur dioxide SO2, and chloride deposition rate Cl−. The following Equation (33) describes the first-year corrosion rate rcorr of carbon steel
where SO2 is the deposition rate of Sulphur dioxide [mg/(m2·day)], T is the temperature [°C], Rh is the relative humidity [%], Cl− is the chloride deposition rate [mg/(m2·day)], and fCS = 0.15·(T–10) when T < 10 °C; otherwise, fCS = –0.054·(T–10).
This first-year corrosion rate rcorr is the base parameter for calculation of corrosion loss Dcorr in time (in unit [μm]) according to standard [21] described in Section 2.
The Slovak Hydrometeorological Institute (SHMI) performs measurements of all the input parameters. The parameters like temperature and relative humidity are measured as is recommended in the standard EN 9225 [25] (approximated in 120 stations in Slovakia), while sulphur dioxide is measured as a concentration in the air in unit [µg/m³] (in about 50 stations). Thus, the convection between deposition rate of Sulphur dioxide SO2 and concentration of Sulphur dioxide in the air SO2,air is equal to [23]
The chloride ions in the air Cl−air in unit [mg/L] are measured in only five stations in Slovakia (in rural or industrial environment, not near roads), which is a very small number for the creation of corrosion maps (see Section 3.3), as well as there being no standard recommended convection between chloride ions in the air Cl−air (in unit [mg/L]) and chloride deposition rate Cl− (in unit [mg/(m2·day)]). Chloride deposition rate Cl− has not been measured in Slovakia, so they were taken from literature and code (Section 3.5 focuses on this matter).
3.2. Long-Term Monitoring of the First-Year Corrosion Rate
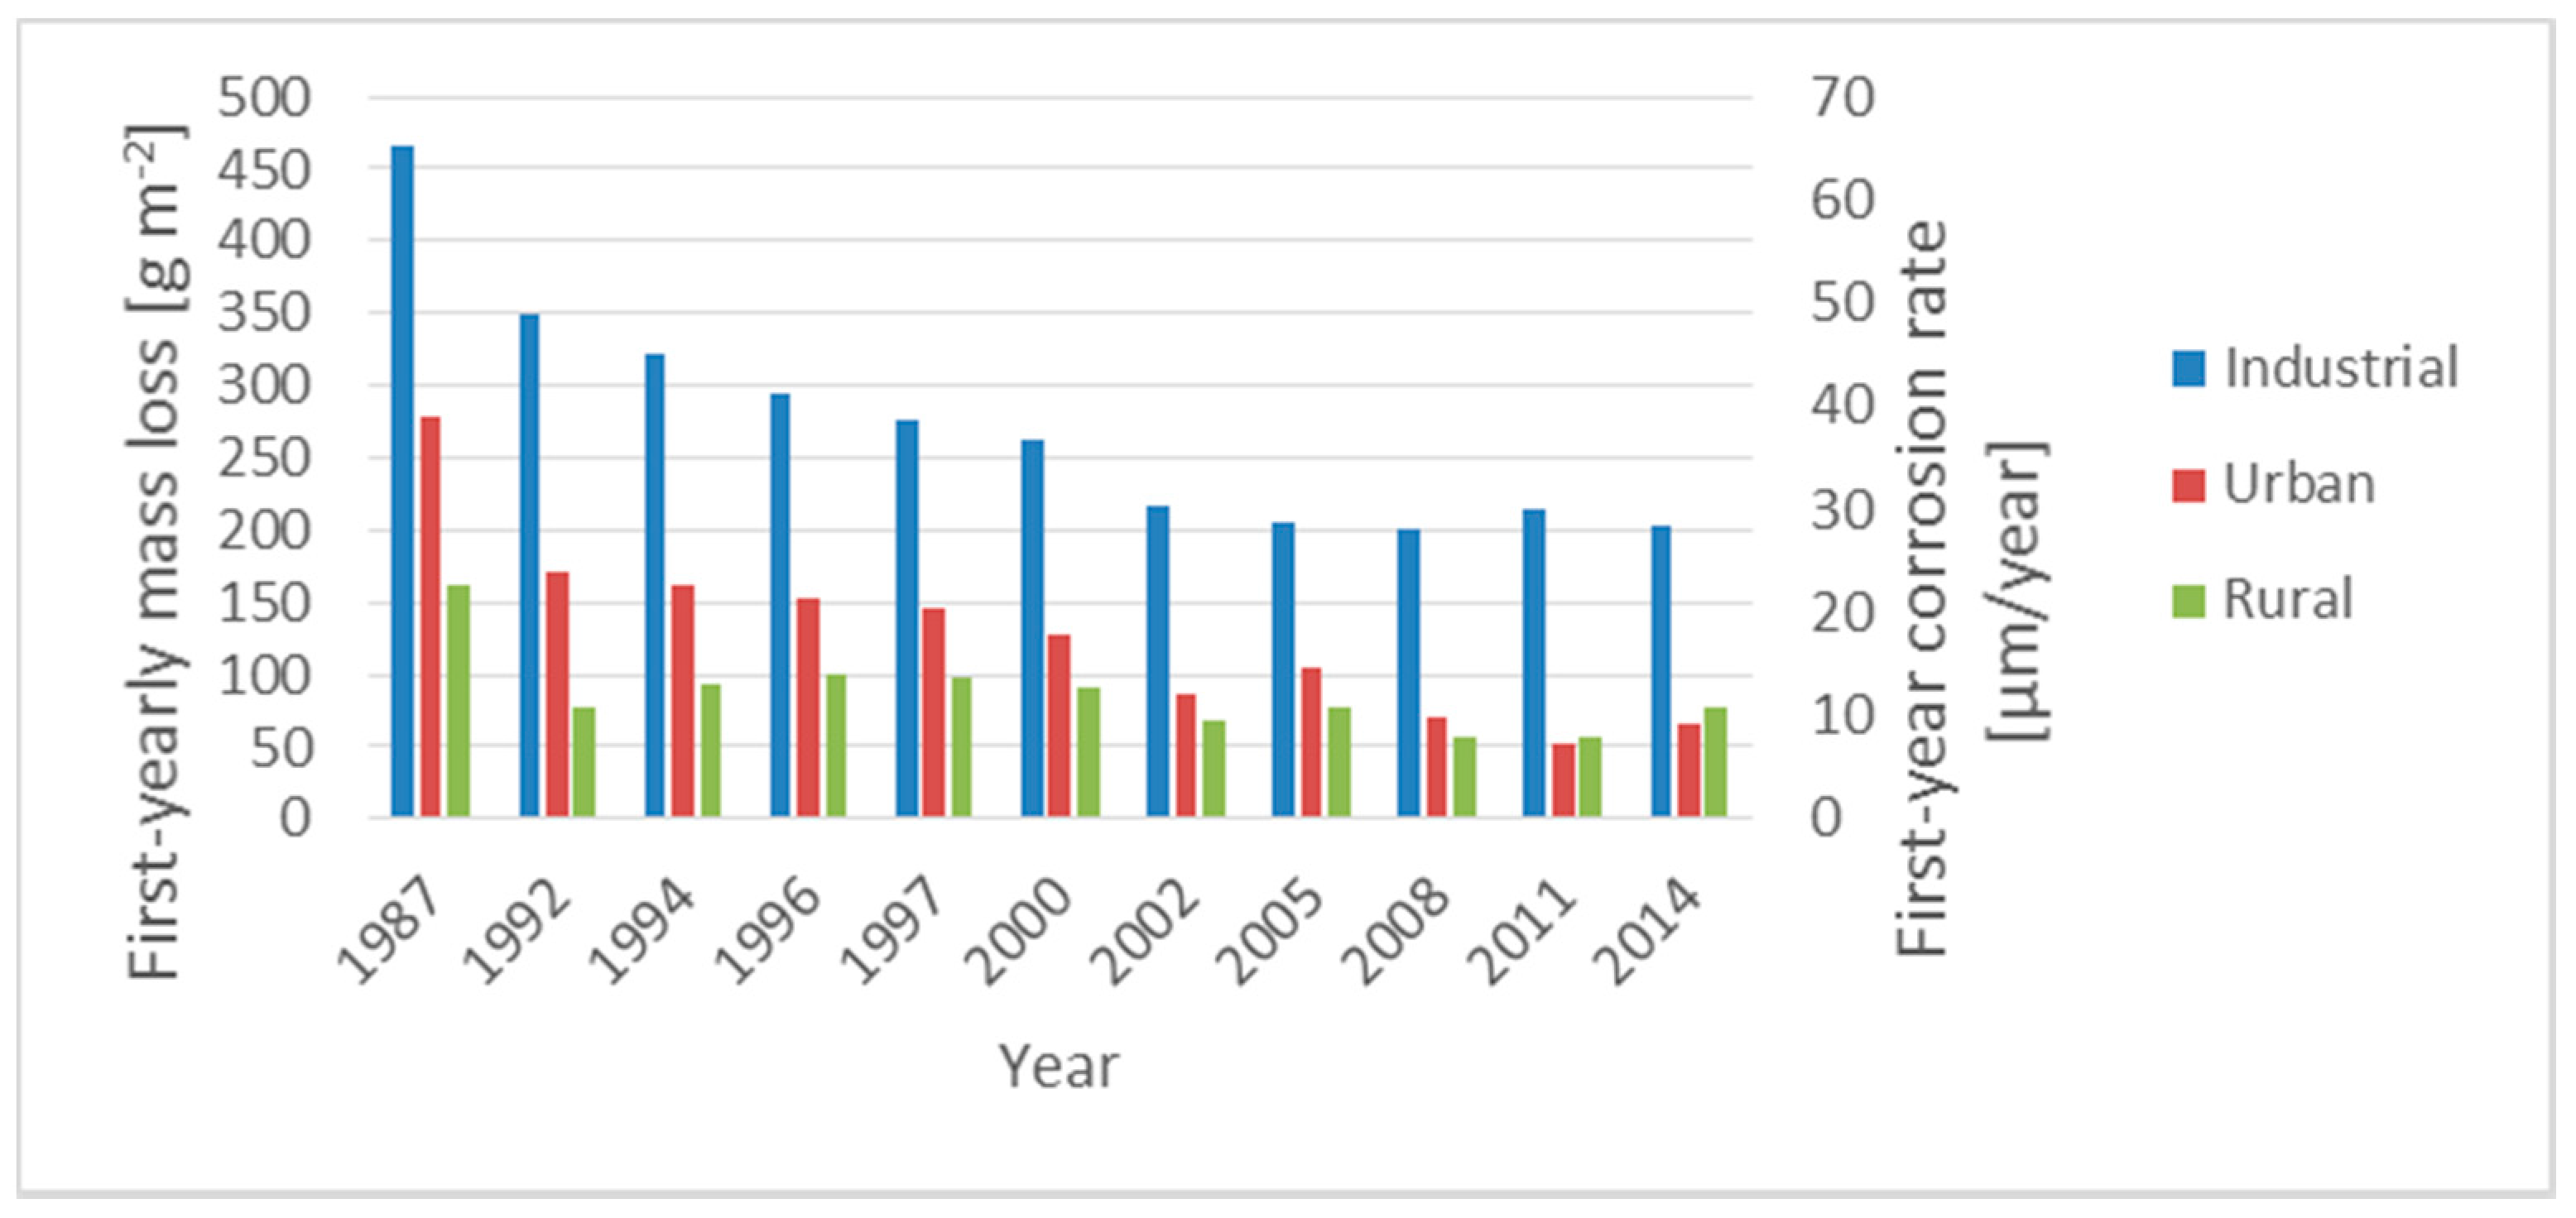
The first-year corrosion rate rcorr is changing in various areas, as well as during the years. Thus, it is significant to know since this corrosion rate should be observed for the correct determination of how high the corrosion rate rcorr in various areas in Slovakia is. The program IPC Materials–International Co-operative Program on the Effect on Materials including Historic and Cultural Monuments has been monitoring the air pollution and corrosion effect in various areas of Europe (the Czech Republic, Germany, Italy, Norway, Sweden, Spain, Finland, France, and Poland) since 1985 (see Figure 3) [26].
Figure 4 presents the average first-year corrosion effect (first-year corrosion rate rcorr and first-year mass loss ML) observed in this research. It can be seen that the corrosion rate rcorr has not been changed roughly since 2002. Thus, the creating of the corrosion maps (see Section 3.3), for determining the first-year corrosion rate rcorr in Slovakia, can be sufficient since 2004.
3.3. Corrosion Maps of Carbon Steel
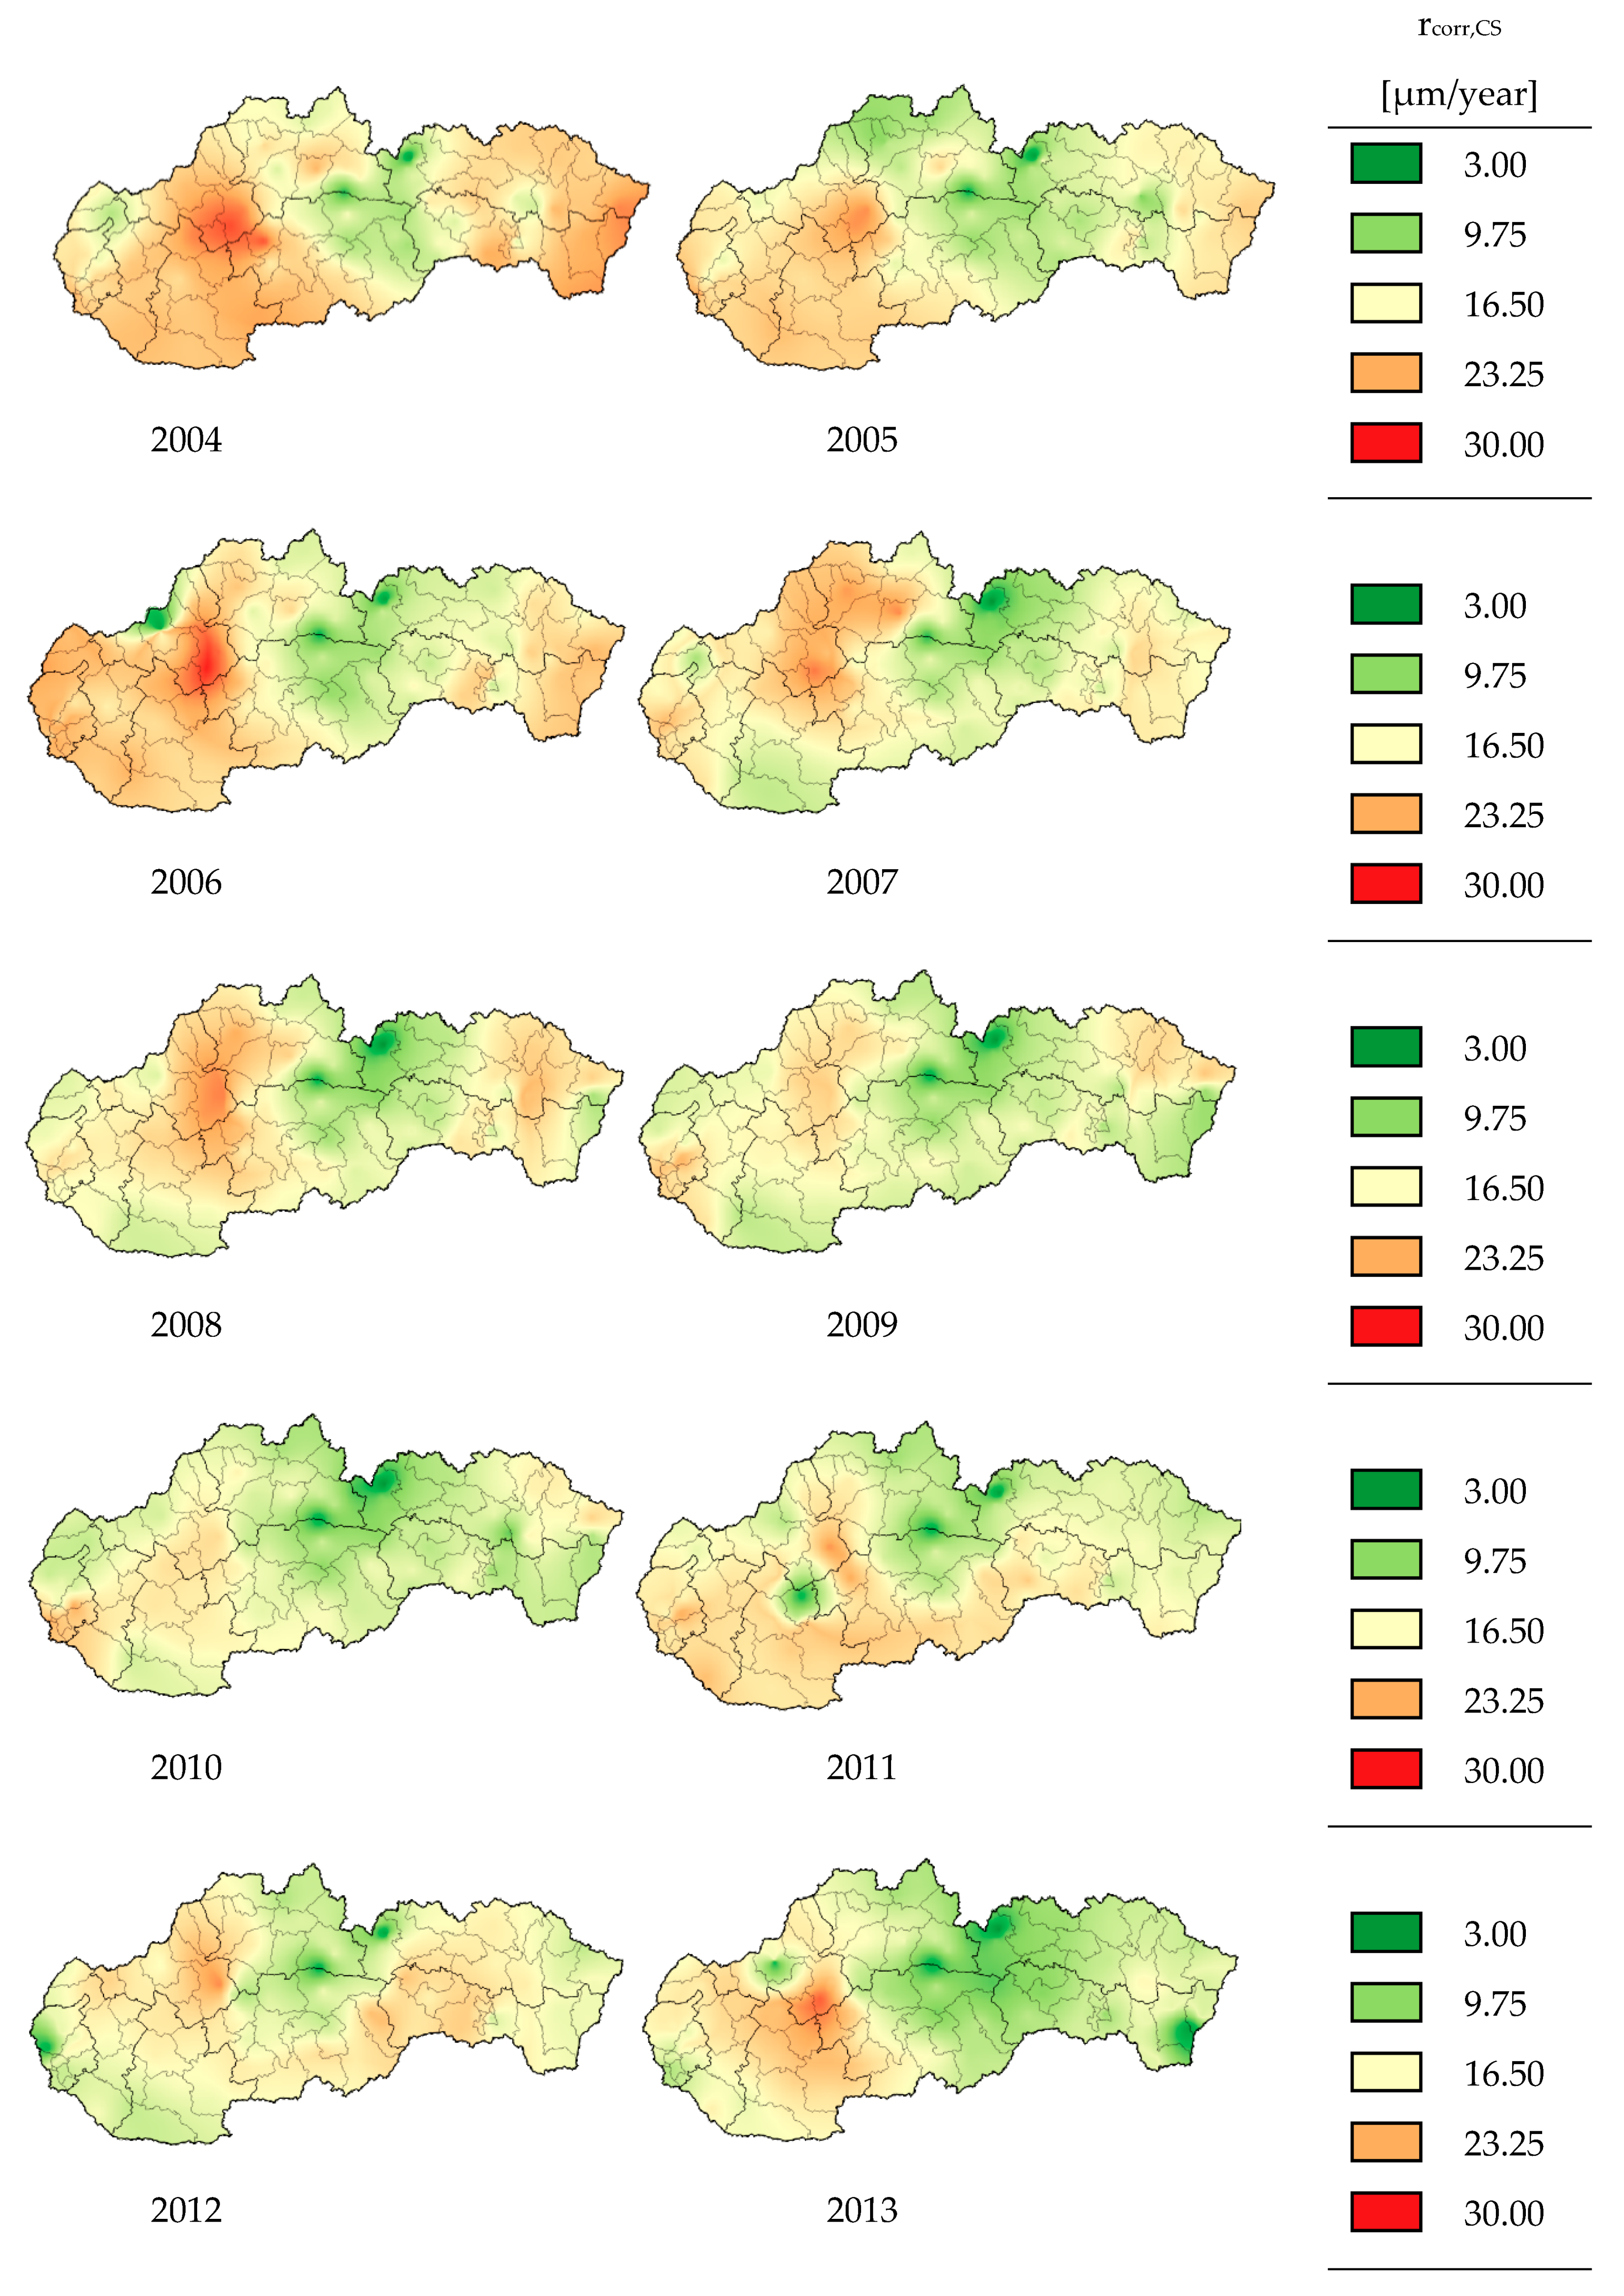
The corrosion maps represent, in graphical form, the first-year corrosion rate rcorr calculated according to Equation (33) in various areas of the Slovak Republic. The input parameters like temperature, relative humidity, and Sulphur dioxide were obtained from co-operation with the Slovak Hydrometeorological Institute (SHMI). The chloride deposition rate, in inland areas, is a relatively small value, usually under 3 mg/(m2·day), so their effect is neglected in creating corrosion maps. Only chlorides calculated from input data from SHMI were taken into account in this part. The chloride from de-icing agents are considered in Section 4.
The process of creating corrosion maps has several steps, and programs like Microsoft Excel, Surfer, QGIS, and GIMP were used. The program Surfer extrapolates all the input parameters, to the point without knowing parameters, to about 93,000 points of results on a grid of 1 × 1 km to all of Slovakia by the formula
where ZA is the estimated value as a linear combination of Zi and Wi, n is the number of neighboring measured values, Zi is the measured value at the i-th location, and Wi is the weight factor that calculates by finding the semi-variogram values between distances of all input points and output pixels.
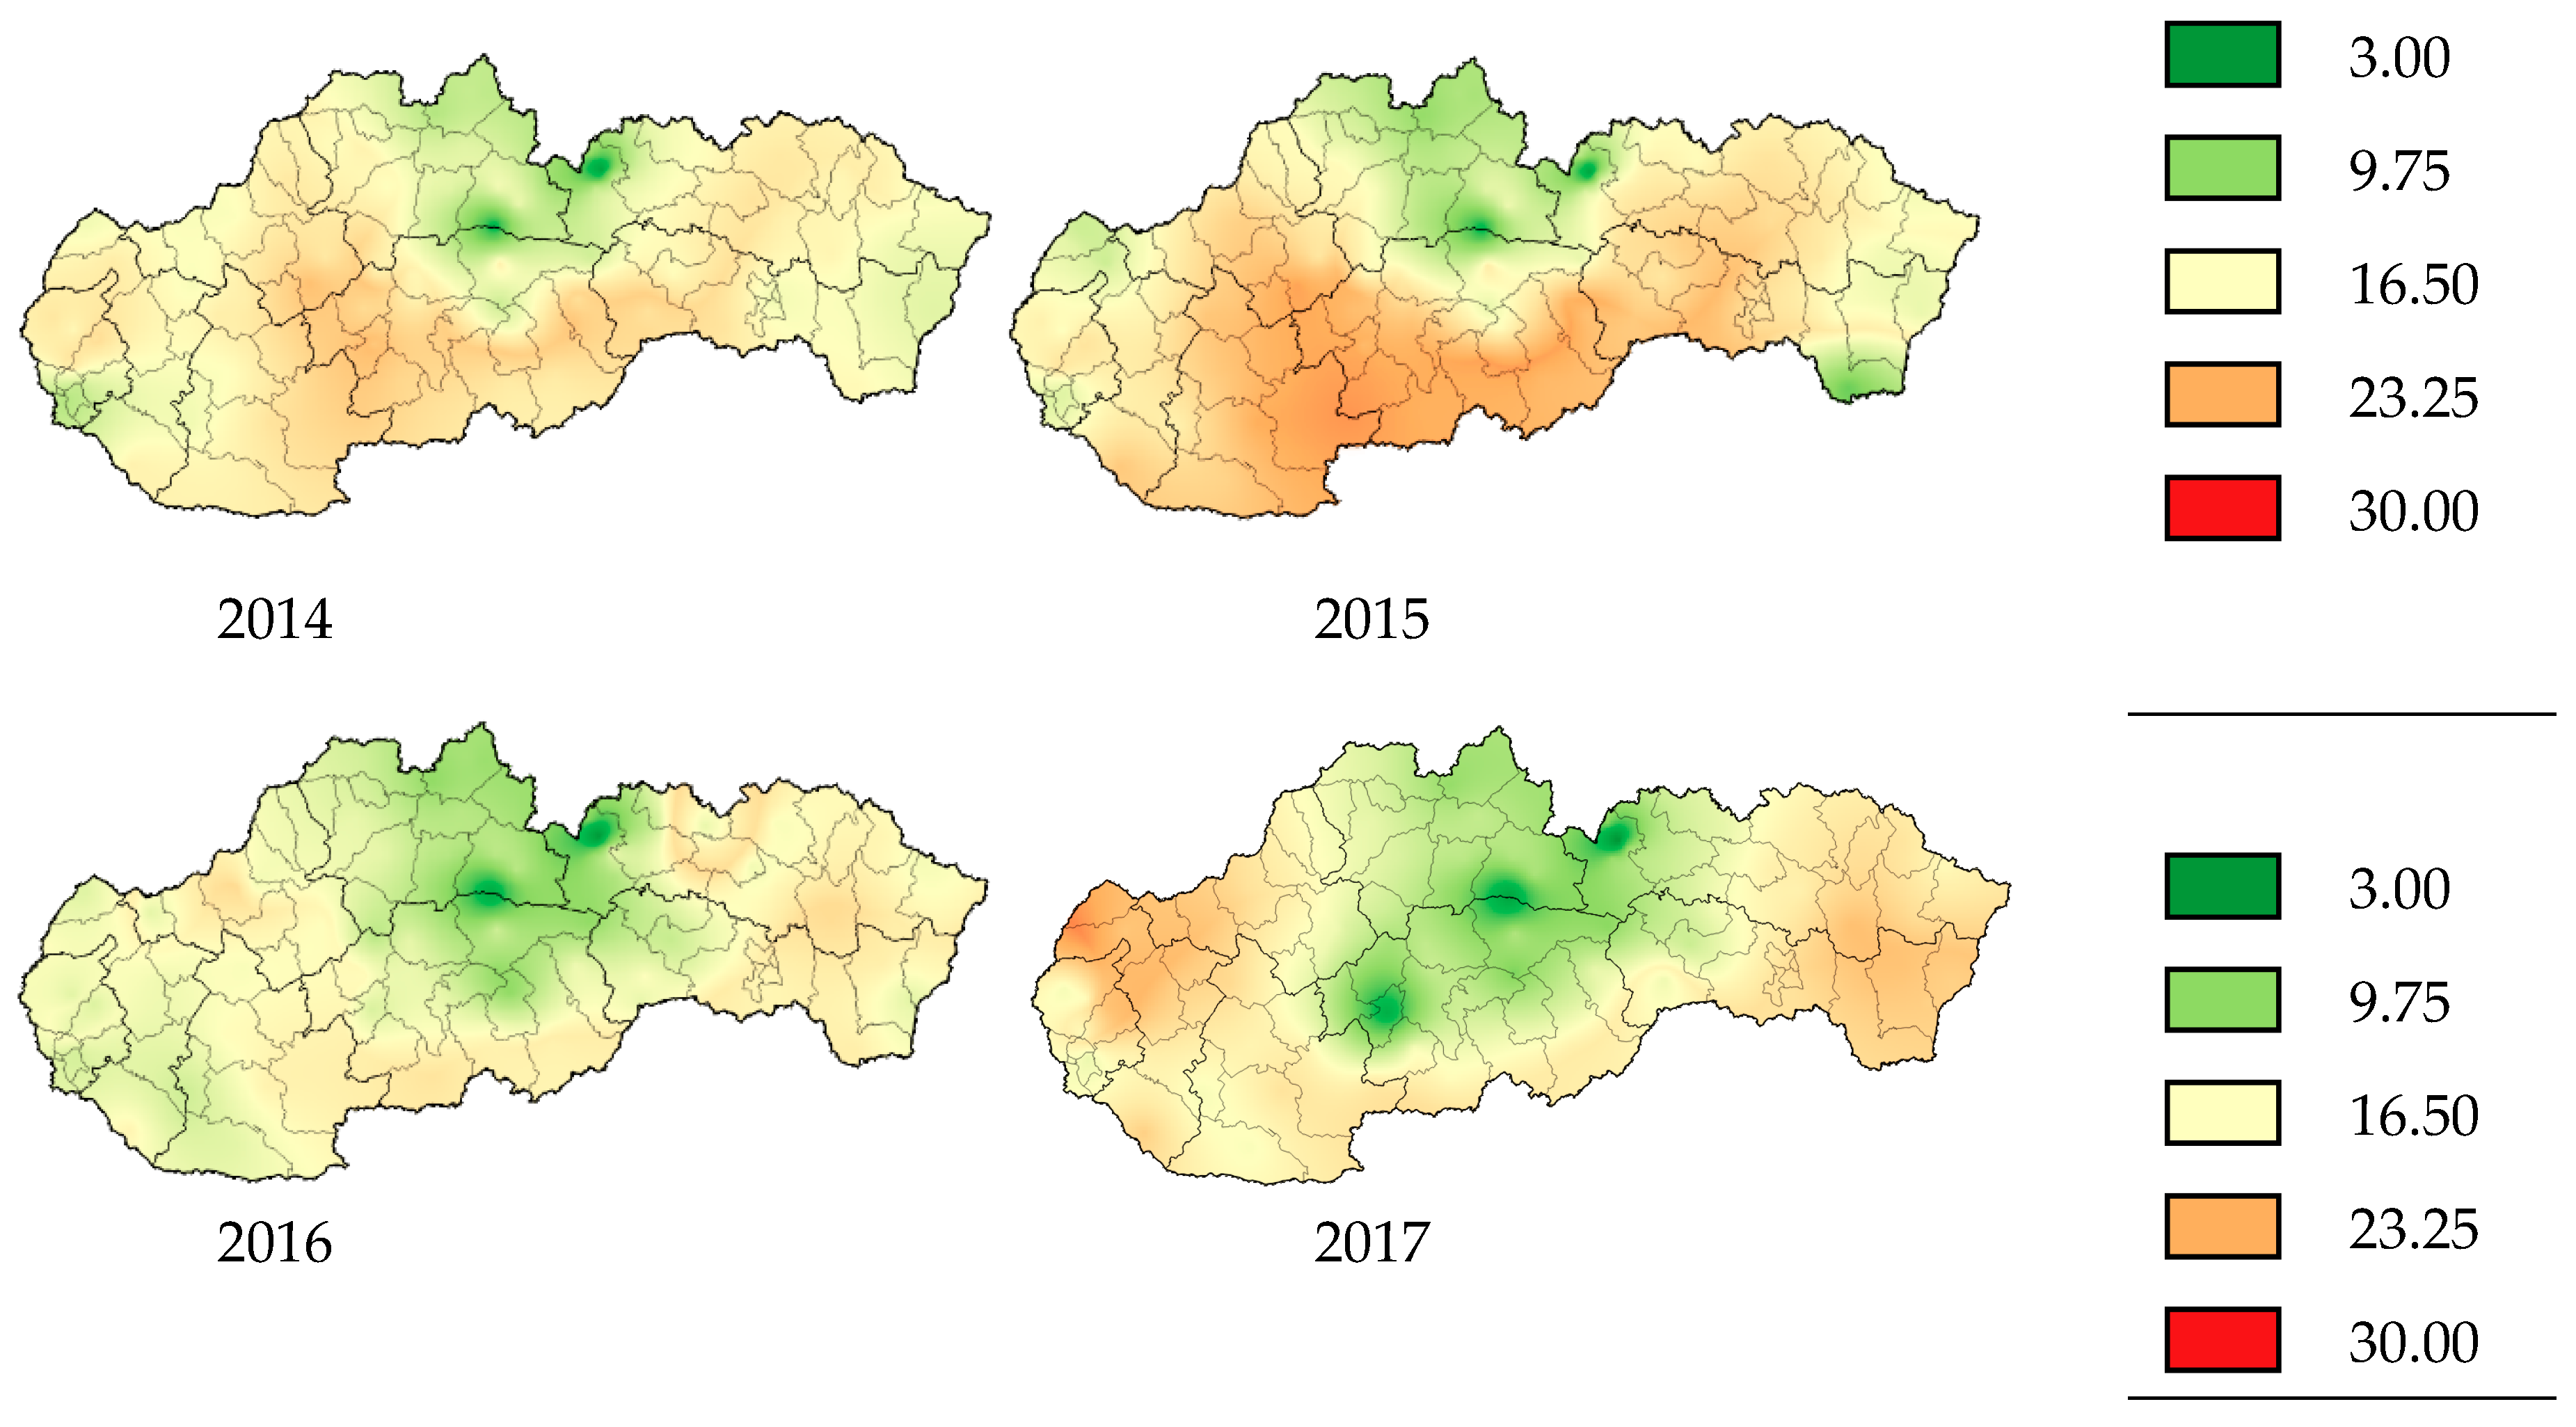
The corrosion maps created according to this process from 2004 to 2017 are shown in Figure 5. The scale of bright tones was chosen from the minimum value of the calculated first-year corrosion rate (rcorr = 3.00 µm/year) to the maximum value of the calculated first-year corrosion rate (rcorr = 30.00 µm/year).
3.4. Impacts of Input Parameters on Corrosion Maps
It may raise the question of which factor affects the most corrosion rate rcorr in various areas in Slovakia. As can be seen on the maps of environment aggressiveness of Slovakia [27], the maps of the concentration of Sulphur dioxide in air SO2,air have the most similar areas of concentration as maps of the first-year corrosion rate.
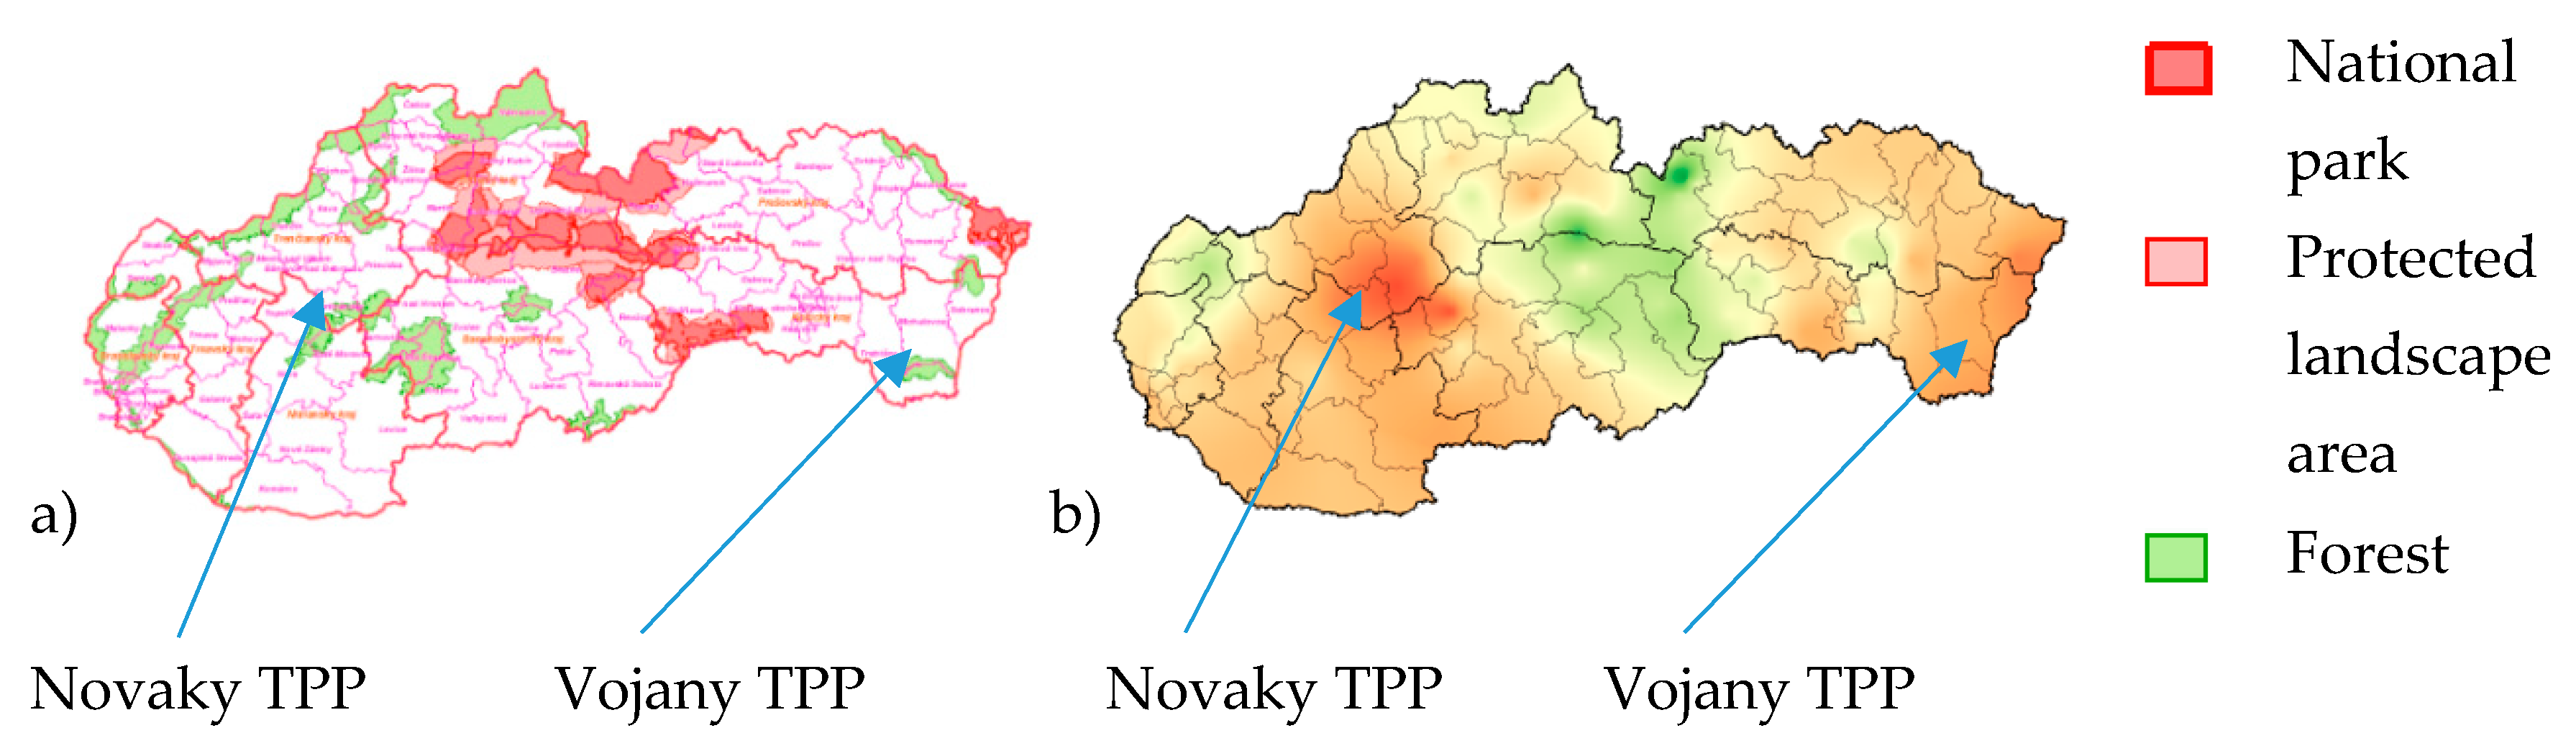
The sources of Sulphur dioxide SO2,air can be either a human source or natural source. The primary human source of Sulphur dioxide is by burning of fossil fuels such as coal and oil. Two thermal power plants are located in the Slovak Republic, in Nováky and Vojany, information on [28]. In addition, the areas of National park have a lower corrosion rate; see Figure 6.
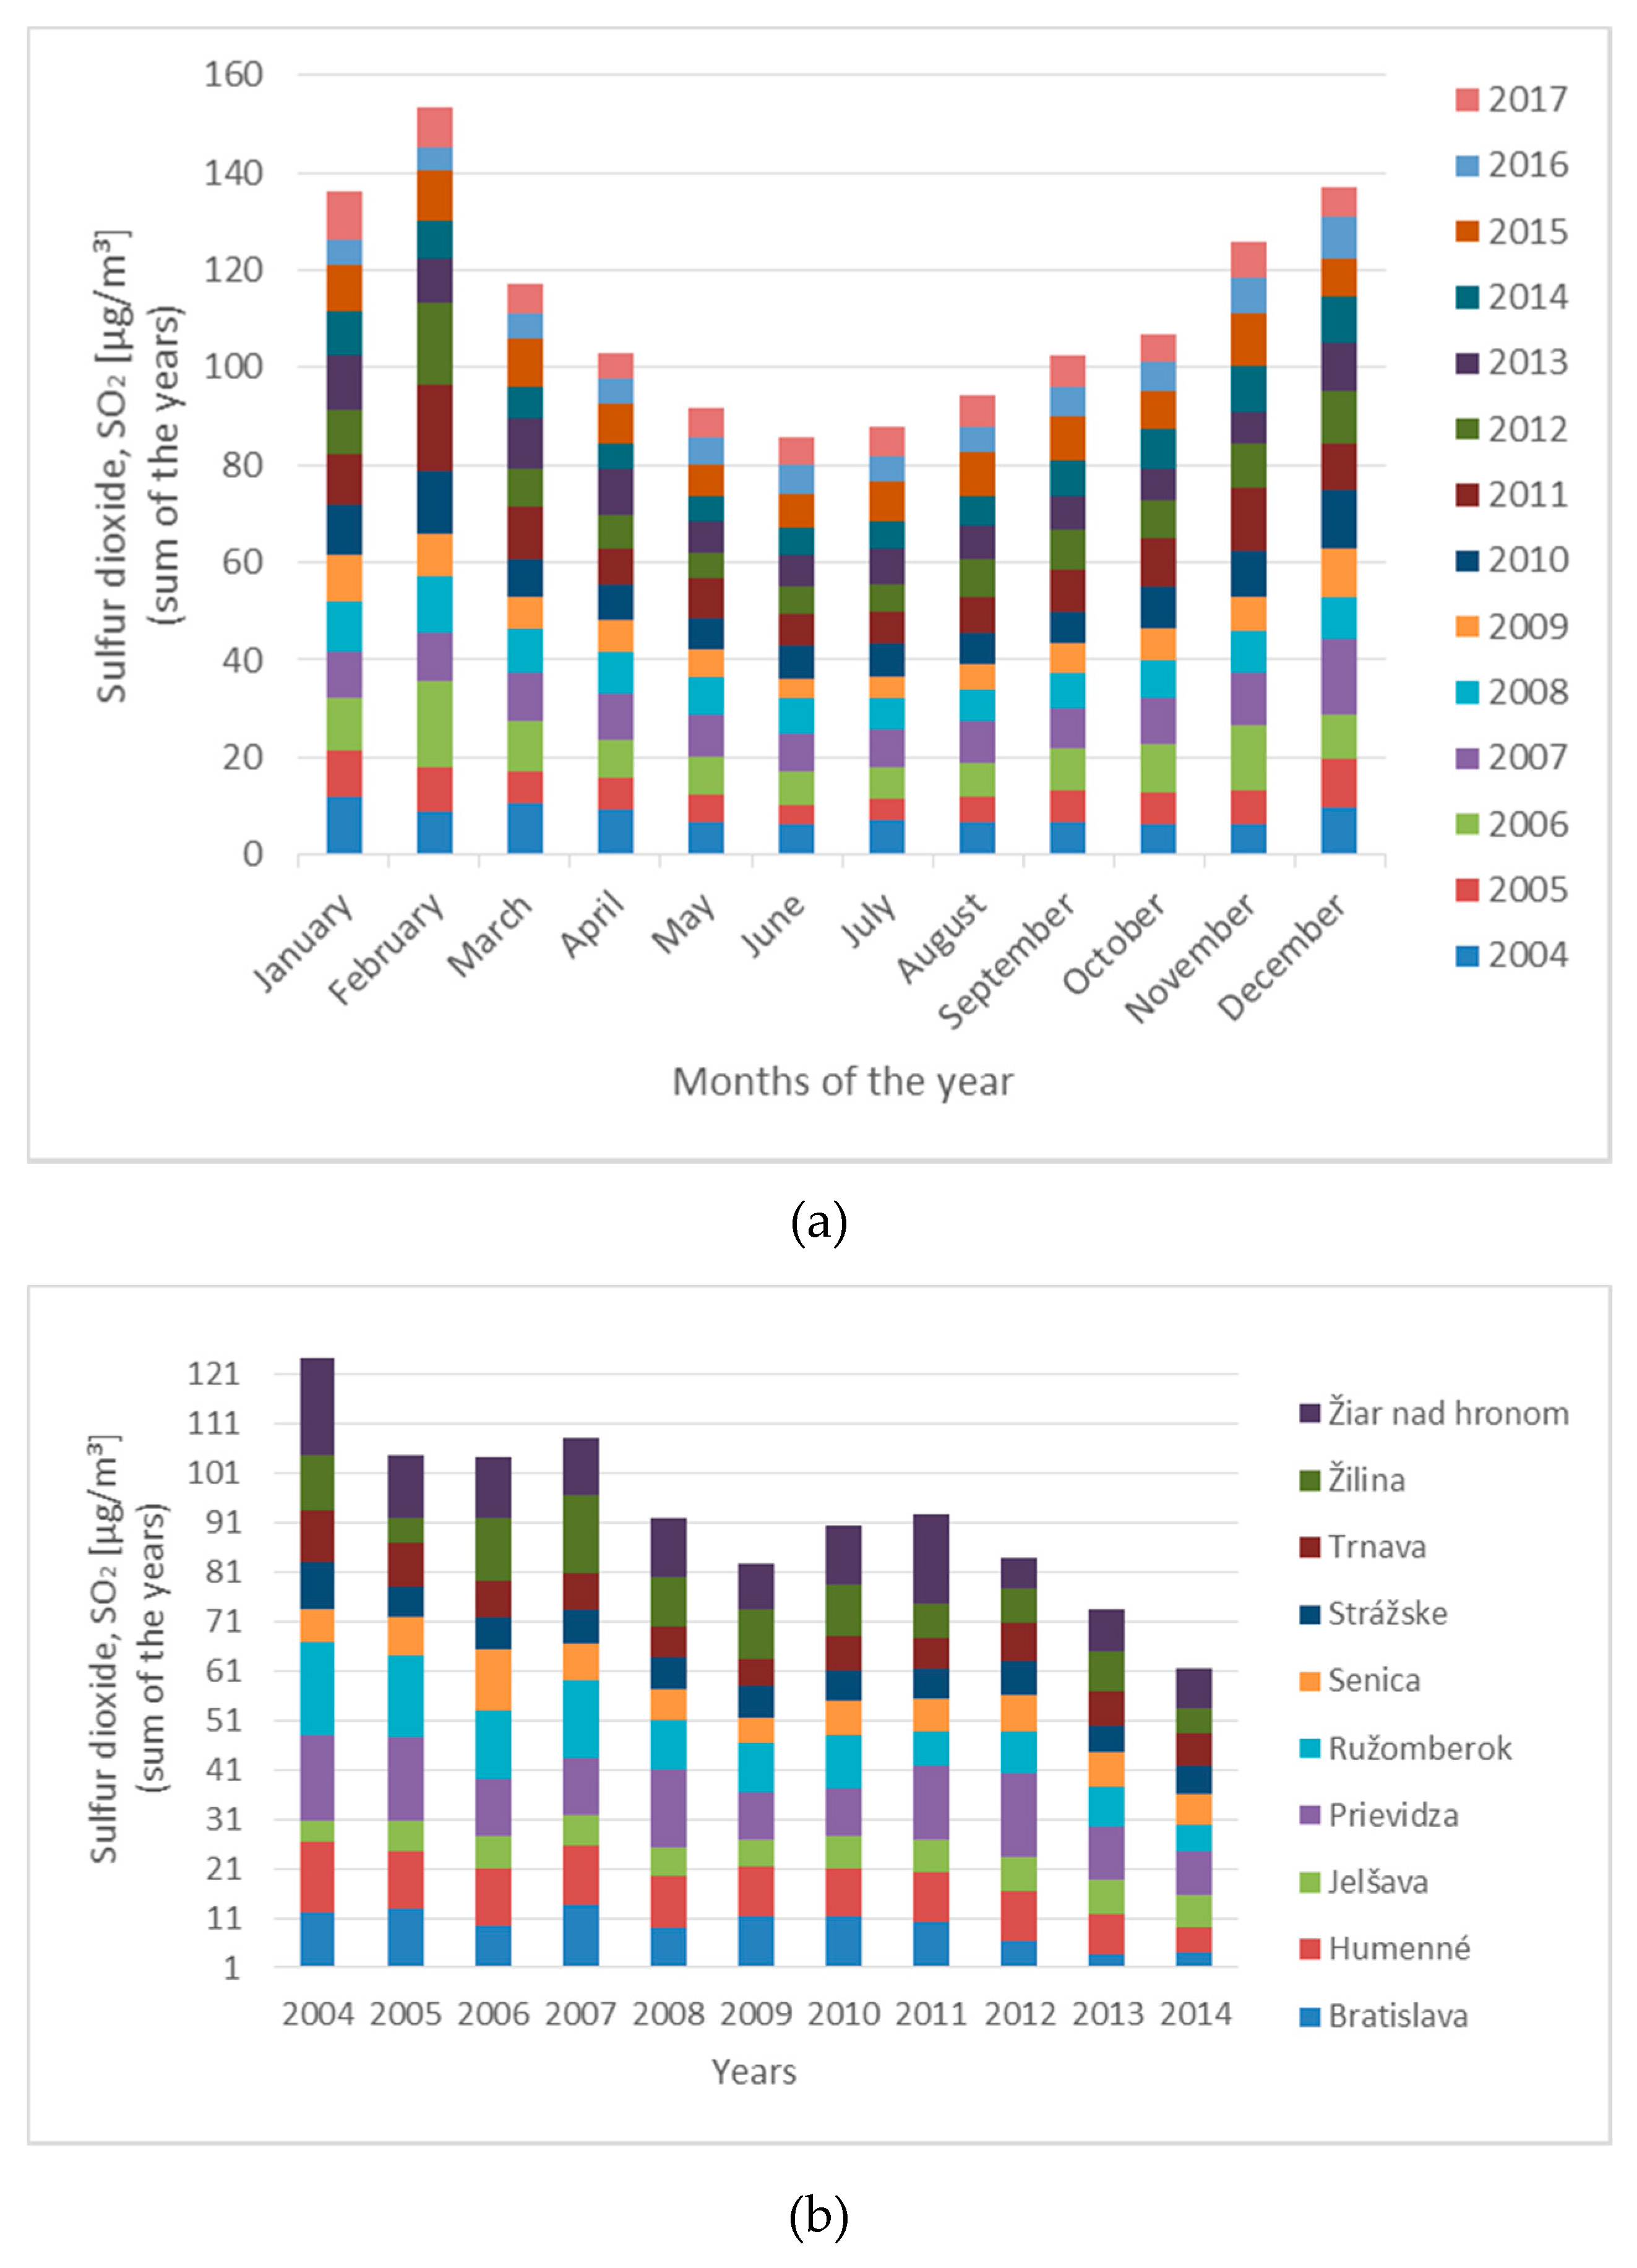
For the variation of the sulphur dioxide concentration in the air SO2,air during the year (in particular months of the year), see Figure 7. The vertical axis (in Figure 7) represents the sum of year average concentration of sulphur dioxide in Slovakia from 2004 to 2017, on which it can be seen that this concentration increased during the winter seasons (November to March), and it should be the result of the higher burning of fossil fuels in thermal power plants and in houses (heating houses in villages with coal and wood). On the side, the minimal concentration is during the summer season. The average value of SO2 decrease in time in Slovakia, as it can be seen from measured values given in Figure 7b).
The most significant natural resource is a volcanic eruption. The most massive volcanic eruption was in April 2010 and in May 2011, which paralyzed almost all air traffic transport over Europe. Despite this fact, the concentration of SO2,air was not significantly increased in these years. The values of rcorr were calculated according to formula (33), which also takes into account chloride ions.
3.5. Effect of Chloride Deposition Rate
The higher concentration of chloride deposition rate Cl− increases the first-year corrosion rate rcorr, as well as changes the corrosion model, for the first twenty years (see formula (14)) to the more linear function by the increasing of exponent b by ∆b (see Equation (16)). It may have a very significant effect on the speed of corrosion and on the decreasing of the reliability in time as well.
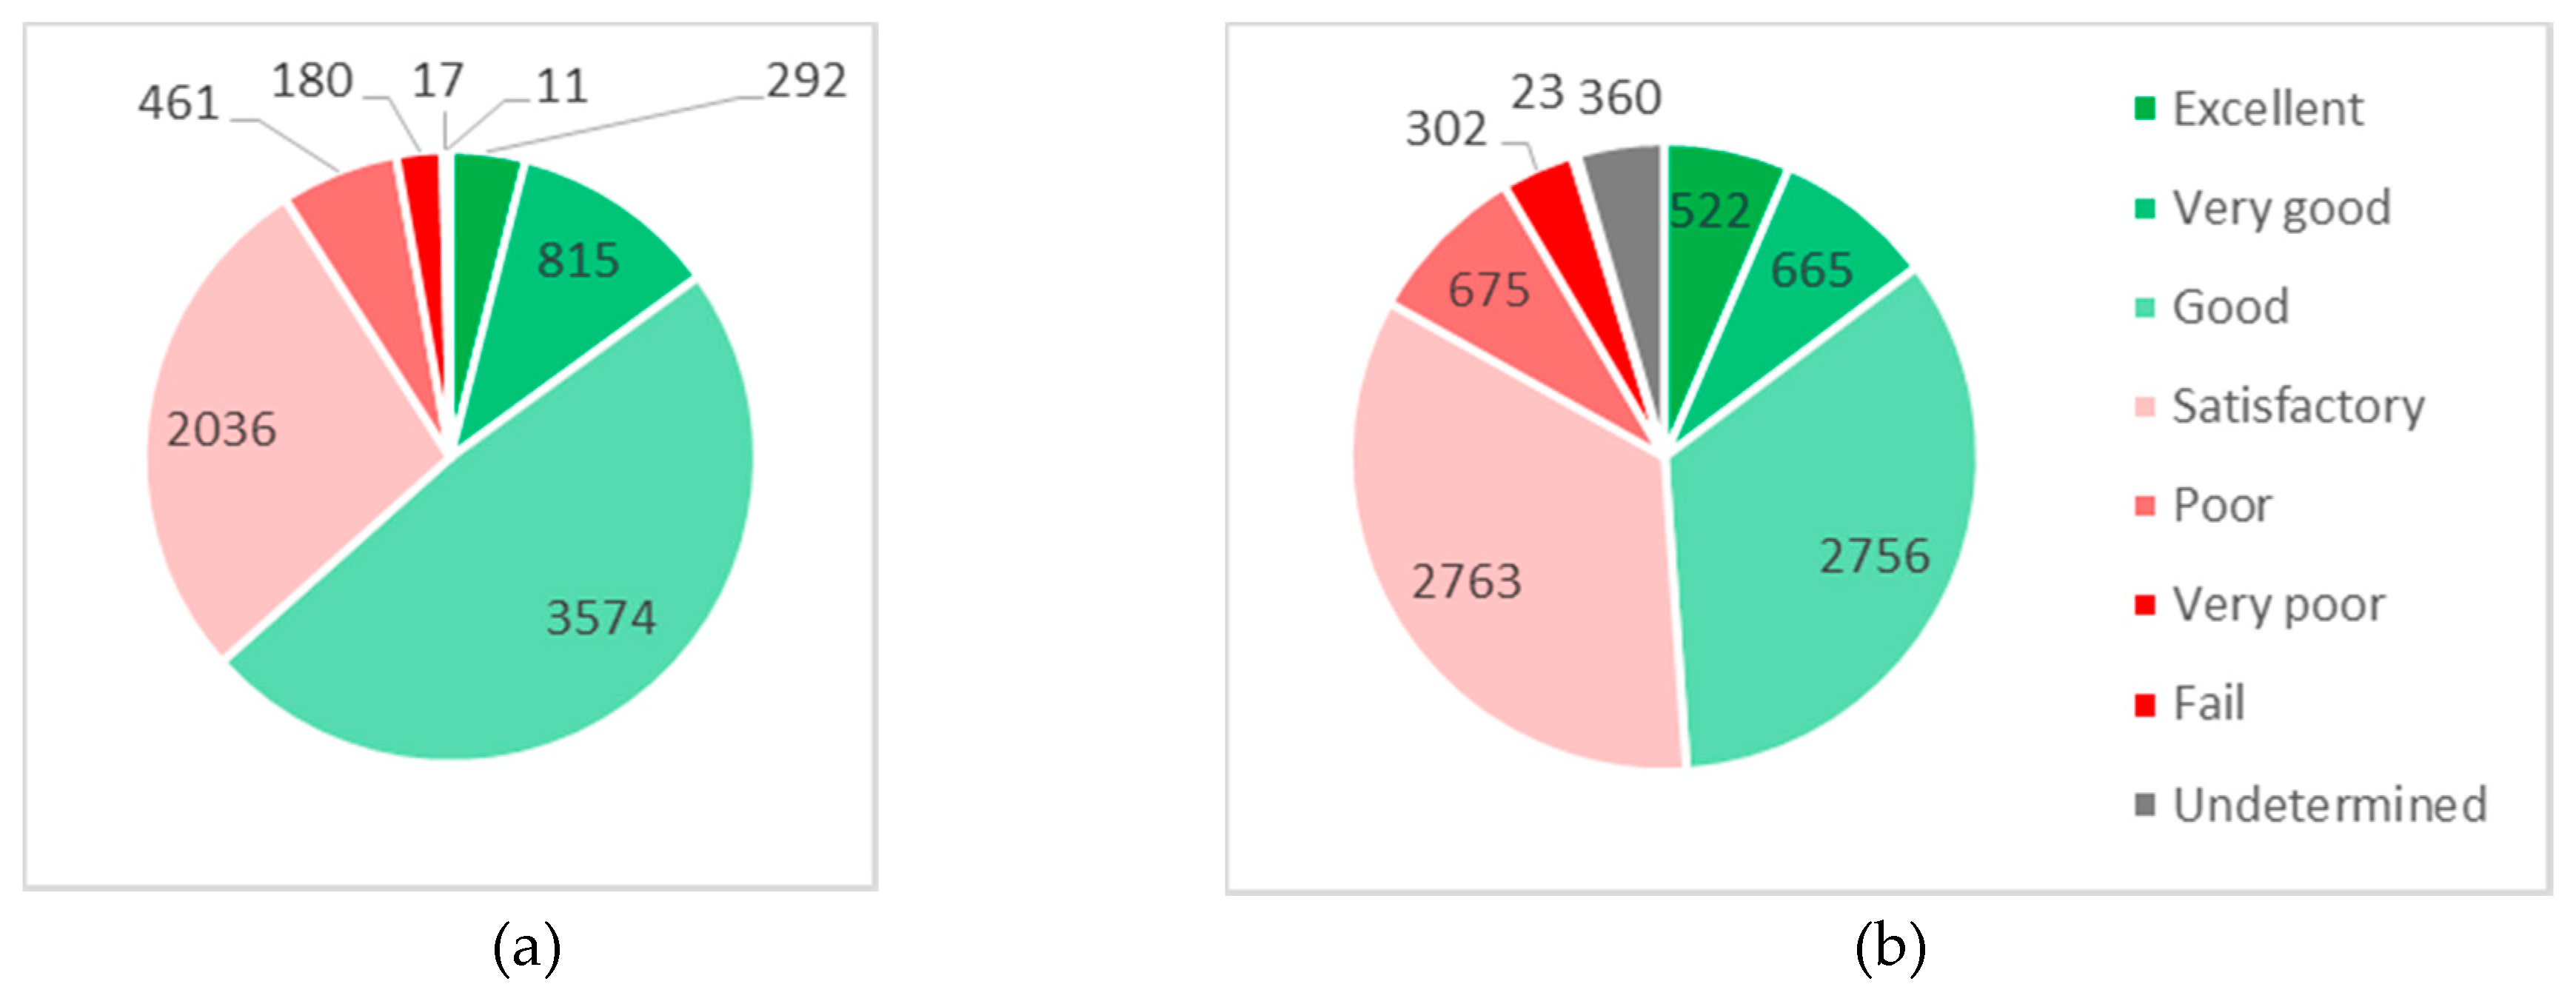
Here, it can distinguish three possible areas of salinity. The first is valid in areas under 3 mg/(m2·day) for which the corrosion maps in Section 3.3 and corrosion model without increasing the exponent b by ∆b are valid. The other two, where the chloride deposition rate is significantly higher, i.e., in areas where de-icing salt on the road infrastructure network in winter seasons is applied either by spraying transport of de-icing salt (in some winter seasons Cl− = 90 mg/(m2·day)) or by splashing transport of de-icing salt (in some winter seasons Cl− = 8000 mg/(m2·day)) [29,30,31]. This effect can be seen mainly on the structures around the road and bridges, e.g., abutments, piles, and superstructure of bridges. Figure 8 shows the grading system of the bridge, under Slovak Road Administration (SRA), in 2004 and in 2017, where it can be seen that the reliability of the bridges is decreased during their designed lifetime, information on Slovak Road Administration [32].
For determination of the corrosion model, the value of the exponent b + ∆b should be known. Some research describes this value over one, up to the value b = 1.79 [33,34,35] and another one under value one [36].
For the parametric study, in the case of spraying transport mechanisms of de-icing salt, the exponent b was chosen b + ∆b ≈ 1 by three facts: the first, the standard EN 9224 [21], recommends that the value of the metal-environment-specific time exponent b + ∆b is usually under one; the second, the results of the accelerated Neutral Salt Spray (NSS) test, according to EN 9227 [37], confirms the value of exponent b close to one (b = 1.08, see Equation (31) and Table 1) and not b + ∆b = 1.211 as it shall be calculated according to Equation (13), when the deposition rate of chloride in the corrosion chamber is Cl− = 4.290 mg/(m2·day). The NSS tests were made in a laboratory of the University of Zilina on specimens of reinforcement of diameters ø6, ø10, ø14, and ø25 (10 specimens of each diameter means 40 specimens) using corrosive chamber type DCTC 1200 P. The corrosive losses on laboratory specimens were calculated using formula (36), which was modified from formula (14)
where Dch is the corrosion loss of non-protected carbon steel samples (reinforcement bar of diameters ø6, ø10, ø14, and ø25, and length 300 mm) in the corrosion chamber [µm], rch,first is the first-daily corrosion rate in the corrosion chamber [µm/day], tch is the time of closed corrosion chamber [days], and bch is the exponent related to the corrosion model in the corrosion chamber [–].
The third is the RC T-beam bridge under service in Kolárovice village has a corrosion model very close to the linear model (i.e., b + ∆b ≈ 1) (see [38]).
4. Parametric Study of Moment Resistance in Time under Various Conditions in Slovakia
For the parametric study, two types of corrosion models were chosen. The first is a power-linear model that represents the areas where the de-icing salt is not applied or is applied by spraying transport mechanisms, while the second model represents the areas where the de-icing salt is applied by splashing transport mechanisms and thus the corrosion model approximated to the linear function. By this, the moment resistance of RC bridge member MRd(t) in time was derived as a power-linear decrease in the moment resistance in time using Equations (18) and (19) and a linear decrease in the moment resistance in time using formula (17). No pit corrosion model was used as the surface corrosion was verified experimentally on the bridge [38].
For the parametric study of the moment resistance MRd(t) in time was chosen, the dimensions of the real RC T-beam bridge in Kolárovice village; see Figure 9. The bridge is the reinforced concrete single span beam bridge. The superstructure consists of bridge slab and of six main beams. The transverse load distribution is ensured by transverse beams. More information about the bridge is possible to see in [38]. All dimensions and material´s characteristics were measured on real structures using destructive or non-destructive testing. The concrete strength was also tested using a Schmidt hammer. The design documentation was not available, and the original values of the material strengths were not known, so it was not possible to compare them with the measured values. The design documentation was not available, and the original values of the material strengths were also not known, so it was not possible to compare them with the measured values. Thus, only the measured geometric and material properties of the bridge were taken into account in the parametric study.
Table 2 shows the input parameters used in the parametric study of the RC T-beam cross-section. As already mentioned, three conditions of salinity were chosen.
The first represents areas where chloride deposition rate Cl− is as in inland areas, under 3 mg/(m2·day). In this case, the chloride ions affect the corrosion rate rcorr not so significantly, the minimum rcorr was increased from 3 μm/year to 5.4 μm/year and the maximum rcorr from 30 μm/year to 33.64 μm/year (see Figure 5), and the ∆b was increased by 0.112 in comparison when the chloride deposition rate is zero or 3.00 mg/(m2·day). As was mentioned above, the deposition rate of chloride has not been measured in Slovakia so, for this case, it was neglected in the creation of corrosion maps and parametric study, as well.
The more significant influence on first-year corrosion rate rcorr has spraying transport mechanisms of de-icing salt on structures. This transport mechanism represents the second conditions under which the structure may occur. For this reason, the average yearly concentration of chloride chose Cl− = 11.20 mg/(m2·day) [29]. Then, the corrosion rate rcorr was increased from 3.00 μm/year to 10.12 μm/year and from 30 μm/year to 38.00 μm/year; see Table 2.
Finally, the parameters for splashing transport mechanisms of de-icing salt were calculated, see Table 2. In this case, the value of rcorr (according to formula (33)) and exponent b + ∆b (according to formula (16)) are several times higher than in the previous two cases.
Long-term experimental research is being carried out on the bridge structure, measuring the actual corrosion losses (rcorr). The first measurement of corrosion losses was made in 2005, the next in 2015, 2016, 2017, and 2018 (the measurement in 2019 are not included). From the measurements, the yearly corrosion rates follow:
- rcorr = 130.38 µm/year (2005–2015),
- rcorr = 169.40 µm/year (2015–2016),
- rcorr = 204.26 µm/year (2016–2017),
- rcorr = 183.78 µm/year (2017–2018).
A splashing transport mechanism on the bridge due to poor drainage solutions (the same level of pavement and cornices causes melted snow to flow with chloride ions from de-icing salts during the winter season) was seen. The measurement of real corrosion losses confirms the legitimacy of using the minimum and maximum values considered in a parametric study (rcorr, min = 81.41 μm/year, rcorr, min = 158.88 μm/year) because the real corrosion losses may be greater.
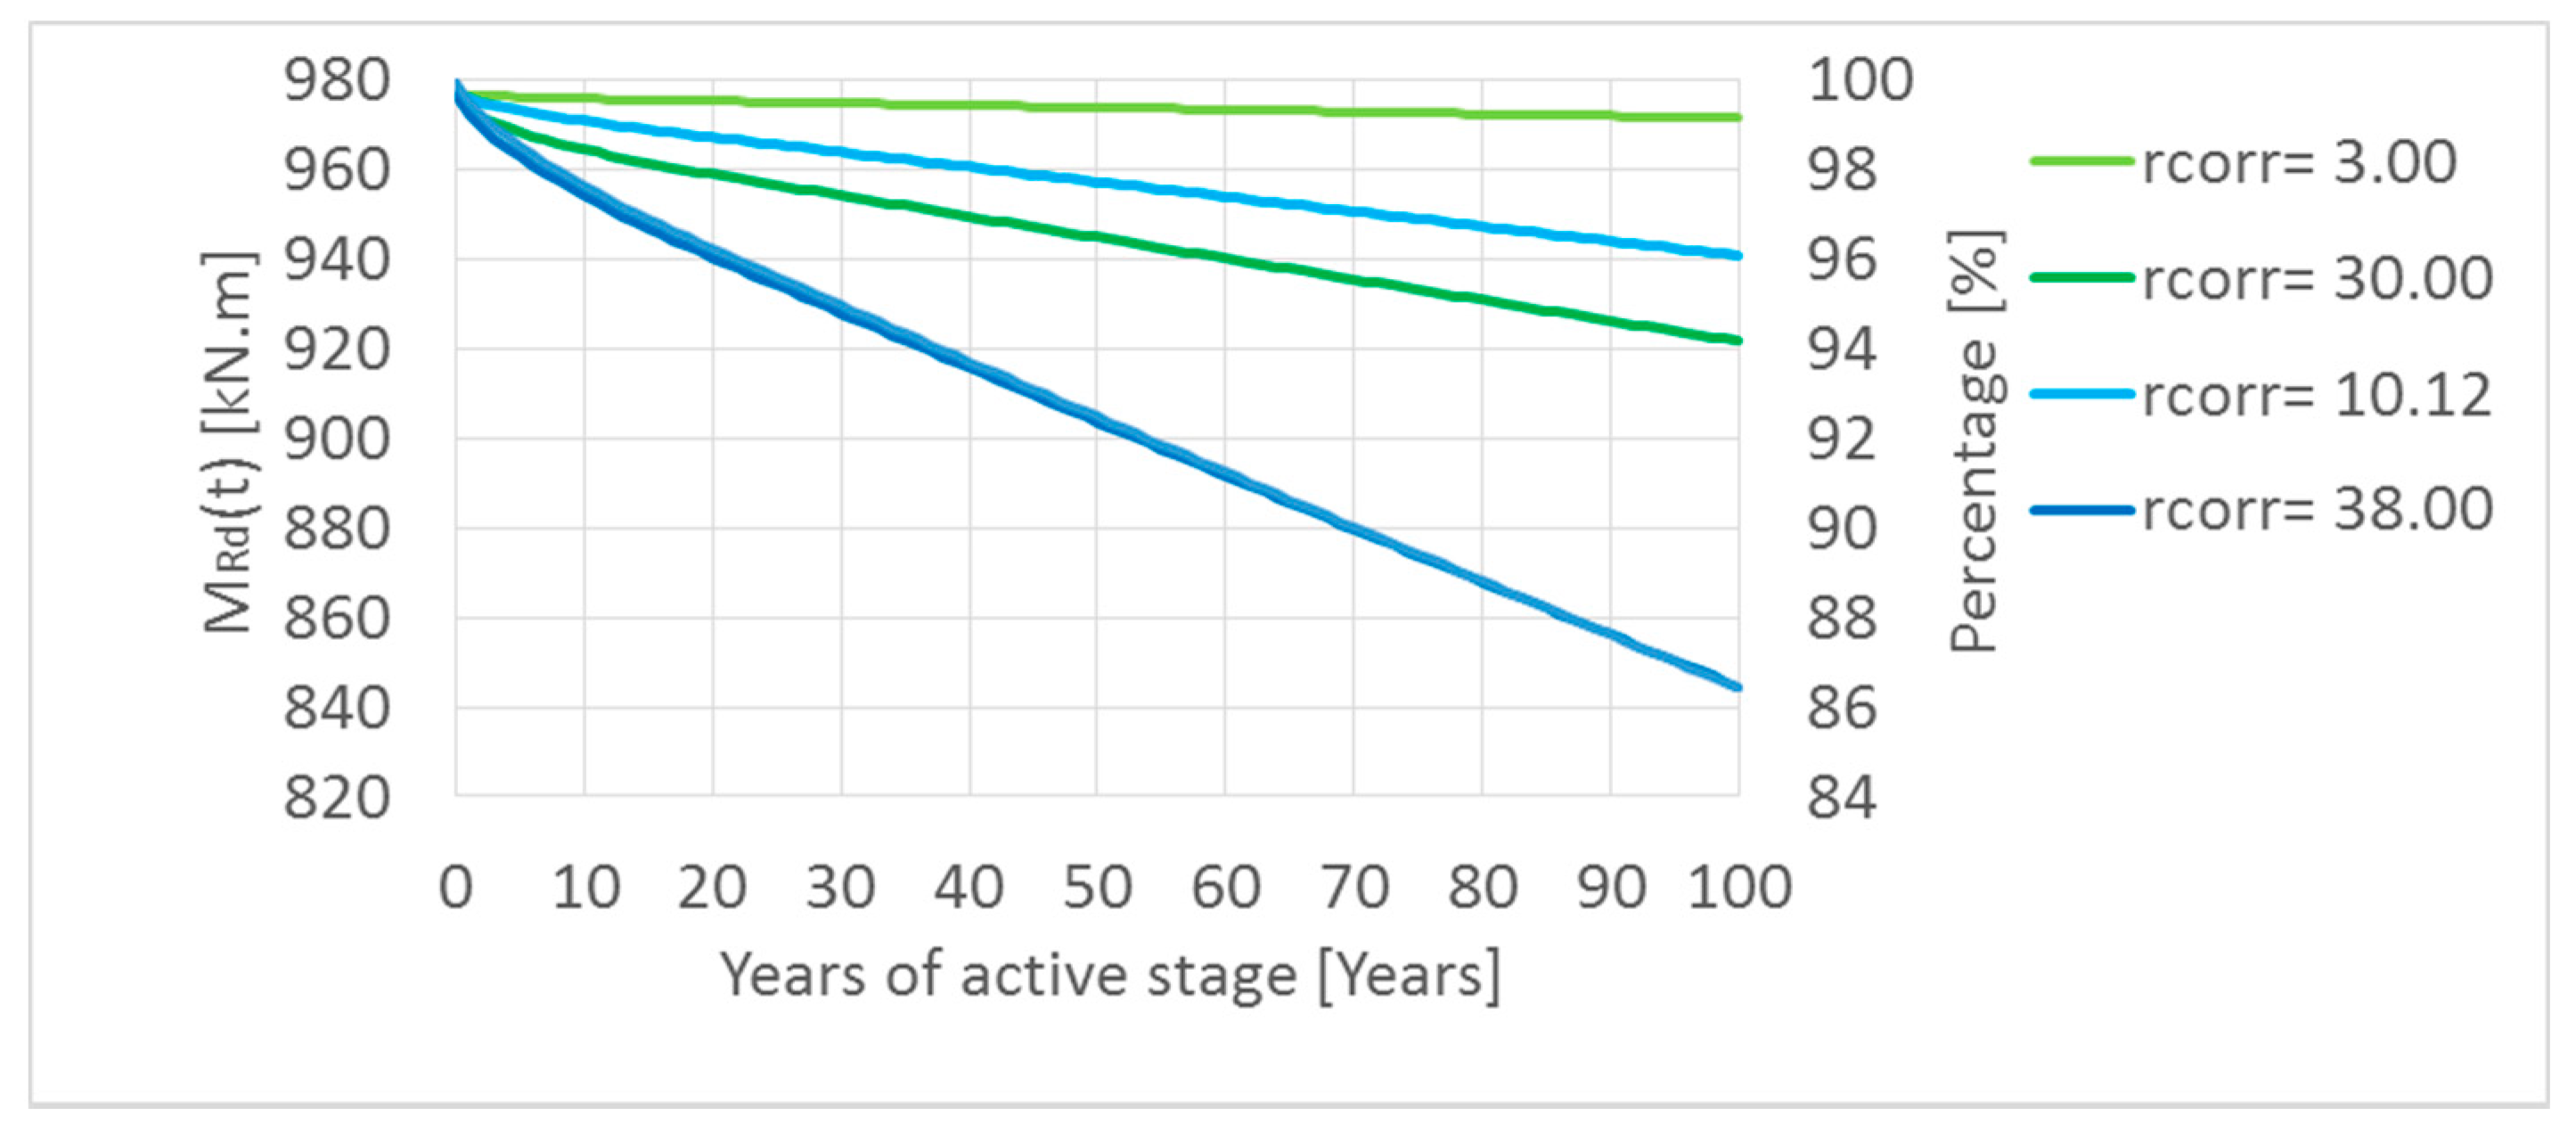
A parametric study was done taking into account minimum and maximum calculated first-year corrosion rate rcorr in Slovakia since 2004. The results are shown in Figure 10 and Figure 11. In the parametric study, for simplifying, the length of the passive stage (t0) was neglected, so it means that the reinforcement corrosion starts at the beginning. By means of parametric study, the main aim was to express the influence of reinforcement corrosion on a possible decrease of resistance of the element—by neglecting the passive stage, extreme values were obtained. The length of the passive stage depends mainly on the aggressiveness of the environment and the thickness of the covering layer, which in practice can reach values of about 10 to 40 years. However, in extreme winter conditions and very poor maintenance, the passive stage can be reduced to only about 5–15 years [2,22,27]. For this reason, firstly, the passive stage in the parametric study was neglected.
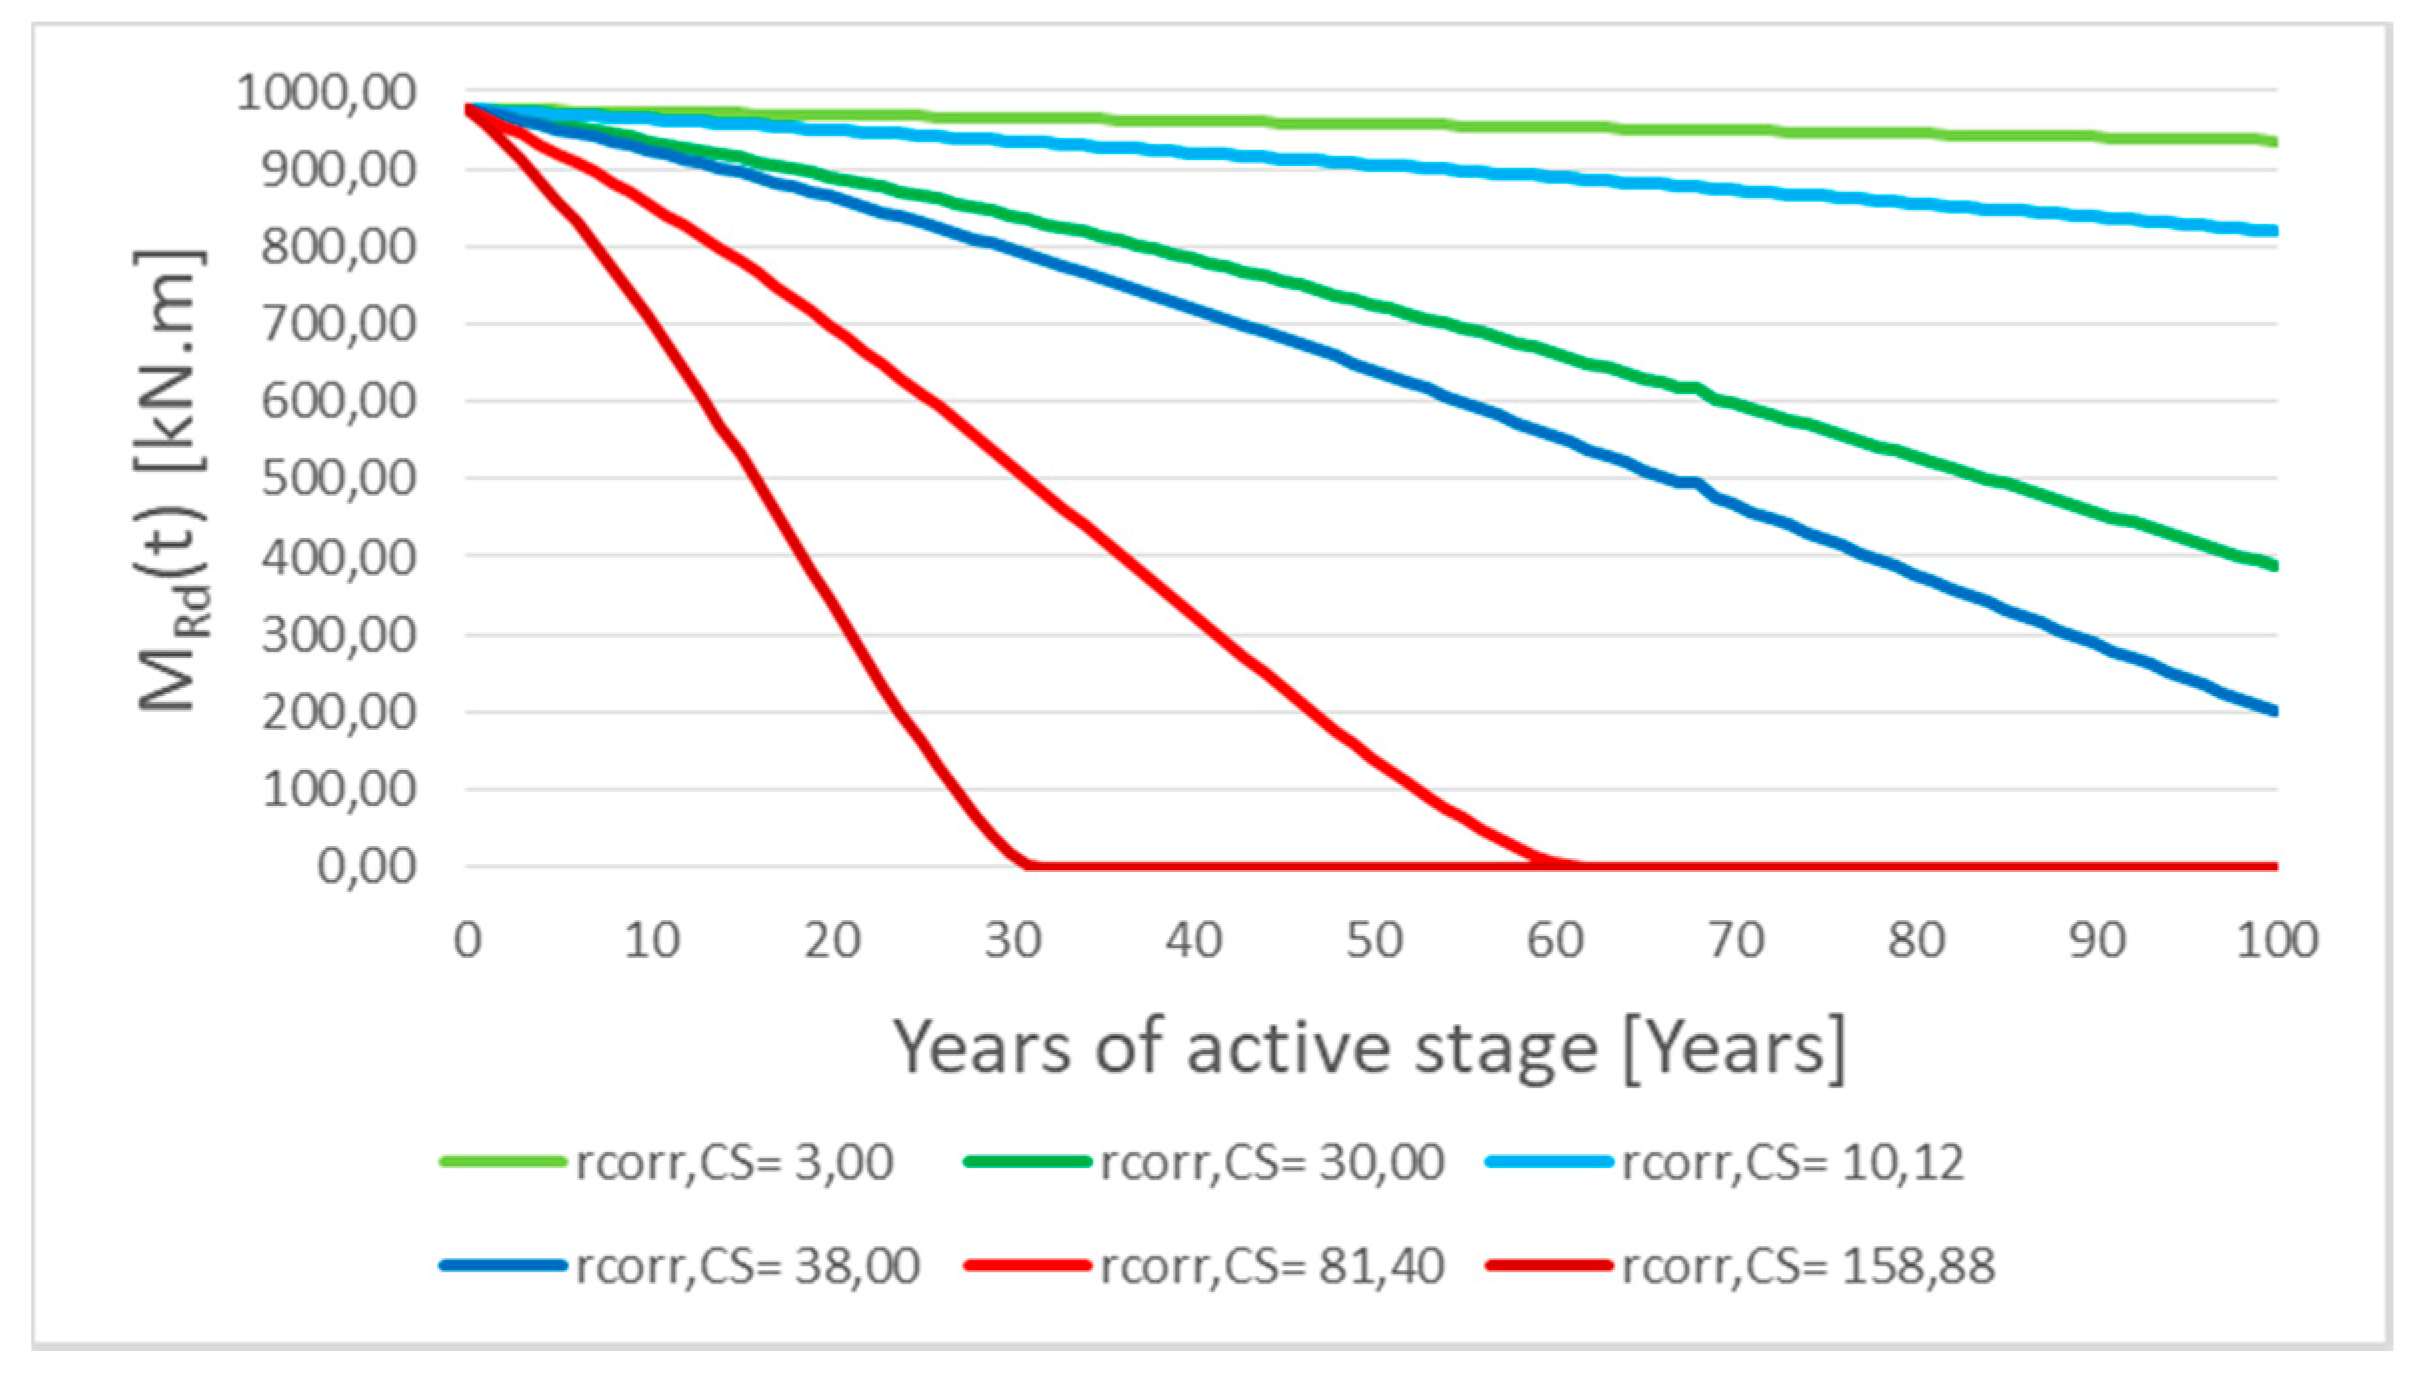
Figure 10 shows that decreasing of the moment resistance in time MRd(t) for the RC T-beam bridge, with the cross-section described above, is relatively very low (from 99.40% to 94.30% of the basic initial value of MRd(t) in time t = 0), which represents inland areas where the salinity is very low (green lines in the graph).
In the case of spraying transport mechanisms of de-icing salt, the moment resistance after one hundred years of corrosion of reinforcement has been decreased by only 4% in areas where the first-year corrosion rate rcorr is lower by 14% (up to 86%) in areas with the upper value of rcorr; see Figure 10 (blue lines) in the graph.
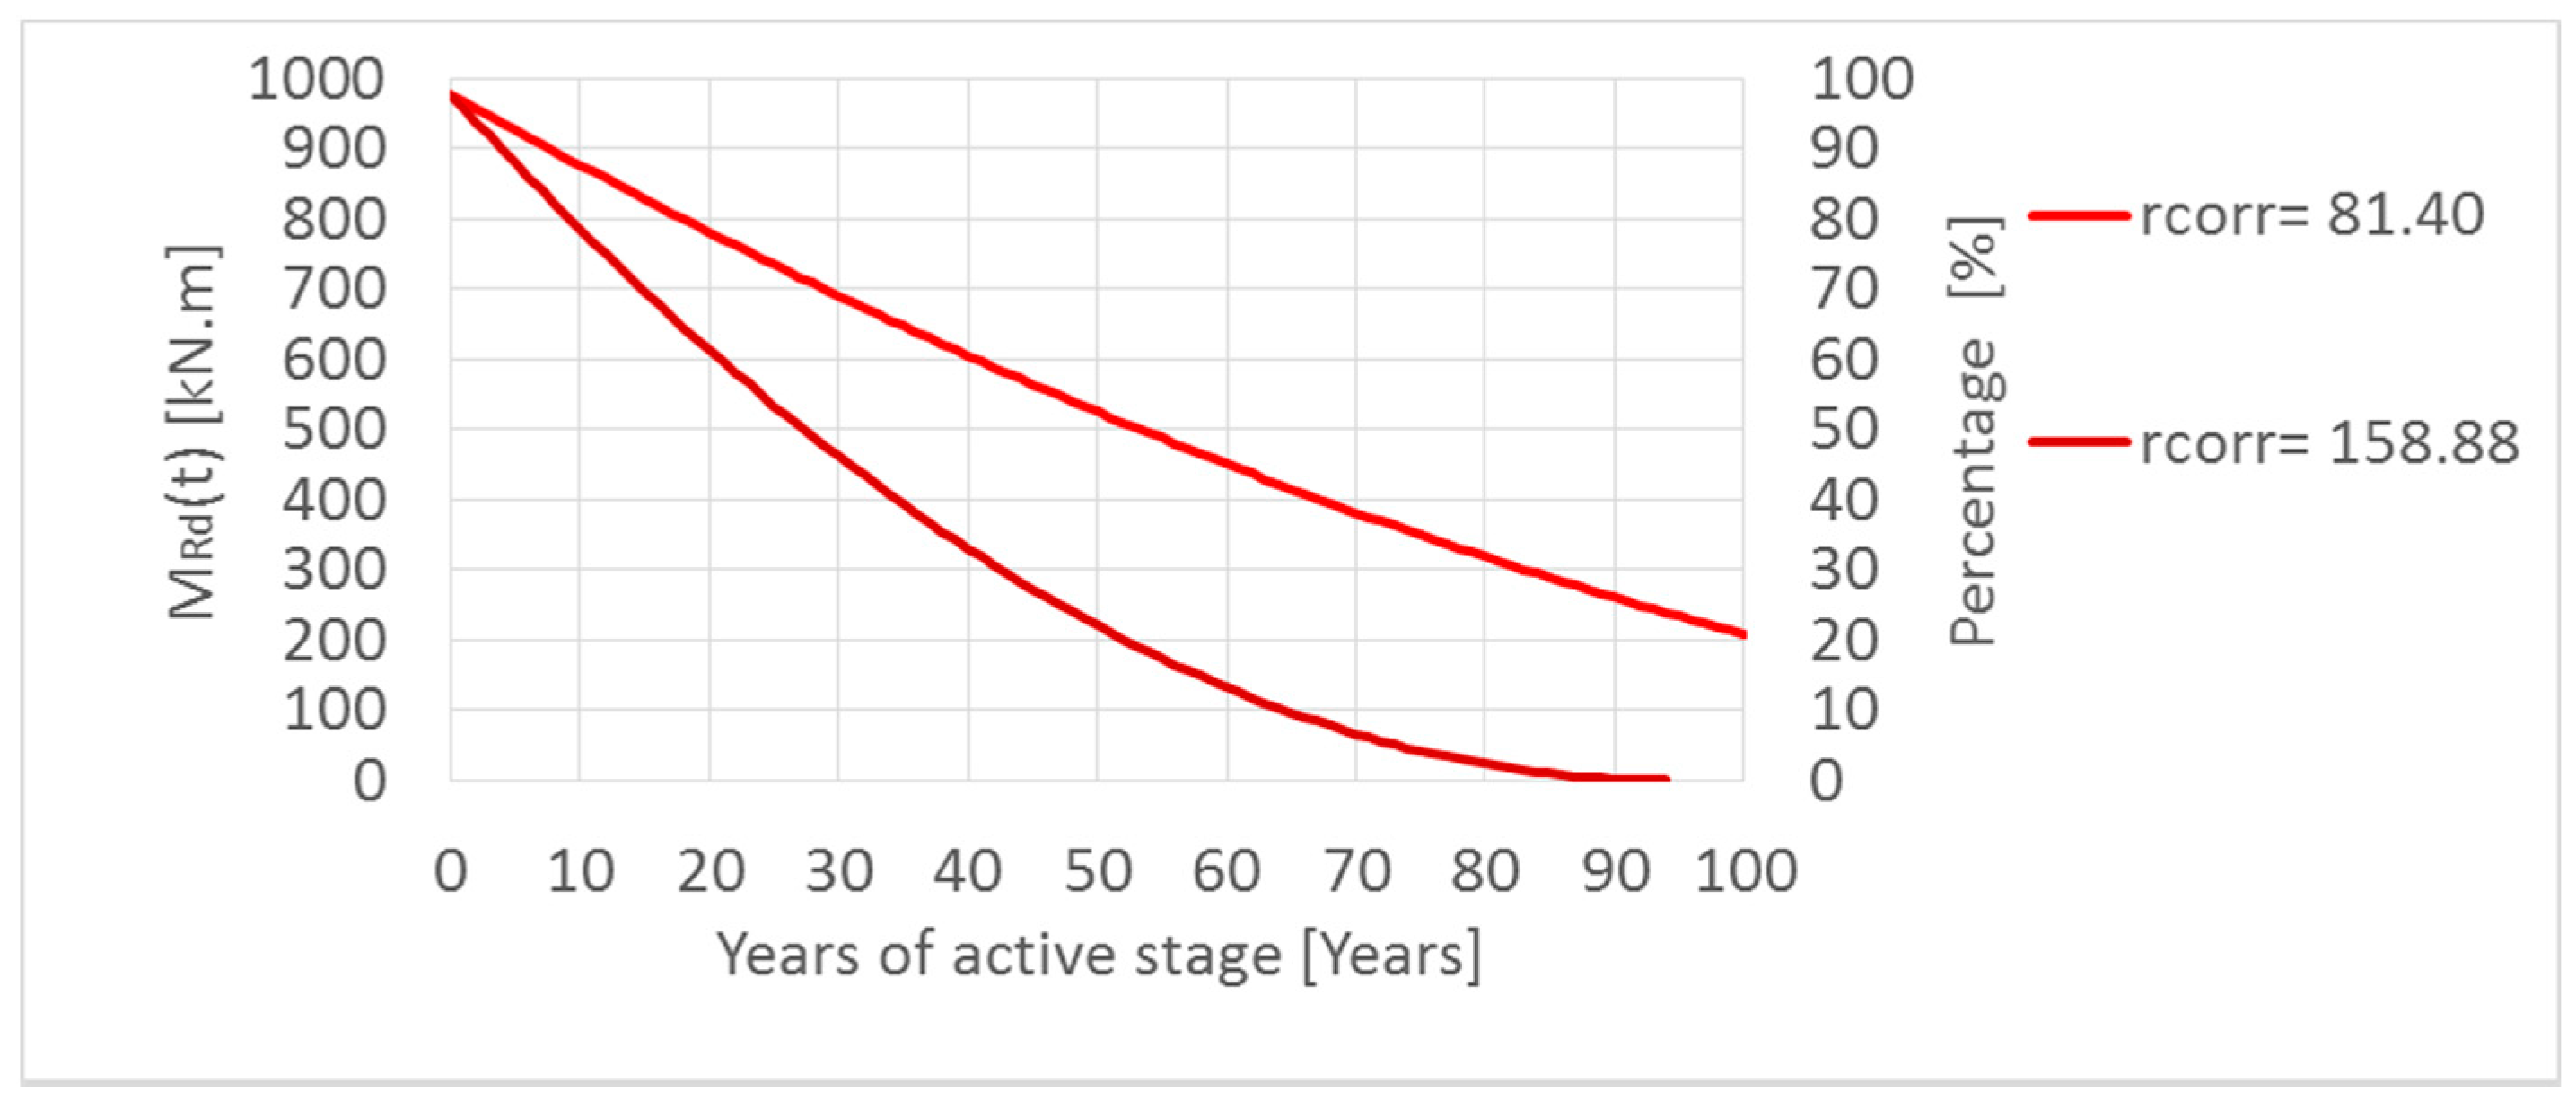
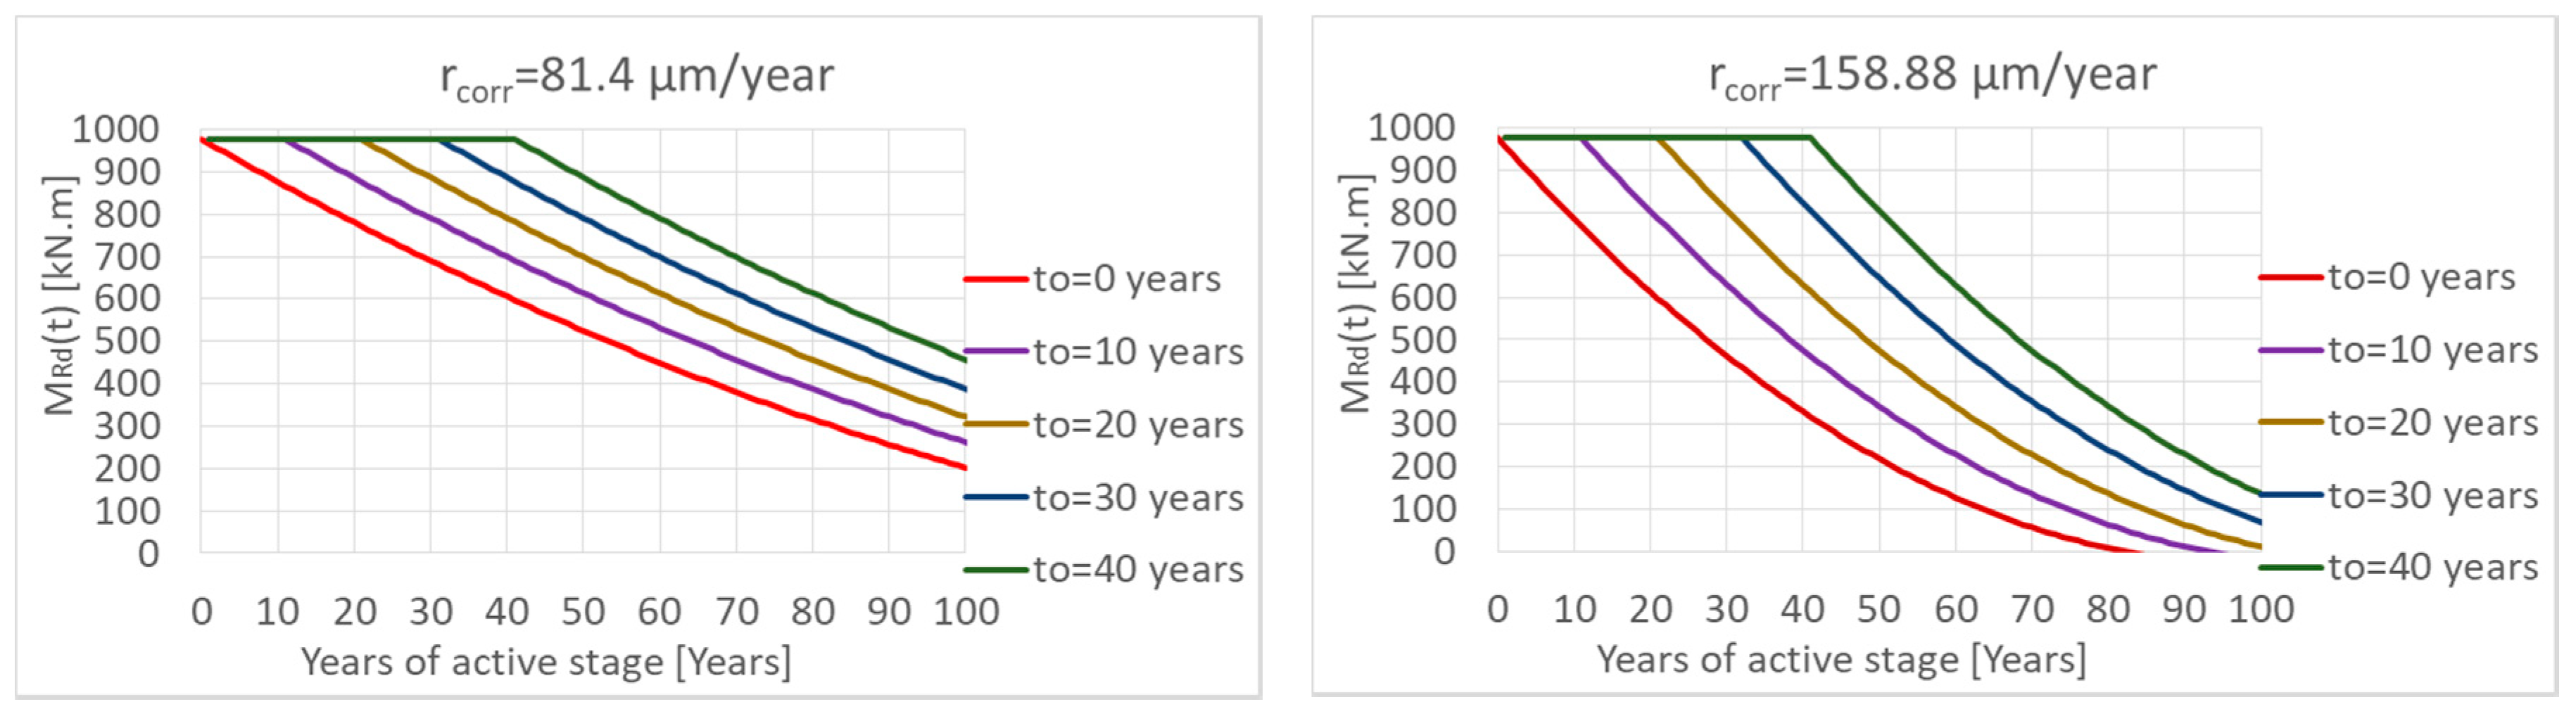
In the case of splashing transport mechanism, the moment resistance has been significantly decreased (Figure 11). Only in the first fifty years of the corrosion (active stage tas) was the moment resistance 60% or 24% depending on considered values rcorr. If the reinforced concrete member has been projected at 80% of their capacity (G = 0.8), conditions (3) and (4) of the reliability margin in time G(t) will be not satisfied in the first eleven or twenty years of the active stage depending on Slovak’s locality.
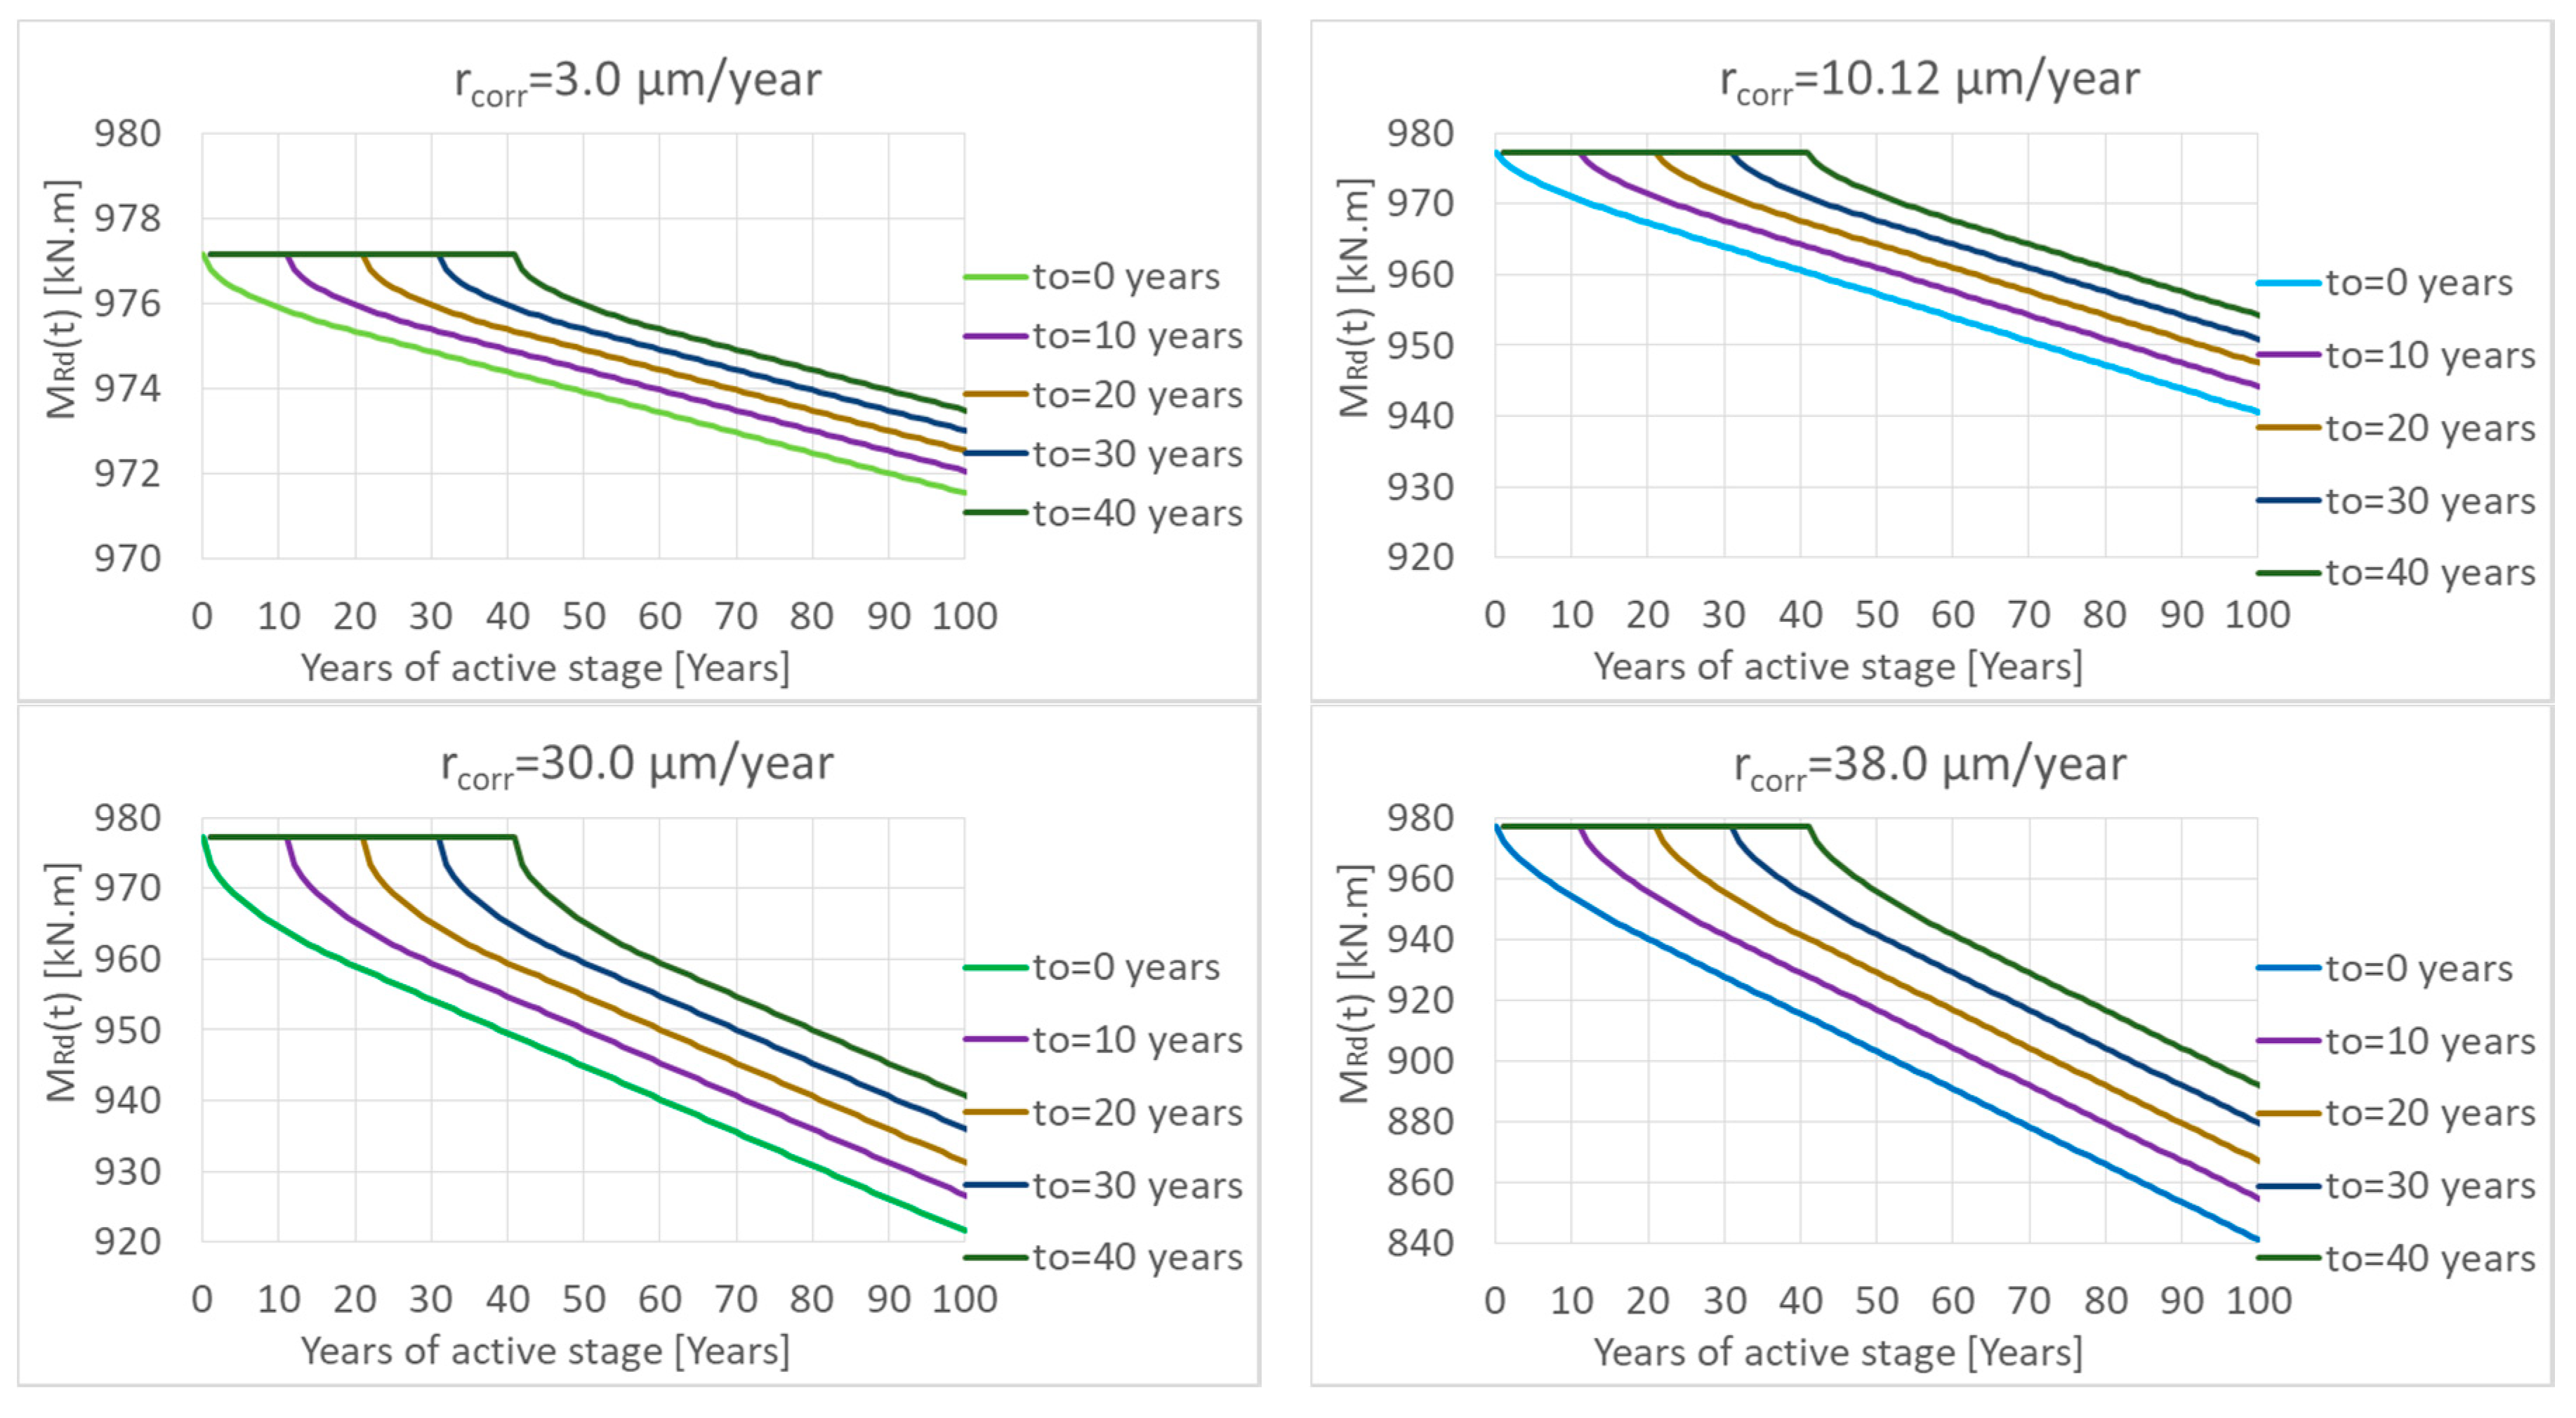
In the next parametric study, the protection of the reinforcement in concrete with a concrete cover was considered, i.e., the passive stage was taken into account. Many models for calculation of the passive stage length exist. This paper is not focused on the precise calculation of the passive stage, so the models are not presented. The length of passive stage for parametric study was only assumed in lengths 10, 20, 30, and 40 years (as was mentioned above). The results are presented in Figure 12.
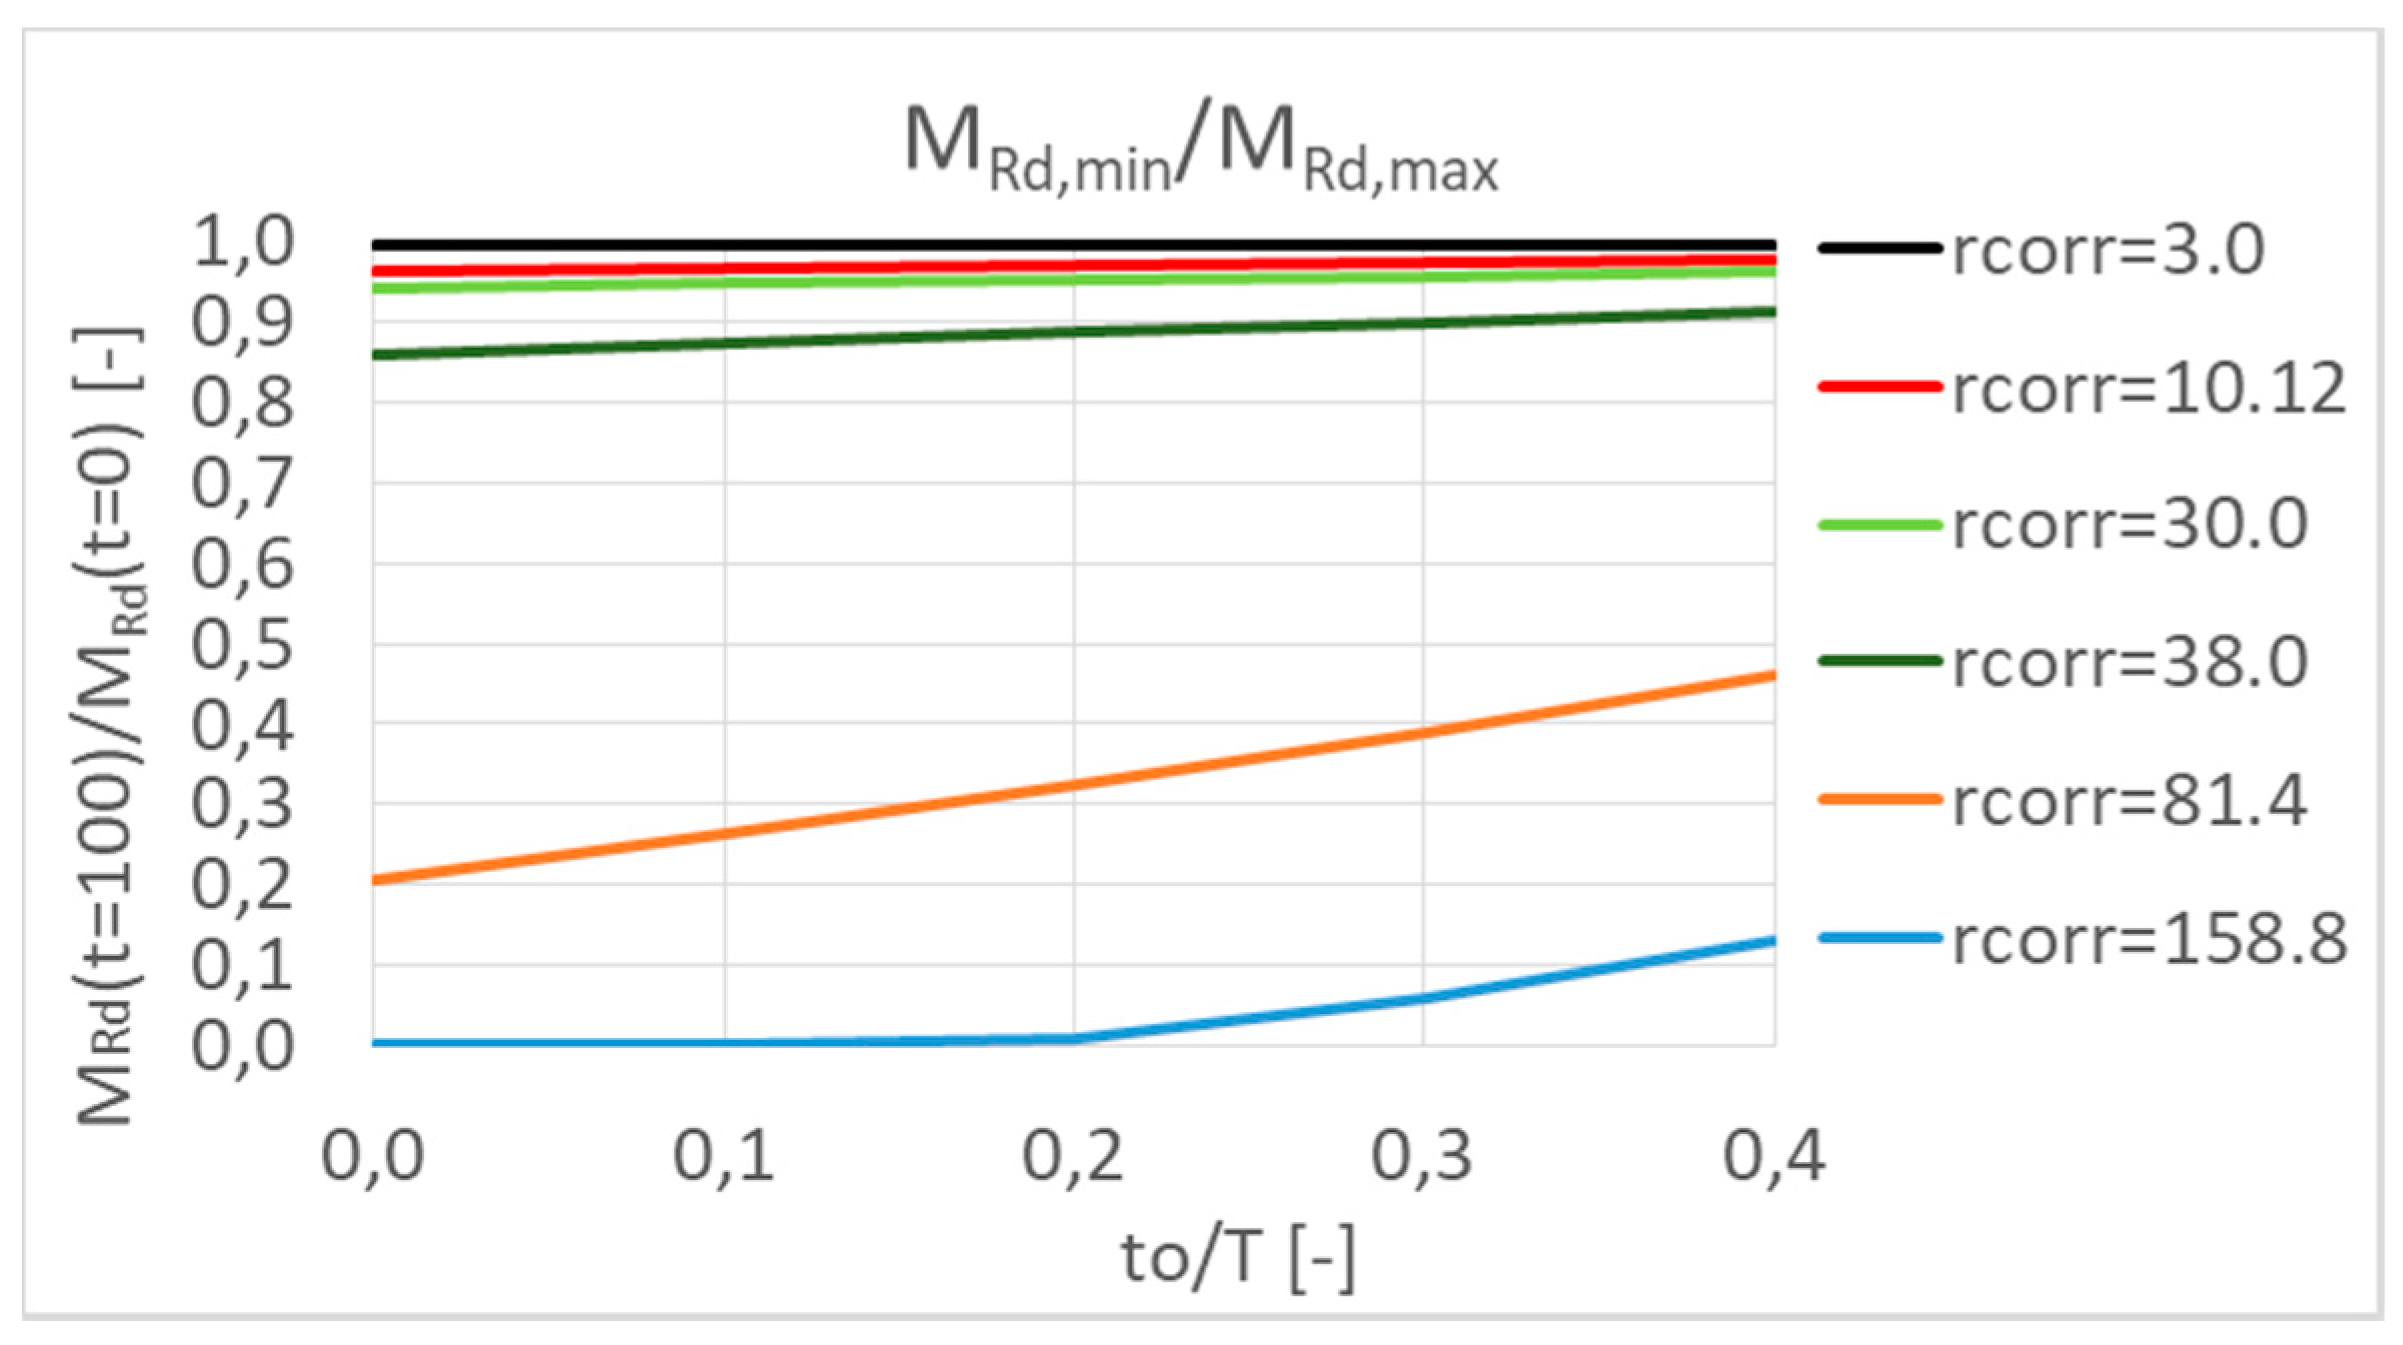
From the results, it follows that the length of passive stage has a higher influence in the case of higher values of rcorr. Because of lower rcorr values, there is also a smaller decrease in overall resistance. Increasing the passive stage length reduces the decrease in resistance by about 1% to 5%. In the case of larger rcorr values, a longer passive stage length reduces the loss of resistance by up to 13–26% (see Figure 13).
According to various literature work, pitting corrosion has a greater effect on the change in resistance than surface corrosion due to the higher rate expressed by the Rcorr parameter, which takes values from 2 to 8 [39].
In the case of pitting corrosion, the most frequently considered shape of a pit is semi-spherical (see Figure 2b), and the pitting penetration p(t) is equal to
or
where Rcorr is the coefficient takes into account pitting corrosion [–] and its value can be from 2 to 8 [39], θ1 is the angle in the case of pitting corrosion [°], and θ2 is the angle in the case of pitting corrosion [°].
The results take into account the pitting corrosion with Rcorr = 4 chosen as shown in Figure 14.
The results show the expected greater impact of pitting corrosion than surface corrosion. In the case of bridge structures, which are typically in a more aggressive environment with a higher rcorr value as building structures, the service life of the structure may only be about 30–40 years unless the passive stage is considered; with a passive stage, the life span may be about 40–90 years.
5. Conclusions
The article is focused on the decreasing of the moment resistance in time MRd(t) of the reinforced concrete T-beam bridge. The first-year corrosion rate of carbon steel rcorr was calculated in various areas in Slovakia using dose–response functions. Moreover, represented values of rcorr were used for the creation of corrosion maps of carbon steel in Slovakia during the time period from 2004 to 2017. On the basis of this first-year corrosion rate rcorr and the research in areas with a higher concentration of chloride deposition rate Cl−, the parametric study was done. Three conditions were simulated under which the T-beam cross-section of the bridge may occur, i.e., inland areas (Cl− < 3.00 mg/(m2·day)), spraying transport mechanisms of de-icing salt (Cl− = 11.20 mg/(m2·day), or splashing transport mechanisms of de-icing salt where yearly deposition rate of chloride is Cl− ≥ 760.50 mg/(m2·day) (see Table 2 – splashing transport mechanism). The conditions take into account a more aggressive environment along the road network, which is not able to take into account using the values measured by SHMI. The paper focuses mainly on the effect of reinforcement corrosion on the possible reduction of the moment resistance of the element in time—the passive stage was neglected. For this reason, the model neglects the influence of permeability of concrete, concrete cover thickness, pH factor of concrete, and carbonation—these parameters were not implemented in the model. Thus, possible extreme resistance values of RC elements were obtained. The model may take into account different levels of corrosion, e.g., also increased values due to a crack in the cover layer.
The results show:
- -
- the decreasing of the moment resistance in time MRd(t) is very significant in the case of splashing transport mechanisms of de-icing salt,
- -
- only after twenty years, in areas with lower first-year corrosion rate, or, after eleven years, in areas with a higher first-year corrosion rate in Slovakia; of the active stage tas, the T-beam cross-section is 80% of their capacity,
- -
- pitting corrosion has a higher influence on decreasing of the moment resistance in time MRd(t) in time—the service life of the bridge structure can be between one-third and two-thirds of the design life (not considering passive stage). If the passive stage is considered, the service life can be more than half of the design lifetime.
- -
- the corrosion maps and the parametric study also confirm that the different aggressive conditions in Slovakia affect the moment resistance in time MRd(t).
- -
- areas with less first-year corrosion rate rcorr are around the National park and areas with higher corrosion rate are e.g., around the town Nováky.
- -
- thus, if it is the same structure built in various localities in Slovakia, the moment resistance in time MRd(t) may be decreased from 99.40% to 94.30% in areas where the salinity is very low, from 96% to 86% in areas with spraying transport mechanisms of de-icing salt (due to salting roads in winter time) or from 20% to zero in areas with splashing transport mechanisms of de-icing salt.
Author Contributions
Data curation, F.B.; Formal analysis, P.K., M.S., and P.B.; Investigation, P.K., M.S., and F.B.; Methodology, M.S.; Project administration, P.K.; Supervision, P.K.; Writing—original draft, P.K.; Writing—review and editing, P.B. All authors have read and agreed to the published version of the manuscript.
Funding
This research was supported by the Slovak Research and Development Agency under contract No. APVV-14-0772, and by the Research Project No. 1/0413/18 of the Slovak Grant Agency
Conflicts of Interest
The authors declare no conflict of interest.
References
- EN 1990. Eurocode. Basis of Structural Design; CEN: Brussels, Belgium, 2002. [Google Scholar]
- Koteš, P.; Vičan, J. Recommended reliability levels for the evaluation of existing bridges according to Eurocodes. Struct. Eng. Int. 2013, 23, 411–417. [Google Scholar] [CrossRef]
- Blesk. Available online: https://www.blesk.cz/clanek/regiony-praha-praha-zpravy/510377/rana-jako-prasknuti-dvermi-trojska-lavka-podle-svedku-musela-spadnout-rychle-a-najednou.html (accessed on 3 December 2017). (in Czech).
- EN ISO 8044. Corrosion of Metals and Alloys: Basic Terms and Definitions; European commit-tee for standardization, CEN: Brussels, Belgium, 2015. [Google Scholar]
- Landolfo, R.; Cascini, L.; Portioli, F. Modeling of metal structure corrosion damage: A state of the art report. Sustainability 2010, 2, 2163–2175. [Google Scholar] [CrossRef] [Green Version]
- R. Winston Revie. Uhlig´s Corrosion Handbook Tried Edition: Glossary of Selected Terms Used in Corrosion Science and Engineering; The Electronical Society Series: New York, NY, USA, 2011; pp. 1217–1221. [Google Scholar]
- Roberdge, P.R. Handbook of Corrosion Engineering; McGraw-Hill: New York, NY, USA, 2000. [Google Scholar]
- Cavaco, E.S.; Neves, L.A.C.; Casas, J.R. On the robustness to corrosion in the life cycle assessment of an existing reinforced concrete bridge. Struct. Infrastruct. Eng. 2018, 14, 137–150. [Google Scholar] [CrossRef]
- Zhang, W.; Ye, Z.; Gu, X. Effects of stirrup corrosion on shear behaviour of reinforced concrete beams. Struct. Infrastruct. Eng. 2017, 13, 1081–1092. [Google Scholar] [CrossRef]
- Ma, Y.; Lu, B.; Guo, Z.; Wang, L.; Chen, H.; Zhang, J. Limit Equilibrium Method-based Shear Strength Prediction for Corroded Reinforced Concrete Beam with Inclined Bars. Materials 2019, 12, 1014. [Google Scholar] [CrossRef] [PubMed] [Green Version]
- Melchers, R.E.; Chaves, I.A. Durability of reinforced concrete bridges in marine environments. Struct. Infrastruct. Eng. 2019, 16:1, 169–180. [Google Scholar] [CrossRef]
- Ožbolt, J.; Oršanić, F.; Balabanić, G. Modelling processes related to corrosion of reinforcement in concrete: coupled 3D finite element model. Struct. Infrastruct. Eng. 2017, 13, 135–146. [Google Scholar] [CrossRef]
- Zhang, L.; Niu, D.; Wen, B.; Luo, D. Concrete Protective Layer Cracking Caused by Non-Uniform Corrosion of Reinforcements. Materials 2019, 12, 4245. [Google Scholar] [CrossRef] [PubMed] [Green Version]
- Andisheh, K.; Scott, A.; Palermo, A.; Clucas, D. Influence of chloride corrosion on the effective mechanical properties of steel reinforcement. Struct. Infrastruct. Eng. 2019, 15, 1036–1048. [Google Scholar] [CrossRef]
- Xiong, C.; Zeng, C.; Li, Y.; Li, L.; Li, P.; Li, D. The Constitutive Relationship for Corroded Steel Bars: Model and Analysis. Materials 2019, 12, 4058. [Google Scholar] [CrossRef] [PubMed] [Green Version]
- EN 1992-1-1 Eurocode 2. Design of Concrete Structures—Part 1-1: General Rules and Rules for Buildings; European Committee for Standardization: CEN: Brussels, Belgium, 2006. [Google Scholar]
- EN 1992-2 Eurocode 2. Design of concrete Structures—Part 2: Concrete Bridges. Design and Detailing Rules; European Committee for Standardization: CEN: Brussels, Belgium, 2006. [Google Scholar]
- Thoft-Christensen, P. A Reliability Based Expert System for Bridge Maintenance. In Proceedings of the Tekno Vision Conference on Bridge and Road Maintenance Management Systems, Copenhagen, Denmark, May 1992; pp. 25–26. [Google Scholar]
- Andrade, C.; Sarria, J.; Alonso, C. Corrosion rate field monitoring of post-tensioned tendons in contact with chlorides. In Proceedings of the Conference Durability of Building Materials and Components 7, Stockholm, Sweden, 19–23 May 1996; pp. 959–967. [Google Scholar]
- Bohnenkamp, K.; Burgmann, G.; Schwenk, W. Investigations of atmospheric corrosion of plain carbon and low-alloy steels in industry, country and sea air. Stahl Eisen 1973, 93, 1054–1060. [Google Scholar]
- EN ISO 9224. Corrosion of Metals and Alloys—Corrosiivity of Atmospheres—Guiding Values for The Corrosivity Categories; European Committee for Standardization, CEN: Brussels, Belgium, 2012. [Google Scholar]
- Koteš, P.; Vičan, J. Influence of reinforcement corrosion on moment and shear resistance in time of RC bridge girder. In Proceedings of the eighth international conference on bridge maintenance, safety and management (IABMAS 2016), Foz do Iguaçu, Brazil, 26–30 June 2016; pp. 1923–1928. [Google Scholar]
- EN ISO 9223. Corrosion of metals and Alloys—Corrosivity of atmospheres - Classification, Determination and Estimation; European Committee for Standardization, CEN: Brussels, Belgium, 2012. [Google Scholar]
- Kucera, V.; Tidblad, J.; Kreislova, K.; Knotkova, D.; Falles, M.; Reiss, D.; Kobus, J. UN/ECE ICP Materials dose–response functions for the milti-pollutant situation. Water Air Soil Pollut. Focus 2007, 7, 249–258. [Google Scholar] [CrossRef]
- EN ISO 9225. Corrosion of Metals and Alloys—Corrosivity of Atmospheres—Measurement of Environmental Parameters Affecting Corrosivity of Atmospheres; European Committee for Standardization: Brussels, Belgium, 2012. [Google Scholar]
- IPC Materials. Available online: http://www.corr-institute.se/icp-materials/web/page.aspx (accessed on 2 October 2018).
- Strieška, M.; Koteš, P. Influence of environmental pollution on degradation of materials. In Young scientist 2017, 9th International scientific conference of civil engineering and architecture; Technical University Of Košice, Faculty Of Civil Engineering: Štrbské Pleso, High Tatras, Slovakia, 2017. [Google Scholar]
- Vojany black coal power plant. Slovak Power Plants. Available online: https://www.seas.sk/vojany-thermal-power-plant (accessed on 2 October 2017).
- Krivy, V.; Kuzmova, M.; Kreislova, K.; Urban, V. Characterization of corrosion products on weathering steel bridges influenced by chloride deposition. Metals 2017, 7, 336. [Google Scholar] [CrossRef] [Green Version]
- Blomqvist, G. De-icing Salt and the Roadside Environment. Master’s Thesis, Royal Institute of Technology (KTH), Stockholm, Sweden, 2001. [Google Scholar]
- Houska, C. Deicing Salt—Recognizing the Corrosion Treat; TMR Consulting: Pittsbugh, PA USA, 2008. [Google Scholar]
- Slovak Road Administration (SRA). Available online: http://www.cdb.sk/en/road-databank.alej (accessed on 2 October 2018).
- Morcillo, M.; Almeida, E.; Rosales, B.; Uruchurtu, J.; Marrocos, M. Corrosión y Protección de Metales en las Atmósferas de Iberoamérica. Parte I - Mapas de Iberoamérica de Corrosividad Atmosférica [Corrosion and Protection of Metals in the Atmospheres of Latin America. Part I - Maps of Ibero-America of Atmospheric Corrosivity] (Proyecto MICAT, XV.1/CYTED); CYTED, Obra colectiva: Madrid, Spain, 1998. [Google Scholar]
- Morcillo, M.; Chico, B.; Alcántara, J.; Díaz, I.; Simancas, J.; De la Fuente, D. Atmospheric corrosion of mild steel in chloride, Rich environments. Questions to be answered. Mater. Corros. 2015, 66, 882–892. [Google Scholar] [CrossRef] [Green Version]
- Hou, W.; Liang, C. Eight-year atmospheric corrosion exposure of steels in China. Corrosion 1999, 55, 65–73. [Google Scholar] [CrossRef]
- Benarie, M.; Lipfert, F.L. A general corrosion function in terms of atmospheric pollutant concentrations and rain pH. Atmos. Environ. 1986, 20, 1947–1958. [Google Scholar] [CrossRef]
- EN ISO 9227. Corrosion tests in artificial atmospheres – Salt spray tests; European Committee for Standardization: CEN: Brussels, Belgium, 2012. [Google Scholar]
- Koteš, P.; Strieška, M.; Brodňan, M. Long-time measurements of reinforcement due to air pollution corrosion on reinforced girder bridge. In Proceedings of the 18th International Multidisciplinary Scientific GeoConference SGEM 2018, Albena, Bulgaria, 27 June–6 July 2018. [Google Scholar]
- Gonzales, J.A.; Andrade, C.; Alonso, C.; Feliu, S. Comparison of rates of general corrosion and maximum pitting penetration on concrete embedded steel reinforcement. Cem. Concr. Res. 1995, 25, 257–264. [Google Scholar] [CrossRef]
Figure 1.
Failures of bridges: (a) collapse of the pedestrian bridge due to corrosion of prestressing cables in city Prague, the Czech Republic [3]; (b) corrosion of reinforced concrete (RC) T-beam bridge in Kolarovice, Slovakia (2006).
Figure 1.
Failures of bridges: (a) collapse of the pedestrian bridge due to corrosion of prestressing cables in city Prague, the Czech Republic [3]; (b) corrosion of reinforced concrete (RC) T-beam bridge in Kolarovice, Slovakia (2006).

Figure 2.
Uniform corrosion of reinforcement bar (a) pitting corrosion; (b) cross-section.

Figure 3.
Locations of measurement stations and exposure stations in the project of IPC Materials [26].
Figure 3.
Locations of measurement stations and exposure stations in the project of IPC Materials [26].

Figure 4.
Average first-year mass loss ML and first-year corrosion rate of carbon steel rcorr from 1987.
Figure 4.
Average first-year mass loss ML and first-year corrosion rate of carbon steel rcorr from 1987.

Figure 5.
First-year corrosion rate of carbon steel rcorr from 2004 to 2017.


Figure 6.
Protected territories in Slovakia (a), the corrosion rate of carbon steel in 2004 (b).

Figure 7.
Sum of the monthly values of SO2,air concentration from 2004 to 2017; (a) and sum of values of sulfur dioxide concentration SO2,air in some selected locations in Slovakia (b).
Figure 7.
Sum of the monthly values of SO2,air concentration from 2004 to 2017; (a) and sum of values of sulfur dioxide concentration SO2,air in some selected locations in Slovakia (b).

Figure 8.
Grading system of the bridge under SRA in 2004 (a) and in 2017 (b).

Figure 9.
Cross-section of the RC T-beam bridge in Kolárovice village.

Figure 10.
Decreasing of the moment resistance in time MRd(t) by corrosion of reinforcement in the case of inland areas (green-lines) and spraying transport mechanisms of de-icing salt (blue-lines) in Slovakia.
Figure 10.
Decreasing of the moment resistance in time MRd(t) by corrosion of reinforcement in the case of inland areas (green-lines) and spraying transport mechanisms of de-icing salt (blue-lines) in Slovakia.

Figure 11.
Decreasing of the moment resistance in time MRd(t) by splashing transport mechanisms of de-icing salt in Slovakia.
Figure 11.
Decreasing of the moment resistance in time MRd(t) by splashing transport mechanisms of de-icing salt in Slovakia.

Figure 12.
Decreasing of the moment resistance in time MRd(t) by corrosion of reinforcement taking into account the passive length (10, 20, 30, and 40 years).
Figure 12.
Decreasing of the moment resistance in time MRd(t) by corrosion of reinforcement taking into account the passive length (10, 20, 30, and 40 years).


Figure 13.
Influence of the passive stage length on the minimum moment resistance in time MRd(t).

Figure 14.
Decreasing of the moment resistance in time MRd(t) taking into account the pitting corrosion.
Figure 14.
Decreasing of the moment resistance in time MRd(t) taking into account the pitting corrosion.


Table 1.
Corrosion loss in the corrosion chamber Dch approximated to the power function and the coefficient of determination R2.
Table 1.
Corrosion loss in the corrosion chamber Dch approximated to the power function and the coefficient of determination R2.
| Diameter ø | rch,first | bch | R2 |
|---|---|---|---|
| [mm] | [µm/day] | [–] | [%] |
| ø6 | 3.1357 | 1.0833 | 99.99 |
| ø10 | 3.0732 | 1.0788 | 99.98 |
| ø14 | 3.0599 | 1.0790 | 99.78 |
| ø25 | 2.9278 | 1.0721 | 99.92 |
| Average | 3.05 | 1.08 | 99.92 |
Table 2.
Basis values for the calculation of the parametric study of the moment resistance in time MRd(t) under various conditions in Slovakia.
Table 2.
Basis values for the calculation of the parametric study of the moment resistance in time MRd(t) under various conditions in Slovakia.
| Values min./max. | Inland Areas without Considering Higher Concentration of Cl− (Cl− < 3.00 mg/(m2·day)) | Spraying Transport Mechanisms of De-Icing Salt (Cl− = 11.20 mg/(m2·day)) | Splashing Transport Mechanisms of De-icing Salt (Cl− ≥ 760.50 mg/(m2·day)) | |||
|---|---|---|---|---|---|---|
| b (–) | rcorr (μm/year) | b + ∆b (-) | rcorr (μm/year) | b + ∆b (–) | rcorr (μm/year) | |
| Minimum value | 0.523 | 3.00 | 0.681 | 10.12 | 1.00 | 81.41 |
| Maximum value | 0.523 | 30.00 | 0.681 | 38.00 | 1.00 | 158.88 |
© 2020 by the authors. Licensee MDPI, Basel, Switzerland. This article is an open access article distributed under the terms and conditions of the Creative Commons Attribution (CC BY) license (http://creativecommons.org/licenses/by/4.0/).
Share and Cite
MDPI and ACS Style
Koteš, P.; Strieška, M.; Bahleda, F.; Bujňáková, P. Prediction of RC Bridge Member Resistance Decreasing in Time under Various Conditions in Slovakia. Materials 2020, 13, 1125. https://0-doi-org.brum.beds.ac.uk/10.3390/ma13051125
AMA Style
Koteš P, Strieška M, Bahleda F, Bujňáková P. Prediction of RC Bridge Member Resistance Decreasing in Time under Various Conditions in Slovakia. Materials. 2020; 13(5):1125. https://0-doi-org.brum.beds.ac.uk/10.3390/ma13051125
Chicago/Turabian StyleKoteš, Peter, Miroslav Strieška, František Bahleda, and Petra Bujňáková. 2020. "Prediction of RC Bridge Member Resistance Decreasing in Time under Various Conditions in Slovakia" Materials 13, no. 5: 1125. https://0-doi-org.brum.beds.ac.uk/10.3390/ma13051125
Note that from the first issue of 2016, this journal uses article numbers instead of page numbers. See further details here.