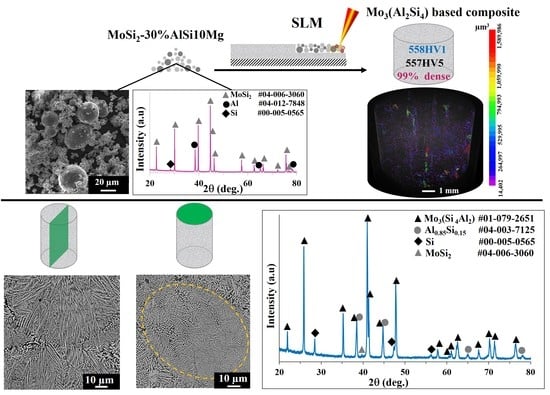
In Situ Mo(Si,Al)2-Based Composite through Selective Laser Melting of a MoSi2-30 wt.% AlSi10Mg Mixture


Abstract
:
1. Introduction
2. Experiments
2.1. Powder Preparation and Characterization
2.2. Selective Laser Melting
2.3. Bulk Characterization
3. Results and Discussion
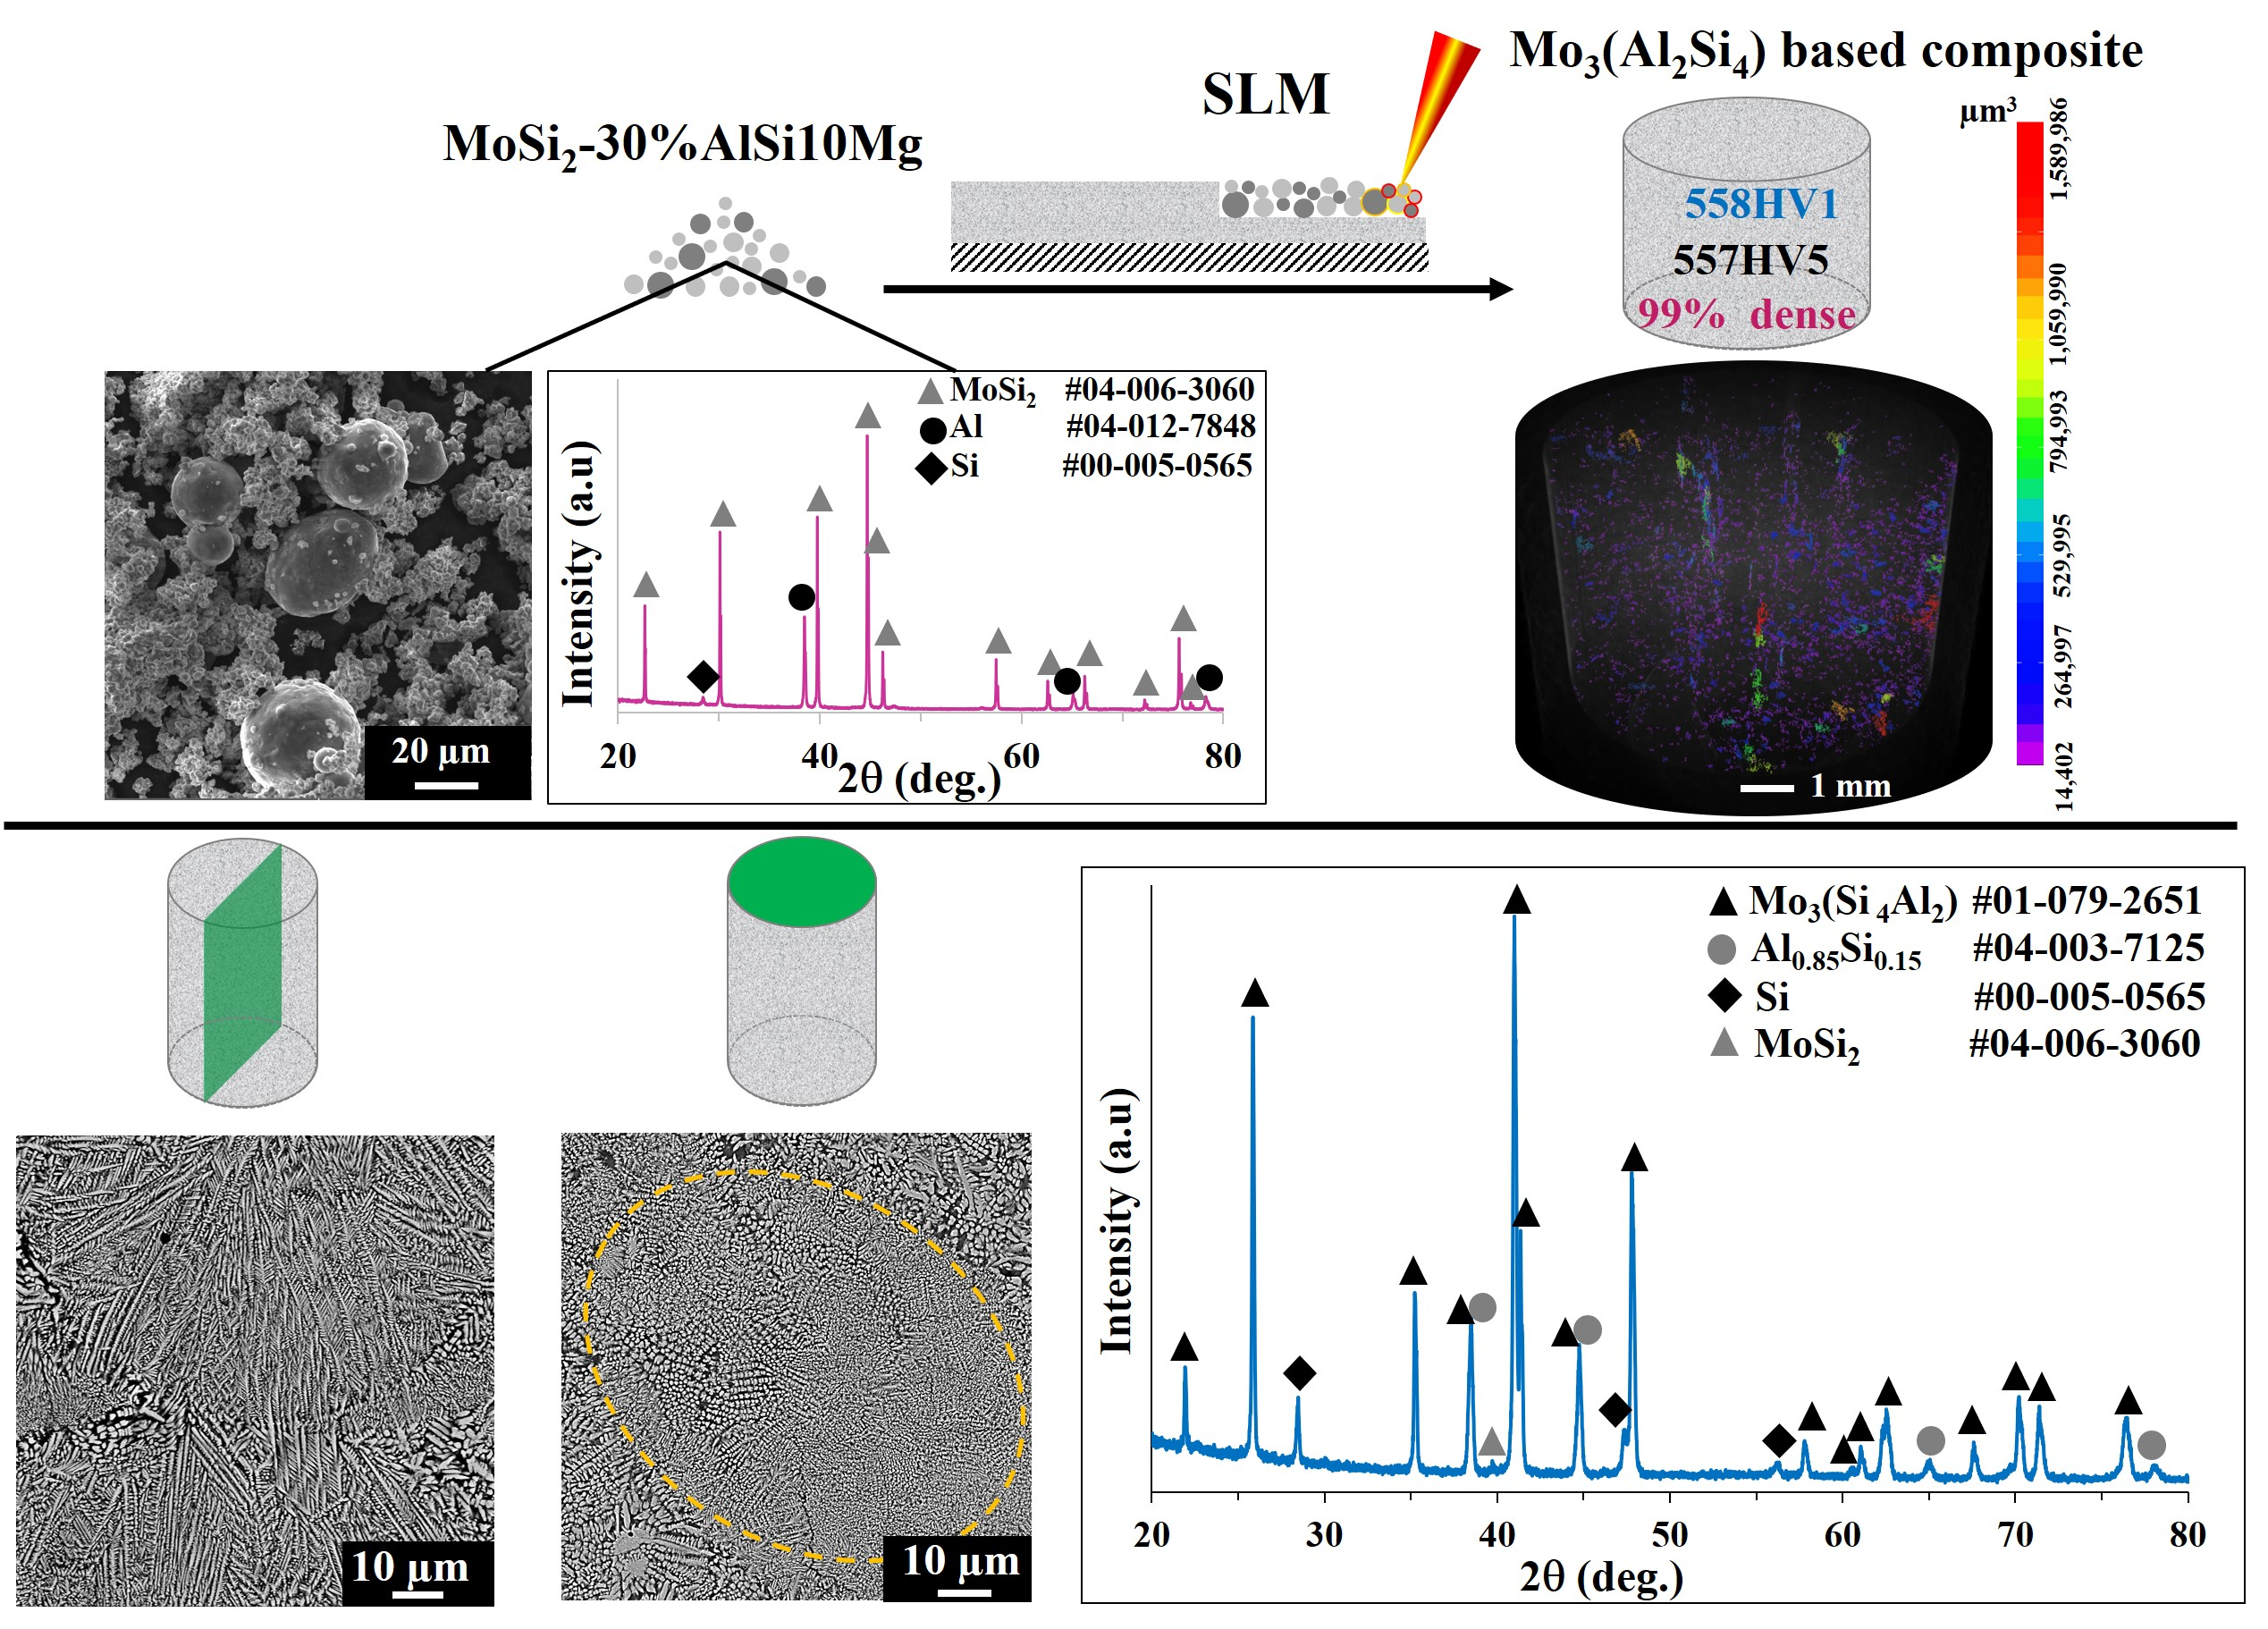
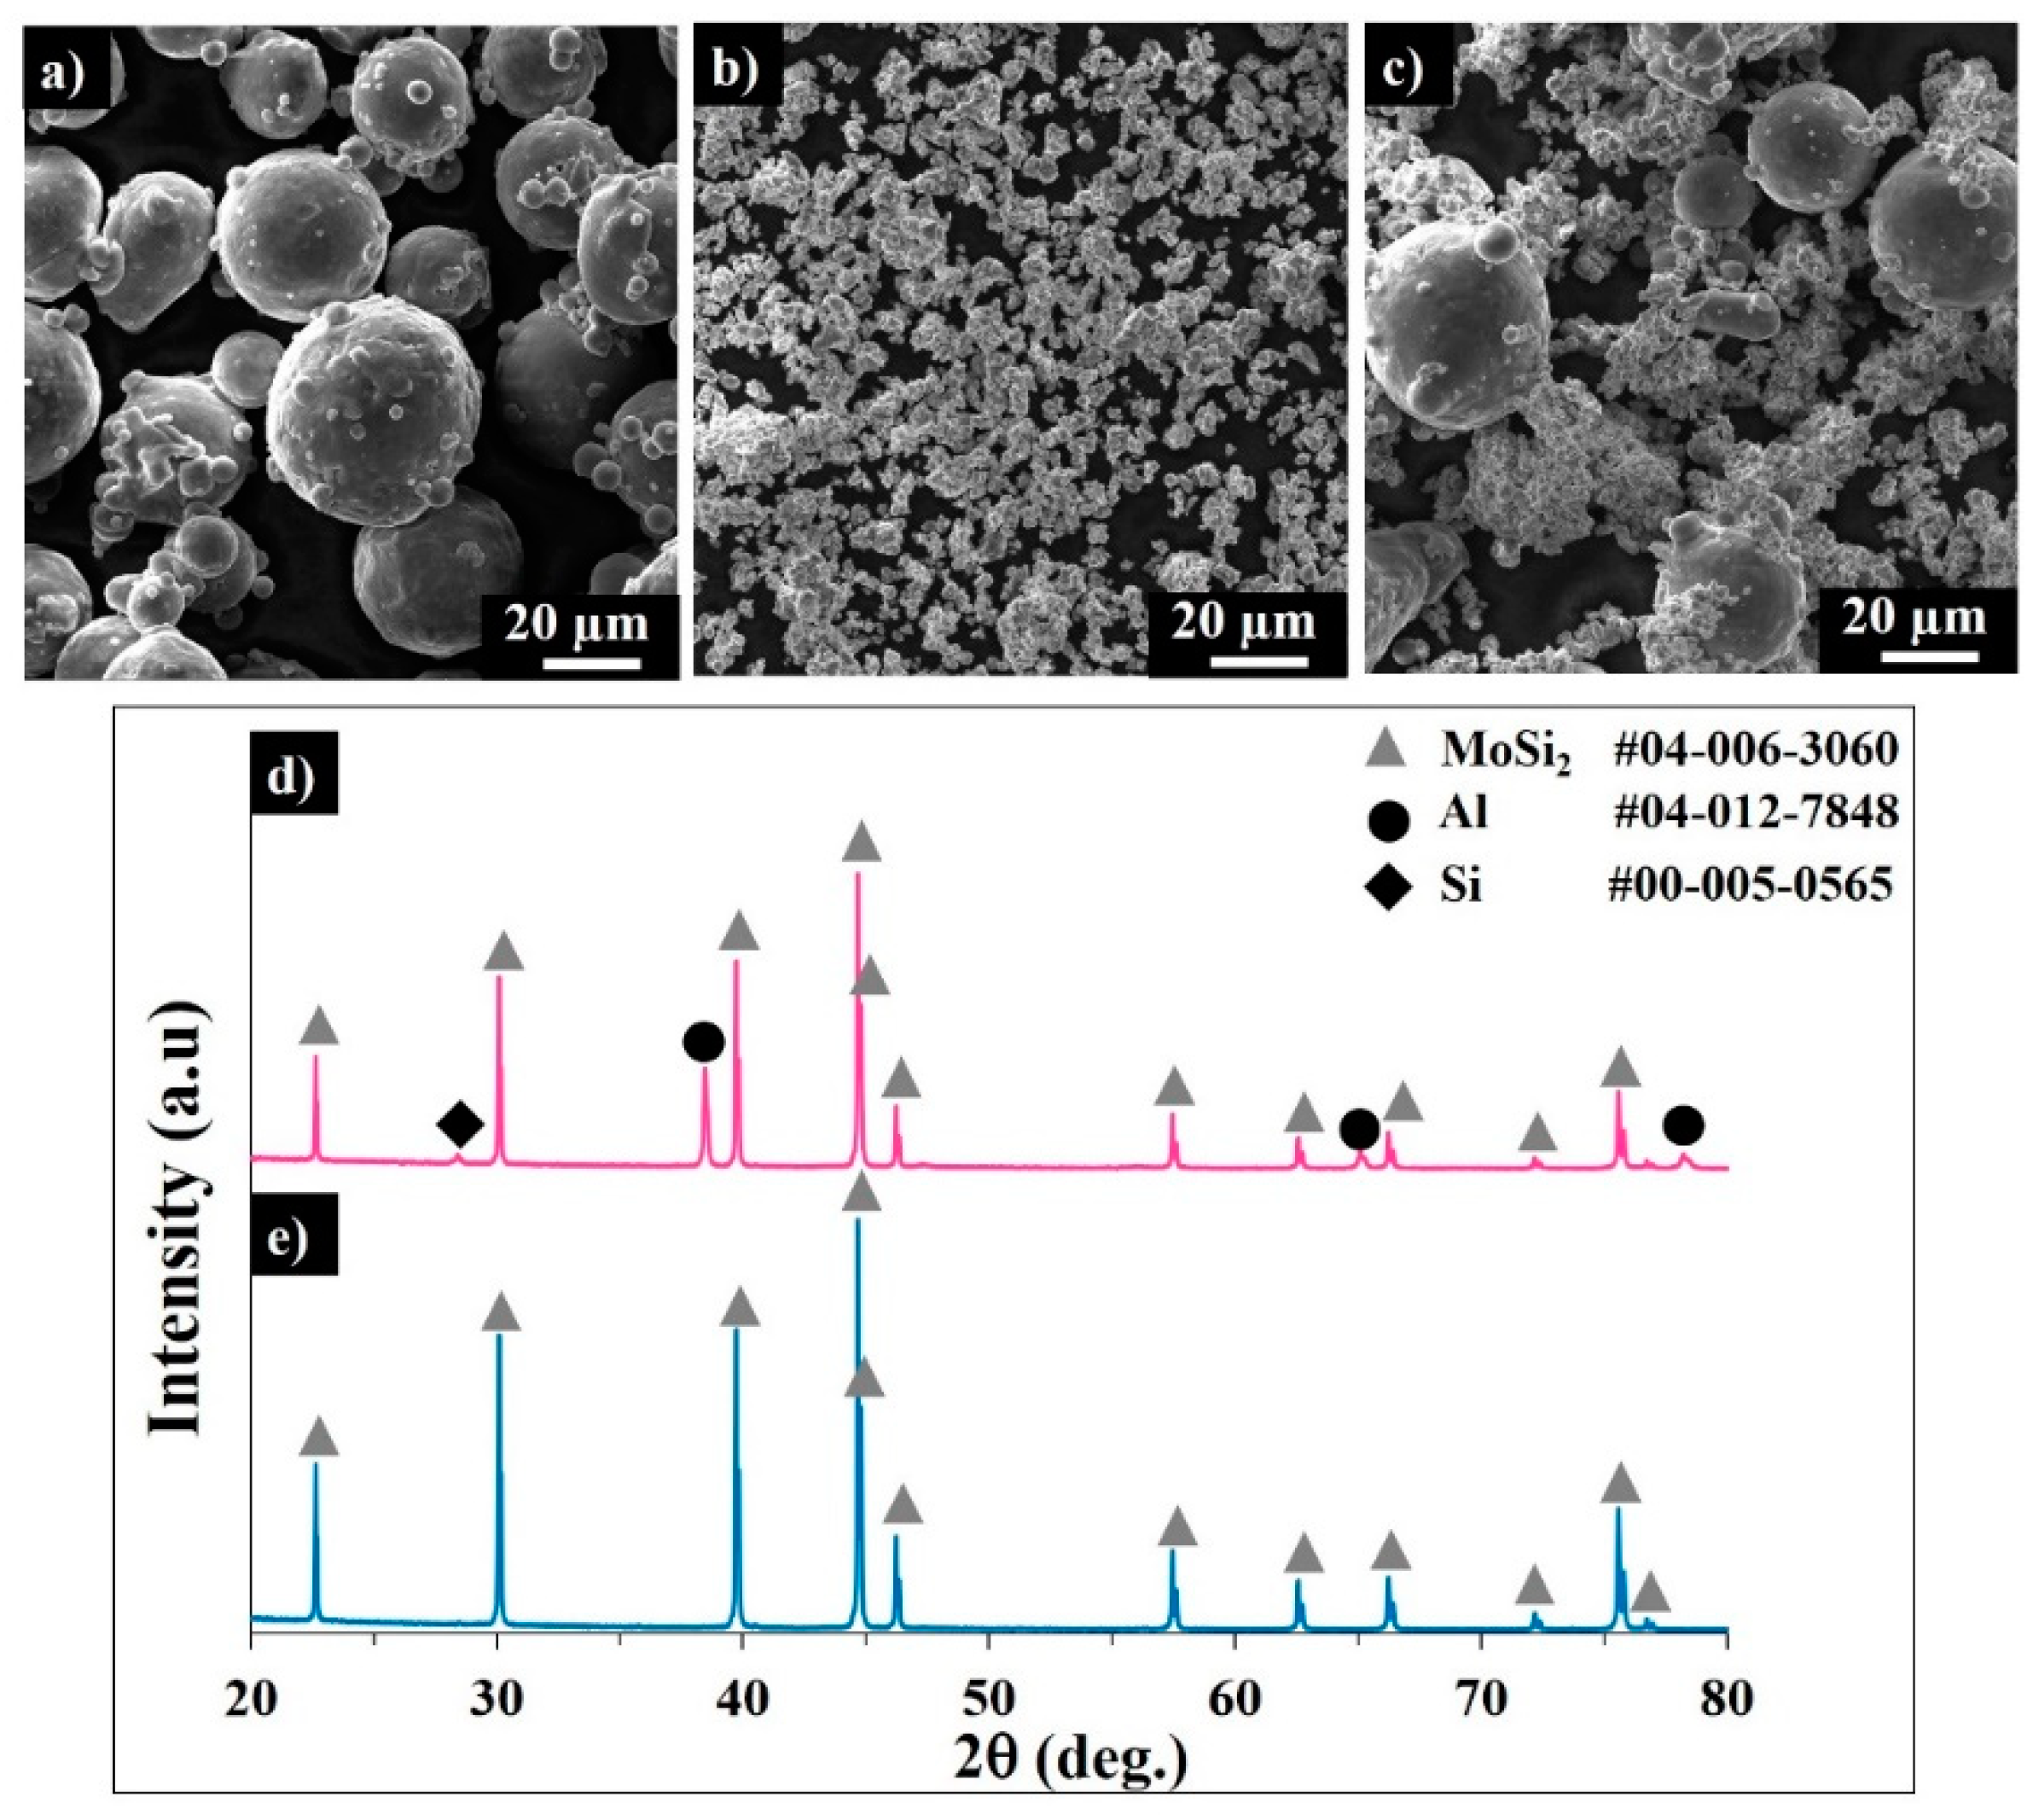
3.1. Powders
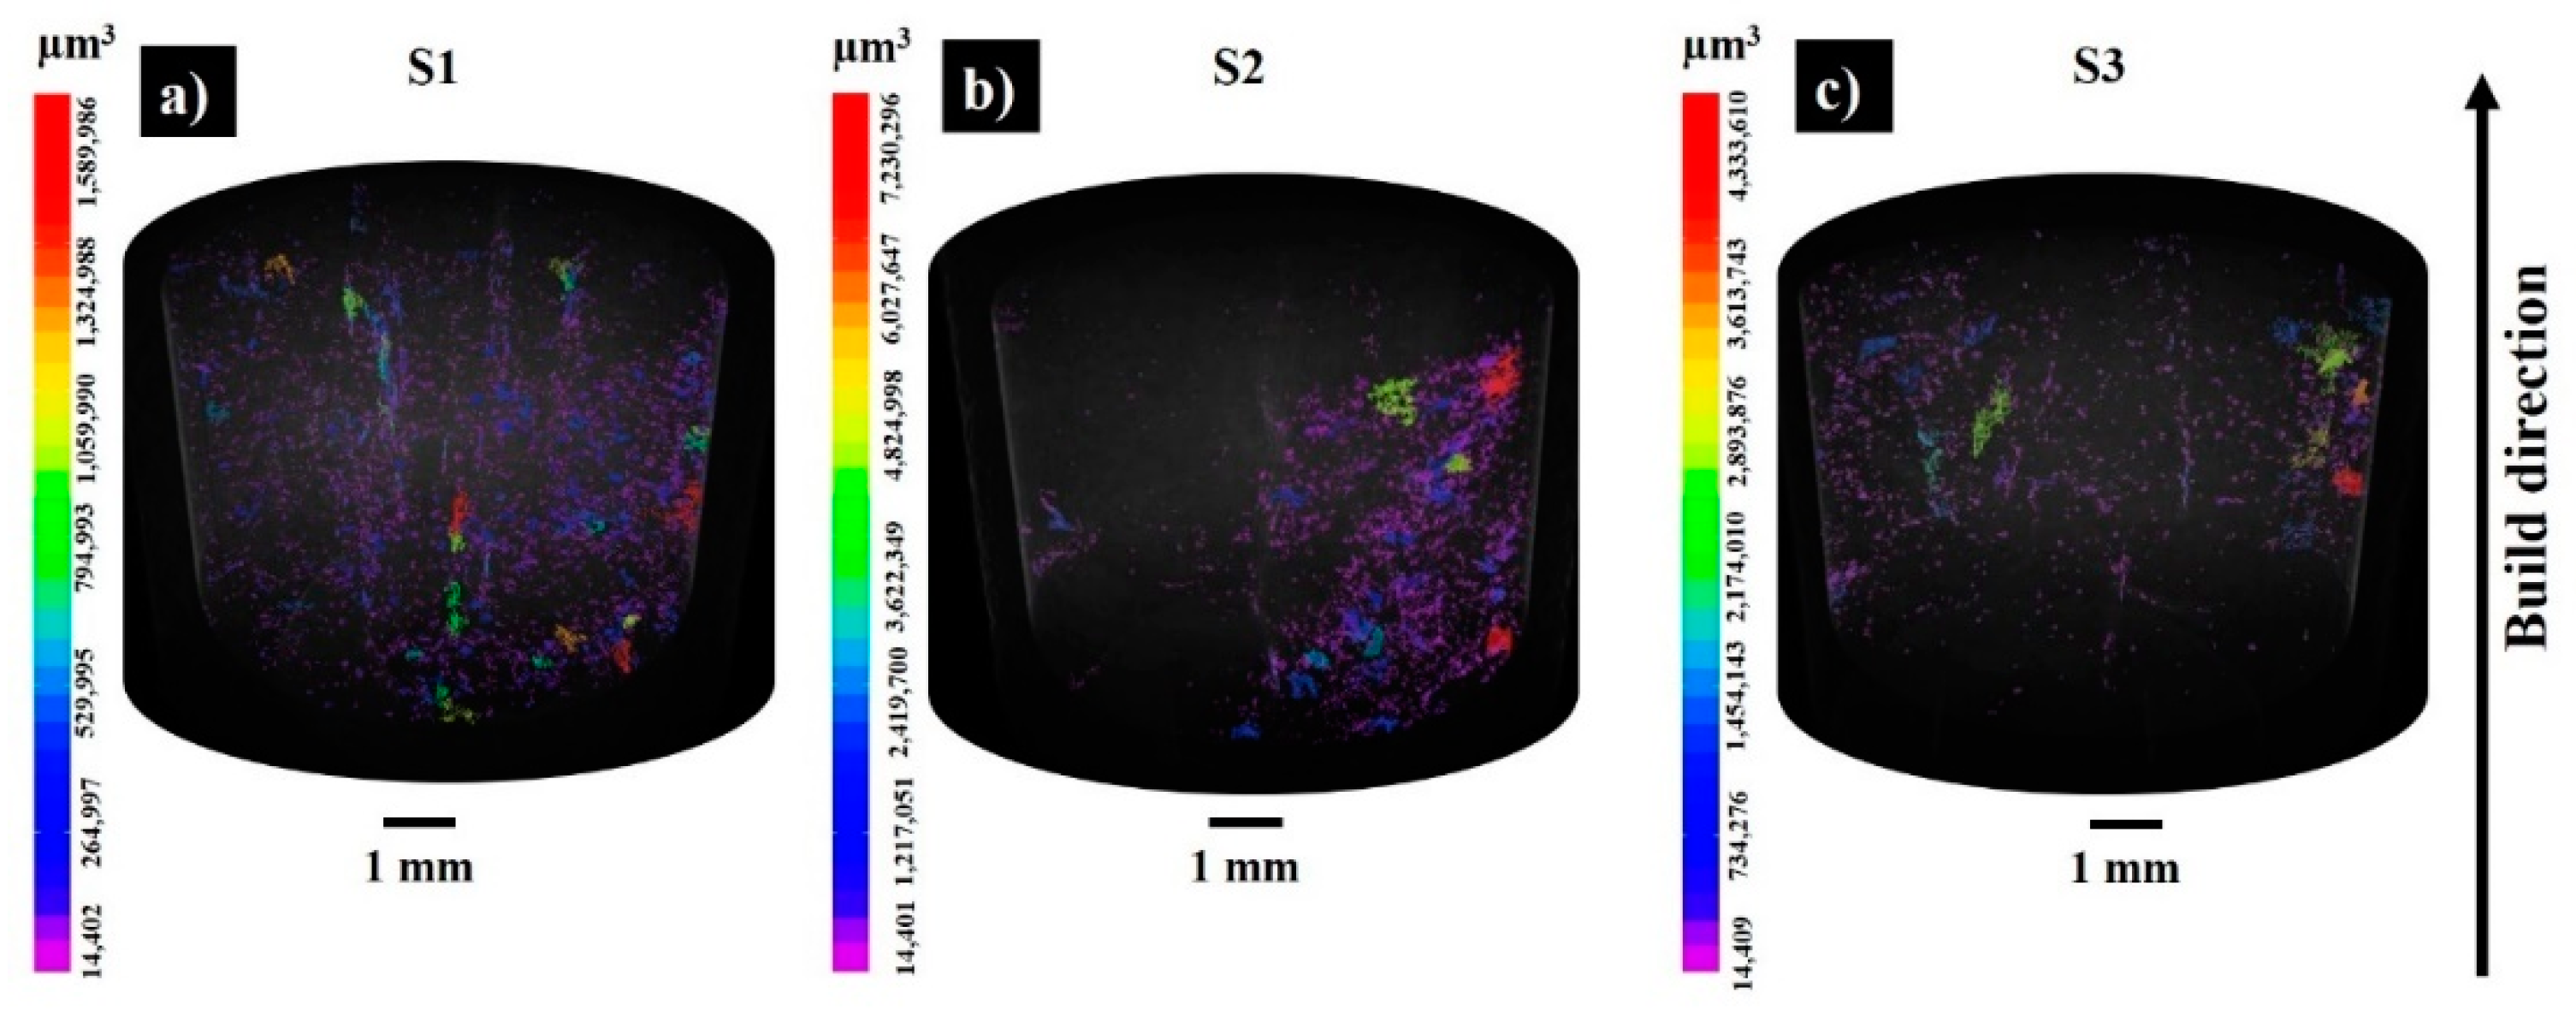
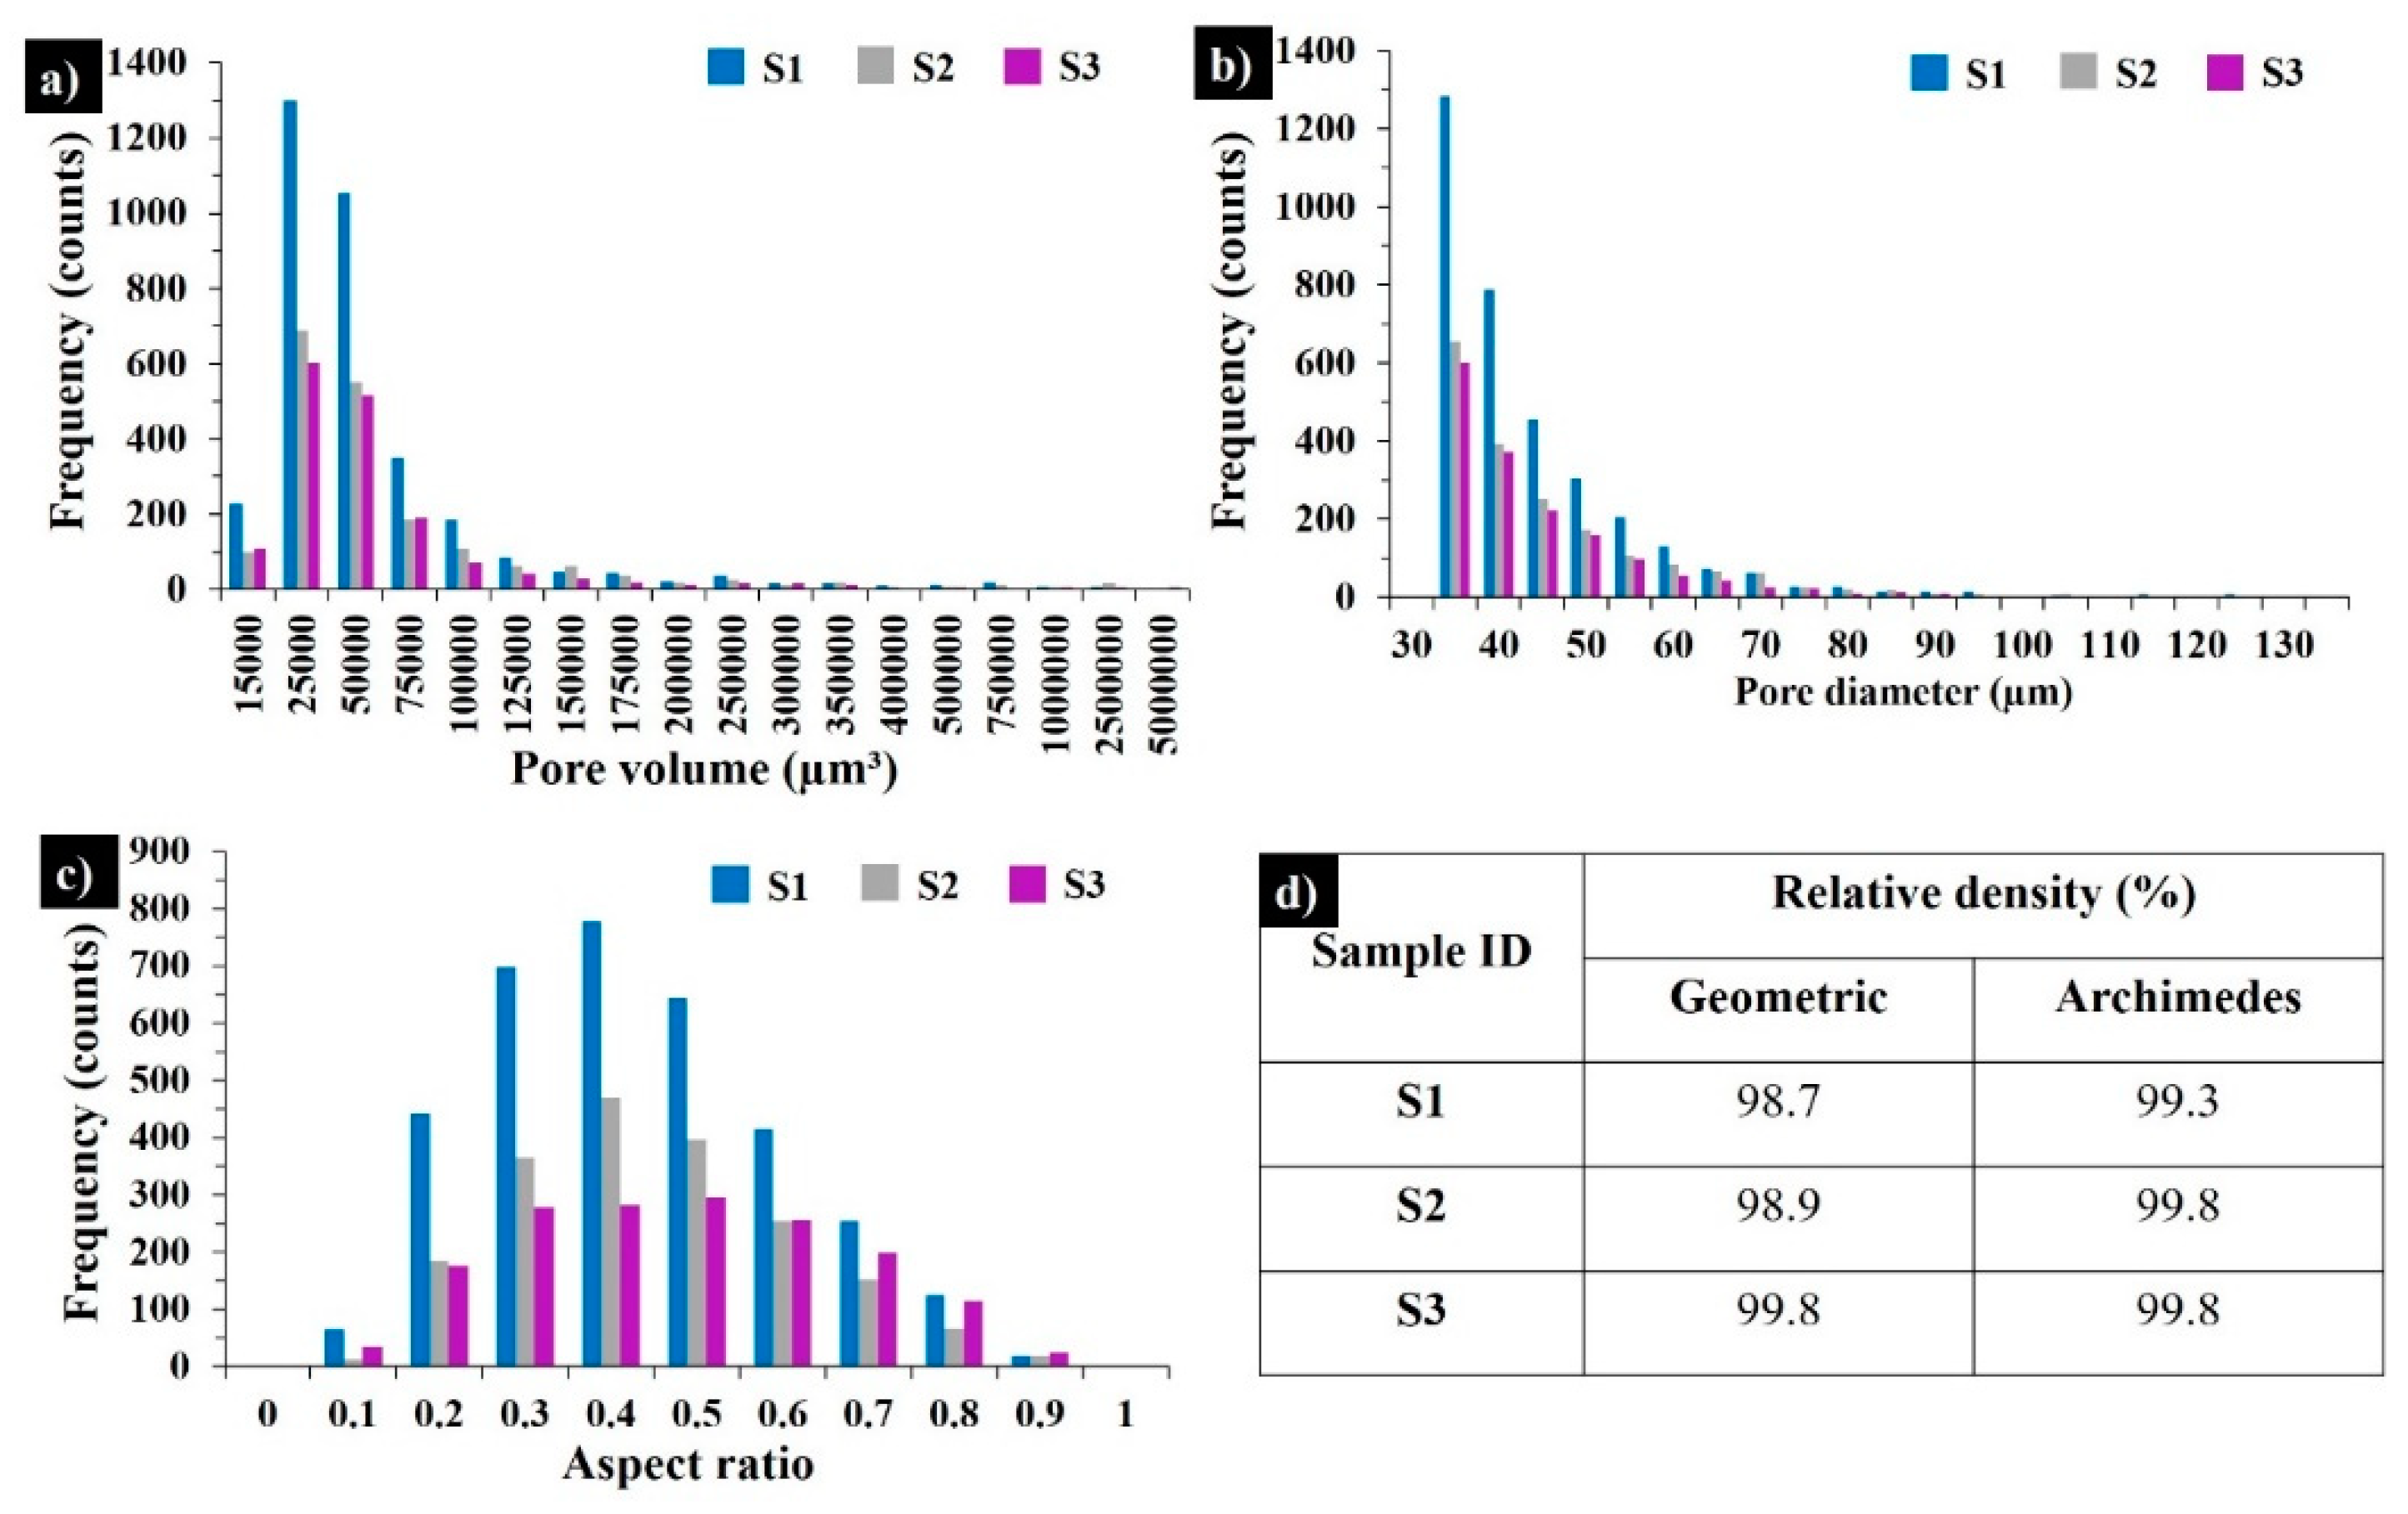
3.2. Bulks
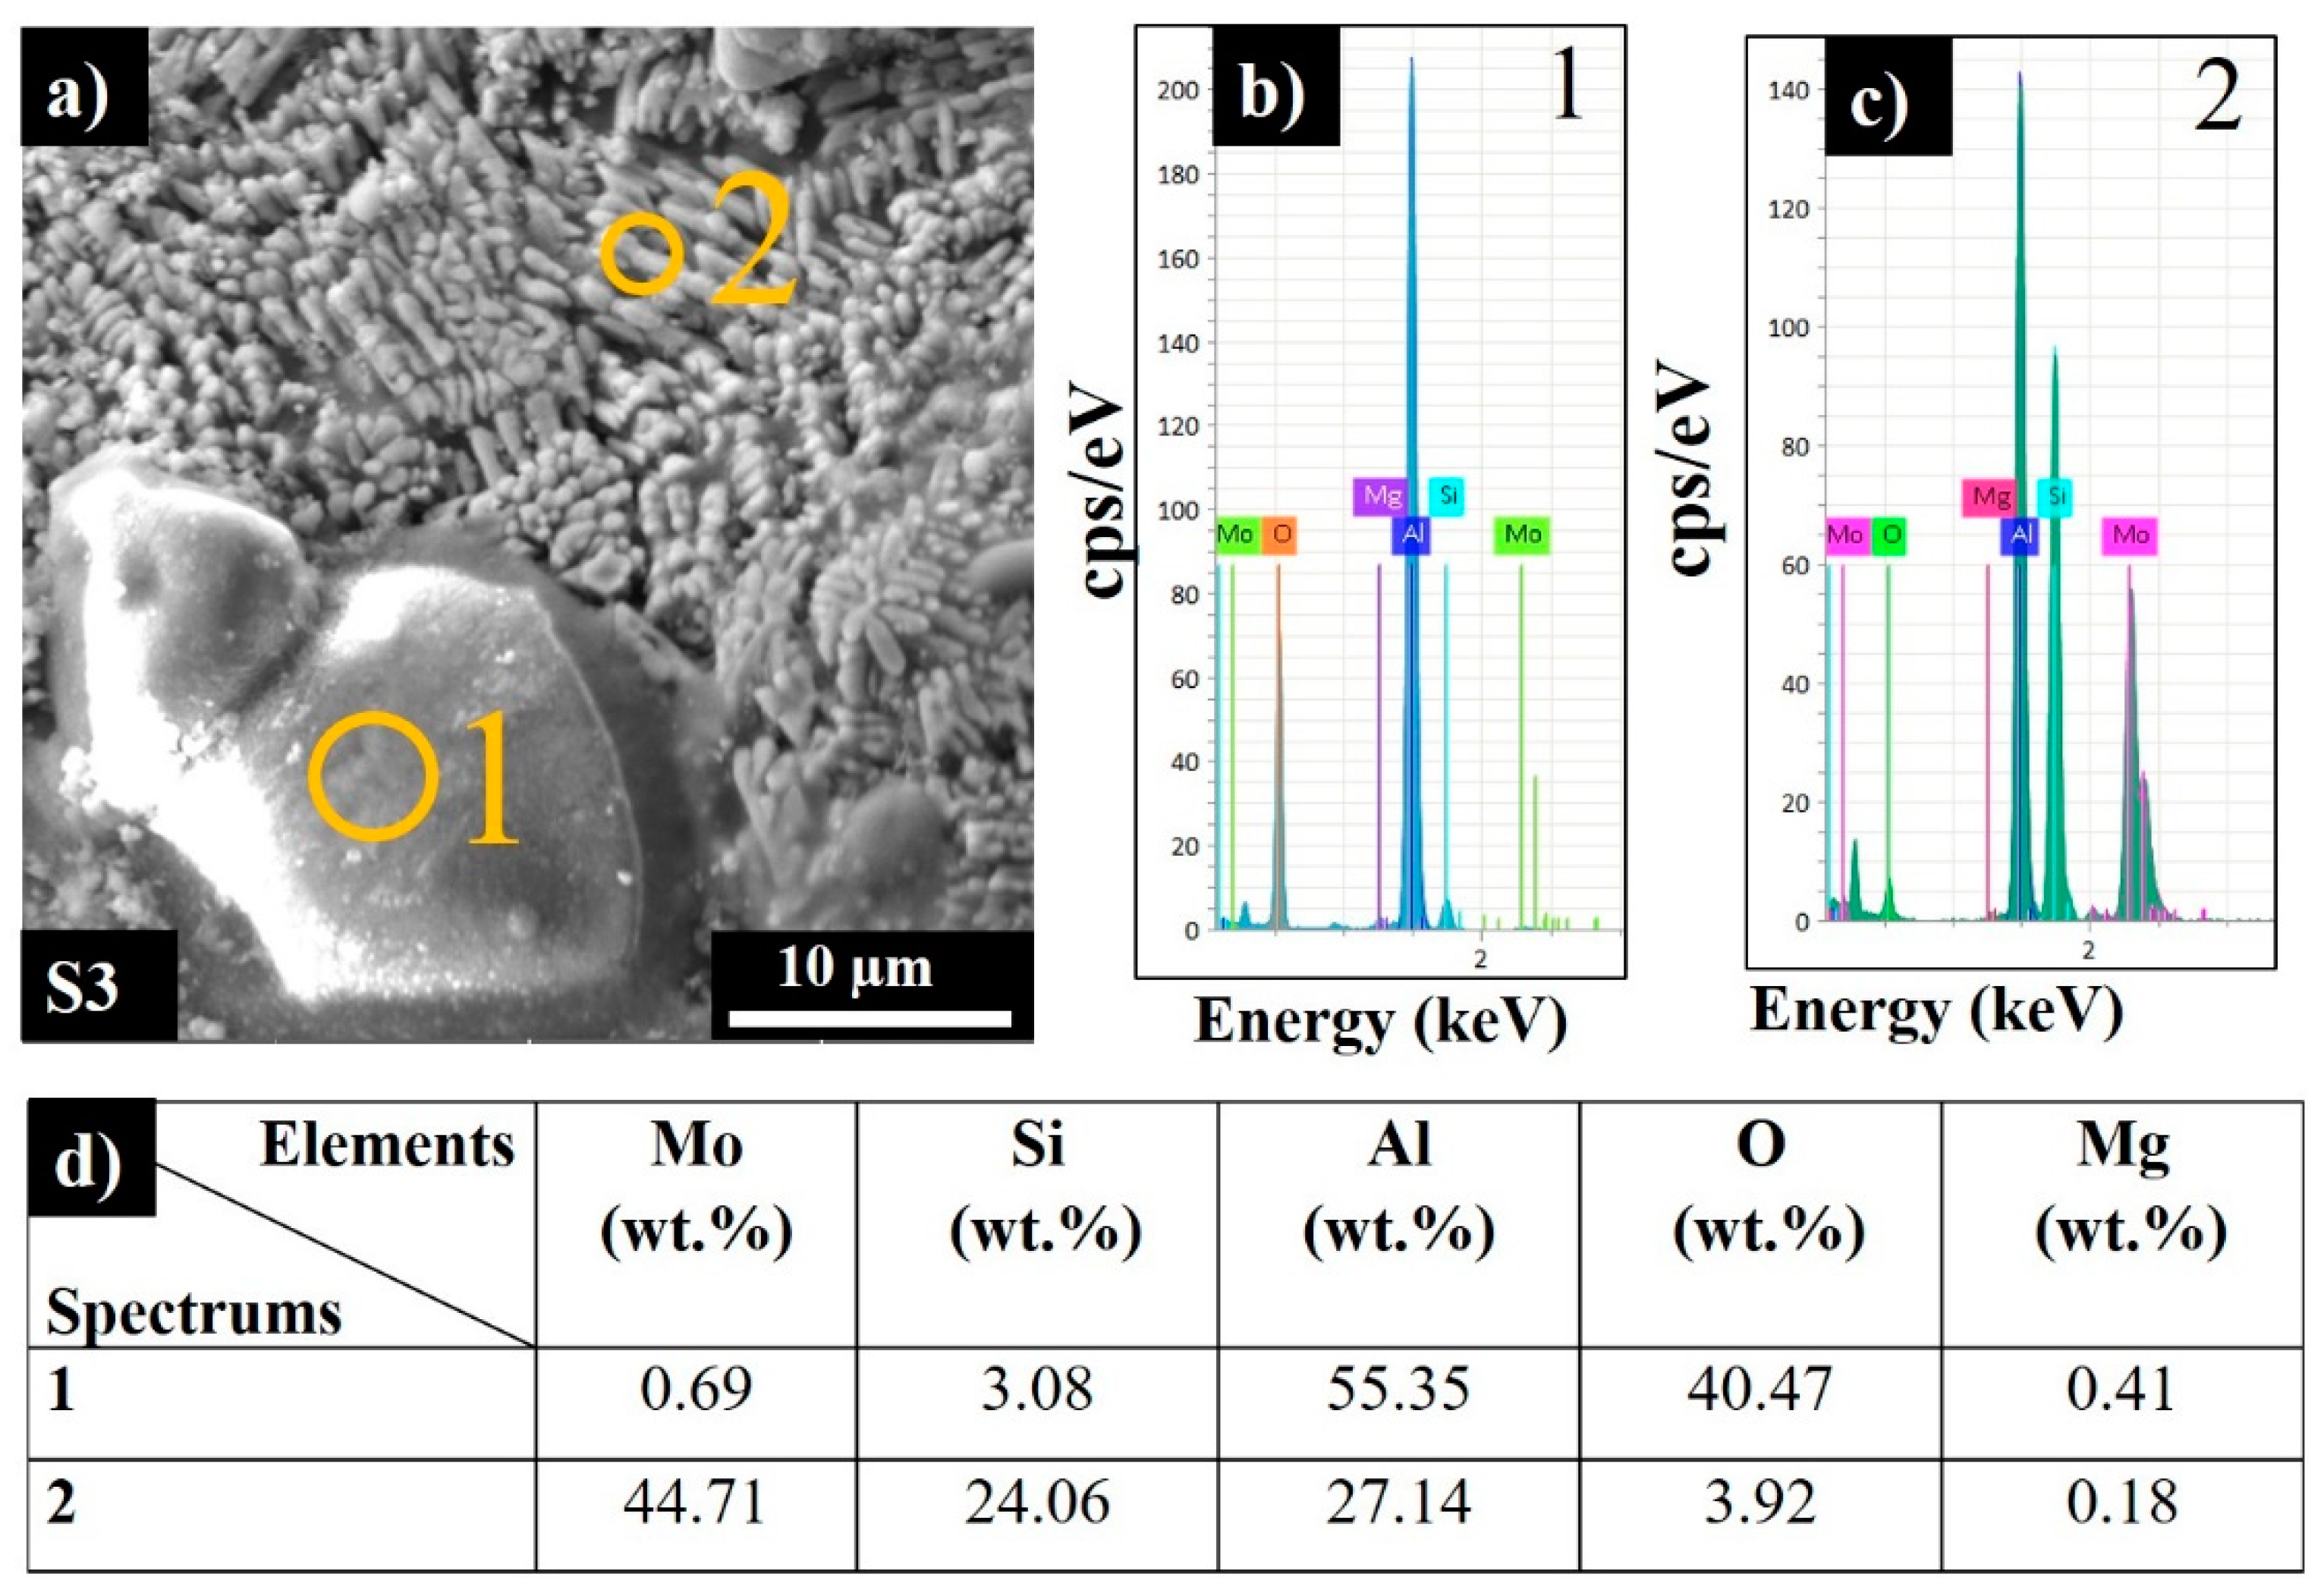
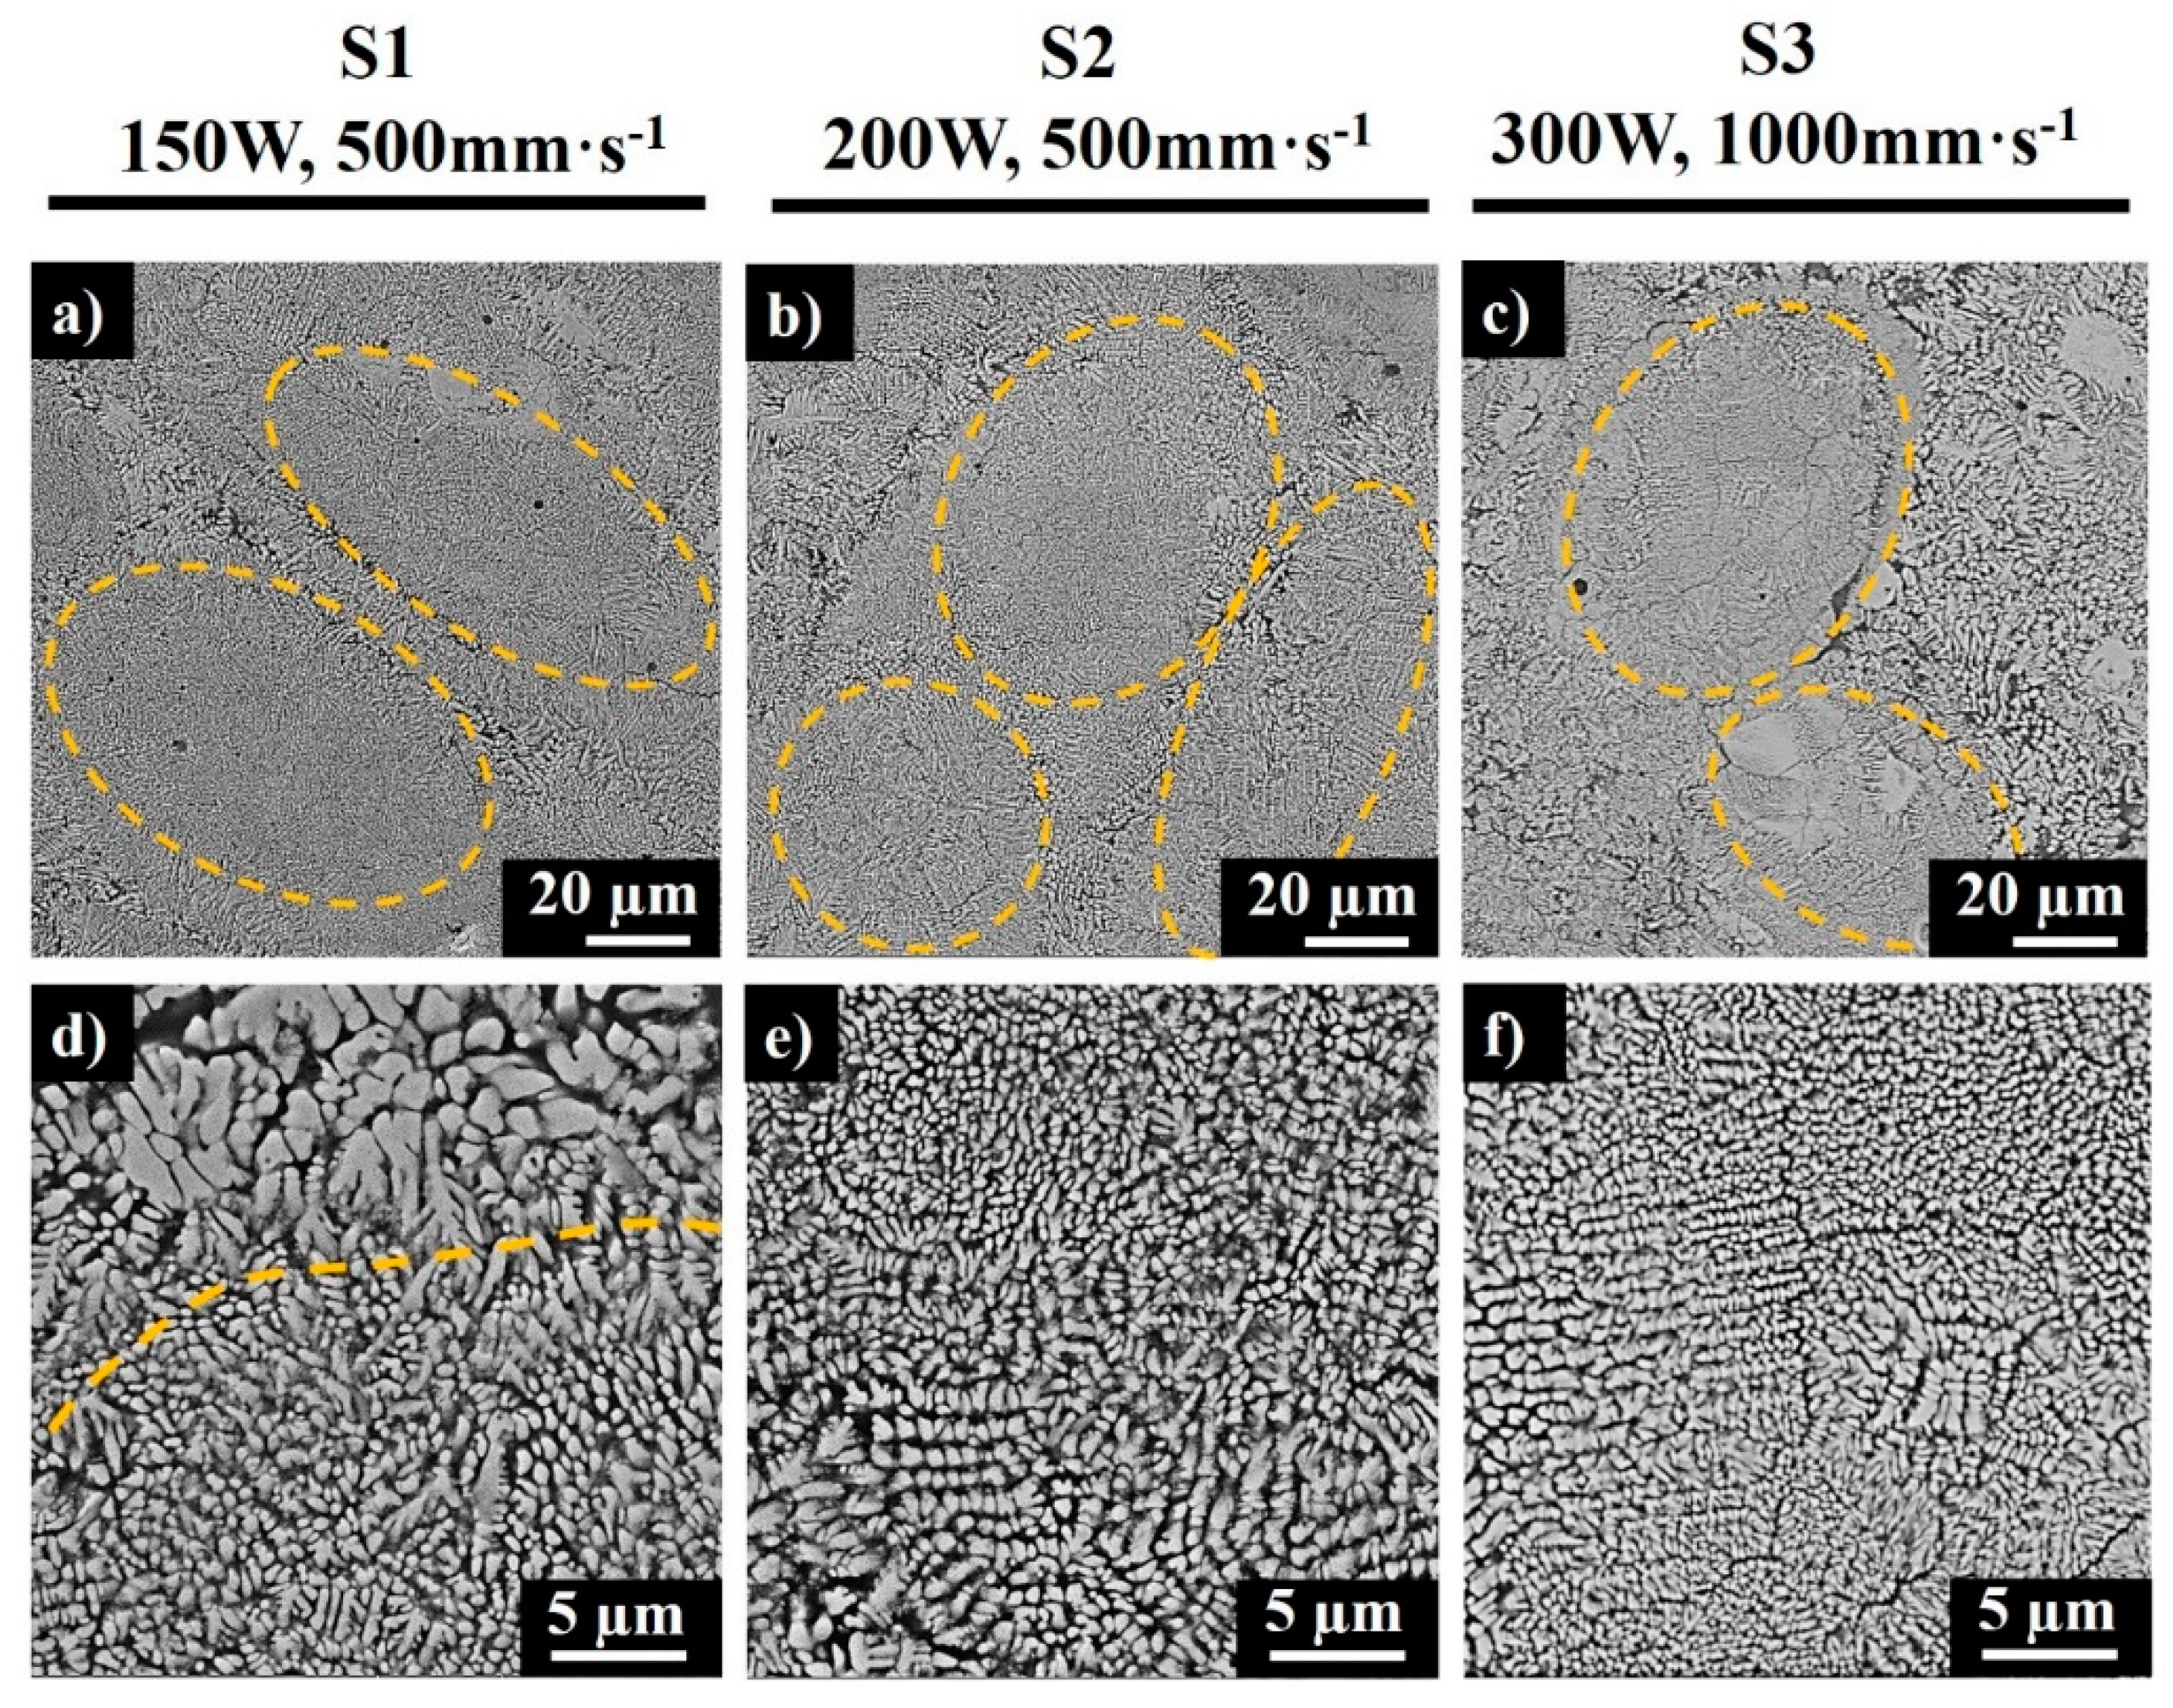
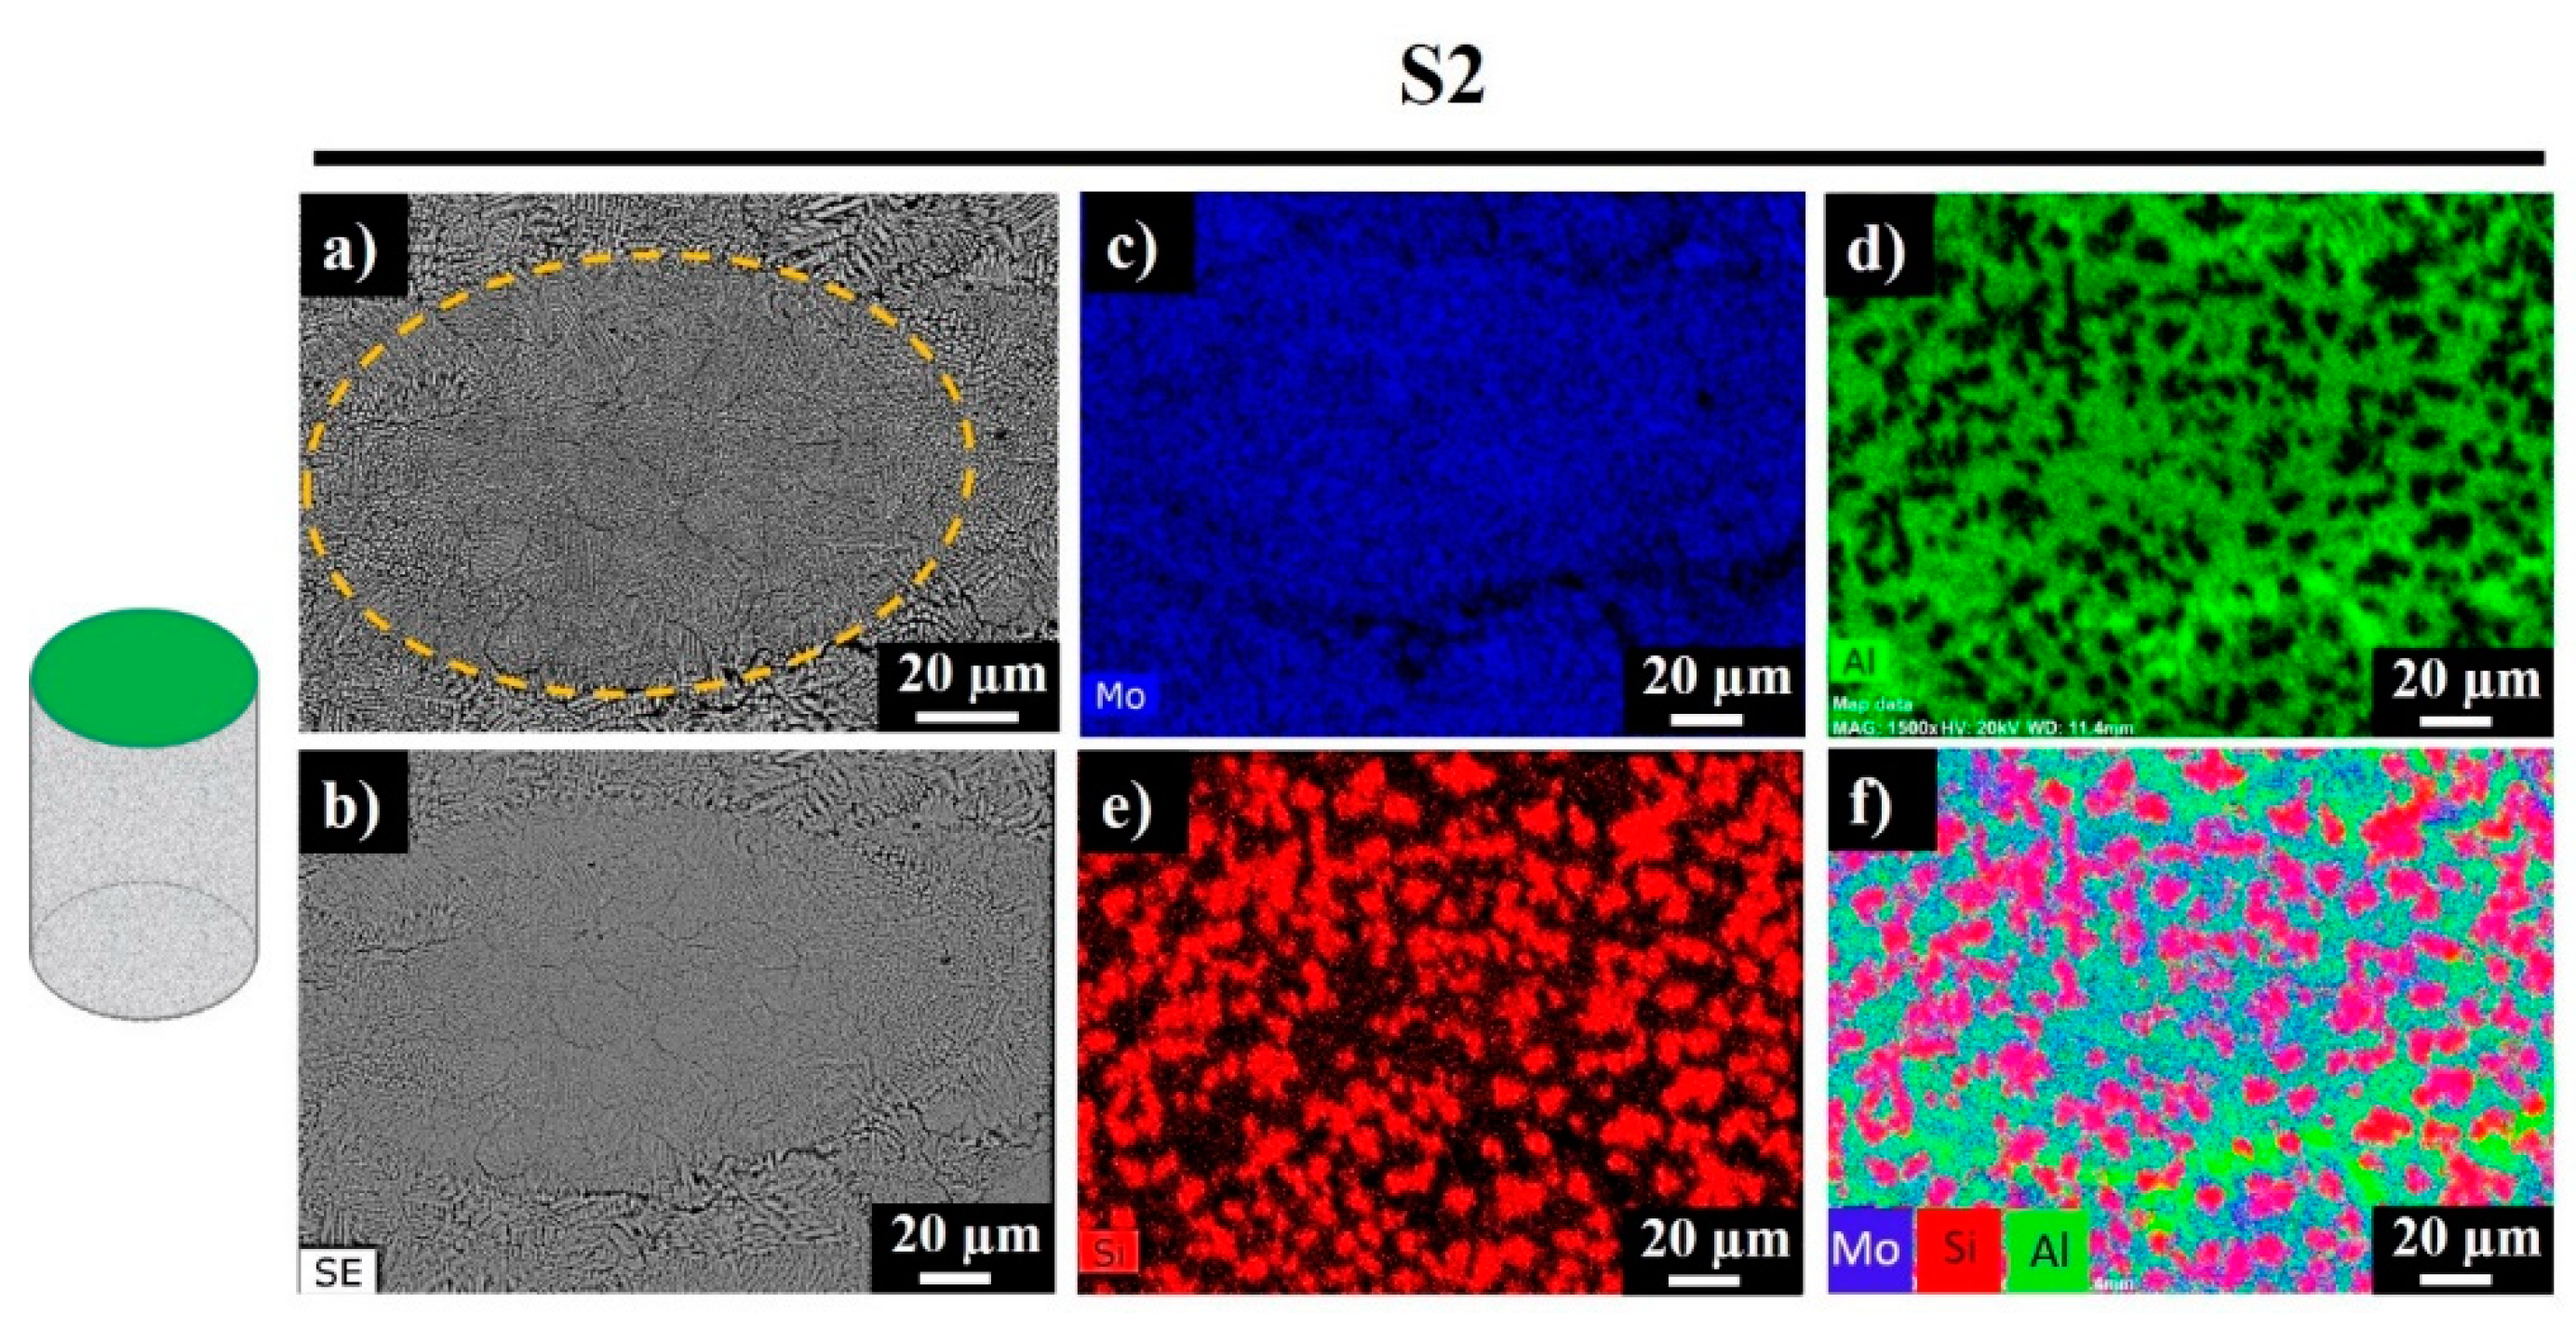
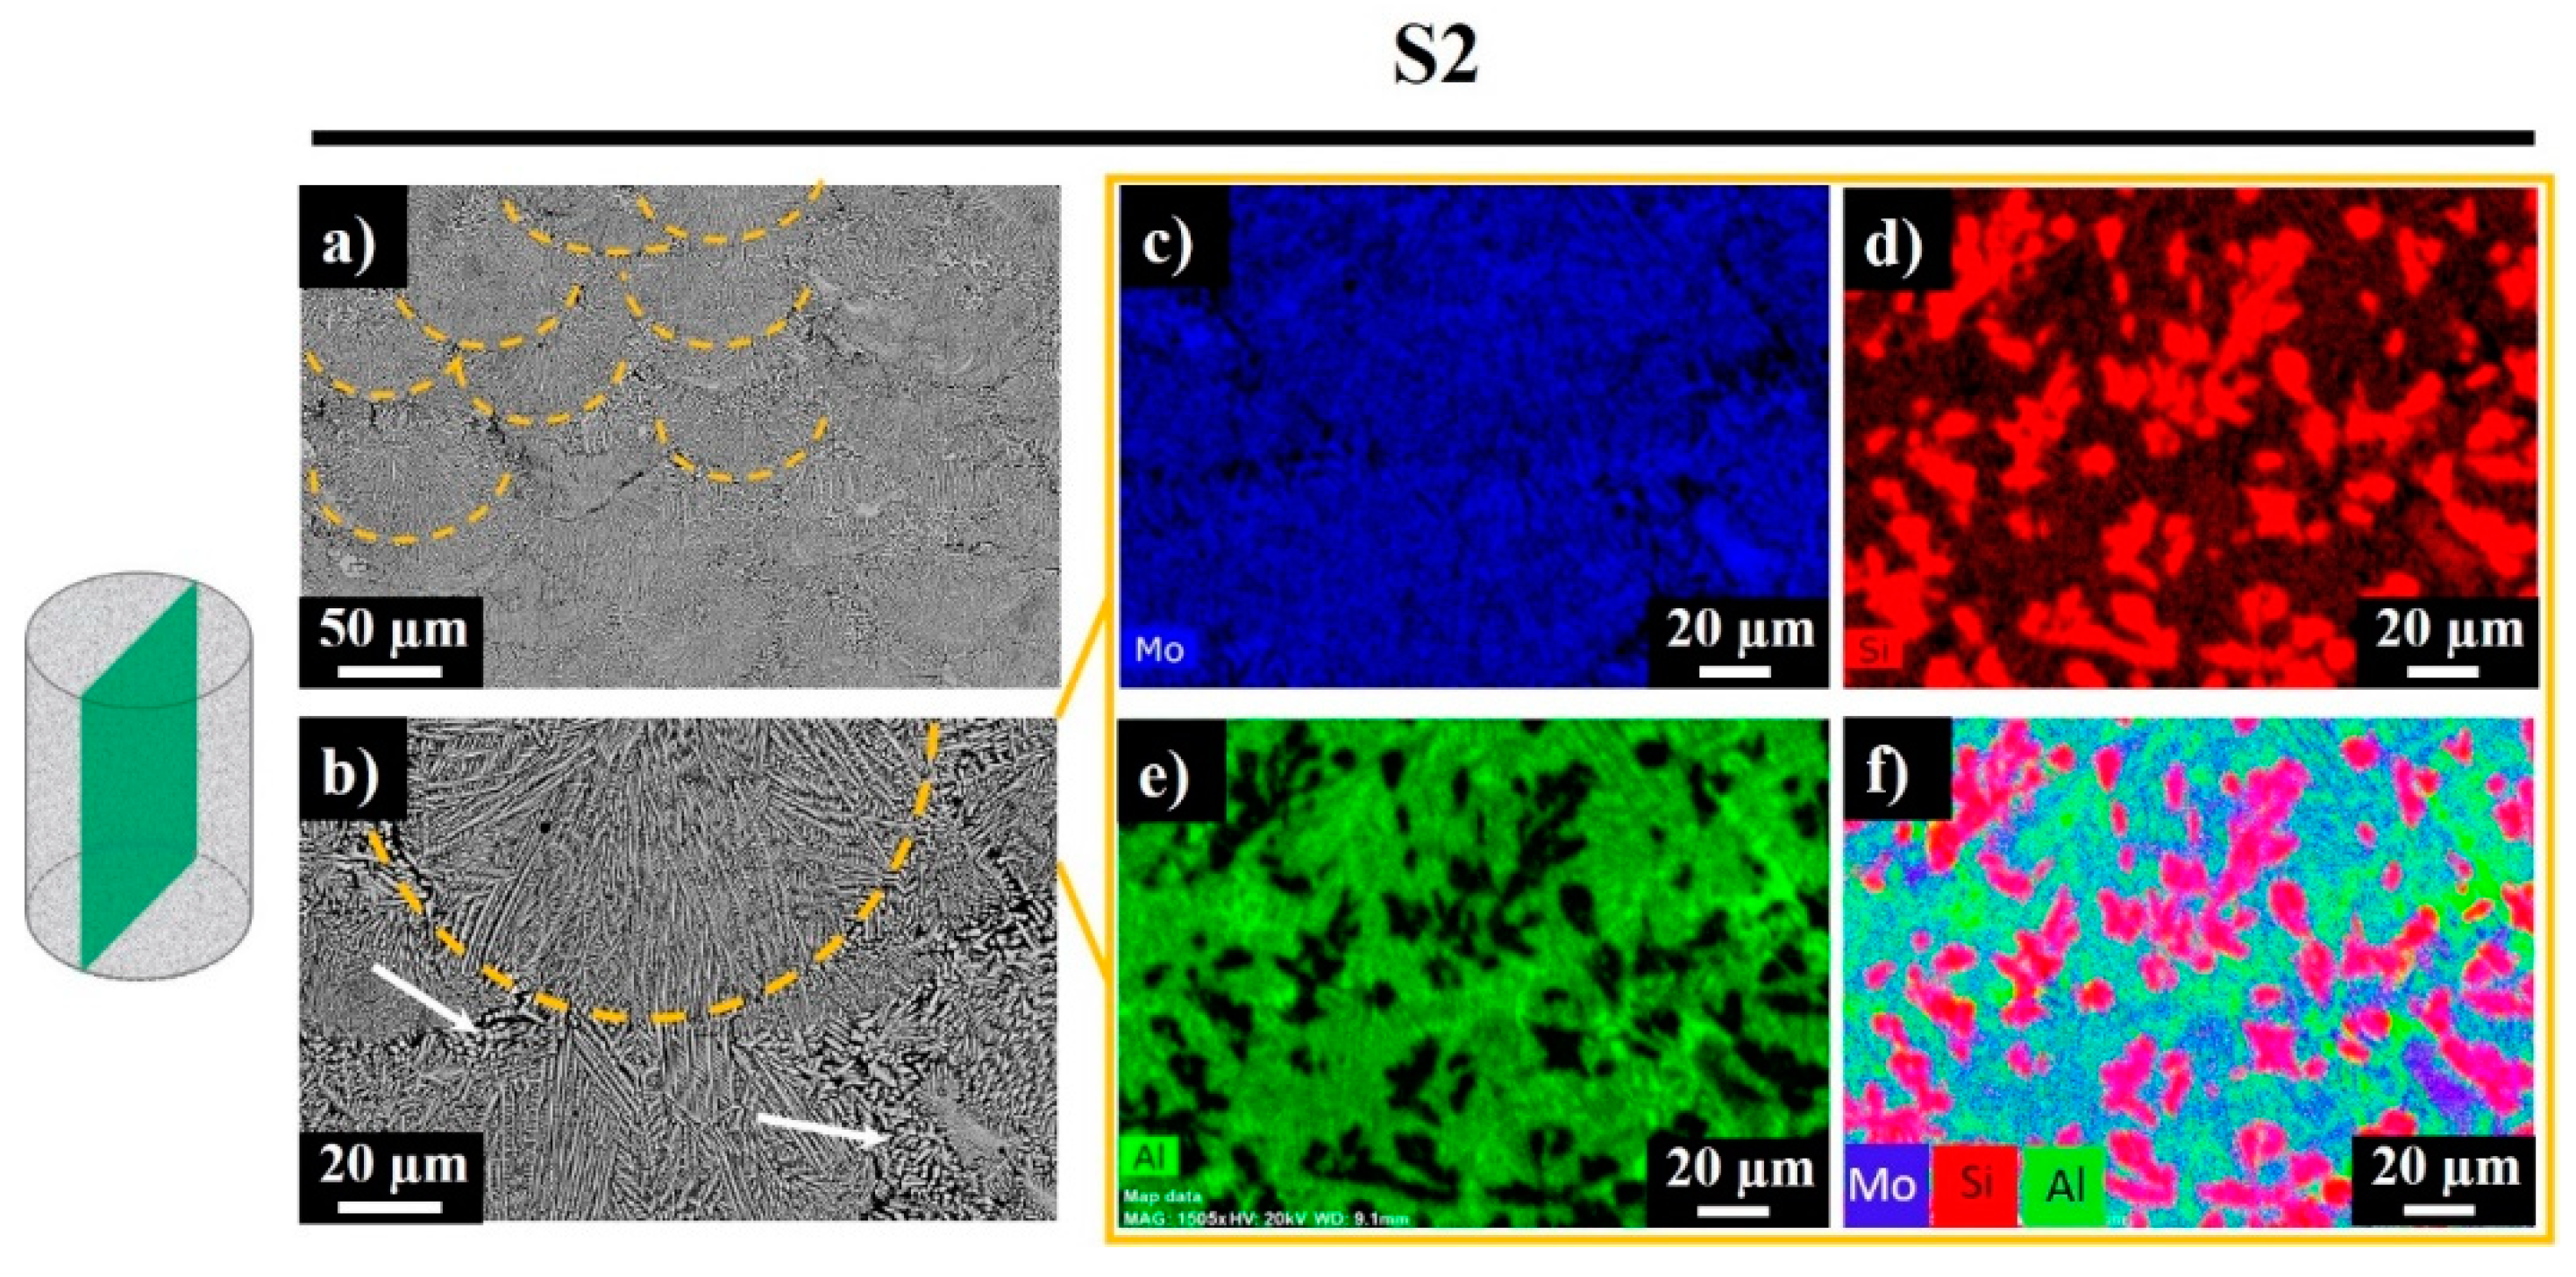
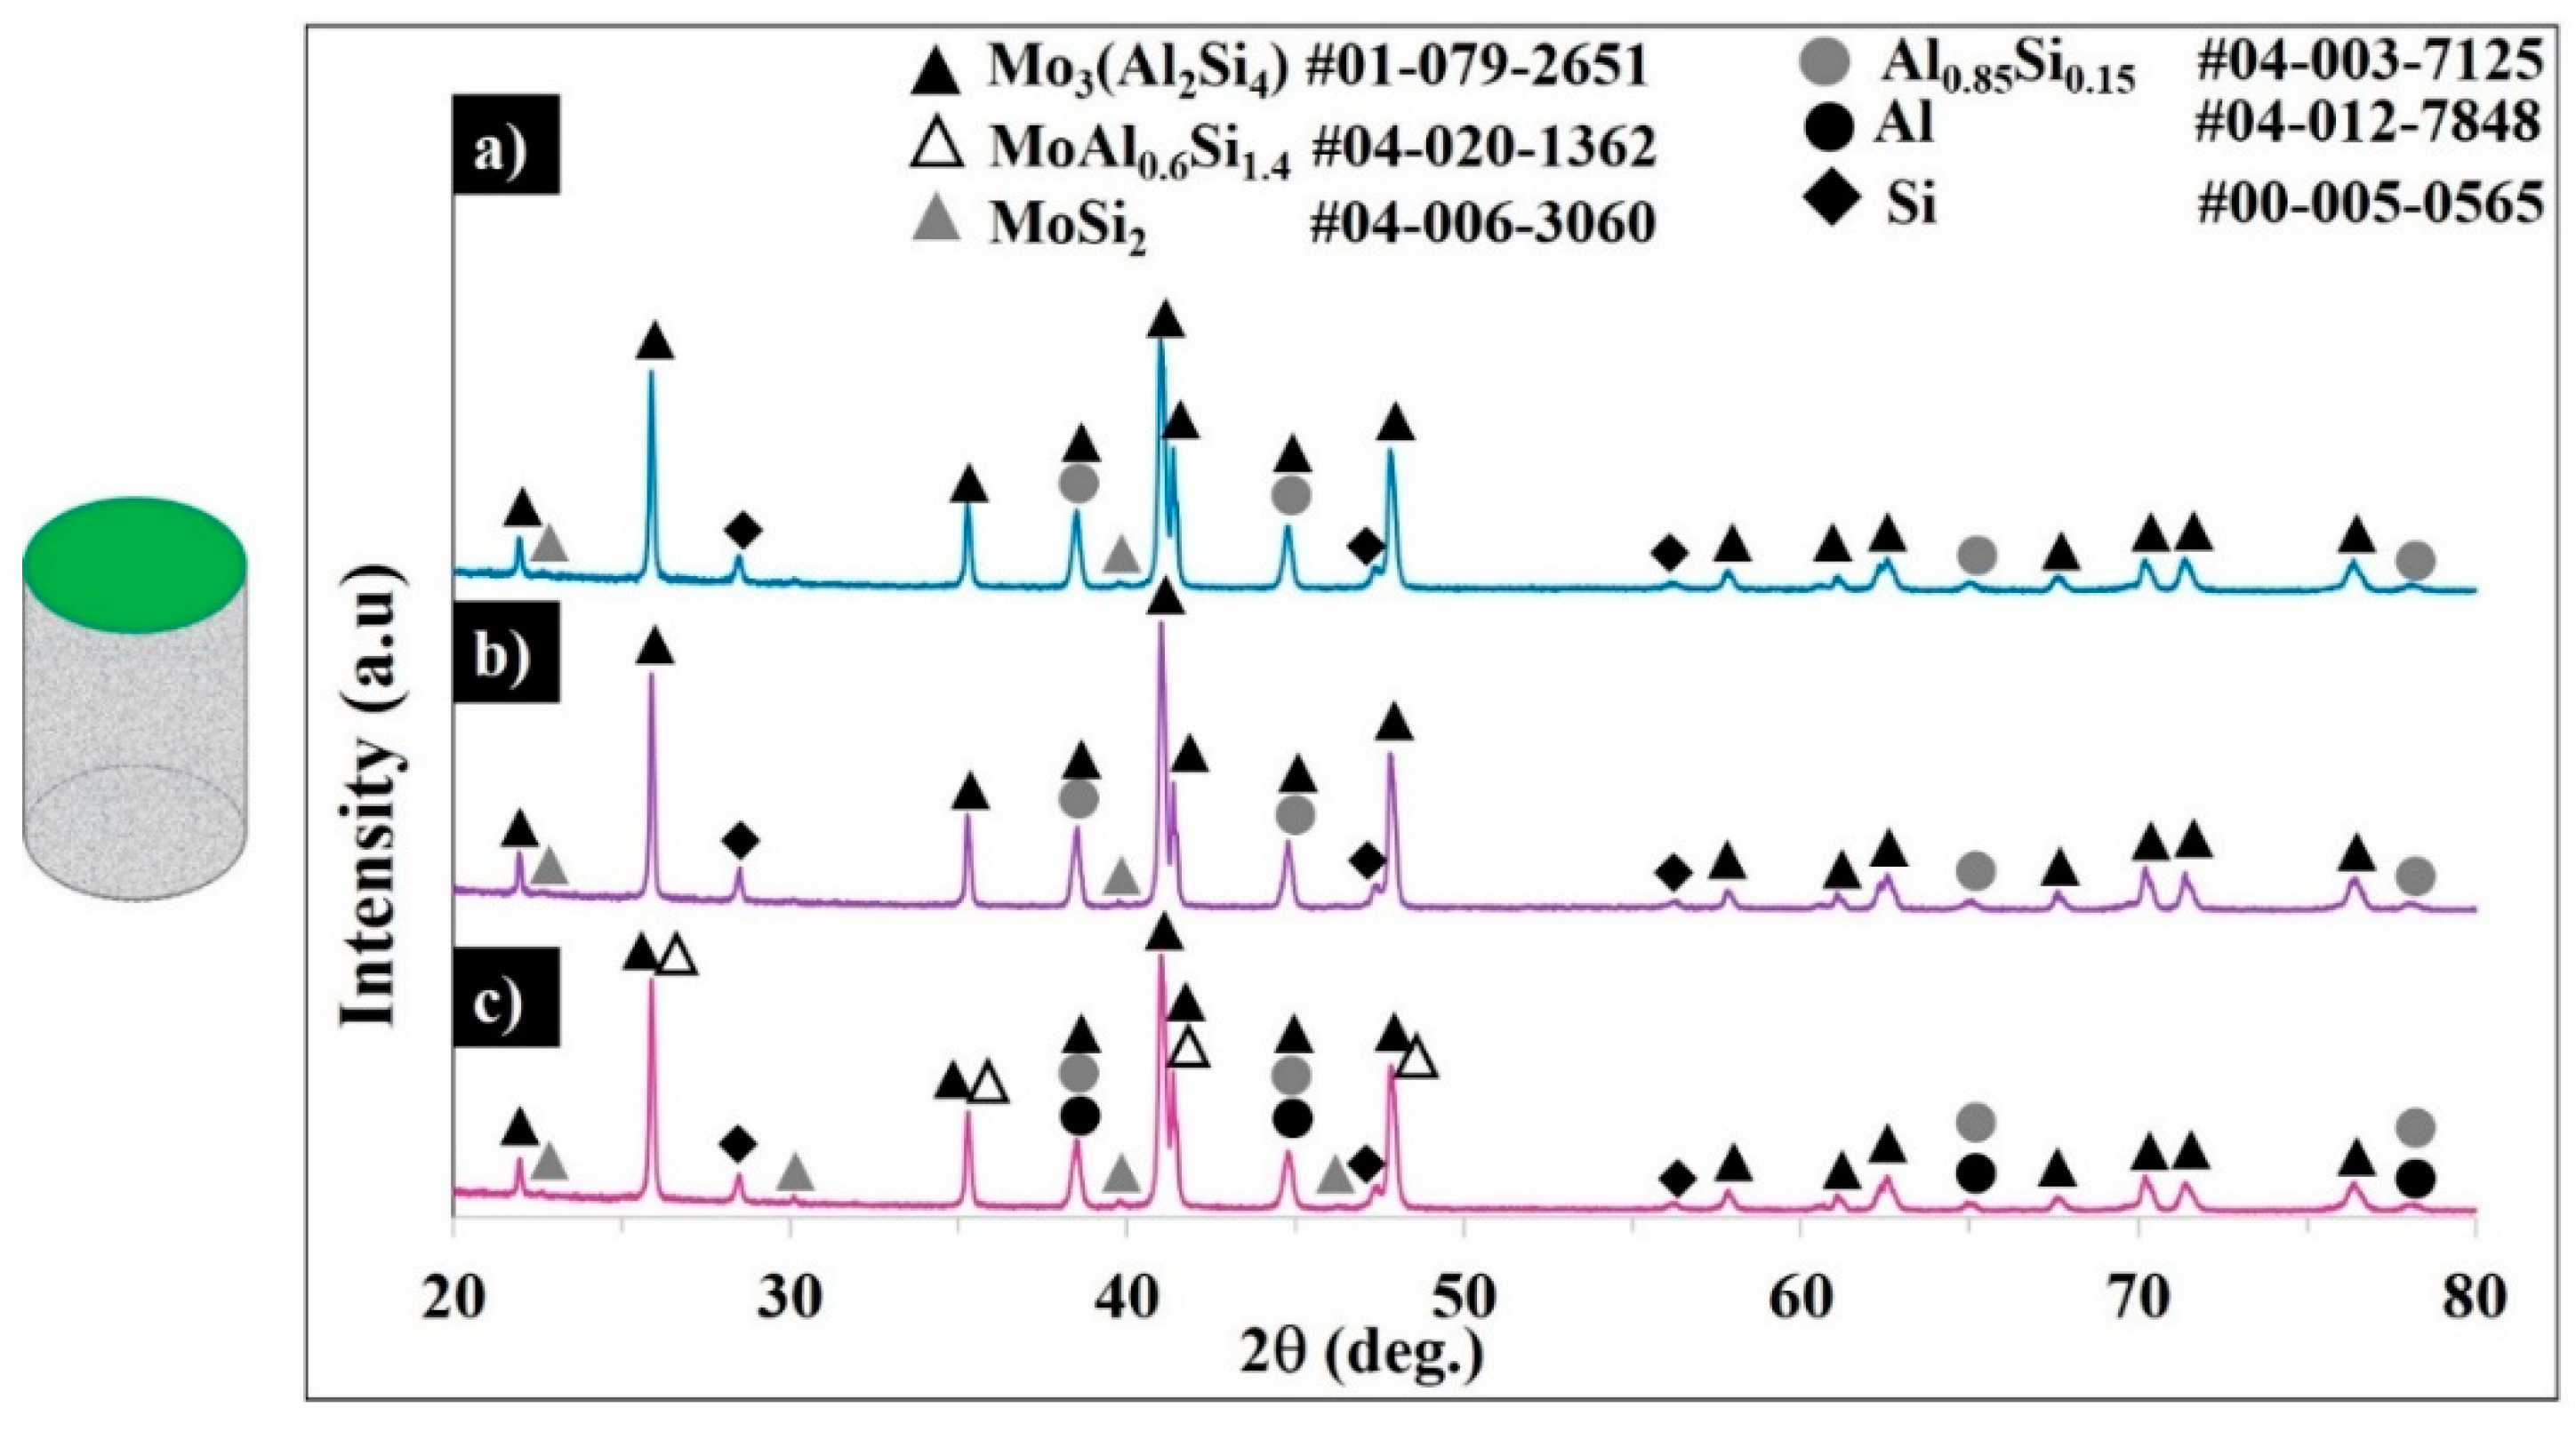
3.3. Microstructural Analysis
4. Conclusions
Author Contributions
Funding
Acknowledgments
Conflicts of Interest
References
- Yao, Z.; Stiglich, J.; Sudarshan, T.S. Molybdenum silicide based materials and their properties. J. Mater. Eng. Perform. 1999, 8, 291–304. [Google Scholar] [CrossRef]
- Vasudevan, A.K.; Petrovic, J.J. A comparative overview of molybdenum disilicide composites. Mater. Sci. Eng. A 1992, 155, 1–17. [Google Scholar] [CrossRef]
- Maruyama, T.; Yanagihara, K. High temperature oxidation and pesting of Mo(Si,Al)2. Mater. Sci. Eng. A 1997, 239, 828–841. [Google Scholar] [CrossRef]
- Stergiou, A.; Tsakiropoulos, P. Study of the effects of Al, Ta, W additions on the microstructure and properties of MoSi2 base alloys. MRS Online Proc. Libr. Arch. 1994, 364, 991. [Google Scholar] [CrossRef]
- Harada, Y.; Murata, Y.; Morinaga, M. Solid solution softening and hardening in alloyed MoSi2. Intermetallics 1998, 6, 529–535. [Google Scholar] [CrossRef]
- Sharif, A.A.; Misra, A.; Petrovic, J.J.; Mitchell, T.E. Alloying of MoSi2 for improved mechanical properties. Intermetallics 2001, 9, 869–873. [Google Scholar] [CrossRef]
- Ramberg, C.E.; Worrell, W.L. Fabrication and High-Temperature Phase Stability of Mo (Al, Si) 2—MoSi2 Intermetallics. J. Am. Ceram. Soc. 2000, 83, 946–948. [Google Scholar] [CrossRef]
- Hobosyan, M.A.; Khachatryan, H.L.; Davidova, A.; Kharatyan, S.L. Chemically activated combustion synthesis of MoSi2/Al cermet foams. Chem. Eng. J. 2011, 170, 286–291. [Google Scholar] [CrossRef]
- Hou, H.D.; Ning, X.J.; Wang, Q.S.; Bin, G.A.O.; Liu, Y.B.; Ying, L.I.U. Preparation of Mo(Si,Al)2 feedstock used for air plasma spraying. Trans. Nonferrous Met. Soc. 2016, 26, 2939–2946. [Google Scholar] [CrossRef]
- Ghayoumabadi, M.E.; Saidi, A.; Abbasi, M.H. Lattice variations and phase evolutions during combustion reactions in Mo–Si–Al system. J. Alloys Compd. 2009, 472, 84–90. [Google Scholar] [CrossRef]
- Tabaru, T.; Shobu, K.; Sakamoto, M.; Hanada, S. Effects of substitution of Al for Si on the lattice variations and thermal expansion of Mo(Si,Al)2. Intermetallics 2004, 12, 33–41. [Google Scholar] [CrossRef]
- Wang, X.H.; Wu, G.Z.; Lu, Q.; Sun, Z. Synthesis and mechanical properties of Nb and Al substituted MoSi2. Mater. Res. Innov. 2015, 19 (Suppl. 4), S175–S180. [Google Scholar] [CrossRef]
- Nanko, M.; Kitahara, A.; Ogura, T.; Kamata, H.; Maruyama, T. Formation of Mo(Si,Al)2 layer on Mo dipped in Al melt saturated with Si and the effects of transition metals added in the melt. Intermetallics 2001, 9, 637–646. [Google Scholar] [CrossRef]
- Liu, Y.; Shao, G.; Tsakiropoulos, P. Thermodynamic reassessment of the Mo–Si and Al–Mo–Si systems. Intermetallics 2000, 8, 953–962. [Google Scholar] [CrossRef]
- Minasyan, T.; Aghayan, M.; Liu, L.; Aydinyan, S.; Kollo, L.; Hussainova, I.; Rodríguez, M.A. Combustion synthesis of MoSi2 based composite and selective laser sintering thereof. J. Eur. Ceram. Soc. 2018, 38, 3814–3821. [Google Scholar] [CrossRef]
- Minasyan, T.; Liu, L.; Holovenko, Y.; Aydinyan, S.; Hussainova, I. Additively manufactured mesostructured MoSi2-Si3N4 ceramic lattice. Ceram. Int. 2019, 45, 9926–9933. [Google Scholar] [CrossRef]
- Read, N.; Wang, W.; Essa, K.; Attallah, M.M. Selective laser melting of AlSi10Mg alloy: Process optimisation and mechanical properties development. Mater. Des. 2015, 65, 417–424. [Google Scholar] [CrossRef] [Green Version]
- ISO 13322-2. Particle Size Analysis—Image Analysis Methods—Part 2: Dynamic Image Analysis Methods. International Organization for Standardization: Geneva, Switzerland, 2006. [Google Scholar]
- Aboulkhair, N.T.; Everitt, N.M.; Ashcroft, I.; Tuck, C. Reducing porosity in AlSi10Mg parts processed by selective laser melting. Addit. Manuf. 2014, 1, 77–86. [Google Scholar] [CrossRef]
- Zhang, J.; Song, B.; Wei, Q.; Bourell, D.; Shi, Y. A review of selective laser melting of aluminum alloys: Processing, microstructure, property and developing trends. J. Mater. Sci. Technol. 2019, 35, 270–284. [Google Scholar] [CrossRef]
- Liu, B.; Li, B.Q.; Li, Z. Selective laser remelting of an additive layer manufacturing process on AlSi10Mg. Results Phys. 2019, 12, 982–988. [Google Scholar] [CrossRef]


| Initial Reagents | Preparation Technique | Final Product | Important Notes | Refs. |
|---|---|---|---|---|
| Mo + 2(1 − x)Si + 2xAl x = 0.14; 0.15; 0.28; 0.37 | Arc melting of plates of the constituent elements Mo, Si, and Al in argon. | Mo(Si1-x,Alx x)2 (0.11 < x < 0.55) x = 0.14; 0.15; 0.28; 0.37 | The substitution of Si with Al gives Mo(Si1-x,Alx)2 of the C40 structure with a large homogeneity in the range of 0.11 < x < 0.55 | [3] |
| 33.3 at.% Mo + 44.2 at.% Si + 22.5 at.% Al | Arc melting | C40 Mo(Al0. 5,Si0,5)2 and C54 MoAl1.3Si0.7 phases | Addition of Al as a substitution for Si leads to formation of the higher symmetry C40 and C54 phases | [4] |
| Mo + 2(1 − x)Si + 2xAl x = 0.0075–0.225 | Arc melting | Mo(Si0.9925Al0.0075)2 Mo(Si0.985Al0.015)2 Mo(Si0.925Al0.075)2 Mo(Si0.85Al0.15)2 Mo(Si0.775Al0.225)2 | Al is soluble in MoSi2 up to about x = 0.045. The excess of Al resulted in formation of the C40- or C49-type phases | [5] |
| Mo + 2Si + (1–2.5 at.%)Al | Arc melting | Mo(Al, Si)2 Al-(1–2.5 at.%) | The addition of 2 at.% Al increased the high-temperature strength of Mo(Al, Si)2, lowered the brittle to ductile transition temperature, and decreased the hardness | [6] |
| Mo + 2(1 − x)Si + 2xAl x = 0.01–0.5 | Self-propagating high-temperature synthesis (SHS) + hot pressing | Mo(Al0.5,Si0.5)2 Mo(Al0.2,Si0.8)2 Mo(Al0.05,Si0.95)2 Mo(Al0.01,Si0.99)2 | The substitution of 10 wt.% Al for Si yielded equal amounts of Mo(Al,Si)2 and MoSi2 | [7] |
| Mo-2Si-0.04PTFE-0.88Al Mo-2Si-0.08PTFE-0.88Al | SHS | MoSi2, Al, Mo5Si3, AlF3 in MoSi2-Al cermet foam | Porous product | [8] |
| Mo + 2(1 − x) + 2x x = 0–0.5 | SHS + induction plasma spheroidization (IPS) | Mo(Si1−x,Alx)2 (x = 0–0.5) x = 0 → nearly pure C11b MoSi2 x = 0.1 → C11b C40 0.2 ≤ x ≤ 0.4 → C40 + C11b (trace) x = 0.1 → C40 + C54 | Mo(Si,Al)2 with C40 structure designed as Mo(Si0.6,Al0.4)2 with the maximum Al content in SHS. After IPS, the apparent density was remarkable improved | [9] |
| Mo + 2(1 − x)Si + 2xAl x = 0.0–0.5 mole (0 to 17.86 wt.% Al) | SHS | Mo(Si1−x,Alx)2 x = 0.08 → C11b MoSi2 + C40 x = 0.2 → nearly pure C40 x = 0.5 → C40 + C54 | Up to 2.84 wt.% Al, only C11b’s tetragonal phase is present; up to 5.33 wt.% Al, a duplex of C11b/C40 phases is present. Increasing the Al reduces the amount of C11b in the biphasic region. A single C40 hexagonal forms at 7.11 wt.% Al. At 17.86 wt.% Al, orthorhombic C54 (Al4Mo3Si2) appears | [10] |
| Mo + 2(1 − x) + 2x x = 0–0.6 | Pseudo-HIP | Mo(Si1-x,Alx)2 x = 0 → C11b x = 0.1 → C11b + C40 x = 0.2−0.4 → C40 x = 0.5 → C40 + C54 x = 0.6 → C54 | C40 is in the range of x = 0.1−0.5, while C11b is detected at x = 0.1 and C54 at x = 0.5. C11b is identified only atx = 0, while only C54 is detected at x = 0.6 | [11] |
| SHS-ed powders Mo1-xNbx)Si2 (x = 0–0.3), Mo(Si1-y,Aly)2 (y = 0–0.3) | SPS at 1350 °C and 40 MPa for 6 min in vacuum | (Mo1-xNbx)Si2 Mo(Si1-y,Aly)2 | Addition of Nb at x = 0–0.12 increased the strength and toughness | [12] |
| Mo plate and molten Al saturated with Si and Mo | Dipping Mo into Al-Si bath at 973 K for 350 ks | Mo plate covered with the layer of Mo(Si,Al)2 of Mo:Si:Al = 30:12:58 | The needle-like grains grow perpendicular to Mo’s surface. The reaction goes through the solution–precipitation process in the Al(Si) liquid between Mo and Mo(Si,Al)2 layers | [13] |
| Sample ID | Laser Power (W) | Scanning Speed (mm·s−1) | Laser Volumetric Energy Density (J·mm−3) | Build Rate (mm3·s−1) |
|---|---|---|---|---|
| S1 | 150 | 500 | 100.8 | 1.48 |
| S2 | 200 | 500 | 134.4 | 1.48 |
| S3 | 300 | 1000 | 100.8 | 2.97 |
| Particle Size | D10 (µm) | D50 (µm) | D90 (µm) | |
|---|---|---|---|---|
| Composition | ||||
| AlSiMg10 | 25.14 ± 0.53 | 38.72 ± 0.67 | 55.47 ± 0.44 | |
| MoSi2 | 5.44 ± 0.26 | 18.95 ± 0.89 | 43.45 ± 0.65 | |
| MoSi2-30 wt.% AlSi10Mg | 7.68 ± 0.07 | 33.02 ± 1.18 | 54.19 ± 1.30 | |
| Powders | MoSi2 (<45 µm) | MoSi2-30 wt.% AlSi10Mg | AlSi10Mg (15–63 µm) | |
|---|---|---|---|---|
| FT4 Results | ||||
| BFE, mJ | 307.52 ± 13.74 | 252.27 ± 19.41 | 206.14 ± 8.92 | |
| SI | 1.09999 ± 0.00606 | 0.95012 ±0.07664 | 0.96271 ± 0.06536 | |
| Sample | Top Surface Roughness, µm | Side Surface Roughness, µm | ||
|---|---|---|---|---|
| Sa | Sz | Sa | Sz | |
| S1 | 10.1 | 94.4 | 11.2 | 109.5 |
| S2 | 9.9 | 75.5 | 13.2 | 130.8 |
| S3 | 14.7 | 130.2 | 17.8 | 173.5 |
| Sample ID | Composition (%) | Elemental Composition (%) | |||||||
|---|---|---|---|---|---|---|---|---|---|
| Mo3(Si4Al2) | MoAl0.6Si1.4 | MoSi2 | Al0.85Si0.15 | Al | Si | Mo | Si | Al | |
| S1 | 69.4 | 0.5 | 1.2 | 19.7 | 0.0 | 9.1 | 45.1 | 30.0 | 24.9 |
| S2 | 70.9 | 0.7 | 1.1 | 17.5 | 0.0 | 9.7 | 46.1 | 30.6 | 23.3 |
| S3 | 67.0 | 3.7 | 2.4 | 17.0 | 1.2 | 8.7 | 46.3 | 29.8 | 23.9 |
© 2020 by the authors. Licensee MDPI, Basel, Switzerland. This article is an open access article distributed under the terms and conditions of the Creative Commons Attribution (CC BY) license (http://creativecommons.org/licenses/by/4.0/).
Share and Cite
Minasyan, T.; Aydinyan, S.; Toyserkani, E.; Hussainova, I. In Situ Mo(Si,Al)2-Based Composite through Selective Laser Melting of a MoSi2-30 wt.% AlSi10Mg Mixture. Materials 2020, 13, 3720. https://0-doi-org.brum.beds.ac.uk/10.3390/ma13173720
Minasyan T, Aydinyan S, Toyserkani E, Hussainova I. In Situ Mo(Si,Al)2-Based Composite through Selective Laser Melting of a MoSi2-30 wt.% AlSi10Mg Mixture. Materials. 2020; 13(17):3720. https://0-doi-org.brum.beds.ac.uk/10.3390/ma13173720
Chicago/Turabian StyleMinasyan, Tatevik, Sofiya Aydinyan, Ehsan Toyserkani, and Irina Hussainova. 2020. "In Situ Mo(Si,Al)2-Based Composite through Selective Laser Melting of a MoSi2-30 wt.% AlSi10Mg Mixture" Materials 13, no. 17: 3720. https://0-doi-org.brum.beds.ac.uk/10.3390/ma13173720