
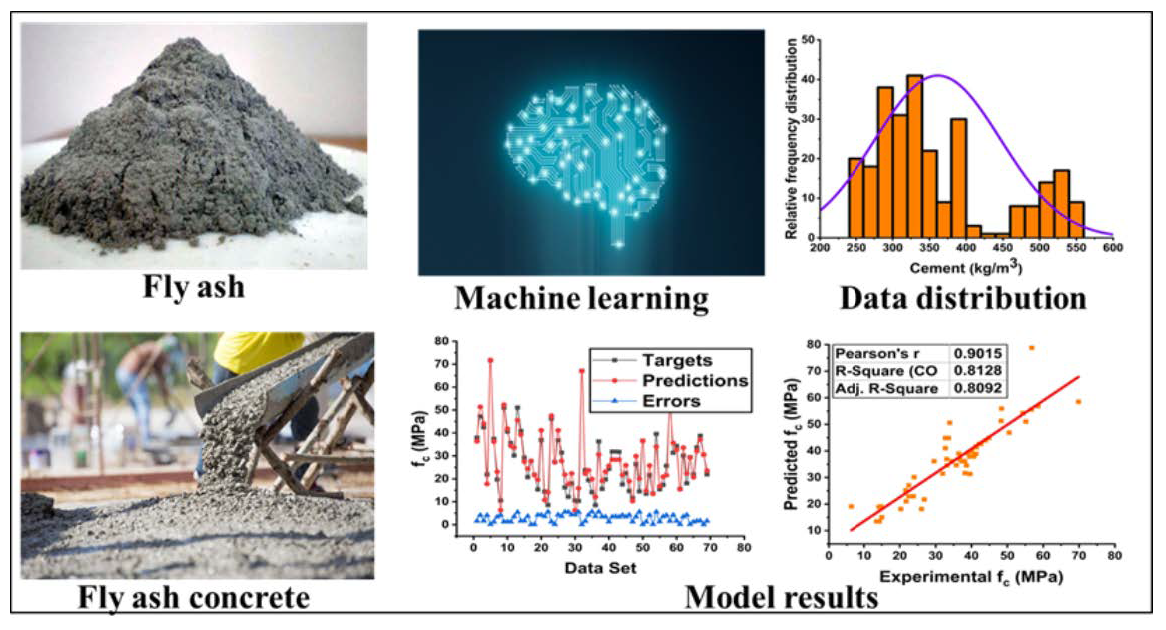
Prediction of Compressive Strength of Fly Ash Based Concrete Using Individual and Ensemble Algorithm

 , ,
, ,  , , , and
Abstract
:
1. Introduction
2. Research Significance
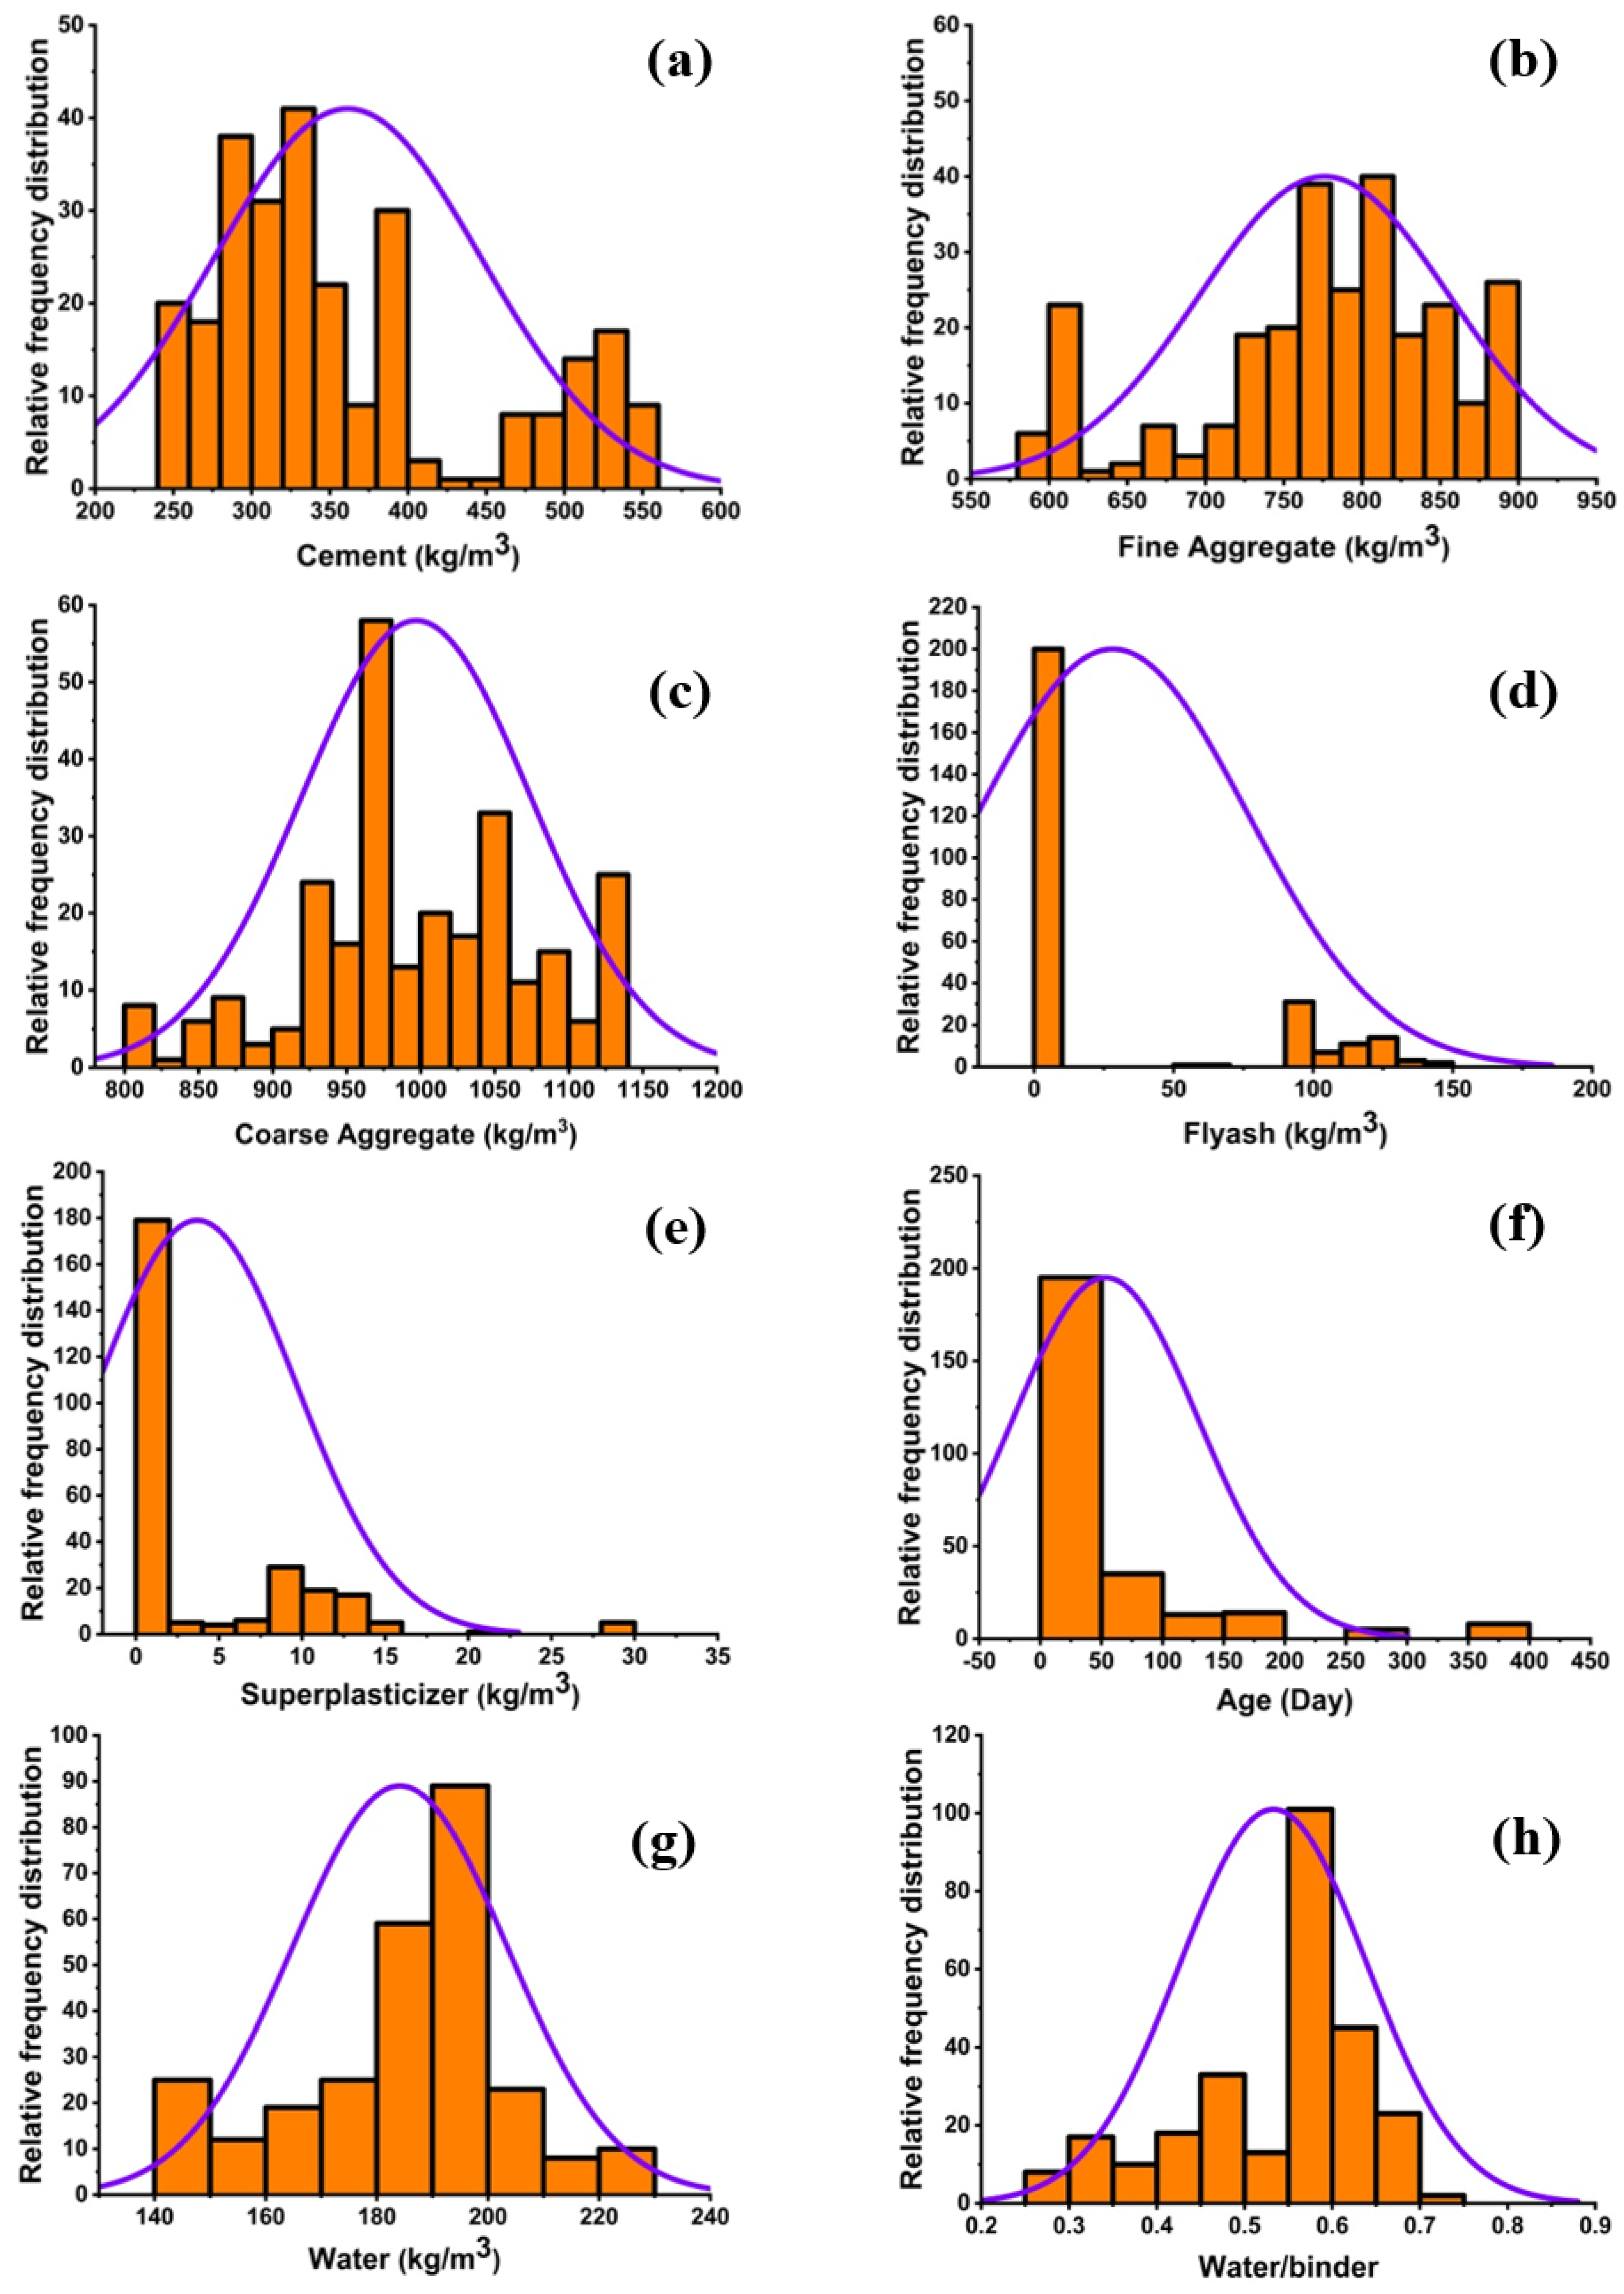
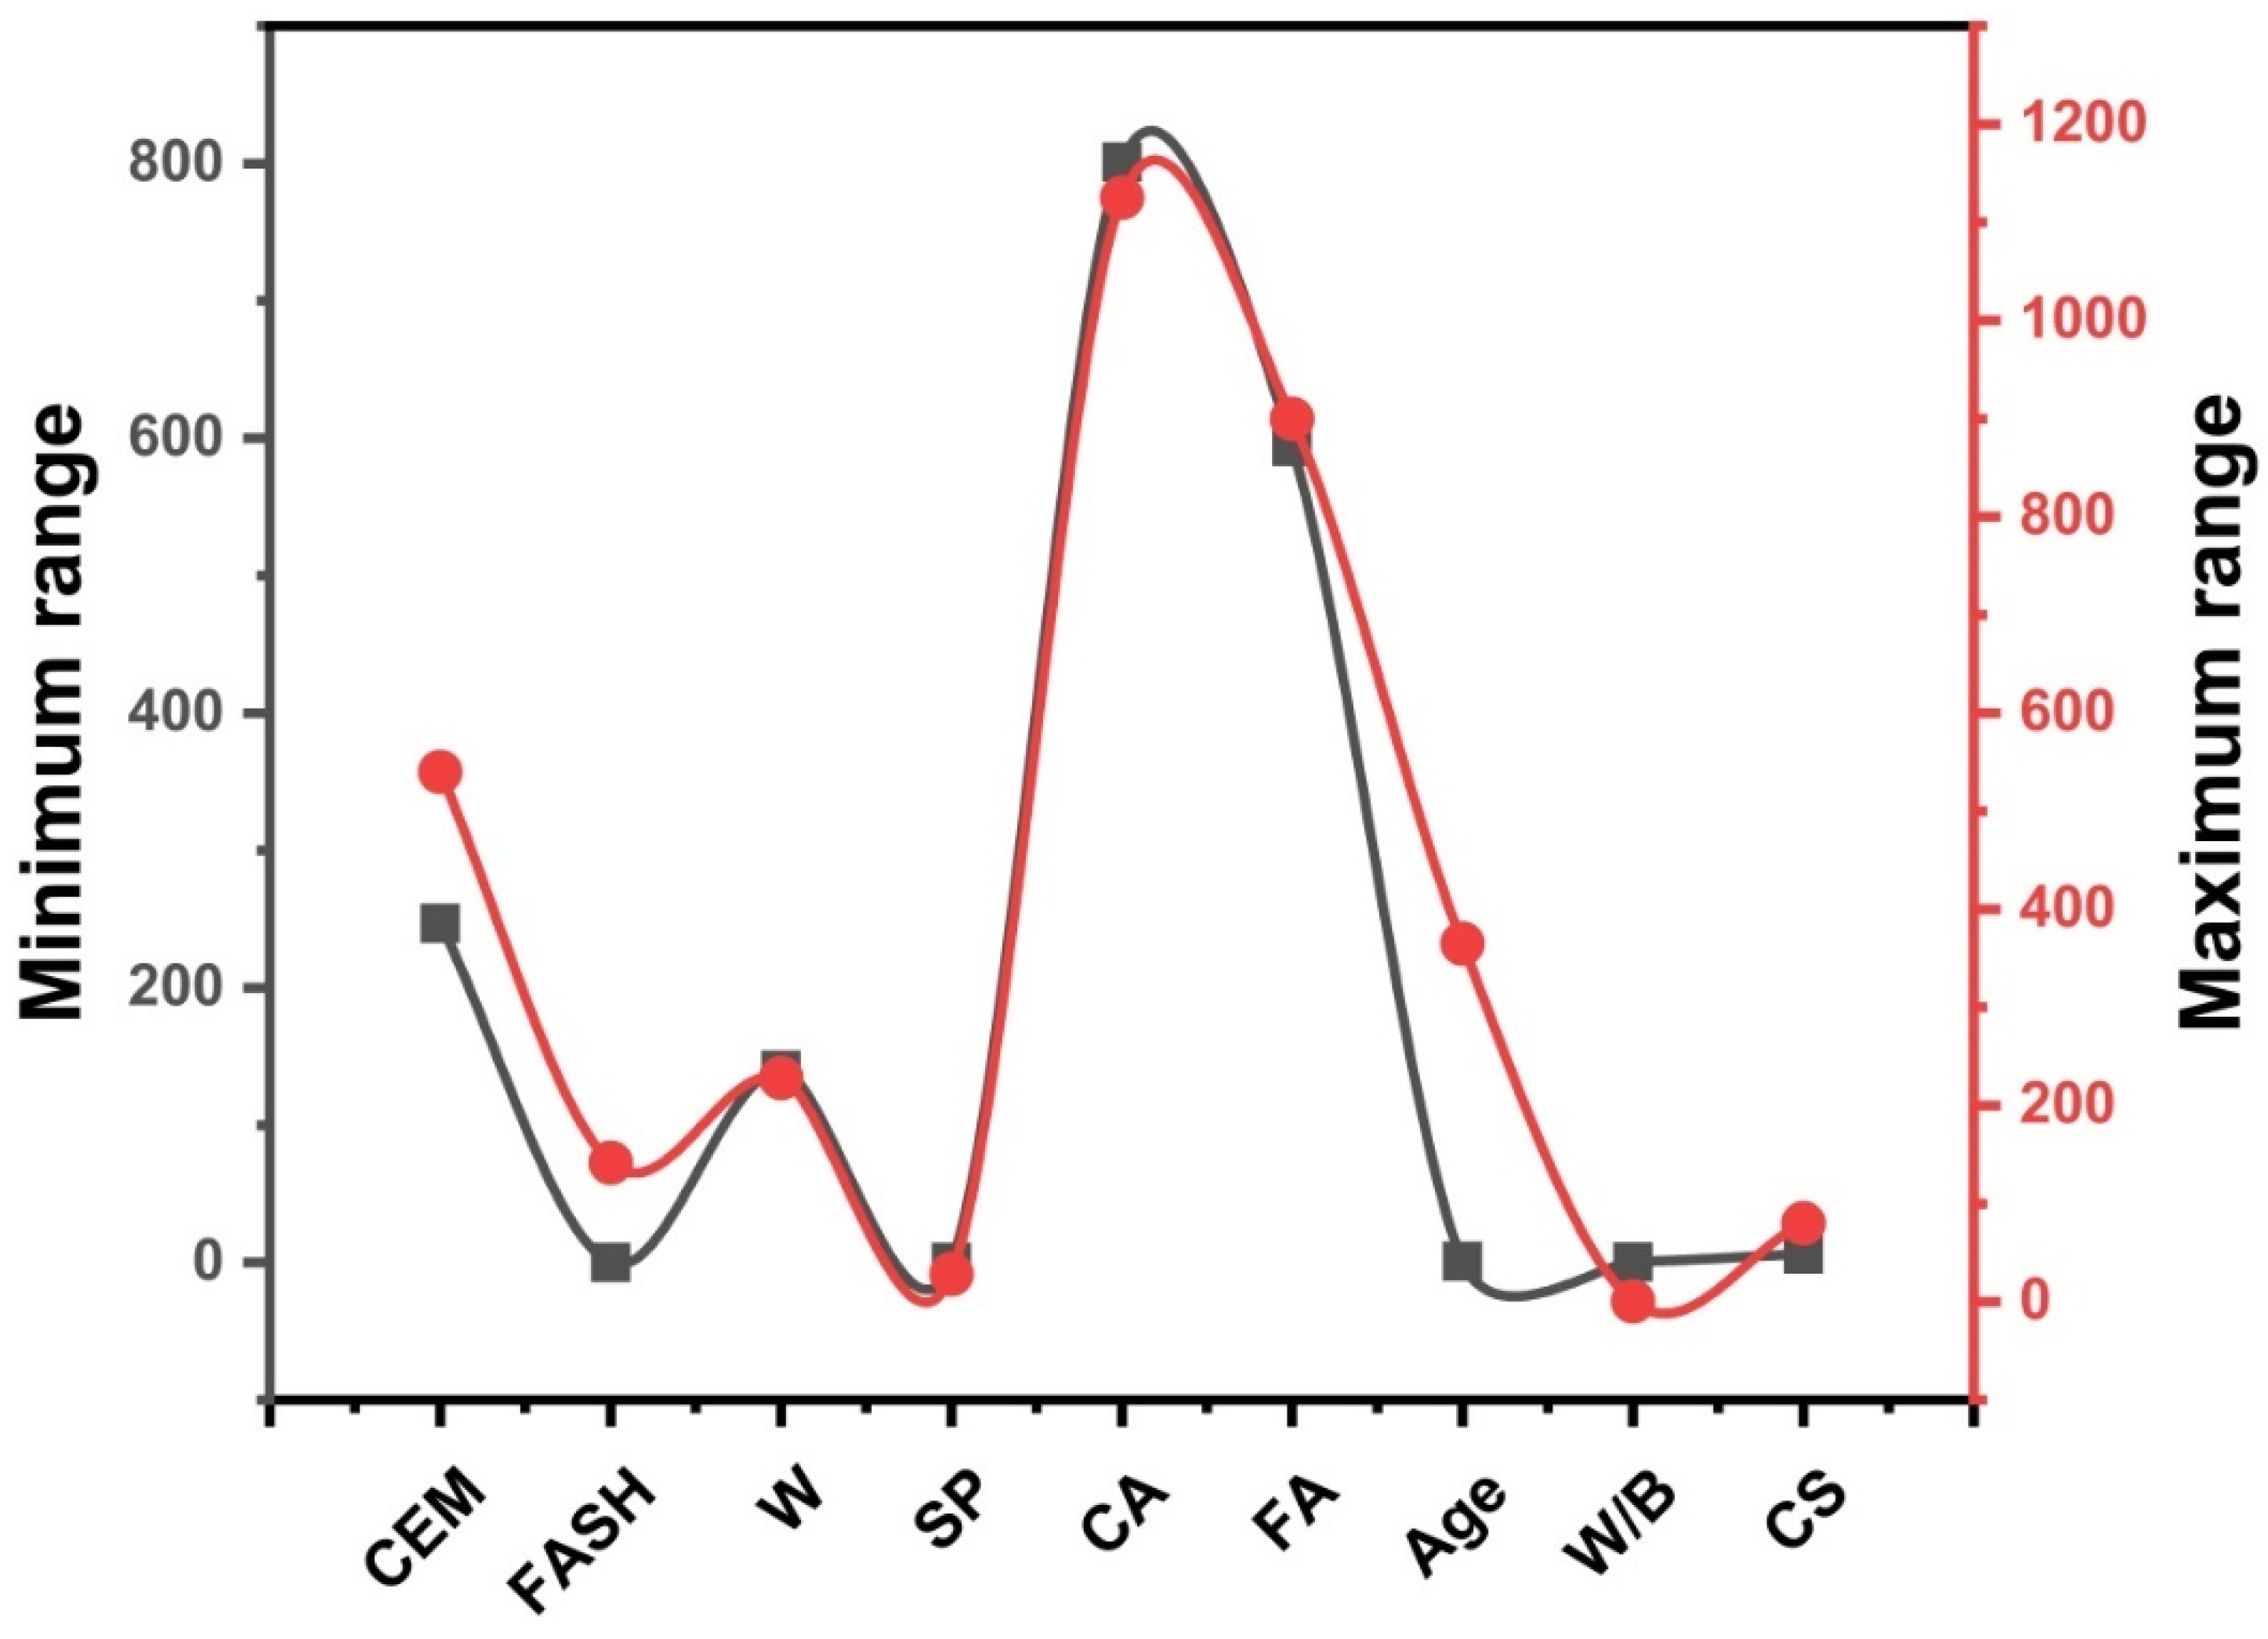
3. Data Description
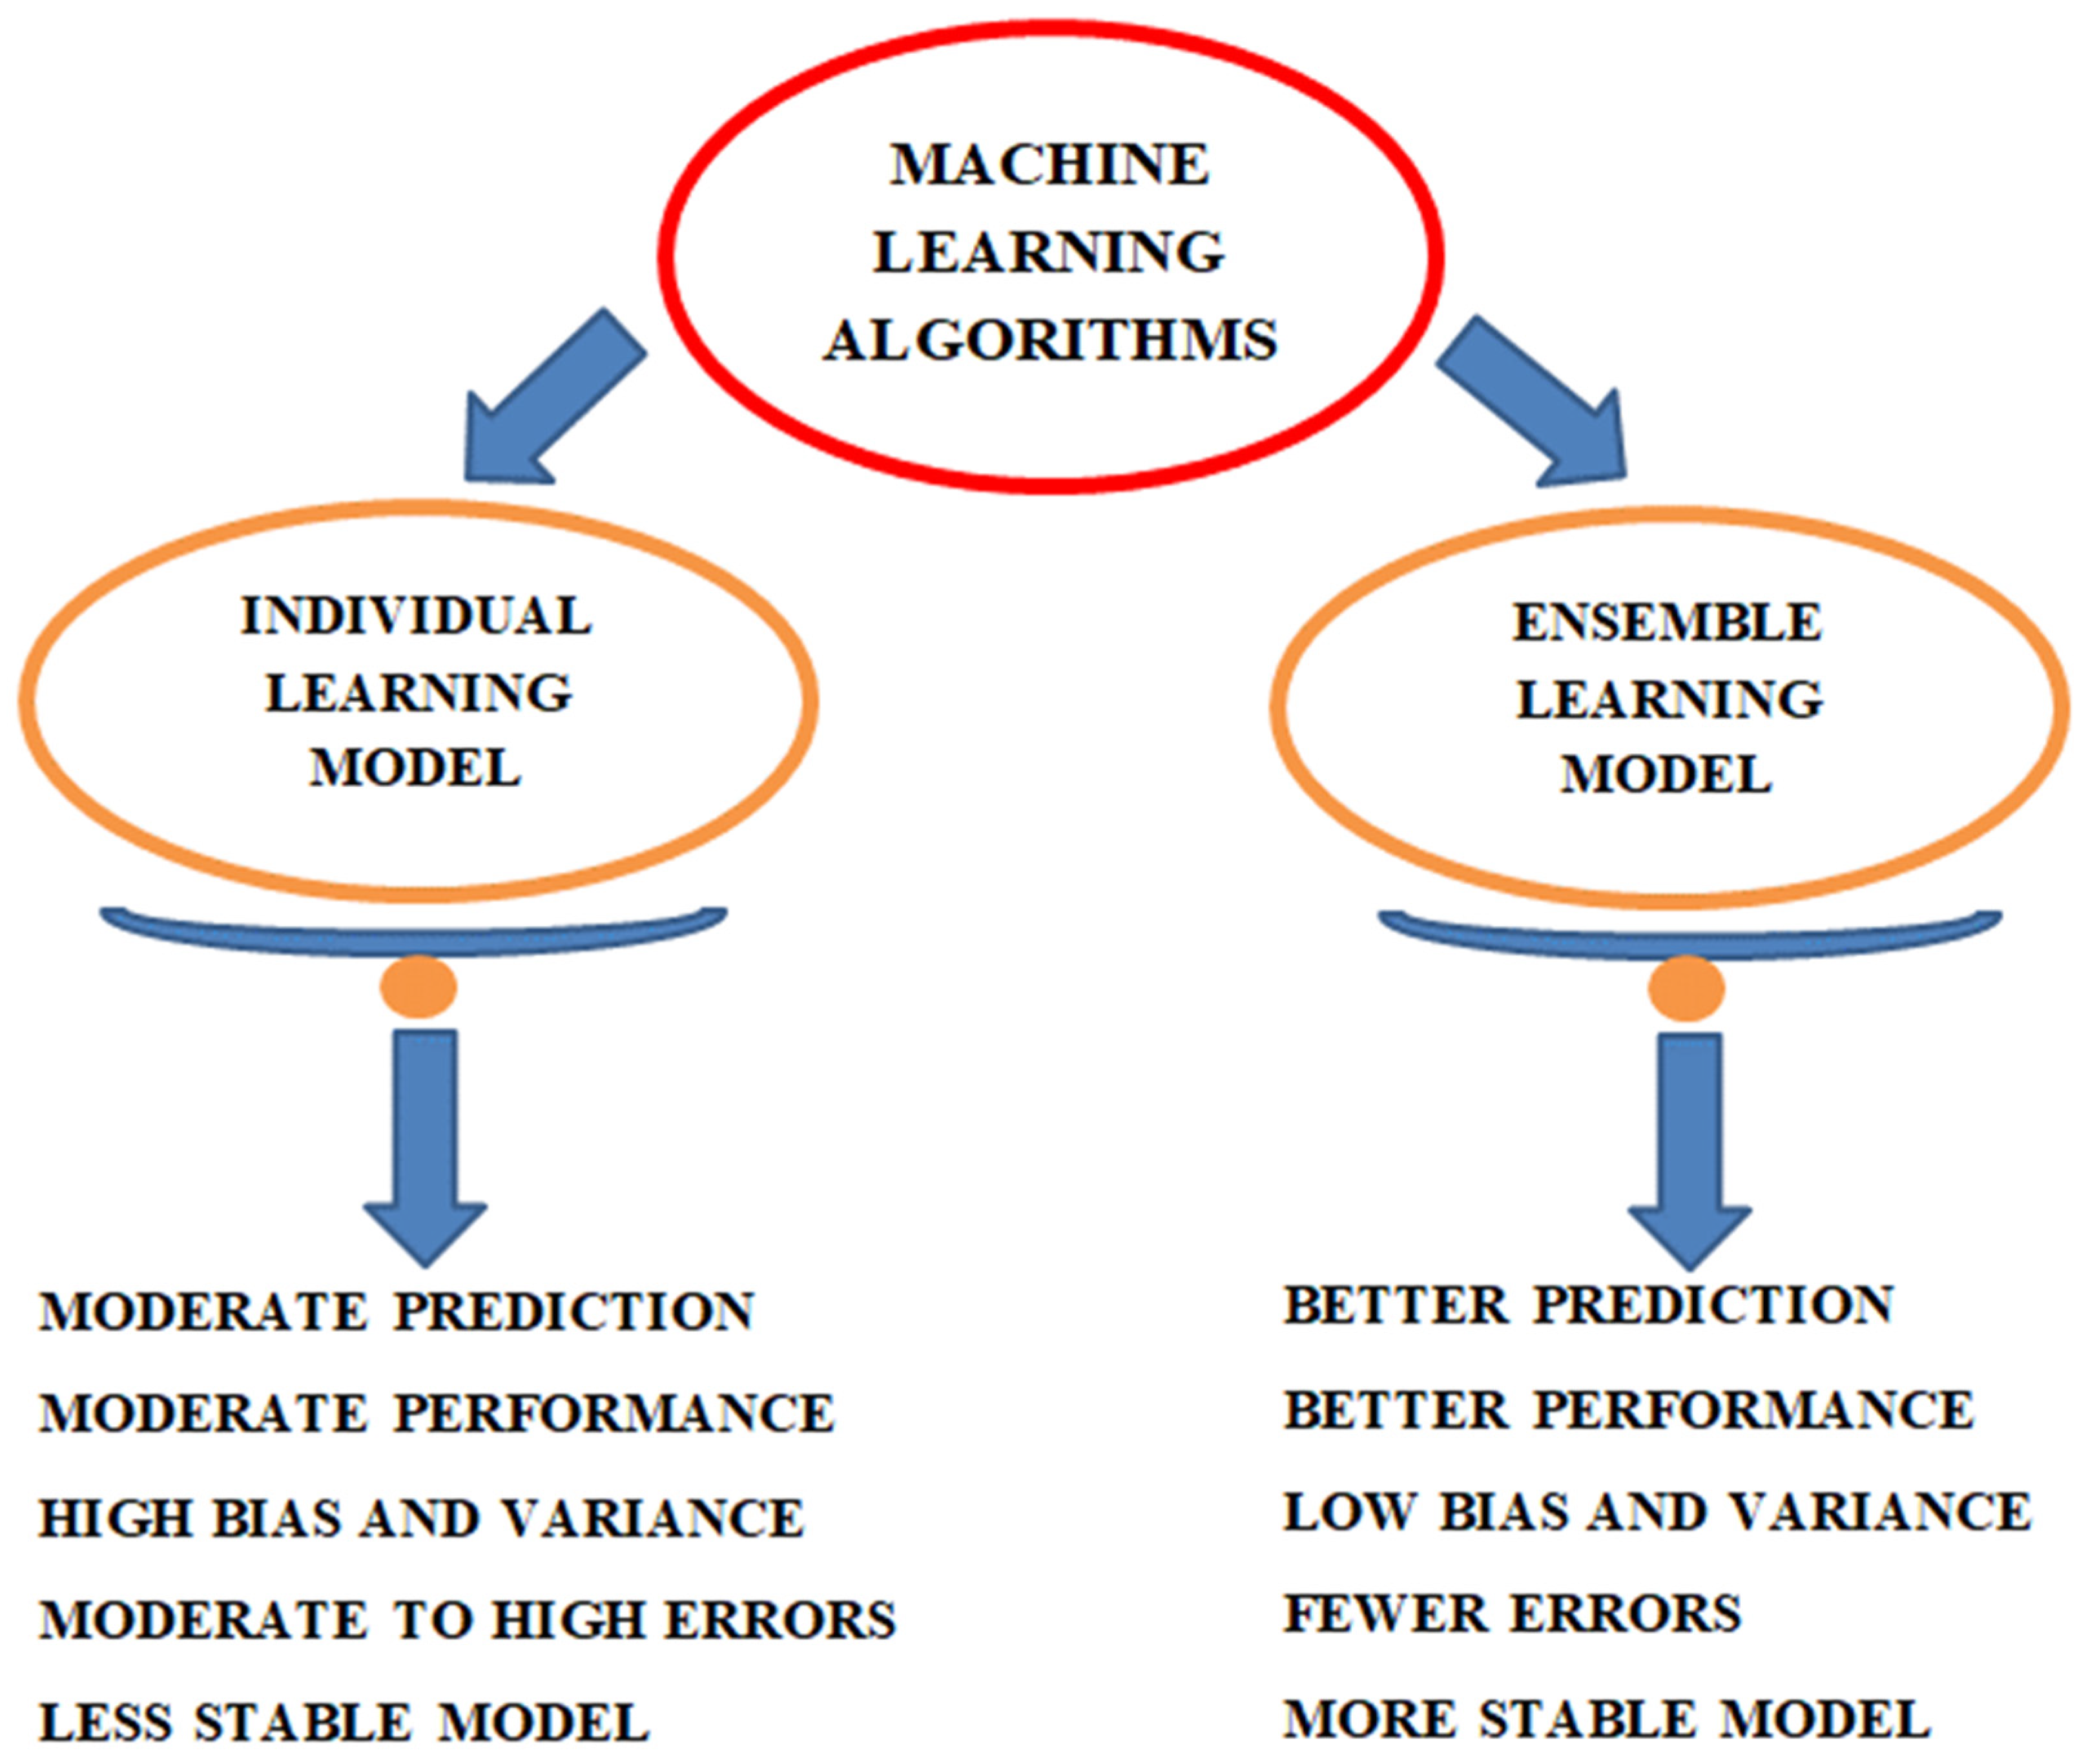
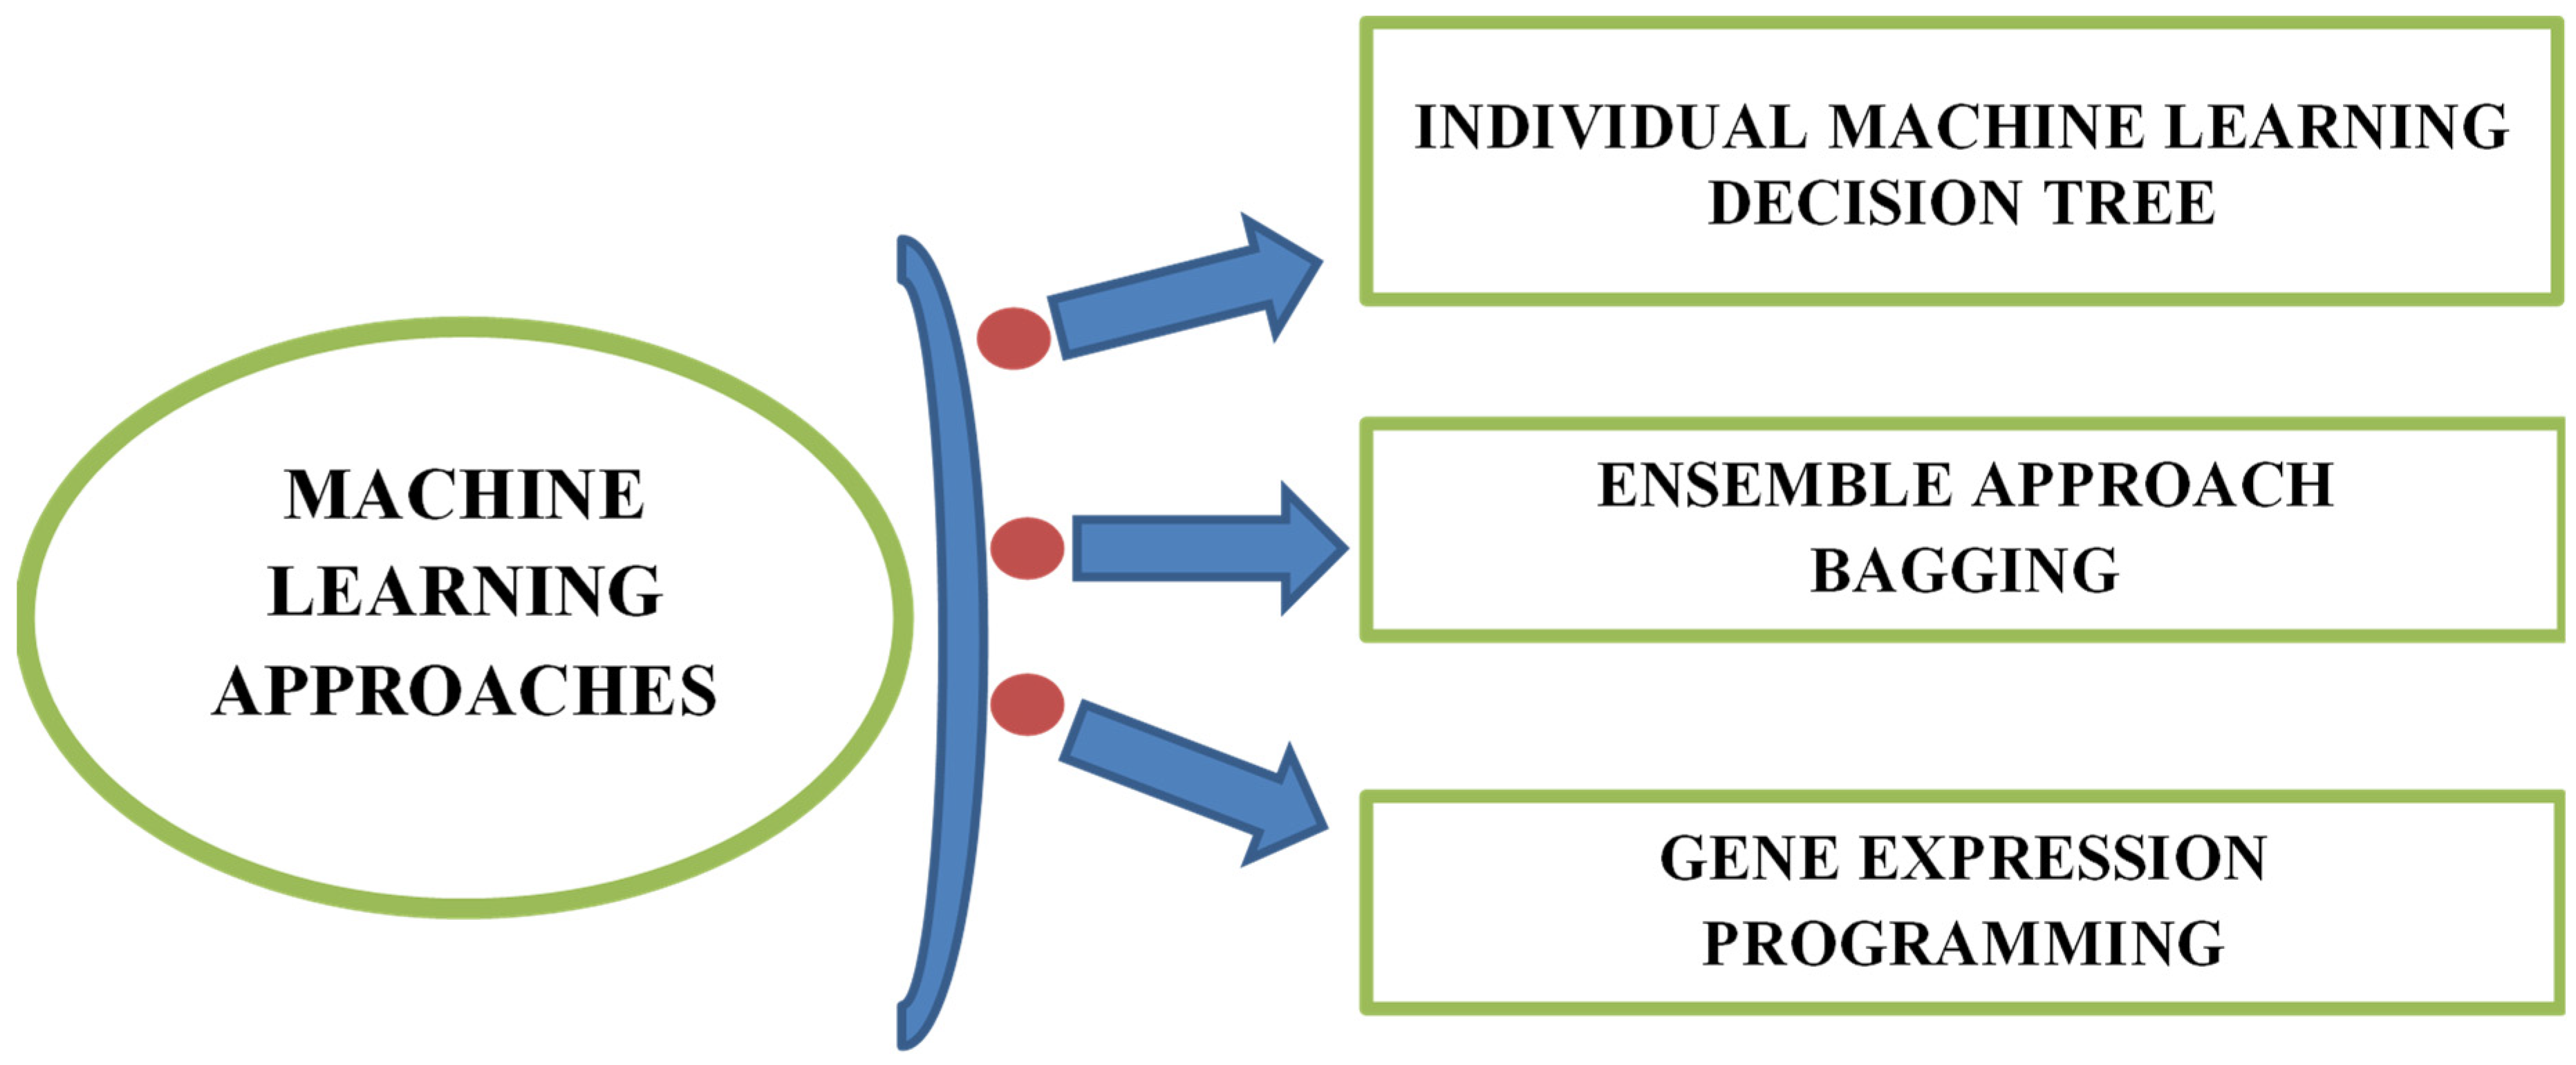
4. Methodology
4.1. Decision Tree
4.2. Ensemble Bagging Approach
4.3. Gene Expression Programming
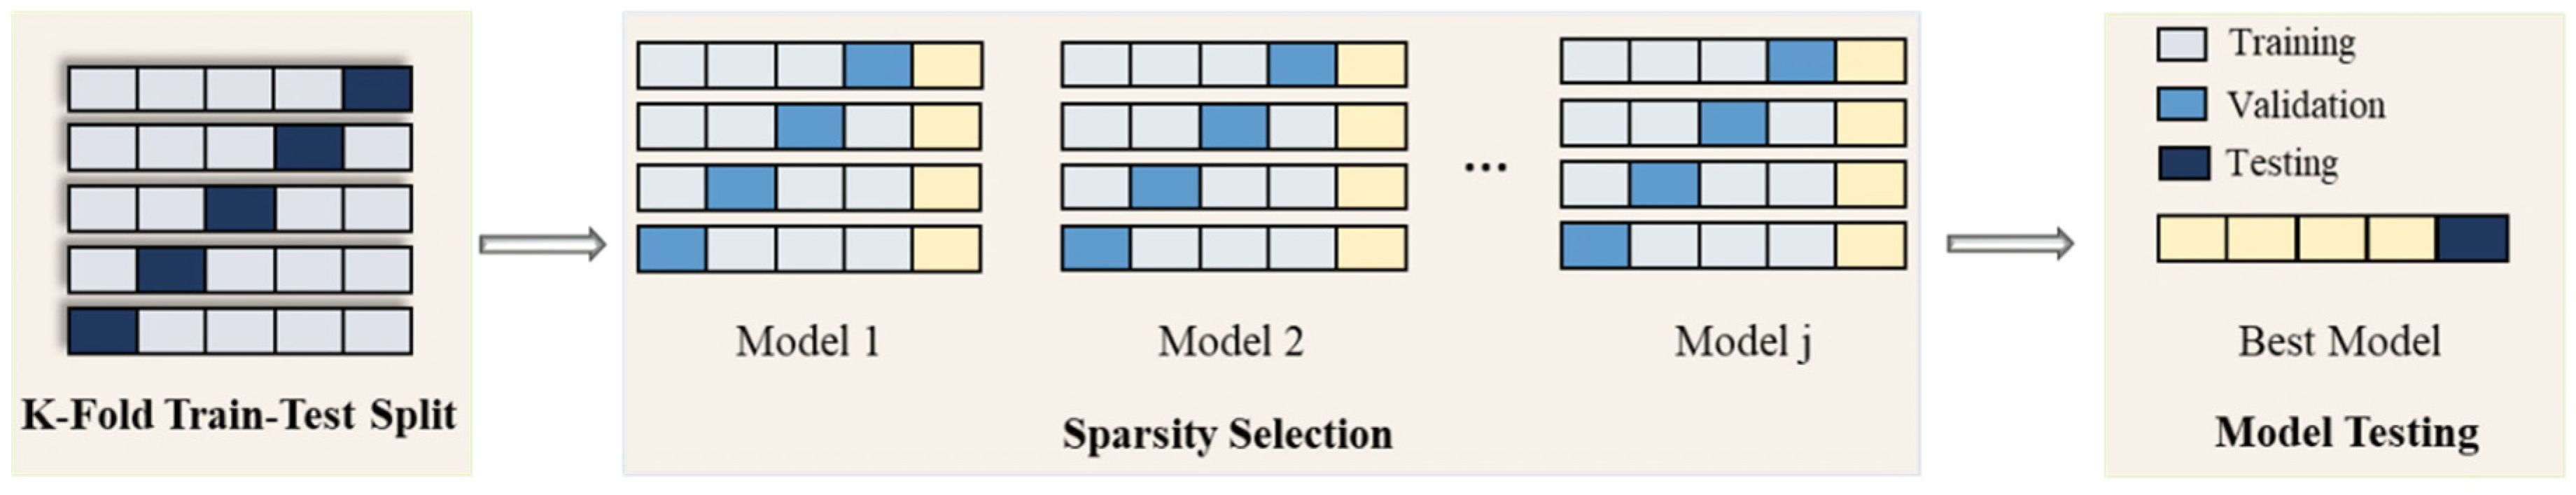
4.4. K-Fold Cross-Validation and Statistical Measures
- n = Total number of data samples,
- = reference values in the data sample,
- = predicted values from models.
5. Model Result
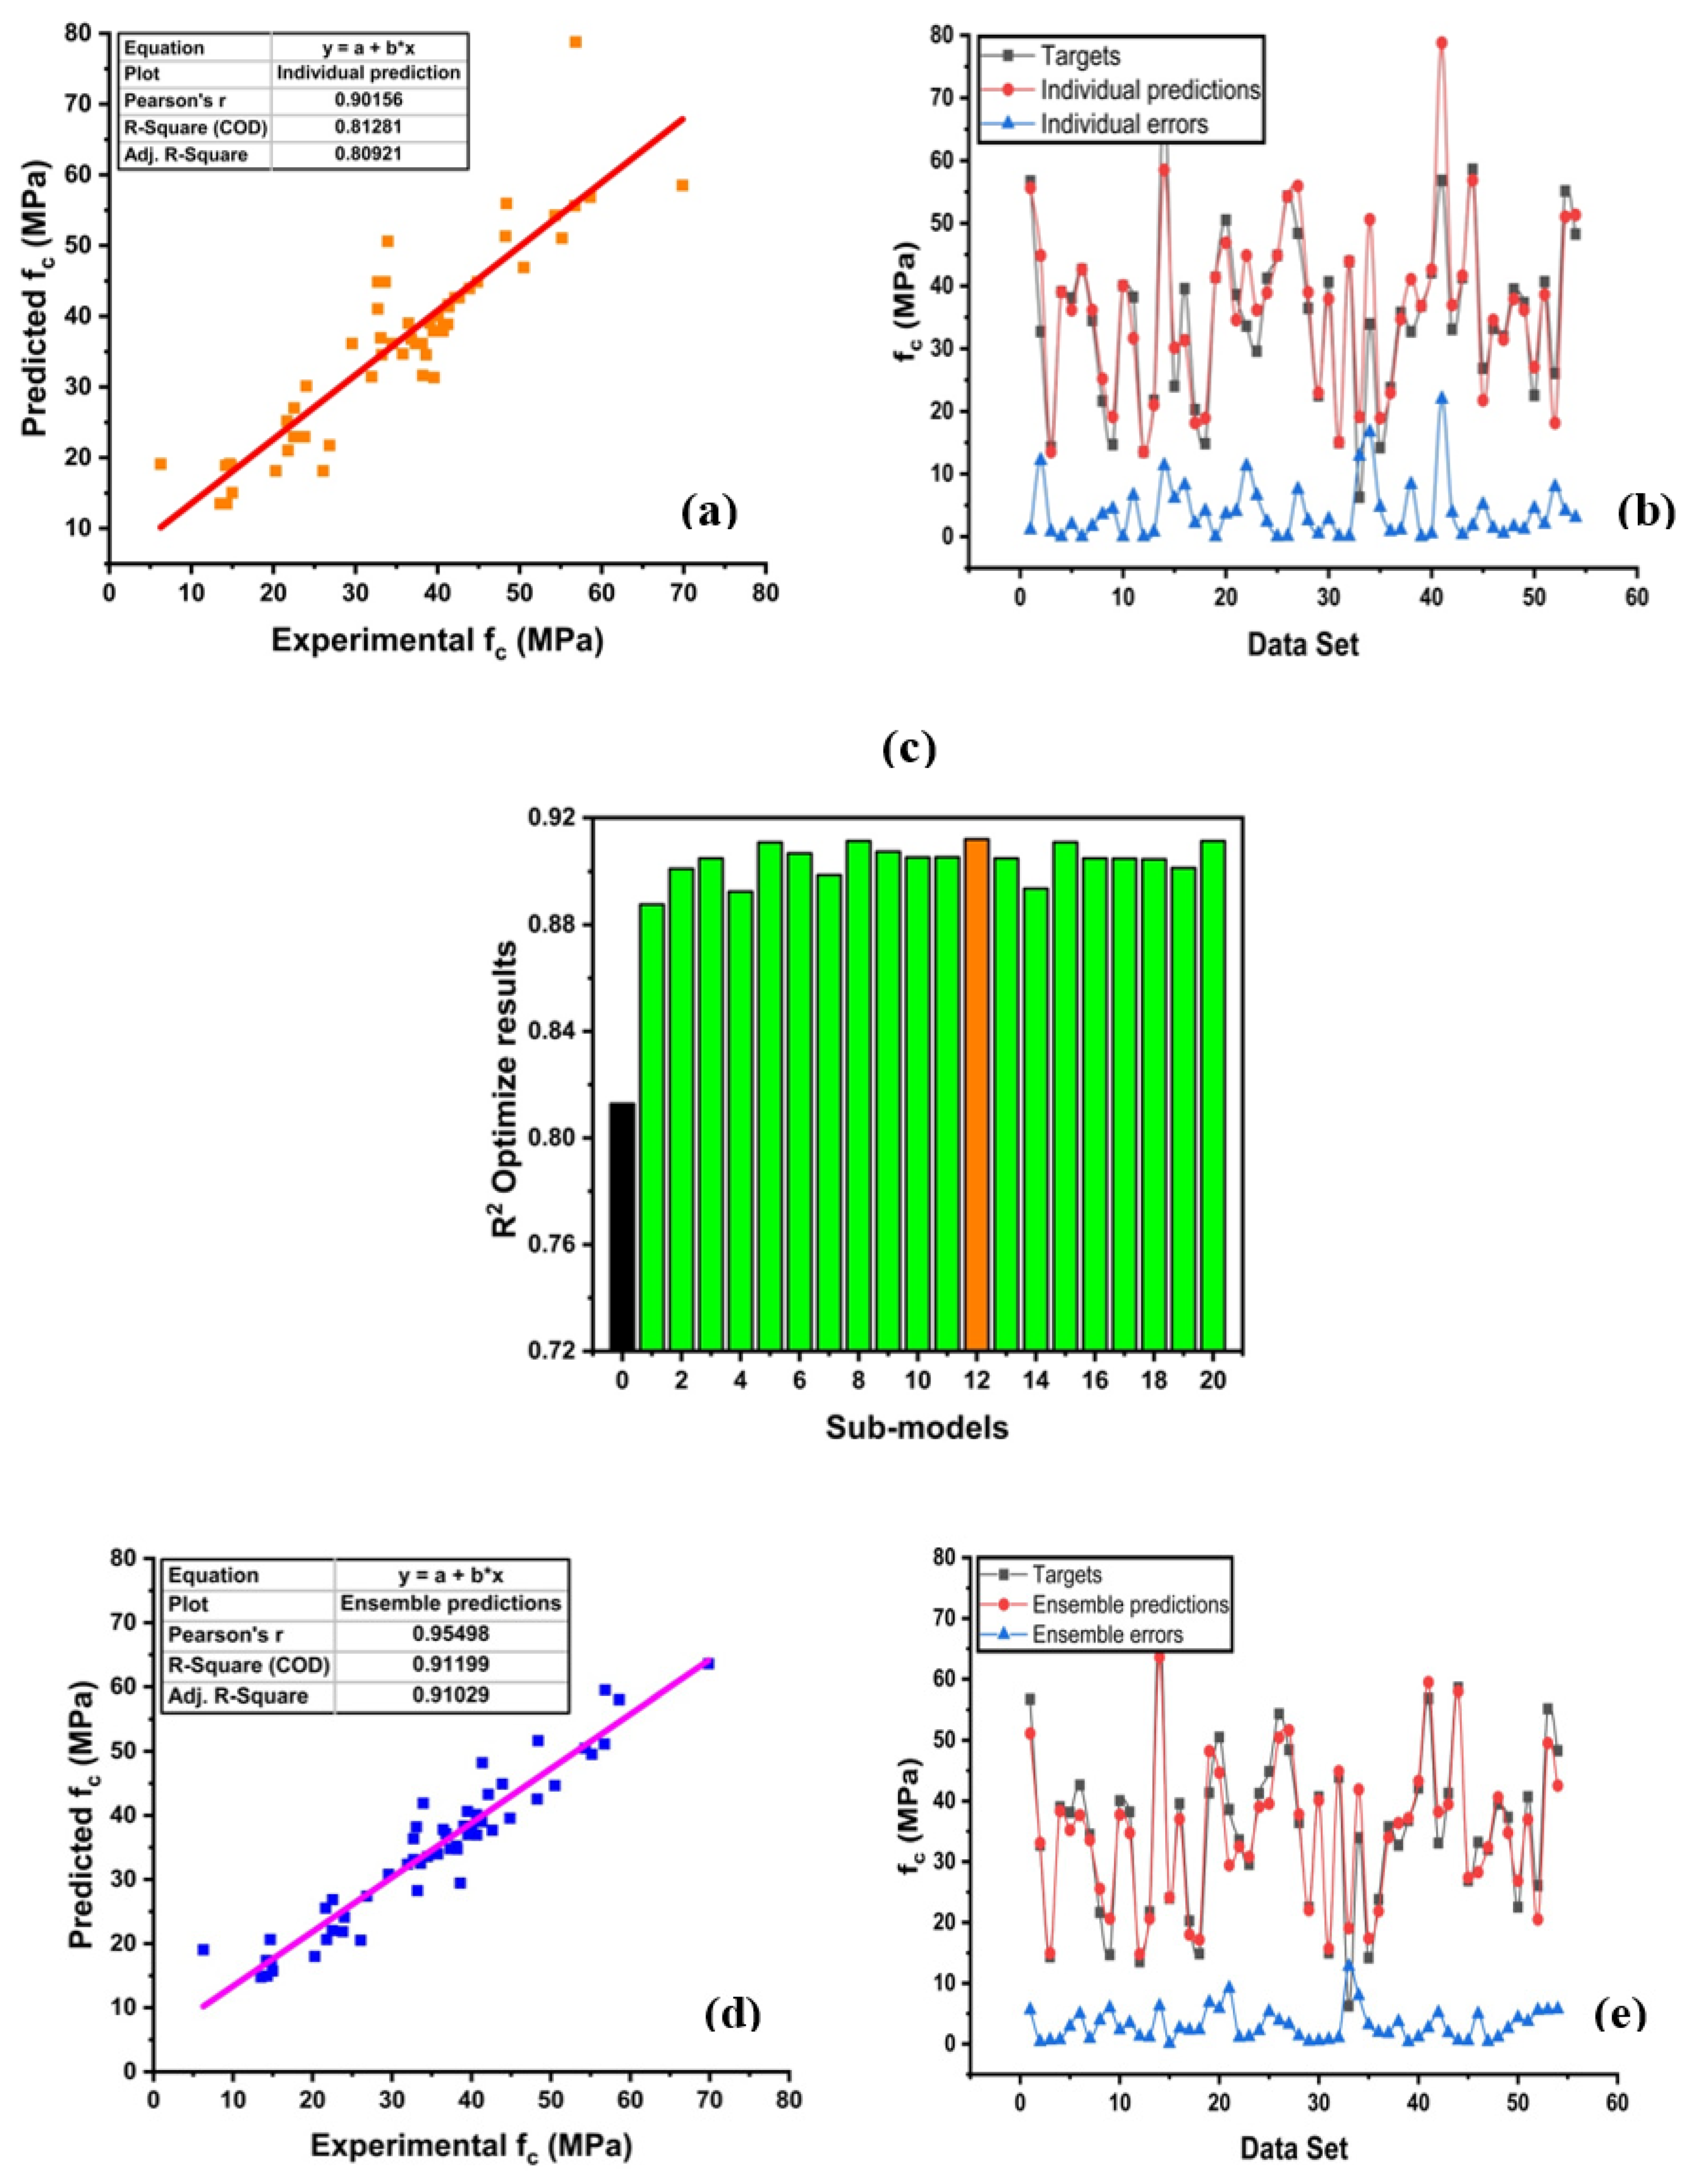
5.1. Decision Tree/Ensemble Model
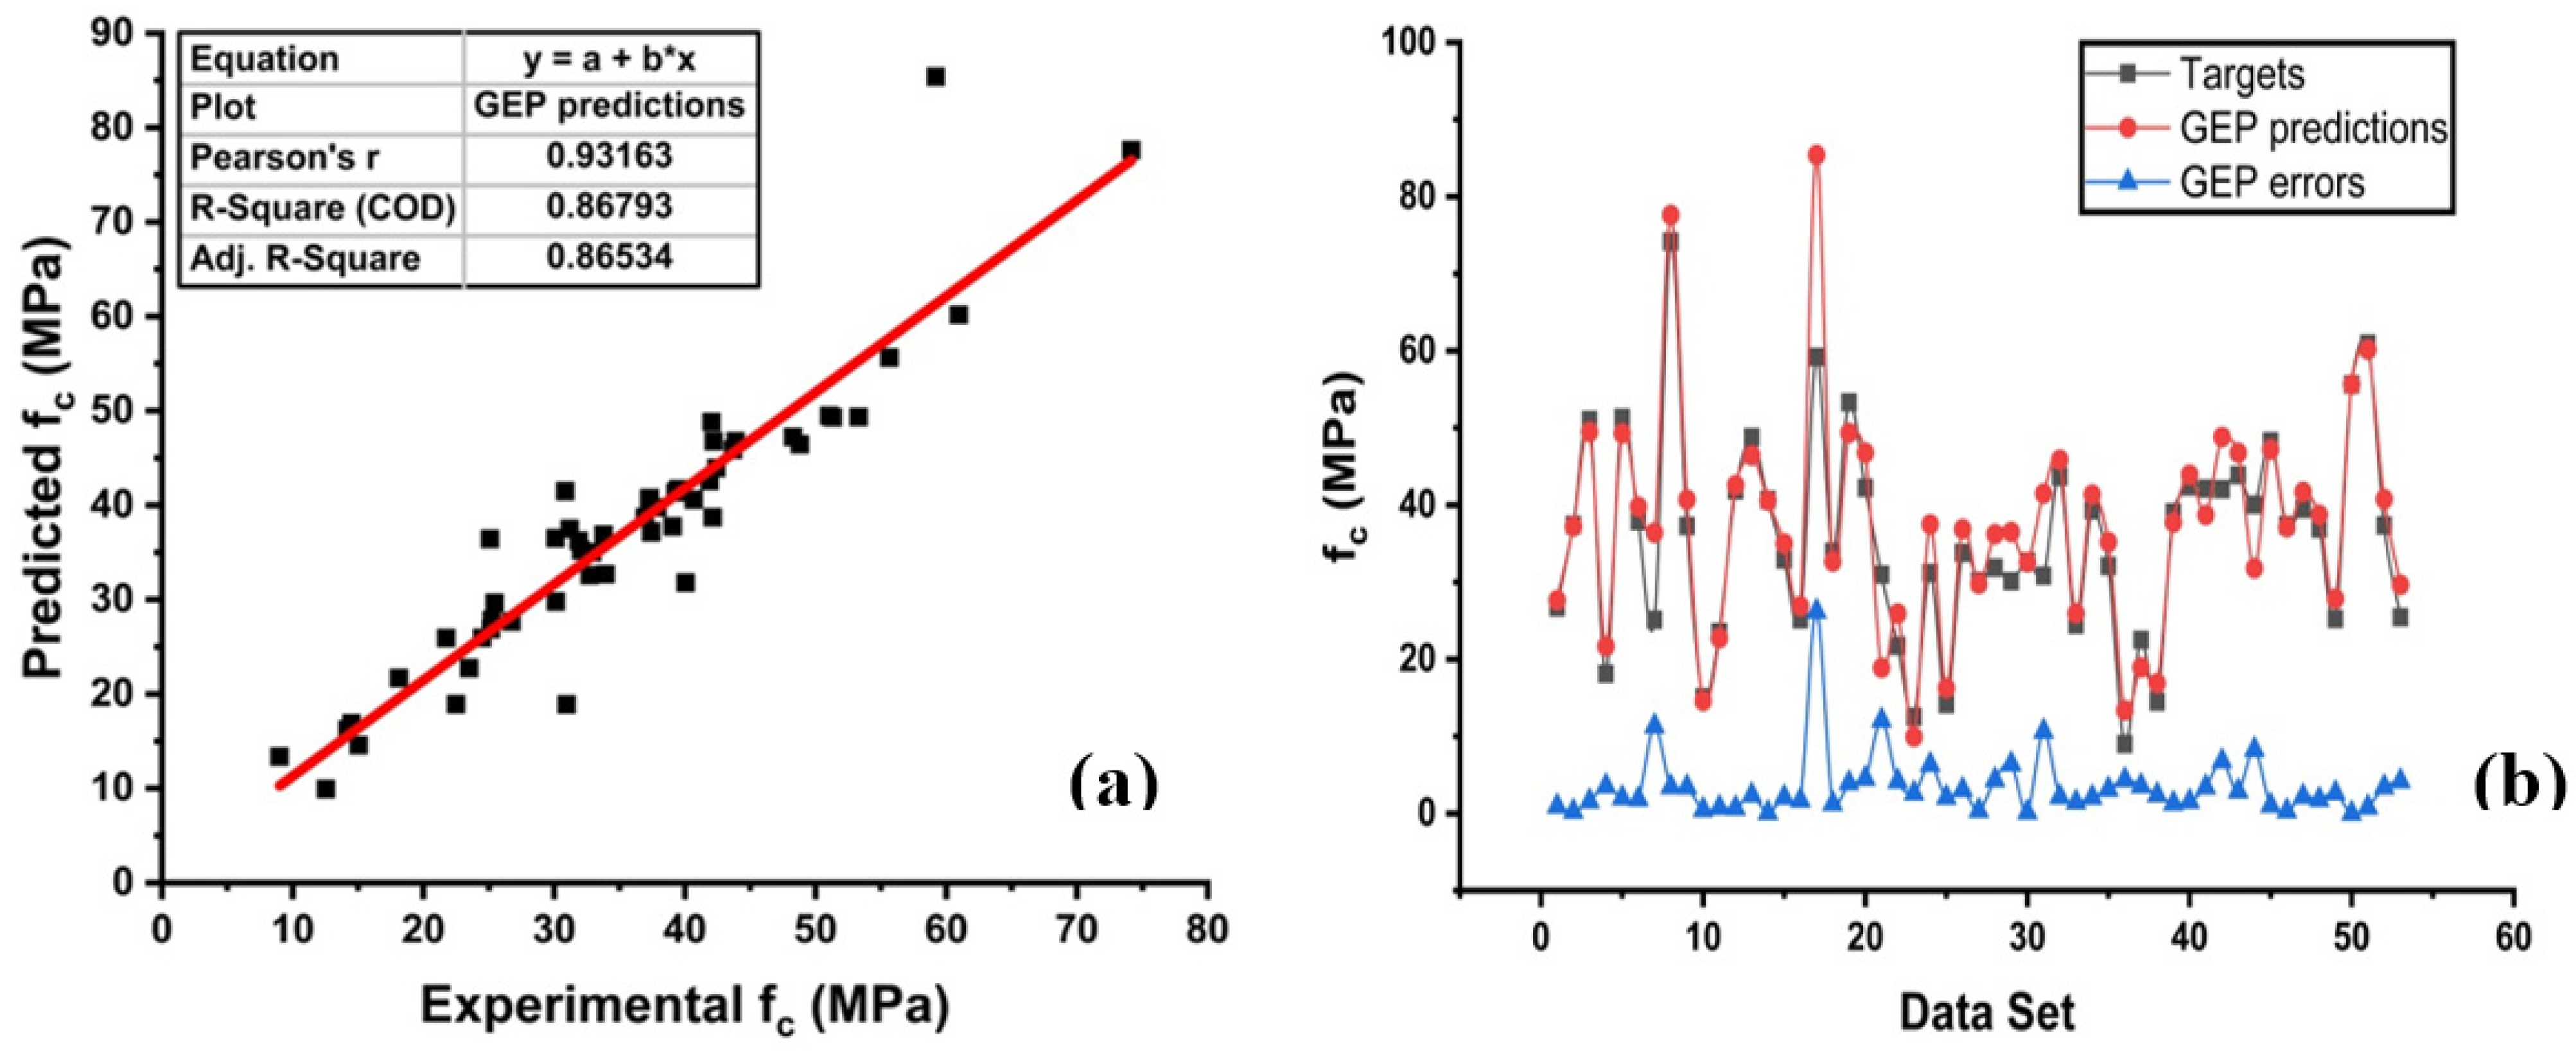
5.2. Gene Expression Programming
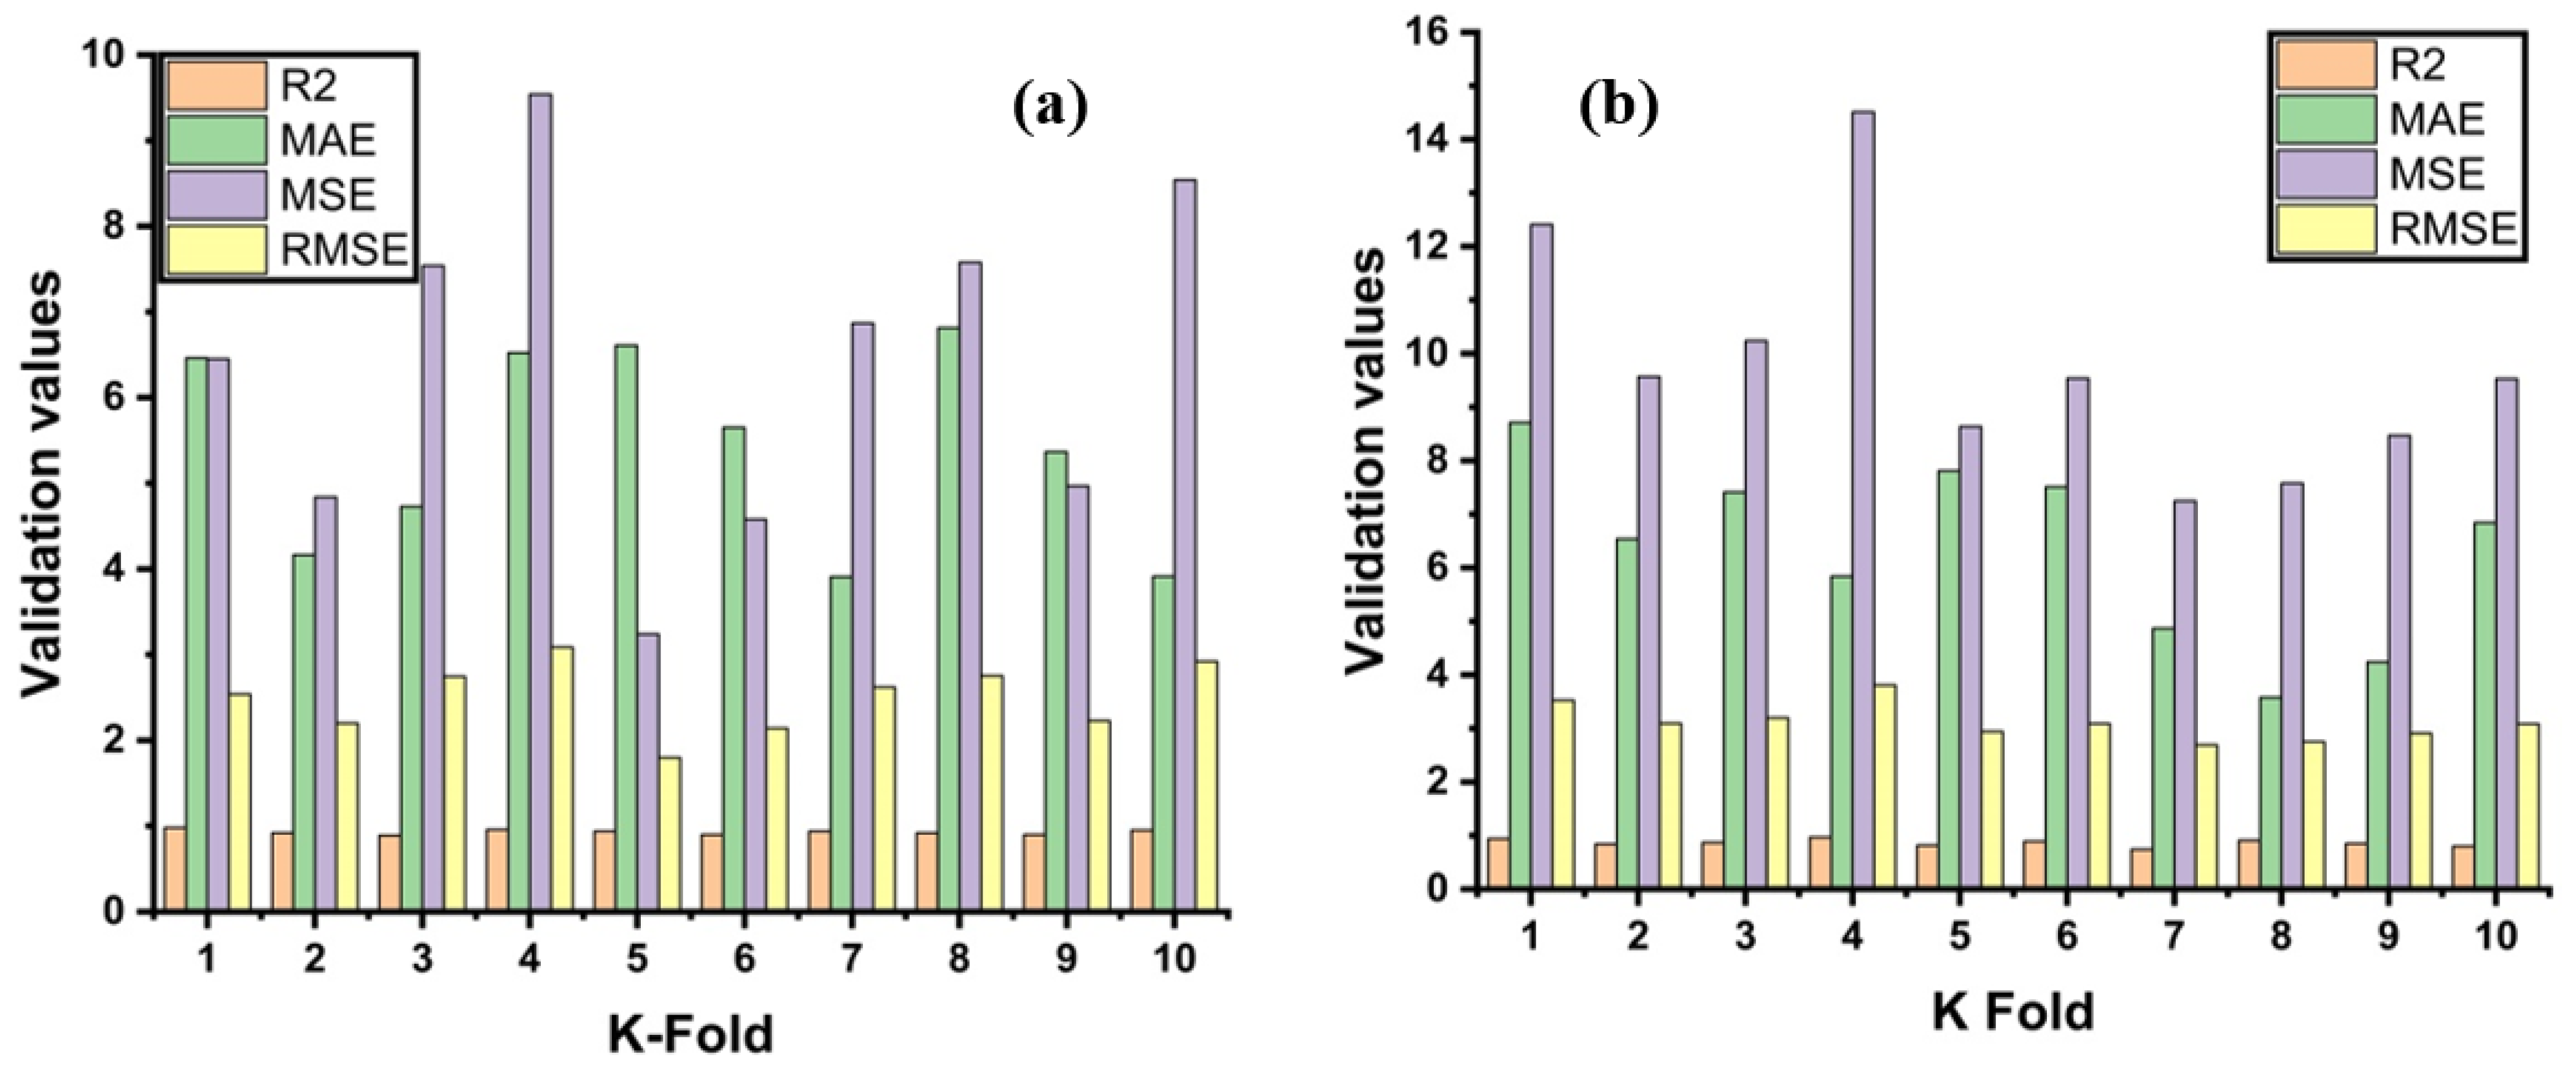
5.3. Evaluation of the Model by K-Fold and Statistical Checks
5.4. Limitation and Future Work
6. Conclusions
- A decision tree with ensemble modeling gives a robust performance compared to a decision tree individually and with gene expression programming. The correlation coefficient of R2 = 0.911 is reported for DT with bagging.
- Optimization of the model for the decision tree with bagging is done by making twenty sub-models. Magnificent enhancement is observed from the twelve, which shows R2 = 0.911 as compared to the individual model with R2 = 0.812.
- Validation score is conducted by different indicators. Both models (DT with bagging and GEP) show better anticipation for testing results.
- Statistical analysis checks reveal that the decision tree with bagging shows enhancement in model accuracy by minimizing the error difference between targeted and predicted values.
Author Contributions
Funding
Data Availability Statement
Conflicts of Interest
Appendix A

| S. No. | Cement | Fly Ash | Water | Super Plasticizer | Coarse Aggregate | Fine Aggregate | Days | W/C | Strength |
|---|---|---|---|---|---|---|---|---|---|
| 1 | 540 | 0 | 162 | 2.5 | 1040 | 676 | 28 | 0.3 | 79.99 |
| 2 | 540 | 0 | 162 | 2.5 | 1055 | 676 | 28 | 0.3 | 61.89 |
| 3 | 475 | 0 | 228 | 0 | 932 | 594 | 28 | 0.48 | 39.29 |
| 4 | 380 | 0 | 228 | 0 | 932 | 670 | 90 | 0.6 | 52.91 |
| 5 | 475 | 0 | 228 | 0 | 932 | 594 | 180 | 0.48 | 42.62 |
| 6 | 380 | 0 | 228 | 0 | 932 | 670 | 365 | 0.6 | 52.52 |
| 7 | 380 | 0 | 228 | 0 | 932 | 670 | 270 | 0.6 | 53.3 |
| 8 | 475 | 0 | 228 | 0 | 932 | 594 | 7 | 0.48 | 38.6 |
| 9 | 475 | 0 | 228 | 0 | 932 | 594 | 270 | 0.48 | 42.13 |
| 10 | 475 | 0 | 228 | 0 | 932 | 594 | 90 | 0.48 | 42.23 |
| 11 | 380 | 0 | 228 | 0 | 932 | 670 | 180 | 0.6 | 53.1 |
| 12 | 349 | 0 | 192 | 0 | 1047 | 806.9 | 3 | 0.55 | 15.05 |
| 13 | 475 | 0 | 228 | 0 | 932 | 594 | 365 | 0.48 | 41.93 |
| 14 | 310 | 0 | 192 | 0 | 971 | 850.6 | 3 | 0.62 | 9.87 |
| 15 | 485 | 0 | 146 | 0 | 1120 | 800 | 28 | 0.3 | 71.99 |
| 16 | 531.3 | 0 | 141.8 | 28.2 | 852.1 | 893.7 | 3 | 0.27 | 41.3 |
| 17 | 531.3 | 0 | 141.8 | 28.2 | 852.1 | 893.7 | 7 | 0.27 | 46.9 |
| 18 | 531.3 | 0 | 141.8 | 28.2 | 852.1 | 893.7 | 28 | 0.27 | 56.4 |
| 19 | 531.3 | 0 | 141.8 | 28.2 | 852.1 | 893.7 | 56 | 0.27 | 58.8 |
| 20 | 531.3 | 0 | 141.8 | 28.2 | 852.1 | 893.7 | 91 | 0.27 | 59.2 |
| 21 | 290.4 | 96.2 | 168.1 | 9.4 | 961.2 | 865 | 3 | 0.58 | 22.5 |
| 22 | 290.4 | 96.2 | 168.1 | 9.4 | 961.2 | 865 | 14 | 0.58 | 34.67 |
| 23 | 290.4 | 96.2 | 168.1 | 9.4 | 961.2 | 865 | 28 | 0.58 | 34.74 |
| 24 | 290.4 | 96.2 | 168.1 | 9.4 | 961.2 | 865 | 56 | 0.58 | 45.08 |
| 25 | 290.4 | 96.2 | 168.1 | 9.4 | 961.2 | 865 | 100 | 0.58 | 48.97 |
| 26 | 277.1 | 97.4 | 160.6 | 11.8 | 973.9 | 875.6 | 3 | 0.58 | 23.14 |
| 27 | 277.1 | 97.4 | 160.6 | 11.8 | 973.9 | 875.6 | 14 | 0.58 | 41.89 |
| 28 | 277.1 | 97.4 | 160.6 | 11.8 | 973.9 | 875.6 | 28 | 0.58 | 48.28 |
| 29 | 277.1 | 97.4 | 160.6 | 11.8 | 973.9 | 875.6 | 56 | 0.58 | 51.04 |
| 30 | 277.1 | 97.4 | 160.6 | 11.8 | 973.9 | 875.6 | 100 | 0.58 | 55.64 |
| 31 | 295.7 | 95.6 | 171.5 | 8.9 | 955.1 | 859.2 | 3 | 0.58 | 22.95 |
| 32 | 295.7 | 95.6 | 171.5 | 8.9 | 955.1 | 859.2 | 14 | 0.58 | 35.23 |
| 33 | 295.7 | 95.6 | 171.5 | 8.9 | 955.1 | 859.2 | 28 | 0.58 | 39.94 |
| 34 | 295.7 | 95.6 | 171.5 | 8.9 | 955.1 | 859.2 | 56 | 0.58 | 48.72 |
| 35 | 295.7 | 95.6 | 171.5 | 8.9 | 955.1 | 859.2 | 100 | 0.58 | 52.04 |
| 36 | 251.8 | 99.9 | 146.1 | 12.4 | 1006 | 899.8 | 3 | 0.58 | 21.02 |
| 37 | 251.8 | 99.9 | 146.1 | 12.4 | 1006 | 899.8 | 14 | 0.58 | 33.36 |
| 38 | 251.8 | 99.9 | 146.1 | 12.4 | 1006 | 899.8 | 28 | 0.58 | 33.94 |
| 39 | 251.8 | 99.9 | 146.1 | 12.4 | 1006 | 899.8 | 56 | 0.58 | 44.14 |
| 40 | 251.8 | 99.9 | 146.1 | 12.4 | 1006 | 899.8 | 100 | 0.58 | 45.37 |
| 41 | 249.1 | 98.8 | 158.1 | 12.8 | 987.8 | 889 | 3 | 0.63 | 15.36 |
| 42 | 249.1 | 98.8 | 158.1 | 12.8 | 987.8 | 889 | 14 | 0.63 | 28.68 |
| 43 | 249.1 | 98.8 | 158.1 | 12.8 | 987.8 | 889 | 28 | 0.63 | 30.85 |
| 44 | 249.1 | 98.8 | 158.1 | 12.8 | 987.8 | 889 | 56 | 0.63 | 42.03 |
| 45 | 249.1 | 98.8 | 158.1 | 12.8 | 987.8 | 889 | 100 | 0.63 | 51.06 |
| 46 | 252.3 | 98.8 | 146.3 | 14.2 | 987.8 | 889 | 3 | 0.58 | 21.78 |
| 47 | 252.3 | 98.8 | 146.3 | 14.2 | 987.8 | 889 | 14 | 0.58 | 42.29 |
| 48 | 252.3 | 98.8 | 146.3 | 14.2 | 987.8 | 889 | 28 | 0.58 | 50.6 |
| 49 | 252.3 | 98.8 | 146.3 | 14.2 | 987.8 | 889 | 56 | 0.58 | 55.83 |
| 50 | 252.3 | 98.8 | 146.3 | 14.2 | 987.8 | 889 | 100 | 0.58 | 60.95 |
| 51 | 246.8 | 125.1 | 143.3 | 12 | 1086.8 | 800.9 | 3 | 0.58 | 23.52 |
| 52 | 246.8 | 125.1 | 143.3 | 12 | 1086.8 | 800.9 | 14 | 0.58 | 42.22 |
| 53 | 246.8 | 125.1 | 143.3 | 12 | 1086.8 | 800.9 | 28 | 0.58 | 52.5 |
| 54 | 246.8 | 125.1 | 143.3 | 12 | 1086.8 | 800.9 | 56 | 0.58 | 60.32 |
| 55 | 246.8 | 125.1 | 143.3 | 12 | 1086.8 | 800.9 | 100 | 0.58 | 66.42 |
| 56 | 275.1 | 121.4 | 159.5 | 9.9 | 1053.6 | 777.5 | 3 | 0.58 | 23.8 |
| 57 | 275.1 | 121.4 | 159.5 | 9.9 | 1053.6 | 777.5 | 14 | 0.58 | 38.77 |
| 58 | 275.1 | 121.4 | 159.5 | 9.9 | 1053.6 | 777.5 | 28 | 0.58 | 51.33 |
| 59 | 275.1 | 121.4 | 159.5 | 9.9 | 1053.6 | 777.5 | 56 | 0.58 | 56.85 |
| 60 | 275.1 | 121.4 | 159.5 | 9.9 | 1053.6 | 777.5 | 100 | 0.58 | 58.61 |
| 61 | 297.2 | 117.5 | 174.8 | 9.5 | 1022.8 | 753.5 | 3 | 0.59 | 21.91 |
| 62 | 297.2 | 117.5 | 174.8 | 9.5 | 1022.8 | 753.5 | 14 | 0.59 | 36.99 |
| 63 | 297.2 | 117.5 | 174.8 | 9.5 | 1022.8 | 753.5 | 28 | 0.59 | 47.4 |
| 64 | 297.2 | 117.5 | 174.8 | 9.5 | 1022.8 | 753.5 | 56 | 0.59 | 51.96 |
| 65 | 297.2 | 117.5 | 174.8 | 9.5 | 1022.8 | 753.5 | 100 | 0.59 | 56.74 |
| 66 | 376 | 0 | 214.6 | 0 | 1003.5 | 762.4 | 3 | 0.57 | 16.28 |
| 67 | 376 | 0 | 214.6 | 0 | 1003.5 | 762.4 | 14 | 0.57 | 25.62 |
| 68 | 376 | 0 | 214.6 | 0 | 1003.5 | 762.4 | 28 | 0.57 | 31.97 |
| 69 | 376 | 0 | 214.6 | 0 | 1003.5 | 762.4 | 56 | 0.57 | 36.3 |
| 70 | 376 | 0 | 214.6 | 0 | 1003.5 | 762.4 | 100 | 0.57 | 43.06 |
| 71 | 500 | 0 | 140 | 4 | 966 | 853 | 28 | 0.28 | 67.57 |
| 72 | 475 | 59 | 142 | 1.9 | 1098 | 641 | 28 | 0.3 | 57.23 |
| 73 | 505 | 60 | 195 | 0 | 1030 | 630 | 28 | 0.39 | 64.02 |
| 74 | 451 | 0 | 165 | 11.3 | 1030 | 745 | 28 | 0.37 | 78.8 |
| 75 | 516 | 0 | 162 | 8.2 | 801 | 802 | 28 | 0.31 | 41.37 |
| 76 | 520 | 0 | 170 | 5.2 | 855 | 855 | 28 | 0.33 | 60.28 |
| 77 | 528 | 0 | 185 | 6.9 | 920 | 720 | 28 | 0.35 | 56.83 |
| 78 | 520 | 0 | 175 | 5.2 | 870 | 805 | 28 | 0.34 | 51.02 |
| 79 | 385 | 136 | 158 | 20 | 903 | 768 | 28 | 0.41 | 55.55 |
| 80 | 500.1 | 0 | 200 | 3 | 1124.4 | 613.2 | 28 | 0.4 | 44.13 |
| 81 | 405 | 0 | 175 | 0 | 1120 | 695 | 28 | 0.43 | 52.3 |
| 82 | 516 | 0 | 162 | 8.3 | 801 | 802 | 28 | 0.31 | 41.37 |
| 83 | 475 | 0 | 162 | 9.5 | 1044 | 662 | 28 | 0.34 | 58.52 |
| 84 | 500 | 0 | 151 | 9 | 1033 | 655 | 28 | 0.3 | 69.84 |
| 85 | 436 | 0 | 218 | 0 | 838.4 | 719.7 | 28 | 0.5 | 23.85 |
| 86 | 289 | 0 | 192 | 0 | 913.2 | 895.3 | 90 | 0.66 | 32.07 |
| 87 | 289 | 0 | 192 | 0 | 913.2 | 895.3 | 3 | 0.66 | 11.65 |
| 88 | 393 | 0 | 192 | 0 | 940.6 | 785.6 | 3 | 0.49 | 19.2 |
| 89 | 393 | 0 | 192 | 0 | 940.6 | 785.6 | 90 | 0.49 | 48.85 |
| 90 | 393 | 0 | 192 | 0 | 940.6 | 785.6 | 28 | 0.49 | 39.6 |
| 91 | 480 | 0 | 192 | 0 | 936.2 | 712.2 | 28 | 0.4 | 43.94 |
| 92 | 480 | 0 | 192 | 0 | 936.2 | 712.2 | 7 | 0.4 | 34.57 |
| 93 | 480 | 0 | 192 | 0 | 936.2 | 712.2 | 90 | 0.4 | 54.32 |
| 94 | 480 | 0 | 192 | 0 | 936.2 | 712.2 | 3 | 0.4 | 24.4 |
| 95 | 333 | 0 | 192 | 0 | 931.2 | 842.6 | 3 | 0.58 | 15.62 |
| 96 | 289 | 0 | 192 | 0 | 913.2 | 895.3 | 7 | 0.66 | 14.6 |
| 97 | 333 | 0 | 192 | 0 | 931.2 | 842.6 | 28 | 0.58 | 31.97 |
| 98 | 333 | 0 | 192 | 0 | 931.2 | 842.6 | 7 | 0.58 | 23.4 |
| 99 | 289 | 0 | 192 | 0 | 913.2 | 895.3 | 28 | 0.66 | 25.57 |
| 100 | 333 | 0 | 192 | 0 | 931.2 | 842.6 | 90 | 0.58 | 41.68 |
| 101 | 393 | 0 | 192 | 0 | 940.6 | 785.6 | 7 | 0.49 | 27.74 |
| 102 | 397 | 0 | 185.7 | 0 | 1040.6 | 734.3 | 28 | 0.47 | 33.08 |
| 103 | 382.5 | 0 | 185.7 | 0 | 1047.8 | 739.3 | 7 | 0.49 | 24.07 |
| 104 | 295.8 | 0 | 185.7 | 0 | 1091.4 | 769.3 | 7 | 0.63 | 14.84 |
| 105 | 397 | 0 | 185.7 | 0 | 1040.6 | 734.3 | 7 | 0.47 | 25.45 |
| 106 | 381.4 | 0 | 185.7 | 0 | 1104.6 | 784.3 | 28 | 0.49 | 22.49 |
| 107 | 295.8 | 0 | 185.7 | 0 | 1091.4 | 769.3 | 28 | 0.63 | 25.22 |
| 108 | 339.2 | 0 | 185.7 | 0 | 1069.2 | 754.3 | 7 | 0.55 | 21.18 |
| 109 | 381.4 | 0 | 185.7 | 0 | 1104.6 | 784.3 | 7 | 0.49 | 14.54 |
| 110 | 339.2 | 0 | 185.7 | 0 | 1069.2 | 754.3 | 28 | 0.55 | 31.9 |
| 111 | 382.5 | 0 | 185.7 | 0 | 1047.8 | 739.3 | 28 | 0.49 | 37.44 |
| 112 | 339 | 0 | 197 | 0 | 968 | 781 | 3 | 0.58 | 13.22 |
| 113 | 339 | 0 | 197 | 0 | 968 | 781 | 7 | 0.58 | 20.97 |
| 114 | 339 | 0 | 197 | 0 | 968 | 781 | 14 | 0.58 | 27.04 |
| 115 | 339 | 0 | 197 | 0 | 968 | 781 | 28 | 0.58 | 32.04 |
| 116 | 339 | 0 | 197 | 0 | 968 | 781 | 90 | 0.58 | 35.17 |
| 117 | 339 | 0 | 197 | 0 | 968 | 781 | 180 | 0.58 | 36.45 |
| 118 | 339 | 0 | 197 | 0 | 968 | 781 | 365 | 0.58 | 38.89 |
| 119 | 277 | 0 | 191 | 0 | 968 | 856 | 14 | 0.69 | 21.26 |
| 120 | 277 | 0 | 191 | 0 | 968 | 856 | 28 | 0.69 | 25.97 |
| 121 | 277 | 0 | 191 | 0 | 968 | 856 | 3 | 0.69 | 11.36 |
| 122 | 277 | 0 | 191 | 0 | 968 | 856 | 90 | 0.69 | 31.25 |
| 123 | 277 | 0 | 191 | 0 | 968 | 856 | 180 | 0.69 | 32.33 |
| 124 | 277 | 0 | 191 | 0 | 968 | 856 | 360 | 0.69 | 33.7 |
| 125 | 307 | 0 | 193 | 0 | 968 | 812 | 180 | 0.63 | 34.49 |
| 126 | 307 | 0 | 193 | 0 | 968 | 812 | 365 | 0.63 | 36.15 |
| 127 | 307 | 0 | 193 | 0 | 968 | 812 | 3 | 0.63 | 12.54 |
| 128 | 307 | 0 | 193 | 0 | 968 | 812 | 28 | 0.63 | 27.53 |
| 129 | 307 | 0 | 193 | 0 | 968 | 812 | 90 | 0.63 | 32.92 |
| 130 | 325 | 0 | 184 | 0 | 1063 | 783 | 7 | 0.57 | 17.54 |
| 131 | 325 | 0 | 184 | 0 | 1063 | 783 | 28 | 0.57 | 30.57 |
| 132 | 275 | 0 | 183 | 0 | 1088 | 808 | 7 | 0.67 | 14.2 |
| 133 | 275 | 0 | 183 | 0 | 1088 | 808 | 28 | 0.67 | 24.5 |
| 134 | 300 | 0 | 184 | 0 | 1075 | 795 | 7 | 0.61 | 15.58 |
| 135 | 300 | 0 | 184 | 0 | 1075 | 795 | 28 | 0.61 | 26.85 |
| 136 | 375 | 0 | 186 | 0 | 1038 | 758 | 7 | 0.5 | 26.06 |
| 137 | 375 | 0 | 186 | 0 | 1038 | 758 | 28 | 0.5 | 38.21 |
| 138 | 400 | 0 | 187 | 0 | 1025 | 745 | 28 | 0.47 | 43.7 |
| 139 | 400 | 0 | 187 | 0 | 1025 | 745 | 7 | 0.47 | 30.14 |
| 140 | 350 | 0 | 186 | 0 | 1050 | 770 | 7 | 0.53 | 20.28 |
| 141 | 350 | 0 | 186 | 0 | 1050 | 770 | 28 | 0.53 | 34.29 |
| 142 | 310 | 0 | 192 | 0 | 1012 | 830 | 3 | 0.62 | 11.85 |
| 143 | 310 | 0 | 192 | 0 | 1012 | 830 | 7 | 0.62 | 17.24 |
| 144 | 310 | 0 | 192 | 0 | 1012 | 830 | 28 | 0.62 | 27.83 |
| 145 | 310 | 0 | 192 | 0 | 1012 | 830 | 90 | 0.62 | 35.76 |
| 146 | 310 | 0 | 192 | 0 | 1012 | 830 | 120 | 0.62 | 38.7 |
| 147 | 331 | 0 | 192 | 0 | 1025 | 821 | 3 | 0.58 | 14.31 |
| 148 | 331 | 0 | 192 | 0 | 1025 | 821 | 7 | 0.58 | 17.44 |
| 149 | 331 | 0 | 192 | 0 | 1025 | 821 | 28 | 0.58 | 31.74 |
| 150 | 331 | 0 | 192 | 0 | 1025 | 821 | 90 | 0.58 | 37.91 |
| 151 | 331 | 0 | 192 | 0 | 1025 | 821 | 120 | 0.58 | 39.38 |
| 152 | 349 | 0 | 192 | 0 | 1056 | 809 | 3 | 0.55 | 15.87 |
| 153 | 349 | 0 | 192 | 0 | 1056 | 809 | 7 | 0.55 | 9.01 |
| 154 | 349 | 0 | 192 | 0 | 1056 | 809 | 28 | 0.55 | 33.61 |
| 155 | 349 | 0 | 192 | 0 | 1056 | 809 | 90 | 0.55 | 40.66 |
| 156 | 349 | 0 | 192 | 0 | 1056 | 809 | 120 | 0.55 | 40.86 |
| 157 | 296 | 0 | 186 | 0 | 1090 | 769 | 7 | 0.63 | 18.91 |
| 158 | 296 | 0 | 186 | 0 | 1090 | 769 | 28 | 0.63 | 25.18 |
| 159 | 297 | 0 | 186 | 0 | 1040 | 734 | 7 | 0.63 | 30.96 |
| 160 | 480 | 0 | 192 | 0 | 936 | 721 | 28 | 0.4 | 43.89 |
| 161 | 480 | 0 | 192 | 0 | 936 | 721 | 90 | 0.4 | 54.28 |
| 162 | 397 | 0 | 186 | 0 | 1040 | 734 | 28 | 0.47 | 36.94 |
| 163 | 281 | 0 | 186 | 0 | 1104 | 774 | 7 | 0.66 | 14.5 |
| 164 | 281 | 0 | 185 | 0 | 1104 | 774 | 28 | 0.66 | 22.44 |
| 165 | 500 | 0 | 200 | 0 | 1125 | 613 | 1 | 0.4 | 12.64 |
| 166 | 500 | 0 | 200 | 0 | 1125 | 613 | 3 | 0.4 | 26.06 |
| 167 | 500 | 0 | 200 | 0 | 1125 | 613 | 7 | 0.4 | 33.21 |
| 168 | 500 | 0 | 200 | 0 | 1125 | 613 | 14 | 0.4 | 36.94 |
| 169 | 500 | 0 | 200 | 0 | 1125 | 613 | 28 | 0.4 | 44.09 |
| 170 | 540 | 0 | 173 | 0 | 1125 | 613 | 7 | 0.32 | 52.61 |
| 171 | 540 | 0 | 173 | 0 | 1125 | 613 | 14 | 0.32 | 59.76 |
| 172 | 540 | 0 | 173 | 0 | 1125 | 613 | 28 | 0.32 | 67.31 |
| 173 | 540 | 0 | 173 | 0 | 1125 | 613 | 90 | 0.32 | 69.66 |
| 174 | 540 | 0 | 173 | 0 | 1125 | 613 | 180 | 0.32 | 71.62 |
| 175 | 540 | 0 | 173 | 0 | 1125 | 613 | 270 | 0.32 | 74.17 |
| 176 | 350 | 0 | 203 | 0 | 974 | 775 | 7 | 0.58 | 18.13 |
| 177 | 350 | 0 | 203 | 0 | 974 | 775 | 14 | 0.58 | 22.53 |
| 178 | 350 | 0 | 203 | 0 | 974 | 775 | 28 | 0.58 | 27.34 |
| 179 | 350 | 0 | 203 | 0 | 974 | 775 | 56 | 0.58 | 29.98 |
| 180 | 350 | 0 | 203 | 0 | 974 | 775 | 90 | 0.58 | 31.35 |
| 181 | 350 | 0 | 203 | 0 | 974 | 775 | 180 | 0.58 | 32.72 |
| 182 | 385 | 0 | 186 | 0 | 966 | 763 | 1 | 0.48 | 6.27 |
| 183 | 385 | 0 | 186 | 0 | 966 | 763 | 3 | 0.48 | 14.7 |
| 184 | 385 | 0 | 186 | 0 | 966 | 763 | 7 | 0.48 | 23.22 |
| 185 | 385 | 0 | 186 | 0 | 966 | 763 | 14 | 0.48 | 27.92 |
| 186 | 385 | 0 | 186 | 0 | 966 | 763 | 28 | 0.48 | 31.35 |
| 187 | 331 | 0 | 192 | 0 | 978 | 825 | 180 | 0.58 | 39 |
| 188 | 331 | 0 | 192 | 0 | 978 | 825 | 360 | 0.58 | 41.24 |
| 189 | 349 | 0 | 192 | 0 | 1047 | 806 | 3 | 0.55 | 14.99 |
| 190 | 331 | 0 | 192 | 0 | 978 | 825 | 3 | 0.58 | 13.52 |
| 191 | 382 | 0 | 186 | 0 | 1047 | 739 | 7 | 0.49 | 24 |
| 192 | 382 | 0 | 186 | 0 | 1047 | 739 | 28 | 0.49 | 37.42 |
| 193 | 382 | 0 | 186 | 0 | 1111 | 784 | 7 | 0.49 | 11.47 |
| 194 | 281 | 0 | 186 | 0 | 1104 | 774 | 28 | 0.66 | 22.44 |
| 195 | 339 | 0 | 185 | 0 | 1069 | 754 | 7 | 0.55 | 21.16 |
| 196 | 339 | 0 | 185 | 0 | 1069 | 754 | 28 | 0.55 | 31.84 |
| 197 | 295 | 0 | 185 | 0 | 1069 | 769 | 7 | 0.63 | 14.8 |
| 198 | 295 | 0 | 185 | 0 | 1069 | 769 | 28 | 0.63 | 25.18 |
| 199 | 296 | 0 | 192 | 0 | 1085 | 765 | 7 | 0.65 | 14.2 |
| 200 | 296 | 0 | 192 | 0 | 1085 | 765 | 28 | 0.65 | 21.65 |
| 201 | 296 | 0 | 192 | 0 | 1085 | 765 | 90 | 0.65 | 29.39 |
| 202 | 331 | 0 | 192 | 0 | 879 | 825 | 3 | 0.58 | 13.52 |
| 203 | 331 | 0 | 192 | 0 | 978 | 825 | 7 | 0.58 | 16.26 |
| 204 | 331 | 0 | 192 | 0 | 978 | 825 | 28 | 0.58 | 31.45 |
| 205 | 331 | 0 | 192 | 0 | 978 | 825 | 90 | 0.58 | 37.23 |
| 206 | 349 | 0 | 192 | 0 | 1047 | 806 | 7 | 0.55 | 18.13 |
| 207 | 349 | 0 | 192 | 0 | 1047 | 806 | 28 | 0.55 | 32.72 |
| 208 | 349 | 0 | 192 | 0 | 1047 | 806 | 90 | 0.55 | 39.49 |
| 209 | 349 | 0 | 192 | 0 | 1047 | 806 | 180 | 0.55 | 41.05 |
| 210 | 349 | 0 | 192 | 0 | 1047 | 806 | 360 | 0.55 | 42.13 |
| 211 | 302 | 0 | 203 | 0 | 974 | 817 | 14 | 0.67 | 18.13 |
| 212 | 302 | 0 | 203 | 0 | 974 | 817 | 180 | 0.67 | 26.74 |
| 213 | 525 | 0 | 189 | 0 | 1125 | 613 | 180 | 0.36 | 61.92 |
| 214 | 500 | 0 | 200 | 0 | 1125 | 613 | 90 | 0.4 | 47.22 |
| 215 | 500 | 0 | 200 | 0 | 1125 | 613 | 180 | 0.4 | 51.04 |
| 216 | 500 | 0 | 200 | 0 | 1125 | 613 | 270 | 0.4 | 55.16 |
| 217 | 540 | 0 | 173 | 0 | 1125 | 613 | 3 | 0.32 | 41.64 |
| 218 | 339 | 0 | 185 | 0 | 1060 | 754 | 28 | 0.55 | 31.65 |
| 219 | 393 | 0 | 192 | 0 | 940 | 758 | 3 | 0.49 | 19.11 |
| 220 | 393 | 0 | 192 | 0 | 940 | 758 | 28 | 0.49 | 39.58 |
| 221 | 393 | 0 | 192 | 0 | 940 | 758 | 90 | 0.49 | 48.79 |
| 222 | 382 | 0 | 185 | 0 | 1047 | 739 | 7 | 0.48 | 24 |
| 223 | 382 | 0 | 185 | 0 | 1047 | 739 | 28 | 0.48 | 37.42 |
| 224 | 310 | 0 | 192 | 0 | 970 | 850 | 7 | 0.62 | 14.99 |
| 225 | 310 | 0 | 192 | 0 | 970 | 850 | 28 | 0.62 | 27.92 |
| 226 | 310 | 0 | 192 | 0 | 970 | 850 | 90 | 0.62 | 34.68 |
| 227 | 310 | 0 | 192 | 0 | 970 | 850 | 180 | 0.62 | 37.33 |
| 228 | 310 | 0 | 192 | 0 | 970 | 850 | 360 | 0.62 | 38.11 |
| 229 | 525 | 0 | 189 | 0 | 1125 | 613 | 3 | 0.36 | 33.8 |
| 230 | 525 | 0 | 189 | 0 | 1125 | 613 | 7 | 0.36 | 42.42 |
| 231 | 525 | 0 | 189 | 0 | 1125 | 613 | 14 | 0.36 | 48.4 |
| 232 | 525 | 0 | 189 | 0 | 1125 | 613 | 28 | 0.36 | 55.94 |
| 233 | 525 | 0 | 189 | 0 | 1125 | 613 | 90 | 0.36 | 58.78 |
| 234 | 525 | 0 | 189 | 0 | 1125 | 613 | 270 | 0.36 | 67.11 |
| 235 | 322 | 0 | 203 | 0 | 974 | 800 | 14 | 0.63 | 20.77 |
| 236 | 322 | 0 | 203 | 0 | 974 | 800 | 28 | 0.63 | 25.18 |
| 237 | 322 | 0 | 203 | 0 | 974 | 800 | 180 | 0.63 | 29.59 |
| 238 | 302 | 0 | 203 | 0 | 974 | 817 | 28 | 0.67 | 21.75 |
| 239 | 397 | 0 | 185 | 0 | 1040 | 734 | 28 | 0.47 | 39.09 |
| 240 | 480 | 0 | 192 | 0 | 936 | 721 | 3 | 0.4 | 24.39 |
| 241 | 522 | 0 | 146 | 0 | 896 | 896 | 7 | 0.28 | 50.51 |
| 242 | 522 | 0 | 146 | 0 | 896 | 896 | 28 | 0.28 | 74.99 |
| 243 | 374 | 0 | 190 | 7 | 1013 | 730 | 28 | 0.51 | 39.05 |
| 244 | 305 | 100 | 196 | 10 | 959 | 705 | 28 | 0.64 | 30.12 |
| 245 | 298 | 107 | 186 | 6 | 879 | 815 | 28 | 0.62 | 42.64 |
| 246 | 318 | 126 | 210 | 6 | 861 | 737 | 28 | 0.66 | 40.06 |
| 247 | 356 | 142 | 193 | 11 | 801 | 778 | 28 | 0.54 | 40.87 |
| 248 | 314 | 113 | 170 | 10 | 925 | 783 | 28 | 0.54 | 38.46 |
| 249 | 321 | 128 | 182 | 11 | 870 | 780 | 28 | 0.57 | 37.26 |
| 250 | 298 | 107 | 210 | 11 | 880 | 744 | 28 | 0.7 | 31.87 |
| 251 | 322 | 116 | 196 | 10 | 818 | 813 | 28 | 0.61 | 31.18 |
| 252 | 313 | 113 | 178 | 8 | 1002 | 689 | 28 | 0.57 | 36.8 |
| 253 | 326 | 138 | 199 | 11 | 801 | 792 | 28 | 0.61 | 40.68 |
| 254 | 336 | 0 | 182 | 3 | 986 | 817 | 28 | 0.54 | 44.86 |
| 255 | 298 | 107 | 164 | 13 | 953 | 784 | 28 | 0.55 | 35.86 |
| 256 | 313 | 0 | 178 | 8 | 1000 | 822 | 28 | 0.57 | 25.1 |
| 257 | 313.3 | 113 | 178.5 | 8 | 1001.9 | 688.7 | 28 | 0.57 | 36.8 |
| 258 | 326.5 | 137.9 | 199 | 10.8 | 801.1 | 792.5 | 28 | 0.61 | 38.63 |
| 259 | 336.5 | 0 | 181.9 | 3.4 | 985.8 | 816.8 | 28 | 0.54 | 44.87 |
| 260 | 298.1 | 107.5 | 163.6 | 12.8 | 953.2 | 784 | 28 | 0.55 | 35.87 |
| 261 | 312.7 | 0 | 178.1 | 8 | 999.7 | 822.2 | 28 | 0.57 | 25.1 |
| 262 | 374.3 | 0 | 190.2 | 6.7 | 1013.2 | 730.4 | 28 | 0.51 | 39.06 |
| 263 | 304.8 | 99.6 | 196 | 9.8 | 959.4 | 705.2 | 28 | 0.64 | 30.12 |
| 264 | 298.1 | 107 | 186.4 | 6.1 | 879 | 815.2 | 28 | 0.63 | 42.64 |
| 265 | 317.9 | 126.5 | 209.7 | 5.7 | 860.5 | 736.6 | 28 | 0.66 | 40.06 |
| 266 | 355.9 | 141.6 | 193.3 | 11 | 801.4 | 778.4 | 28 | 0.54 | 40.87 |
| 267 | 313.8 | 112.6 | 169.9 | 10.1 | 925.3 | 782.9 | 28 | 0.54 | 38.46 |
| 268 | 321.4 | 127.9 | 182.5 | 11.5 | 870.1 | 779.7 | 28 | 0.57 | 37.27 |
| 269 | 298.2 | 107 | 209.7 | 11.1 | 879.6 | 744.2 | 28 | 0.7 | 31.88 |
| 270 | 322.2 | 115.6 | 196 | 10.4 | 817.9 | 813.4 | 28 | 0.61 | 31.18 |
References
- Zhang, N.; Duan, H.; Miller, T.R.; Tam, V.W.Y.; Liu, G.; Zuo, J. Mitigation of carbon dioxide by accelerated sequestration in concrete debris. Renew. Sustain. Energy Rev. 2020, 117, 109495. [Google Scholar] [CrossRef]
- Monkman, S.; MacDonald, M. On carbon dioxide utilization as a means to improve the sustainability of ready-mixed concrete. J. Clean. Prod. 2017, 167, 365–375. [Google Scholar] [CrossRef]
- Qian, X.; Wang, J.; Fang, Y.; Wang, L. Carbon dioxide as an admixture for better performance of OPC-based concrete. J. CO2 Util. 2018, 25, 31–38. [Google Scholar] [CrossRef]
- Akbar, A.; Liew, K.M. Assessing recycling potential of carbon fiber reinforced plastic waste in production of eco-efficient cement-based materials. J. Clean. Prod. 2020, 274, 123001. [Google Scholar] [CrossRef]
- Jahanzaib Khalil, M.; Aslam, M.; Ahmad, S. Utilization of sugarcane bagasse ash as cement replacement for the production of sustainable concrete—A review. Constr. Build. Mater. 2020, 121371. [Google Scholar] [CrossRef]
- Wang, L.; Chen, L.; Tsang, D.C.W.; Guo, B.; Yang, J.; Shen, Z.; Hou, D.; Ok, Y.S.; Poon, C.S. Biochar as green additives in cement-based composites with carbon dioxide curing. J. Clean. Prod. 2020, 258, 120678. [Google Scholar] [CrossRef]
- Kang, S.; Lloyd, Z.; Kim, T.; Ley, M.T. Predicting the compressive strength of fly ash concrete with the Particle Model. Cem. Concr. Res. 2020, 137, 106218. [Google Scholar] [CrossRef]
- Farooq, F.; Akbar, A.; Khushnood, R.A.; Muhammad, W.L.B.; Rehman, S.K.U.; Javed, M.F. Experimental investigation of hybrid carbon nanotubes and graphite nanoplatelets on rheology, shrinkage, mechanical, and microstructure of SCCM. Materials 2020, 13, 230. [Google Scholar] [CrossRef] [PubMed] [Green Version]
- Akbar, A.; Farooq, F.; Shafique, M.; Aslam, F.; Alyousef, R.; Alabduljabbar, H. Sugarcane bagasse ash-based engineered geopolymer mortar incorporating propylene fibers. J. Build. Eng. 2021, 33, 101492. [Google Scholar] [CrossRef]
- Ghouleh, Z.; Shao, Y. Turning municipal solid waste incineration into a cleaner cement production. J. Clean. Prod. 2018, 195, 268–279. [Google Scholar] [CrossRef]
- Lee, M.G.; Kang, D.; Jo, H.; Park, J. Carbon dioxide utilization with carbonation using industrial waste-desulfurization gypsum and waste concrete. J. Mater. Cycles Waste Manag. 2016, 18, 407–412. [Google Scholar] [CrossRef]
- Possan, E.; Thomaz, W.A.; Aleandri, G.A.; Felix, E.F.; dos Santos, A.C.P. CO2 uptake potential due to concrete carbonation: A case study. Case Stud. Constr. Mater. 2017, 6, 147–161. [Google Scholar] [CrossRef]
- Farooq, F.; Ahmed, W.; Akbar, A.; Aslam, F.; Alyousef, R. Predictive modelling for sustainable high-performance concrete from industrial wastes: A comparison and optimization of models using ensemble learners. J. Clean. Prod. 2021, 292, 126032. [Google Scholar] [CrossRef]
- Bin Khairul anuar, M.A.R.; Ngamkhanong, C.; Wu, Y.; Kaewunruen, S. Recycled Aggregates Concrete Compressive Strength Prediction Using Artificial Neural Networks (ANNs). Infrastructures 2021, 6, 17. [Google Scholar] [CrossRef]
- Farooq, F.; Amin, M.N.; Khan, K.; Sadiq, M.R.; Javed, M.F.; Aslam, F.; Alyousef, R. A comparative study of random forest and genetic engineering programming for the prediction of compressive strength of high strength concrete (HSC). Appl. Sci. 2020, 10, 7330. [Google Scholar] [CrossRef]
- Javed, M.F.; Farooq, F.; Memon, S.A.; Akbar, A.; Khan, M.A.; Aslam, F.; Alyousef, R.; Alabduljabbar, H.; Rehman, S.K.U.; Ur Rehman, S.K.; et al. New Prediction Model for the Ultimate Axial Capacity of Concrete-Filled Steel Tubes: An Evolutionary Approach. Crystals 2020, 10, 741. [Google Scholar] [CrossRef]
- Iqbal, M.F.; Liu, Q.F.; Azim, I.; Zhu, X.; Yang, J.; Javed, M.F.; Rauf, M. Prediction of mechanical properties of green concrete incorporating waste foundry sand based on gene expression programming. J. Hazard. Mater. 2020, 384, 121322. [Google Scholar] [CrossRef]
- De Domenico, D.; Ricciardi, G. Shear strength of RC beams with stirrups using an improved Eurocode 2 truss model with two variable-inclination compression struts. Eng. Struct. 2019, 198. [Google Scholar] [CrossRef]
- Sadowski, Ł.; Nikoo, M.; Nikoo, M. Concrete compressive strength prediction using the imperialist competitive algorithm. Comput. Concr. 2018, 22, 355–363. [Google Scholar] [CrossRef]
- Czarnecki, S.; Shariq, M.; Nikoo, M.; Sadowski, Ł. An intelligent model for the prediction of the compressive strength of cementitious composites with ground granulated blast furnace slag based on ultrasonic pulse velocity measurements. Measurement 2021, 108951. [Google Scholar] [CrossRef]
- Sadowski, Ł.; Piechówka-Mielnik, M.; Widziszowski, T.; Gardynik, A.; Mackiewicz, S. Hybrid ultrasonic-neural prediction of the compressive strength of environmentally friendly concrete screeds with high volume of waste quartz mineral dust. J. Clean. Prod. 2019, 212, 727–740. [Google Scholar] [CrossRef]
- Javed, M.F.; Amin, M.N.; Shah, M.I.; Khan, K.; Iftikhar, B.; Farooq, F.; Aslam, F.; Alyousef, R.; Alabduljabbar, H. Applications of gene expression programming and regression techniques for estimating compressive strength of bagasse ash based concrete. Crystals 2020, 10, 737. [Google Scholar] [CrossRef]
- Aslam, F.; Farooq, F.; Amin, M.N.; Khan, K.; Waheed, A.; Akbar, A.; Javed, M.F.; Alyousef, R.; Alabdulijabbar, H. Applications of Gene Expression Programming for Estimating Compressive Strength of High-Strength Concrete. Adv. Civ. Eng. 2020. [Google Scholar] [CrossRef]
- Naderpour, H.; Rafiean, A.H.; Fakharian, P. Compressive strength prediction of environmentally friendly concrete using artificial neural networks. J. Build. Eng. 2018, 16, 213–219. [Google Scholar] [CrossRef]
- Getahun, M.A.; Shitote, S.M.; Abiero Gariy, Z.C. Artificial neural network based modelling approach for strength prediction of concrete incorporating agricultural and construction wastes. Constr. Build. Mater. 2018, 190, 517–525. [Google Scholar] [CrossRef]
- Liu, Q.; Iqbal, M.F.; Yang, J.; Lu, X.; Zhang, P.; Rauf, M. Prediction of chloride diffusivity in concrete using artificial neural network: Modelling and performance evaluation. Constr. Build. Mater. 2020, 268, 121082. [Google Scholar] [CrossRef]
- Ahmad, T.; Chen, H.; Huang, R.; Yabin, G.; Wang, J.; Shair, J.; Azeem Akram, H.M.; Hassnain Mohsan, S.A.; Kazim, M. Supervised based machine learning models for short, medium and long-term energy prediction in distinct building environment. Energy 2018, 158, 17–32. [Google Scholar] [CrossRef]
- Wang, P.; Zheng, X.; Li, J.; Zhu, B. Prediction of epidemic trends in COVID-19 with logistic model and machine learning technics. Chaos Solitons Fractals 2020, 139, 110058. [Google Scholar] [CrossRef]
- Cladera, A.; Marí, A.R. Shear design procedure for reinforced normal and high-strength concrete beams using artificial neural networks. Part I: Beams without stirrups. Eng. Struct. 2004, 26, 917–926. [Google Scholar] [CrossRef]
- Onyari, E.K.; Ikotun, B.D. Prediction of compressive and flexural strengths of a modified zeolite additive mortar using artificial neural network. Constr. Build. Mater. 2018, 187, 1232–1241. [Google Scholar] [CrossRef]
- Feng, D.C.; Liu, Z.T.; Wang, X.D.; Chen, Y.; Chang, J.Q.; Wei, D.F.; Jiang, Z.M. Machine learning-based compressive strength prediction for concrete: An adaptive boosting approach. Constr. Build. Mater. 2020, 230, 117000. [Google Scholar] [CrossRef]
- Feng, D.C.; Liu, Z.T.; Wang, X.D.; Jiang, Z.M.; Liang, S.X. Failure mode classification and bearing capacity prediction for reinforced concrete columns based on ensemble machine learning algorithm. Adv. Eng. Inform. 2020, 45. [Google Scholar] [CrossRef]
- Bui, D.K.; Nguyen, T.; Chou, J.S.; Nguyen-Xuan, H.; Ngo, T.D. A modified firefly algorithm-artificial neural network expert system for predicting compressive and tensile strength of high-performance concrete. Constr. Build. Mater. 2018, 180, 320–333. [Google Scholar] [CrossRef]
- Salami, B.A.; Rahman, S.M.; Oyehan, T.A.; Maslehuddin, M.; Al Dulaijan, S.U. Ensemble machine learning model for corrosion initiation time estimation of embedded steel reinforced self-compacting concrete. Meas. J. Int. Meas. Confed. 2020, 165, 108141. [Google Scholar] [CrossRef]
- Cai, R.; Han, T.; Liao, W.; Huang, J.; Li, D.; Kumar, A.; Ma, H. Prediction of surface chloride concentration of marine concrete using ensemble machine learning. Cem. Concr. Res. 2020, 136, 106164. [Google Scholar] [CrossRef]
- Aydogmus, H.Y.; Erdal, H.I.; Karakurt, O.; Namli, E.; Turkan, Y.S.; Erdal, H. A comparative assessment of bagging ensemble models for modeling concrete slump flow. Comput. Concr. 2015, 16, 741–757. [Google Scholar] [CrossRef]
- Erdal, H.I. Two-level and hybrid ensembles of decision trees for high performance concrete compressive strength prediction. Eng. Appl. Artif. Intell. 2013, 26, 1689–1697. [Google Scholar] [CrossRef]
- Zounemat-Kermani, M.; Stephan, D.; Barjenbruch, M.; Hinkelmann, R. Ensemble data mining modeling in corrosion of concrete sewer: A comparative study of network-based (MLPNN & RBFNN) and tree-based (RF, CHAID, & CART) models. Adv. Eng. Inform. 2020, 43, 101030. [Google Scholar] [CrossRef]
- Lichman, M. UCI Machine Learning Repository; University of California, School of Information and Computer Science: Irvine, CA, USA, 2013; Available online: http://archive.ics.uci.edu/ml (accessed on 27 November 2020).
- Karbassi, A.; Mohebi, B.; Rezaee, S.; Lestuzzi, P. Damage prediction for regular reinforced concrete buildings using the decision tree algorithm. Comput. Struct. 2014, 130, 46–56. [Google Scholar] [CrossRef]
- Ben Chaabene, W.; Flah, M.; Nehdi, M.L. Machine learning prediction of mechanical properties of concrete: Critical review. Constr. Build. Mater. 2020, 260, 119889. [Google Scholar] [CrossRef]
- Ribeiro, M.H.D.M.; dos Santos Coelho, L. Ensemble approach based on bagging, boosting and stacking for short-term prediction in agribusiness time series. Appl. Soft Comput. J. 2020, 86, 105837. [Google Scholar] [CrossRef]
- Dou, J.; Yunus, A.P.; Bui, D.T.; Merghadi, A.; Sahana, M.; Zhu, Z.; Chen, C.W.; Han, Z.; Pham, B.T. Improved landslide assessment using support vector machine with bagging, boosting, and stacking ensemble machine learning framework in a mountainous watershed, Japan. Landslides 2020, 17, 641–658. [Google Scholar] [CrossRef]
- Kaboli, S.H.A.; Fallahpour, A.; Selvaraj, J.; Rahim, N.A. Long-term electrical energy consumption formulating and forecasting via optimized gene expression programming. Energy 2017, 126, 144–164. [Google Scholar] [CrossRef]
- Ferreira, C. Gene Expression Programming in Problem Solving. In Soft Computing and Industry; Springer: London, UK, 2002; pp. 635–653. [Google Scholar]
- Shah, M.I.; Javed, M.F.; Abunama, T. Proposed formulation of surface water quality and modelling using gene expression, machine learning, and regression techniques. Environ. Sci. Pollut. Res. 2020, 1–19. [Google Scholar] [CrossRef] [PubMed]
- Khan, M.A.; Memon, S.A.; Farooq, F.; Javed, M.F.; Aslam, F.; Alyousef, R. Compressive Strength of Fly-Ash-Based Geopolymer Concrete by Gene Expression Programming and Random Forest. Adv. Civ. Eng. 2021, 2021, 1–17. [Google Scholar] [CrossRef]
- Kohavi, R. A Study of Cross-Validation and Bootstrap for Accuracy Estimation and Model Selection. In Proceedings of the International Joint Conference of Artificial Intelligence, Montreal, QC, Canada, 20–25 August 1995. [Google Scholar]


| Statistics | Cem * | FASH * | W * | SP * | CA * | FA * | Age * | W/B * |
|---|---|---|---|---|---|---|---|---|
| Mean | 361.39 | 28.15 | 184.15 | 3.68 | 996.90 | 775.93 | 53.31 | 0.53 |
| Standard Error | 5.20 | 2.94 | 1.17 | 0.36 | 4.70 | 4.86 | 4.63 | 0.01 |
| Median | 336.25 | 0.00 | 189.00 | 0.00 | 987.80 | 781.95 | 28.00 | 0.58 |
| Mode | 349.00 | 0.00 | 192.00 | 0.00 | 1125.00 | 613.00 | 28.00 | 0.58 |
| Standard Deviation | 85.49 | 48.35 | 19.29 | 5.95 | 77.26 | 79.92 | 76.06 | 0.11 |
| Sample Variance | 7309.14 | 2337.79 | 372.16 | 35.39 | 5969.32 | 6387.59 | 5784.50 | 0.01 |
| Kurtosis | −0.50 | −0.44 | 0.29 | 3.52 | −0.19 | −0.07 | 7.01 | −0.04 |
| Skewness | 0.83 | 1.20 | −0.38 | 1.77 | −0.26 | −0.67 | 2.62 | −0.92 |
| Range | 293.20 | 142.00 | 88.00 | 28.20 | 324.00 | 305.80 | 364.00 | 0.43 |
| Minimum | 246.80 | 0.00 | 140.00 | 0.00 | 801.00 | 594.00 | 1.00 | 0.27 |
| Maximum | 540.00 | 142.00 | 228.00 | 28.20 | 1125.00 | 899.80 | 365.00 | 0.70 |
| Sum | 97,574.60 | 7601.70 | 49,720.30 | 993.40 | 269,163.90 | 209,502.40 | 14,394.00 | 143.89 |
| Count | 270.00 | 270.00 | 270.00 | 270.00 | 270.00 | 270.00 | 270.00 | 270.00 |
| Data Points | Decision Tree (DT) Targets | DT Predictions | Ensemble Prediction | Gene Expression Programming (GEP) Targets | GEP Predictions | DT Errors | Ensemble Errors | GEP Errors |
|---|---|---|---|---|---|---|---|---|
| 1 | 56.74 | 55.64 | 51.14 | 26.74 | 27.66 | 1.10 | 5.60 | 0.92 |
| 2 | 32.72 | 44.87 | 33.11 | 37.44 | 37.21 | 12.15 | 0.39 | 0.23 |
| 3 | 14.31 | 13.52 | 14.94 | 51.04 | 49.48 | 0.79 | 0.63 | 1.56 |
| 4 | 39.06 | 39.05 | 38.35 | 18.13 | 21.68 | 0.01 | 0.71 | 3.55 |
| 5 | 38.11 | 36.15 | 35.22 | 51.33 | 49.31 | 1.96 | 2.89 | 2.02 |
| 6 | 42.64 | 42.64 | 37.67 | 37.91 | 39.76 | 0.00 | 4.97 | 1.85 |
| 7 | 34.49 | 36.15 | 33.57 | 25.10 | 36.42 | 1.66 | 0.92 | 11.32 |
| 8 | 21.65 | 25.18 | 25.55 | 74.17 | 77.61 | 3.53 | 3.90 | 3.44 |
| 9 | 14.7 | 19.11 | 20.62 | 37.27 | 40.69 | 4.41 | 5.92 | 3.42 |
| 10 | 40.06 | 40.06 | 37.74 | 15.05 | 14.58 | 0.00 | 2.32 | 0.47 |
| 11 | 38.21 | 31.65 | 34.74 | 23.52 | 22.76 | 6.56 | 3.47 | 0.76 |
| 12 | 13.52 | 13.52 | 14.79 | 41.89 | 42.56 | 0.00 | 1.27 | 0.67 |
| 13 | 21.78 | 21.02 | 20.63 | 48.79 | 46.44 | 0.76 | 1.15 | 2.35 |
| 14 | 69.84 | 58.52 | 63.61 | 40.68 | 40.59 | 11.32 | 6.23 | 0.09 |
| 15 | 24 | 30.14 | 24.11 | 32.92 | 34.99 | 6.14 | 0.11 | 2.07 |
| 16 | 39.58 | 31.35 | 37.01 | 25.18 | 26.87 | 8.23 | 2.57 | 1.69 |
| 17 | 20.28 | 18.13 | 18.00 | 59.20 | 85.40 | 2.15 | 2.28 | 26.20 |
| 18 | 14.84 | 18.91 | 17.15 | 33.94 | 32.67 | 4.07 | 2.31 | 1.27 |
| 19 | 41.37 | 41.37 | 48.22 | 53.30 | 49.35 | 0.00 | 6.85 | 3.95 |
| 20 | 50.51 | 46.9 | 44.65 | 42.22 | 46.77 | 3.61 | 5.86 | 4.55 |
| 21 | 38.6 | 34.57 | 29.43 | 30.96 | 18.90 | 4.03 | 9.17 | 12.06 |
| 22 | 33.61 | 44.87 | 32.51 | 21.75 | 25.93 | 11.26 | 1.10 | 4.18 |
| 23 | 29.59 | 36.15 | 30.80 | 12.54 | 9.95 | 6.56 | 1.21 | 2.59 |
| 24 | 41.24 | 38.89 | 39.02 | 31.18 | 37.50 | 2.35 | 2.22 | 6.32 |
| 25 | 44.86 | 44.87 | 39.55 | 14.20 | 16.26 | 0.01 | 5.31 | 2.06 |
| 26 | 54.32 | 54.28 | 50.46 | 33.80 | 36.88 | 0.04 | 3.86 | 3.08 |
| 27 | 48.4 | 55.94 | 51.65 | 30.14 | 29.77 | 7.54 | 3.25 | 0.37 |
| 28 | 36.45 | 39 | 37.80 | 31.88 | 36.23 | 2.55 | 1.35 | 4.35 |
| 29 | 22.5 | 22.95 | 22.03 | 30.12 | 36.52 | 0.45 | 0.47 | 6.40 |
| 30 | 40.66 | 37.91 | 40.12 | 32.72 | 32.57 | 2.75 | 0.54 | 0.15 |
| 31 | 14.99 | 15.05 | 15.71 | 30.85 | 41.47 | 0.06 | 0.72 | 10.62 |
| 32 | 43.89 | 43.94 | 44.89 | 43.70 | 45.88 | 0.05 | 1.00 | 2.18 |
| 33 | 6.27 | 19.11 | 19.05 | 24.50 | 25.95 | 12.84 | 12.78 | 1.45 |
| 34 | 33.94 | 50.6 | 41.89 | 39.29 | 41.35 | 16.66 | 7.95 | 2.06 |
| 35 | 14.2 | 18.91 | 17.38 | 32.07 | 35.21 | 4.71 | 3.18 | 3.14 |
| 36 | 23.8 | 22.95 | 21.86 | 9.01 | 13.37 | 0.85 | 1.94 | 4.36 |
| 37 | 35.76 | 34.68 | 33.99 | 22.50 | 18.93 | 1.08 | 1.77 | 3.57 |
| 38 | 32.72 | 41.05 | 36.38 | 14.50 | 16.89 | 8.33 | 3.66 | 2.39 |
| 39 | 36.8 | 36.8 | 37.17 | 39.06 | 37.75 | 0.00 | 0.37 | 1.31 |
| 40 | 42.13 | 42.62 | 43.28 | 42.42 | 43.95 | 0.49 | 1.15 | 1.53 |
| 41 | 56.83 | 78.8 | 59.50 | 42.13 | 38.72 | 21.97 | 2.67 | 3.41 |
| 42 | 33.08 | 36.94 | 38.20 | 42.03 | 48.82 | 3.86 | 5.12 | 6.79 |
| 43 | 41.3 | 41.64 | 39.45 | 43.89 | 46.77 | 0.34 | 1.85 | 2.88 |
| 44 | 58.61 | 56.85 | 58.01 | 40.06 | 31.79 | 1.76 | 0.60 | 8.27 |
| 45 | 26.85 | 21.75 | 27.39 | 48.28 | 47.22 | 5.10 | 0.54 | 1.06 |
| 46 | 33.21 | 34.57 | 28.27 | 37.42 | 37.11 | 1.36 | 4.94 | 0.31 |
| 47 | 31.97 | 31.45 | 32.39 | 39.49 | 41.69 | 0.52 | 0.42 | 2.20 |
| 48 | 39.49 | 37.91 | 40.61 | 36.94 | 38.73 | 1.58 | 1.12 | 1.79 |
| 49 | 37.33 | 36.15 | 34.77 | 25.22 | 27.85 | 1.18 | 2.56 | 2.63 |
| 50 | 22.53 | 27.04 | 26.86 | 55.64 | 55.64 | 4.51 | 4.33 | 0.00 |
| 51 | 40.68 | 38.63 | 36.96 | 60.95 | 60.16 | 2.05 | 3.72 | 0.79 |
| 52 | 26.06 | 18.13 | 20.51 | 37.33 | 40.76 | 7.93 | 5.55 | 3.43 |
| 53 | 55.16 | 51.04 | 49.54 | 25.45 | 29.65 | 4.12 | 5.62 | 4.20 |
| 54 | 48.28 | 51.33 | 42.55 | - | - | 3.05 | 5.73 | - |
| K Fold | Ensemble Model | GEP Model | ||||||
|---|---|---|---|---|---|---|---|---|
| R2 | MAE | MSE | RMSE | R2 | MAE | MSE | RMSE | |
| 1 | 0.96 | 8.46 | 4.45 | 2.10 | 0.86 | 10.71 | 13.57 | 3.68 |
| 2 | 0.91 | 5.17 | 7.44 | 2.72 | 0.94 | 7.45 | 7.97 | 2.82 |
| 3 | 0.84 | 3.73 | 8.54 | 2.92 | 0.89 | 6.18 | 11.24 | 3.35 |
| 4 | 0.90 | 9.52 | 5.84 | 2.41 | 0.95 | 5.84 | 14.51 | 3.80 |
| 5 | 0.94 | 6.81 | 6.44 | 2.53 | 0.93 | 7.81 | 9.64 | 3.10 |
| 6 | 0.90 | 5.65 | 5.88 | 2.42 | 0.86 | 7.51 | 6.51 | 2.55 |
| 7 | 0.85 | 7.91 | 6.87 | 2.62 | 0.81 | 8.47 | 7.25 | 2.69 |
| 8 | 0.88 | 5.81 | 9.85 | 3.13 | 0.76 | 6.58 | 7.58 | 2.75 |
| 9 | 0.95 | 6.37 | 4.97 | 2.22 | 0.84 | 5.64 | 9.47 | 3.07 |
| 10 | 0.92 | 4.92 | 6.35 | 2.51 | 0.89 | 6.84 | 8.35 | 2.88 |
| Statistics | MAE (MPa) | MSE (MPa) | RMSE (MPa) |
|---|---|---|---|
| DT | 3.896 | 36.01 | 6.00 |
| DT-BAG | 3.113 | 16.28 | 4.03 |
| GEP | 3.478 | 29.91 | 5.46 |
Publisher’s Note: MDPI stays neutral with regard to jurisdictional claims in published maps and institutional affiliations. |
© 2021 by the authors. Licensee MDPI, Basel, Switzerland. This article is an open access article distributed under the terms and conditions of the Creative Commons Attribution (CC BY) license (http://creativecommons.org/licenses/by/4.0/).
Share and Cite
Ahmad, A.; Farooq, F.; Niewiadomski, P.; Ostrowski, K.; Akbar, A.; Aslam, F.; Alyousef, R. Prediction of Compressive Strength of Fly Ash Based Concrete Using Individual and Ensemble Algorithm. Materials 2021, 14, 794. https://0-doi-org.brum.beds.ac.uk/10.3390/ma14040794
Ahmad A, Farooq F, Niewiadomski P, Ostrowski K, Akbar A, Aslam F, Alyousef R. Prediction of Compressive Strength of Fly Ash Based Concrete Using Individual and Ensemble Algorithm. Materials. 2021; 14(4):794. https://0-doi-org.brum.beds.ac.uk/10.3390/ma14040794
Chicago/Turabian StyleAhmad, Ayaz, Furqan Farooq, Pawel Niewiadomski, Krzysztof Ostrowski, Arslan Akbar, Fahid Aslam, and Rayed Alyousef. 2021. "Prediction of Compressive Strength of Fly Ash Based Concrete Using Individual and Ensemble Algorithm" Materials 14, no. 4: 794. https://0-doi-org.brum.beds.ac.uk/10.3390/ma14040794