
The Influence Mechanism of Ettringite Crystals and Microstructure Characteristics on the Strength of Calcium-Based Stabilized Soil


Abstract
:1. Introduction
2. Materials and Methods
2.1. Soils and Stabilizers
2.2. Sample Preparation
2.3. Testing Methods
2.3.1. Unconfined Compressive Strength (UCS)
2.3.2. Scanning Electron Microscope (SEM)
2.3.3. X-Ray Diffraction (XRD)
2.3.4. Thermogravimetry–Derivative Thermogravimetry (TG–DTG)
2.3.5. Fourier Transform Infrared Spectroscopy (FTIR)
3. Experimental Results
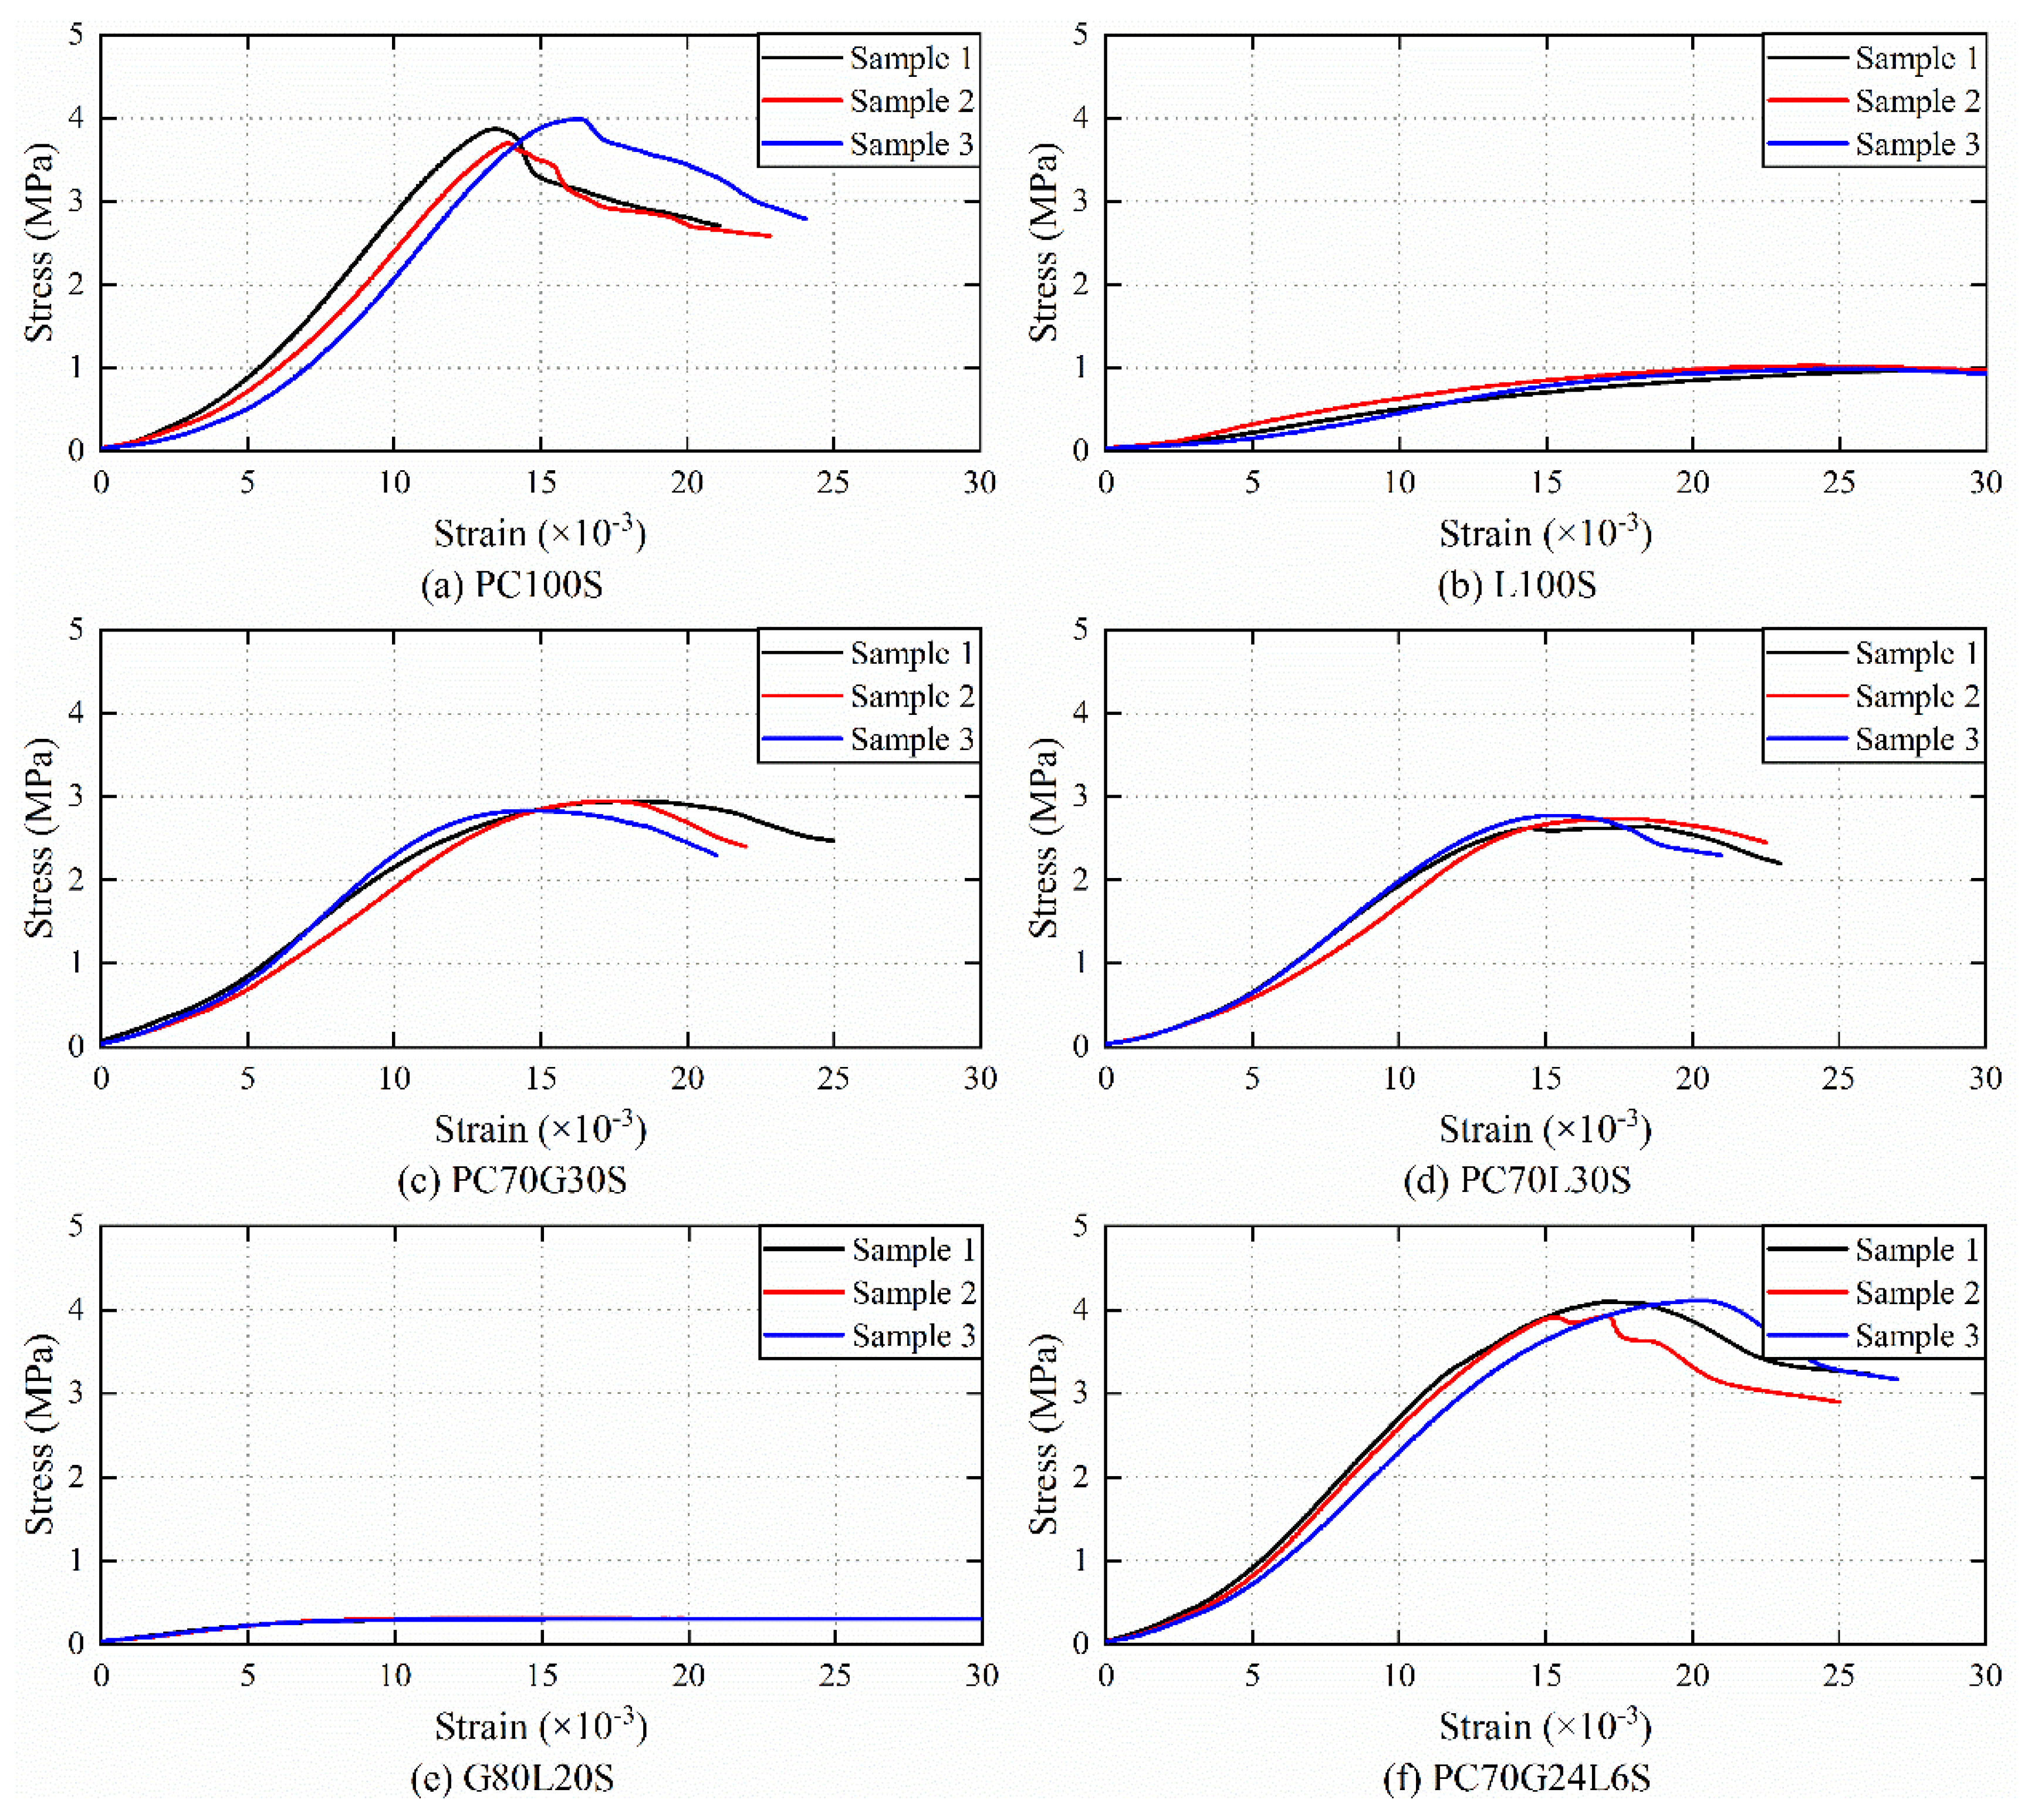
3.1. UCS Results
3.2. SEM Analysis
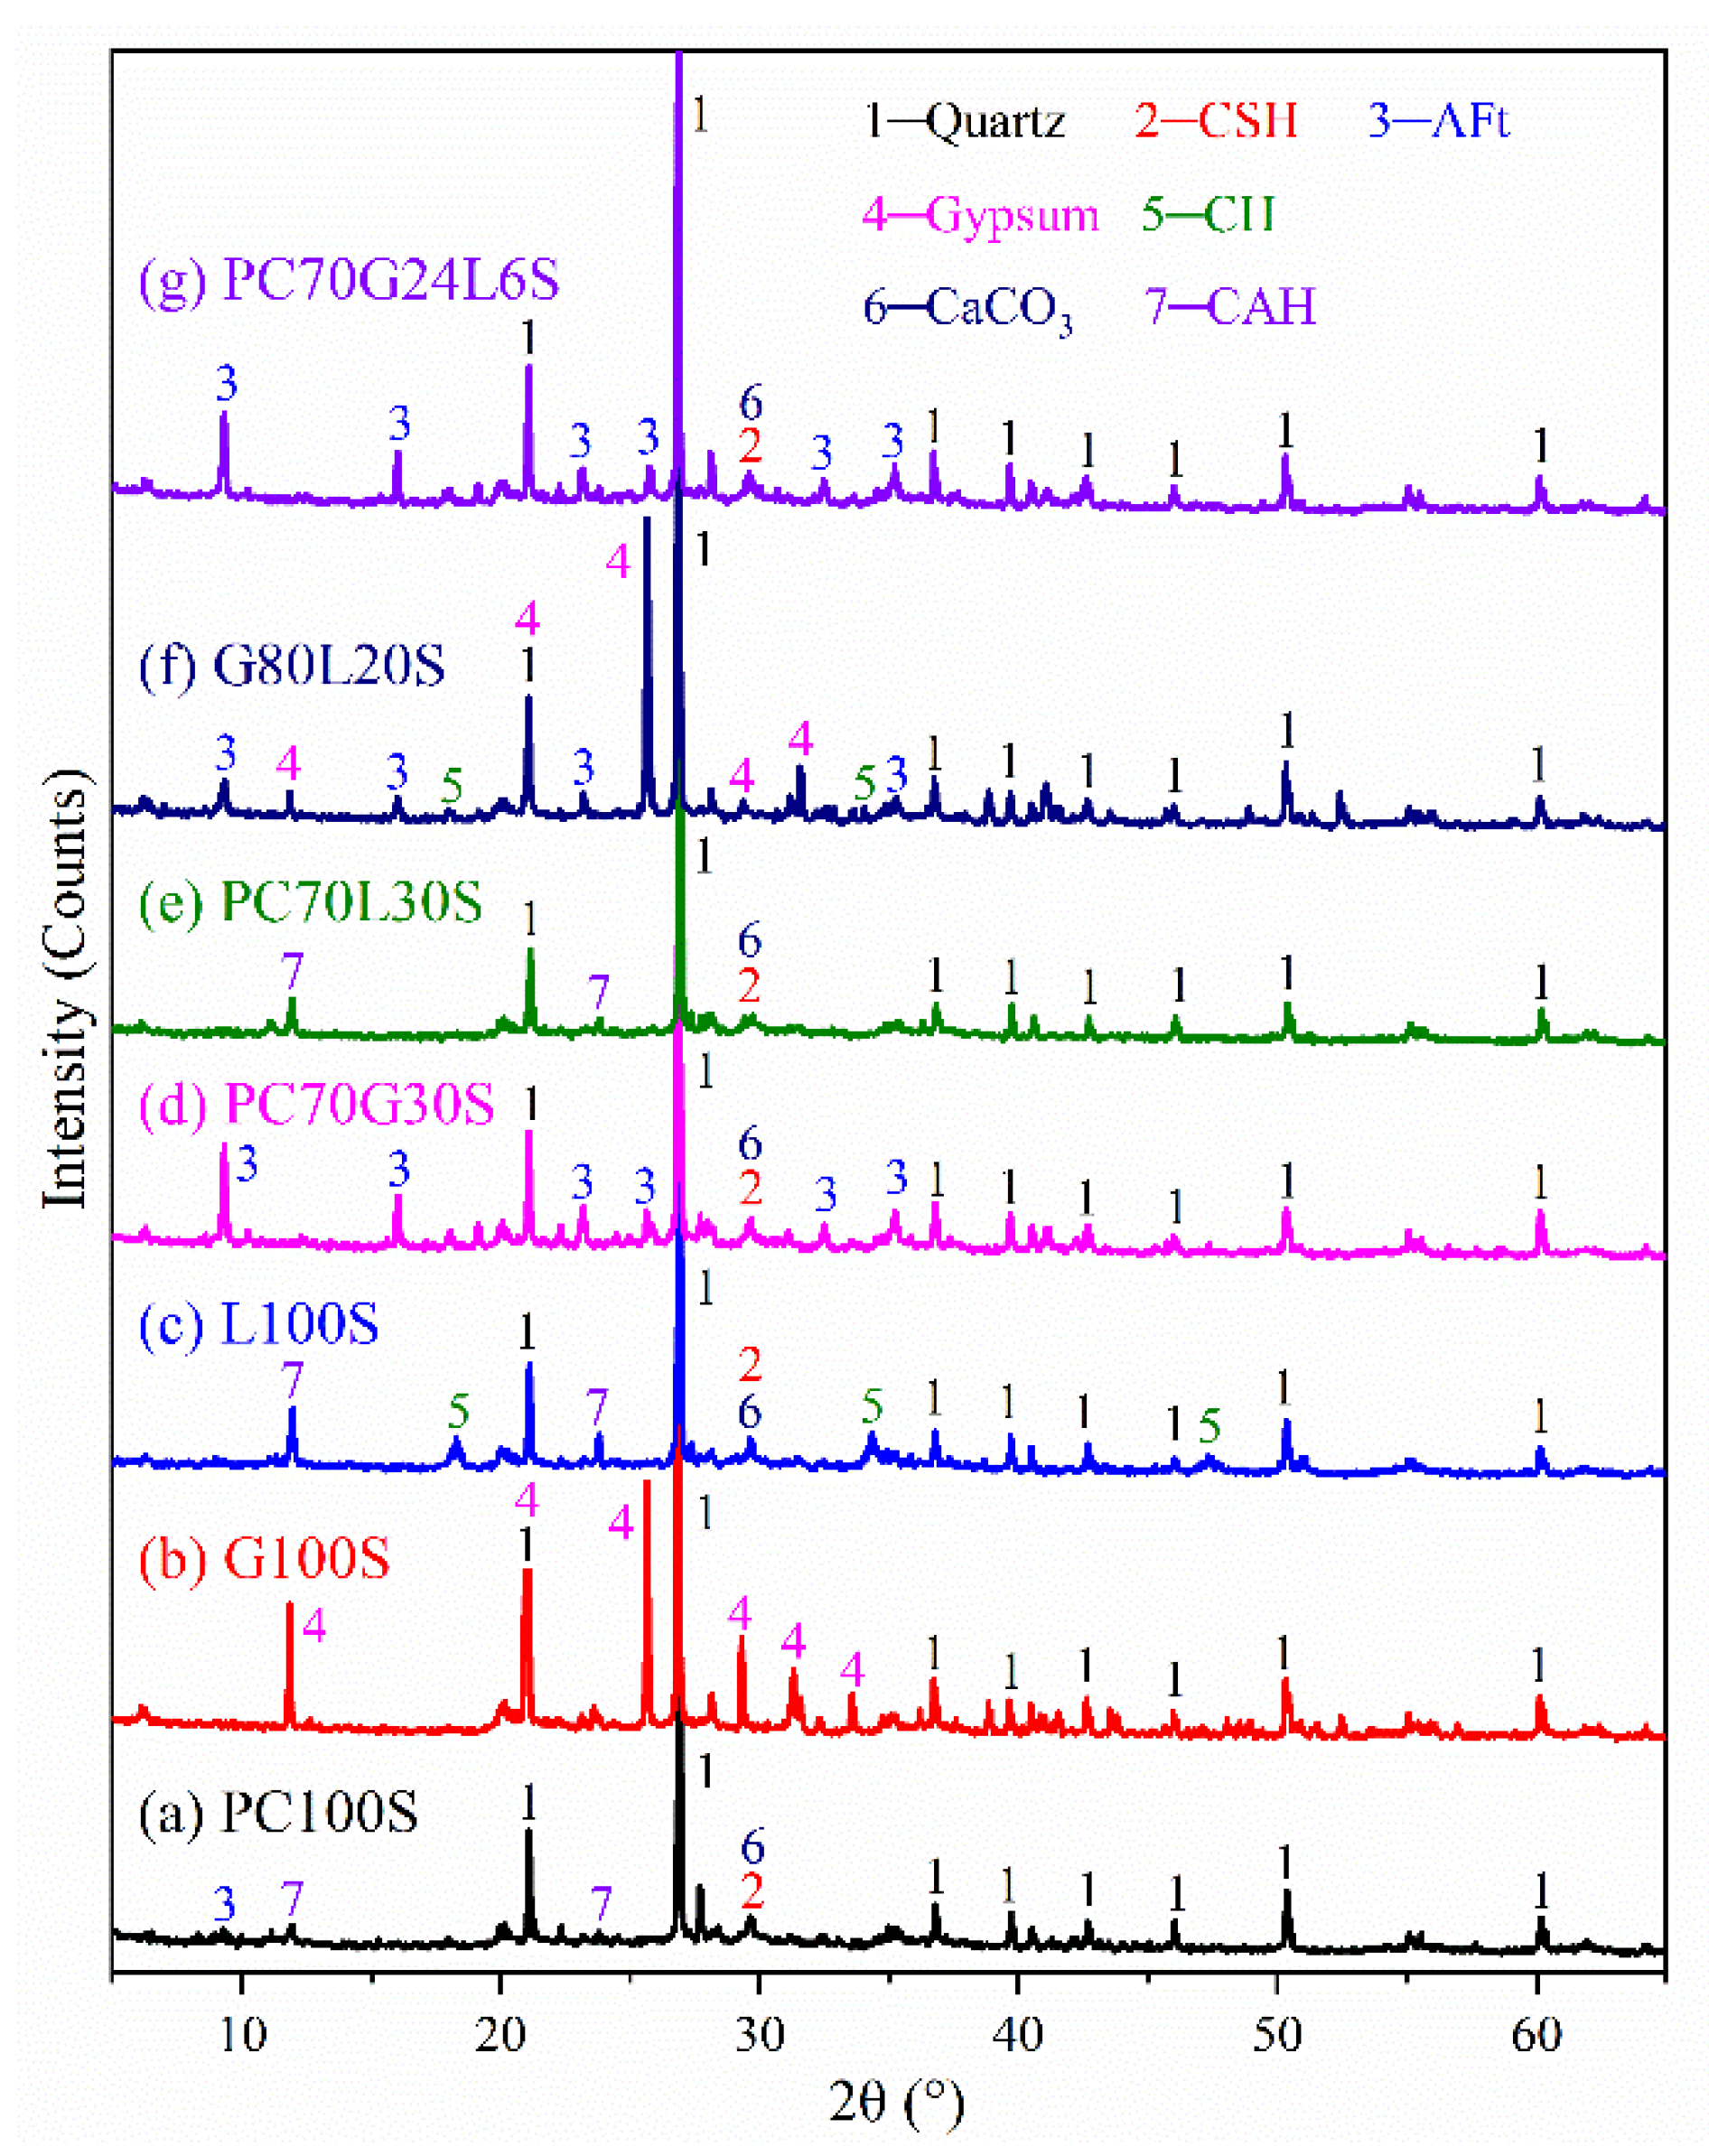
3.3. XRD Analysis
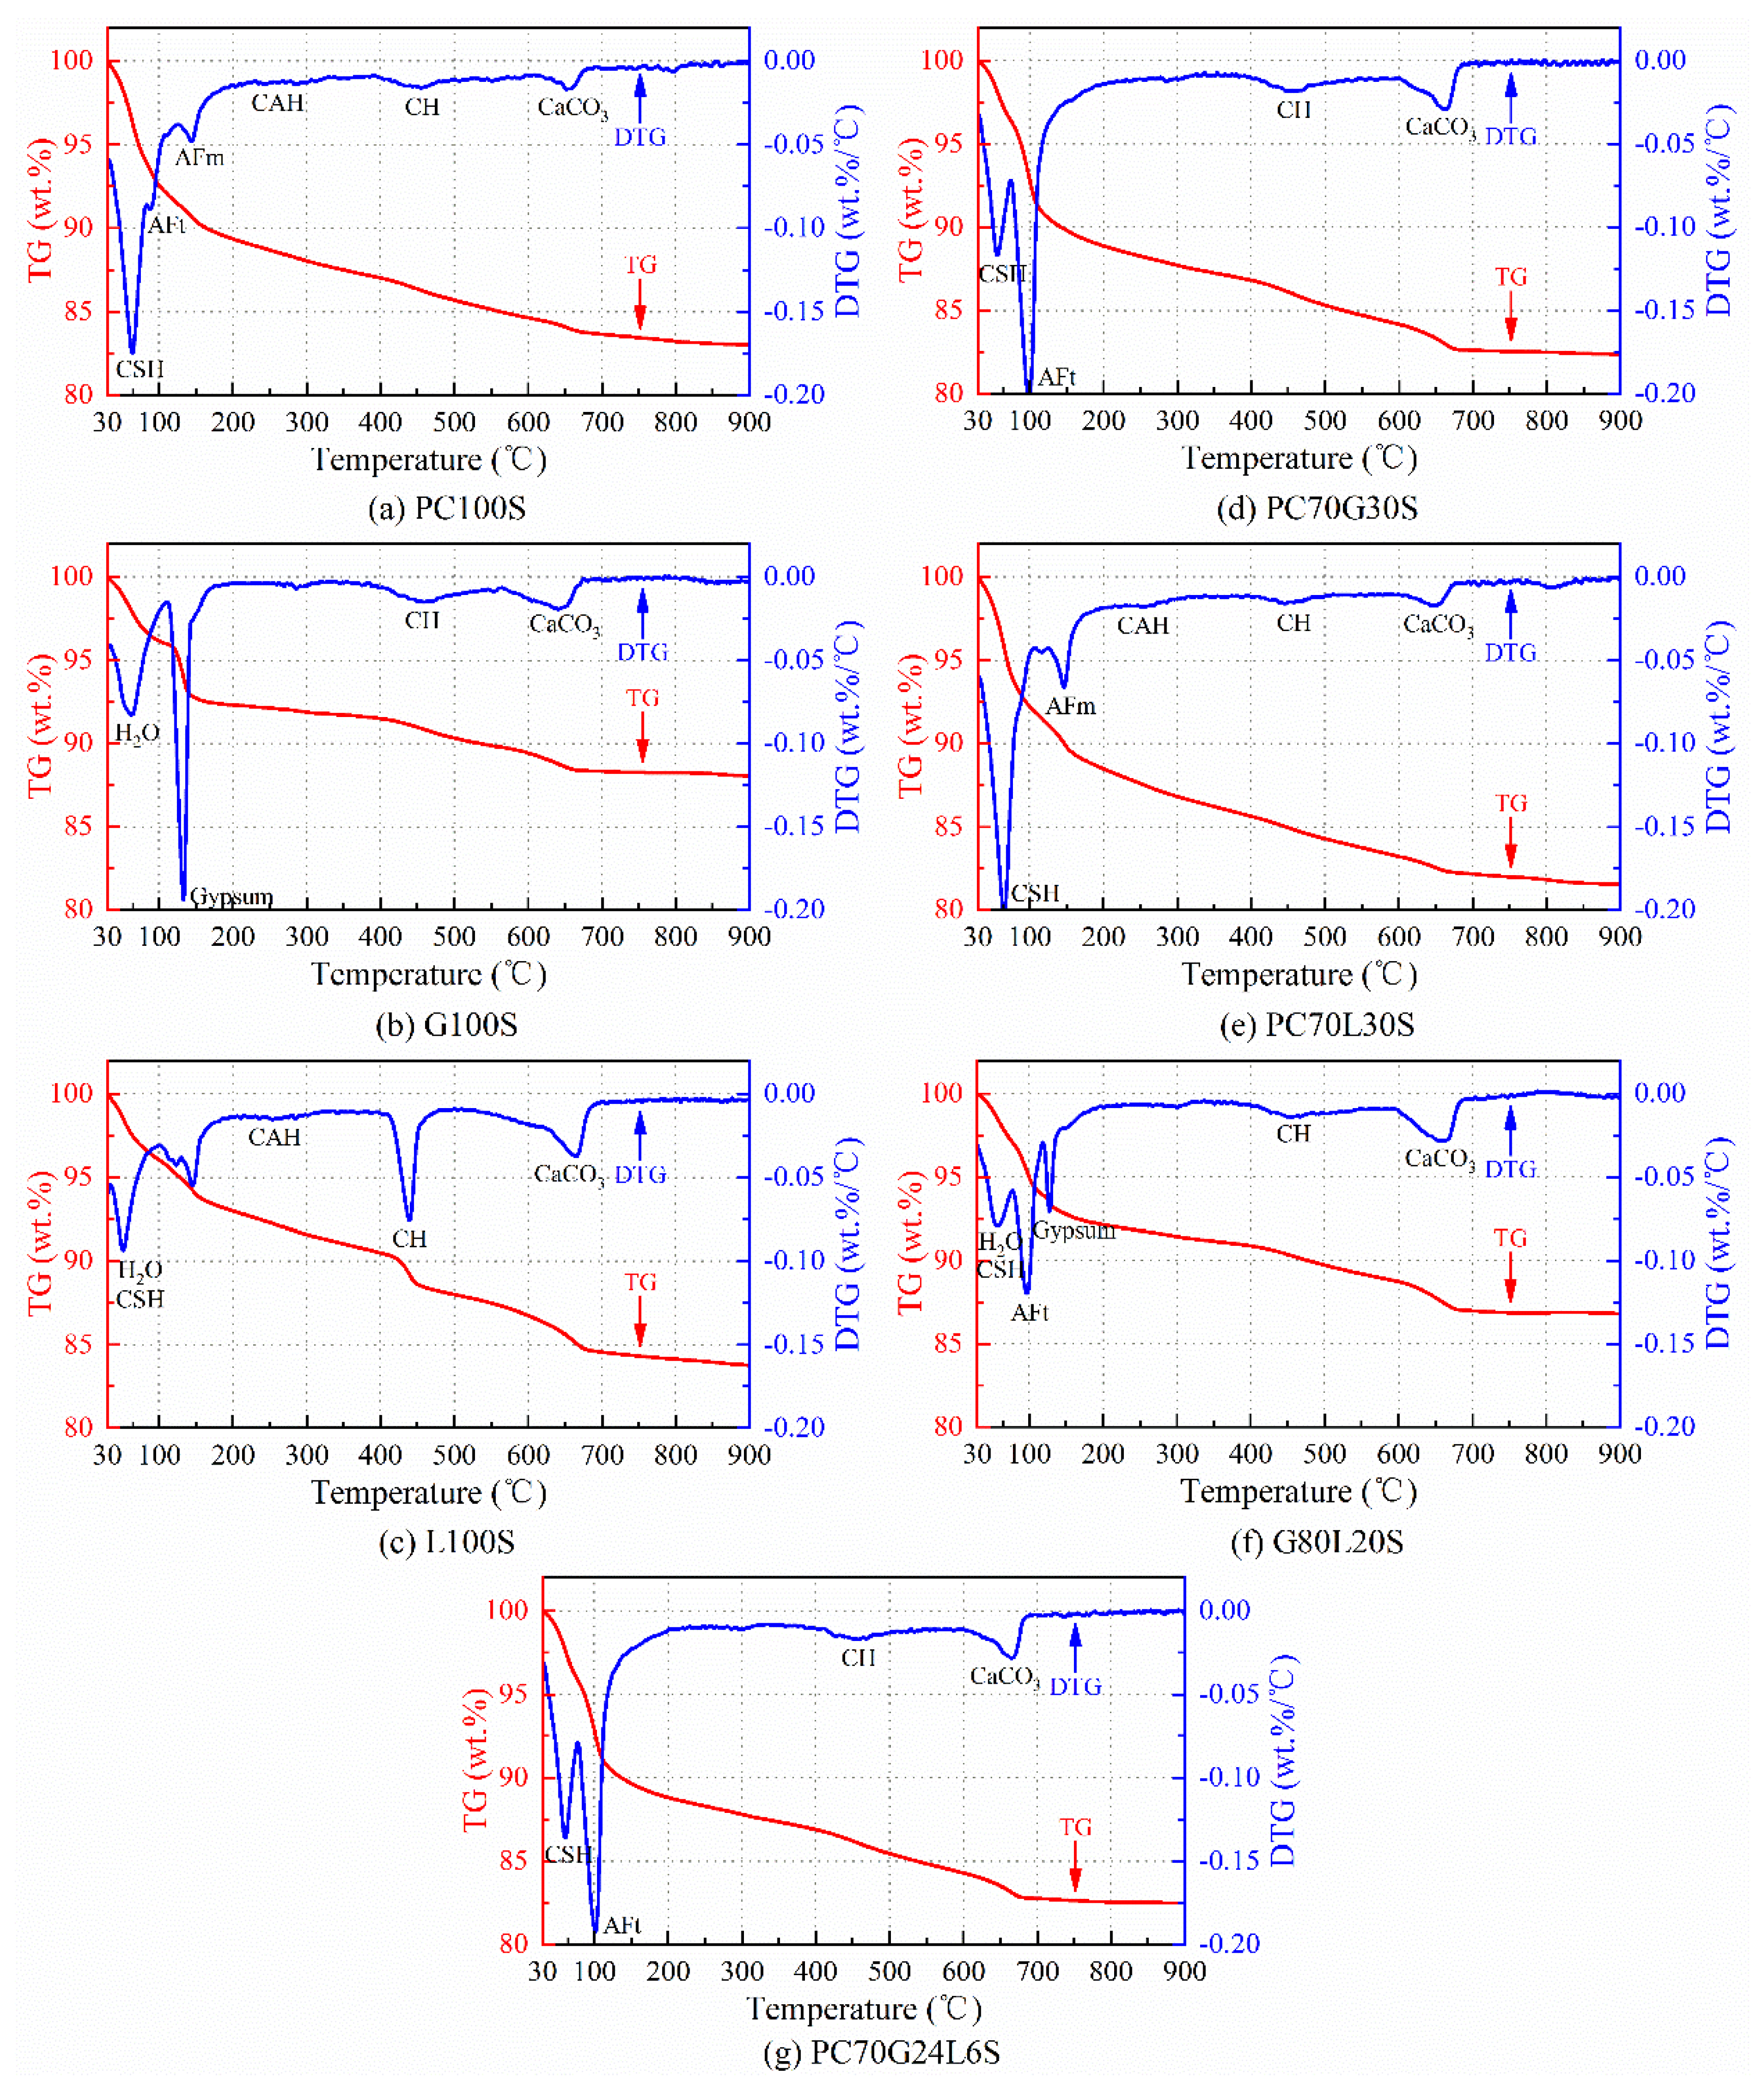
3.4. TG–DTG Analysis
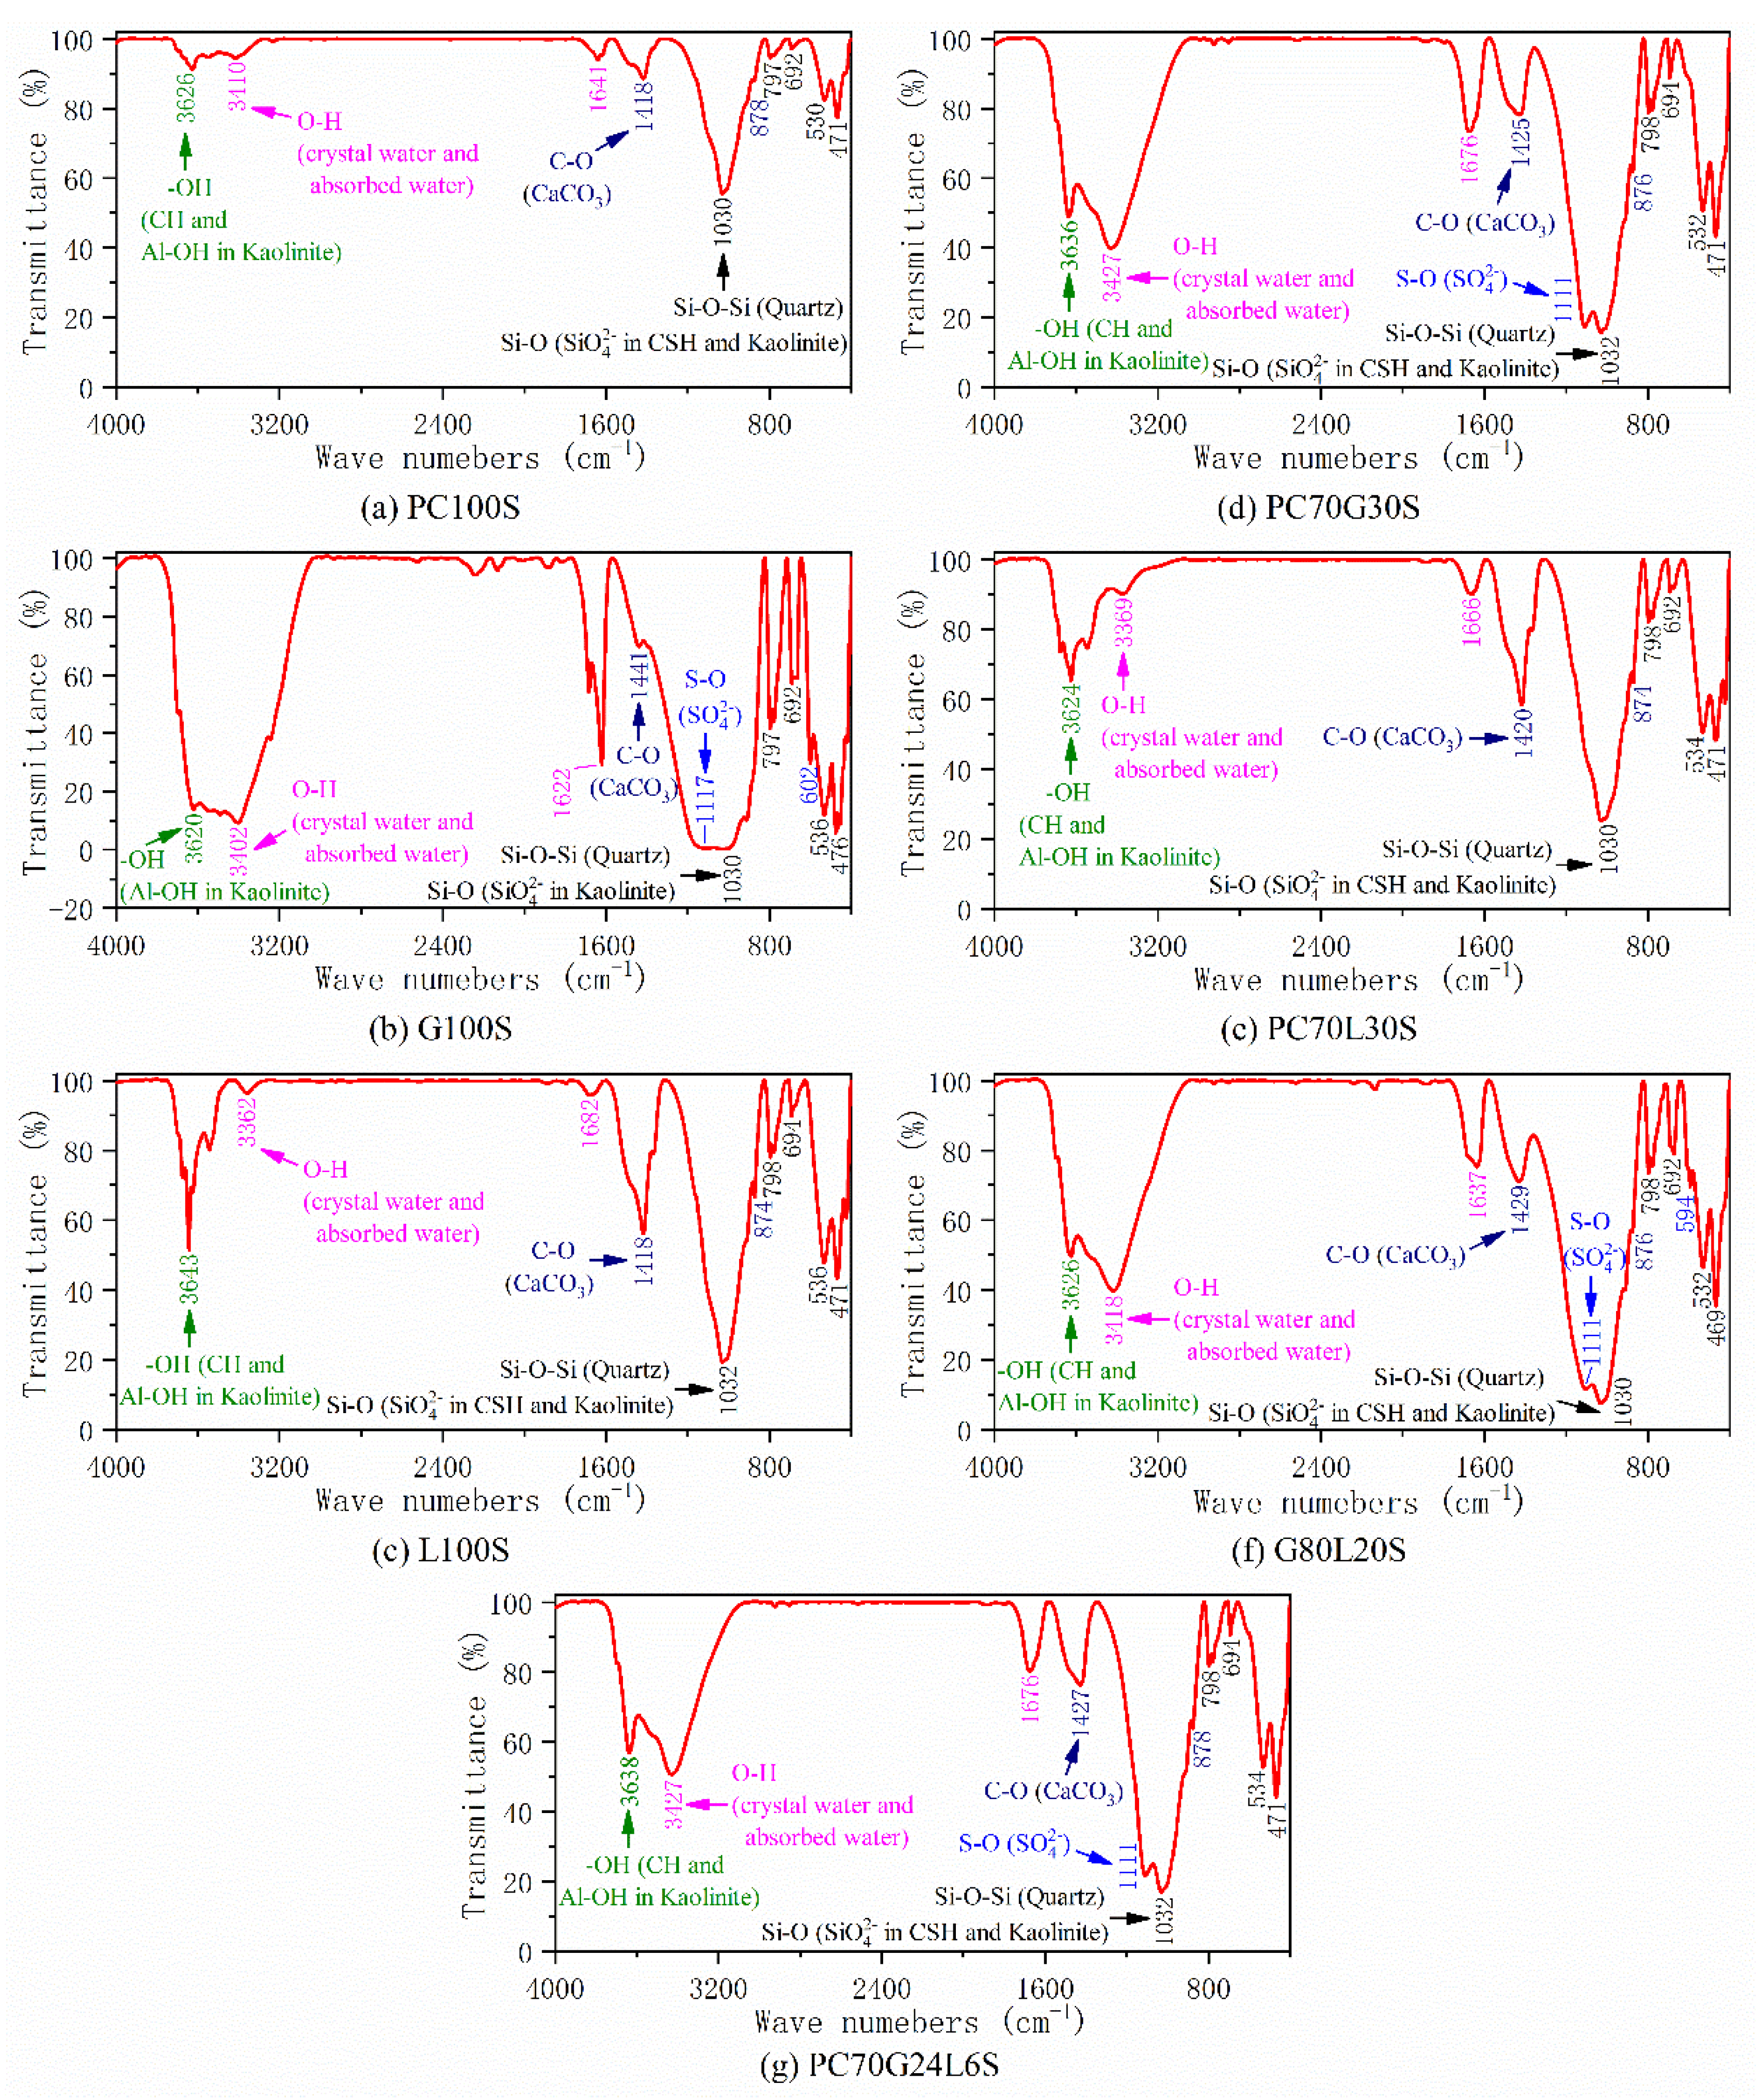
3.5. FTIR Analysis
4. Discussion
5. Conclusions
- (1)
- In three groups of single-doped stabilized soils, the compressive strength of the cement-stabilized soil is the highest, followed by the lime-stabilized soil, and the gypsum-stabilized soil cannot be shaped. For three groups of double-doped stabilized soils, namely, the cement–gypsum-stabilized soil, the cement–lime-stabilized soil, and the gypsum–lime-stabilized soil, their compressive strength is lower than that of the cement-stabilized soil, indicating that the double-doped stabilizers have no more contribution to improve the compressive strength of stabilized soil than cement. However, the compressive strength of the cement–gypsum–lime-stabilized soil is higher than that of any single-doped or double-doped stabilized soils, showing that the compressive strength of stabilized soil can be improved as an appropriate amount of gypsum and lime are added into cement at the same time to form a three-doped stabilizer;
- (2)
- For the cement-stabilized soil, abundant CSH gels coat the outer surface of soil particles to make them cemented together. A few AFt crystals filled in macropores have little effect on improving the strength. Therefore, the strength of the cement-stabilized soil is relatively high but still lower than the cement–gypsum–lime-stabilized soil;
- (3)
- As for the cement–gypsum–stabilized soil, superabundant thick and long AFt crystals make the pores in soil particles larger, while CSH gels cannot cement the soil particles and the AFt crystals together, and hence the stabilized soil becomes looser. As a result, its strength is slightly lower than that of the cement-stabilized soil;
- (4)
- For the cement–gypsum–lime-stabilized soil, the appropriate amount of fine AFt crystals fills the macropores between soil particles and form a network space structure. Sufficient CSH gels wrap the outer surface of the soil particles and the AFt crystals network space structure to make them cemented tightly together. Therefore, its strength is slightly stronger than that of the cement-stabilized soil and far stronger than that of the cement–gypsum–stabilized soil;
- (5)
- The two main influencing factors for the strength of the calcium-based stabilized soil are the production of CSH gels and the content of harmful pores (macropores). The content of harmful pores mainly depends on the production and size of AFt crystals. Superabundant thick and long AFt crystals make the pores in soil particles larger, which decreases the strength of stabilized soil, whereas the appropriate amount of fine AFt crystals filling the macropores between soil particles and forming a network space structure improve the strength of stabilized soil. Therefore, the proportion of each component in calcium-based stabilizer should consider the production of CSH gels and fine AFt crystals to achieve an optimal balance.
Author Contributions
Funding
Data Availability Statement
Conflicts of Interest
References
- Hamidi, S.; Marandi, S.M. Clay concrete and effect of clay minerals types on stabilized soft clay soils by epoxy resin. Appl. Clay Sci. 2018, 151, 92–101. [Google Scholar] [CrossRef]
- Sharma, L.K.; Sirdesai, N.N.; Sharma, K.M.; Singh, T.N. Experimental study to examine the independent roles of lime and cement on the stabilization of a mountain soil: A comparative study. Appl. Clay Sci. 2018, 152, 183–195. [Google Scholar] [CrossRef]
- Jiang, N.; Du, Y.; Liu, S.; Wei, M.; Horpibulsuk, S.; Arulrajah, A. Multi-scale laboratory evaluation of the physical, mechanical, and microstructural properties of soft highway subgrade soil stabilized with calcium carbide residue. Can. Geotechnol. J. 2016, 53, 373–383. [Google Scholar] [CrossRef] [Green Version]
- Jha, A.K.; Sivapullaiah, P.V. Mechanism of improvement in the strength and volume change behavior of lime stabilized soil. Eng. Geol. 2015, 198, 53–64. [Google Scholar] [CrossRef]
- Seco, A.; Miqueleiz, L.; Prieto, E.; Marcelino, S.; García, B.; Urmeneta, P. Sulfate soils stabilization with magnesium-based binders. Appl. Clay Sci. 2017, 135, 457–464. [Google Scholar] [CrossRef]
- Celik, E.; Nalbantoglu, Z. Effects of ground granulated blastfurnace slag (GGBS) on the swelling properties of lime-stabilized sulfate-bearing soils. Eng. Geol. 2013, 163, 20–25. [Google Scholar] [CrossRef]
- Mashifana, T.P.; Okonta, F.N.; Ntuli, F. Geotechnical properties and microstructure of lime-fly ash-phosphogypsum-stabilized soil. Adv. Civ. Eng. 2018, 3640868, 1–9. [Google Scholar] [CrossRef]
- Jha, A.K.; Sivapullaiah, P.V. Gypsum-induced volume change behavior of stabilized expansive soil with fly ash-lime. Geotechnol. Test. J. 2016, 39, 20150017. [Google Scholar] [CrossRef]
- Cheng, Y.; Wang, S.; Li, J.; Huang, X.; Li, C.; Wu, J. Engineering and mineralogical properties of stabilized expansive soil compositing lime and natural pozzolans. Constr. Build. Mater. 2018, 187, 1031–1038. [Google Scholar] [CrossRef]
- MolaAbasi, H.; Naderi Semsani, S.; Saberian, M.; Khajeh, A.; Li, J.; Harandi, M. Evaluation of the long-term performance of stabilized sandy soil using binary mixtures: A micro- and macro-level approach. J. Clean. Prod. 2020, 267, 122209. [Google Scholar] [CrossRef]
- Liang, S.; Chen, J.; Guo, M.; Feng, D.; Liu, L.; Qi, T. Utilization of Pretreated municipal solid waste incineration fly ash for cement-stabilized soil. Waste Manag. 2020, 105, 425–432. [Google Scholar] [CrossRef]
- Ahmed, A. Compressive strength and microstructure of soft clay soil stabilized with recycled bassanite. Appl. Clay Sci. 2015, 104, 27–35. [Google Scholar] [CrossRef]
- Liu, P.; Chen, Y.; Wang, W.; Yu, Z. Effect of physical and chemical sulfate attack on performance degradation of concrete under different conditions. Chem. Phys. Lett. 2020, 745, 137254. [Google Scholar] [CrossRef]
- Huang, X.; Li, Z.; Ning, J.; Xu, S. Principle and method of optimization design for soft soil stabilizer. J. Wuhan Univ. Technol. Mat. Sci. Edit. 2009, 24, 154–160. [Google Scholar] [CrossRef]
- Du, Y.; Yu, B.; Liu, K.; Jiang, N.; Liu, M.D. Physical, hydraulic, and mechanical properties of clayey soil stabilized by lightweight alkali-activated slag geopolymer. J. Mater. Civ. Eng. 2017, 29, 04016217. [Google Scholar] [CrossRef] [Green Version]
- Liao, Y.; Jiang, G.; Wang, K.; Al Qunaynah, S.; Yuan, W. Effect of steel slag on the hydration and strength development of calcium sulfoaluminate cement. Constr. Build. Mater. 2020, 265, 120301. [Google Scholar] [CrossRef]
- Han, J.; Wang, K.; Shi, J.; Wang, Y. Influence of sodium aluminate on cement hydration and concrete properties. Constr. Build. Mater. 2014, 64, 342–349. [Google Scholar] [CrossRef]
- Yang, S.; Liu, W. The effect of changing fly ash content on the modulus of compression of stabilized soil. Materials 2019, 12, 2925. [Google Scholar] [CrossRef] [Green Version]
- Choobbasti, A.J.; Kutanaei, S.S. Microstructure characteristics of cement-stabilized sandy soil using nanosilica. J. Rock Mech. Geotechnol. Eng. 2017, 9, 981–988. [Google Scholar] [CrossRef]
- Lang, L.; Chen, B.; Li, N. Utilization of lime/carbide slag-activated ground granulated blast-furnace slag for dredged sludge stabilization. Mar. Geores. Geotechnol. 2020, 1741050, 1–11. [Google Scholar] [CrossRef]
- Siang, N.D.; Paul, S.C.; Anggraini, V.; Kong, S.Y.; Qureshi, T.S.; Rodriguez, C.R.; Liu, Q.; Šavija, B. Influence of SiO2, TiO2 and Fe2O3 nanoparticles on the properties of fly ash blended cement mortars. Constr. Build. Mater. 2020, 258, 119627. [Google Scholar] [CrossRef]
- Miyandehi, B.M.; Feizbakhsh, A.; Yazdi, M.A.; Liu, Q.; Yang, J.; Alipour, P. Performance and properties of mortar mixed with nano-CuO and rice husk ash. Cem. Concr. Compos. 2016, 74, 225–235. [Google Scholar] [CrossRef]
- Xia, J.; Su, Q.; Liu, D. Optimal gypsum–lime content of high water material. Mater. Lett. 2018, 215, 284–287. [Google Scholar] [CrossRef]
- Gijbels, K.; Pontikes, Y.; Samyn, P.; Schreurs, S.; Schroeyers, W. Effect of NaOH content on hydration, mineralogy, porosity and strength in alkali/sulfate-activated binders from ground granulated blast furnace slag and phosphogypsum. Cem. Concr. Res. 2020, 132, 106054. [Google Scholar] [CrossRef]
- Jiang, N.; Du, Y.; Liu, K. Durability of lightweight alkali-activated ground granulated blast furnace slag (GGBS) stabilized clayey soils subjected to sulfate attack. Appl. Clay Sci. 2018, 161, 70–75. [Google Scholar] [CrossRef]
- Qoku, E.; Bier, T.A.; Westphal, T. Phase Assemblage in ettringite-forming cement pastes: A X-ray diffraction and thermal analysis characterization. J. Build. Eng. 2017, 12, 37–50. [Google Scholar] [CrossRef]
- He, Y.; Zhang, X.; Hooton, R.D.; Wang, Y.; Kong, Y.; Wang, X.; Wang, H. Influence of PCE on rheological and hydration performances of cement paste. J. Mater. Civ. Eng. 2020, 32, 04020002. [Google Scholar] [CrossRef]
- Zhang, T.; Cai, G.; Liu, S. Application of lignin-stabilized silty soil in highway subgrade: A macroscale laboratory study. J. Mater. Civ. Eng. 2018, 30, 04018034. [Google Scholar] [CrossRef]
- Wei, L.; Chai, S.; Guo, Q.; Wang, P.; Li, F. Mechanical properties and stabilizing mechanism of stabilized saline soils with four stabilizers. Bull. Eng. Geol. Environ. 2020, 79, 5341–5354. [Google Scholar] [CrossRef]
- Silva, D.A.; Monteiro, P.J.M. Early formation of ettringite in tricalcium aluminate-calcium hydroxide-gypsum dispersions. J. Am. Ceram. Soc. 2007, 90, 614–617. [Google Scholar] [CrossRef]


| Index 1 | Value |
|---|---|
| pH | 7.92 |
| Specific gravity, Gs | 2.75 |
| Plastic limit, WP (%) | 24.1 |
| Liquid limit, WL (%) | 44.2 |
| Grain size distribution (%) | — |
| Clay (<0.002 mm) | 9.15 |
| Silt (0.002–0.075 mm) | 80.28 |
| Sand (0.075–2 mm) | 10.57 |
| Oxide Composition 1 | Content by Mass (%) | |||
|---|---|---|---|---|
| Soil | PC | Gypsum | Lime | |
| SiO2 | 64.47 | 19.83 | 1.38 | 0.28 |
| Al2O3 | 15.86 | 7.75 | 0.08 | 0.13 |
| CaO | 1.22 | 52.42 | 35.85 | 73.83 |
| SO3 | 0.02 | 3.70 | 45.59 | 0.24 |
| Fe2O3 | 5.72 | 3.97 | 0.03 | 0.28 |
| MgO | 1.32 | 2.25 | 3.38 | 0.50 |
| K2O | 2.14 | 0.77 | — | 0.01 |
| TiO2 | 0.80 | 0.34 | — | — |
| Na2O | 0.55 | 0.18 | — | — |
| Others | 0.03 | 0.31 | 0.39 | 0.01 |
| Loss on ignition 2 | 7.87 | 8.48 | 13.30 | 24.72 |
| Stabilized Soil Sample | The Proportion of Each Component in Stabilizer (%) | UCS | SEM | XRD | TG–DTG | FTIR | ||
|---|---|---|---|---|---|---|---|---|
| PC | Gypsum | Lime | ||||||
| PC100S | 100 | — | — | √ | √ | √ | √ | √ |
| G100S | — | 100 | — | √ | √ | √ | √ | |
| L100S | — | — | 100 | √ | √ | √ | √ | |
| PC70G30S | 70 | 30 | — | √ | √ | √ | √ | √ |
| PC70L30S | 70 | — | 30 | √ | √ | √ | √ | √ |
| G80L20S | — | 80 | 20 | √ | √ | √ | √ | |
| PC70G24L6S | 70 | 24 | 6 | √ | √ | √ | √ | √ |
Publisher’s Note: MDPI stays neutral with regard to jurisdictional claims in published maps and institutional affiliations. |
© 2021 by the authors. Licensee MDPI, Basel, Switzerland. This article is an open access article distributed under the terms and conditions of the Creative Commons Attribution (CC BY) license (http://creativecommons.org/licenses/by/4.0/).
Share and Cite
Han, Y.; Xia, J.; Chang, H.; Xu, J. The Influence Mechanism of Ettringite Crystals and Microstructure Characteristics on the Strength of Calcium-Based Stabilized Soil. Materials 2021, 14, 1359. https://0-doi-org.brum.beds.ac.uk/10.3390/ma14061359
Han Y, Xia J, Chang H, Xu J. The Influence Mechanism of Ettringite Crystals and Microstructure Characteristics on the Strength of Calcium-Based Stabilized Soil. Materials. 2021; 14(6):1359. https://0-doi-org.brum.beds.ac.uk/10.3390/ma14061359
Chicago/Turabian StyleHan, Youmin, Junwu Xia, Hongfei Chang, and Jun Xu. 2021. "The Influence Mechanism of Ettringite Crystals and Microstructure Characteristics on the Strength of Calcium-Based Stabilized Soil" Materials 14, no. 6: 1359. https://0-doi-org.brum.beds.ac.uk/10.3390/ma14061359