
Long-Term Stability of Different Kinds of Gas Nanobubbles in Deionized and Salt Water


 , , ,
, , ,
Abstract
:
1. Introduction
2. Materials and Methods
2.1. Materials
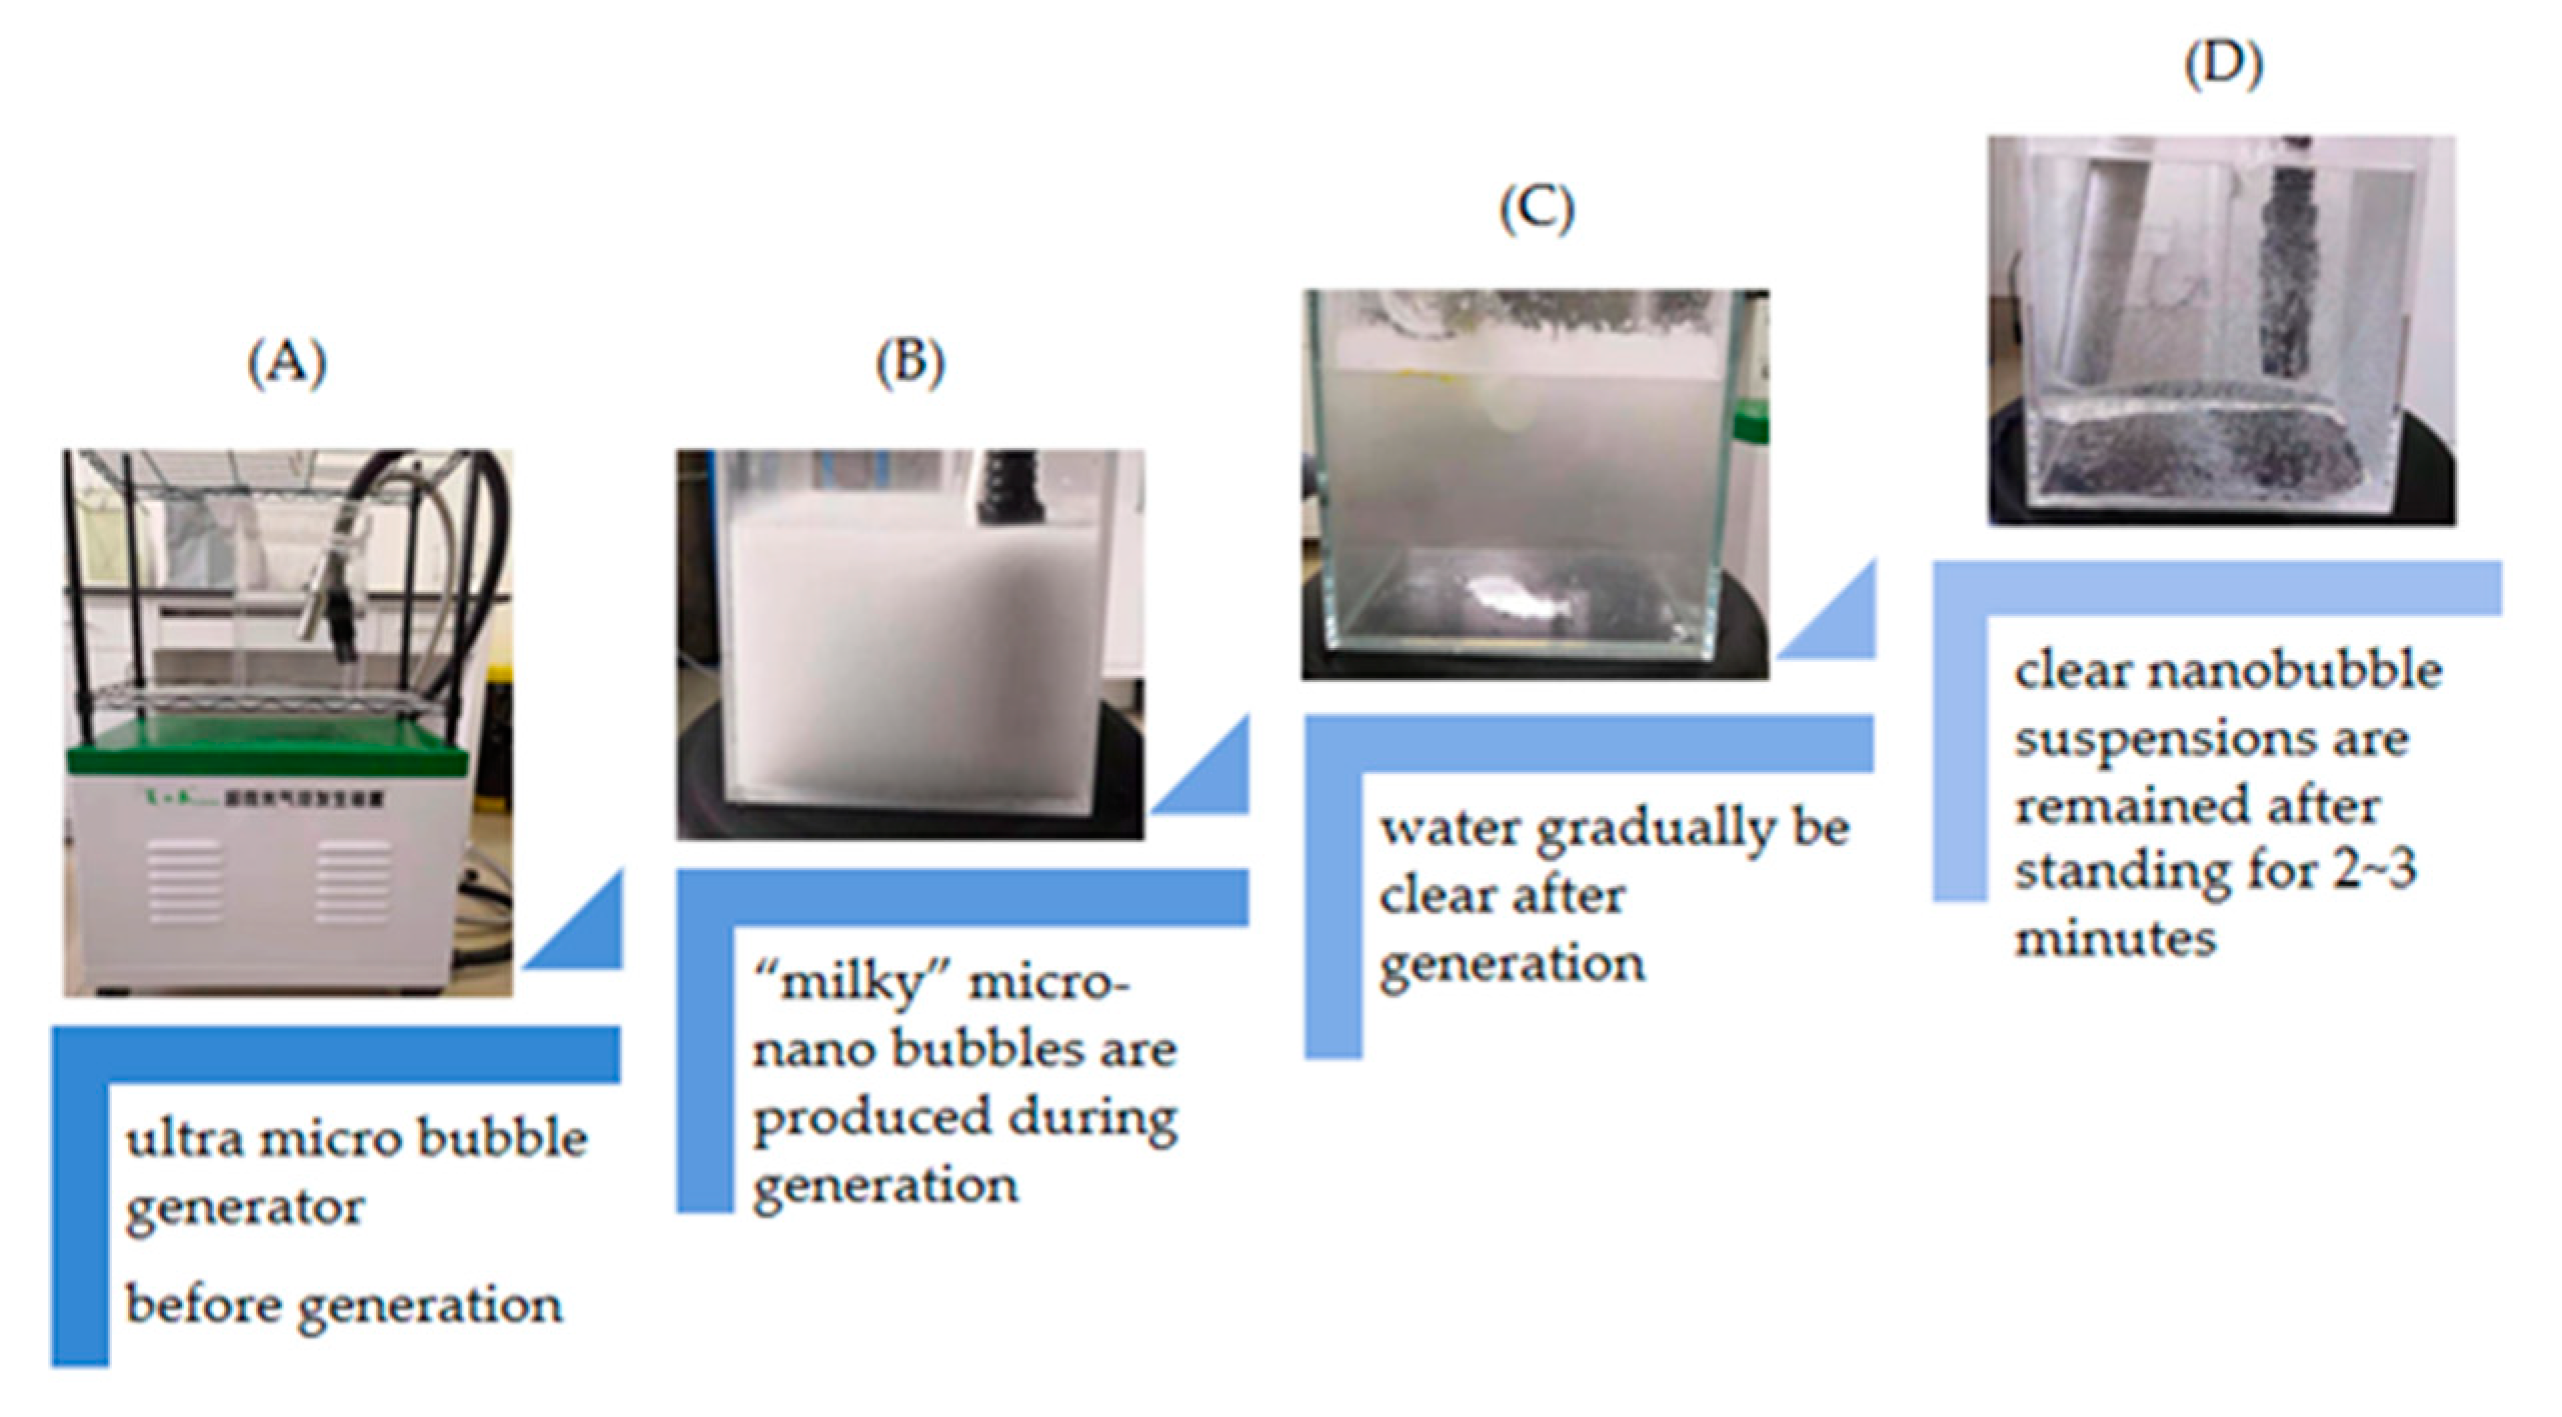
2.2. Generation of Different Kinds of Nanobubbles
2.3. Characterization of Bulk Nanobubble Suspensions
3. Results and Discussion
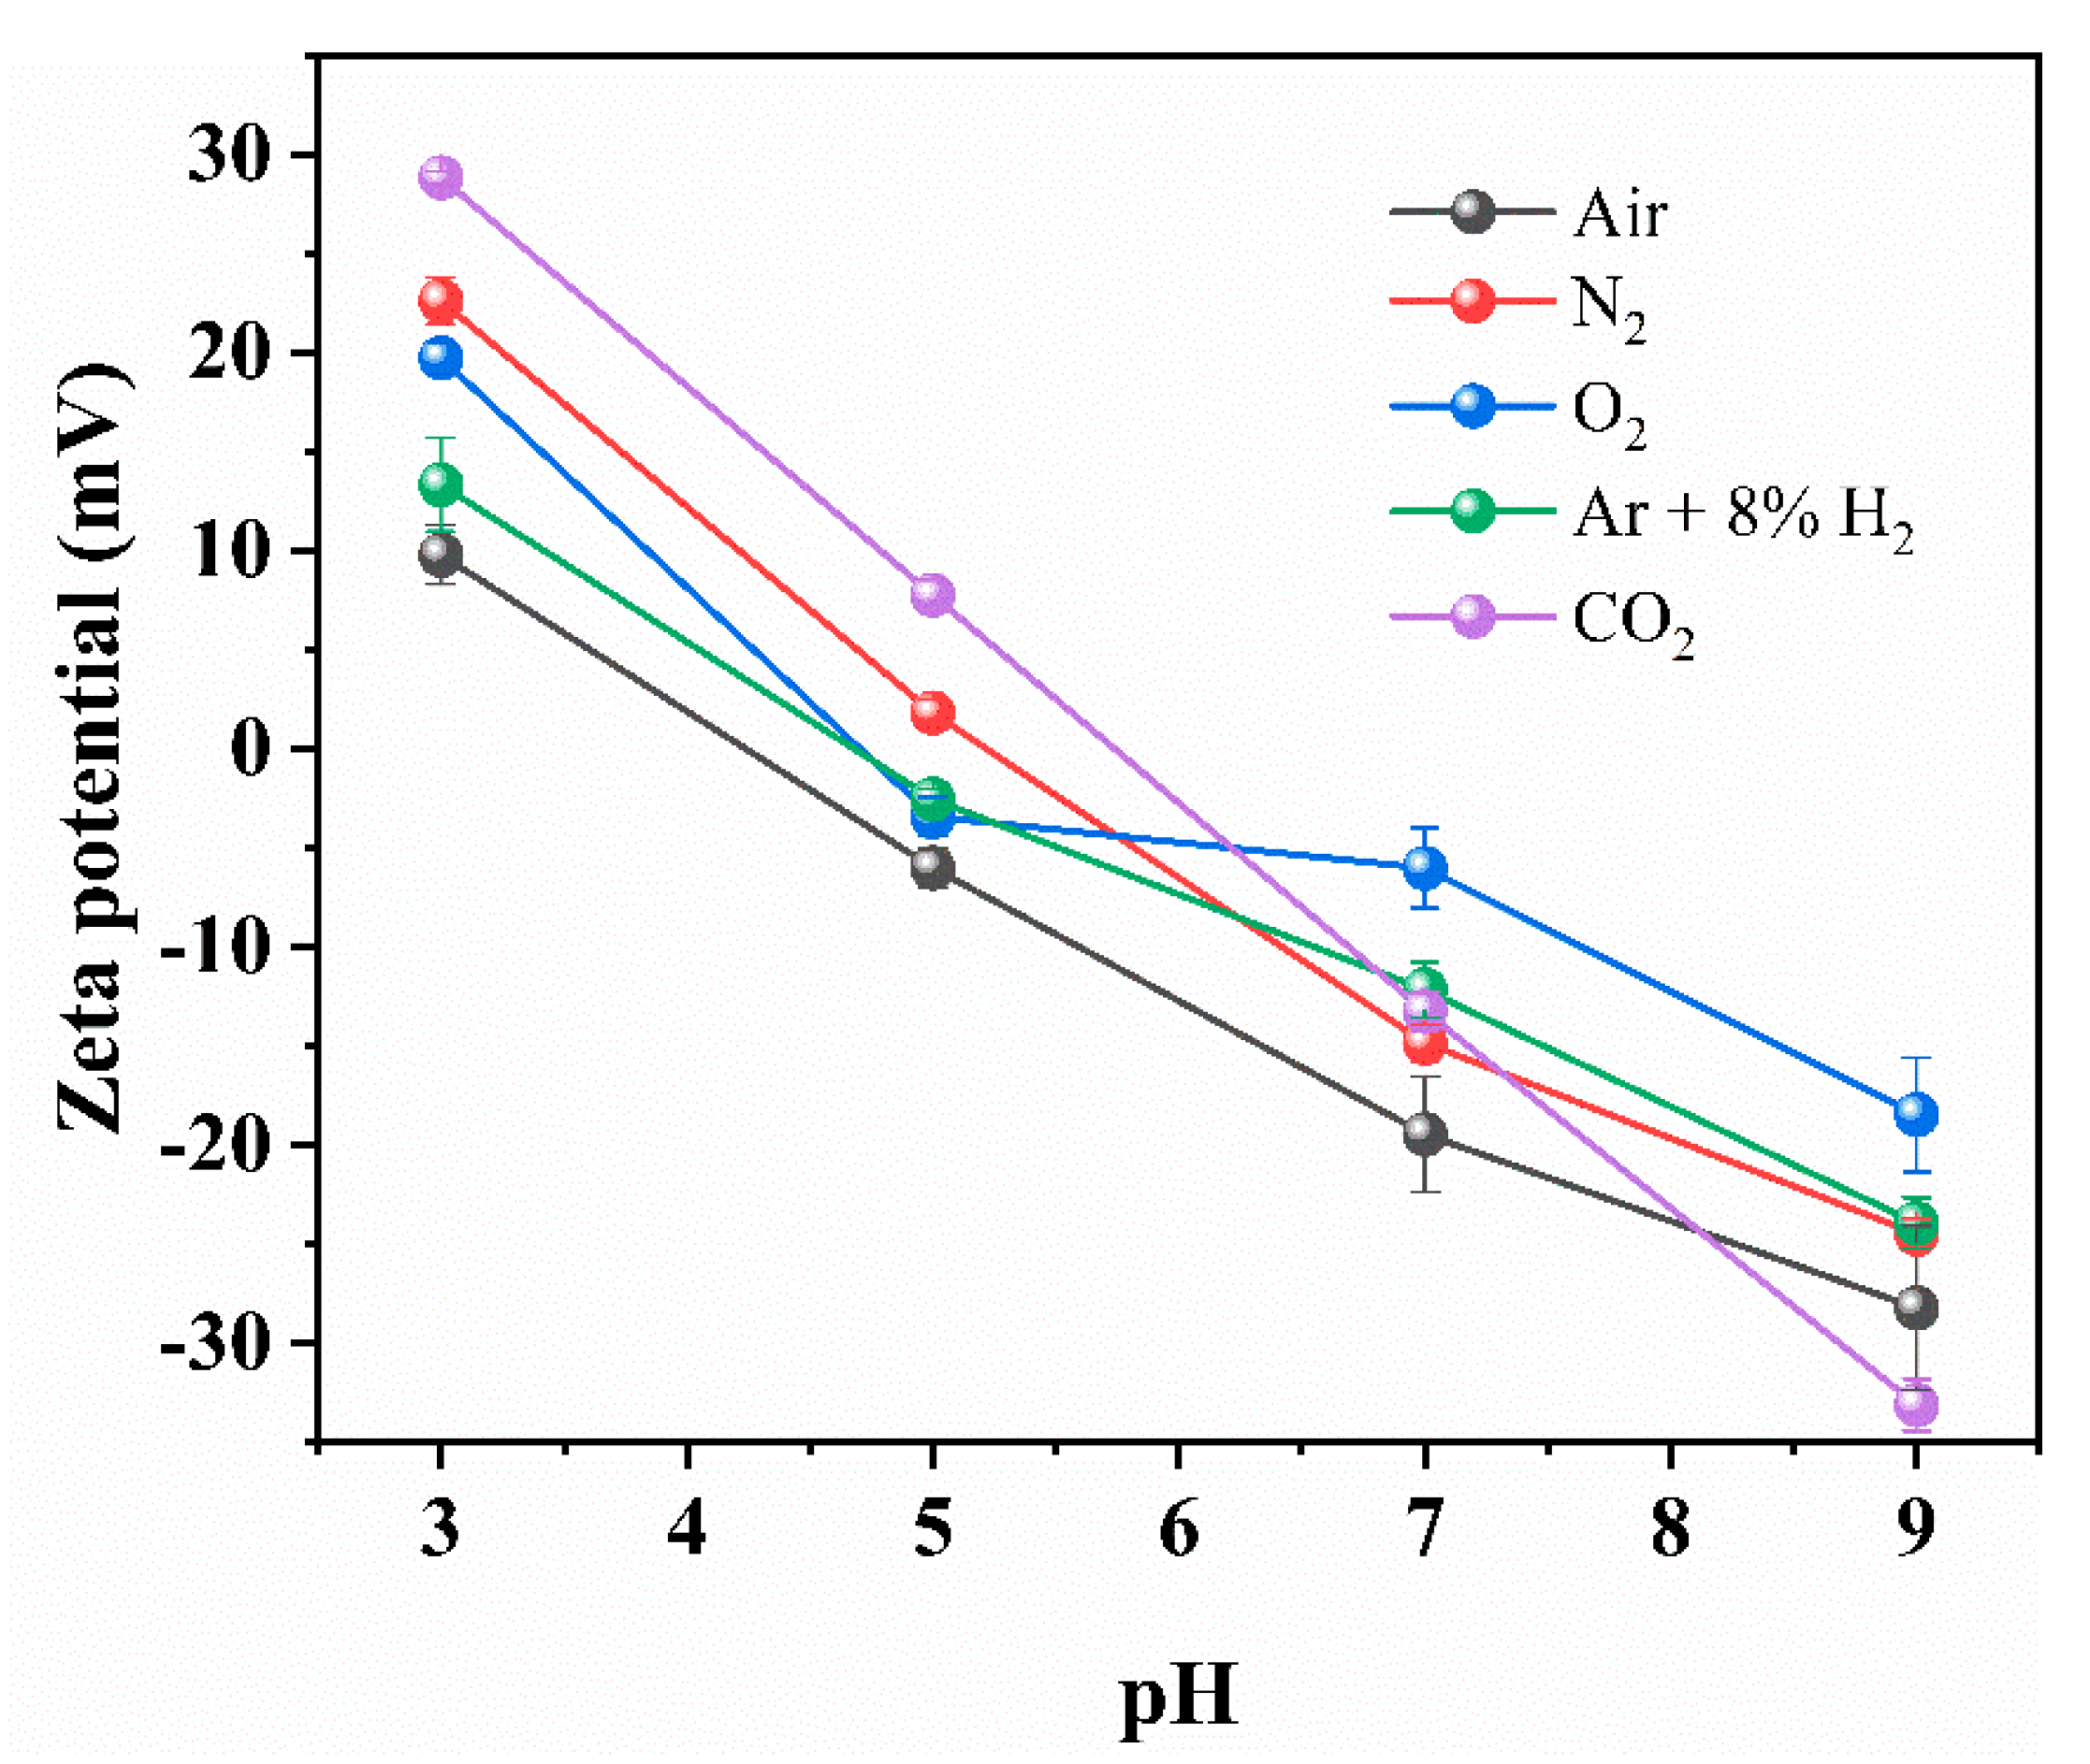
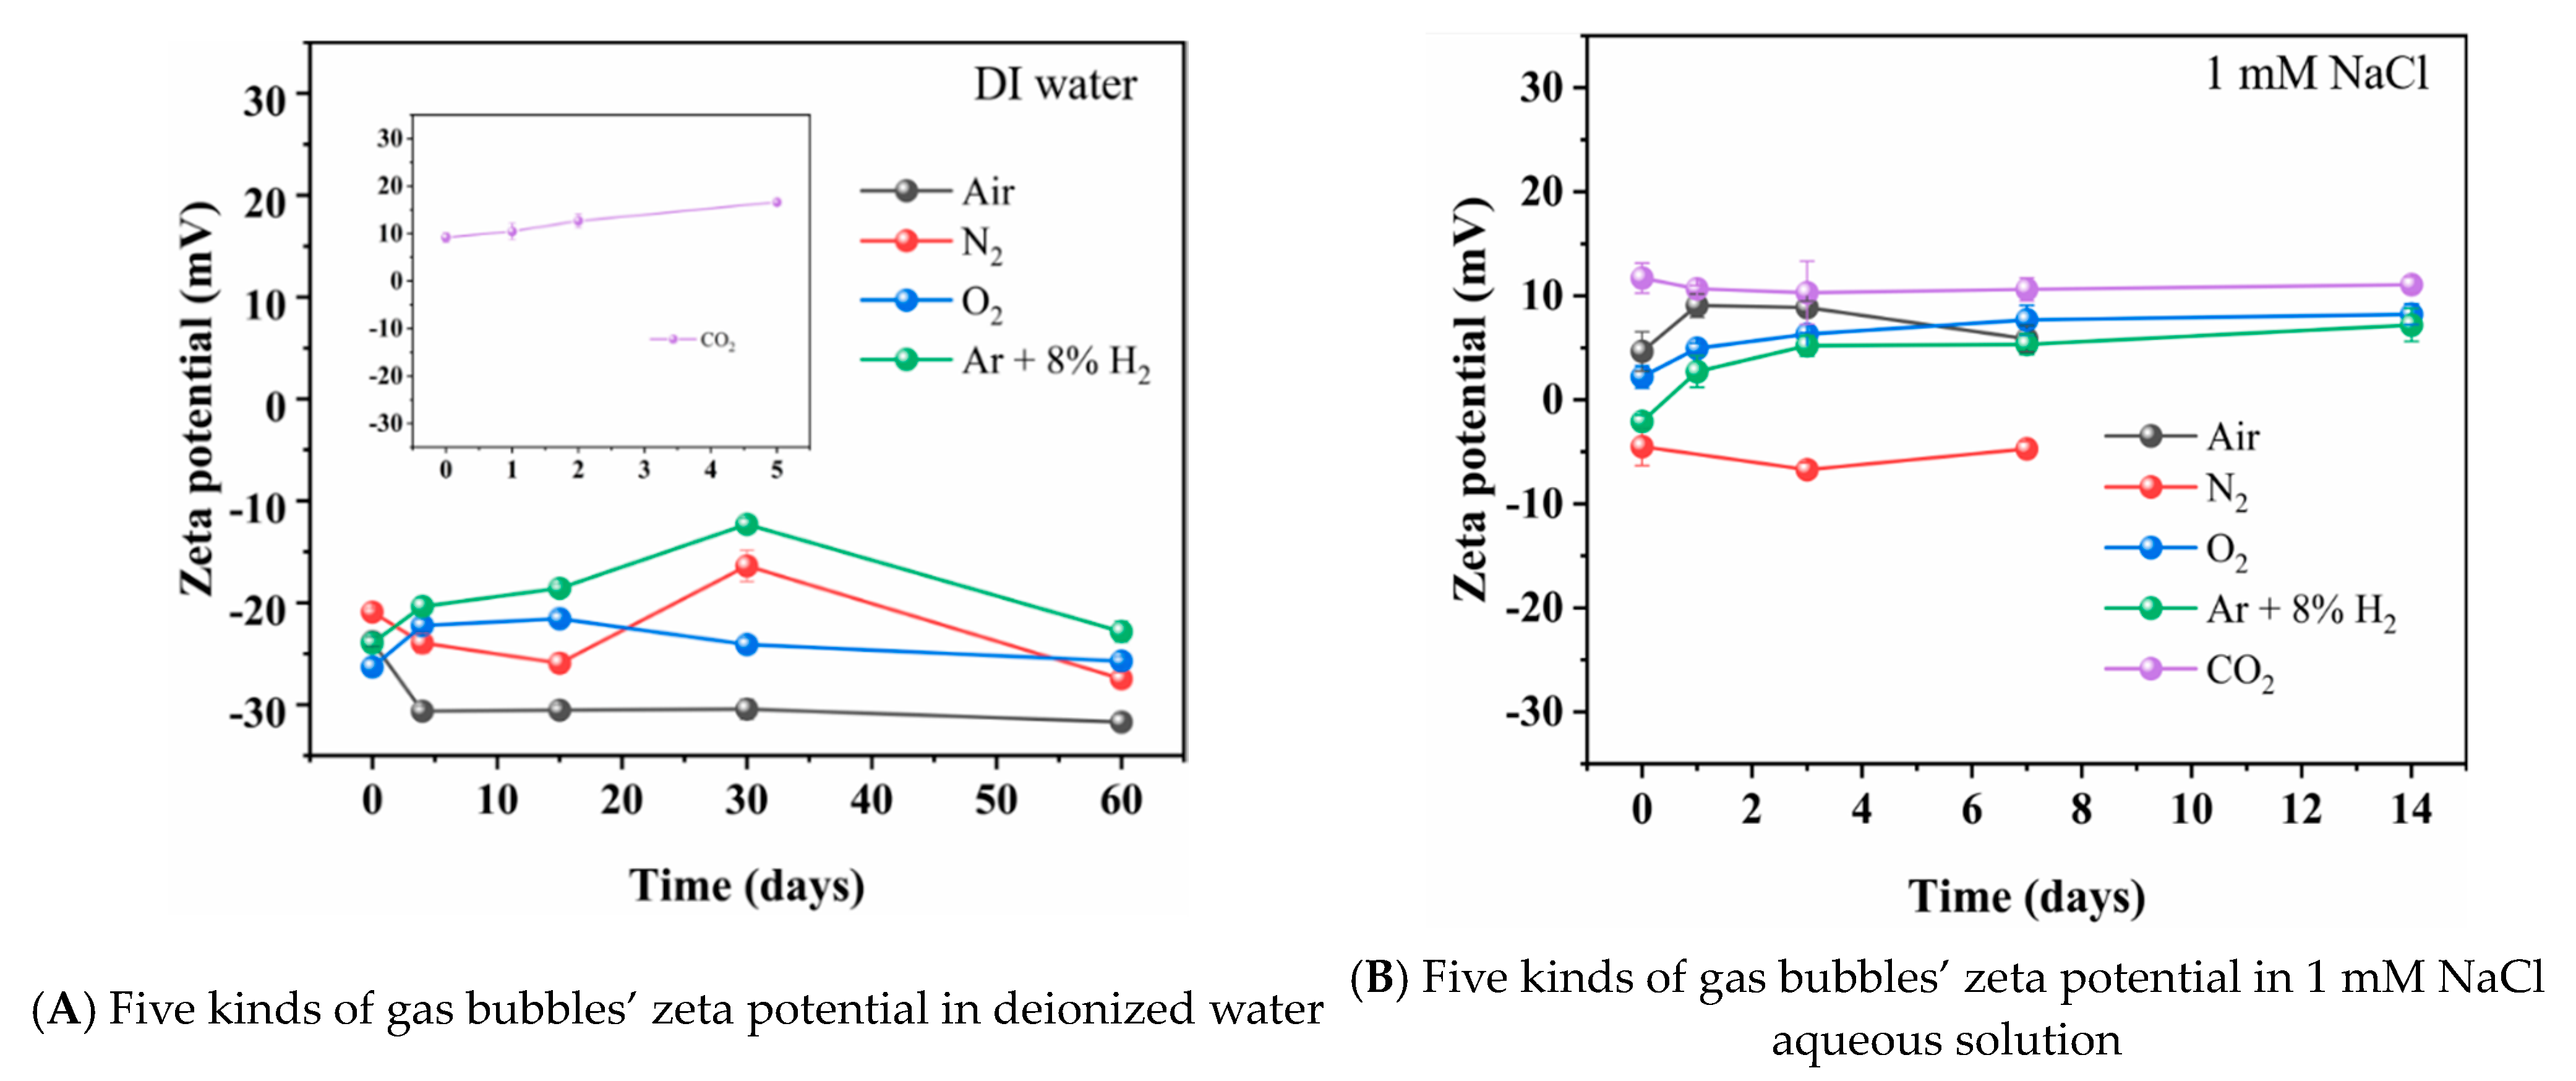
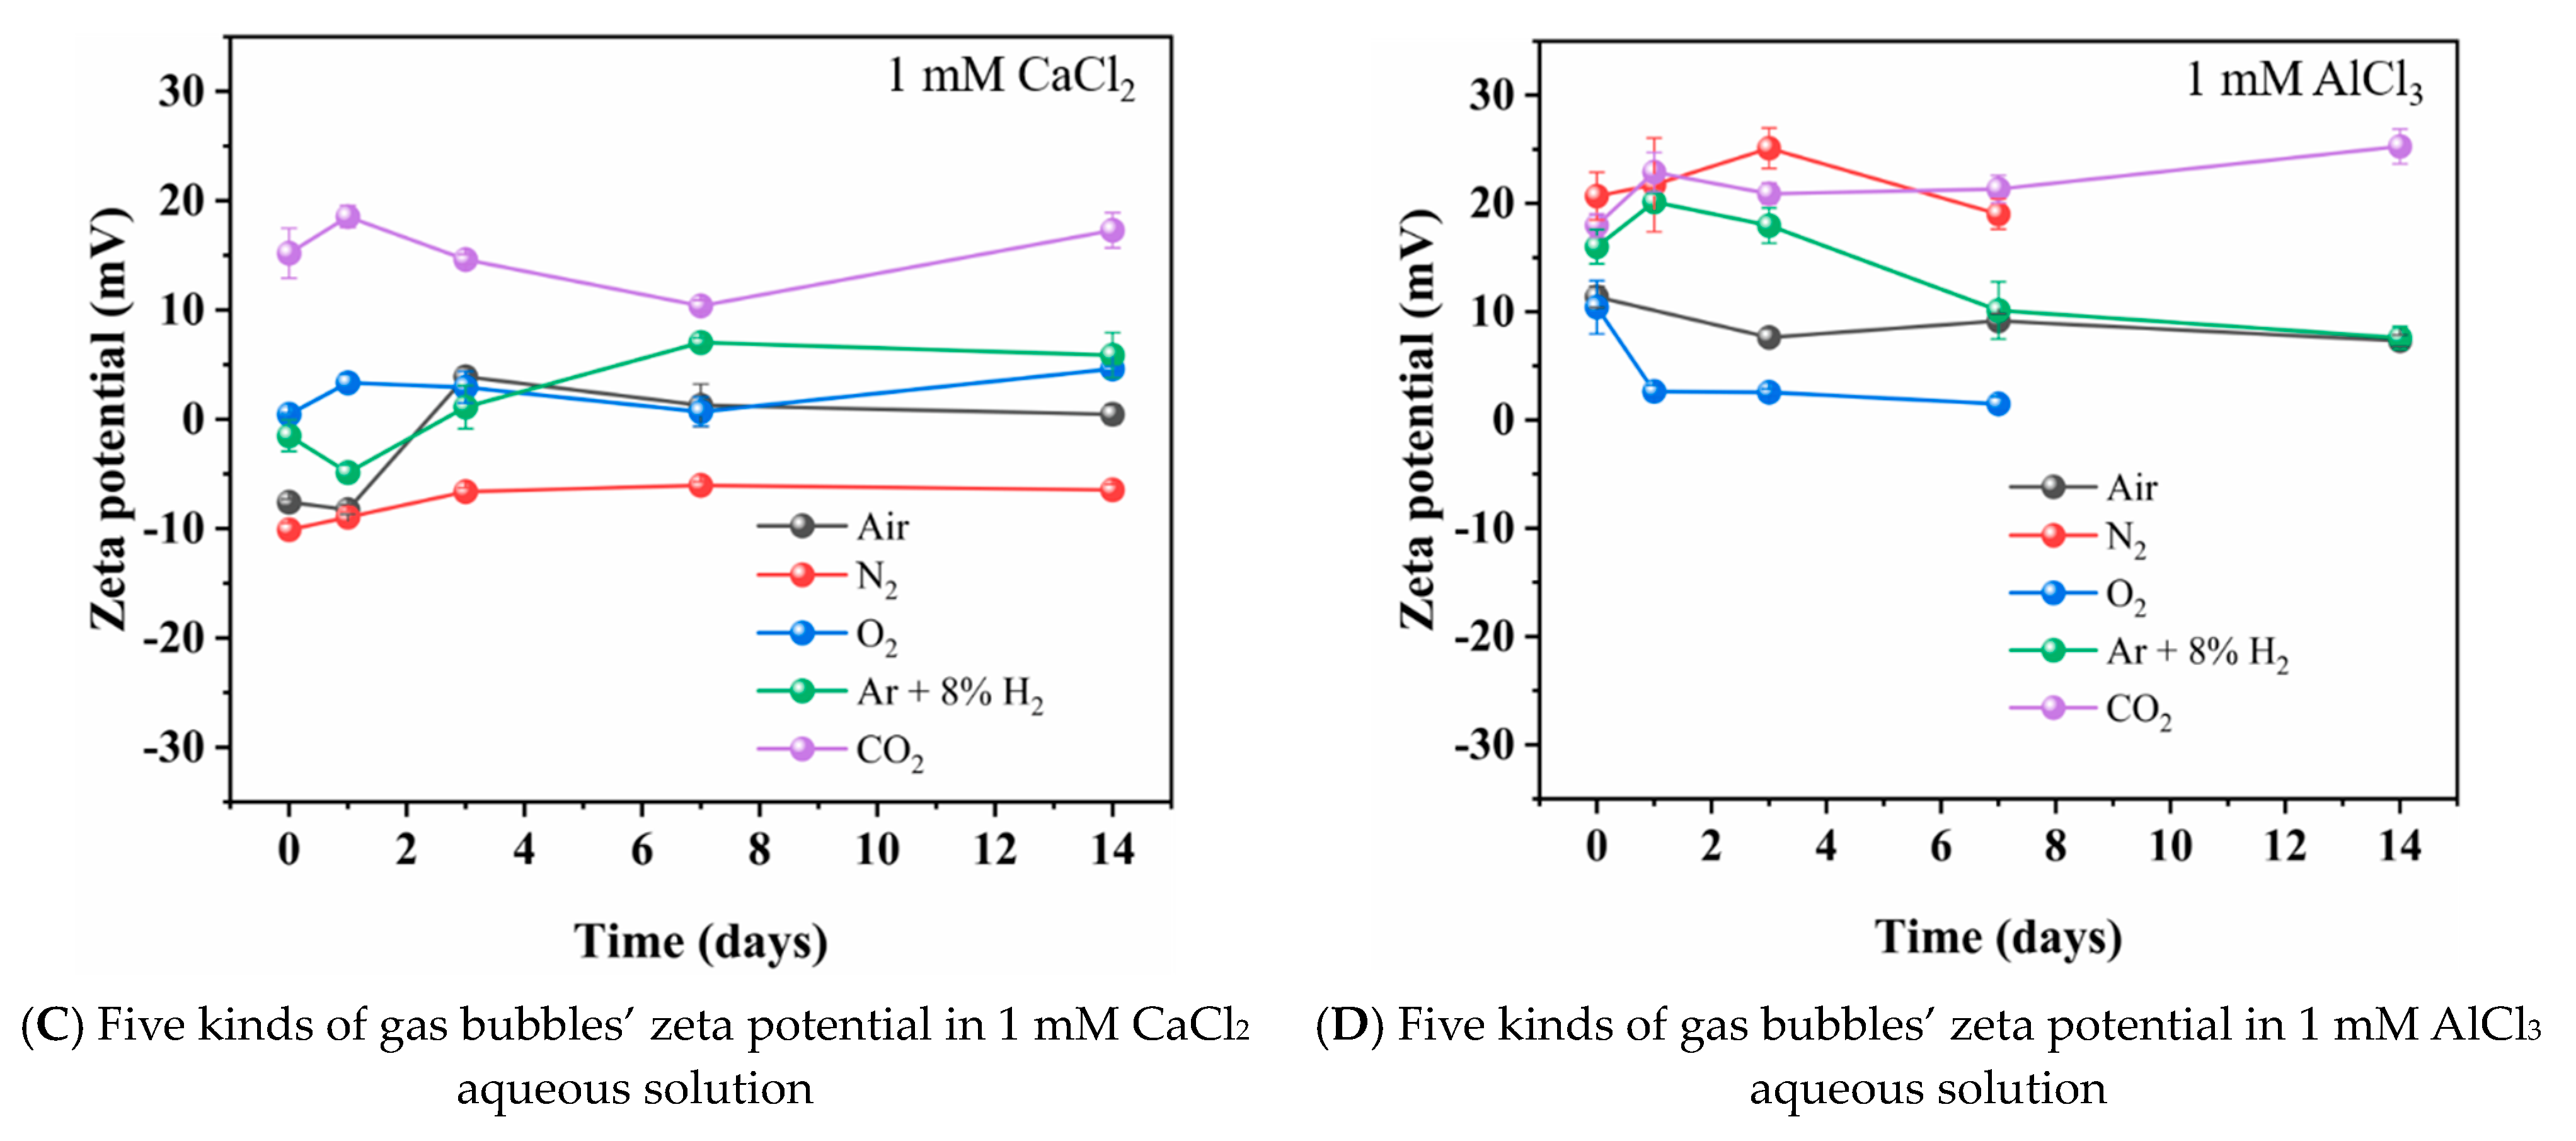
3.1. Zeta Potential of Different Kinds of Nanobubbles
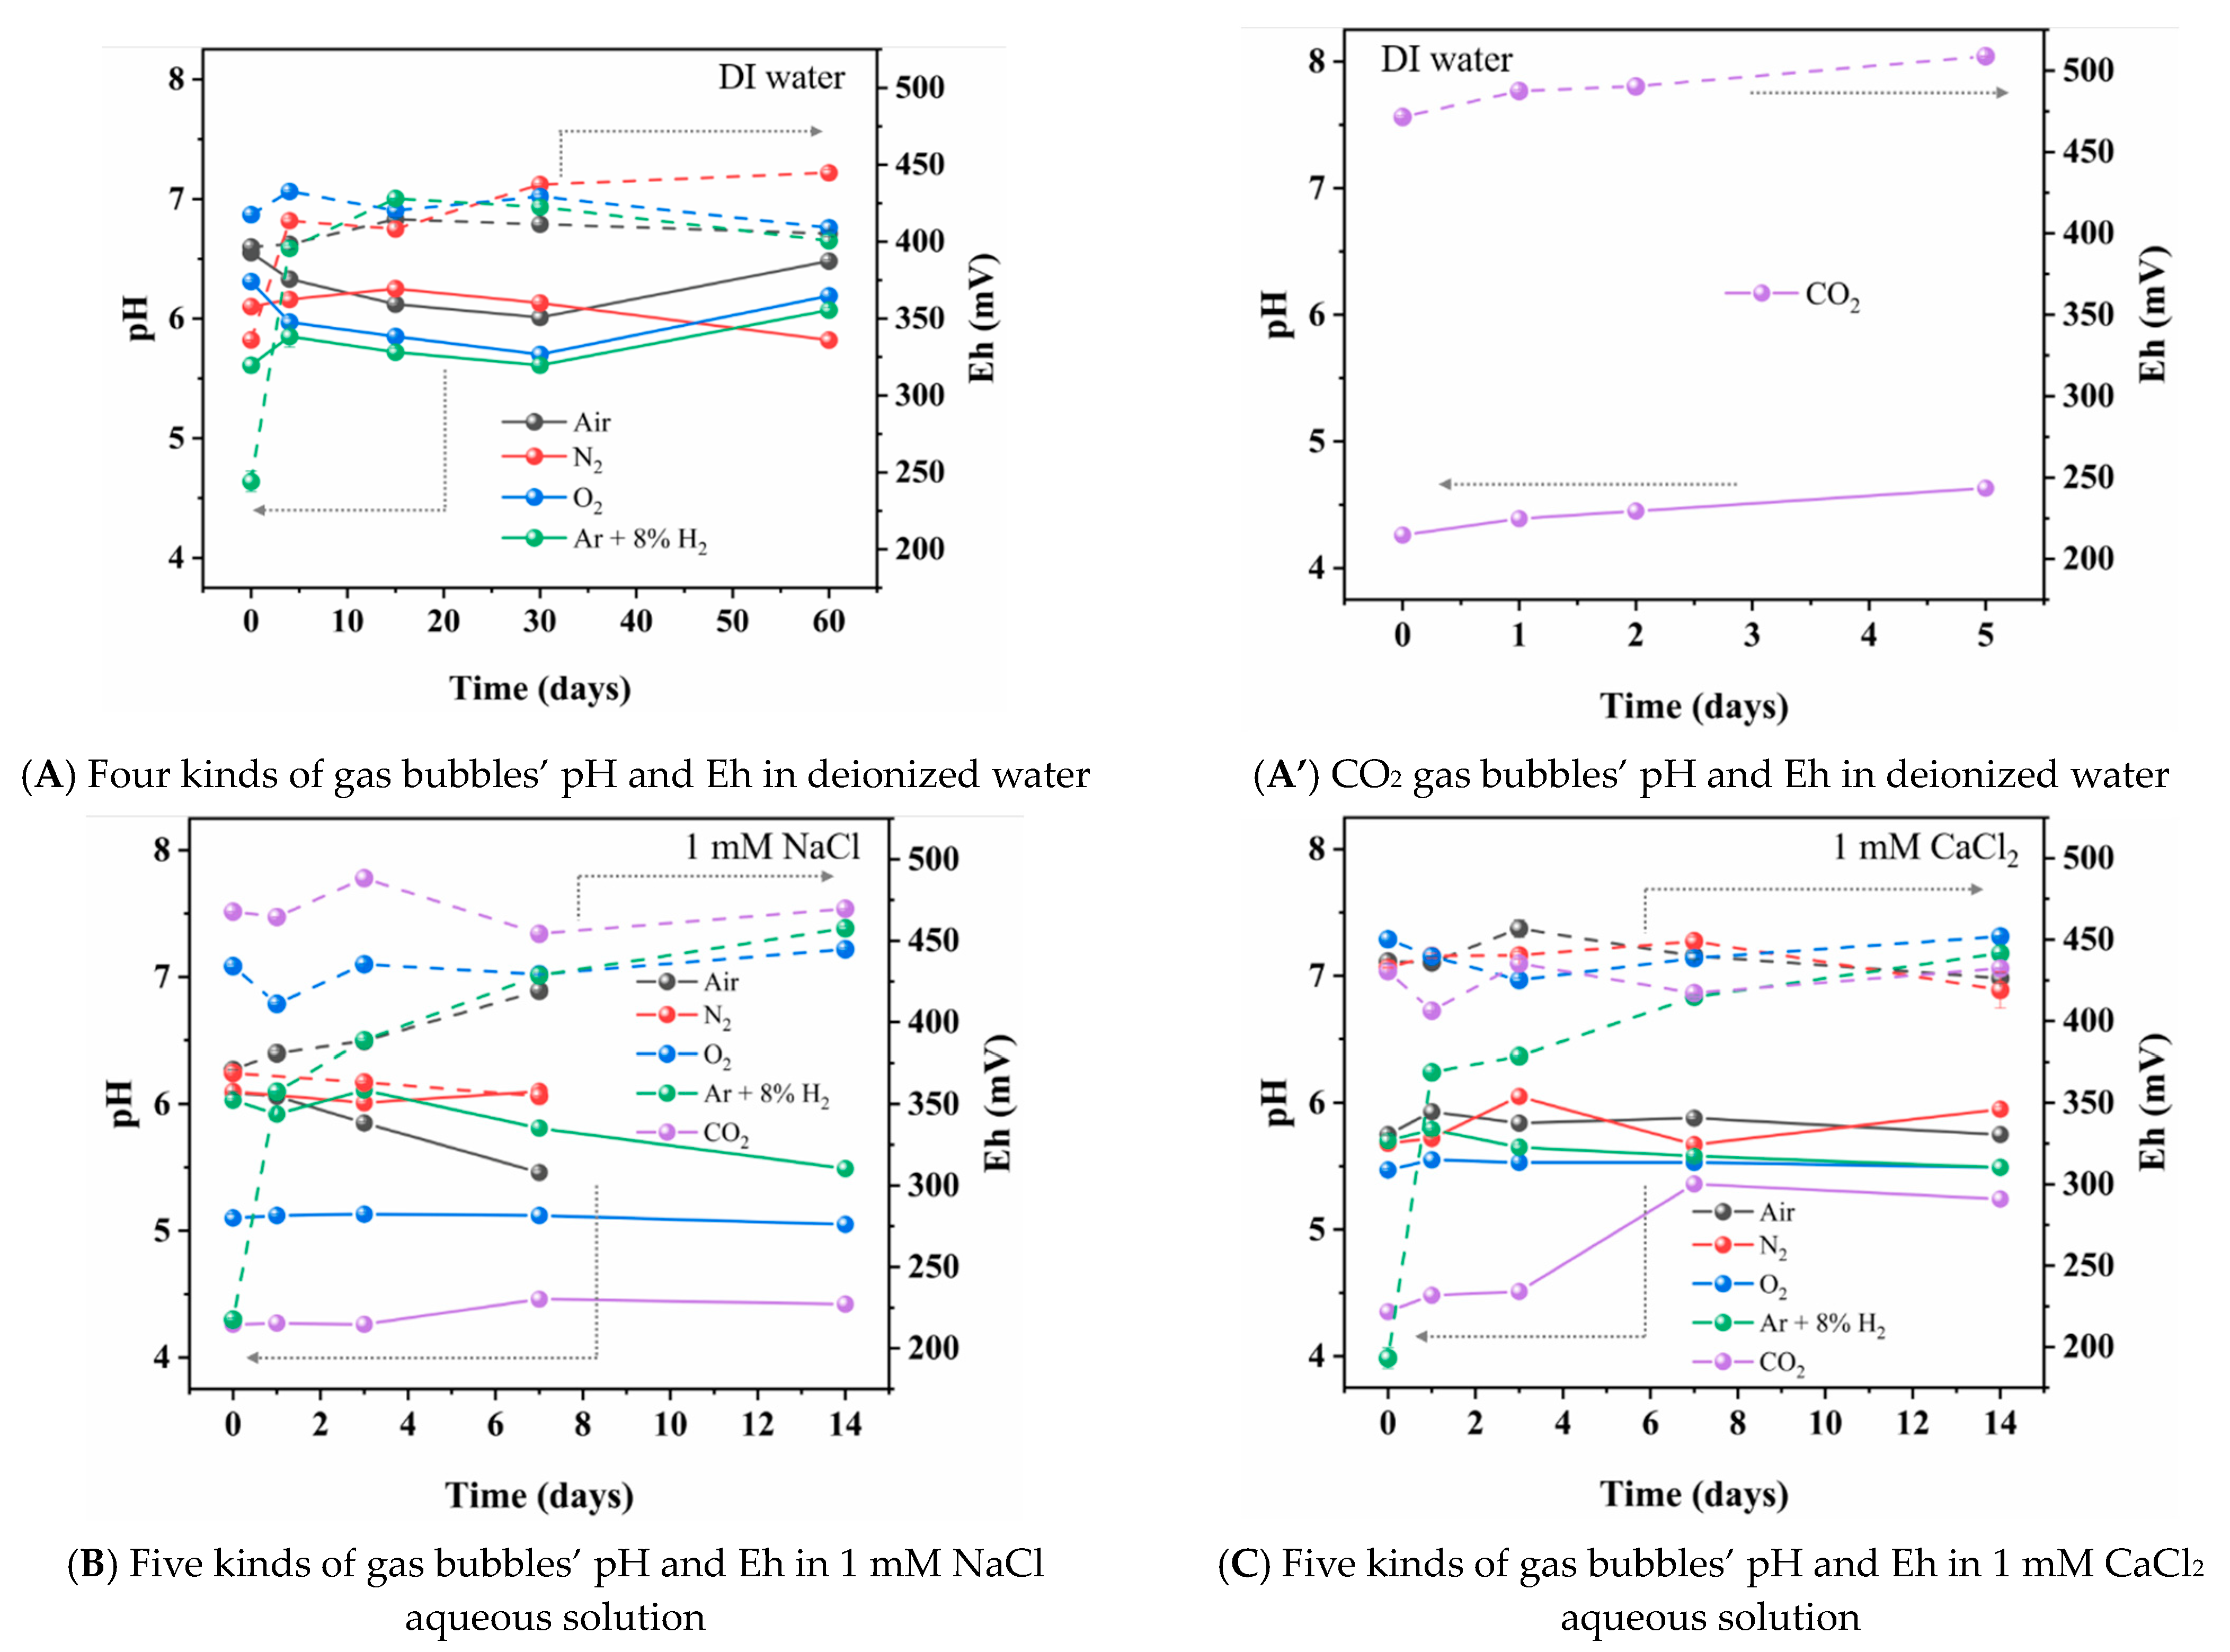
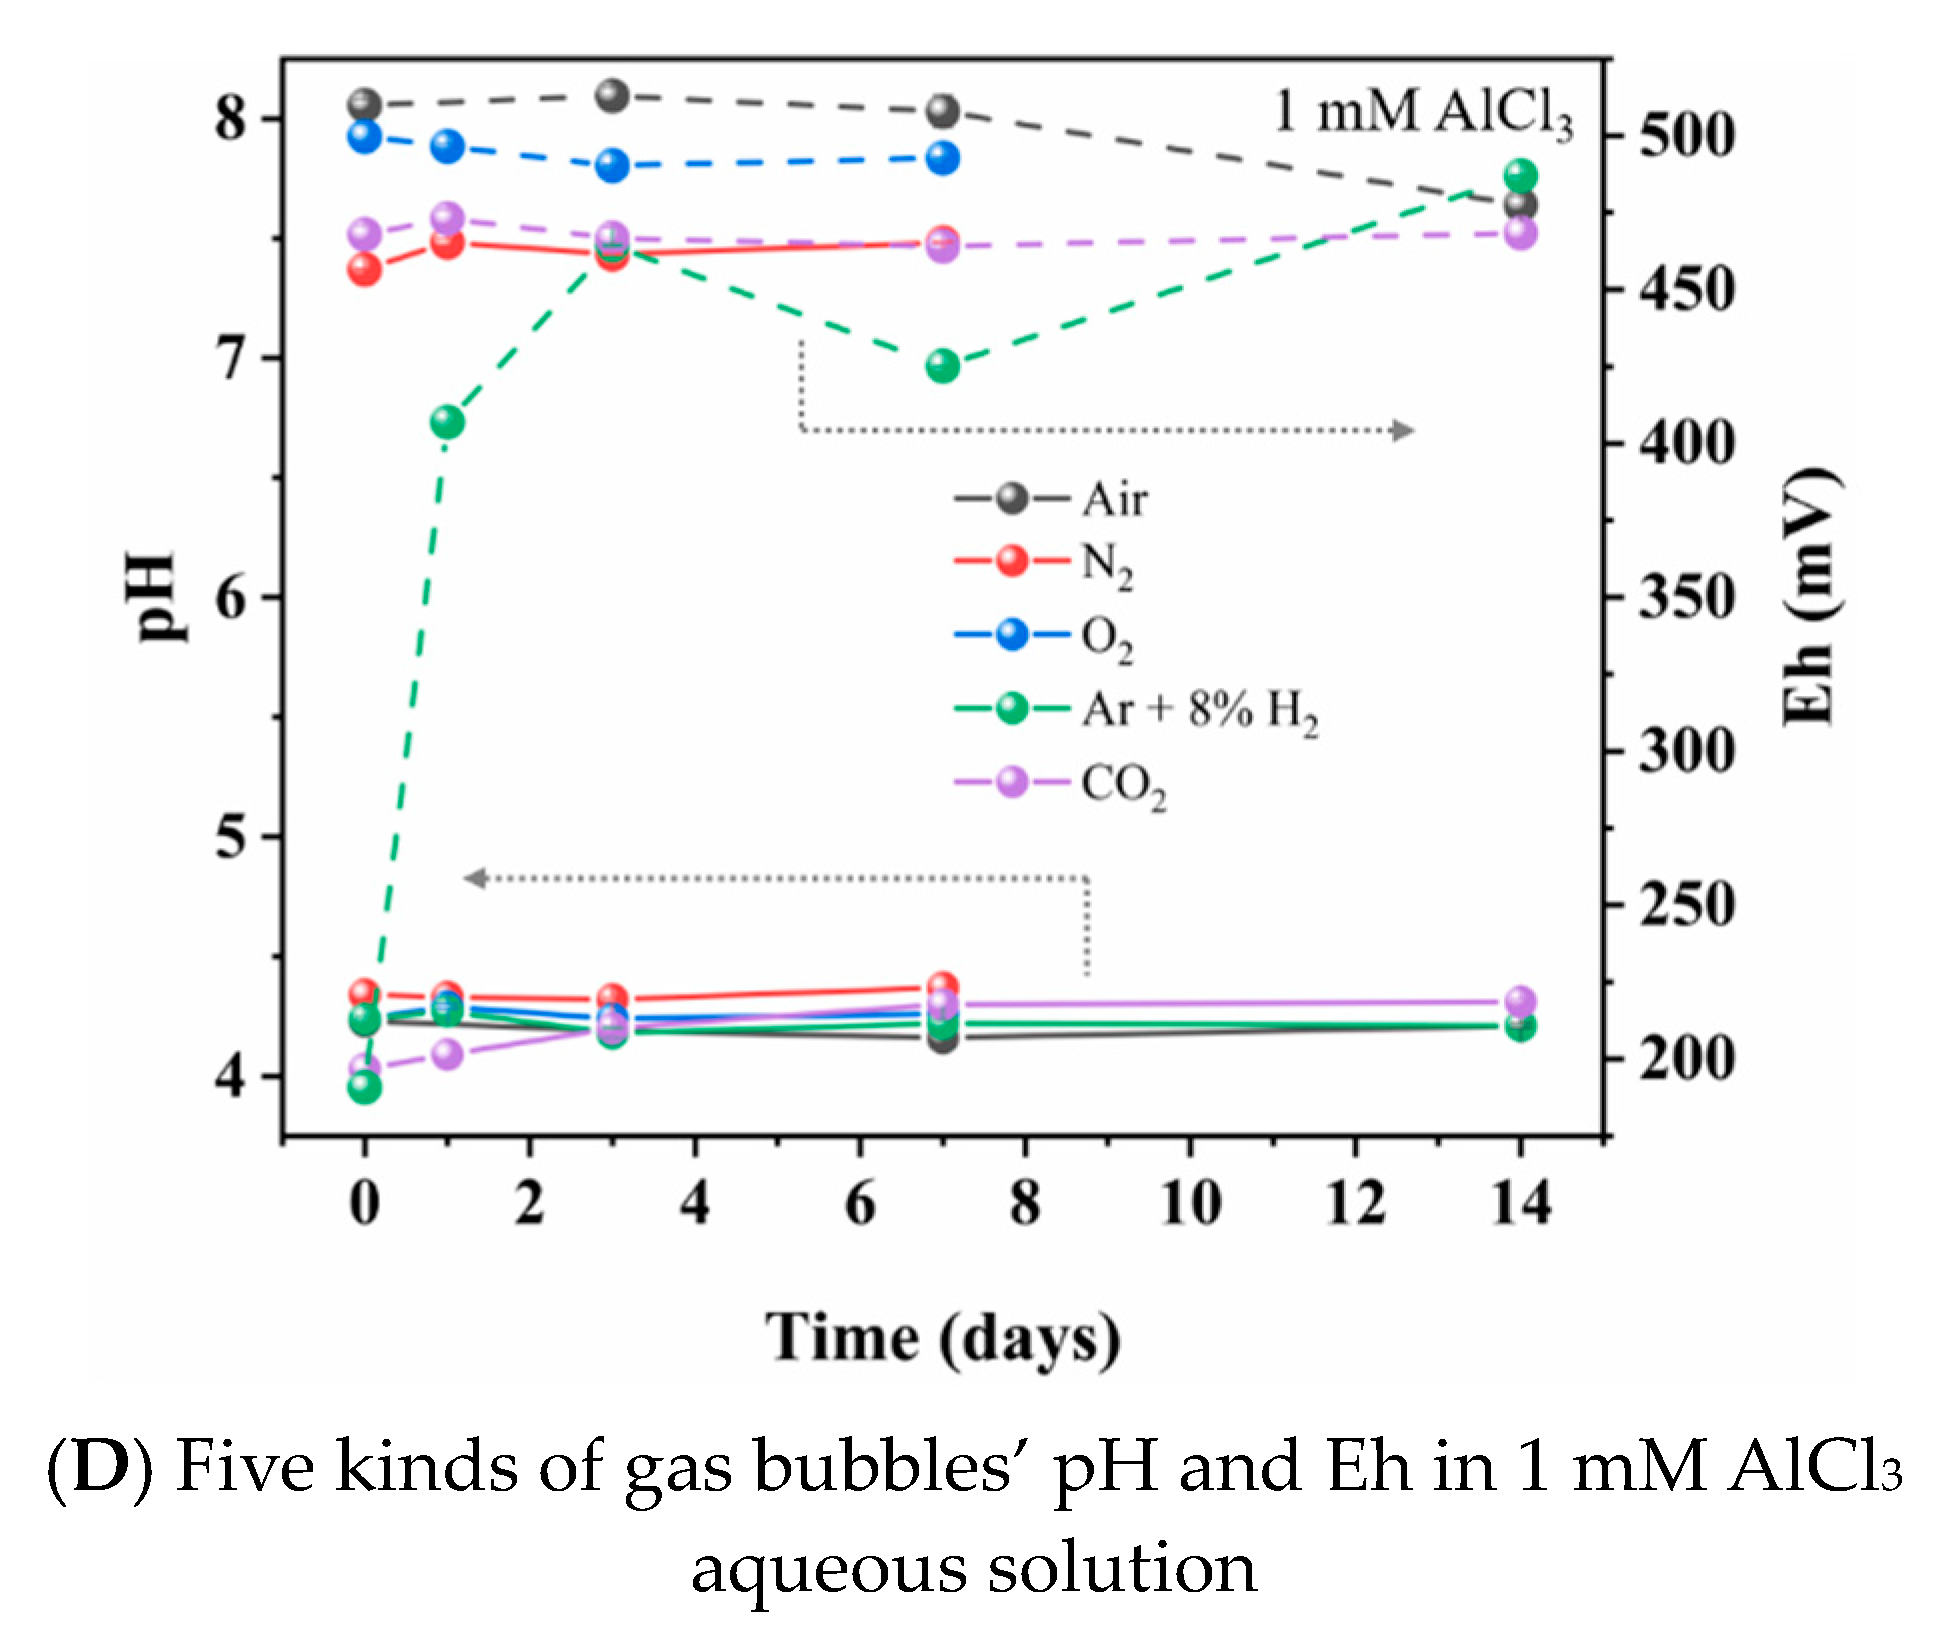
3.2. Time Effect of Mean Size and Zeta Potential of Different Gas Nanobubbles and pH and Eh of Nanobubble Suspensions
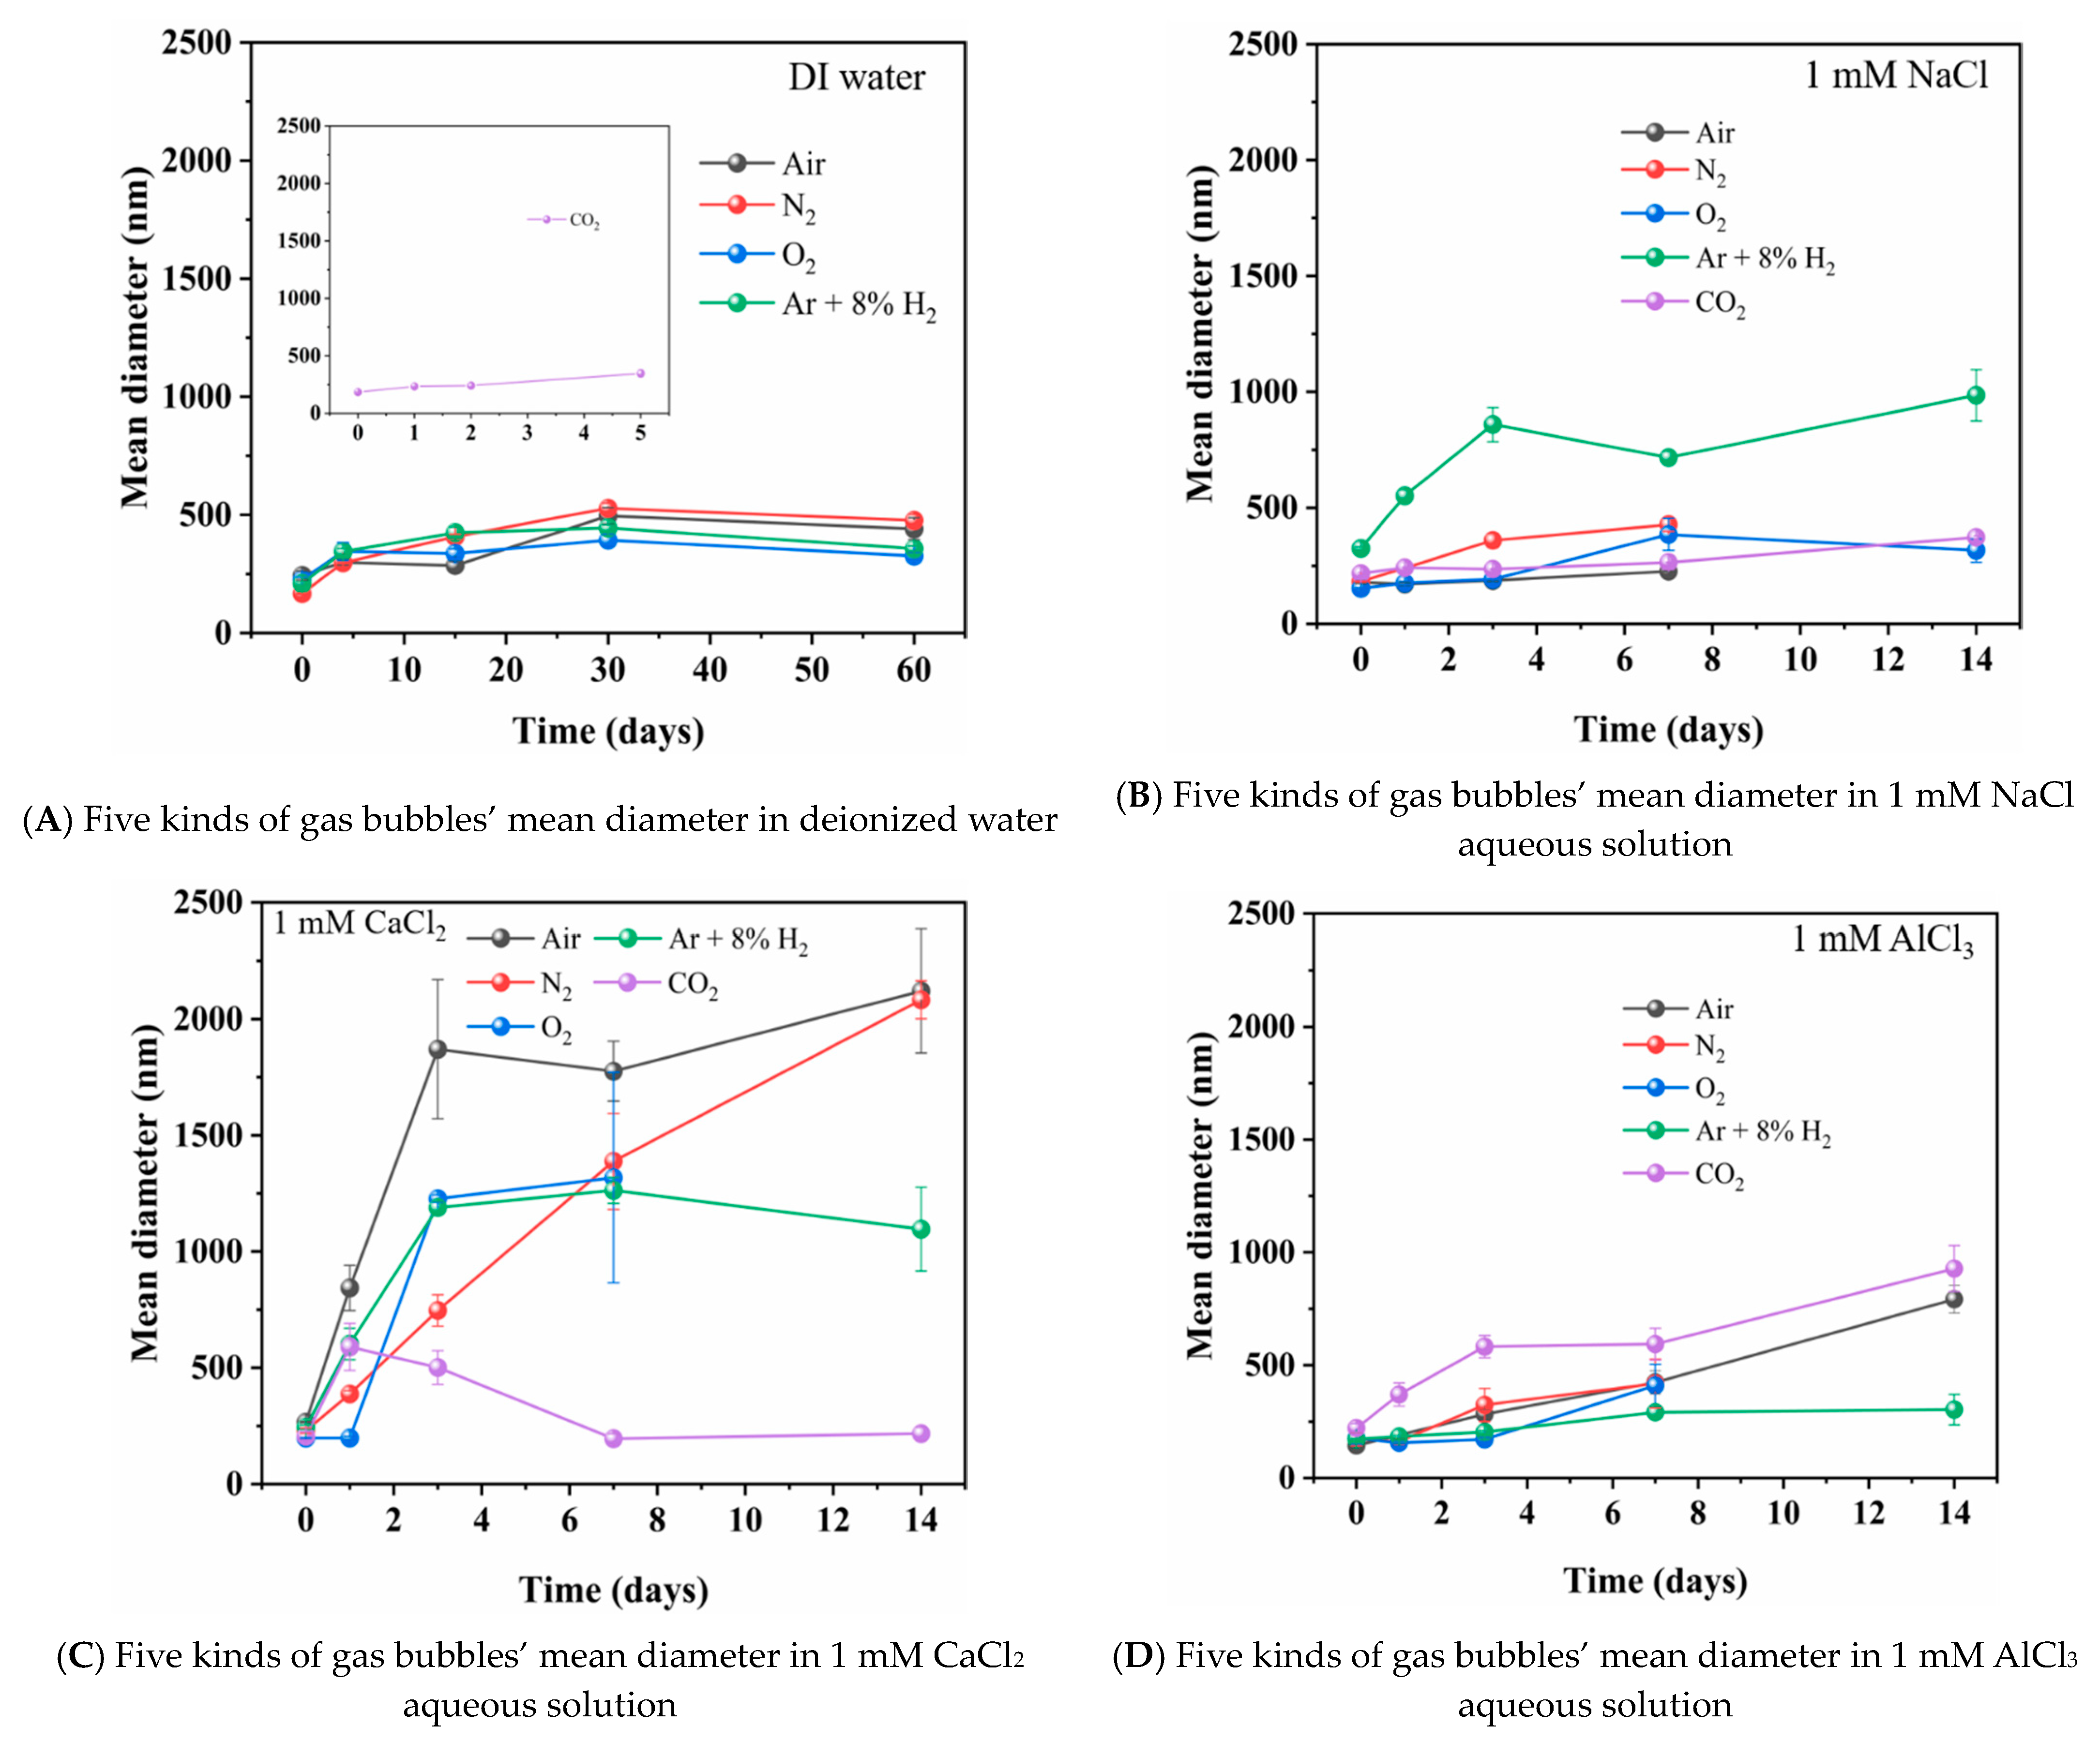
3.2.1. Nanobubble Characteristics Change as a Function of Time in Deionized Water
3.2.2. Nanobubble Characteristics Change as a Function of Time in Salt Aqueous Solutions
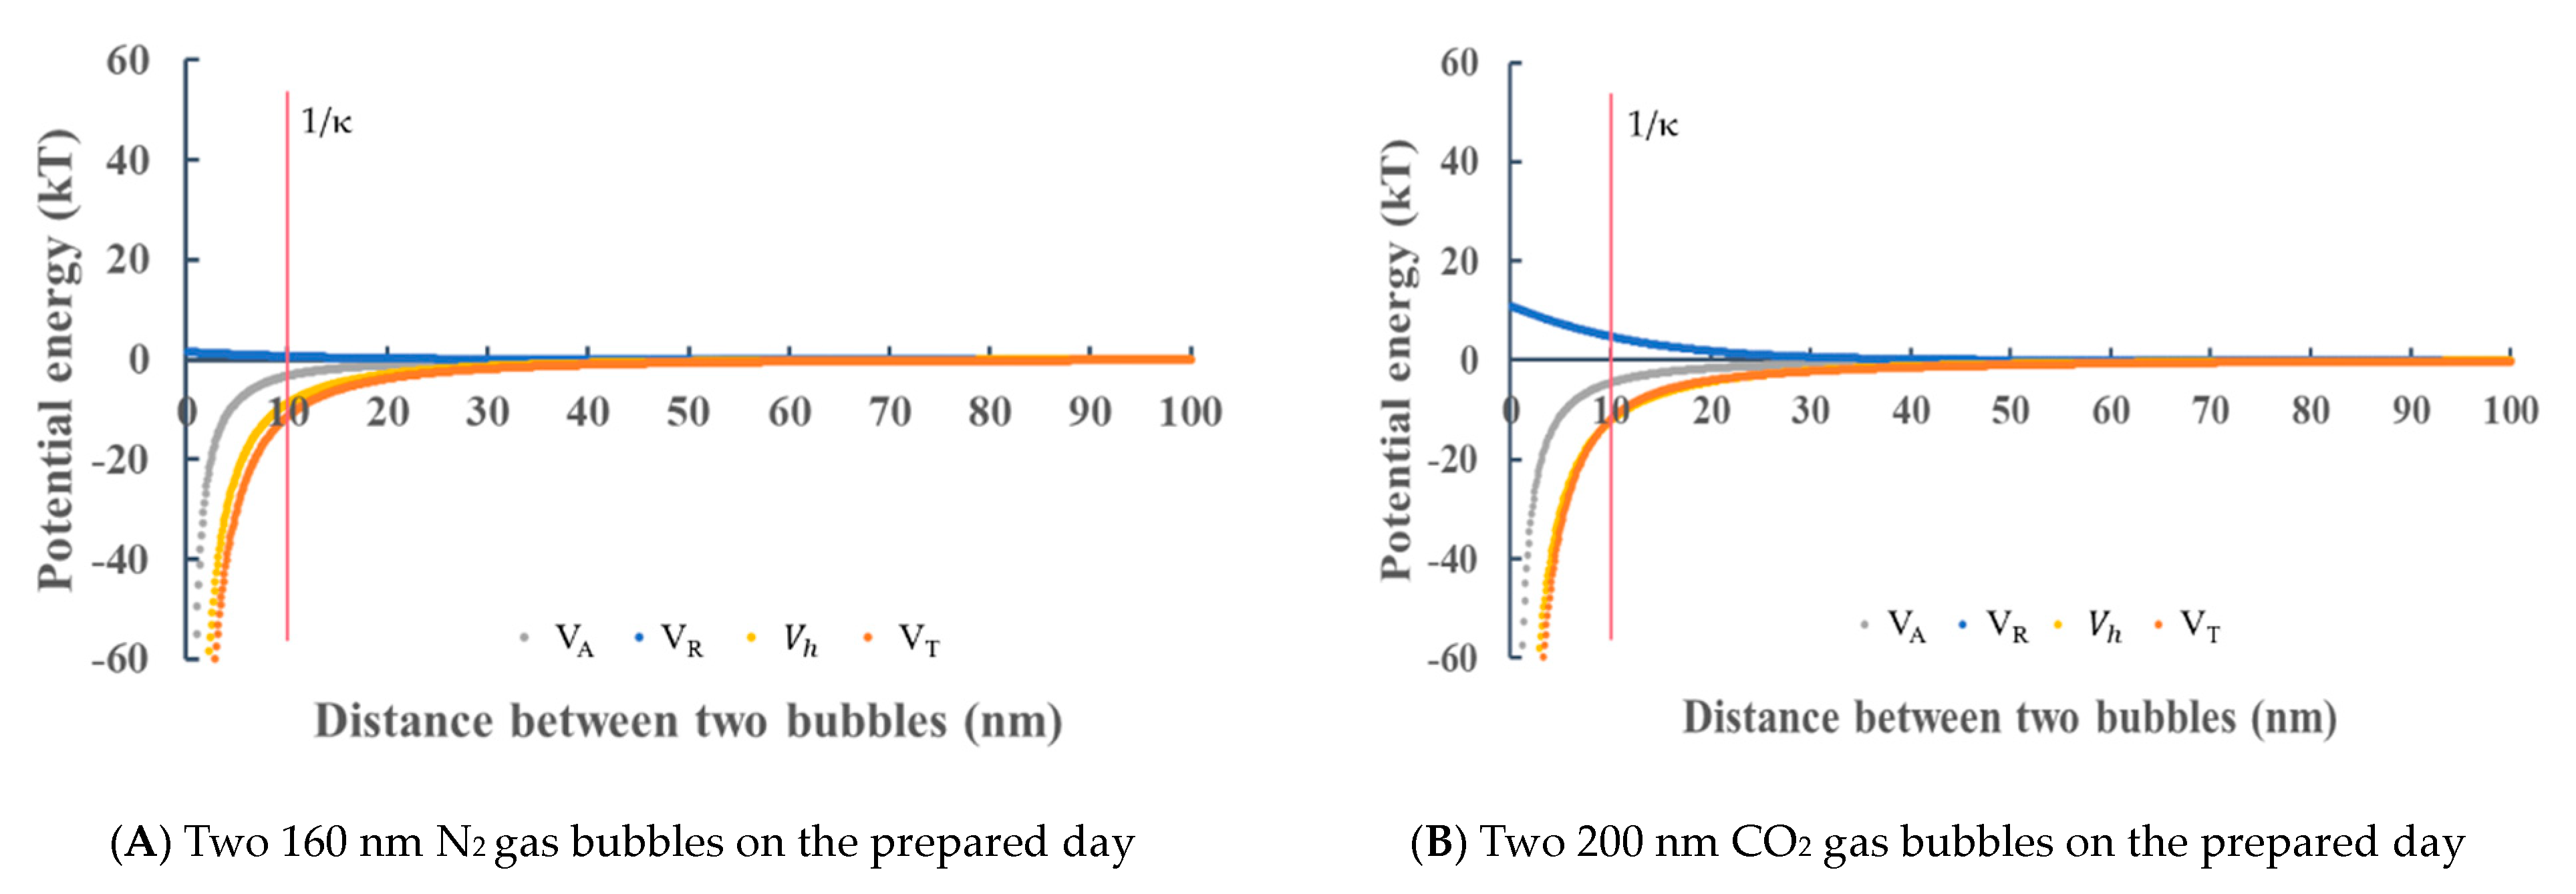
3.3. Nanobubble Stabilization Estimation by Using the Extended DLVO Theory
3.3.1. Stability Calculation of Nanobubbles in Deionized Water
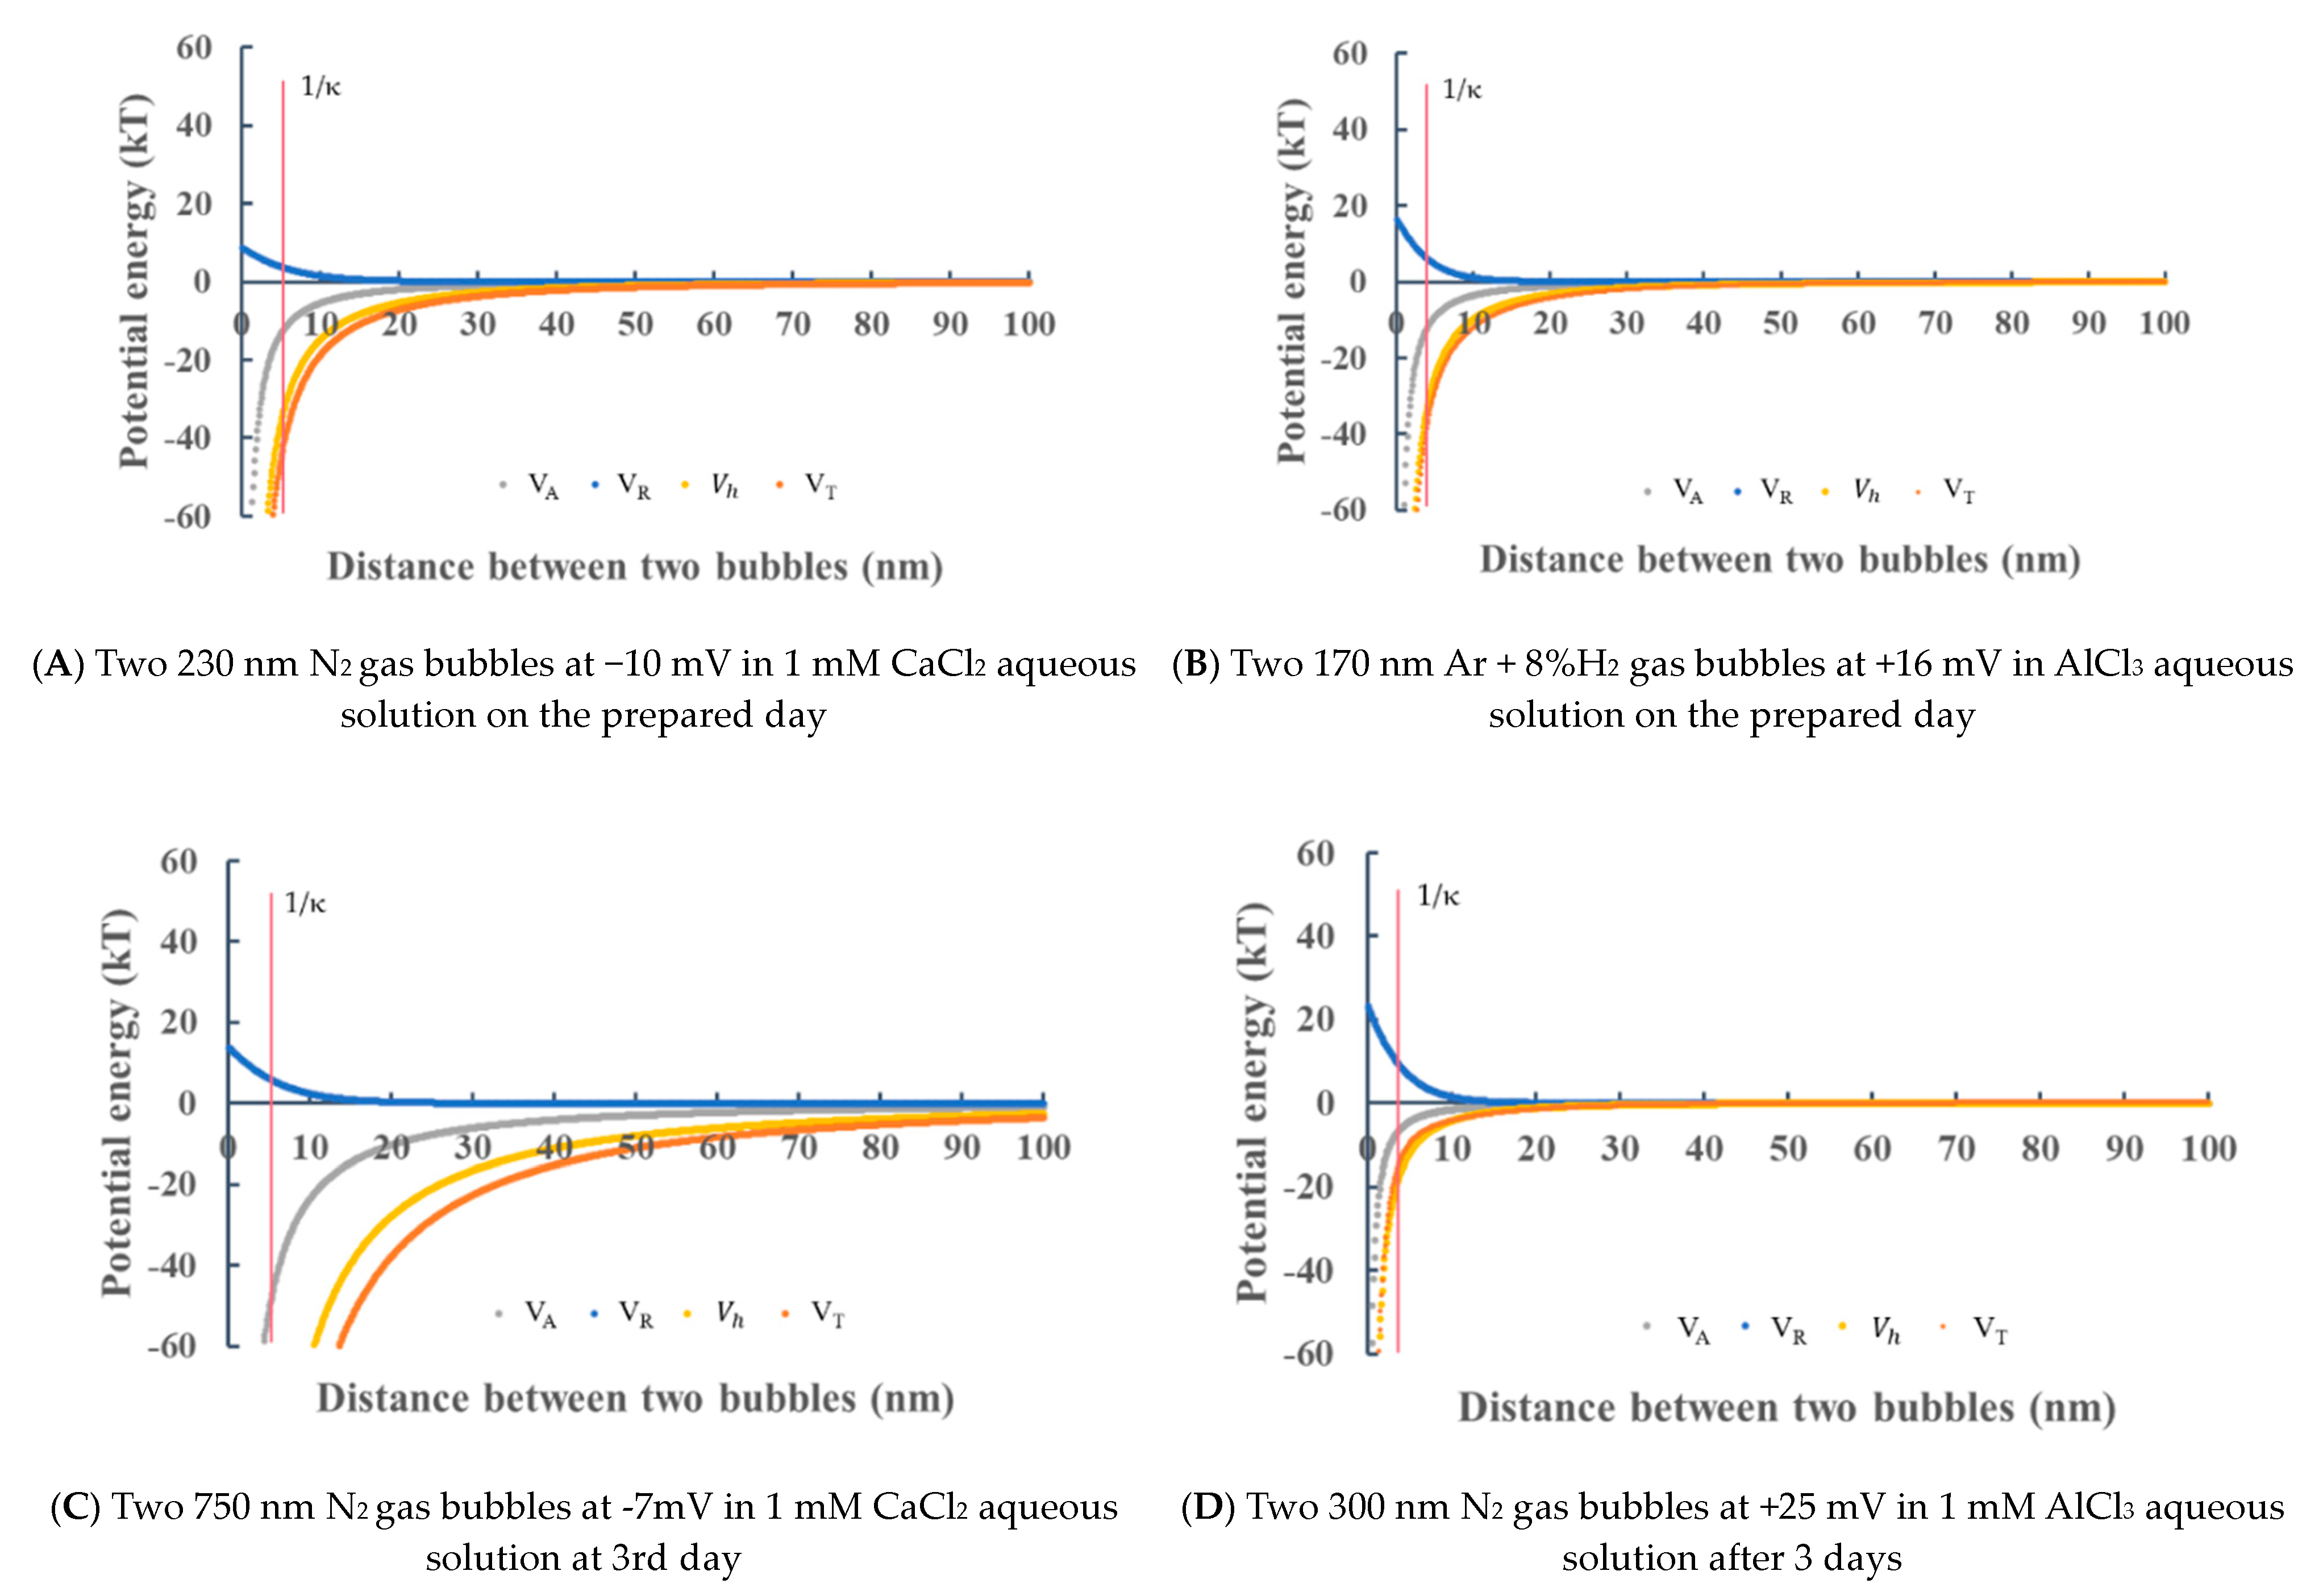
3.3.2. Stability Calculation of Nanobubbles in Salt Aqueous Solutions
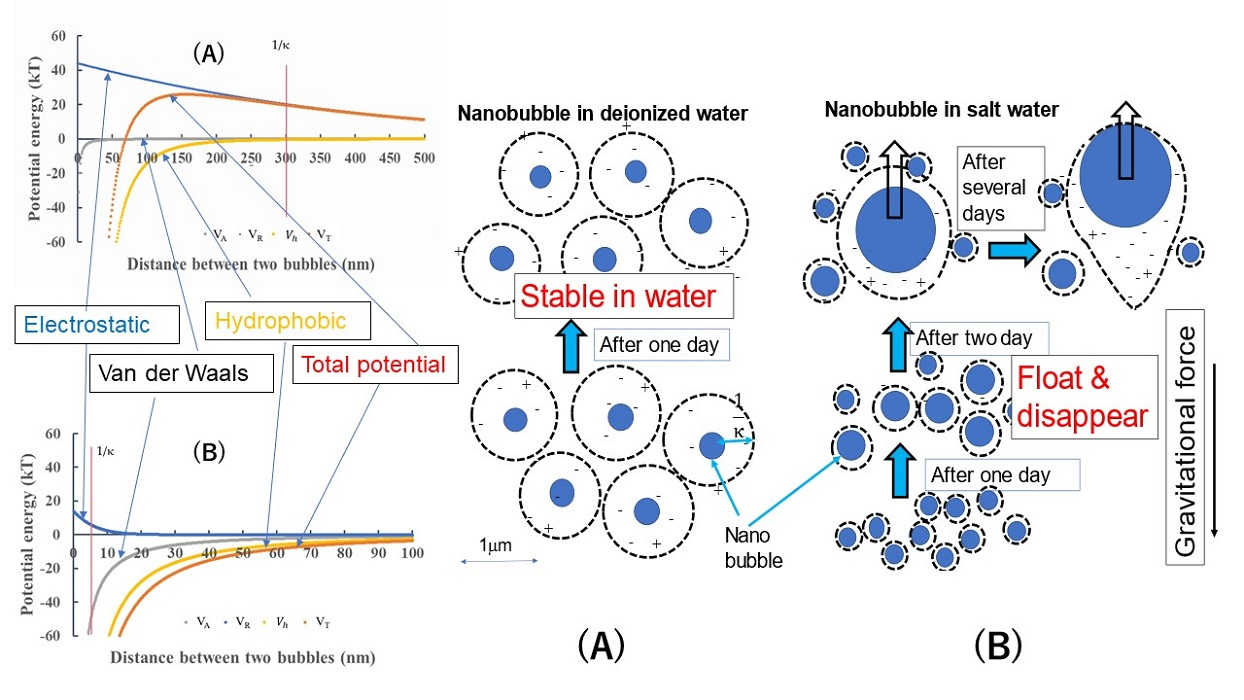
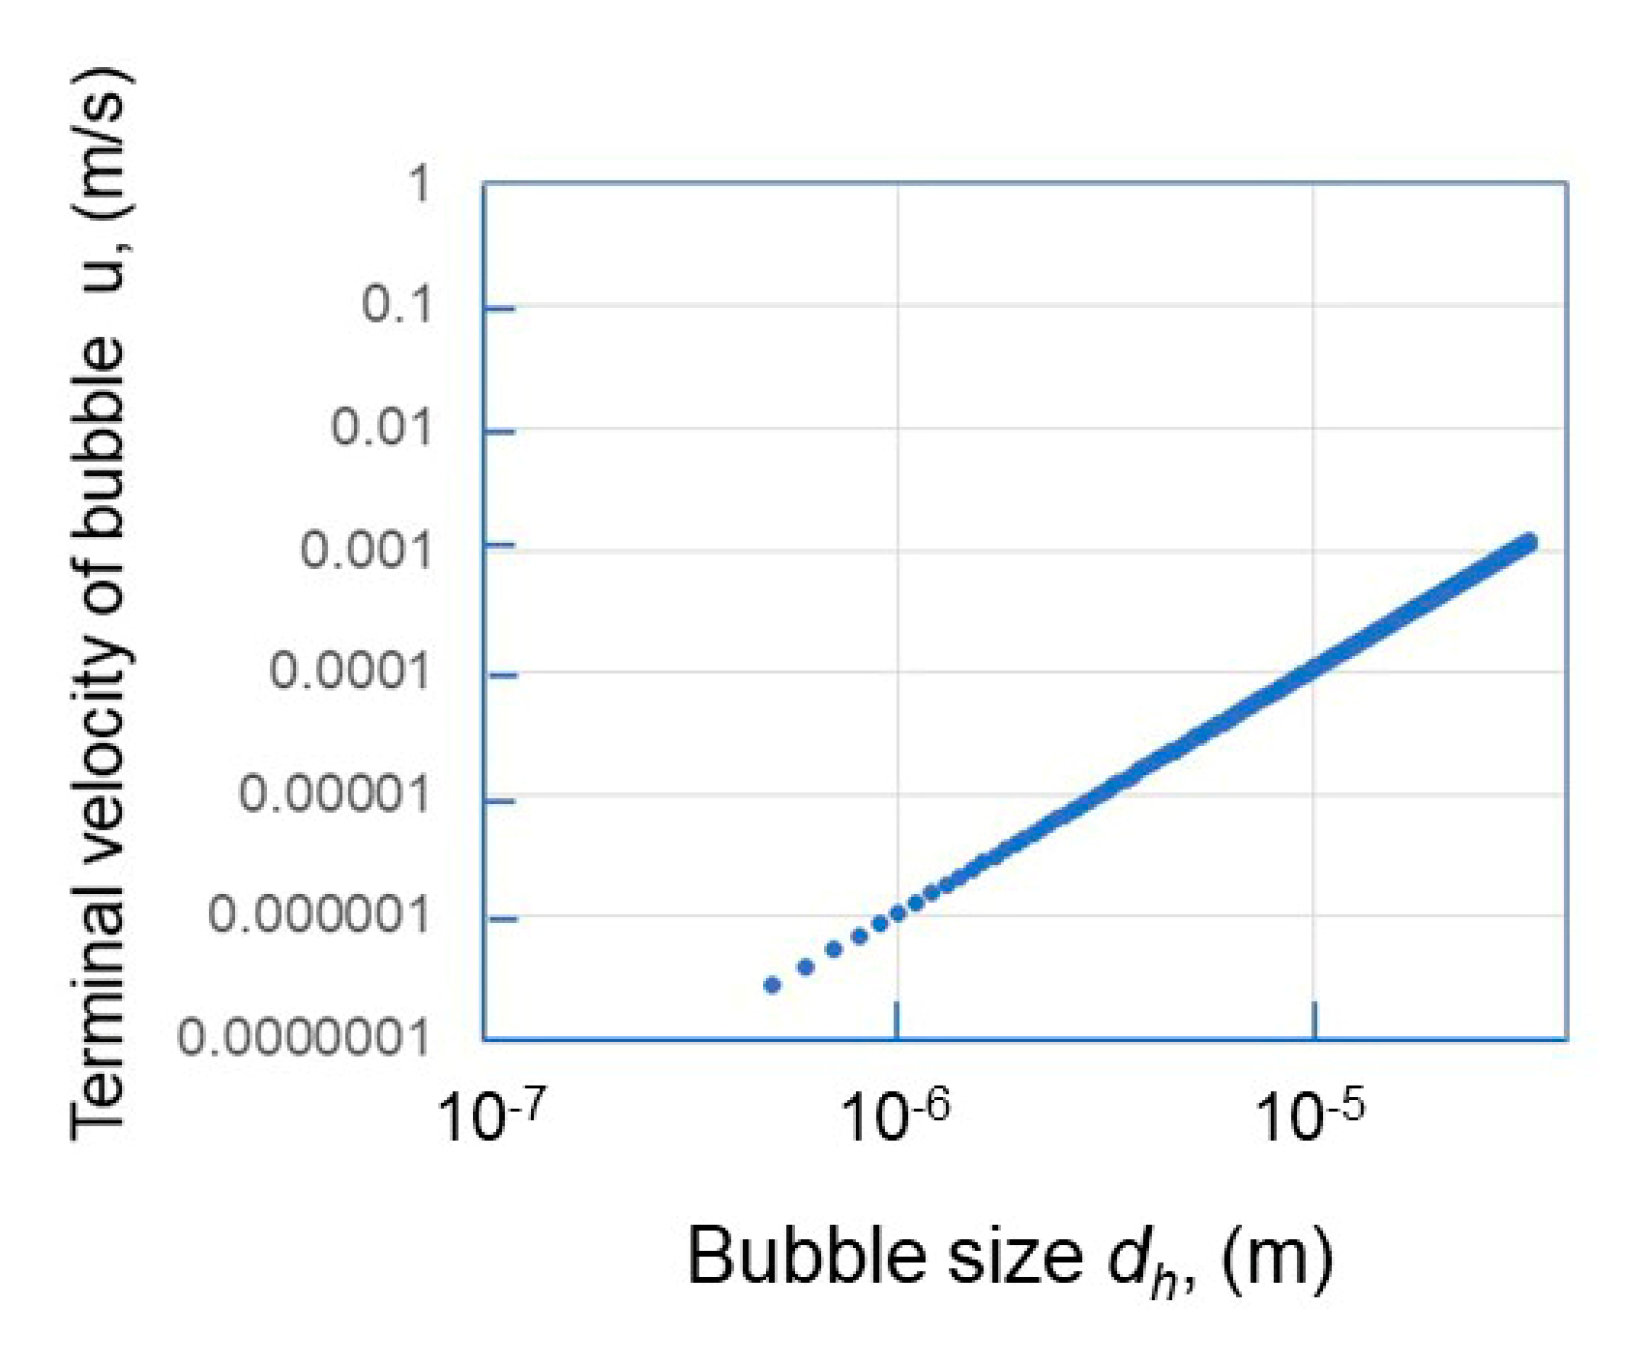
3.3.3. Nanobubble Movement in Salt Aqueous Solution
4. Conclusions
- The IEPs of different gas nanobubbles in deionized water varied, and the CO2 nanobubbles showed the highest value of pH at 5.7.
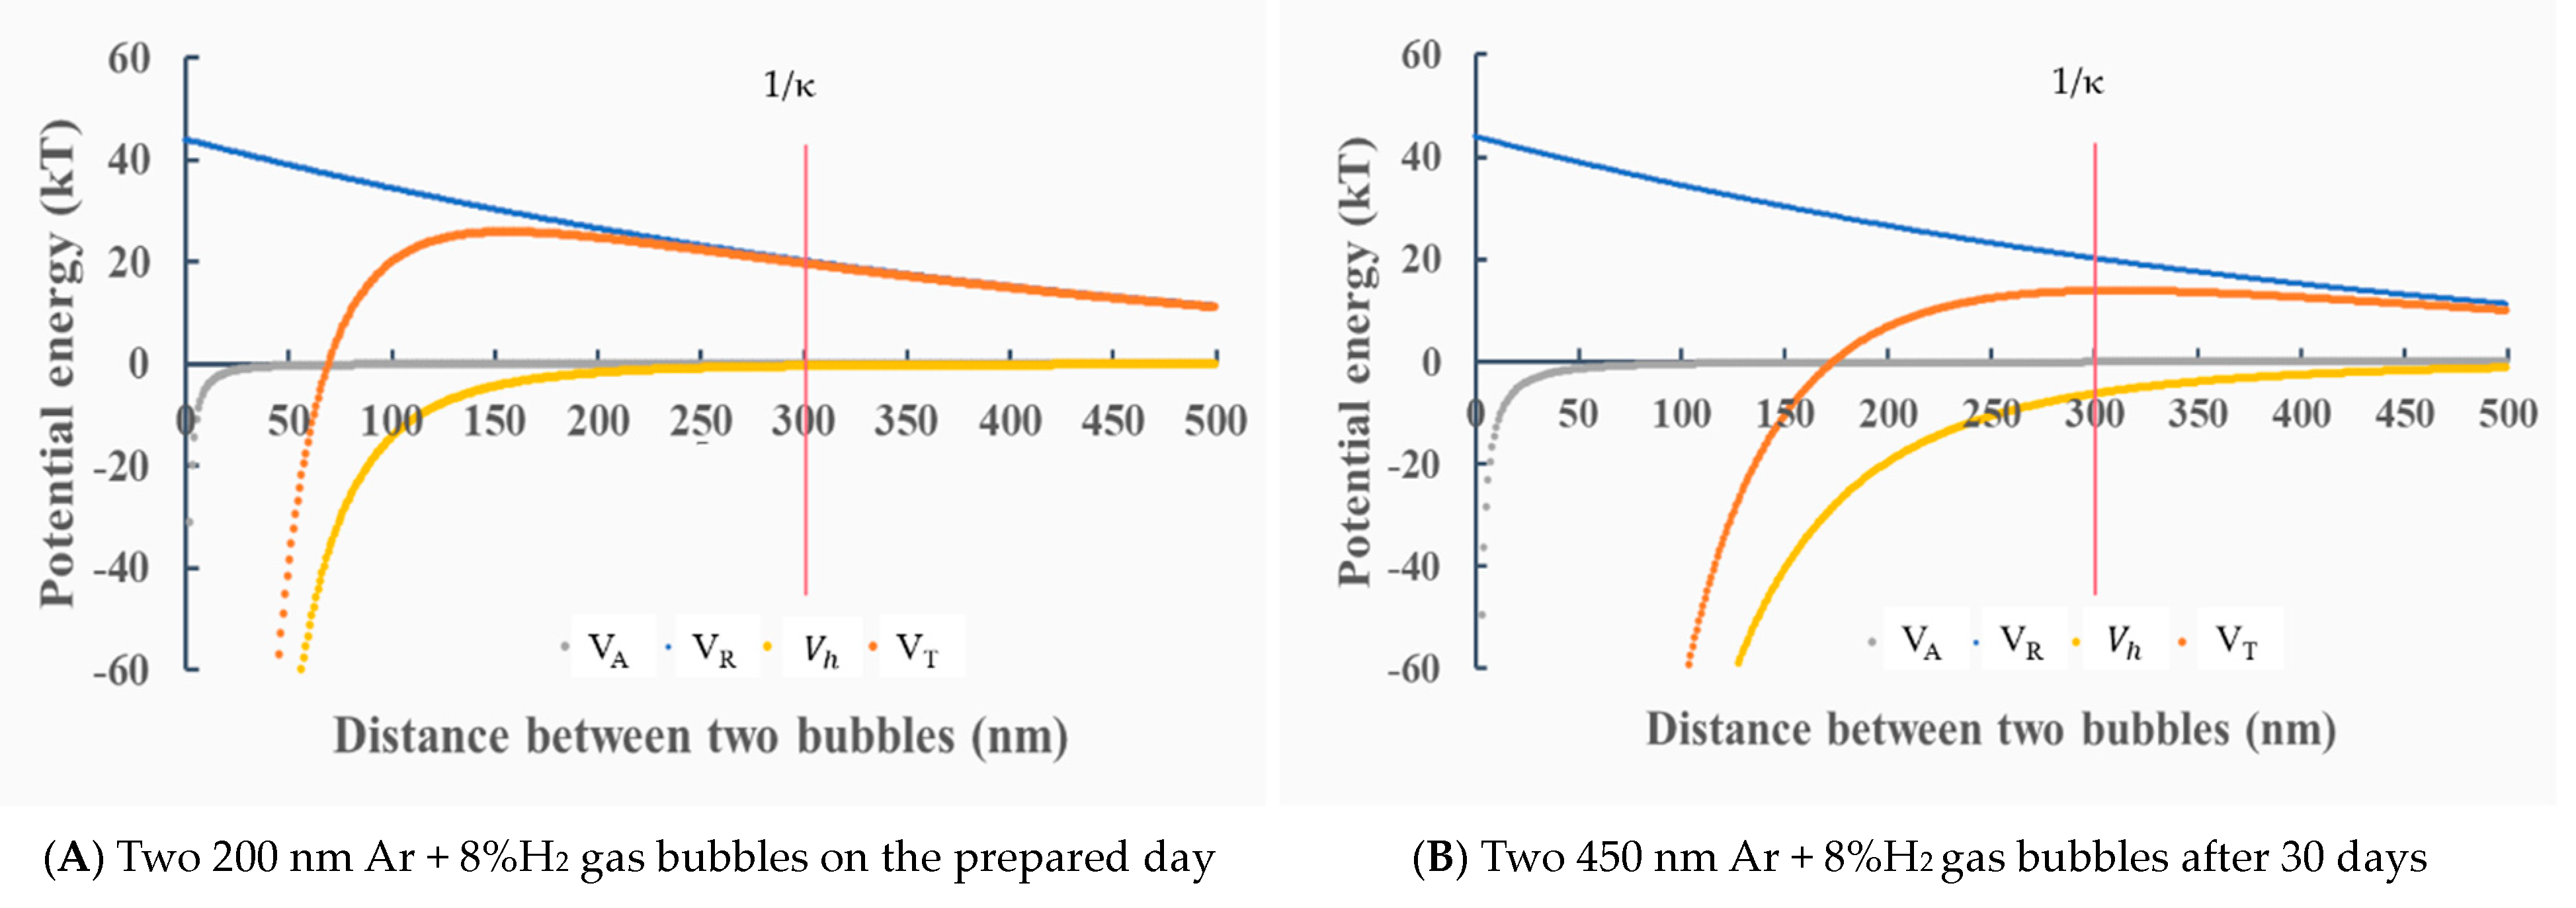
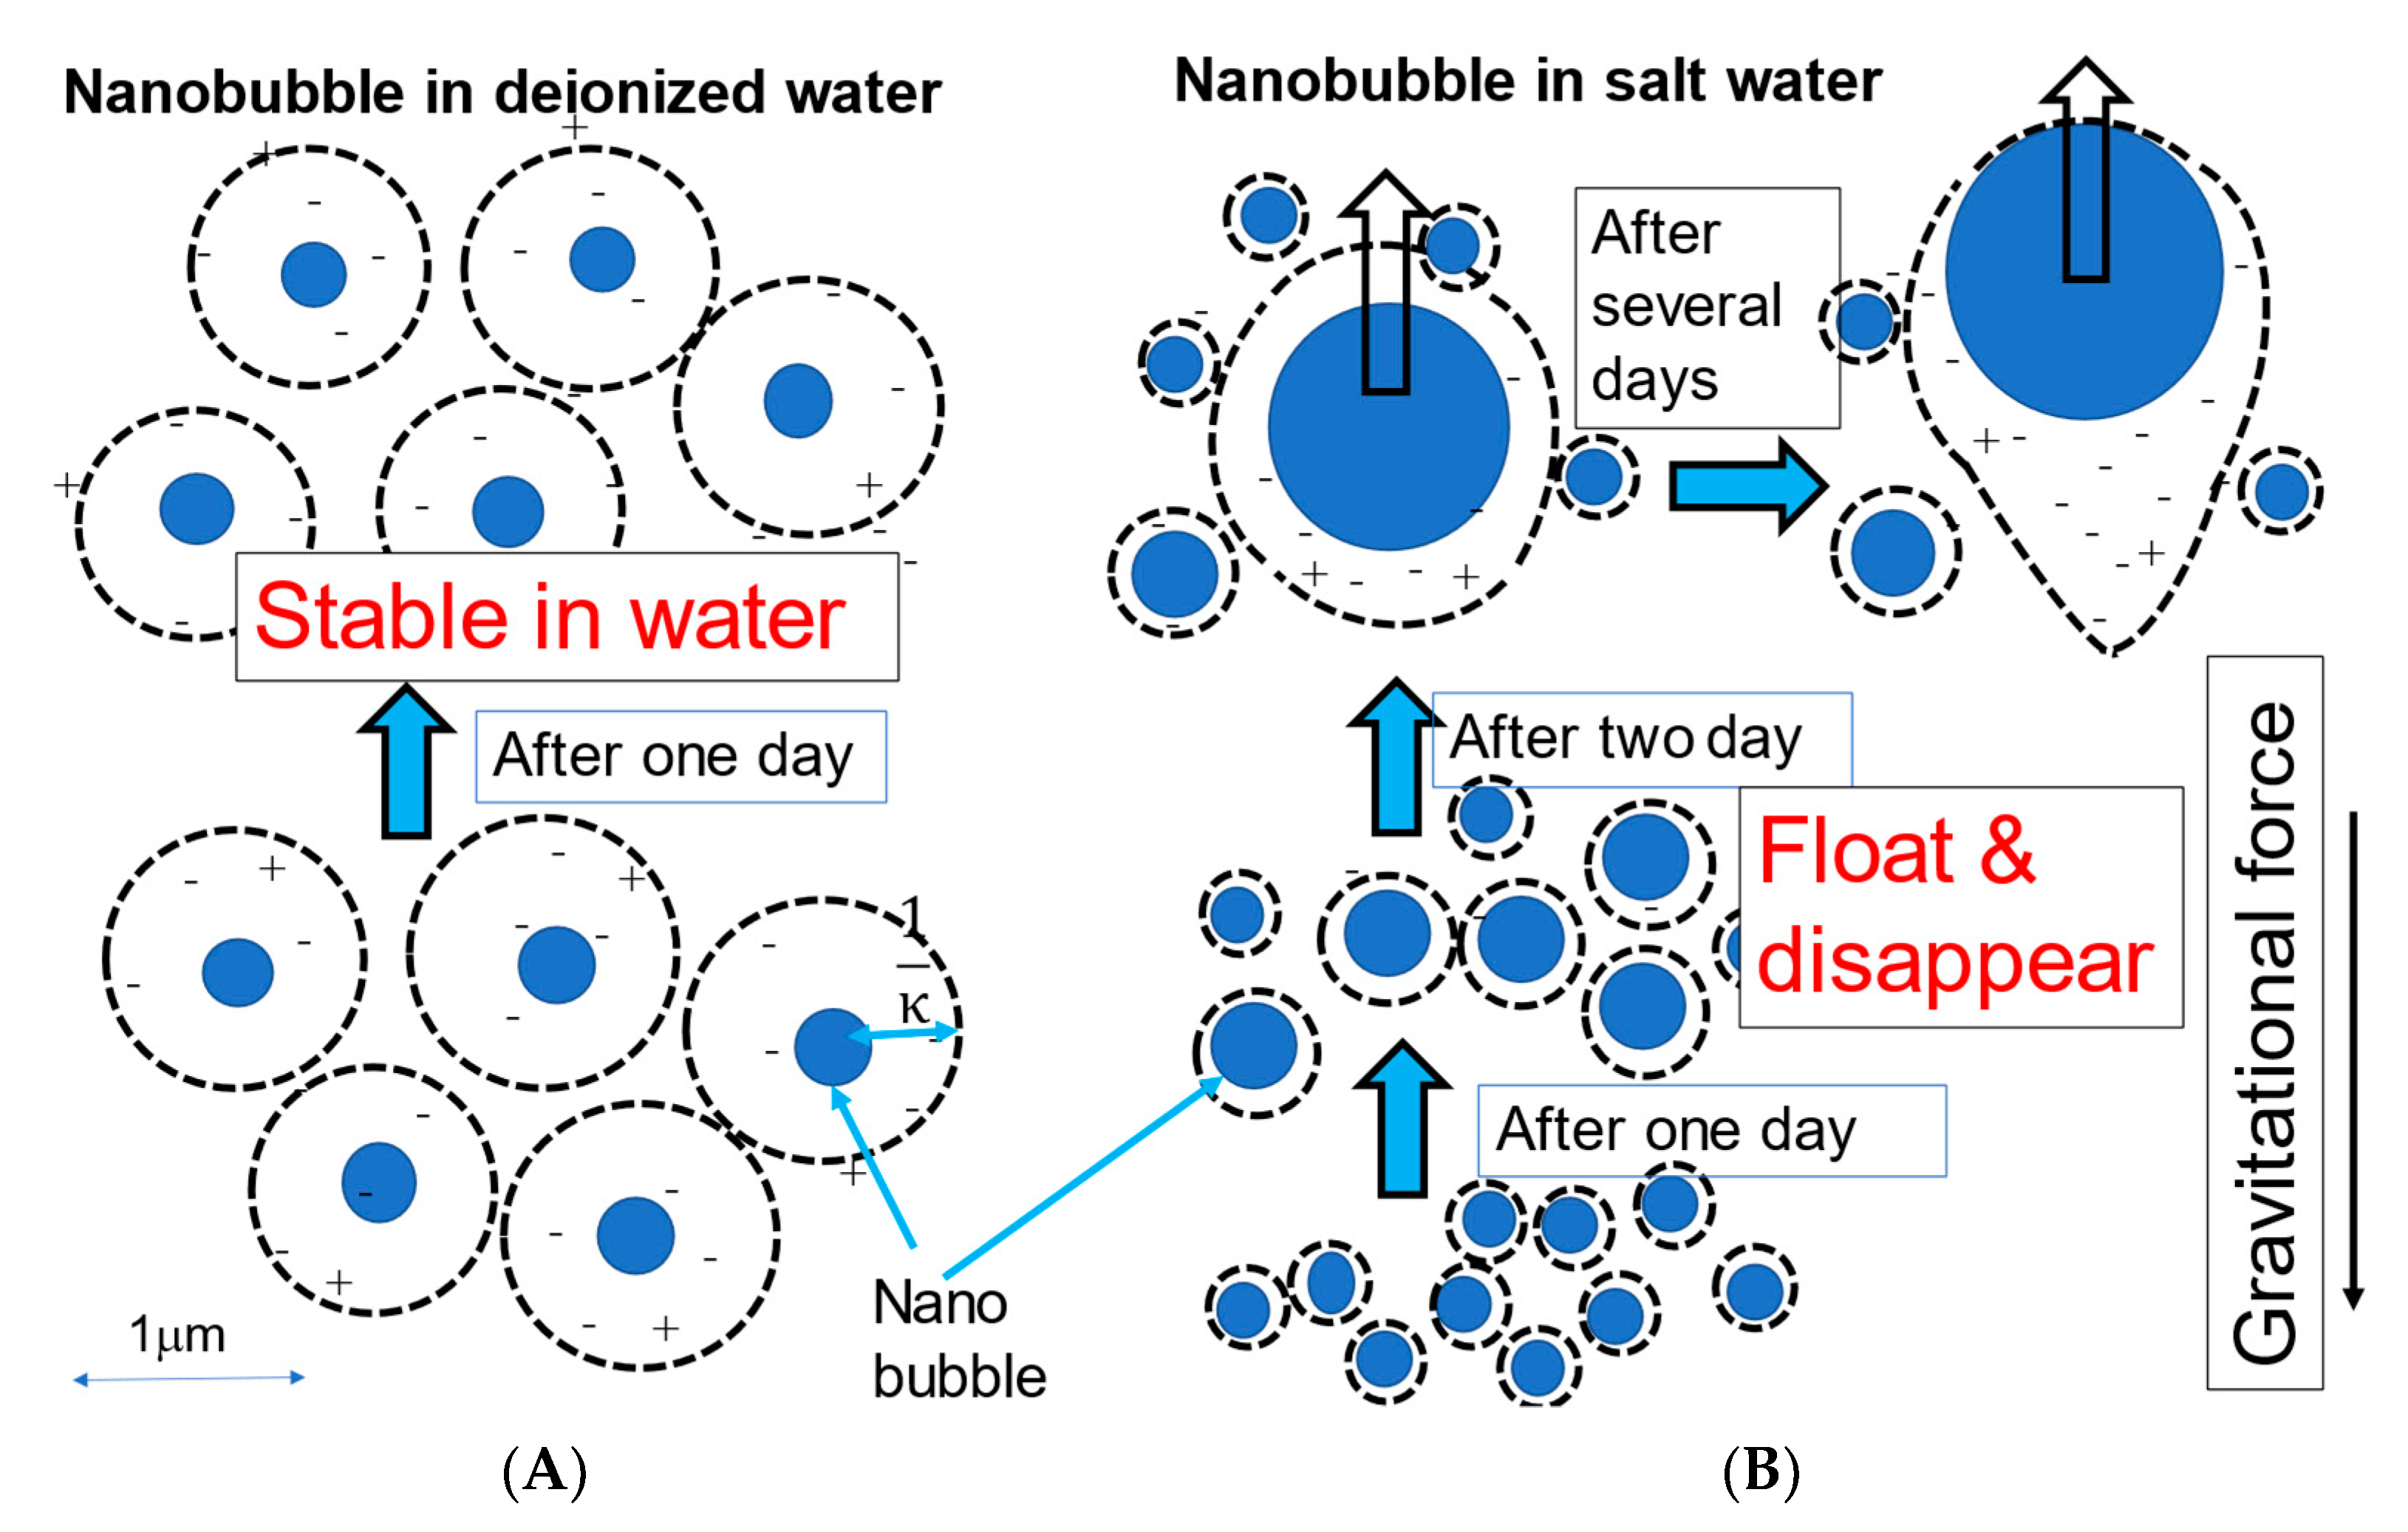
- The N2, O2, Ar + 8%H2 and air nanobubbles in deionized water showed the long-term stability for 60 days. During the 60 days, the bubble size gradually increased and decreased. Thus, this size change, explained by the Ostwald ripening effect, was also coupled with a bubble stability discussion using the total potential energy between two nanobubbles under different conditions calculated by the extended DLVO theory.
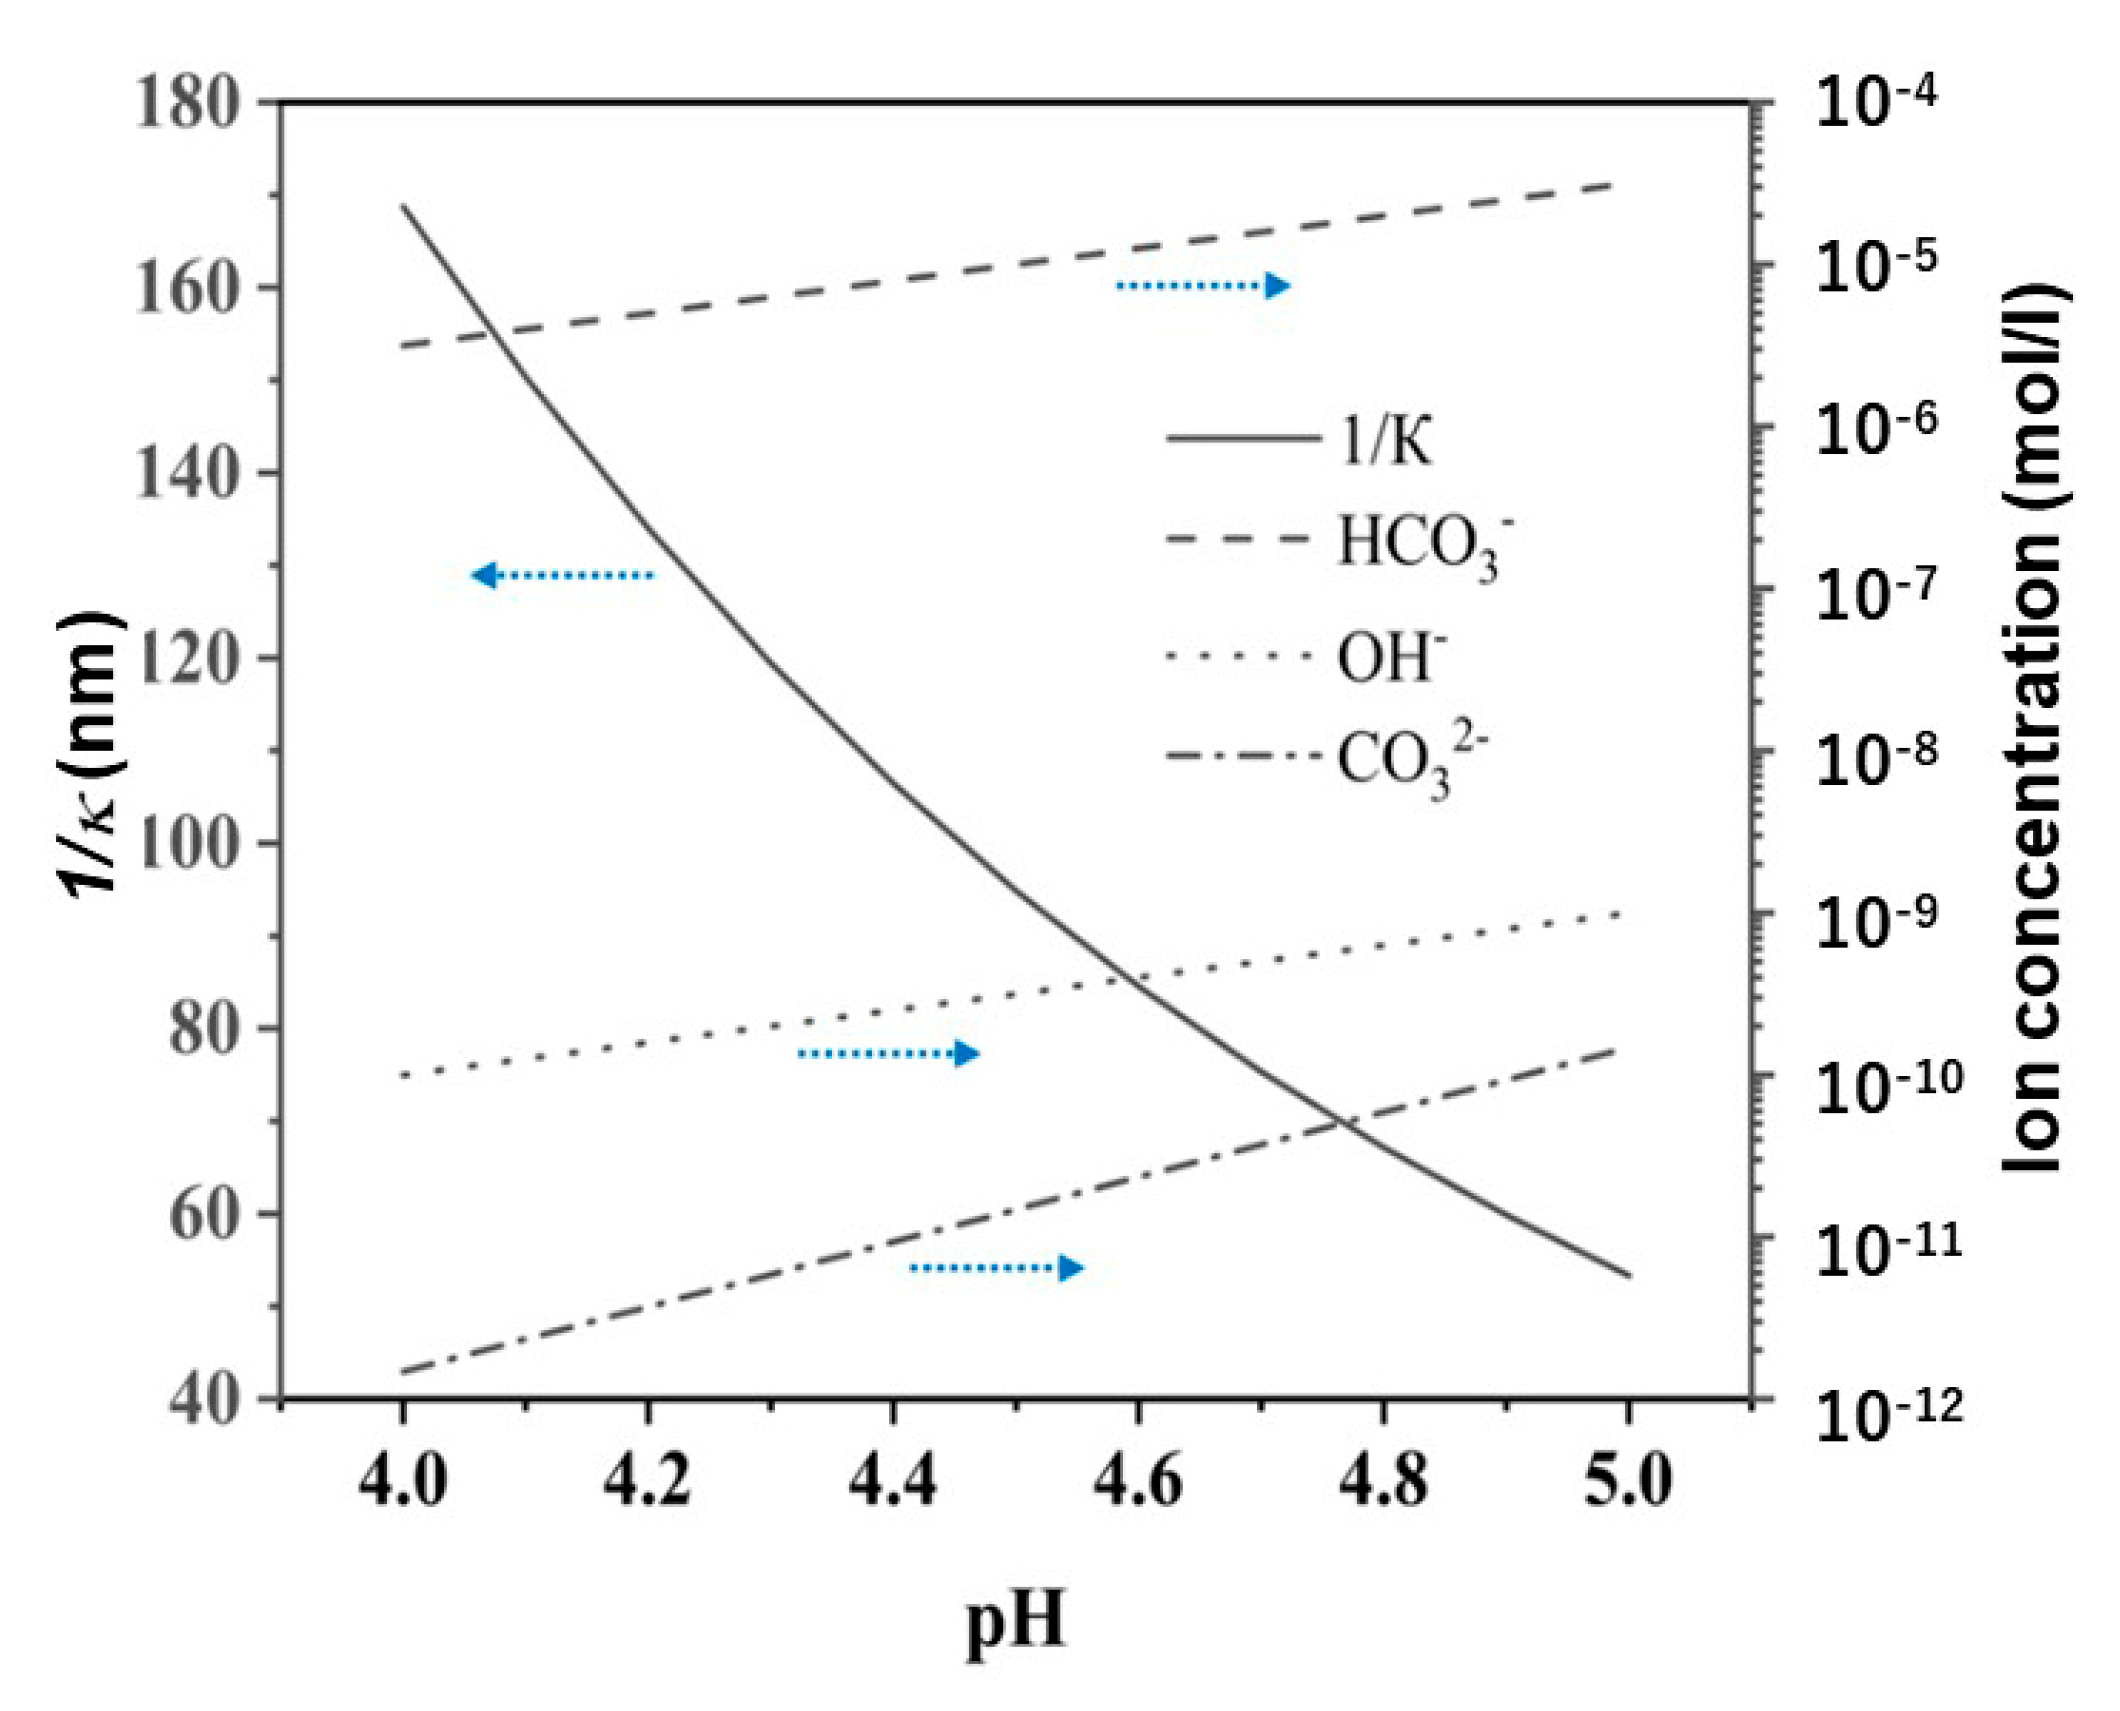
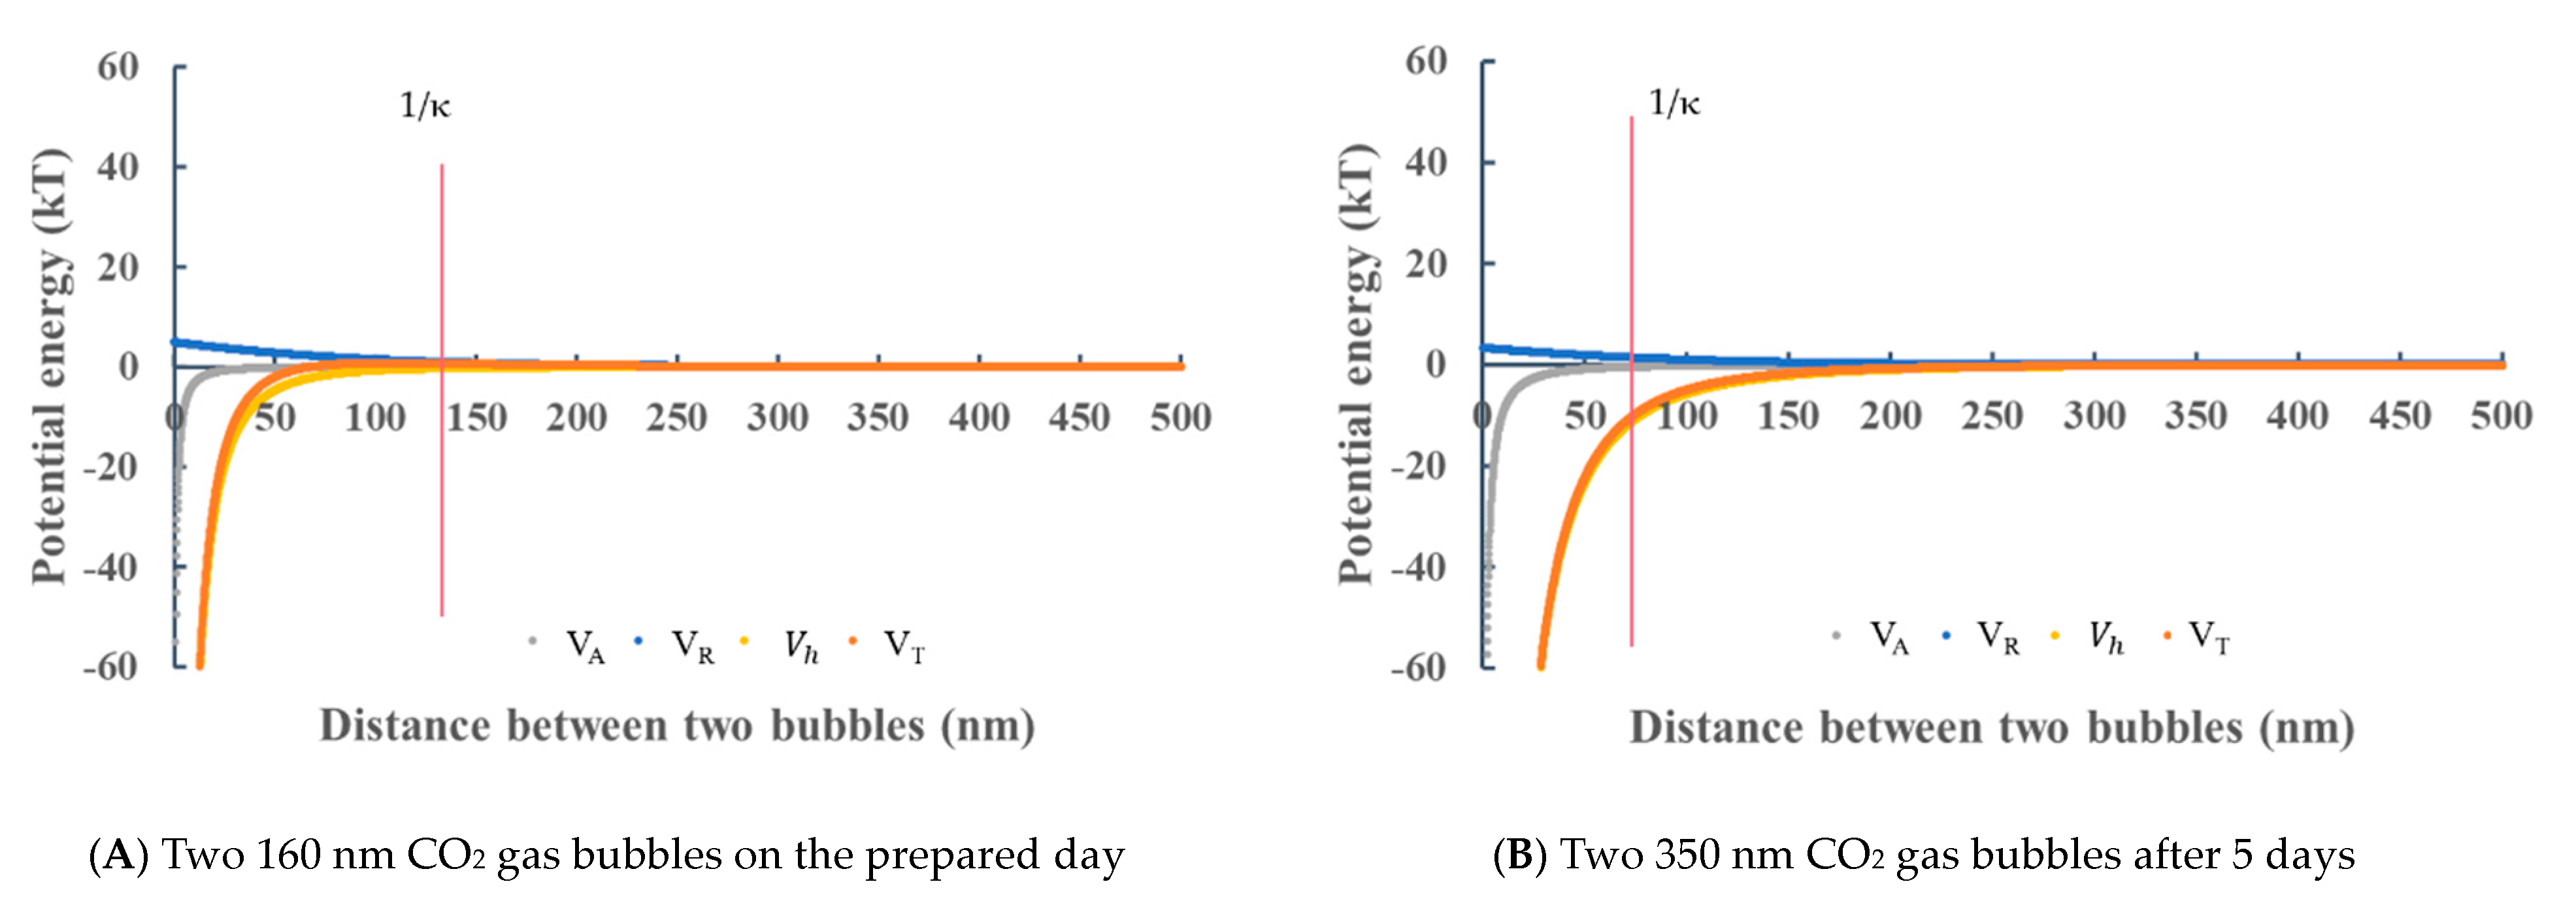
- The CO2 nanobubbles produced in deionized water were not stable and disappeared after five days. The CO2 nanobubbles in water dissolved the HCO3− ion, which could decrease the total potential energy between CO2 bubbles, and thus the CO2 nanobubbles became unstable.
- The N2, O2, Ar + 8%H2 and air nanobubbles produced in the 1 mM salt aqueous solution were not stable. The potential barrier between the nanobubbles disappeared, and the bubble size gradually increased with their coalescence, followed by floating and disappearing after 14 days for O2, Ar + 8%H2 and air nanobubbles, and 7 days for N2 nanobubbles. On the other hand, the CO2 nanobubbles in the 1 mM of NaCl and CaCl2 aqueous solution became more stable than the CO2 nanobubbles in deionized water, and a 200 to 300 nm mean bubble size was kept for two weeks.
- A bubble smaller than 1 μm can experience very low terminal velocity (<1 × 10⁻⁶ m/s) which prevents bubbles from floating against the buoyancy force.
Author Contributions
Funding
Institutional Review Board Statement
Informed Consent Statement
Data Availability Statement
Acknowledgments
Conflicts of Interest
Nomenclature
| a | Radius of nanobubble |
| a1 | Radius of nanobubble 1 |
| a2 | Radius of nanobubble 2 |
| A | Hamaker constant for the gas in water |
| C | Concentration |
| dh | Hydrodynamic diameter |
| DT | Diffusion coefficient |
| e | Electron charge |
| g | Gravitational acceleration |
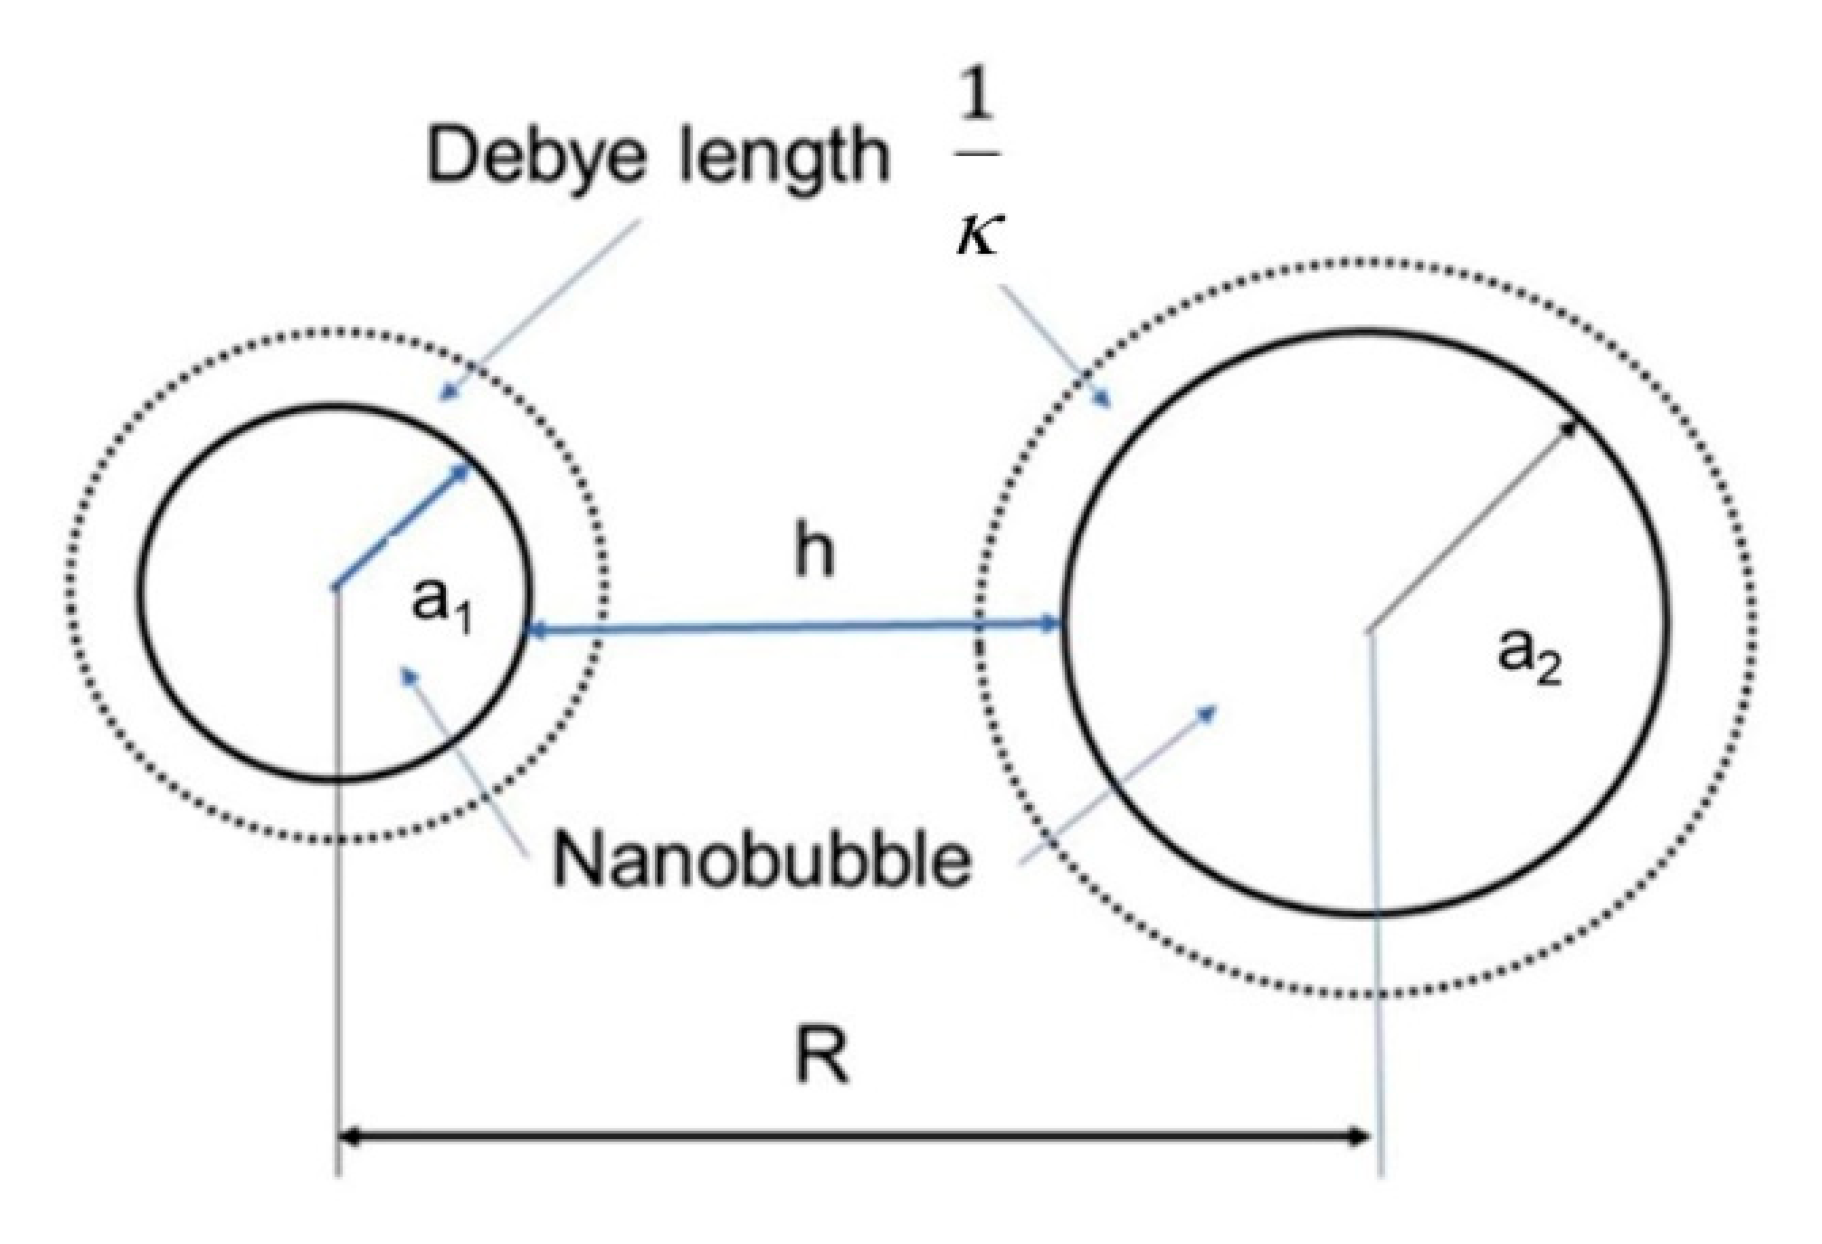
| h | surface-to-surface distance between two nanobubbles |
| k | Boltzmann constant |
| Ka1, Ka2 | Equilibrium constant |
| K | hydrophobic force constant for the gas in water |
| K′ | constant for Lemlich’s theory |
| n | Concentration of anion or cation in solution |
| NA | Avogadro number |
| ΔP | Laplace pressure difference |
| p | Instantaneous bubble mean radius |
| R | Distance between bubbles 1 and 2 |
| t | Time |
| T | Absolute temperature |
| u | Terminal velocity |
| VA | Van der Waals interaction potential energy |
| Vh | Hydrophobic force interaction potential energy |
| VR | Electrostatic interaction potential energy |
| VT | Total potential energy of interaction between two nanobubbles |
| x | Distance |
| z | Ionic valence |
| γ | Surface tension |
| ε | Electron charge |
| ε0 | Permittivity of vacuum |
| εr | Relative dielectric constant |
| Ψ1, Ψ2 | Surface potential of the nanobubbles of radius a1 and a2 |
| η | Viscosity |
| κ | Debye–Hückel parameter |
| ρ | Density of water |
| μ | Electrophoretic mobility |
| ζ | Zeta potential |
References
- Xiao, W.; Xu, G. Mass transfer of nanobubble aeration and its effect on biofilm growth: Microbial activity and structural properties. Sci. Total Environ. 2020, 703, 134976. [Google Scholar] [CrossRef] [PubMed]
- Ke, S.; Xiao, W.; Quan, N.; Dong, Y.; Zhang, L.; Hu, J. Formation and Stability of Bulk Nanobubbles in Different Solutions. Langmuir 2019, 35, 5250–5256. [Google Scholar] [CrossRef]
- Ulatowski, K.; Sobieszuk, P.; Mróz, A.; Ciach, T. Stability of nanobubbles generated in water using porous membrane system. Chem. Eng. Process. Process Intensif. 2019, 136, 62–71. [Google Scholar] [CrossRef]
- Michailidi, E.D.; Bomis, G.; Varoutoglou, A.; Kyzas, G.Z.; Mitrikas, G.; Mitropoulos, A.C.; Efthimiadou, E.K.; Favvas, E.P. Bulk nanobubbles: Production and investigation of their formation/stability mechanism. J. Colloid Interface Sci. 2020, 564, 371–380. [Google Scholar] [CrossRef] [PubMed]
- Kanematsu, W.; Tuziuti, T.; Yasui, K. The influence of storage conditions and container materials on the long term stability of bulk nanobubbles -Consideration from a perspective of interactions between bubbles and surroundings. Chem. Eng. Sci. 2020, 219, 115594. [Google Scholar] [CrossRef]
- Nirmalkar, N.; Pacek, A.W.; Barigou, M. On the Existence and Stability of Bulk Nanobubbles. Langmuir 2018, 34, 10964–10973. [Google Scholar] [CrossRef]
- Uchida, T.; Liu, S.; Enari, M.; Oshita, S.; Yamazaki, K.; Gohara, K. Effect of NaCl on the Lifetime of Micro- and Nanobubbles. Nanomaterials 2016, 6, 31. [Google Scholar] [CrossRef]
- Nirmalkar, N.; Pacek, A.W.; Barigou, M. Interpreting the interfacial and colloidal stability of bulk nanobubbles. Soft Matter 2018, 14, 9643–9656. [Google Scholar] [CrossRef] [PubMed] [Green Version]
- Meegoda, J.N.; Hewage, S.A.; Batagoda, J.H. Application of the diffused double layer theory to nanobubbles. Langmuir 2019, 39, 12100–12112. [Google Scholar] [CrossRef]
- Hewage, S.A.; Kewalramani, J.; Meegoda, J.N. Stability of nanobubbles in different salt solutions. Colloids Surf. A 2021, 609, 125669. [Google Scholar] [CrossRef]
- Fujita, T.; Kurokawa, H.; Han, Z.; Zhou, Y.; Matsui, H.; Ponou, J.; Dodbiba, G.; He, C.; Wei, Y. Free Radical Degradation in Aqueous Solution by BlowingHydrogen and Carbon Dioxyde Nanotubes. Sci. Rep. 2021, 11, 3068. [Google Scholar] [CrossRef] [PubMed]
- Kurokawa, H.; Ito, H.; Taninaka, A.; Shigekawa, H.; Dodbiba, G.; Wei, Y.; Fujita, T. Antioxidant Effect of Hydrogen Nanobubble Contributes to Suppression of Tumor Cell Growth. Biomed. J. Sci. Tech. Res. 2019, 19, 14592–14594. [Google Scholar]
- Temesgen, T.; Bui, T.T.; Han, M.; Kim, T.-I.; Park, H. Micro and nanobubble technologies as a new horizon for water-treatment techniques: A review. Adv. Colloid Interface Sci. 2017, 246, 40–51. [Google Scholar] [CrossRef]
- Wu, Y.; Lyu, T.; Yue, B.; Tonoli, E.; Verderio, E.A.M.; Ma, Y.; Pan, G. Enhancement of Tomato Plant Growth and Productivity in Organic Farming by Agri-Nanotechnology Using Nanobubble Oxygation. J. Agric. Food Chem. 2019, 67, 10823–10831. [Google Scholar] [CrossRef] [Green Version]
- Ghadimkhani, A.; Zhang, W.; Marhaba, T. Ceramic membrane defouling (cleaning) by air Nano Bubbles. Chemosphere 2016, 146, 379–384. [Google Scholar] [CrossRef] [PubMed]
- Zhu, J.; An, H.; Alheshibri, M.; Liu, L.; Terpstra, P.M.; Liu, G.; Craig, V.S. Cleaning with Bulk Nanobubbles. Langmuir 2016, 32, 11203–11211. [Google Scholar] [CrossRef] [PubMed]
- Dayarathne, H.N.P.; Jeong, S.; Jang, A. Chemical-free scale inhibition method for seawater reverse osmosis membrane process: Air micro-nano bubbles. Desalination 2019, 461, 1–9. [Google Scholar] [CrossRef]
- Atkinson, A.J.; Apul, O.G.; Schneider, O.; Garcia-Segura, S.; Westerhoff, P. Nanobubble Technologies Offer Opportunities to Improve Water Treatment. Acc. Chem. Res. 2019, 52, 1196–1205. [Google Scholar] [CrossRef]
- Azevedo, A.; Oliveira, H.A.; Rubio, J. Treatment and water reuse of lead-zinc sulphide ore mill wastewaters by high rate dissolved air flotation. Miner. Eng. 2018, 127, 114–121. [Google Scholar] [CrossRef]
- Kyzas, G.Z.; Bomis, G.; Kosheleva, R.I.; Efthimiadou, E.K.; Favvas, E.P.; Kostoglou, M.; Mitropoulos, A.C. Nanobubbles effect on heavy metal ions adsorption by activated carbon. Chem. Eng. J. 2019, 356, 91–97. [Google Scholar] [CrossRef]
- Lyu, T.; Wu, S.; Mortimer, R.J.G.; Pan, G. Nanobubble Technology in Environmental Engineering: Revolutionization Potential and Challenges. Environ. Sci. Technol. 2019, 53, 7175–7176. [Google Scholar] [CrossRef] [Green Version]
- Agarwal, A.; Ng, W.J.; Liu, Y. Principle and applications of microbubble and nanobubble technology for water treatment. Chemosphere 2011, 84, 1175–1180. [Google Scholar] [CrossRef]
- Hernandez, C.; Abenojar, E.C.; Hadley, J.; de Leon, A.C.; Coyne, R.; Perera, R.; Gopalakrishnan, R.; Basilion, J.P.; Kolios, M.C.; Exner, A.A. Sink or float? Characterization of shell-stabilized bulk nanobubbles using a resonant mass measurement technique. Nanoscale 2019, 11, 851–855. [Google Scholar] [CrossRef] [Green Version]
- Azevedo, A.; Etchepare, R.; Calgaroto, S.; Rubio, J. Aqueous dispersions of nanobubbles: Generation, properties and features. Miner. Eng. 2016, 94, 29–37. [Google Scholar] [CrossRef]
- Etchepare, R.; Azevedo, A.; Calgaroto, S.; Rubio, J. Removal of ferric hydroxide by flotation with micro and nanobubbles. Sep. Purif. Technol. 2017, 184, 347–353. [Google Scholar] [CrossRef]
- Yang, X.; Nie, J.; Wang, D.; Zhao, Z.; Kobayashi, M.; Adachi, Y.; Shimizu, K.; Lei, Z.; Zhang, Z. Enhanced hydrolysis of waste activated sludge for methane production via anaerobic digestion under N2-nanobubble water addition. Sci. Total Environ. 2019, 693, 133524. [Google Scholar] [CrossRef]
- Wang, X.; Lei, Z.; Shimizu, K.; Zhang, Z.; Lee, D.J. Improved methane production from corn straw using anaerobically digested sludge pre-augmented by nanobubble water. Bioresour. Technol. 2020, 311, 123479. [Google Scholar] [CrossRef] [PubMed]
- Phan, K.K.T.; Truong, T.; Wang, Y.; Bhandari, B. Nanobubbles: Fundamental characteristics and applications in food processing. Trends Food Sci. Technol. 2020, 95, 118–130. [Google Scholar] [CrossRef]
- Phan, K.K.T.; Truong, T.; Wang, Y.; Bhandari, B. Formation and Stability of Carbon Dioxide Nanobubbles for Potential Applications in Food Processing. Food Eng. Rev. 2020. [Google Scholar] [CrossRef]
- Kim, H.J.; Choi, H.; Choi, H.; Lee, B.; Lee, D.; Lee, D.E. Study on Physical Properties of Mortar for Section Restoration Using Calcium Nitrite and CO2 Nano-Bubble Water. Materials 2020, 13, 3897. [Google Scholar] [CrossRef] [PubMed]
- Kim, J.; Kitagaki, R.; Choi, H. Pore Filling Effect of Forced Carbonation Reactions Using Carbon Dioxide Nanobubbles. Materials 2020, 13, 4343. [Google Scholar] [CrossRef]
- Oh, S.H.; Yoon, S.H.; Song, H.; Han, J.G.; Kim, J.-M. Effect of hydrogen nanobubble addition on combustion characteristics of gasoline engine. Int. J. Hydrog. Energy 2013, 38, 14849–14853. [Google Scholar] [CrossRef]
- Wang, X.; Yuan, T.; Lei, Z.; Kobayashi, M.; Adachi, Y.; Shimizua, K.; Lee, D.J.; Zhang, Z. Supplementation of O-2-containing gas nanobubble water to enhance methane production from anaerobic digestion of cellulose. Chem. Eng. J. 2020, 398, 125652. [Google Scholar] [CrossRef]
- Trefalt, G.; Szilagyi, I.; Téllez, G.; Borkovec, M. Colloidal Stability in Asymmetric Electrolytes: Modifications of the Schulze-Hardy Rule. Langmuir 2017, 33, 1695–1704. [Google Scholar] [CrossRef]
- Reeks, M.W. Stokes-Einstein Equation; Begell House: Danbury, CT, USA, 2011. [Google Scholar]
- Oshima, H. Developments in Theories of Electrokinetic Phenomena: From Smoluchowski to ELKIN. Oleoscience 2013, 13, 3–9. [Google Scholar]
- Lide, D.R. Handbook of Chemistry and Pysics, 101st ed.; CRC Press: Boca Raton, FL, USA, 2020. [Google Scholar]
- Welch, M.J.; Lipton, J.F.; Seck, J.A. Tracer studies with radioactive oxygen-15. Exchange between carbon dioxide and water. J. Phys. Chem. 1969, 73, 351–3356. [Google Scholar] [CrossRef]
- Ushikubo, F.Y.; Enari, M.; Furukawa, T.; Nakagawa, R.; Makino, Y.; Kaeagoe, Y.; Oshita, S. Zeta-potential of Micro- and/or Nano-bubbles in Water Produced by some kinds of Gases. IFAC Proc. 2010, 43, 283–288. [Google Scholar] [CrossRef]
- Leroy, P.; Dougnot, D.; Revil, A.; Lassin, A.; Azaroual, M. A double layer model of the gas bubble/water interface. J. Colloid Interface Sci. 2012, 388, 243–256. [Google Scholar] [CrossRef]
- Yang, C.; Dabros, T.; Li, D.; Czarnecki, J.; Masliyah, J.H. Measurement of the zeta potential of gas bubble in aqueous solutions by micro electrophoresis method. J. Colloid Interface Sci. 2001, 243, 128–135. [Google Scholar] [CrossRef]
- Cho, S.-H.; Kim, J.-Y.; Chun, J.-H.; Kim, J.-D. Ultrasonic formation of nanobubbles and their zeta-potentials in aqueous electrolyte and surfactant solutions, Colloids and Surfaces A: Physicochem. Eng. Asp. 2005, 269, 28–34. [Google Scholar] [CrossRef]
- Han, M.Y.; Kim, M.K.; Shin, M.S. Generation of a positively charged bubble and its possiblemechanism of formation. J. Water Supply Res. Technol. AQUA 2006, 55, 471–478. [Google Scholar] [CrossRef]
- Tchaliovska, S.; Manev, E.; Radoev, B.; Eriksson, J.C.; Claesson, P.M. Interactions in equiribrium free films of aqueous dodecyl ammonium chloride solutions. J. Colloid Interface Sci. 1994, 168, 190–1944. [Google Scholar] [CrossRef]
- Angarska, J.K.; Dimitrova, B.S.; Danov, K.D.; Kralchevsky, P.A.; Ananthapadmanabhan, K.P.; Lips, A. Detection of the hydrophobic surface force in foam films by measurements of the critical thickness of the film rupture. Langmuir 2004, 20, 1799–1806. [Google Scholar] [CrossRef]
- Israelachivili, J.N. Intermolecular and Surface Forces with Applications to Colloidal and Biological Systems; Academic Press Limited: London, UK, 1985. [Google Scholar]
- Usui, S.; Sasaki, H. Dispersion and Coagulation of Fine Particles―Fundamentals and applications. J. Shigen Sozai 1991, 107, 585–591. [Google Scholar] [CrossRef]
- Fujita, T.; Ito, R.; Tokoro, C.; Sadaki, J.; Dodbiba, G.; Tsukamoto, R.; Okuda, H.; Yamane, H. Classification of submicron Ni particles by heterocoagulation. Powder Technol. 2007, 173, 19–28. [Google Scholar] [CrossRef]
- Yoon, R.H.; Aksoy, B.S. Hydrophobic forces in thin water films stabilized by dodecyl ammonium chloride. J. Colloid Interface Sci. 1999, 211, 1–10. [Google Scholar] [CrossRef] [PubMed]
- Wang, L.; Yoon, R.H. hydrophobic forces n the foam films stabilized by sodium dodecyl sulfate: Effect of electrolyte. Langmuir 2004, 20, 11457–11464. [Google Scholar] [CrossRef]
- Zheng, X.; Jang, J. Hydraulic properties of porous media saturated with nanoparticle-stabilized air-water foam. Sustainability 2016, 8, 1317. [Google Scholar] [CrossRef] [Green Version]
- Lemilich, R. Prediction of changes in bubble size distribution due to interbubble gas distribution due to interbubble gas diffusion in form. Ind. Eng. Chem. Fundam. 1978, 17, 89–93. [Google Scholar] [CrossRef]
- Huang, Z.; Su, M.; Yang, Q.; Li, Z.; Chen, S.; Li, Y.; Zhou, X.; Li, F.; Song, Y. A general patterning approach by manipulating the evolution of two-dimensional liquid foams. Nat. Commun. 2017, 8, 14110. [Google Scholar] [CrossRef] [Green Version]
- Otsuki, A.; Bryant, G. Characterization of the interactions within fine particle mixtures in highly concentrated suspensions for advanced particle processing. Adv. Colloid Interface Sci. 2015, 226, 37–43. [Google Scholar] [CrossRef] [PubMed]
- Derjaguin, B.W.; Dukhin, S.S. Theory of flotation of small and medium size particles. Trans. Inst. Min. Metall. 1960, 70, 221–246. [Google Scholar] [CrossRef]


| Gas | Solubility of Gas in 298.15 K mol gas/mol H2O | Dielectric Constant of Gas (Average) | Isoelectric Point (pH) |
|---|---|---|---|
| H2 | 1.455 × 10⁻⁵ | 1.0002532 | |
| O2 | 2.748 × 10⁻⁵ | 1.0004941 | 4.7 |
| 8%H2 + Ar | 1.0005247 | 4.6 | |
| Air | 1.0005359 | 4.2 | |
| Ar | 2.748 × 10⁻⁵ | 1.0005360 | |
| N2 | 1.274 × 10⁻⁵ | 1.0005474 | 5.2 |
| CO2 | 7.07 × 10⁻⁴ | 1.0009217 | 5.7 |
| DI Water | 1 mM NaCl | 1 mM CaCl2 | 1 mM AlCl3 | |
|---|---|---|---|---|
| Air | More than 60 | 7 | 14 | 14 |
| N2 | More than 60 | 7 | 14 | 7 |
| O2 | More than 60 | 14 | 7 | 7 |
| Ar + 8%H2 | More than 60 | 14 | 14 | 14 |
| CO2 | 5 | 14 | 14 | 14 |
| DI Water | 1 mM NaCl | 1 mM CaCl2 | 1 mM AlCl3 | |
|---|---|---|---|---|
| N2 | 300 (pH 6) | 10 | 5 | 3 |
| O2 | 300 (pH 6) | 10 | 5 | 3 |
| Ar + 8%H2 | 300 (pH 6) | 10 | 5 | 3 |
| CO2 | 140 (pH 4.2) 70 (pH 4.7) | 10 | 5 | 3 |
Publisher’s Note: MDPI stays neutral with regard to jurisdictional claims in published maps and institutional affiliations. |
© 2021 by the authors. Licensee MDPI, Basel, Switzerland. This article is an open access article distributed under the terms and conditions of the Creative Commons Attribution (CC BY) license (https://creativecommons.org/licenses/by/4.0/).
Share and Cite
Zhou, Y.; Han, Z.; He, C.; Feng, Q.; Wang, K.; Wang, Y.; Luo, N.; Dodbiba, G.; Wei, Y.; Otsuki, A.; et al. Long-Term Stability of Different Kinds of Gas Nanobubbles in Deionized and Salt Water. Materials 2021, 14, 1808. https://0-doi-org.brum.beds.ac.uk/10.3390/ma14071808
Zhou Y, Han Z, He C, Feng Q, Wang K, Wang Y, Luo N, Dodbiba G, Wei Y, Otsuki A, et al. Long-Term Stability of Different Kinds of Gas Nanobubbles in Deionized and Salt Water. Materials. 2021; 14(7):1808. https://0-doi-org.brum.beds.ac.uk/10.3390/ma14071808
Chicago/Turabian StyleZhou, Yali, Zhenyao Han, Chunlin He, Qin Feng, Kaituo Wang, Youbin Wang, Nengneng Luo, Gjergj Dodbiba, Yuezhou Wei, Akira Otsuki, and et al. 2021. "Long-Term Stability of Different Kinds of Gas Nanobubbles in Deionized and Salt Water" Materials 14, no. 7: 1808. https://0-doi-org.brum.beds.ac.uk/10.3390/ma14071808