
A New Method of Predicting the Structural and Mechanical Change of Materials during Extrusion by the Method of Multiple Plastic Deformations

 , ,
, ,  and
and
Abstract
:1. Introduction
1.1. Properties of Materials Prepared by SPD
1.2. Equal Channel Angular Pressing
1.3. Motivation of the Study
2. Materials and Methods
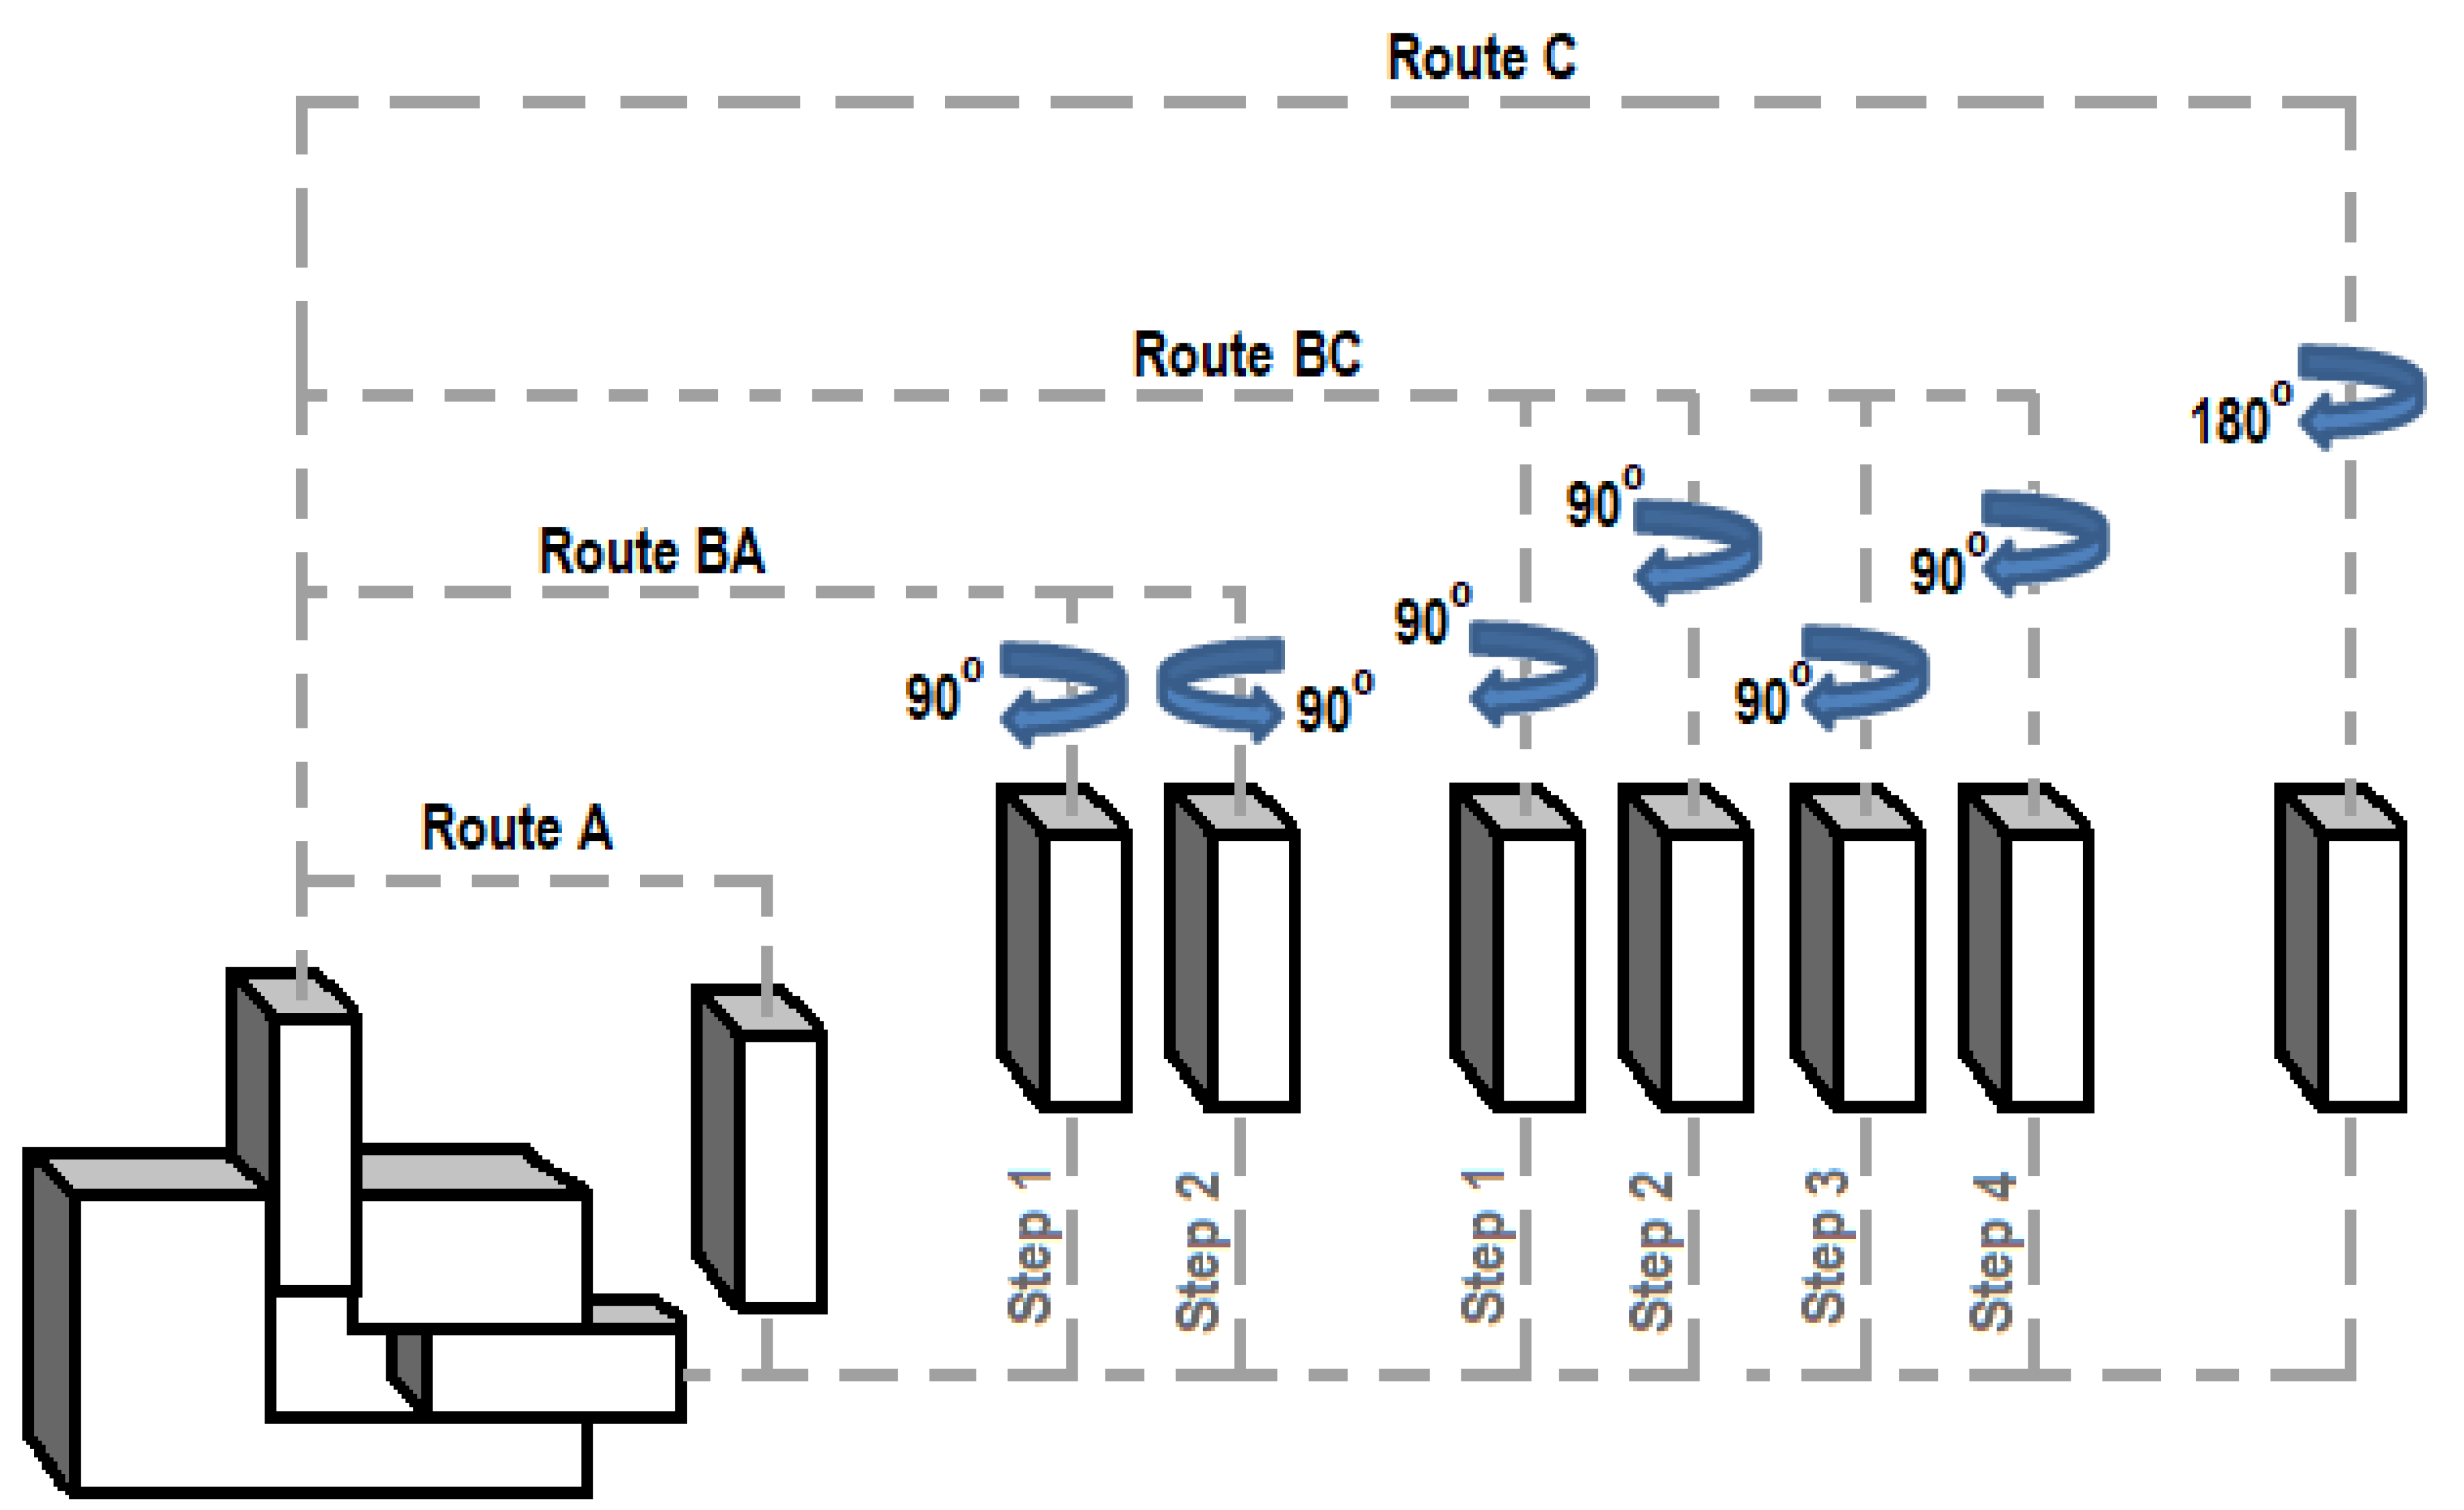
2.1. Experimental Procedures
- Route A: the sample is repeatedly compressed without rotation;
- Route BA: the sample is rotated 90° in an alternative direction between each pass;
- Route BC: the sample rotates 90° in the same direction;
- Route C: the sample rotates 180° between each pass.
- Young’s modulus of elasticity Emat = 84,500 MPa;
- Yield strength Re = 110 MPa;
- Strength limit Rm = 216 MPa;
- Failure limit Rfr = 90 MPa;
- Density ρ = 8653 kg∙m−3;
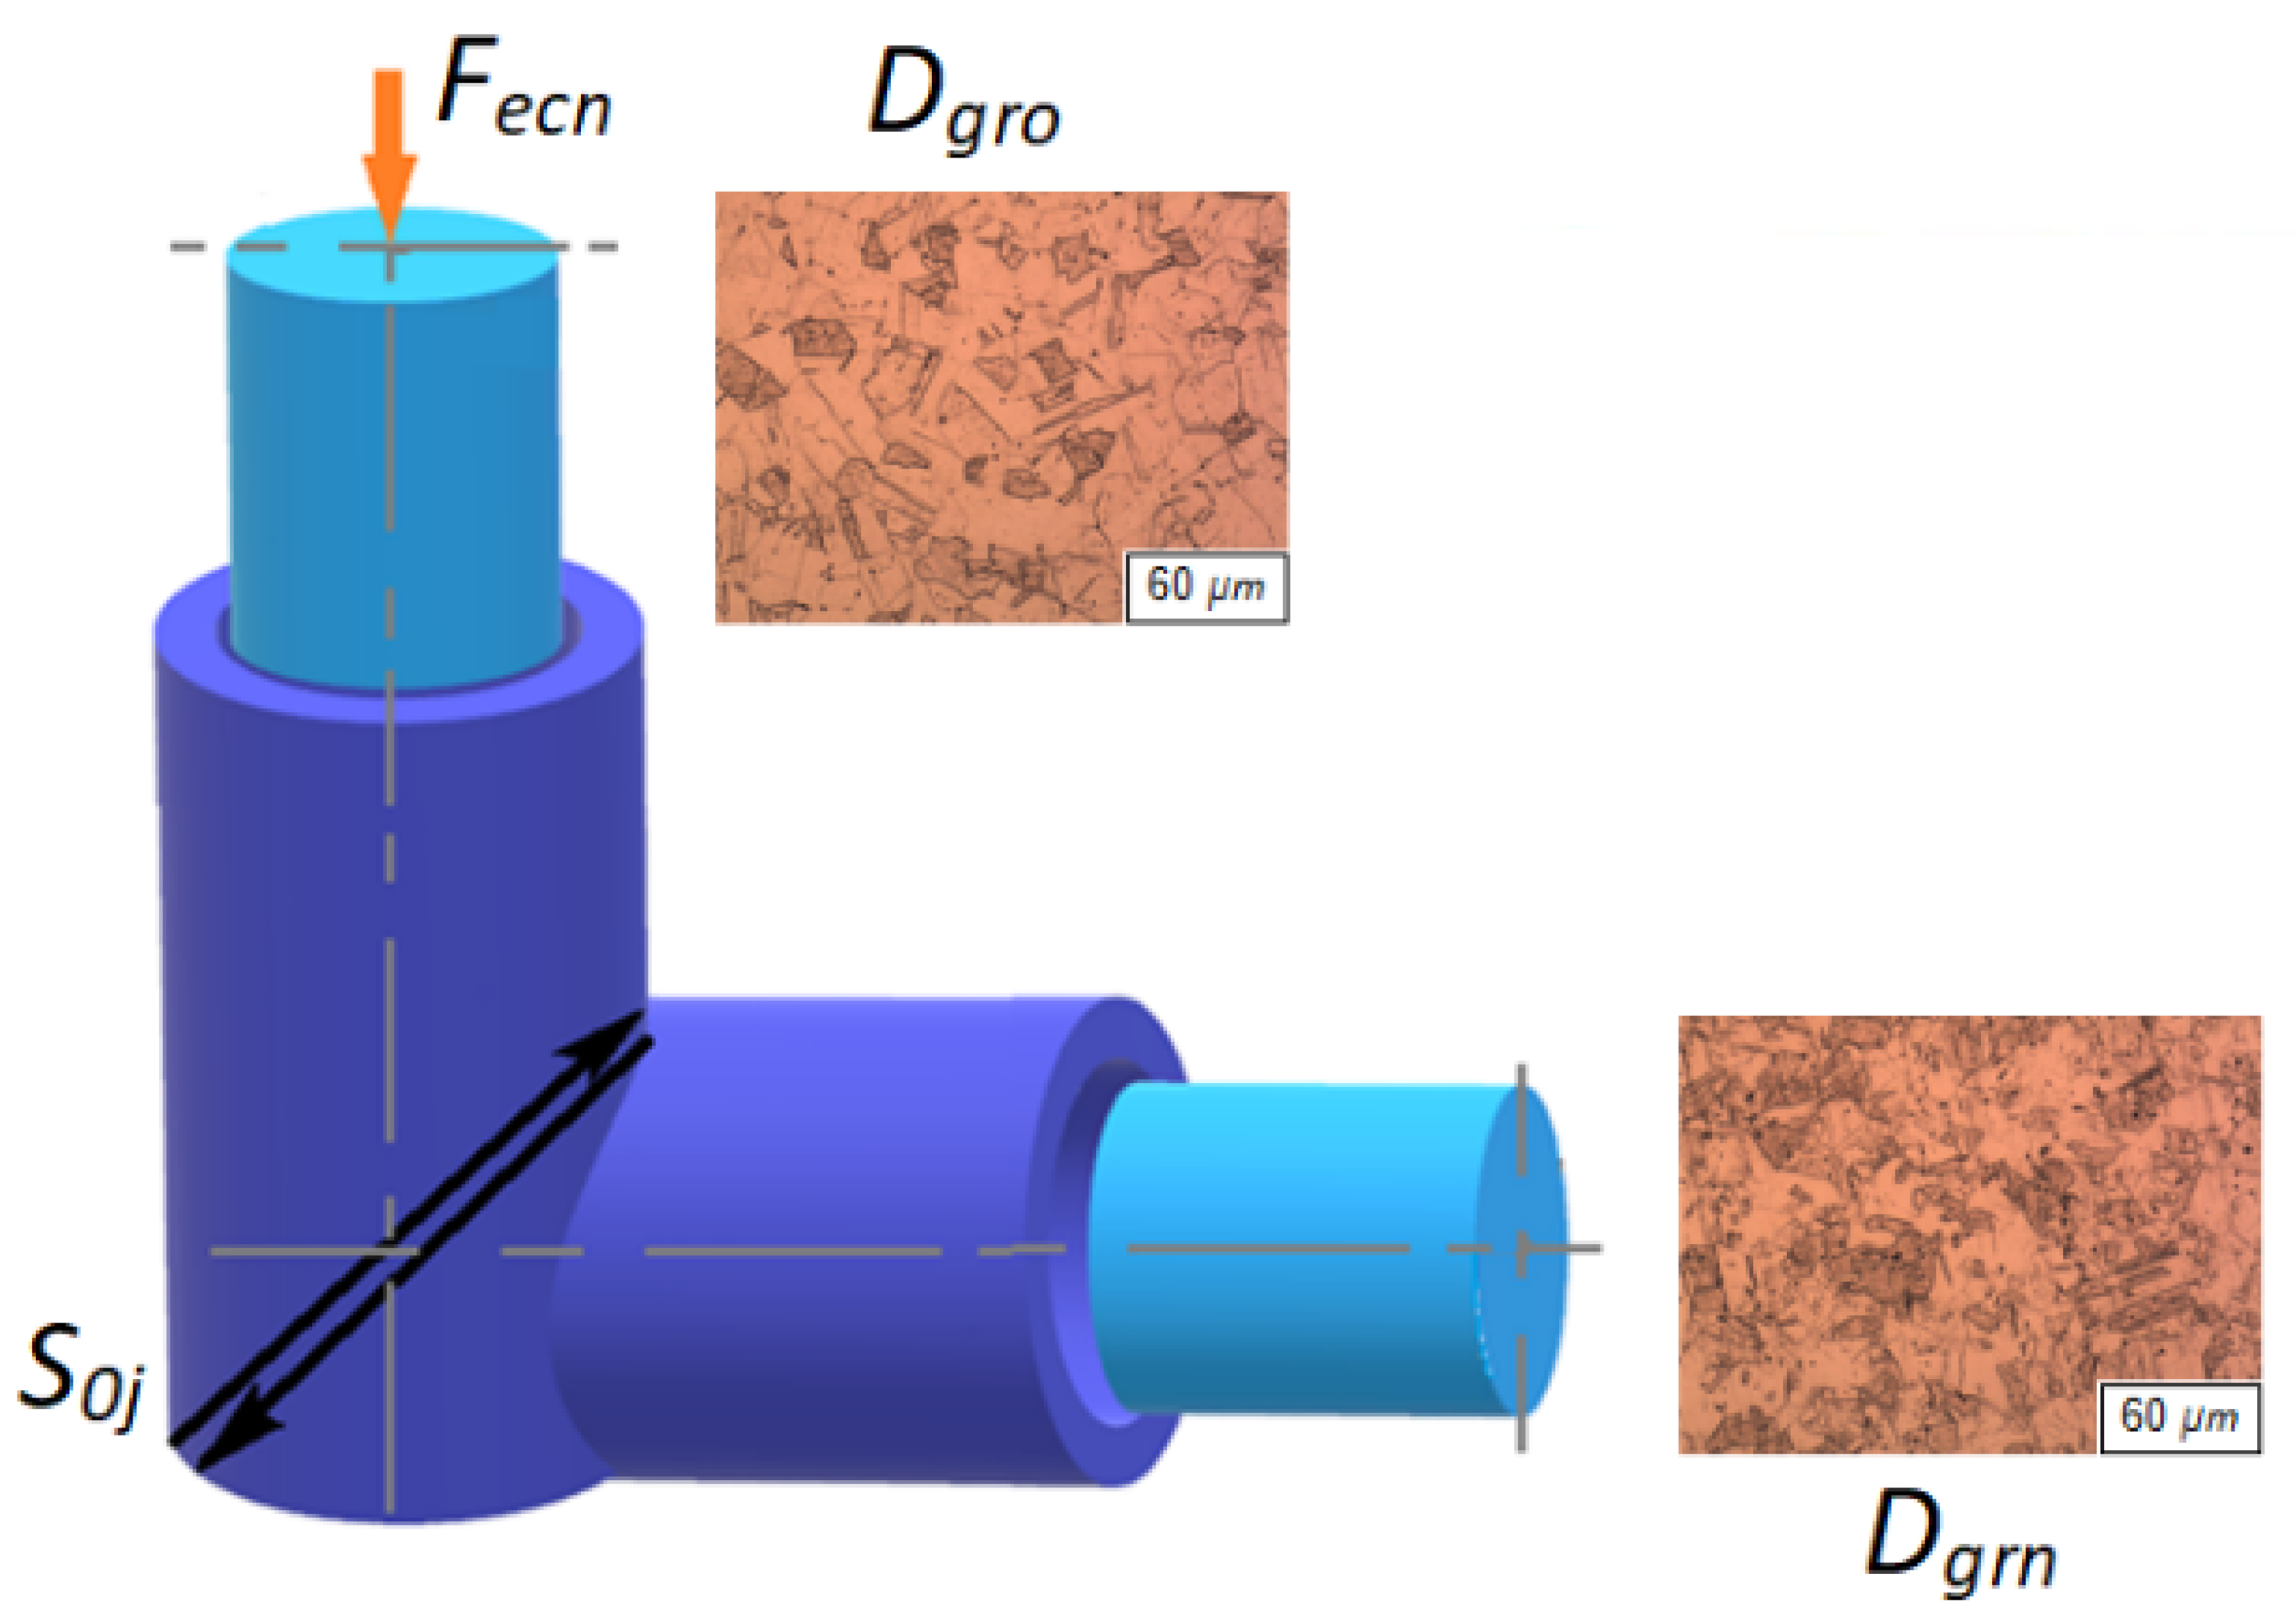
- Input diameter of structural grain Dgro = 12.74 µm.
2.2. Measurement of Ultrasonic Speed
2.3. New Method for Mechanical Analysis of Extrusion Functions
3. Results and Discussion
3.1. Measured Parameters
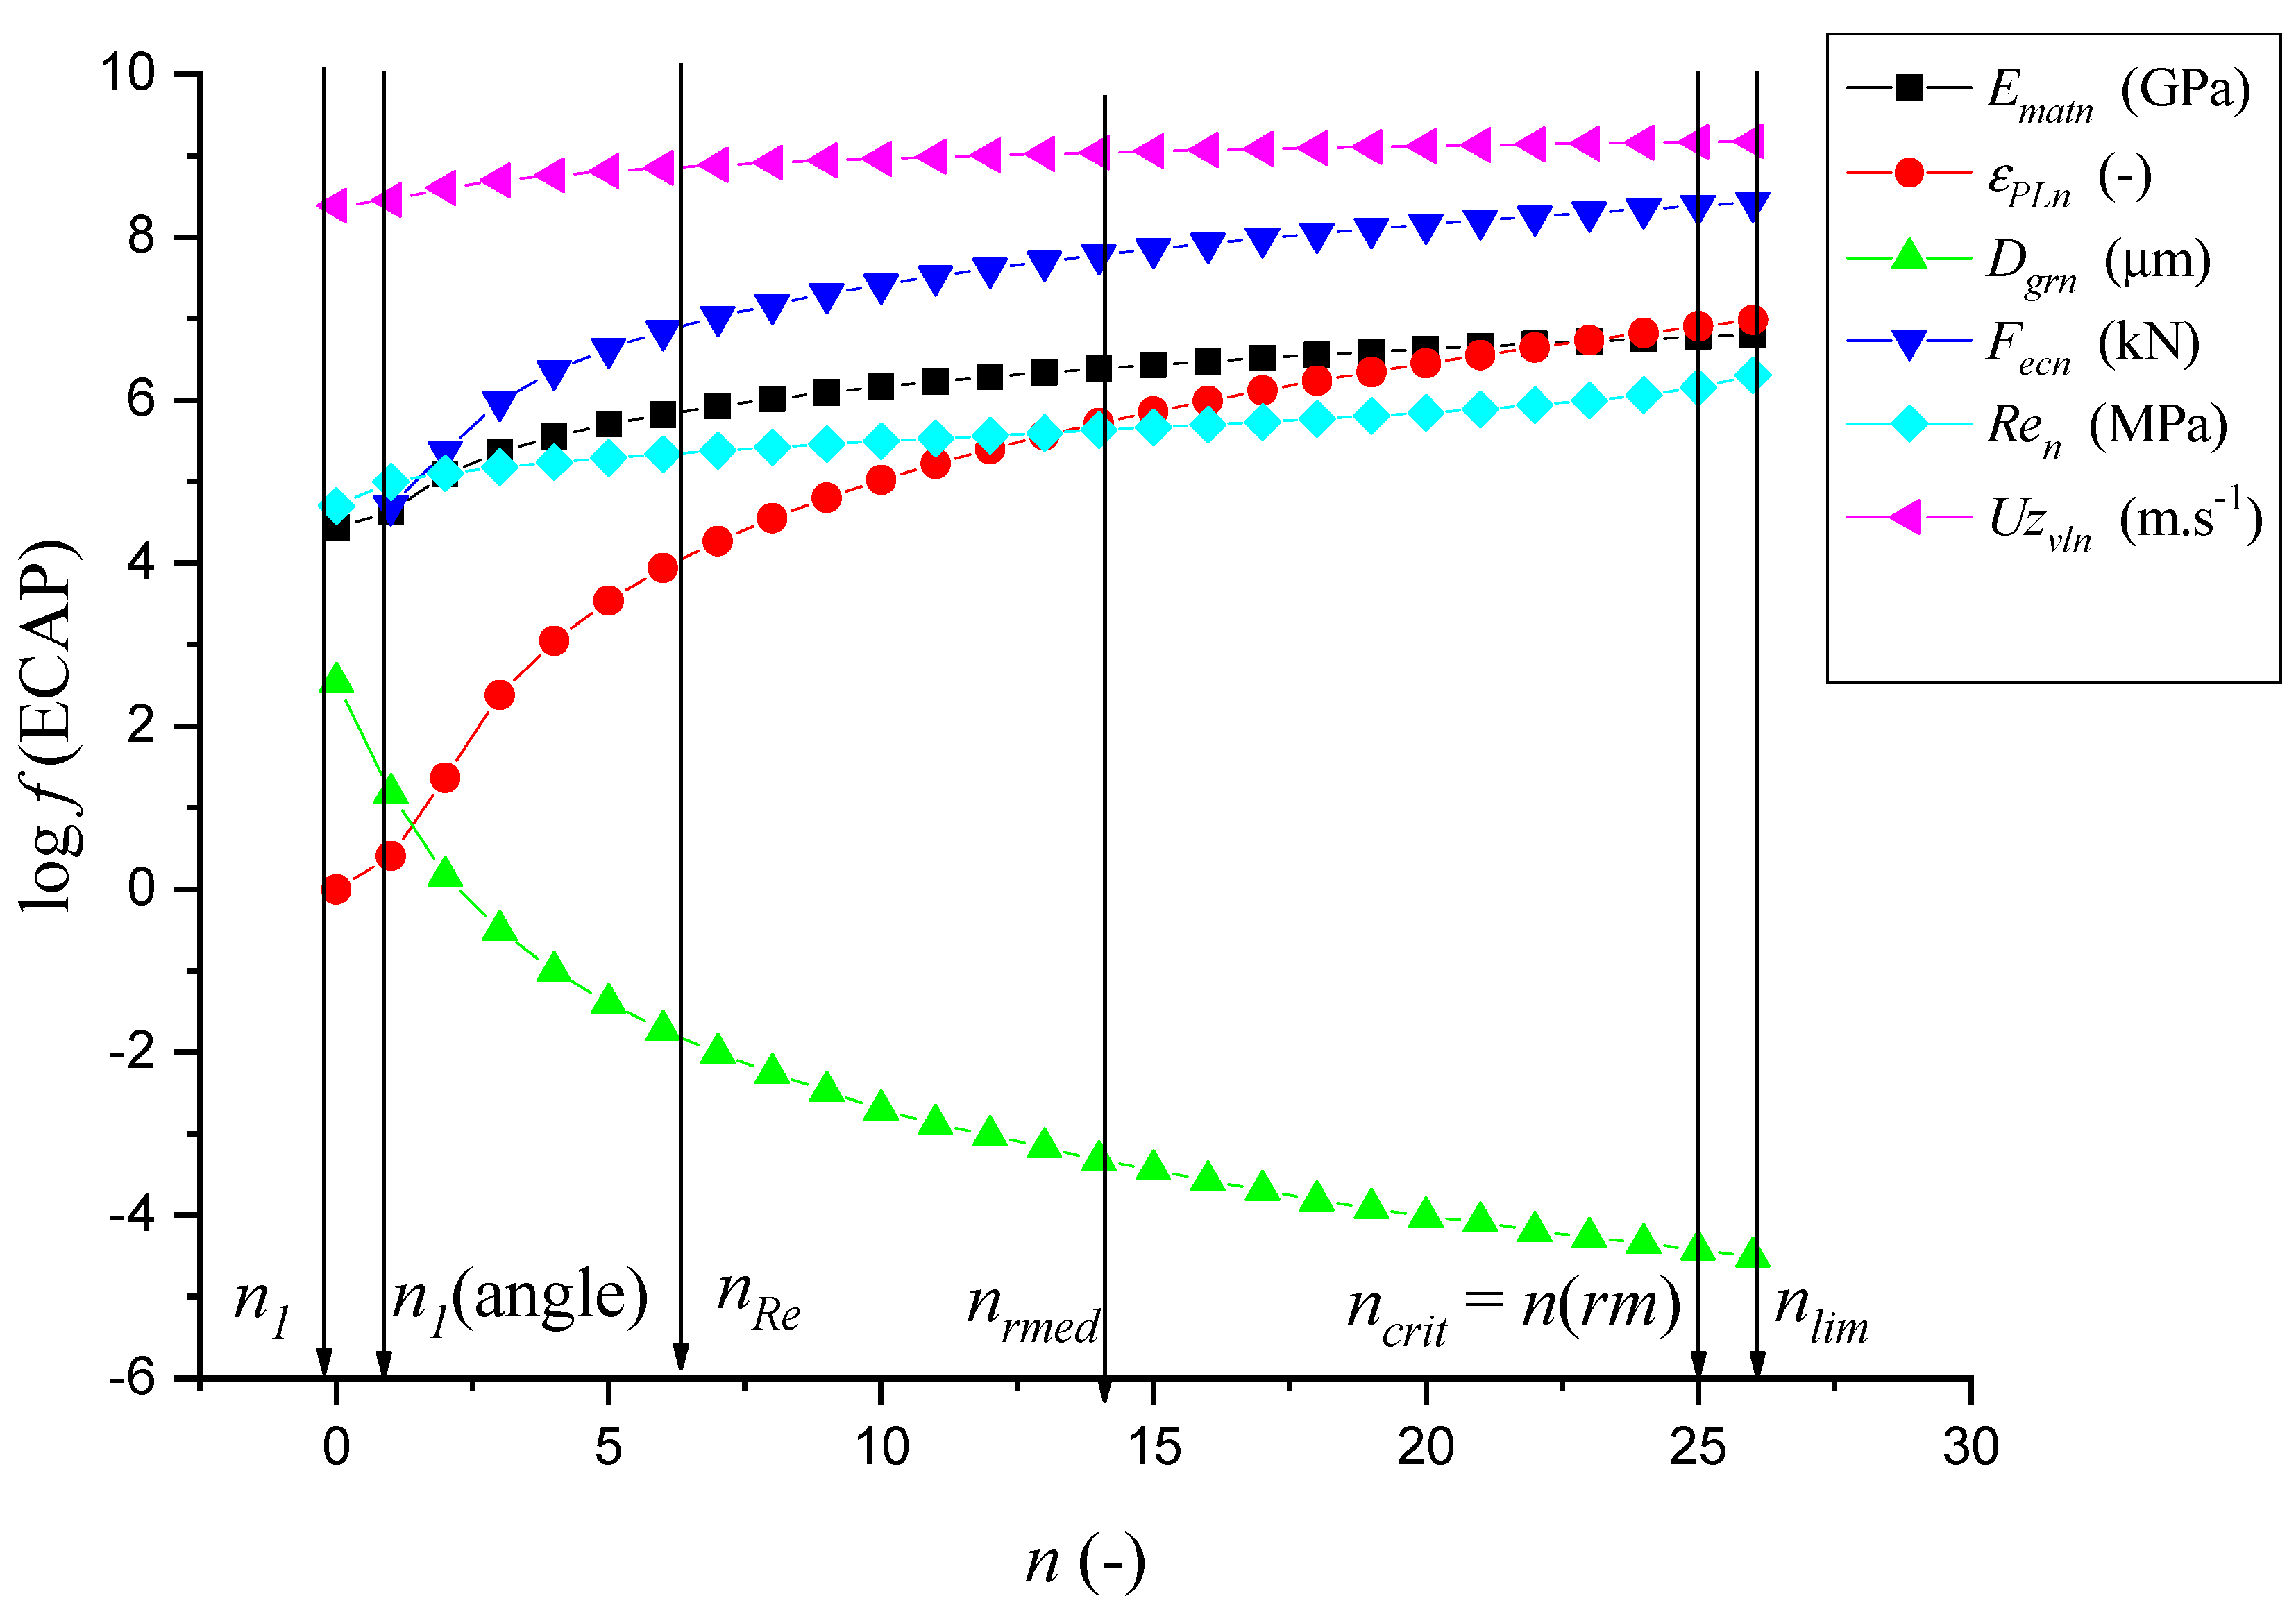
3.2. Prediction Parameters
| n1 | Represents a high resistance of the surface layer. |
| n (angle) | The level of the beginning of the effect of the channel break (represents the influence of the ECAP technology knee). |
| nRe | Level of exceeding the yield strength Re of the material. |
| n (rmed) | Level of mean number of extrusions n(lim)/2. |
| ncrit = n (rm) | Level of exceeding the yield strength Rm of the material (delimited zone of structural deformations). |
| n (lim) | Level of reaching the limit deformation capacity (zone of decomposition of structural bonds). |
3.3. Analytic Approach to the Solution
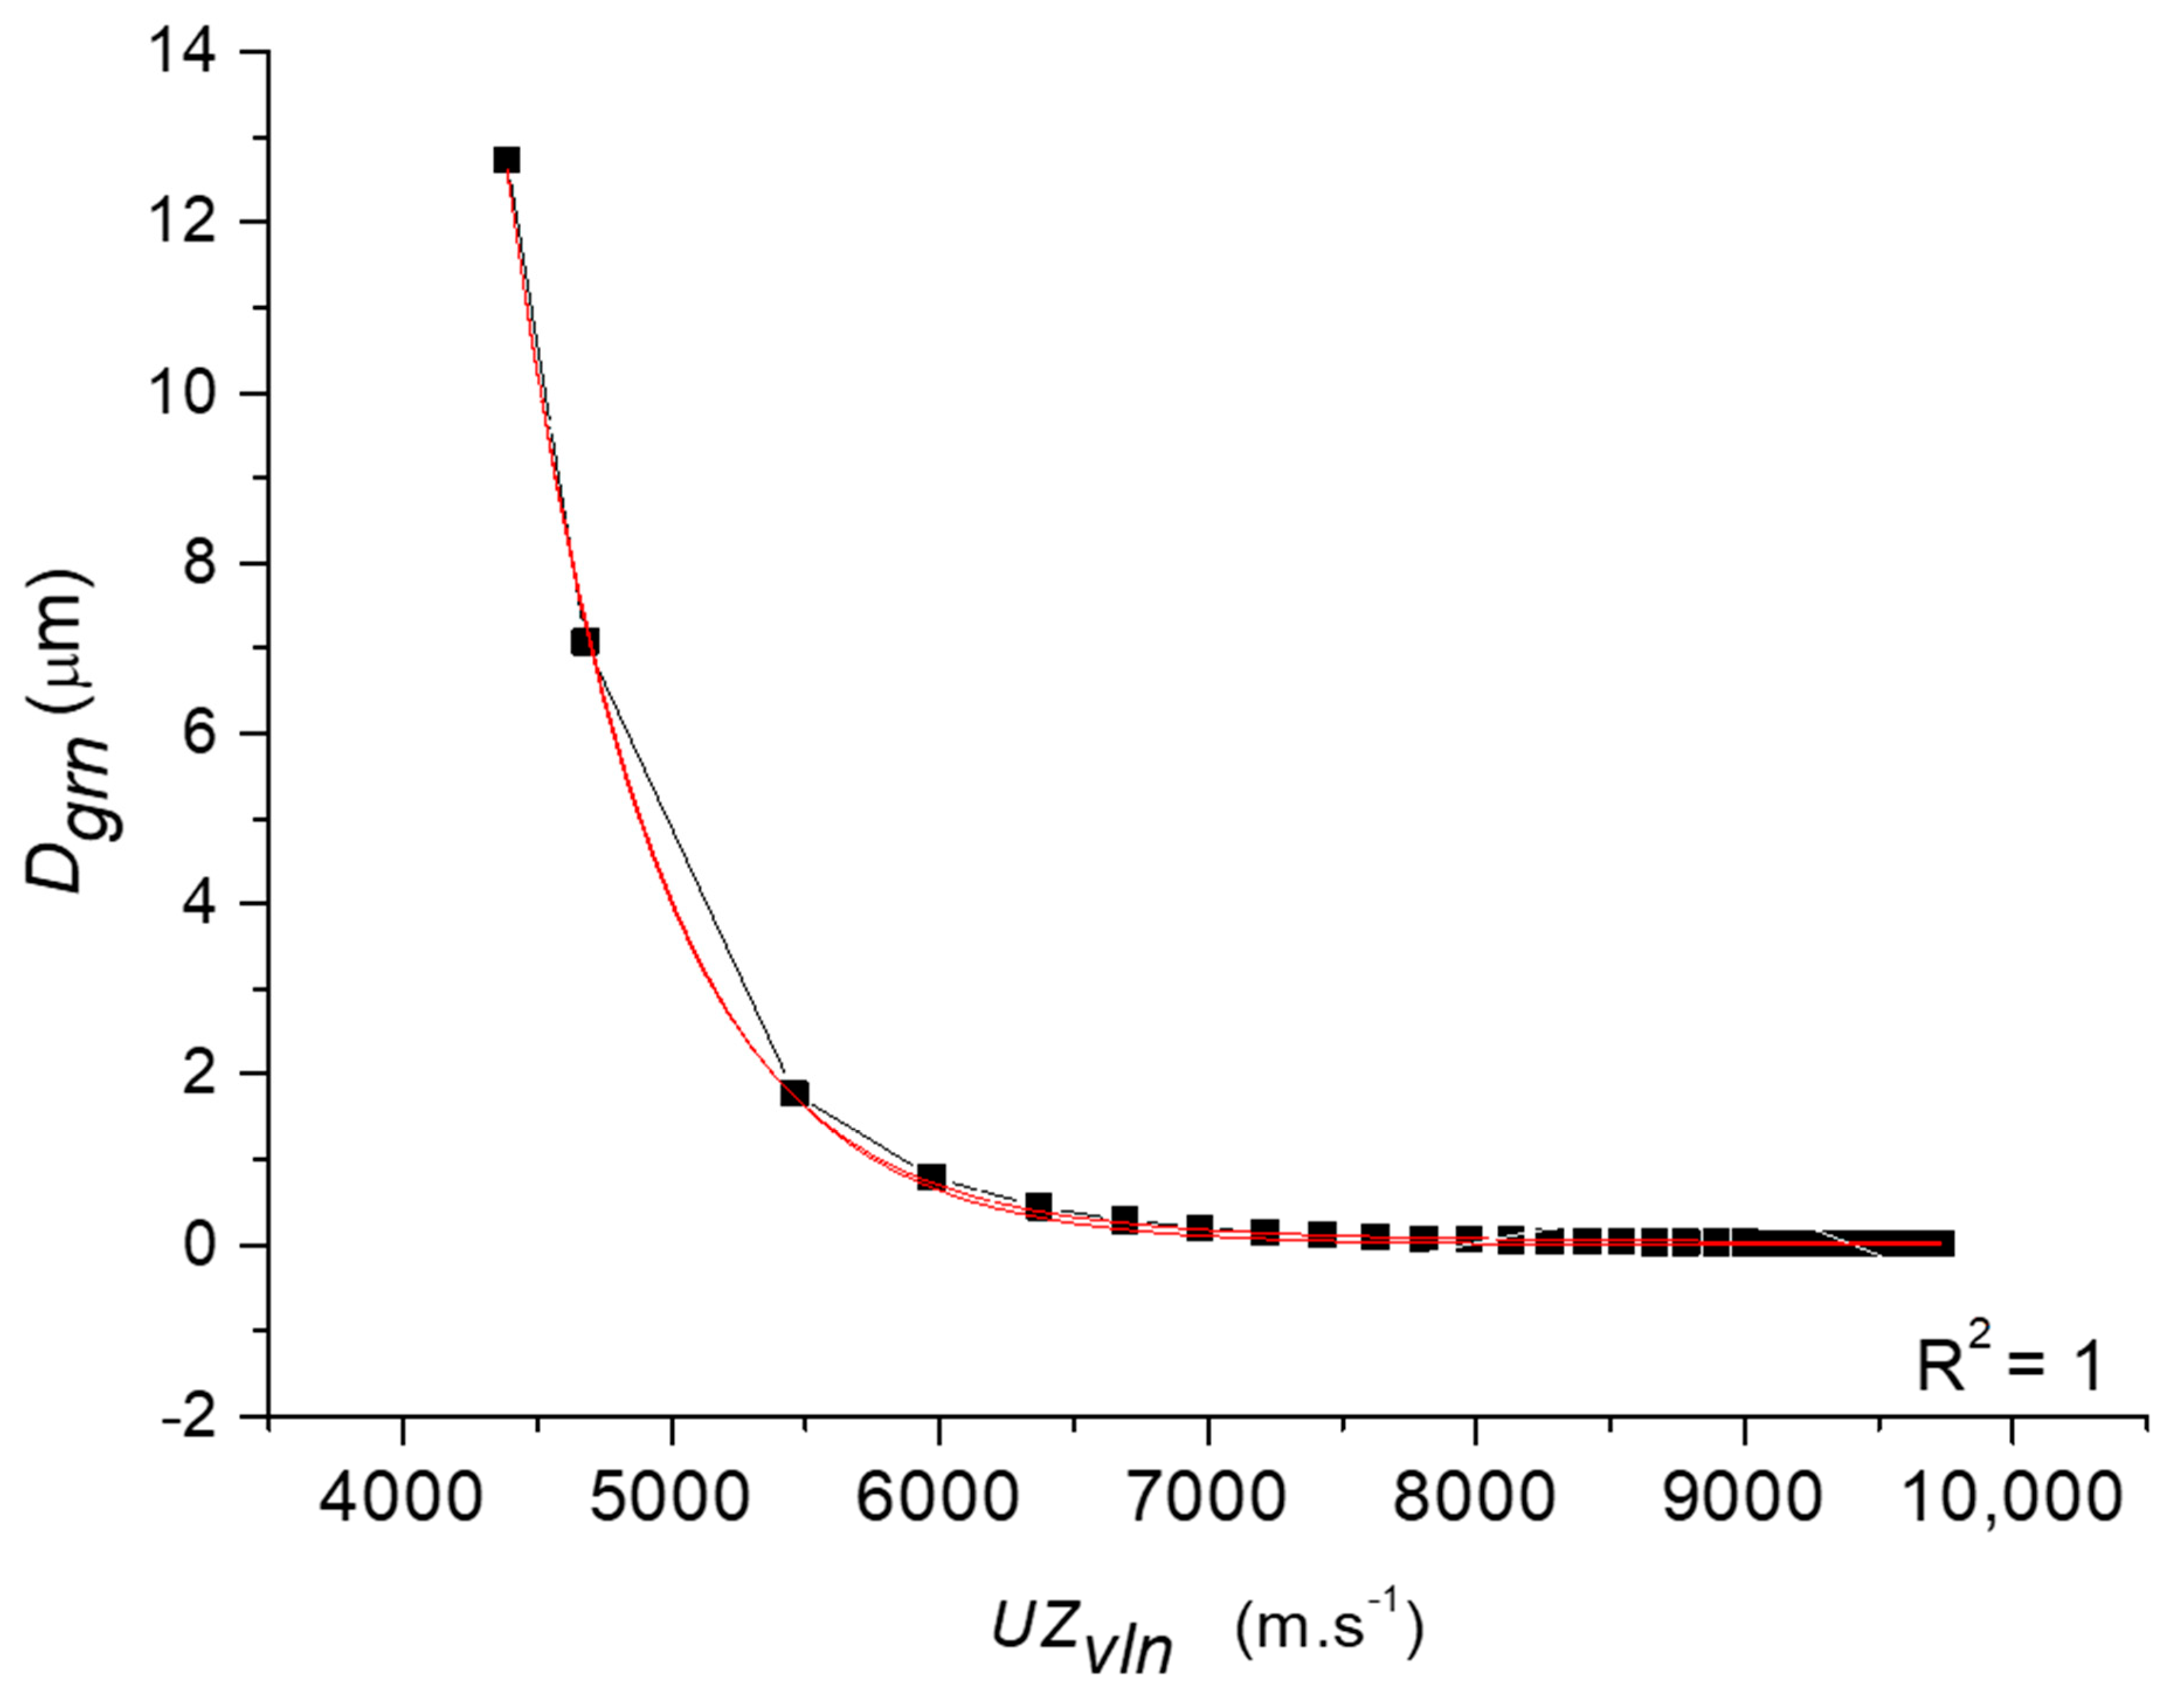
3.4. Data Distribution Calibration Graphs
4. Comparison and Verification of Results
- Derivation of the equilibrium equation for extrusion by the ECAP method (1);
- Derivation of new Equations (1) and (7)–(18) needed for solving the problem by the ECAP method;
- Algorithmizing of calculations for Excel and Matlab programs.
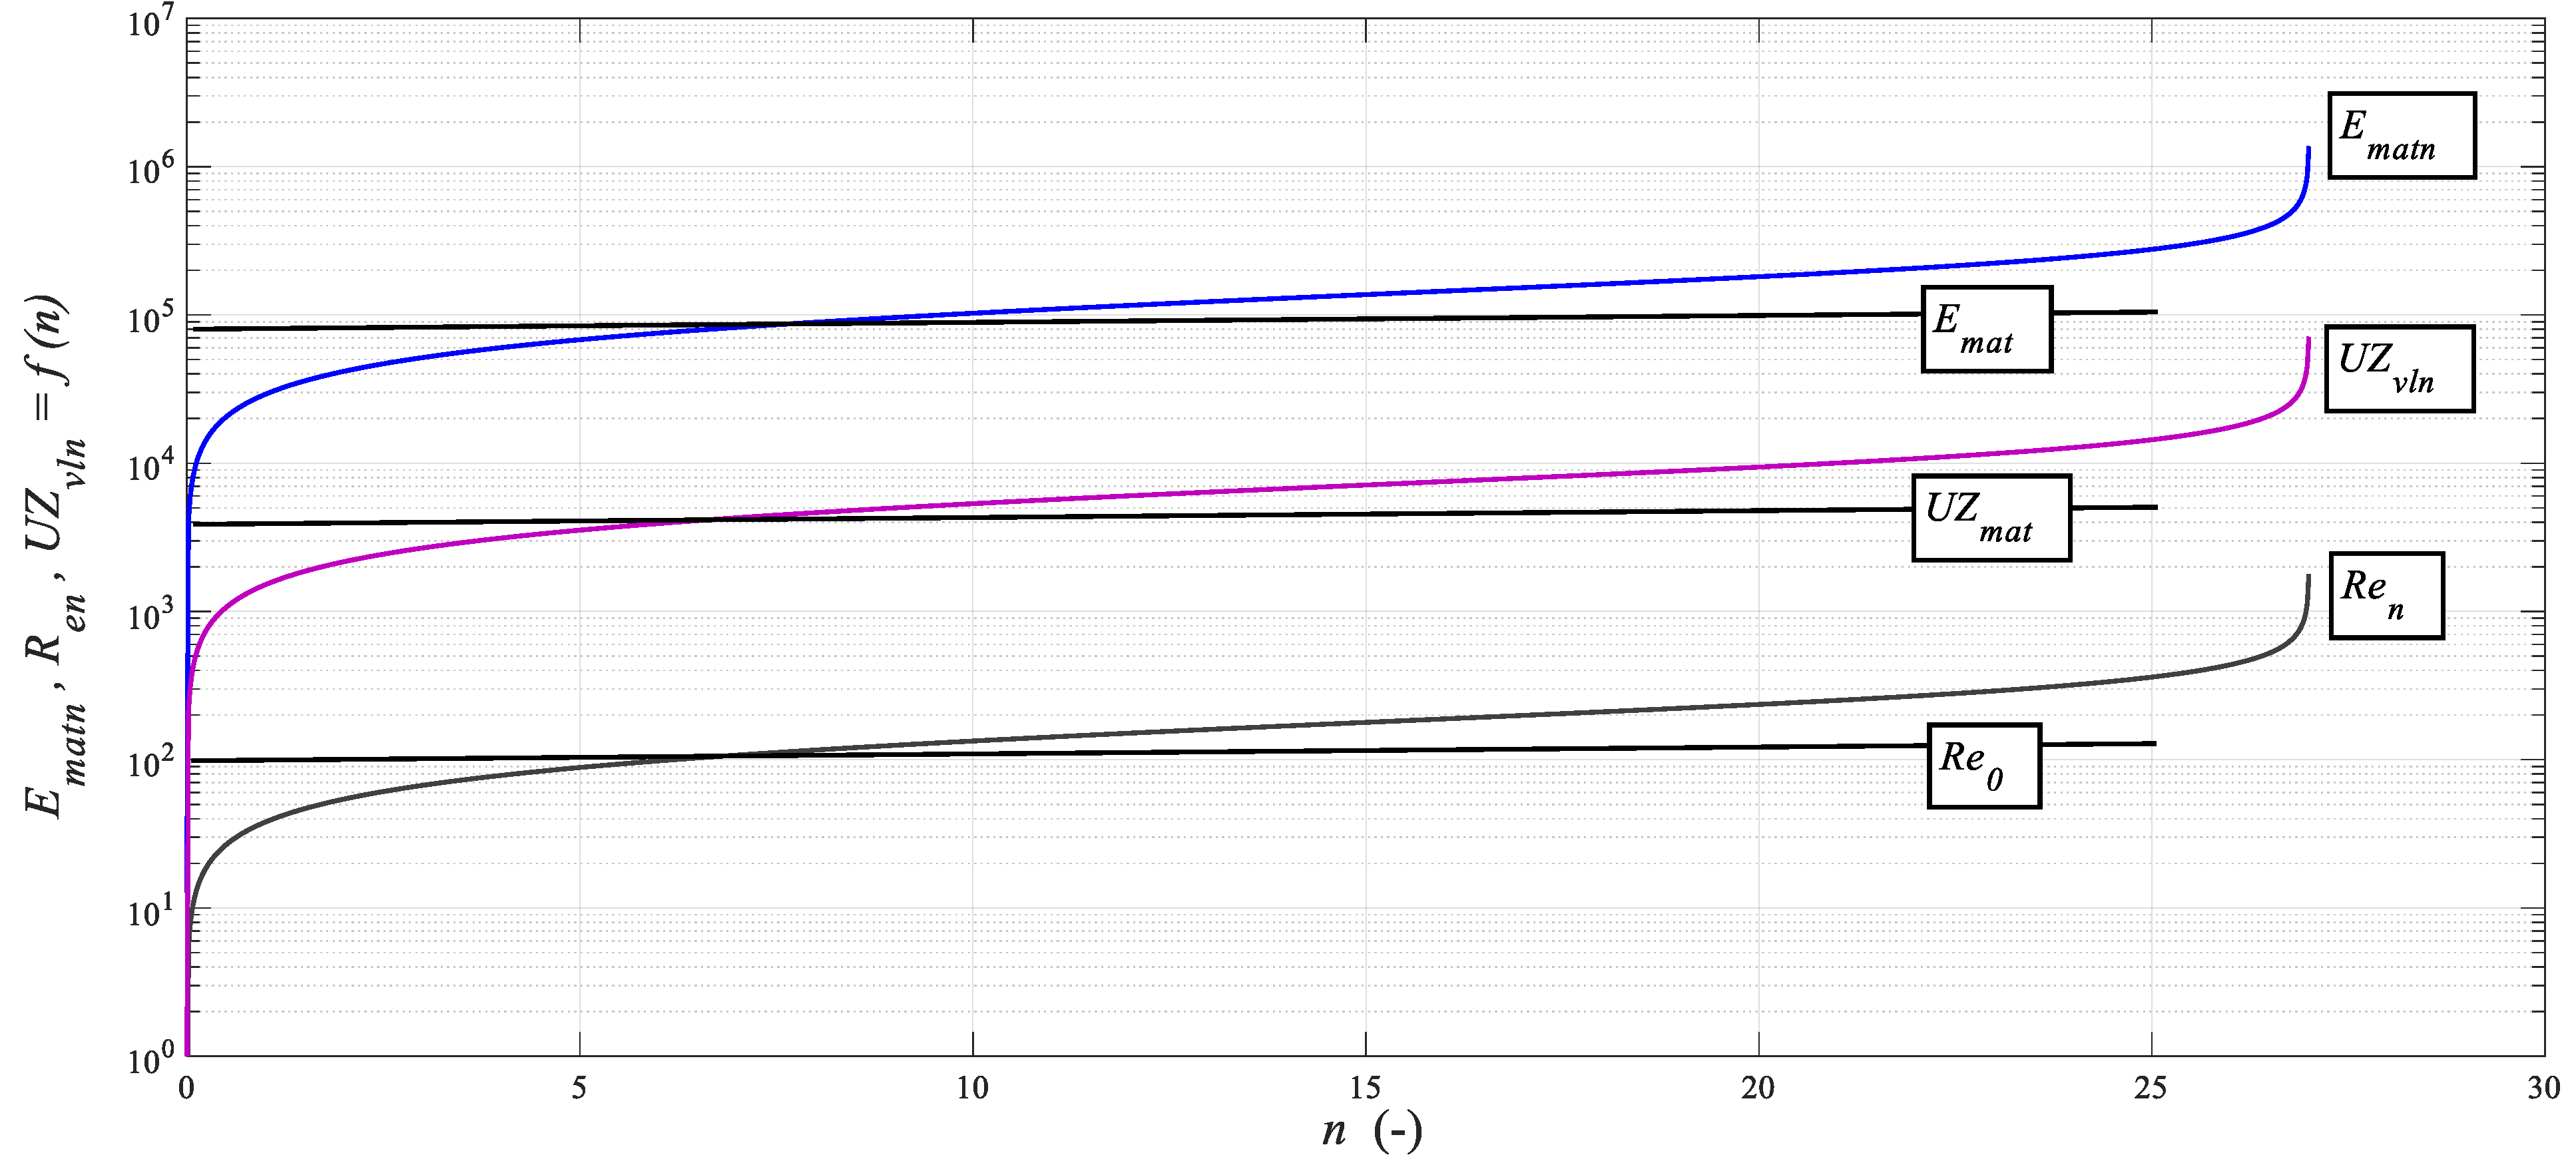
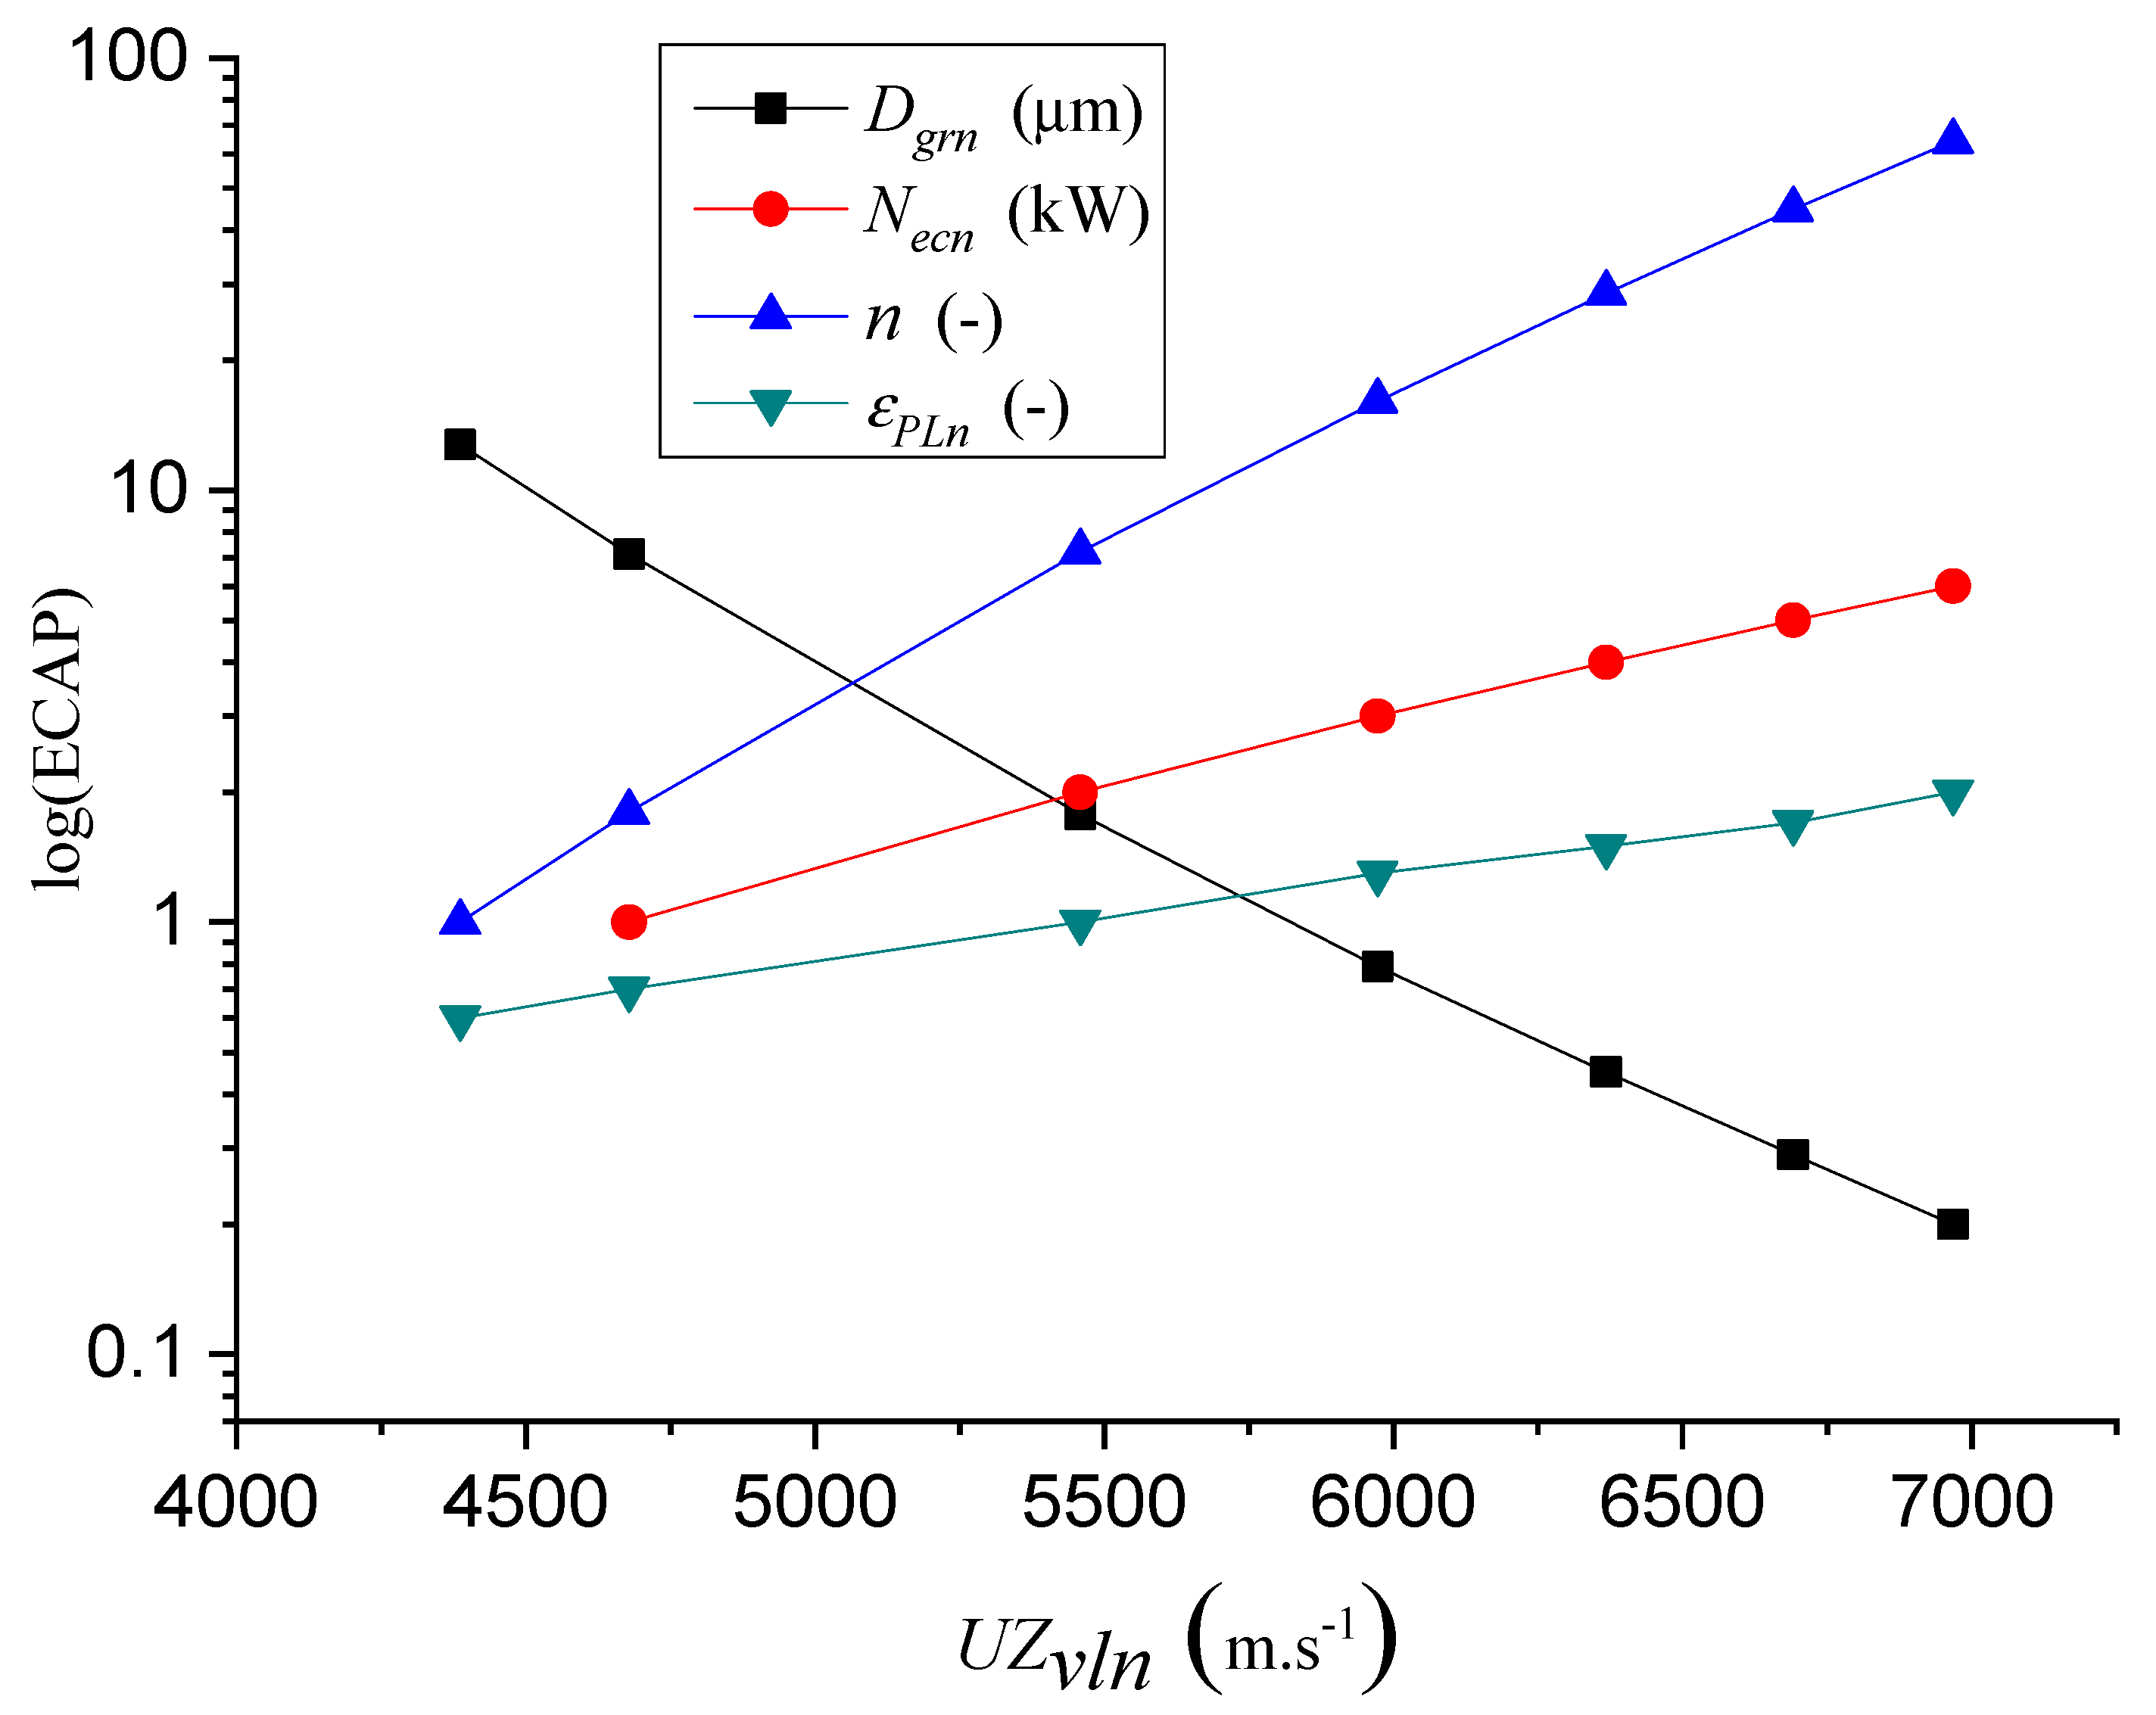
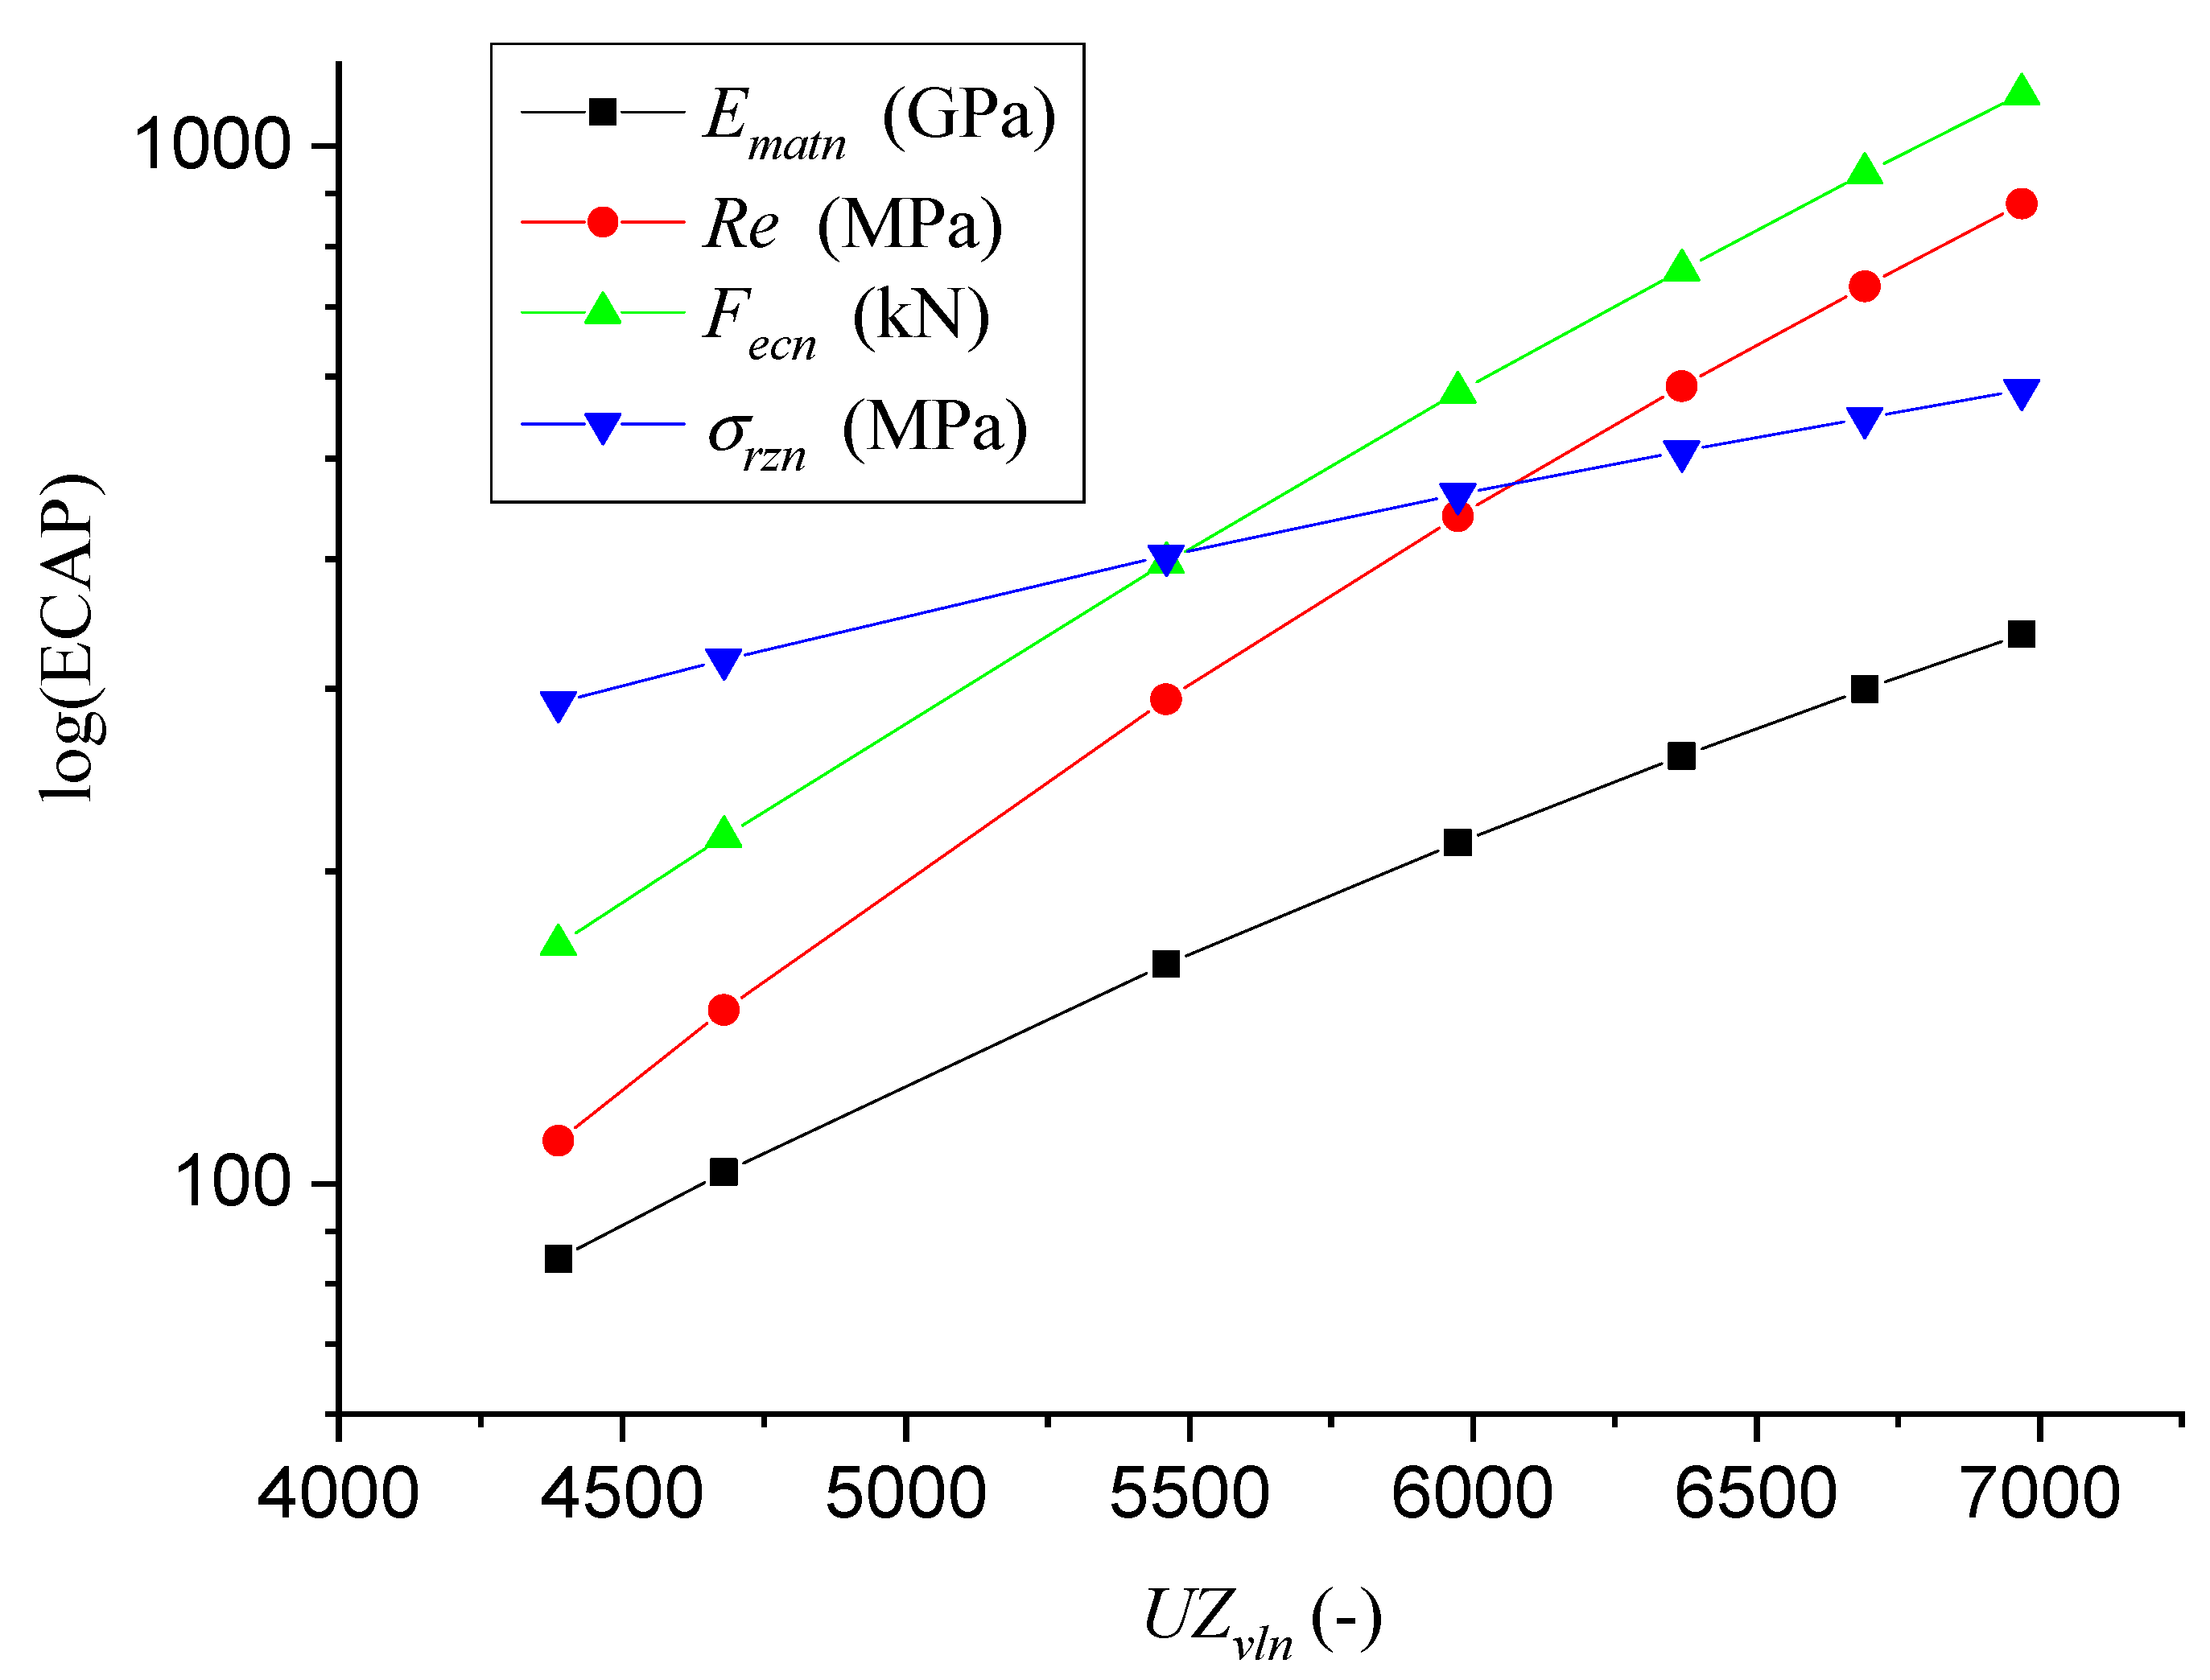
4.1. Comparison and Verification of the Results According to the Velocity of Longitudinal Ultrasound Waves
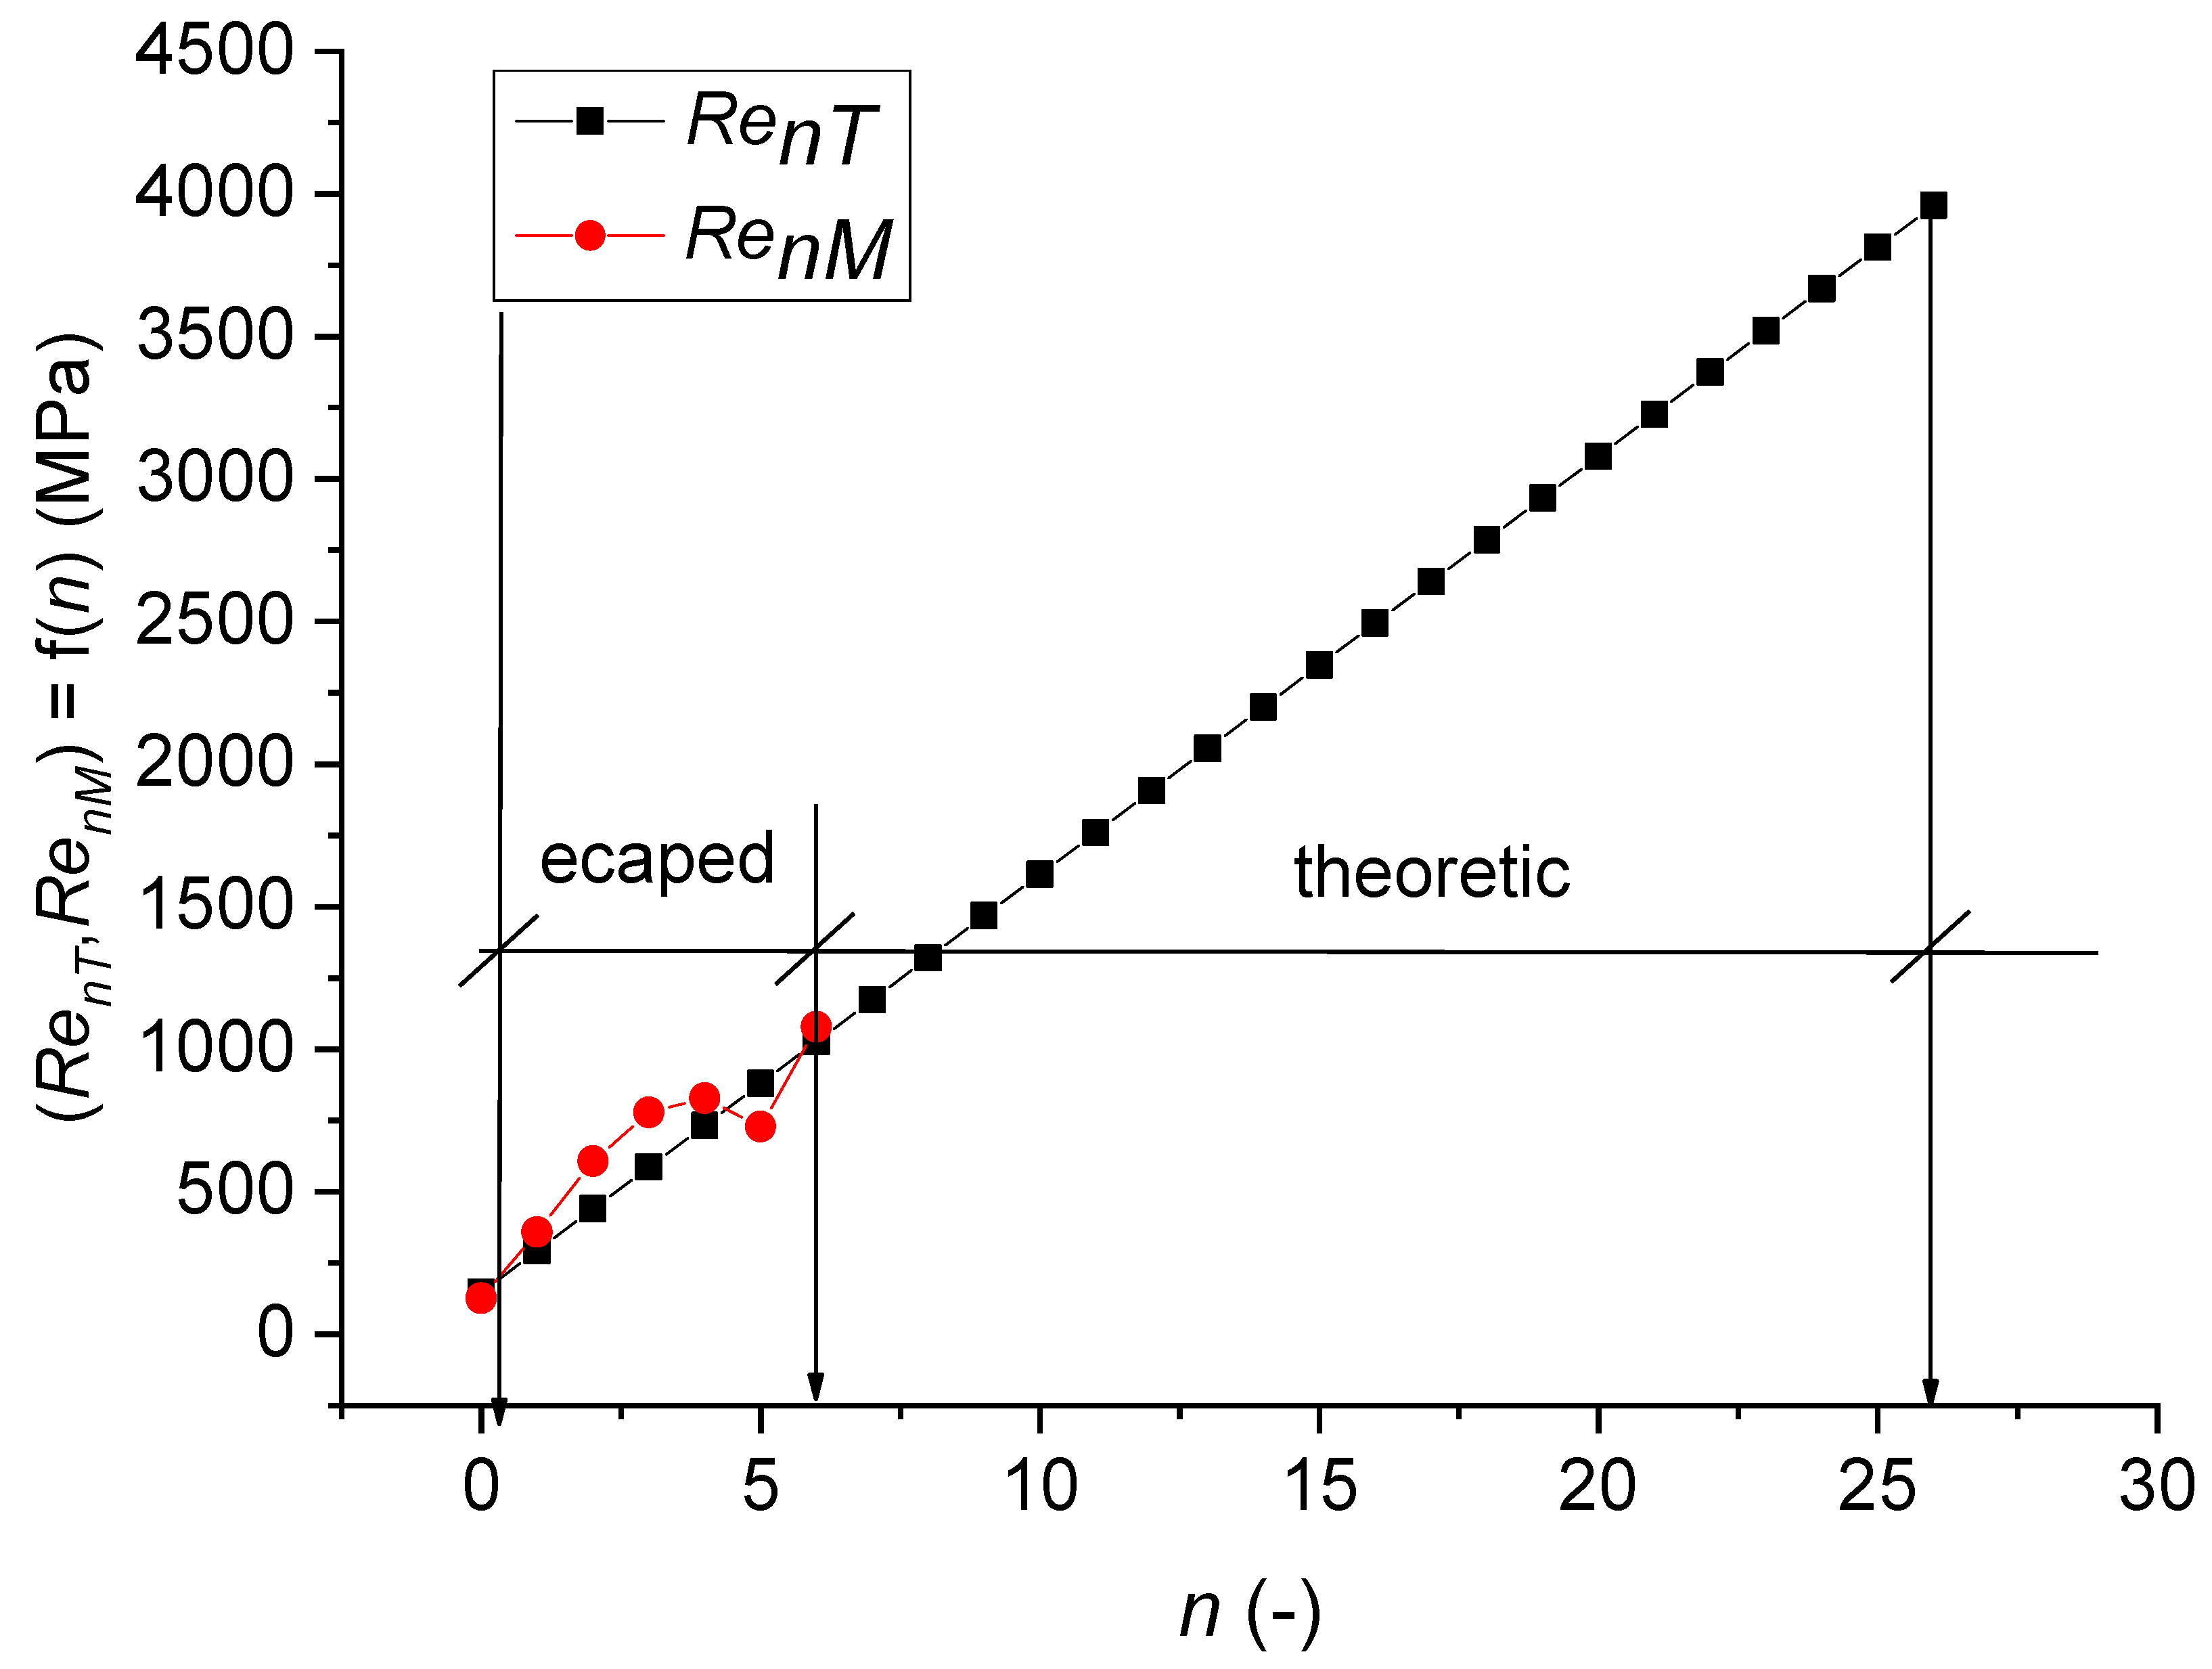
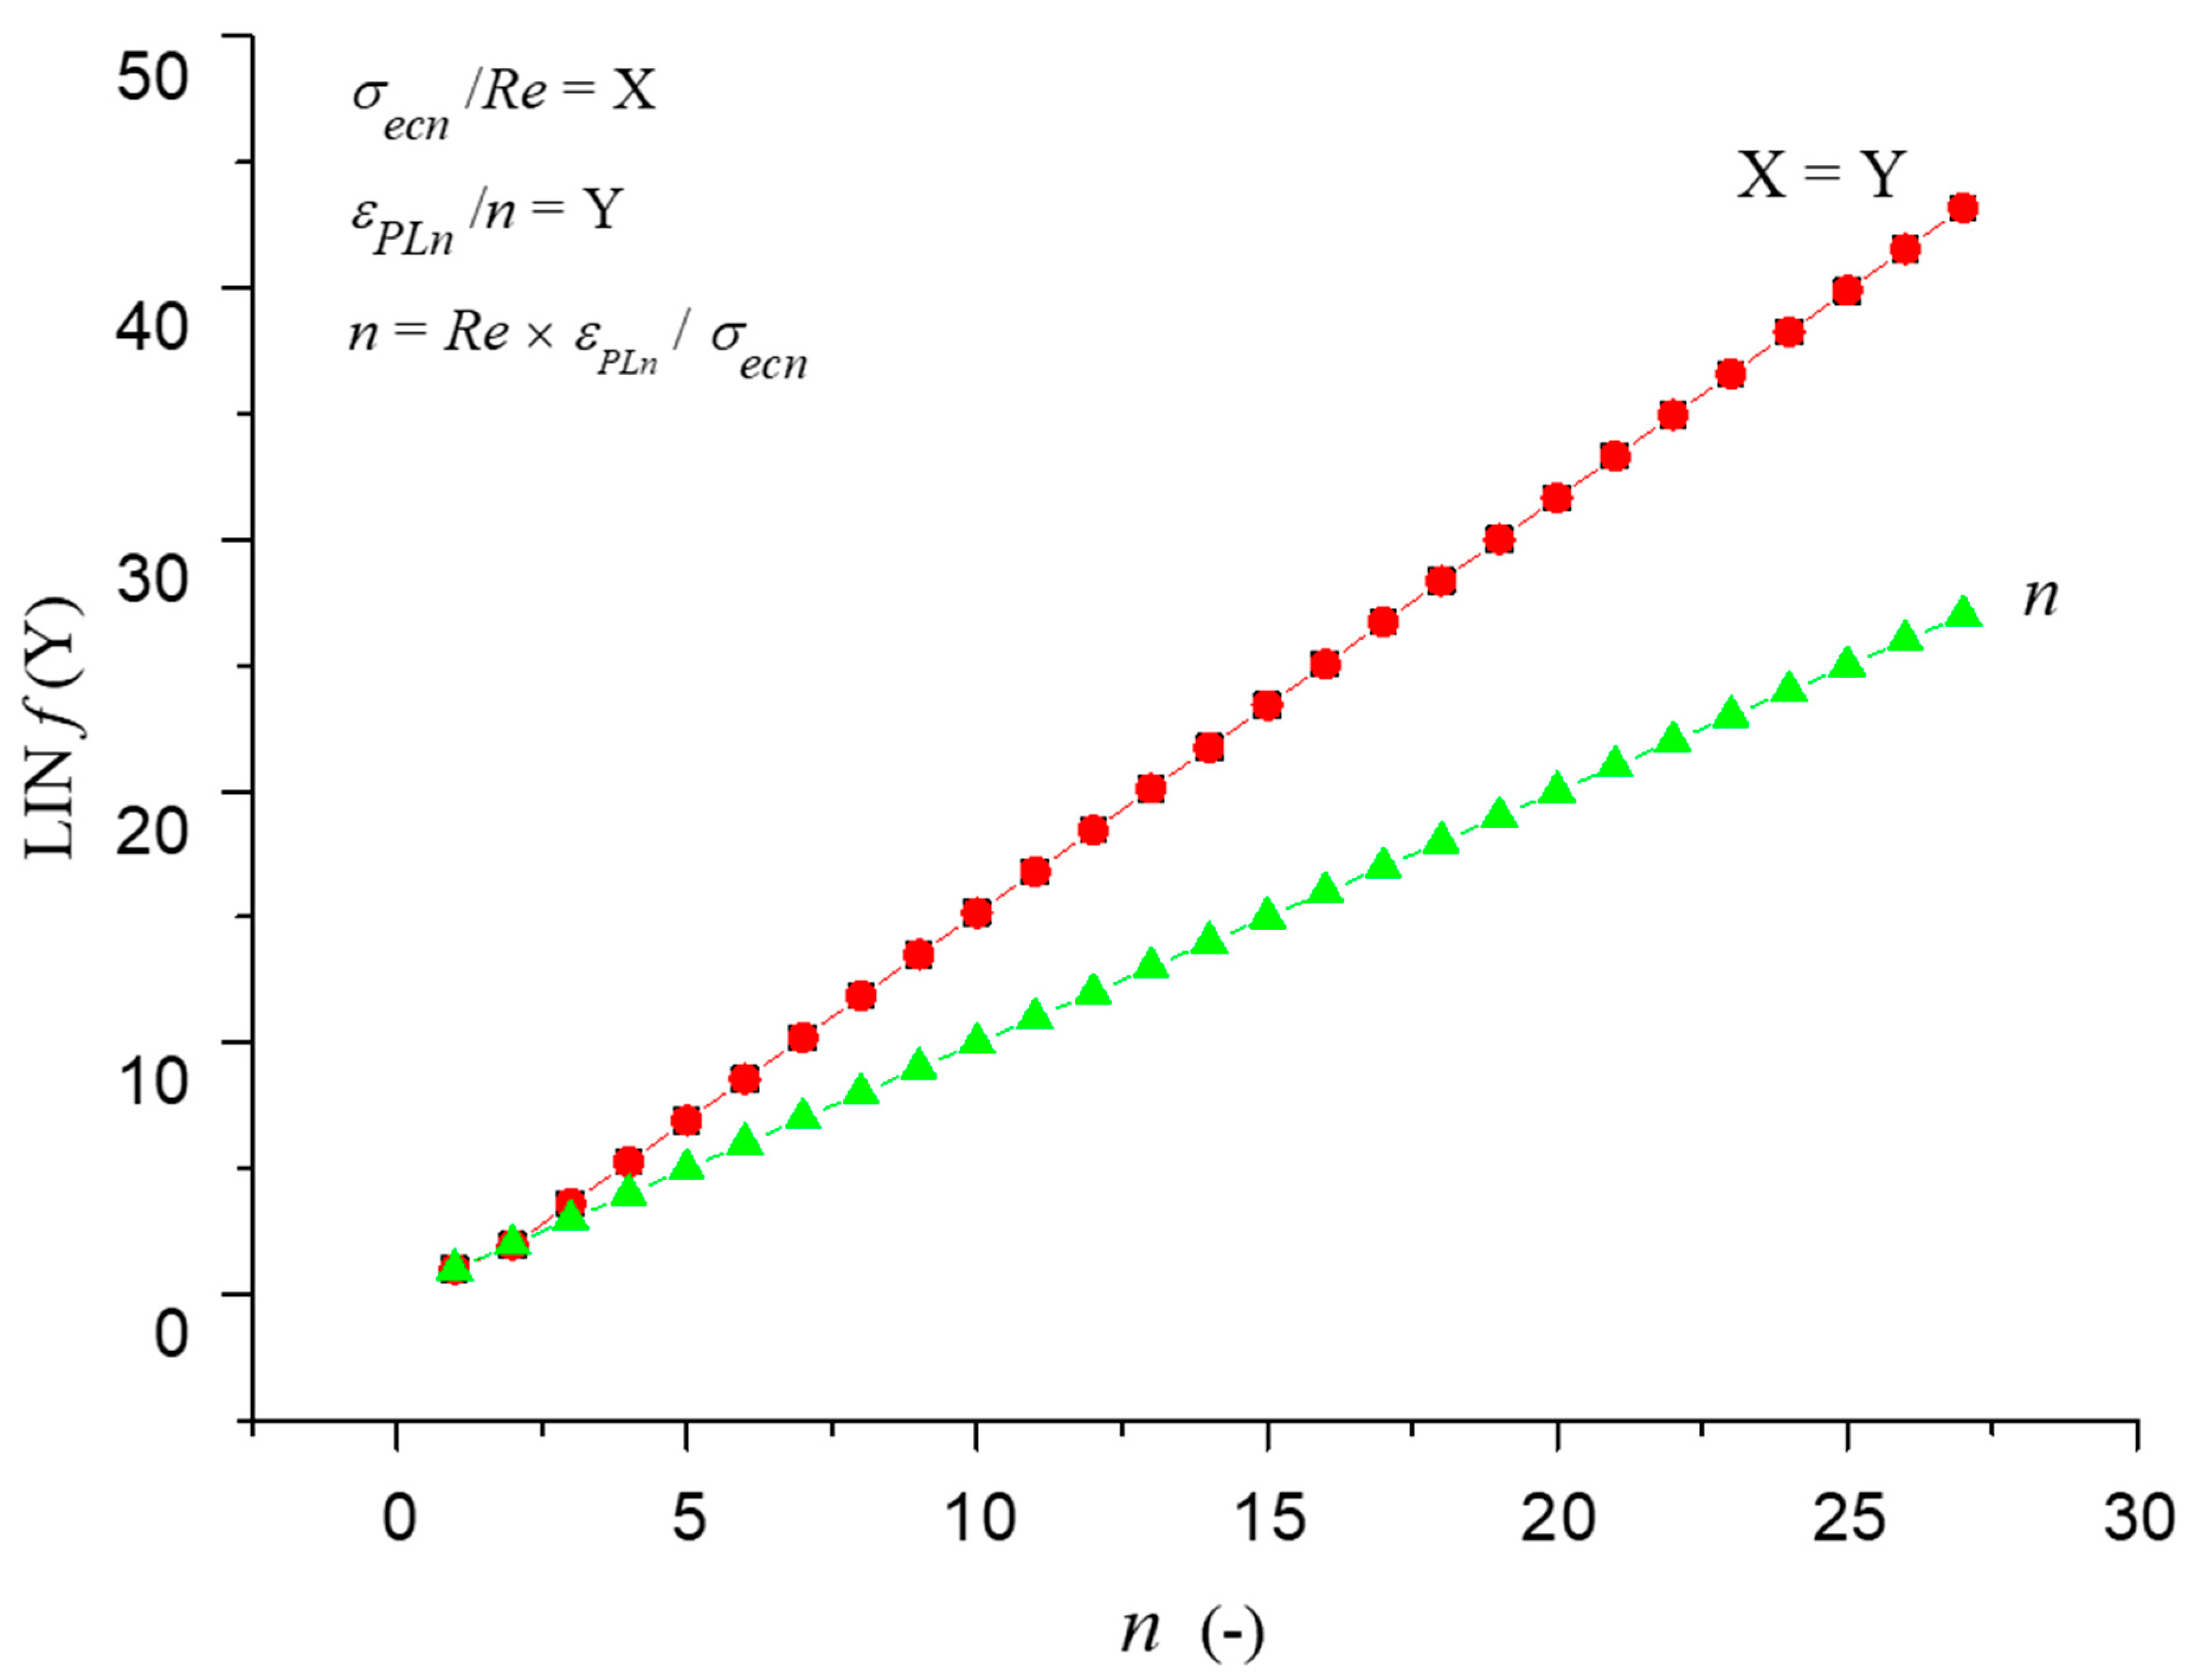
4.2. Control and Verification Comparison Results by Ultrasound and by Equilibrium Equation
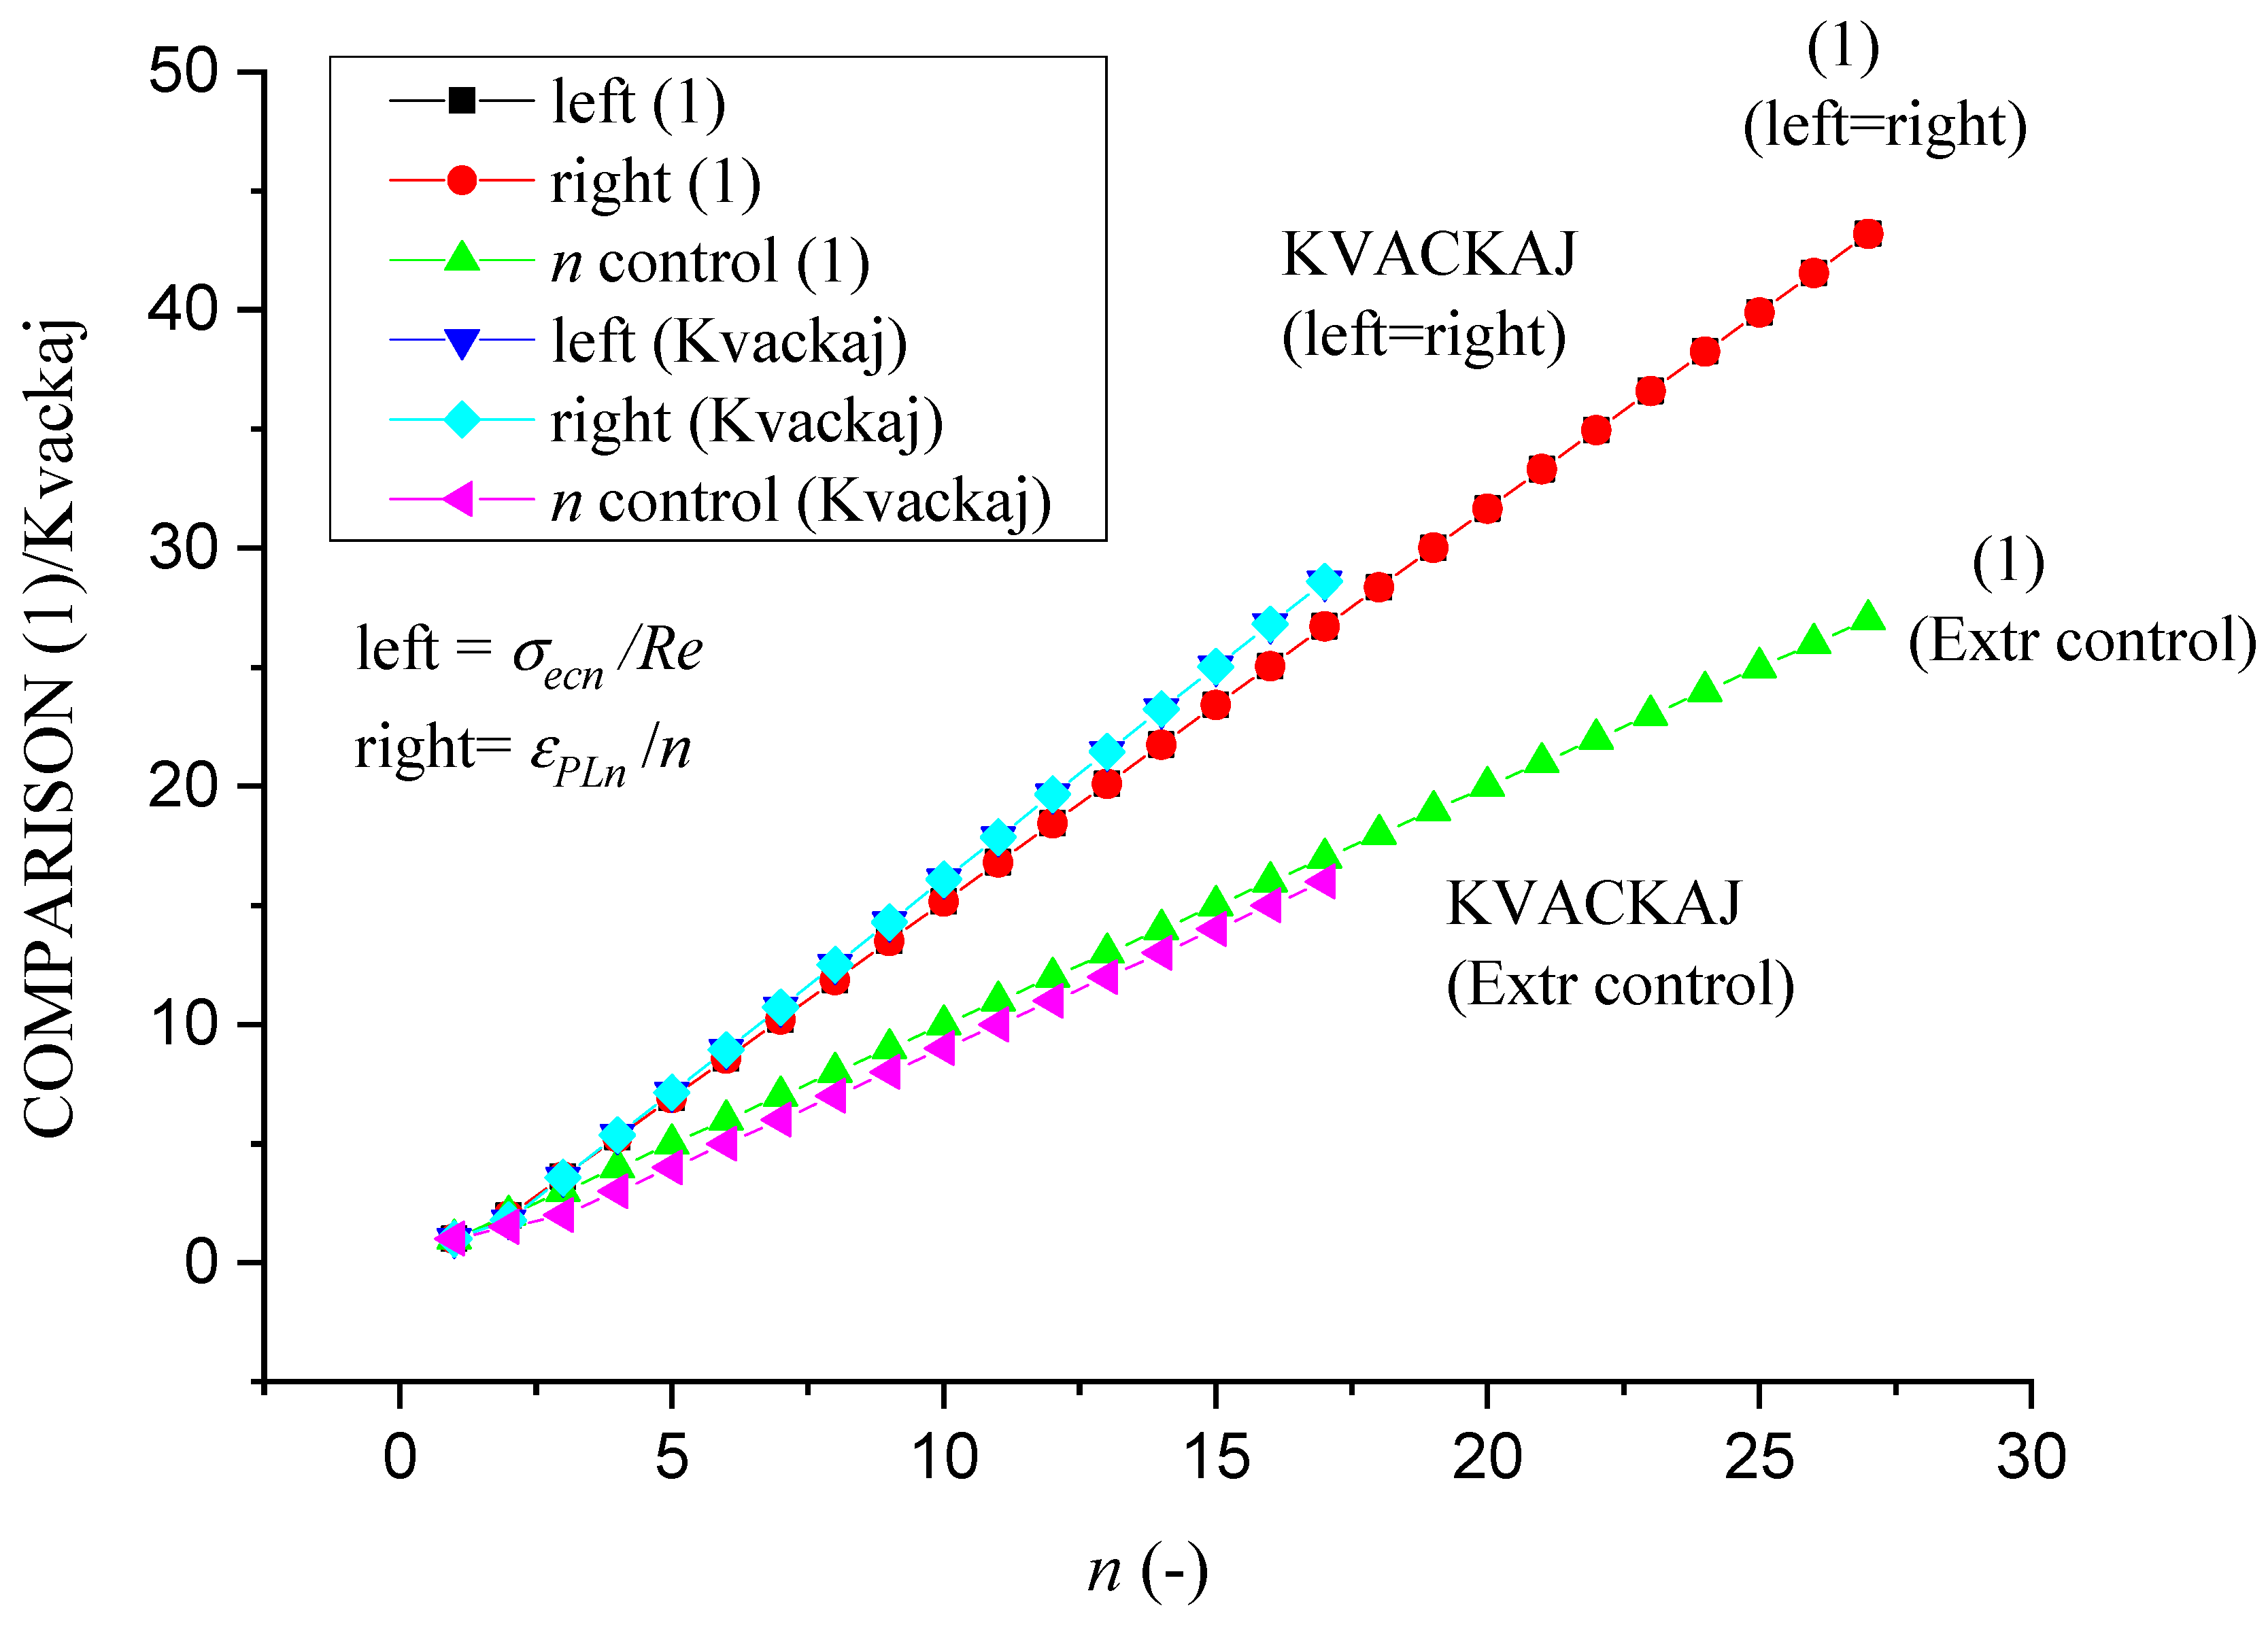
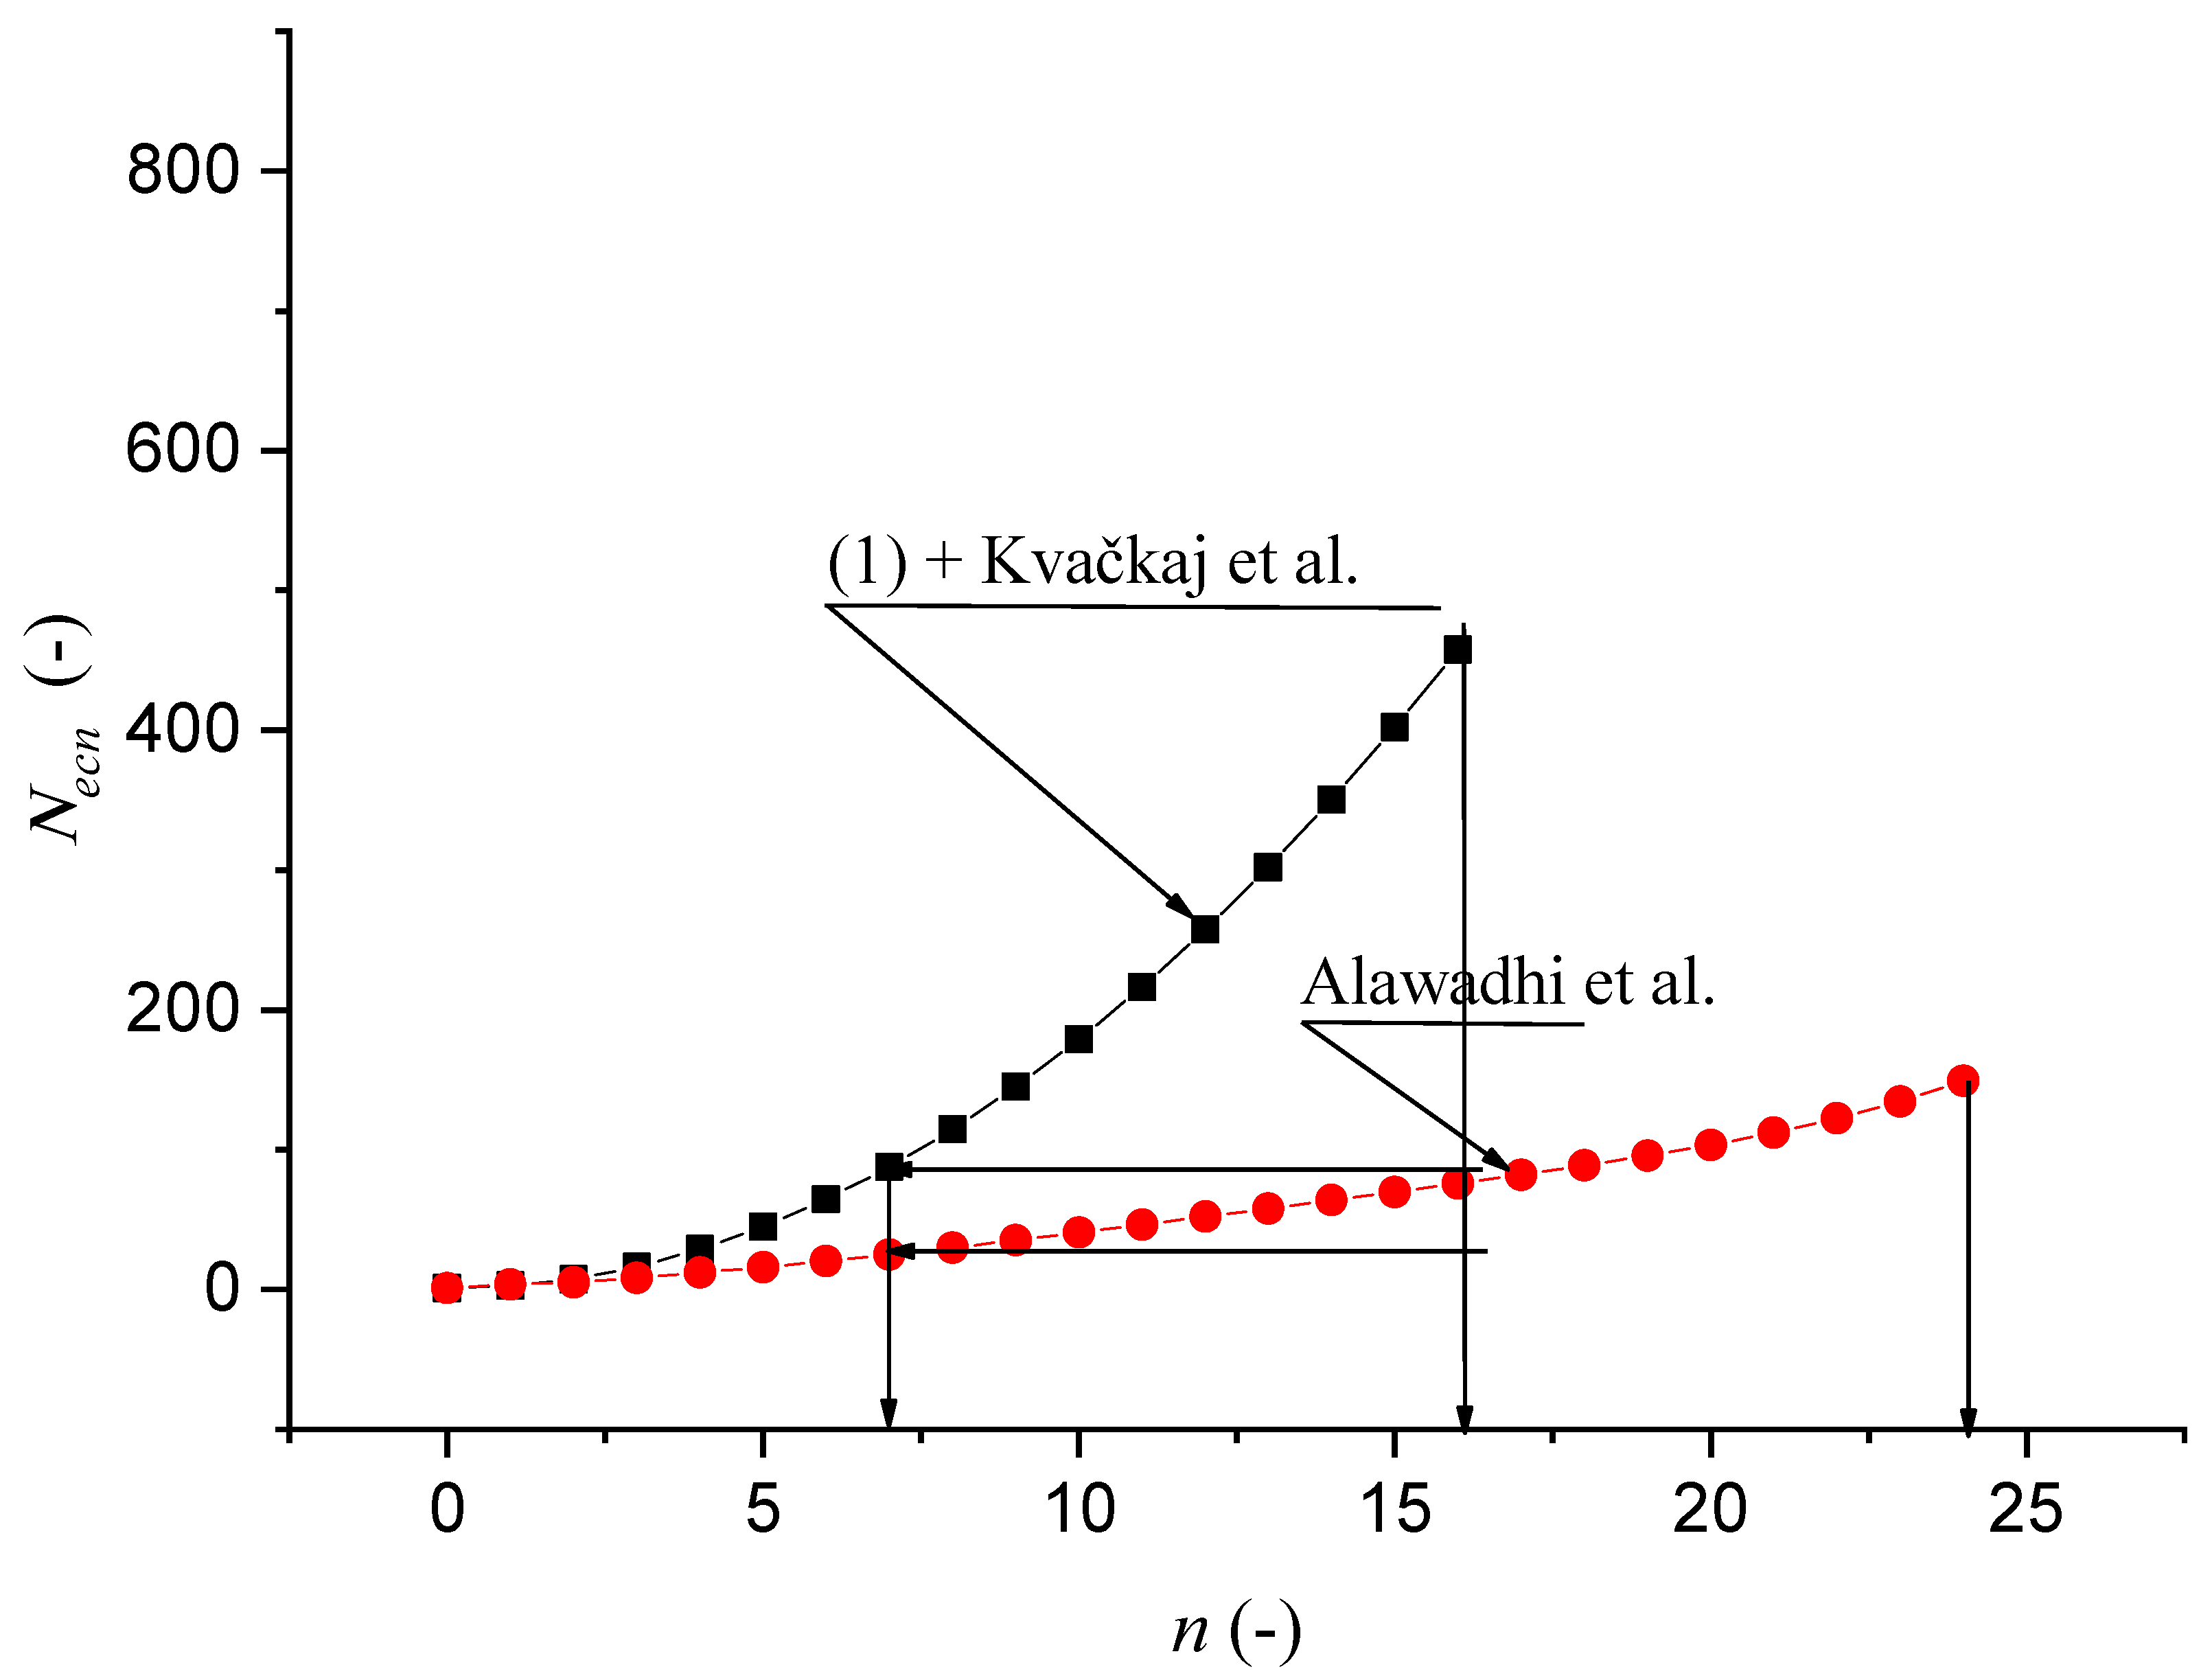
4.3. Comparison of Author’s Own Investigations with Literature
5. Evaluation of Results and Discussion
6. Conclusions
Author Contributions
Funding
Institutional Review Board Statement
Informed Consent Statement
Data Availability Statement
Conflicts of Interest
References
- Watanabe, T.; Tsurekawa, S.; Zhao, X.; Zuo, L. The Coming of Grain Boundary Engineering in the 21st Century. In Microstructure and Texture in Steels: And Other Materials; Haldar, A., Suwas, S., Bhattacharjee, D., Eds.; Springer Science & Business Media: London, UK, 2009; pp. 43–79. [Google Scholar]
- Hansen, N. Hall–Petch relation and boundary strengthening. Scr. Mater. 2004, 51, 801–806. [Google Scholar] [CrossRef]
- Segal, V. Review: Modes and Processes of Severe Plastic Deformation (SPD). Materials 2018, 11, 1175. [Google Scholar] [CrossRef] [Green Version]
- Keshtiban, P.M.; Behnagh, R.A.; Alimirzaloo, V. Routes Investigation in Equal Channel Multi-angular Pressing Process of UFG Al−3% Mg Alloy Strips. Trans. Indian Inst. Met. 2018, 71, 659–664. [Google Scholar] [CrossRef]
- Łyszkowski, R.; Czujko, T.; Varin, R.A. Multi-axial forging of Fe 3 Al-base intermetallic alloy and its mechanical properties. J. Mater. Sci. 2017, 52, 2902–2914. [Google Scholar] [CrossRef] [Green Version]
- Edalati, K.; Horita, Z. A review on high-pressure torsion (HPT) from 1935 to 1988. Mater. Sci. Eng. A 2016, 652, 325–352. [Google Scholar] [CrossRef]
- Zhou, W.; Yu, J.; Lin, J.; Dean, T.A. Manufacturing a curved profile with fine grains and high strength by differential velocity sideways extrusion. Int. J. Mach. Tools Manuf. 2019, 140, 77–88. [Google Scholar] [CrossRef]
- Zrník, J.; Kraus, L.; Prnka, T.; Šperlink, K. Preparation of Ultrafine Grains and Nanocrystalline Metallic Materials by Extreme Plastic Deformation and Their Properties; Repronis: Ostrava, Check Republic, 2007; p. 76. ISBN 978-80-7329-153-2. [Google Scholar]
- Segal, V.M.; Reznikov, V.I.; Drobyshevskiy, A.E.; Kopylov, V.I. Plastic working of metals by simple shear. Russ. Metal. 1981, 1, 99–105. [Google Scholar]
- Valiev, R.Z.; Langdon, T.G. Principles of equal-channel angular pressing as a processing tool for grain refinement. Prog. Mater. Sci. 2006, 51, 881–981. [Google Scholar] [CrossRef]
- Valiev, R.Z.; Krasilnikov, N.A.; Tsenev, N.K. Plastic deformation of alloys with submicron-grained structure. Mater. Sci. Eng. A 1991, 137, 35–40. [Google Scholar] [CrossRef]
- Valiev, R.Z.; Korznikov, A.V.; Mulyukov, R.R. Structure and properties of ultrafine-grained materials produced by severe plastic deformation. Mater. Sci. Eng. A 1993, 186, 141–148. [Google Scholar] [CrossRef]
- Sabirov, I.; Enikeev, N.A.; Murashkin, M.Y.; Valiev, R.Z. Bulk Nanostructured Materials with Multifunctional Properties; Springer International Publishing: Berlin, Germany, 2015. [Google Scholar]
- Harničárová, M.; Valíček, J.; Kušnerová, M.; Kopal, I.; Litecká, J.; Kadnár, M.; Kmec, J.; Palková, Z. Prediction of shortening and material grain size after extrusion using the ECAP method. Defect Diffus. Forum 2020, 400, 91–105. [Google Scholar] [CrossRef]
- Segal, V.M. Apparatus and Method for Deformation Processing of Metals, Ceramics, Plastics and Other Materials. U.S. Patent 5,400,633, 28 March 1995. [Google Scholar]
- Stecher, G.; Thomson, P. Improved Channel Processing. Patent Int. Publication No. WO 03/027337, 1 April 2003. [Google Scholar]
- Markušev, V.M.; Sloboda, V.N.; Kaibyshev, O. A Method for Deformation Processing of Materials and Apparatus for Its Realization. Russian Patent No. 2146571, 2000. [Google Scholar]
- Liu, Z.Y.; Liang, G.X.; Wang, E.D.; Wang, Z.R. The effect of cumulative large plastic strain on the structure and properties of a Cu–Zn alloy. Mater. Sci. Eng. A. 1998, 242, 137–140. [Google Scholar] [CrossRef]
- Krallics, G.; Szeles, Z.; Semenova, I.P.; Dotsenko, T.V.; Alexandrov, A.I.V. Experimental Investigations of the Al-Mg-Si Alloy Subjected to Equal-Channel Angular Pressing. In Nanomaterials by Severe Plastic Deformation; Zehetbauer, M., Valiev, R.Z., Eds.; Wiley-VCH Verlag GmbH & Co.: Weinheim, Germany, 2004; pp. 183–189. [Google Scholar]
- Raab, G.I.; Krasilnikov, N.A.; Valiev, R.Z. Processing Ultrafine-Grained Copper by ECAP with Controlled Back-Pressure. Ultrafine Grained Materials III. In Proceedings of the 2004 TMS Annual Meeting, Charlette, NC, USA, 14–18 March 2004; pp. 137–143. [Google Scholar]
- Ponce-Peña, P.; López-Chipres, E.; García-Sánchez, E.; Escobedo-Bretado, M.A.; Ochoa-Salazar, B.X.; González-Lozano, M.A. Optimized design of an ECAP die using the finite element method for obtaining nanostructured materials. Adv. Mater. Sci. Eng. 2015, 2015, 1–8. [Google Scholar] [CrossRef] [Green Version]
- Djavanroodi, F.; Ebrahimi, M. Effect of die parameters and material properties in ECAP with parallel channels. Mater. Sci. Eng. A 2010, 527, 7593–7599. [Google Scholar] [CrossRef]
- Ahmadi, F.; Farzin, M. Investigation of a new route for equal channel angular pressing process using three-dimensional finite element method. Proc. Inst. Mech. Eng. B J. Eng. Manuf. 2014, 228, 765–774. [Google Scholar] [CrossRef]
- Parshikov, R.A.; Rudskoy, A.I.; Zolotov, A.M.; Tolochko, O.V. Technological problems of equal channel angular pressing. Rev. Adv. Mater. Sci. 2013, 34, 26–36. [Google Scholar]
- Prangnell, P.B.; Harris, C.; Roberts, S.M. Finite element modelling of equal channel angular extrusion. Scr. Mater. 1997, 37, 983–989. [Google Scholar] [CrossRef]
- Tong, L.B.; Zheng, M.Y.; Hu, X.S.; Wu, K.; Xu, S.W.; Kamado, S.; Kojima, Y. Influence of ECAP routes on microstructure and mechanical properties of Mg–Zn–Ca alloy. Mater. Sci. Eng. A 2010, 527, 4250–4256. [Google Scholar] [CrossRef]
- Lee, B.S.; Cho, H. Influence of ECAP routes on the microstructure and mechanical properties of hot extruded 3003 Al alloy. Solid State Phenom. 2007, 124, 1397–1400. [Google Scholar] [CrossRef]
- Stolyarov, V.V.; Zhu, Y.T.; Alexandrov, I.V.; Lowe, T.C.; Valiev, R.Z. Influence of ECAP routes on the microstructure and properties of pure Ti. Mater. Sci. Eng. A 2001, 299, 59–67. [Google Scholar] [CrossRef]
- Gajanan, M.N.; Narendranath, S.; Kumar, S.S. (2019, March). Influence of ECAP processing routes on microstructure mechanical properties and corrosion behavior of AZ80 Mg alloy. AIP Conf. Proc. 2019, 2082, 030016. [Google Scholar]
- Irfan, O.M.; Al-Mufadi, F.; Al-Shataif, Y.; Djavanroodi, F. Effect of Equal Channel Angular Pressing (ECAP) on Erosion-Corrosion of Pure Copper. Appl. Sci. 2017, 7, 1250. [Google Scholar] [CrossRef] [Green Version]
- Valiev, R.Z.; Alexandrov, I.V.; Zhu, Y.T.; Lowe, T.C. Paradox of strength and ductility in metals processed by severe plastic deformation. J. Mater. Res. 2002, 17, 5–8. [Google Scholar] [CrossRef] [Green Version]
- Bhargava, S.; Nigam, V.; Arora, K.; Sahai, A.; Sharma, R.S.; HansRaj, K. An Analysis on the Deformation of Pure Copper during Multi-pass Equal Channel Angular Extrusion. Procedia Mater. Sci. 2014, 5, 719–725. [Google Scholar] [CrossRef]
- Švec, J.; Szkandera, P.; Rusz, S.; Hilšer, O.; Petrů, J. Refining structure of copper by SPD process. IOP Conf. Ser. Mater. Sci. Eng. 2019, 461, 1–6. [Google Scholar] [CrossRef]
- Zhang, M.; Liu, L.; Liang, S.; Li, J. Evolution in Microstructures and Mechanical Properties of Pure Copper Subjected to Severe Plastic Deformation. Met. Mater. Int. 2020, 26, 1585–1595. [Google Scholar] [CrossRef]
- Harnicarova, M.; Valicek, J.; Kušnerová, M.; Kmec, J.; Palková, Z.; Kopal, I.; Krmela, J.; Panda, A. Study of the influence of the structural grain size on the mechanical properties of technical materials. Mater. und Werkst. 2019, 50, 635–645. [Google Scholar] [CrossRef]
- Valíček, J.; Cep, R.; Rokosz, K.; Lukianowicz, C.; Kozak, D.; Zeleňák, M.; Koštial, P.; Hloch, S.; Harničárová, M.; Hlaváček, P.; et al. New way to take control of a structural grain size in the formation of nanomaterials by extrusion. Mater. und Werkst. 2012, 43, 405–411. [Google Scholar] [CrossRef]
- Valíček, J.; Borovička, A.; Hloch, S.; Hlaváček, P. Method for the Design of a Technology for the Abrasive Waterjet Cutting of Materials. U.S. Patent 9,073,175, 7 July 2015. [Google Scholar]
- Valíček, J.; Borovička, A.; Hloch, S.; Hlaváček, P. Method for the Design of a Technology for the Abrasive Waterjet Cutting of Materials Kawj. Czech Republic Patent CZ 305514 B6, 23 July 2010. [Google Scholar]
- Chang, C.P.; Sun, P.L.; Kao, P.W. Deformation induced grain boundaries in commercially pure aluminium. Acta Mater. 2000, 48, 3377–3385. [Google Scholar] [CrossRef]
- Cheng, G.M.; Jian, W.W.; Xu, W.Z.; Yuan, H.; Millett, P.C.; Zhu, Y.T. Grain size effect on deformation mechanisms of nanocrystalline bcc metals. Mater. Res. Lett. 2013, 1, 26–31. [Google Scholar] [CrossRef] [Green Version]
- Valíček, J.; Harničárová, M.; Öchsner, A.; Hutyrová, Z.; Kušnerová, M.; Tozan, H.; Michenka, V.; Šepelák, V.; Mita’, D.; Zajac, J. Quantifying the mechanical properties of materials and the process of elastic-plastic deformation under external stress on material. Materials 2015, 8, 7401–7422. [Google Scholar] [CrossRef] [PubMed] [Green Version]
- Valíček, J.; Czán, A.; Harničárová, M.; Šajgalík, M.; Kušnerová, M.; Czánová, T.; Kopal, I.; Gombár, M.; Kmec, J.; Šafář, M. A new way of identifying, predicting and regulating residual stress after chip-forming machining. Int. J. Mech. Sci. 2019, 155, 343–359. [Google Scholar] [CrossRef]
- Kvačkaj, T.; Kočiško, R.; Besterci, M.; Donič, T.; Pokorný, I.; Kuskulič, T.; Sülleiová, K.; Molnárová, M.; Kováčová, M.; Kvačkaj, M. Influence of SPD by ECAP on Cu Properties. Mater. Sci. Forum. 2008, 584–586, 310–314. [Google Scholar] [CrossRef]
- Alawadhi, M.Y.; Sabbaghianrad, S.; Huang, Y.; Langdon, T.G. Evaluating the paradox of strength and ductility in ultrafine-grained oxygen-free copper processed by ECAP at room temperature. Mater. Sci. Eng. A. 2021, 802, 140546. [Google Scholar] [CrossRef]
- Greger, M.; Kawulok, R. Processing of Commercial Purity Titanium by ECAP Using a 90 Degrees Die at 350 °C Temperature. Hutn. Listy 2017, 6, 74–78. [Google Scholar]


| n | Ematn | εPLnM | DgrnM | FecnM | ReM | UZvlnM |
|---|---|---|---|---|---|---|
| (-) | (GPa) | (-) | (µm) | (kN) | (MPa) | (m∙s−1) |
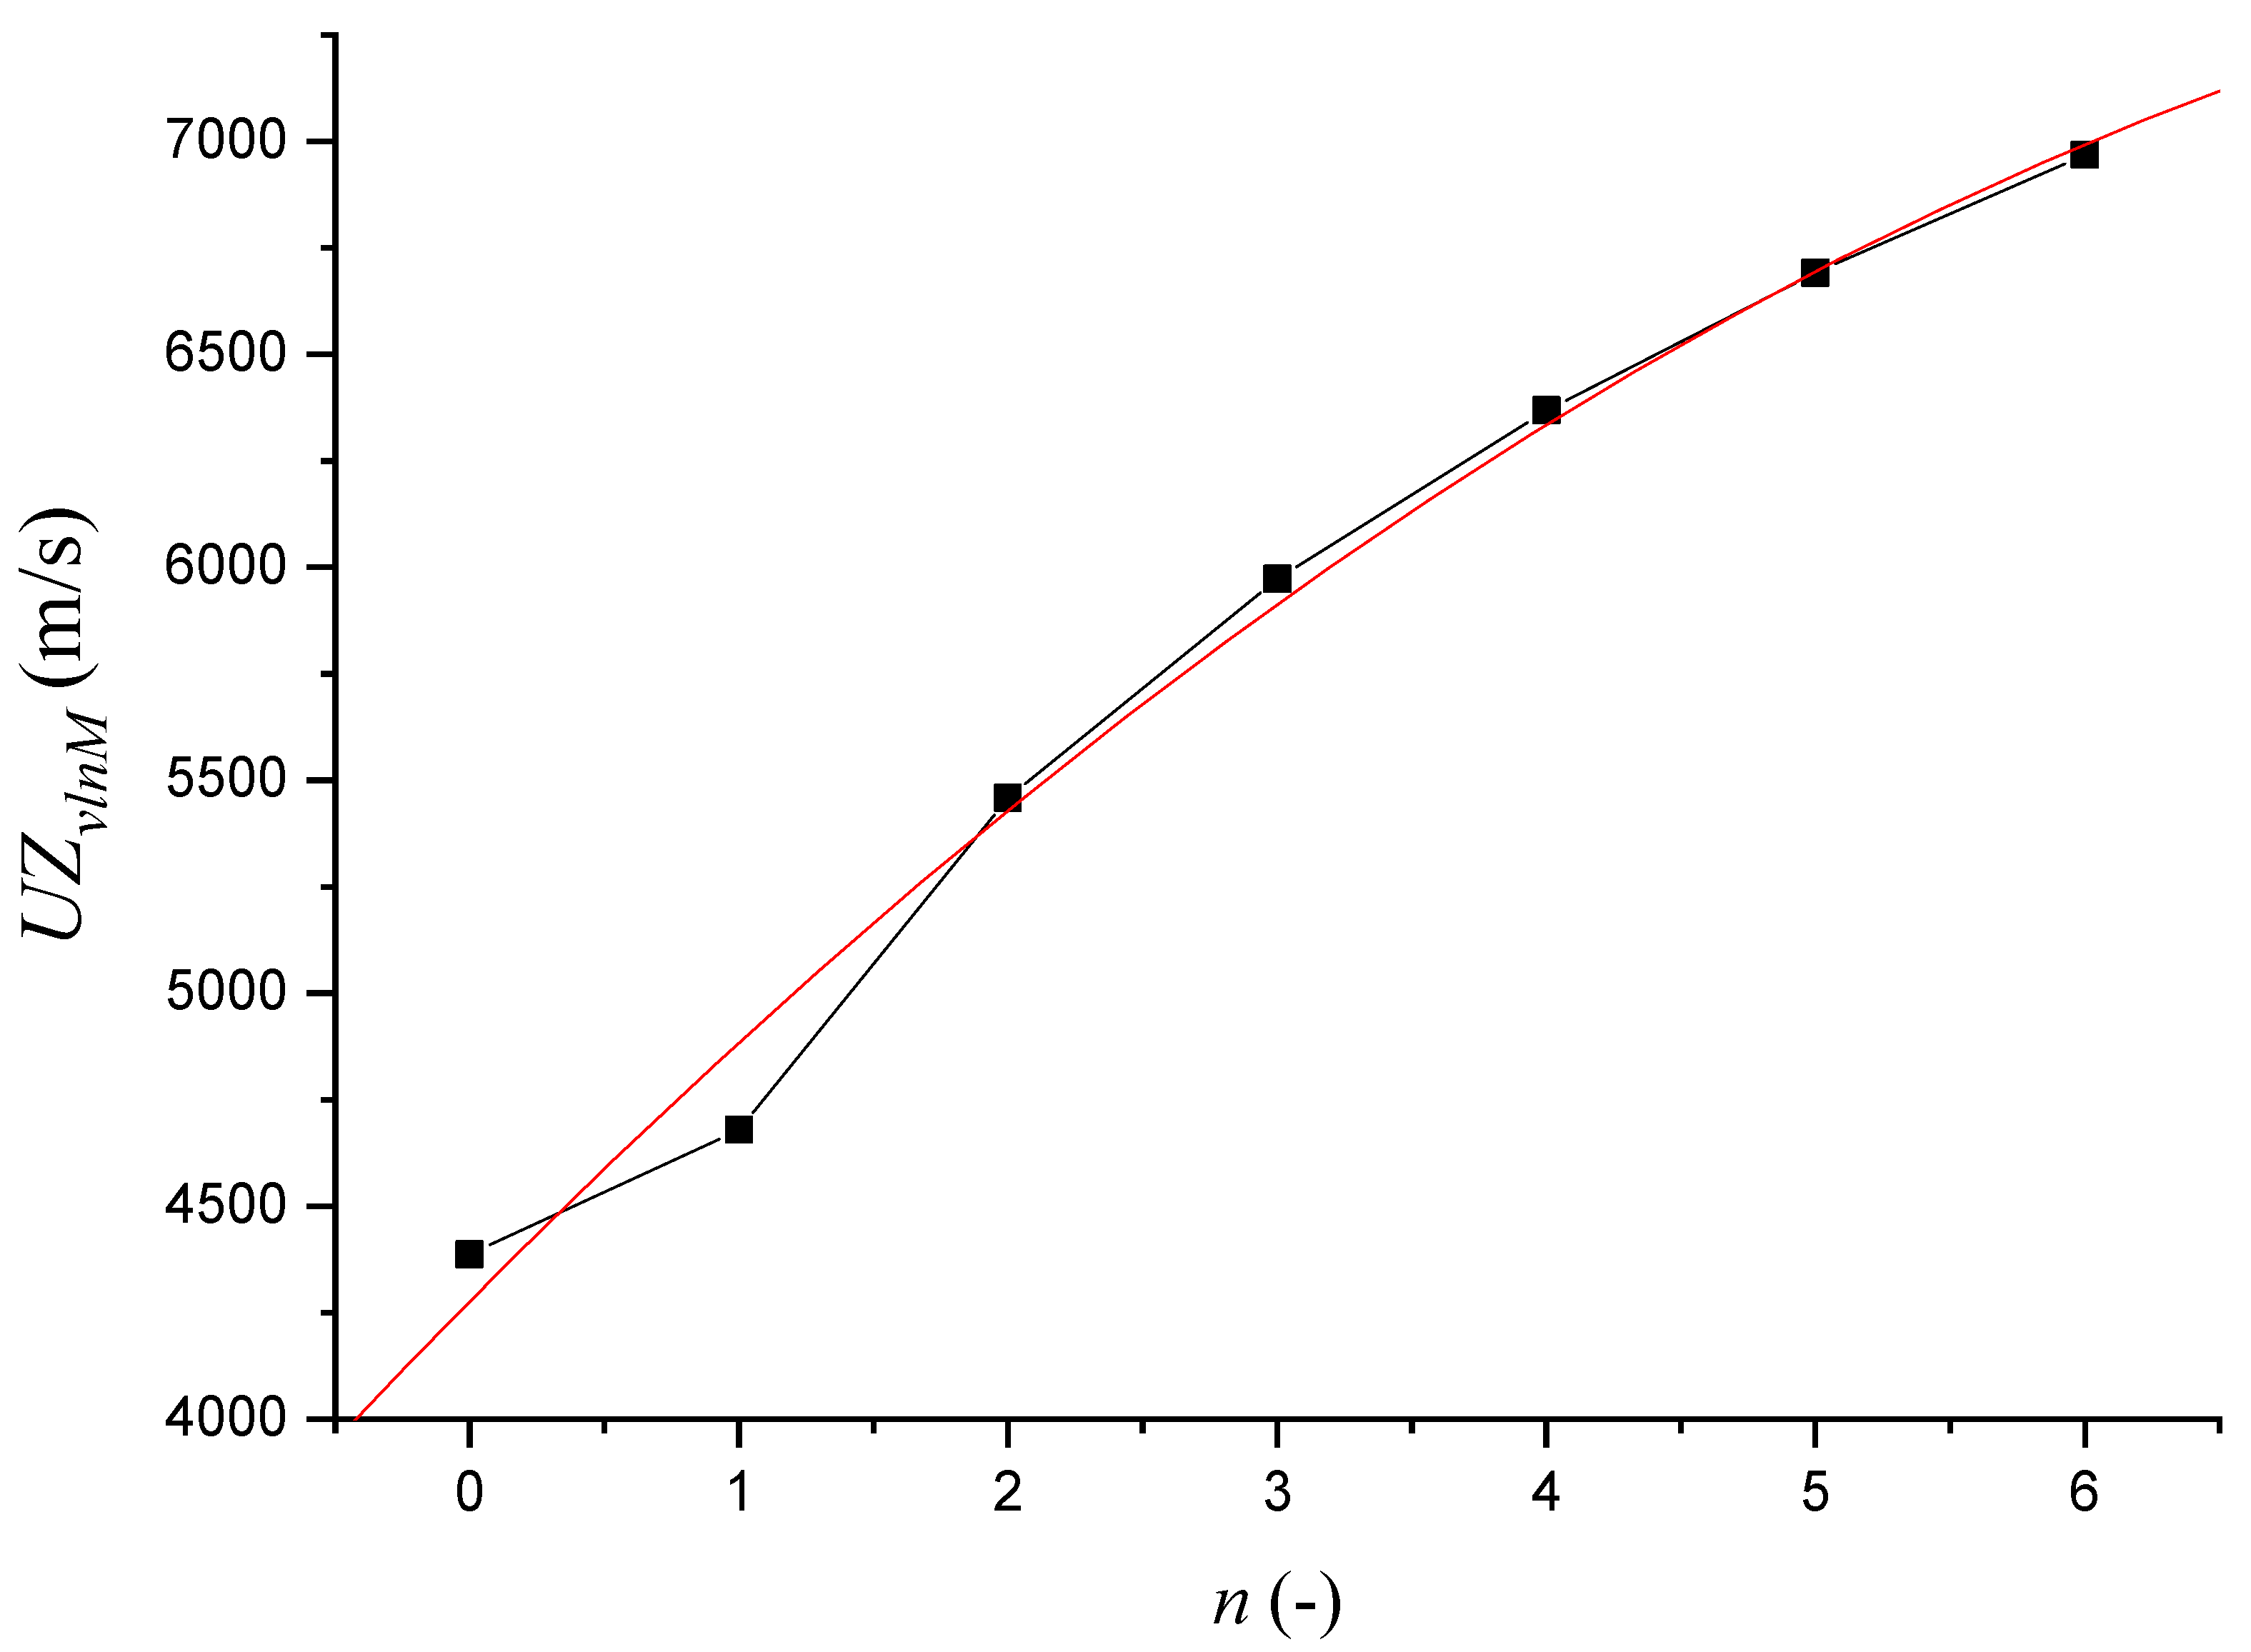
| 0 | 84.5 | 1.00 | 12.740 | 0 | 110.00 | 4387 |
| 1 | 102.5 | 1.50 | 3.244 | 110 | 148.00 | 4679 |
| 2 | 162.7 | 3.93 | 1.177 | 216 | 164.30 | 5459 |
| 3 | 213.1 | 10.83 | 0.605 | 397 | 177.20 | 5973 |
| 4 | 258.2 | 21.05 | 0.367 | 579 | 188.40 | 6368 |
| 5 | 299.6 | 34.55 | 0.248 | 760 | 198.60 | 6691 |
| 6 | 338.3 | 51.38 | 0.178 | 942 | 208.20 | 6968 |
| n | Ematn | εPLnP | DgrnP | FecnP | ReP | UZvlnP |
|---|---|---|---|---|---|---|
| (-) | (GPa) | (-) | (µm) | (kN) | (GPa) | (m∙s−1) |
| 7 | 374.9 | 71.46 | 0.134 | 1123 | 217.40 | 7211 |
| 8 | 409.9 | 94.91 | 0.105 | 1305 | 226.30 | 7428 |
| 9 | 443.3 | 121.58 | 0.084 | 1486 | 235.00 | 7625 |
| 10 | 475.6 | 151.64 | 0.067 | 1668 | 243.70 | 7806 |
| 11 | 506.8 | 184.90 | 0.056 | 1849 | 252.40 | 7973 |
| 12 | 537.1 | 221.45 | 0.049 | 2030 | 261.10 | 8128 |
| 13 | 566.5 | 261.42 | 0.042 | 2212 | 270.00 | 8274 |
| 14 | 595.2 | 304.56 | 0.036 | 2393 | 279.20 | 8412 |
| 15 | 623.2 | 351.14 | 0.032 | 2575 | 288.60 | 8542 |
| 16 | 650.6 | 400.87 | 0.028 | 2756 | 298.60 | 8665 |
| 17 | 677.4 | 454.05 | 0.025 | 2938 | 309.00 | 8783 |
| 18 | 703.8 | 510.38 | 0.022 | 3119 | 320.30 | 8895 |
| 19 | 729.6 | 570.17 | 0.020 | 3301 | 332.50 | 9002 |
| 20 | 755.0 | 633.09 | 0.018 | 3482 | 346.00 | 9106 |
| 21 | 779.9 | 699.49 | 0.017 | 3664 | 361.40 | 9205 |
| 22 | 804.5 | 769.00 | 0.015 | 3845 | 379.30 | 9301 |
| 23 | 828.7 | 841.80 | 0.014 | 4026 | 401.10 | 9393 |
| 24 | 852.5 | 918.11 | 0.013 | 4208 | 429.60 | 9482 |
| 25 | 876.1 | 997.50 | 0.012 | 4389 | 470.90 | 9568 |
| 26 | 899.3 | 1080.42 | 0.011 | 4571 | 547.70 | 9652 |
Publisher’s Note: MDPI stays neutral with regard to jurisdictional claims in published maps and institutional affiliations. |
© 2021 by the authors. Licensee MDPI, Basel, Switzerland. This article is an open access article distributed under the terms and conditions of the Creative Commons Attribution (CC BY) license (https://creativecommons.org/licenses/by/4.0/).
Share and Cite
Harničárová, M.; Valíček, J.; Kušnerová, M.; Palková, Z.; Kopal, I.; Borzan, C.; Kadnár, M.; Paulovič, S. A New Method of Predicting the Structural and Mechanical Change of Materials during Extrusion by the Method of Multiple Plastic Deformations. Materials 2021, 14, 2594. https://0-doi-org.brum.beds.ac.uk/10.3390/ma14102594
Harničárová M, Valíček J, Kušnerová M, Palková Z, Kopal I, Borzan C, Kadnár M, Paulovič S. A New Method of Predicting the Structural and Mechanical Change of Materials during Extrusion by the Method of Multiple Plastic Deformations. Materials. 2021; 14(10):2594. https://0-doi-org.brum.beds.ac.uk/10.3390/ma14102594
Chicago/Turabian StyleHarničárová, Marta, Jan Valíček, Milena Kušnerová, Zuzana Palková, Ivan Kopal, Cristina Borzan, Milan Kadnár, and Stanislav Paulovič. 2021. "A New Method of Predicting the Structural and Mechanical Change of Materials during Extrusion by the Method of Multiple Plastic Deformations" Materials 14, no. 10: 2594. https://0-doi-org.brum.beds.ac.uk/10.3390/ma14102594