
Luminescence Properties and Judd–Ofelt Analysis of Various ErF3 Concentration-Doped BaF2 Crystals


1
Faculty of Physics, West University of Timisoara, 4 Bd.V. Parvan, 300223 Timisoara, Romania
2
National Institute of Research & Development for Electrochemistry and Condensed Matter—INCEMC Timisoara, 144 Aurel Păunescu-Podeanu Street, 300569 Timisoara, Romania
*
Author to whom correspondence should be addressed.
Materials 2021, 14(15), 4221; https://0-doi-org.brum.beds.ac.uk/10.3390/ma14154221
Submission received: 9 June 2021
/
Revised: 13 July 2021
/
Accepted: 23 July 2021
/
Published: 28 July 2021
(This article belongs to the Special Issue Growth and Characterization of Bulk Crystals)
Abstract
:The influence of erbium ion concentration on the optical properties of BaF2:ErF3 crystals was investigated. Four ErF3 concentration (0.05, 0.08, 0.15 and 0.5 mol% ErF3)-doped BaF2 crystals were obtained using the Bridgman technique. Room temperature optical absorption in the 250–850 nm spectral range was measured, and the photoluminescence (PL) and decay times were also investigated. The Judd–Ofelt (JO) approximation was used, taking into account four absorption peaks (at 377, 519, 653 and 802 nm). The JO intensity parameters, Ωt (t = 2, 4, 6), were calculated. The influence of the ErF3 concentration on the JO parameters, branching ratio, radiative transition probability and radiative lifetime were studied. The obtained results were compared with measured values and with those reported in the literature. Under excitation at 380 nm, the well-known green (539 nm) and red (668 nm) emissions were obtained. The calculated and experimental radiative lifetimes were in millisecond range for green and red emissions. The intensity of the PL spectra varied with the Er3+ ion concentration. The emission intensity increased linearly or exponentially, depending on the ErF3 concentration. Under excitation at 290 nm, separate to the green and red emissions, a new UV emission band (at 321 nm) was obtained. Other research has not reported the UV emission or the influence of ErF3 concentration on emission behavior.
1. Introduction
Doped fluoride (MeF2: Me = Ca, Sr, Ba) crystals have been widely studied in order to find new scintillator and laser materials. Rare-earth (RE) ion-doped fluorides (MeF2), due to their optical properties, have been studied for various applications [1]. Pure BaF2 is a good scintillator for elementary particle and γ-ray detection. The optical and luminescence behavior of RE:BaF2 crystals are less investigated than the other fluorides. To keep the charge neutrality of the MeF2 lattice, the RE3+ ions dissolved in MeF2 need charge compensation. As a result, isolated centers, such as Oh, C4v and C3v, and clusters will appear [2]. Using a site-selective laser excitation method, Wells [3] proved that, in the case of BaF2, the dominant center has C3v symmetry for low ErF3 concentrations (<0.1 mol%). The dielectric relaxation studies [4,5,6,7] also pointed out that only trigonal C3v (NNN) centers are created.
The search for laser materials with UV emissions is a current necessity. In the context of the Covid pandemic, UV radiation is important for air purification. It has also been proved that UV radiation may be used for tissue treatments, for skin diseases, such as lymphoma, vitiligo and psoriasis [8].
Our preliminary luminescence experiments on a 0.2 mol% ErF3:BaF2 sample showed emission in the near-UV domain [9]. The Er3+:MeF2 crystals were studied for their properties that are good for cascade excitation [10,11,12]. Under excitation at 805 nm, Patel et al. [13] demonstrated that BaF2:Er3+ crystals generate red, green and UV emissions more efficiently than the CaF2:Er3+ crystals. Wojtowicz [14] identified emission bands in VIS, UV and VUV spectral regions by excitation in the VUV domain. The green and red emissions observed by Zhang et al. [15] in Er3+:BaF2 crystals were very weak in comparison with those obtained for Er3+:BaCl2 crystals. The emission bands were obtained by 808 nm excitation. The green emission is the strongest by 976 nm excitation (the 2H1/2, 4S11/2 → 4I15/2 transition). Bitam et al. [16] investigated the luminescence properties of BaF2: 2 mol% ErF3 crystals. They observed a red emission, 200 times weaker than the green emission, under excitation at 378 nm. The emission spectrum of Tb3+-doped BaF2 observed by Witkowski and Wojtowicz [17] consisted of blue and green emissions. Orlovskii et al. [18] investigated BaF2:(0.35–1.3 at.% HoF3 and 0.3–2.1 at.% TmF3) crystals, using sensitization of Ho3+ fluorescence by Tm3+. By excitation at 980 nm, two emissions were reported by [19] in SrGe4O9:Er3+, Yb3+ phosphors. The influence of Yb3+ concentration on the green (551 nm) and red (662 nm) emissions were studied. As the YbF3 concentration exceeded 5 at.%, the red band became more intense than the green band. The Near Infrared (NIR) emission, due to Er3+ ions, increased five times as the YbF3 concentration increased. The strongest upconversion was obtained for the S8 at.% YbF3-doped sample.
Only a few papers that analyze the luminescence of the RE:BaF2 crystals, especially doped with Er3+ ions, can be found in the literature. The reported investigations refer to crystals doped with a high RE concentration. The influence of Er3+ ion concentration in BaF2 on the luminescence properties of this material has not yet been reported. The Judd–Ofelt (JO) semi-empirical analysis [20,21] allows the calculation of the transition probabilities, branching-ratios and radiative lifetimes in RE-doped materials using only the optical absorption spectra. Bitam et al. [16], using the JO method, reported the calculated and experimental radiative lifetime of Er3+ states and the quantum efficiency in the case of 2 mol% Er3+-doped BaF2. The JO intensity parameters Ωi (i = 2, 3, 4) for Er3+ ions of f-f transitions and comparative analysis of the calculated and measured lifetimes were studied by Stef et al. [9] for BaF2: 0.2 mol% ErF3 and by Preda et al. [22] for Er3+:CaF2.
The goal of this paper is to investigate the optical and luminescence behavior of low ErF3 concentration (0.05–0.5 mol%)-doped BaF2 crystals. To achieve these objectives, optical absorption and photoluminescence (PL) measurements were taken, and the Judd–Ofelt (JO) model was used to obtain information about the luminescence properties of the Er3+:BaF2 crystals. The obtained theoretical values were compared with the experimental results. We focused on the influence of ErF3 concentration on the optical and luminescence behavior. To our knowledge, no other report on this behavior can be found in the literature.
2. Materials and Methods
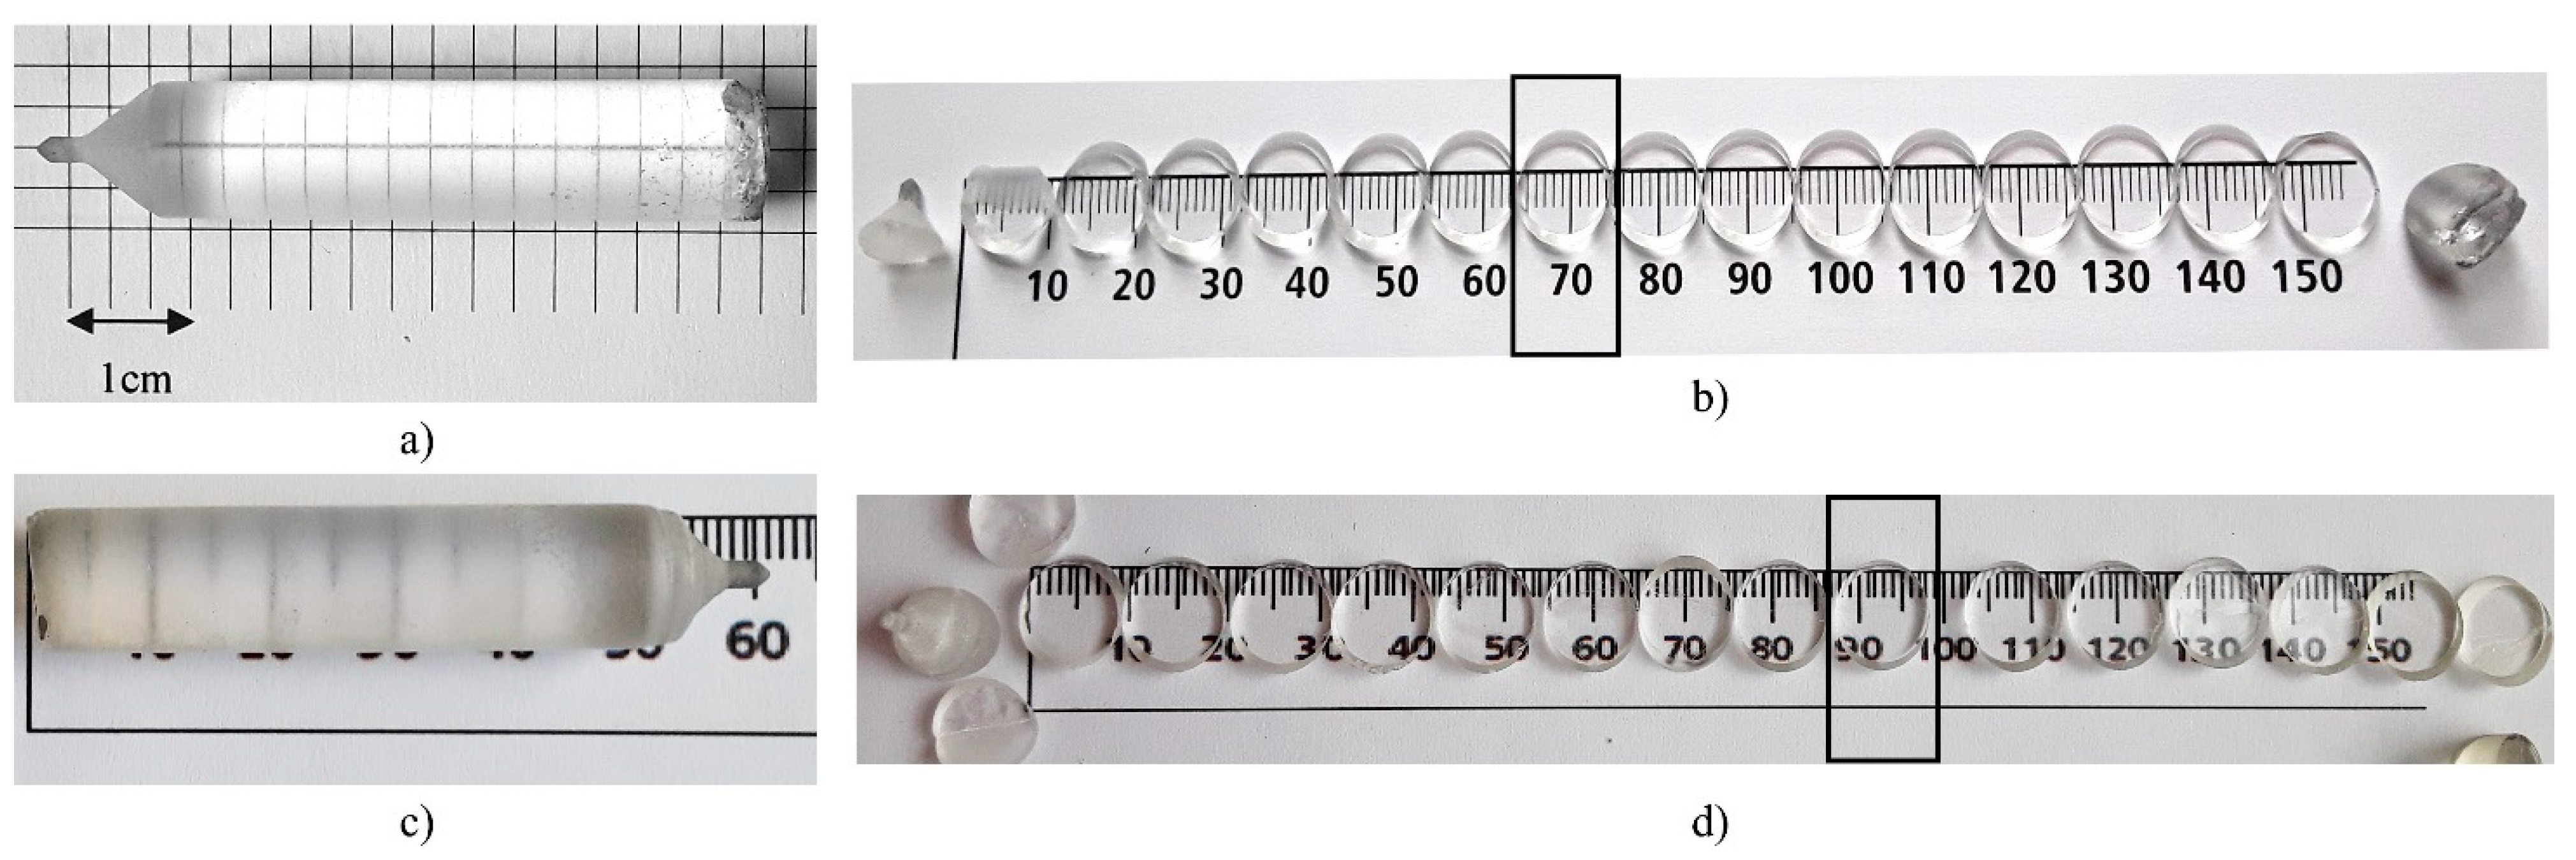
In order to obtain the four ErF3-doped BaF2 crystals, the Stockbarger–Bridgman method was used. Crushed BaF2 optical UV-VIS windows (Crystran Ltd. UK) were used as raw material. We aimed to investigate the properties of BaF2 crystals doped with low ErF3 concentrations. Therefore, first we added 0.05 mol% ErF3 to the BaF2 powder and chose a step of 0.05 mol% ErF3. The ErF3 came from Merck (99.99%). Next, we added 0.1, 0.15 mol% ErF3 and a concentration of 0.5 mol% ErF3, ten times higher than the lowest. Checking the optical absorption spectrum of the 0.1 mol% ErF3 sample and comparing it with the other samples, we found that the concentration was 0.08 mol% ErF3, due to the evaporation of the substance during the growth process. The crystals were grown in our Bridgman equipment using a shaped graphite furnace [23]. The crystals were obtained in vacuum (~10−1 Pa) using a spectral pure graphite crucible, with a pulling rate of 4 mm h−1. More details about the growth conditions are described in [7,9]. The obtained crystals were transparent, ~10 mm in diameter and ~5 cm in length, free of visible inclusions or cracks (Figure 1). In order to investigate the spectroscopic properties, the crystals were cleaved from the bottom to the top into 12–17 slices with a thickness of 2.5 mm. In order to study the influence of the ErF3 concentration on the optical absorption and emission spectra, we chose a slice from each crystal, cleaved approximately in the middle of the crystal (see Figure 1a,b,d). Some characteristics of the chosen slices are described in Table 1.
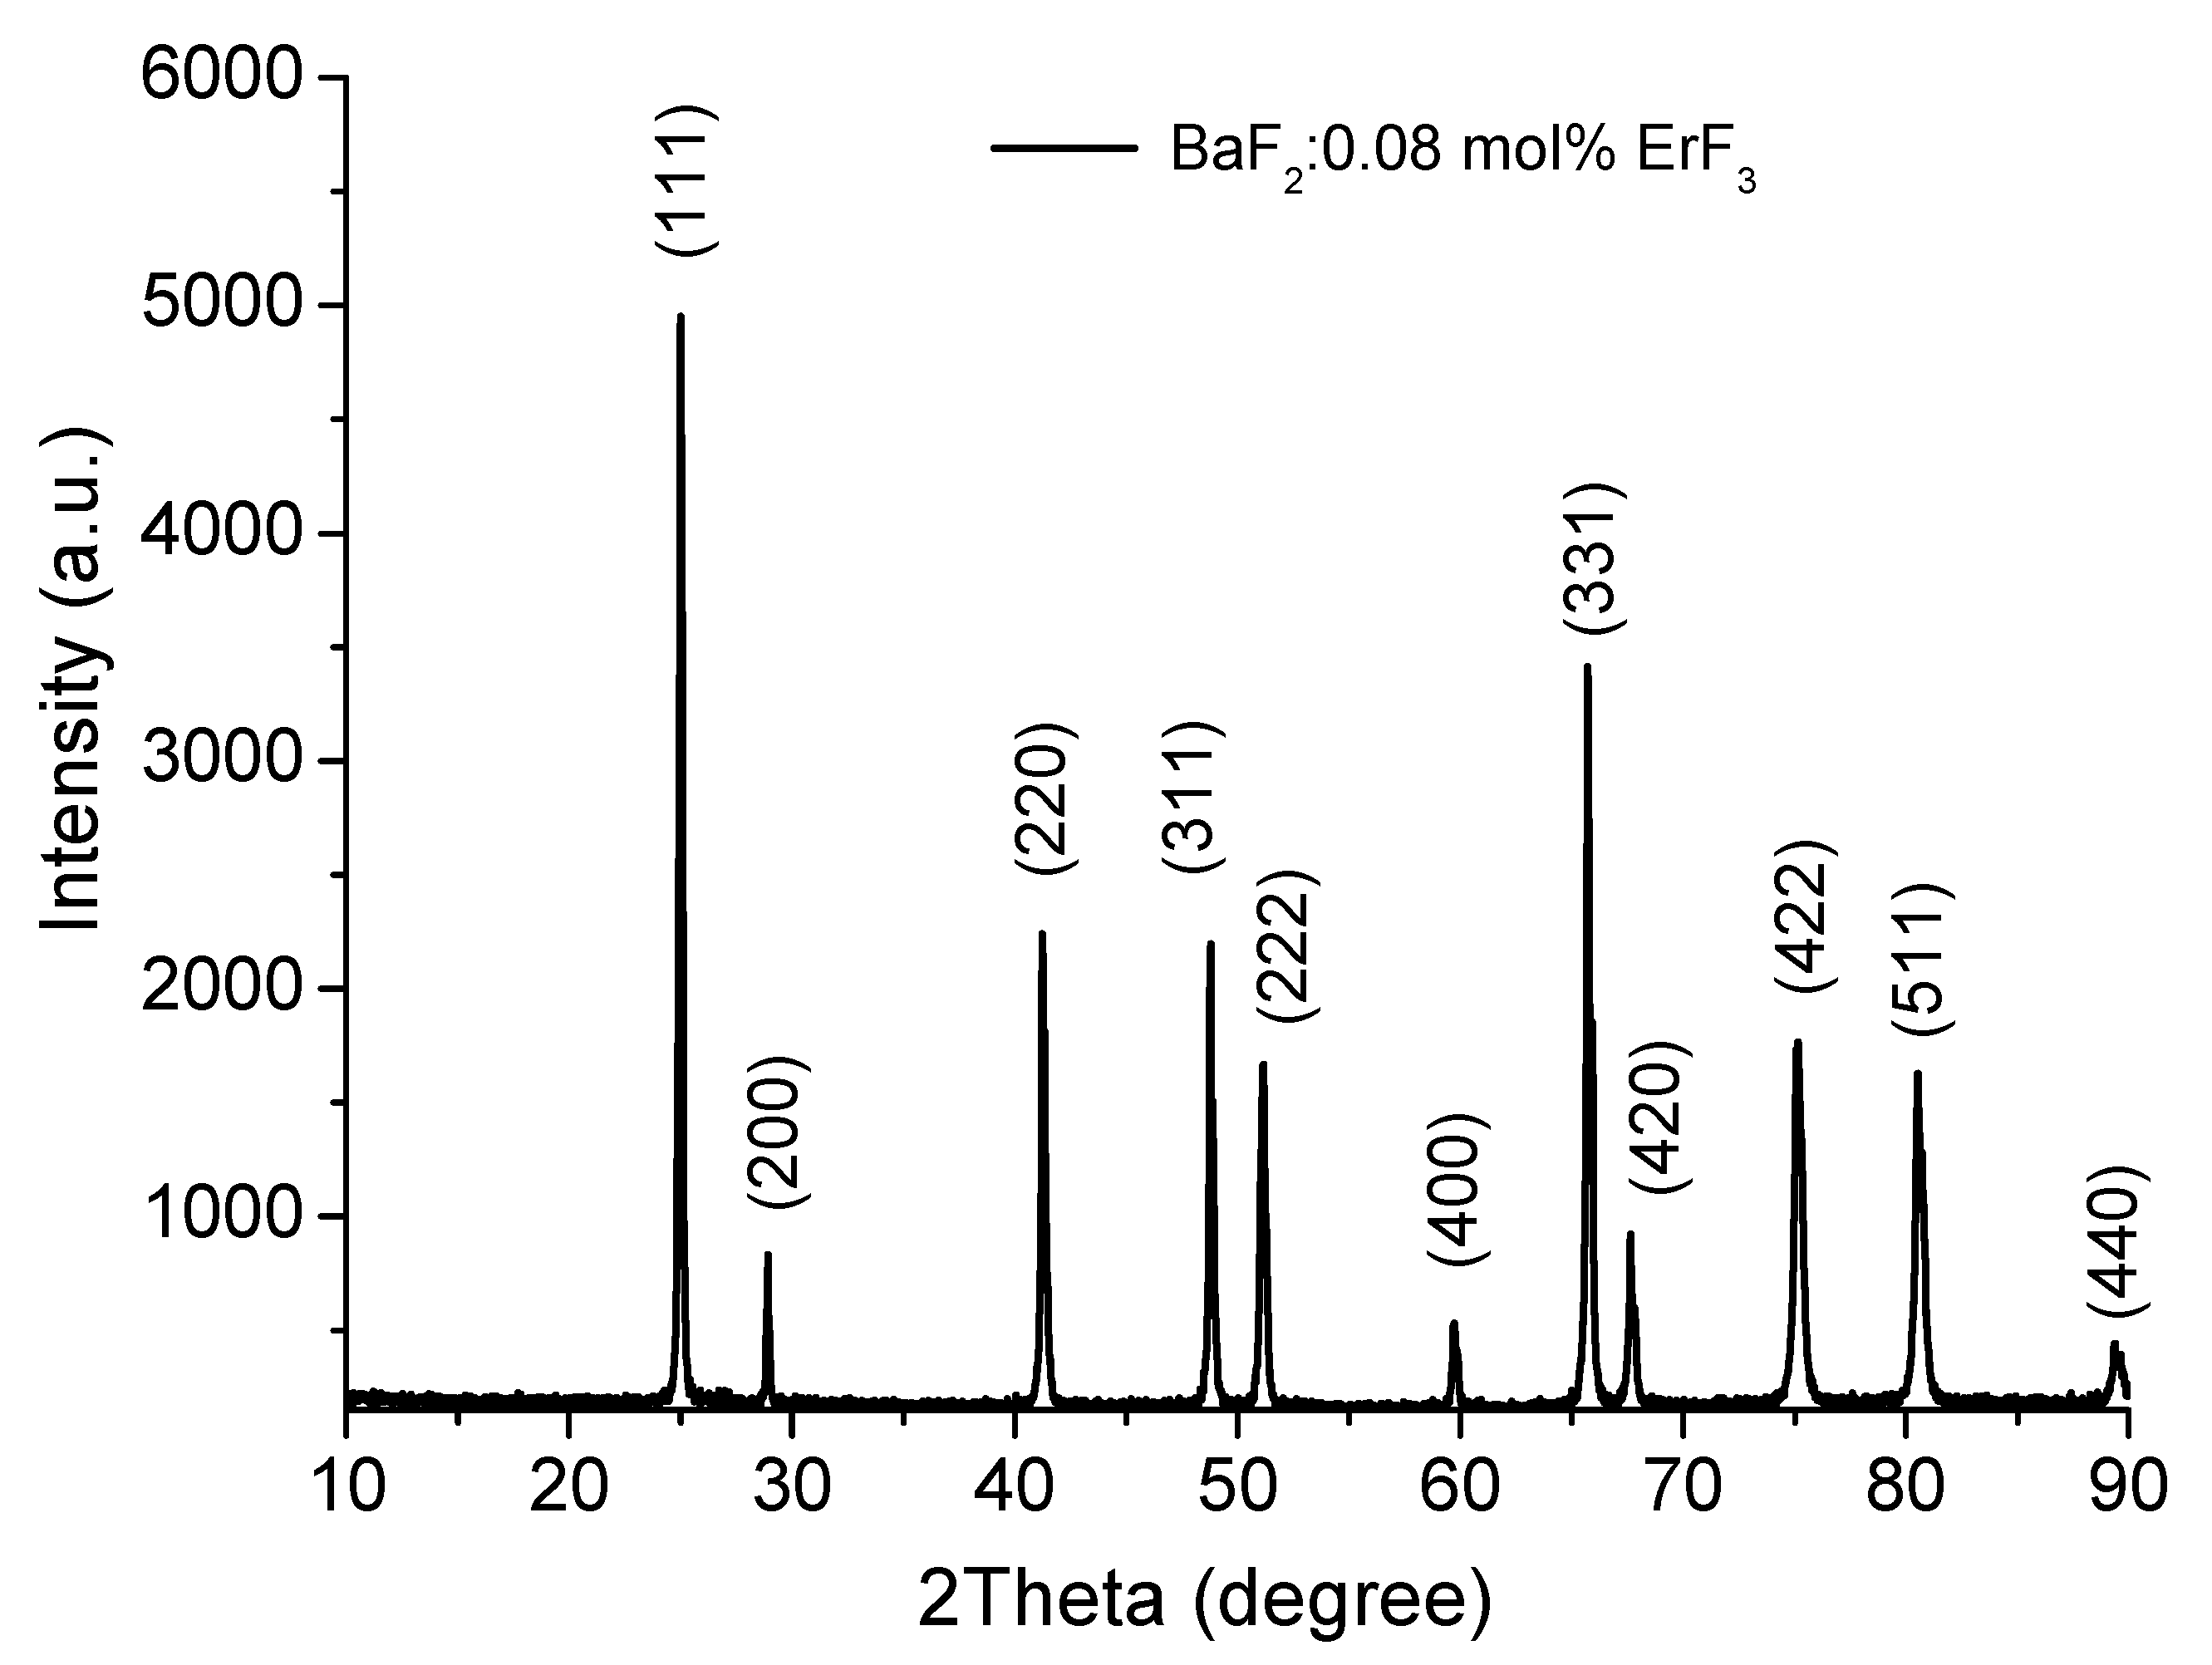
The room temperature optical absorption spectra in the 250–850 nm range were recorded using a Shimadzu 1650 PC spectrophotometer. The spectrophotometer uses an automatic correction for baseline correction. The correction subtracts the absorbance value at a specific wavelength from all wavelengths across the sample spectrum. The correction takes into account the effect of instrument noise and the light scattering due to the possible undesired particles in the sample. In order to measure the room temperature luminescence spectra in the UV-VIS domain, a FLS 980–Edinburgh Instruments spectrofluorometer was used. Stationary and time-resolved photoluminescence measurements, with a scan slit of 0.1 nm, were taken. The excitation source was an Xe lamp for CW measurements, and for photoluminescence kinetics measurements, the pulsed microseconds Xe flash-lamp µF2 and nanoseconds flash lamp nF920 was used. For stationary and time-resolved measurements, the PMT Hamamatsu R928P detector was used. To check the crystalline structure, XRD analysis was performed using an X-ray diffractometer (PW 3040/60 X’Pert PRO) with Cu-Kα radiation (λ = 1.5418 Å). Figure 2 shows the XRD pattern for the BaF2: 0.08 mol% ErF3-grinded crystal sample. The diffraction peaks correspond to the cubic phase according to ICDD Cards No 00-004-0452, No 01-085-1341 and No 00-002-1157, and in good agreement with the published data of Bitam et al. [16]. No additional peaks that can be associated with undesired impurities were observed. The crystalline planes corresponding to the peaks are shown in Figure 2. The obtained lattice parameters are a = b = c = 6.2065 Å, Fm3m space group, α = β = γ = 90°.
The radiative decay time was calculated using the instrument software F980 reconvolution fit function, taking in account the instrumental contribution IRF to the decay curve. The branching ratios, the emission transition probabilities and the radiative lifetimes were obtained using the Judd–Ofelt (JO) model [20,21]. The influence of Er3+ ion concentration on the JO parameters and on the radiative lifetime was also investigated.
3. Results
3.1. Optical Absorption Spectra
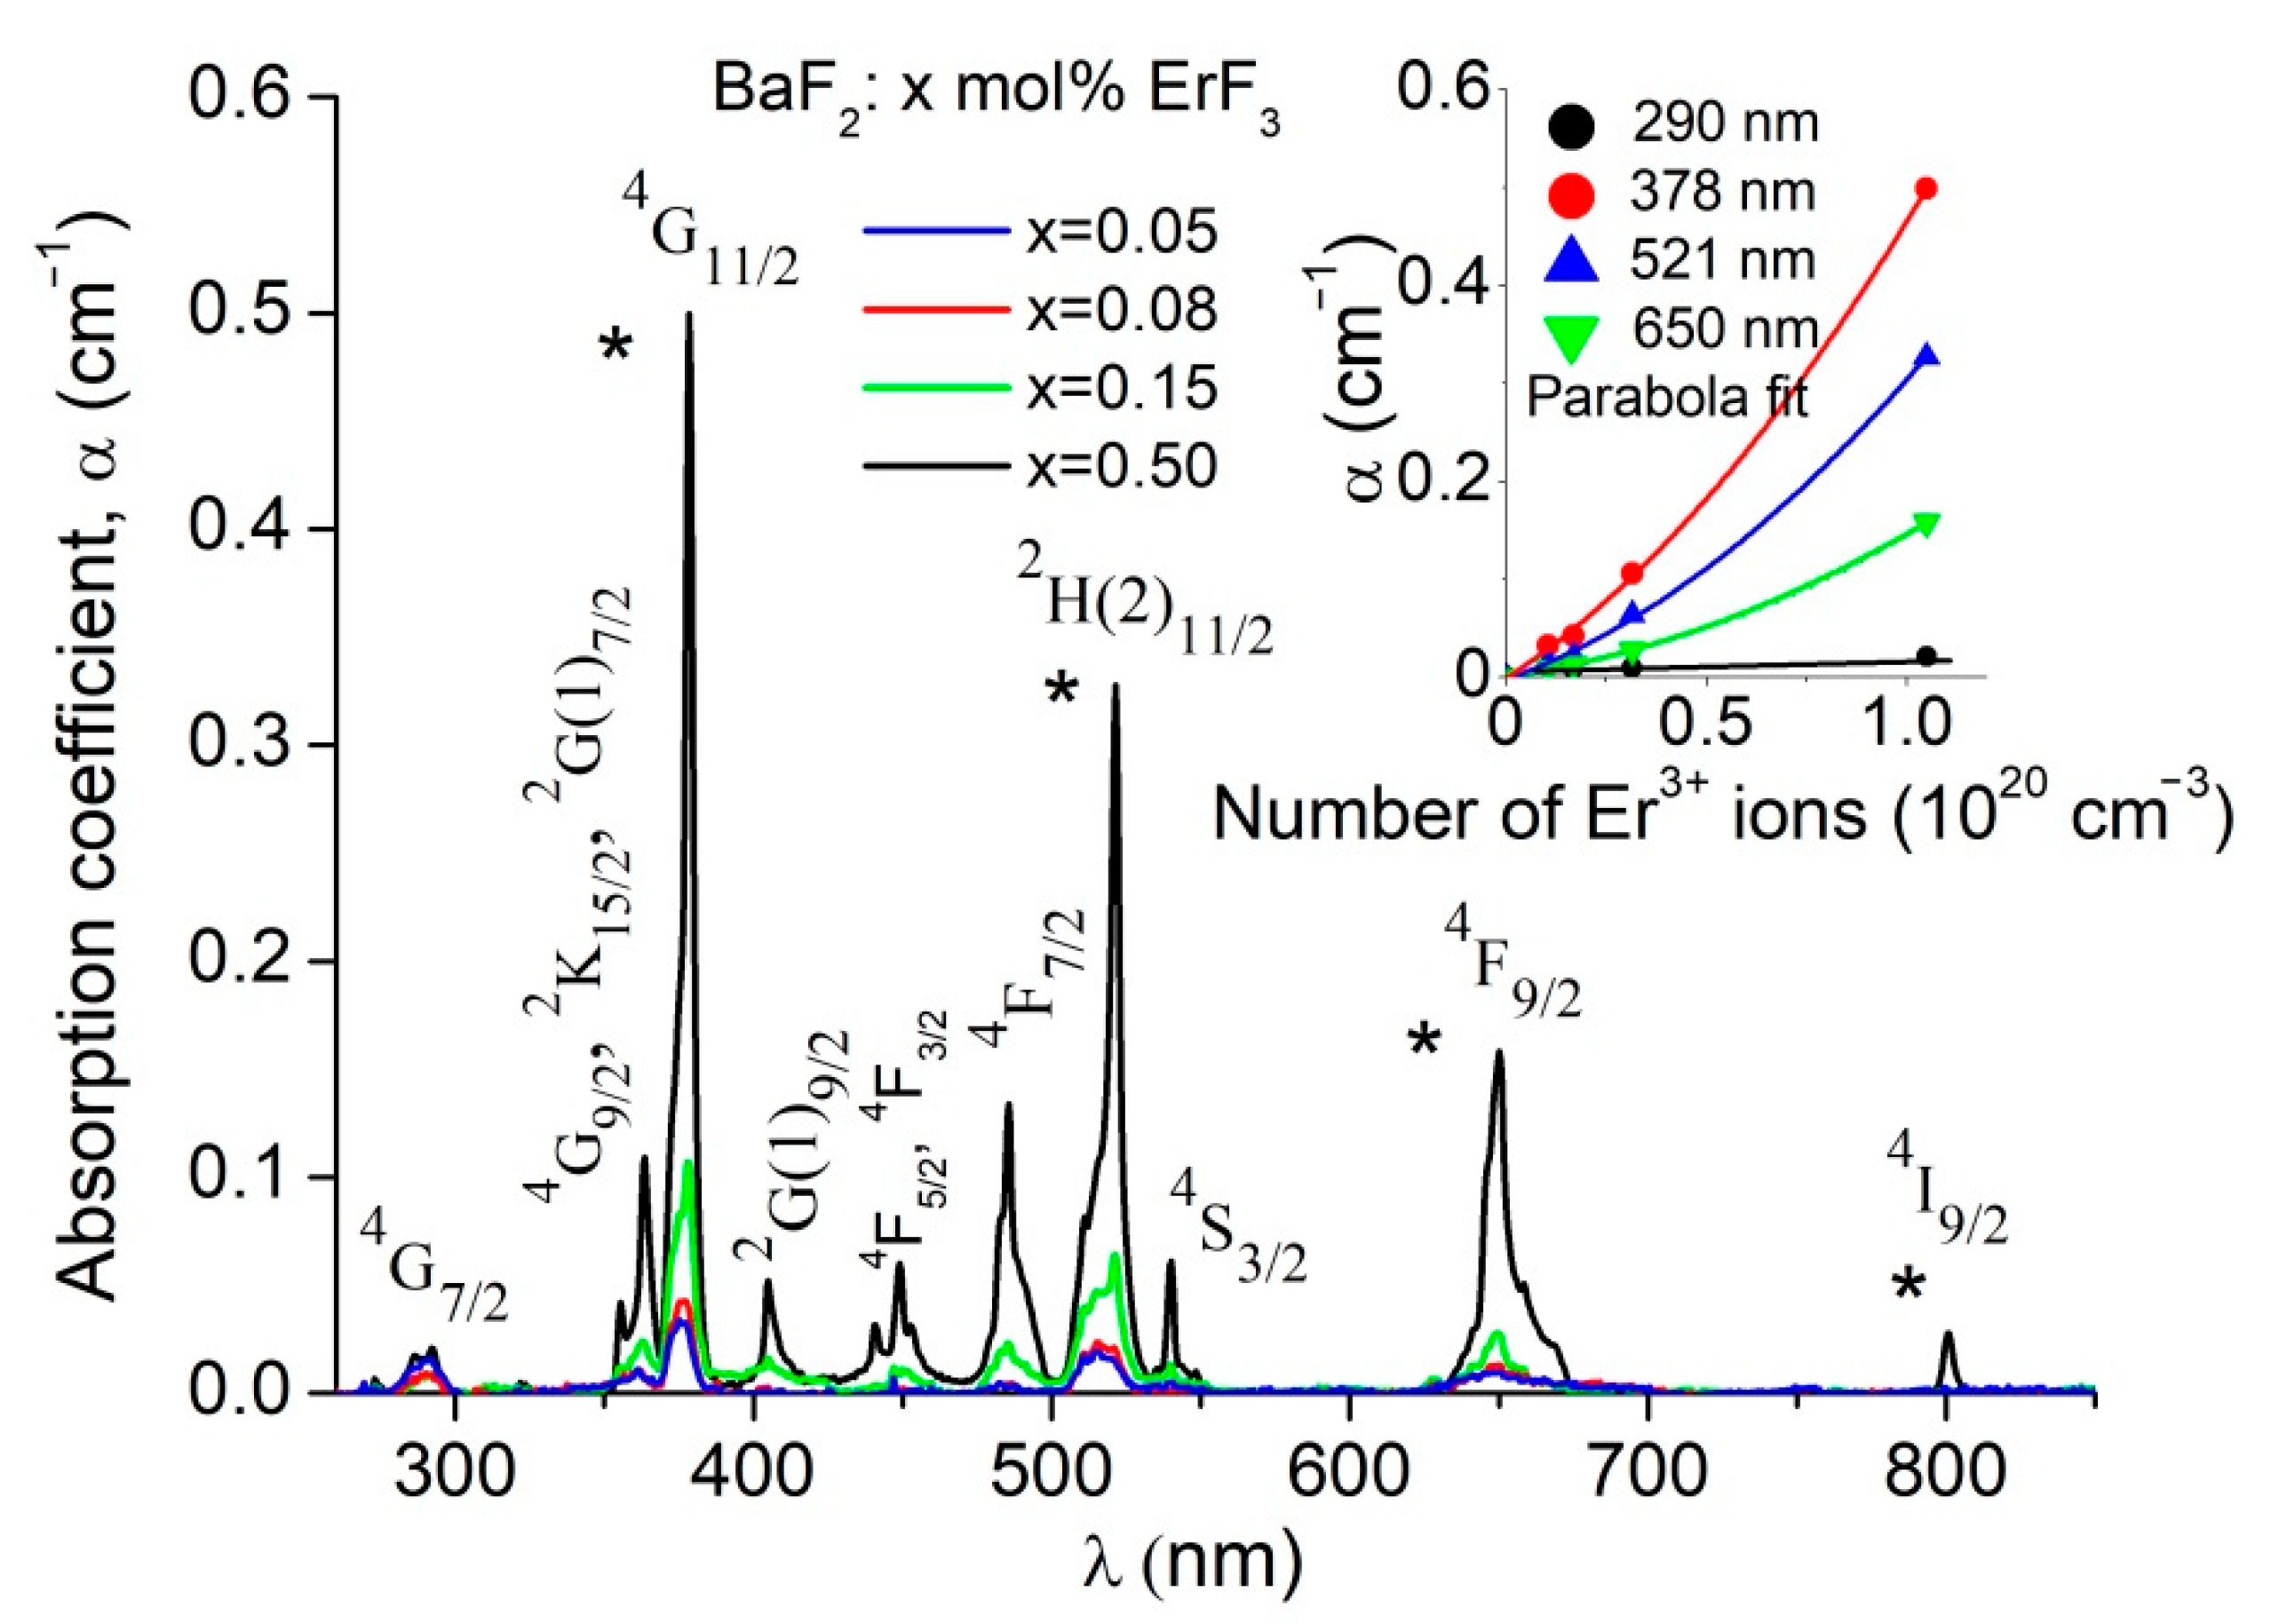
In order to study the influence of the ErF3 concentration on the optical absorption spectra, we eliminated the different backgrounds of the samples. The optical absorption spectra of the ErF3:BaF2 samples (indicated in Table 1) are shown in Figure 3. In the 250–850 nm domain, the absorption spectra consist of 10 absorption bands. The absorption bands correspond to the transitions from the 4I15/2 ground state to the Er3+ ions excited states, specified in the figure.
The absorption bands are broad and structured. Due to the charge compensation process, the energy levels of the Er3+ ions split causing the formation of broad and structured absorption bands. The most intense absorption bands peak at 378.5 nm, 521 nm and 650 nm. The intensity (the absorption coefficient, α) of these bands does not increase linearly with the ErF3 concentration (respectively, the number of ions, N, in the host), but parabolically (see the insert in Figure 3). The asterisks in the figure indicate the bands used in the JO analysis.
3.2. Judd–Ofelt Analysis
Information about the luminescence properties of rare-earth-doped fluoride can be obtained using the Judd–Ofelt model [20,21]. This approximation permits the determination of the transition probabilities using only the optical absorption spectra [10,20,21]. In order to calculate the JO intensity parameters Ω2, Ω4 and Ω6, we have used a set of four absorption bands (indicated by asterisk in Figure 3). These bands correspond to the transitions: 4115/2—4I9/2 (802 nm), 4115/2—4F9/2 (653 nm), 4115/2—2H(2)11/2 (519 nm) and 4115/2—4G11/2 (377 nm). The experimental line strength, Smeas, is obtained from the absorption spectra by calculating the absorption band area (Σ) (see Table 2).
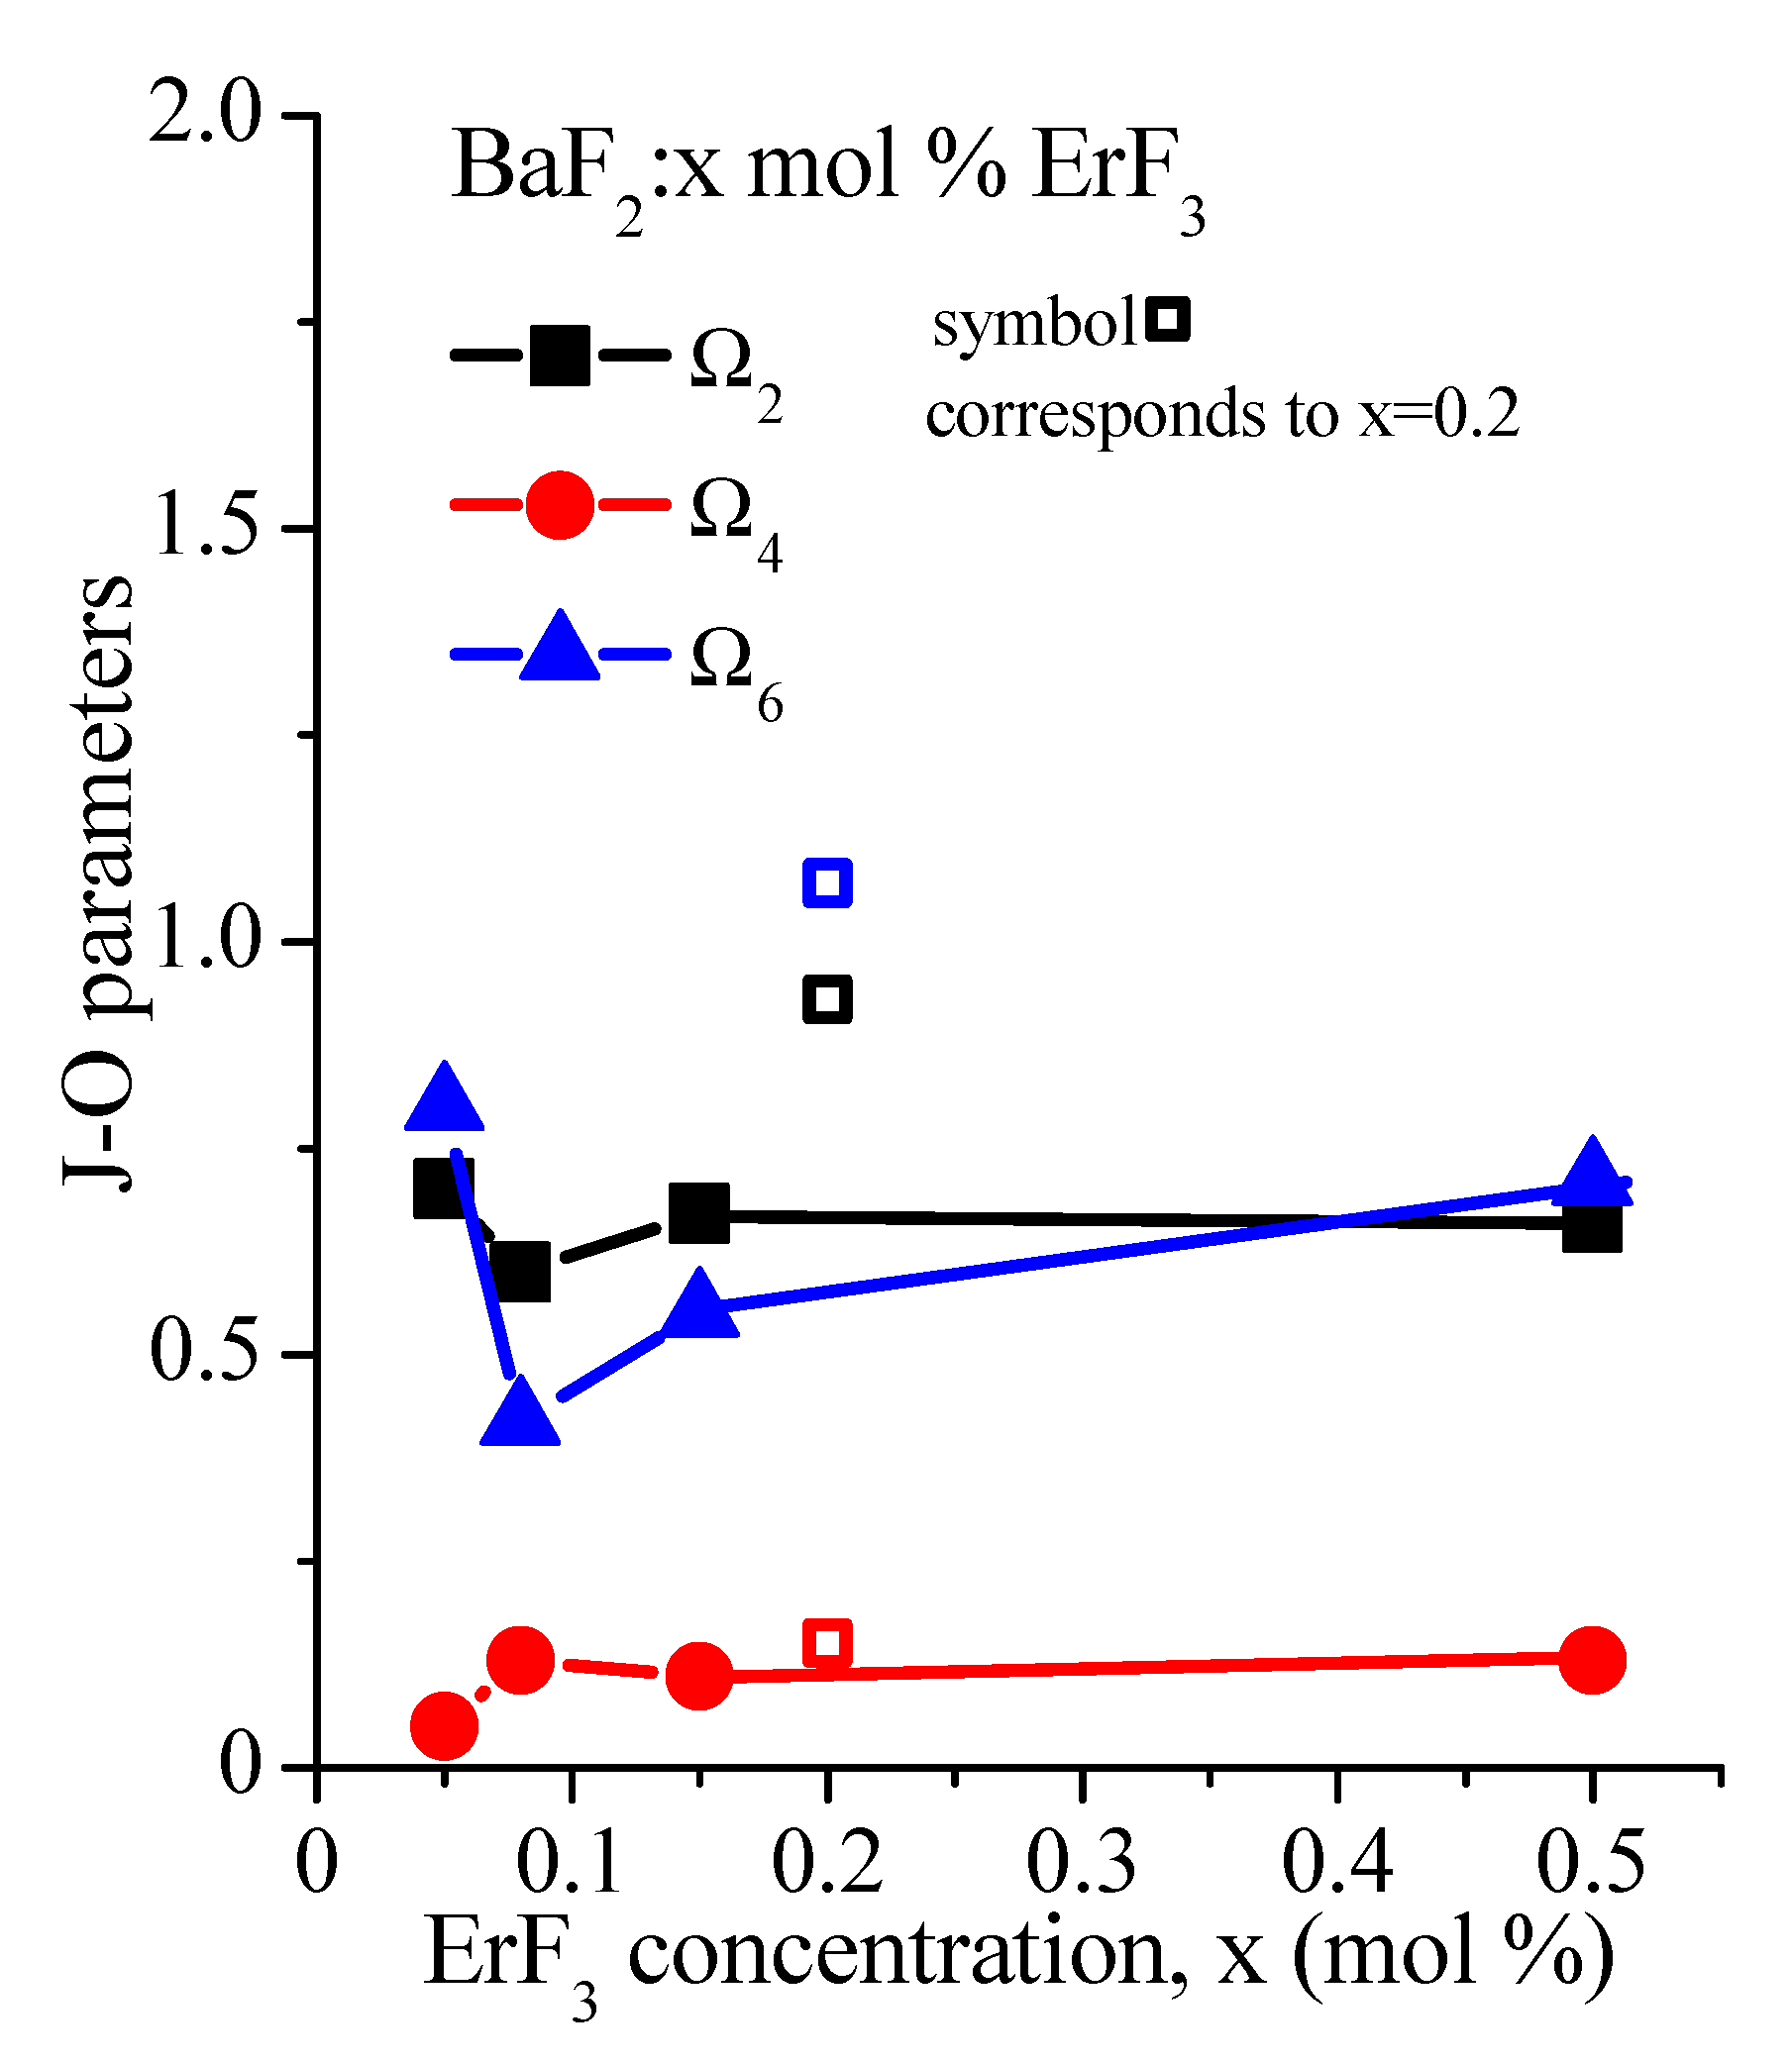
In order to obtain the JO parameters Ωi (i = 2, 4, 6) and the measured (experimental) line strength, we solved a set of four equations corresponding to the four transitions under study. These calculations were made for the four ErF3 concentration samples using the Levenberg–Marquardt algorithm. The influence of the ErF3 concentration on the obtained JO parameters is shown in Table 3 and Figure 4. The spectroscopic quality factor χ is also given. Significant errors usually occur in the estimation of JO parameters because it is difficult to obtain accurate absorption line strengths in the case of broad and structured absorption bands (as in our case), and due to the JO model itself [9].
The calculated line strength is where is the electric dipole (ed) line strength and is the contribution of the magnetic dipole (md) transition. These line strengths were calculated using JO parameters, and the values of the reduced matrix elements for the chosen Er3+ bands from those tabulated in the work of Kaminskii [10]. The measured and calculated absorption line strengths for transitions 4I15/2 → [4I9/2; 4F9/2; 2H(2)11/2; 4G11/2] are shown in Table 4. The root-mean-square deviation, defined by is a measure of the accuracy of the fit; q is the number of analyzed spectral bands (q = 4) and p is the number of the parameters sought (p = 3). The obtained values for the root-mean-square (r.m.s.) deviation are shown in Table 4.
In order to calculate the radiative lifetime (τrad) for an excited state J, we used the relationship , where AJJ′ is the spontaneous emission probability and the sum is taken over all final lower-lying states J’. The fluorescence branching ratio was estimated using the relationship . The value of the radiative emission probabilities, the branching ratios and the radiative lifetimes are given in Table 5.
A comparison of the calculated radiative lifetimes (τrad) and those measured by other authors is shown in Table 6.
The discrepancy between the calculated and measured lifetimes by other authors can indicate the existence of an energy migration, thermal coupling between manifolds and/or strong emission reabsorption that cannot be described using the JO model.
3.3. Photoluminescence and PL Kinetics
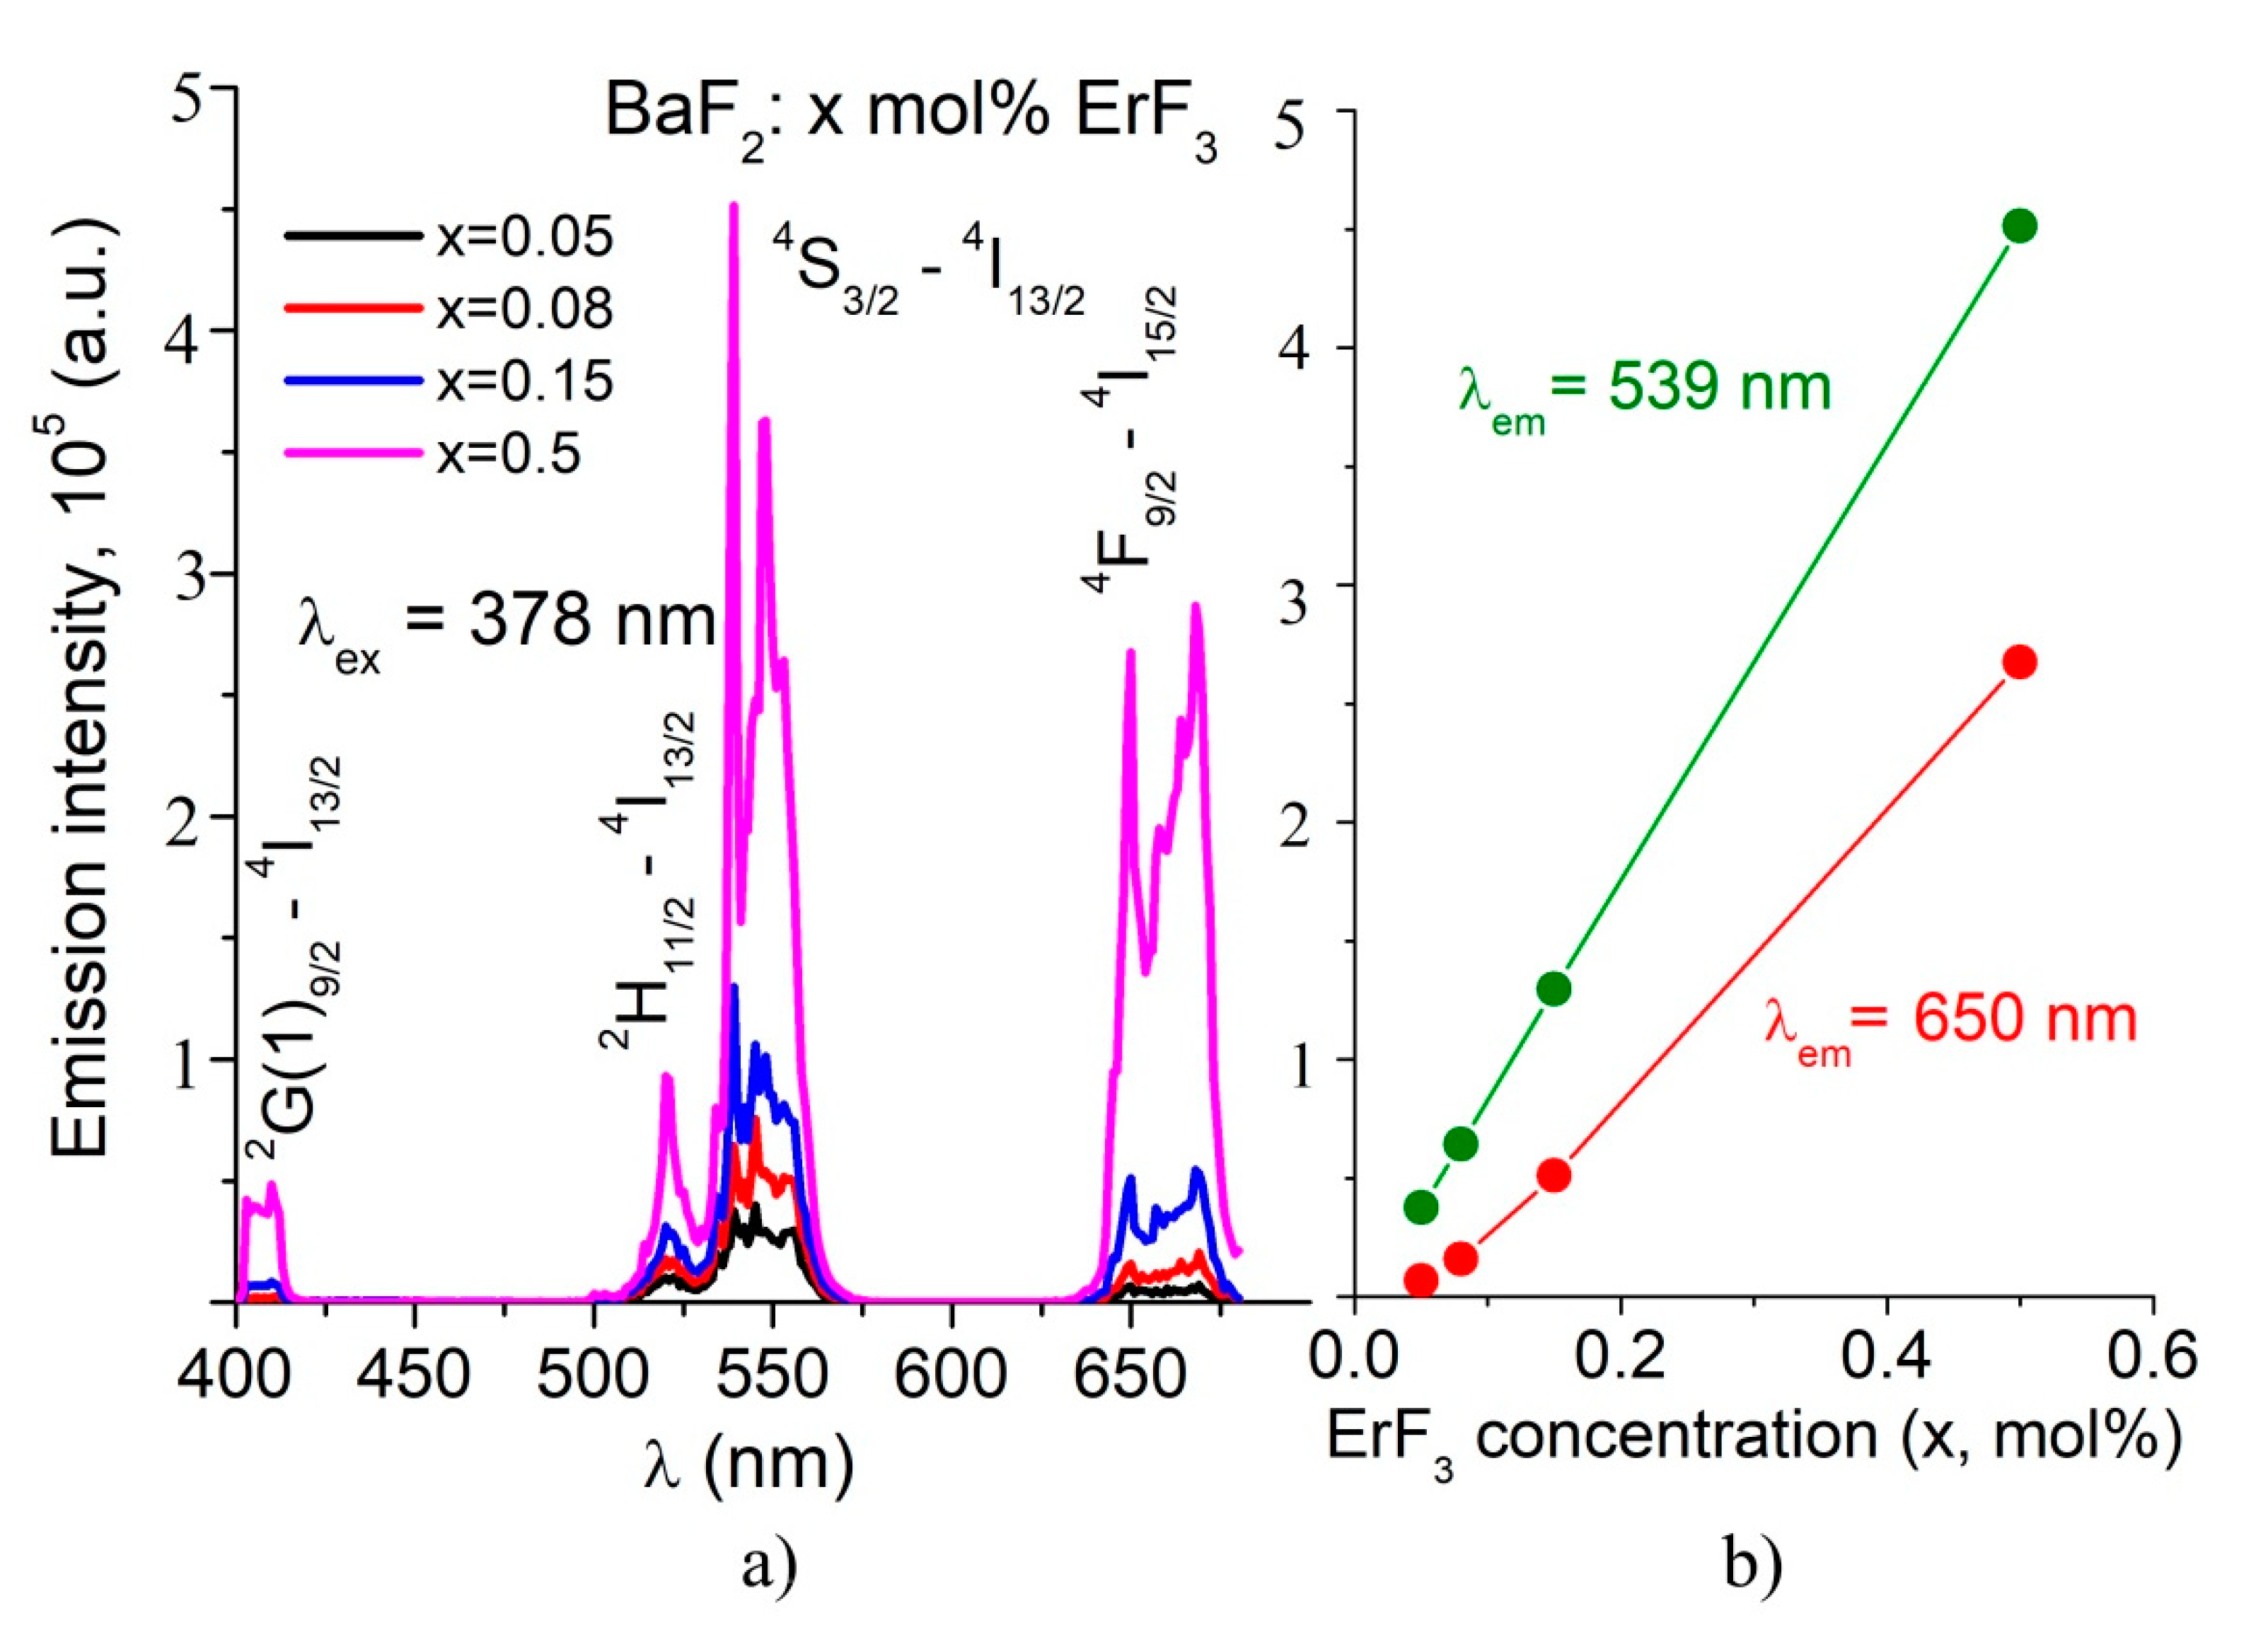
In order to obtain the room temperature emission spectra, two absorption bands were used for excitation, namely λexc. = 378 nm (4I15/2 → 4G11/2 transition) and λexc. = 290 nm (4I15/2 → 4G7/2 transition). The emission spectra of the studied samples are shown in Figure 5 and Figure 6. By excitation at 378 nm, we obtained three broad emission bands (Figure 5). The red band, around 660 nm, has two peaks at 650 nm and 668 nm. The green band is broad, with three peaks at 547 nm, 539 nm and 521 nm. The less intense blue band is centered at 410 nm.
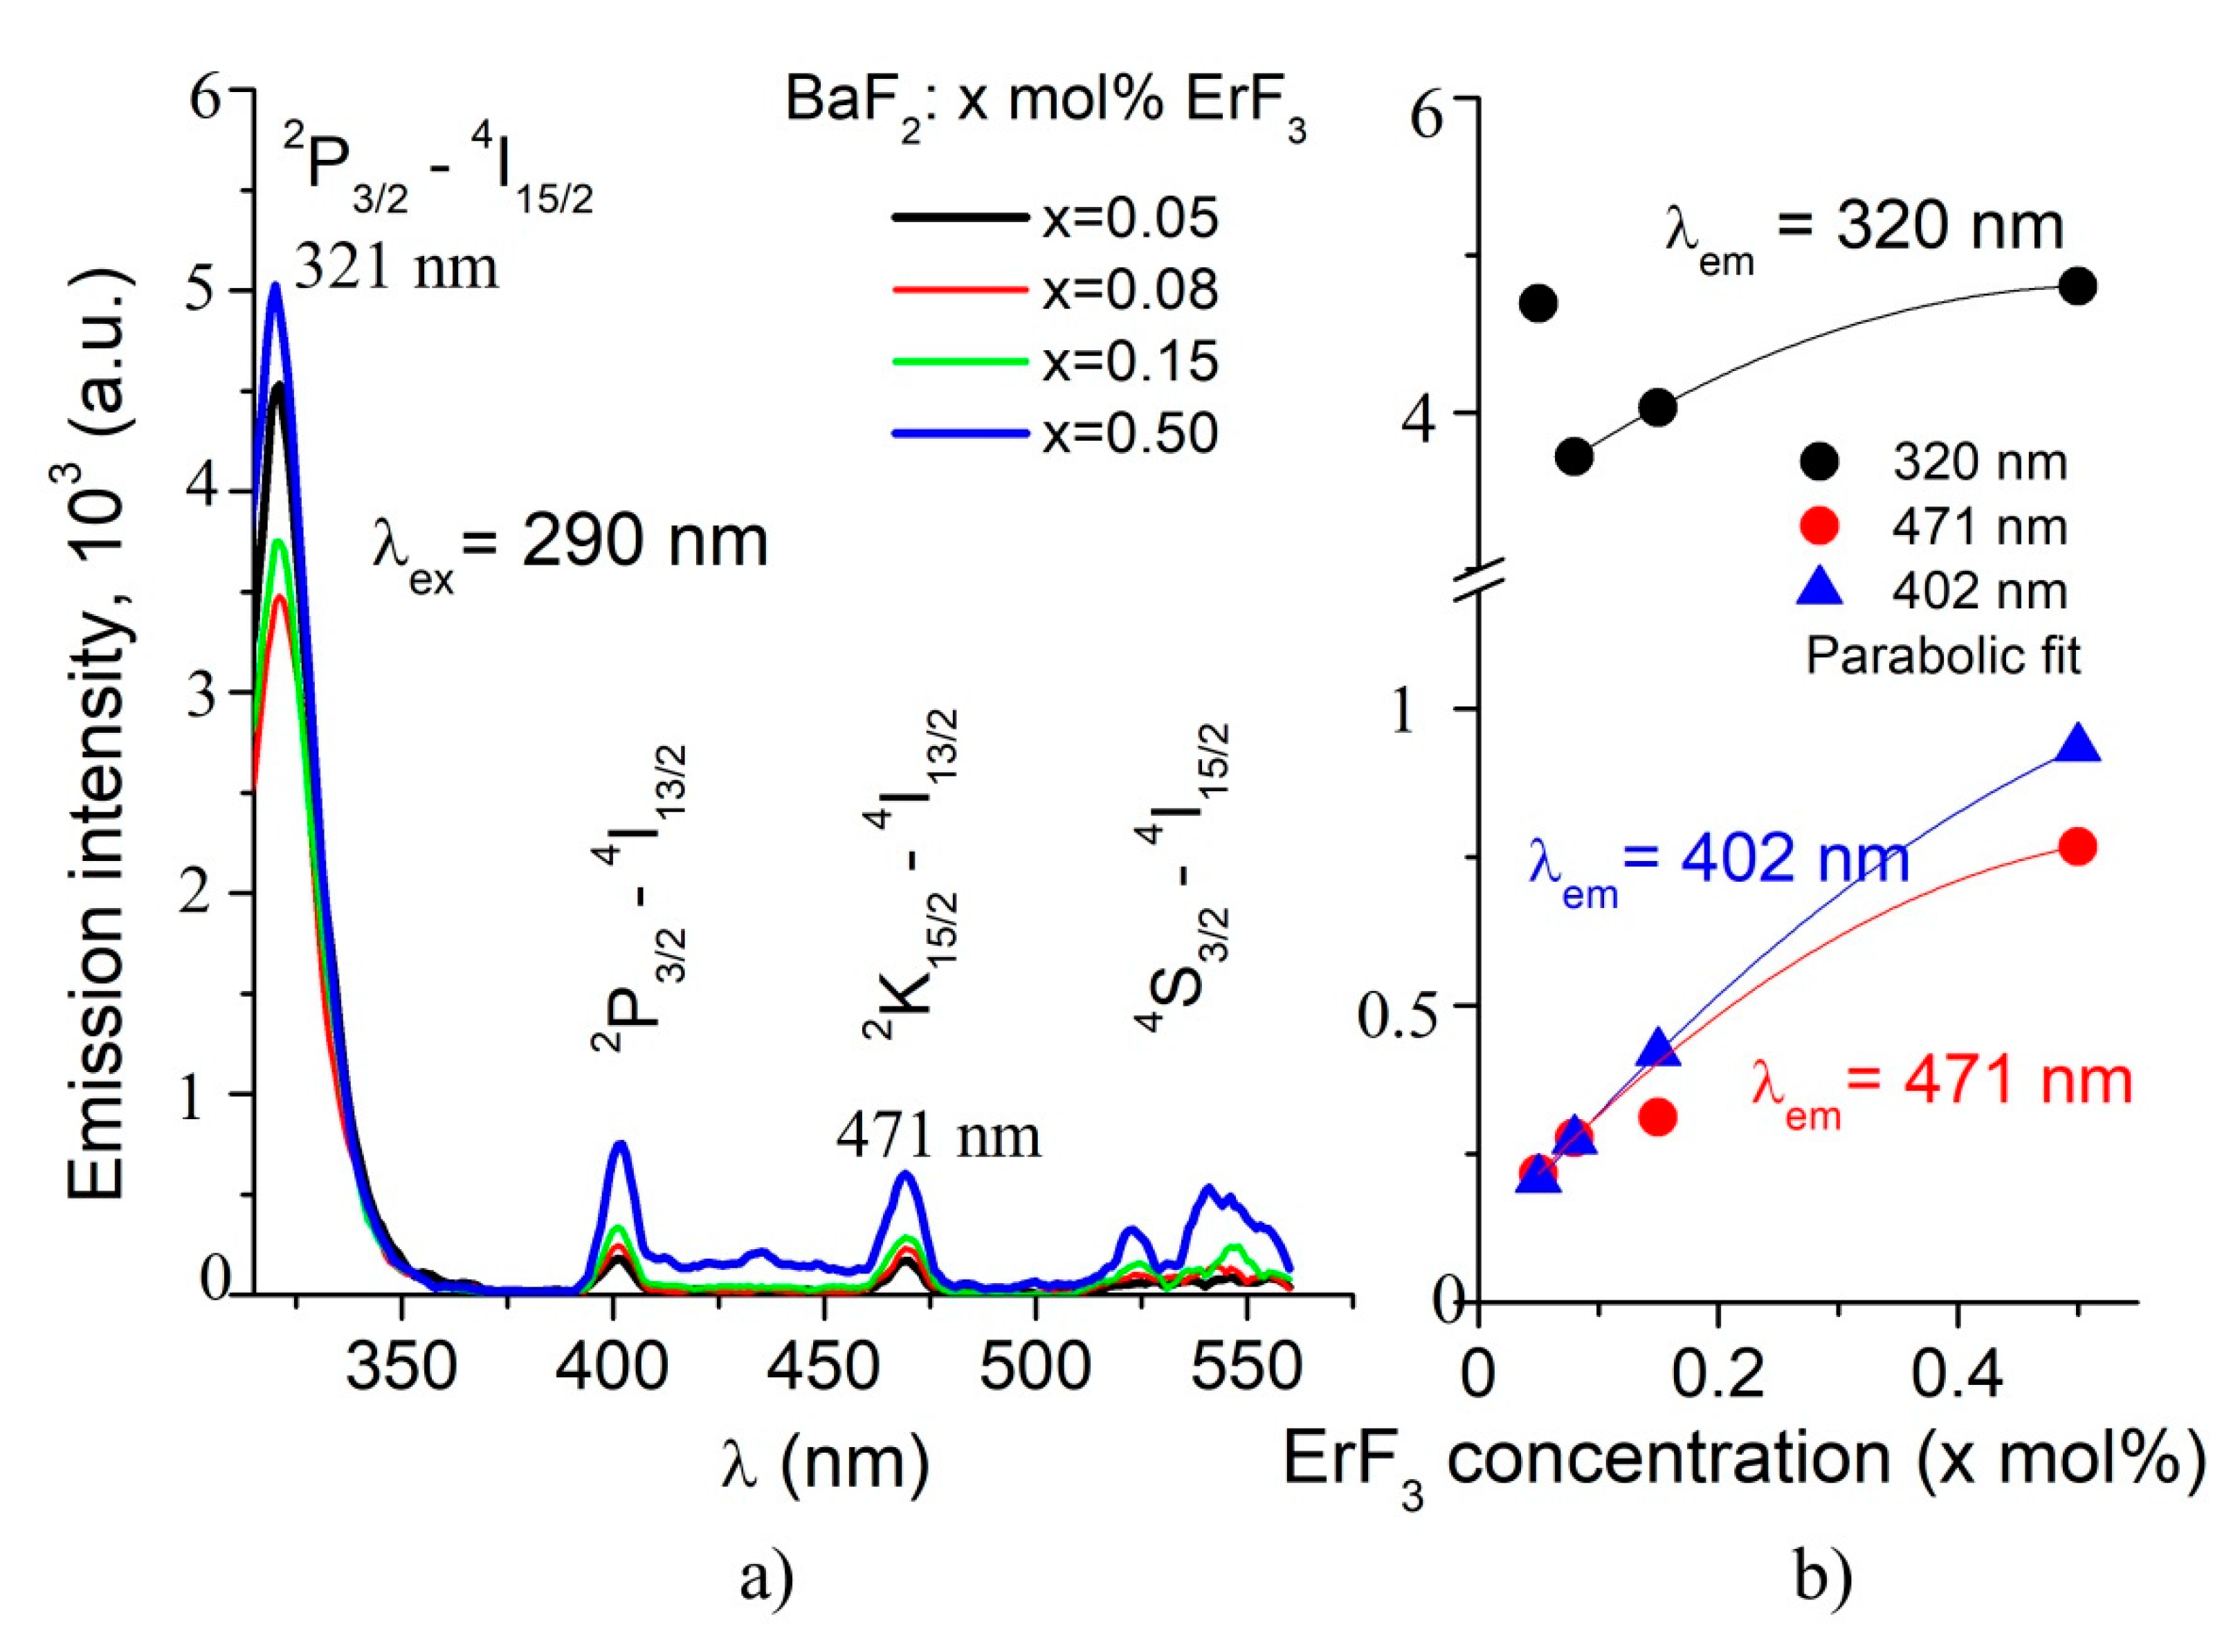
By excitation at 290 nm, the emission spectra are characterized by five photoluminescence bands: four weak emissions at 403 nm, 471 nm, 523 nm and 539 nm, and a very strong emission at 321 nm (Figure 6). The UV emission reported in our previous work corresponds to the 0.2 mol% ErF3 sample [9]. As the ErF3 concentration increases, the intensity of the emission bands increases (see Figure 5b and Figure 6b).
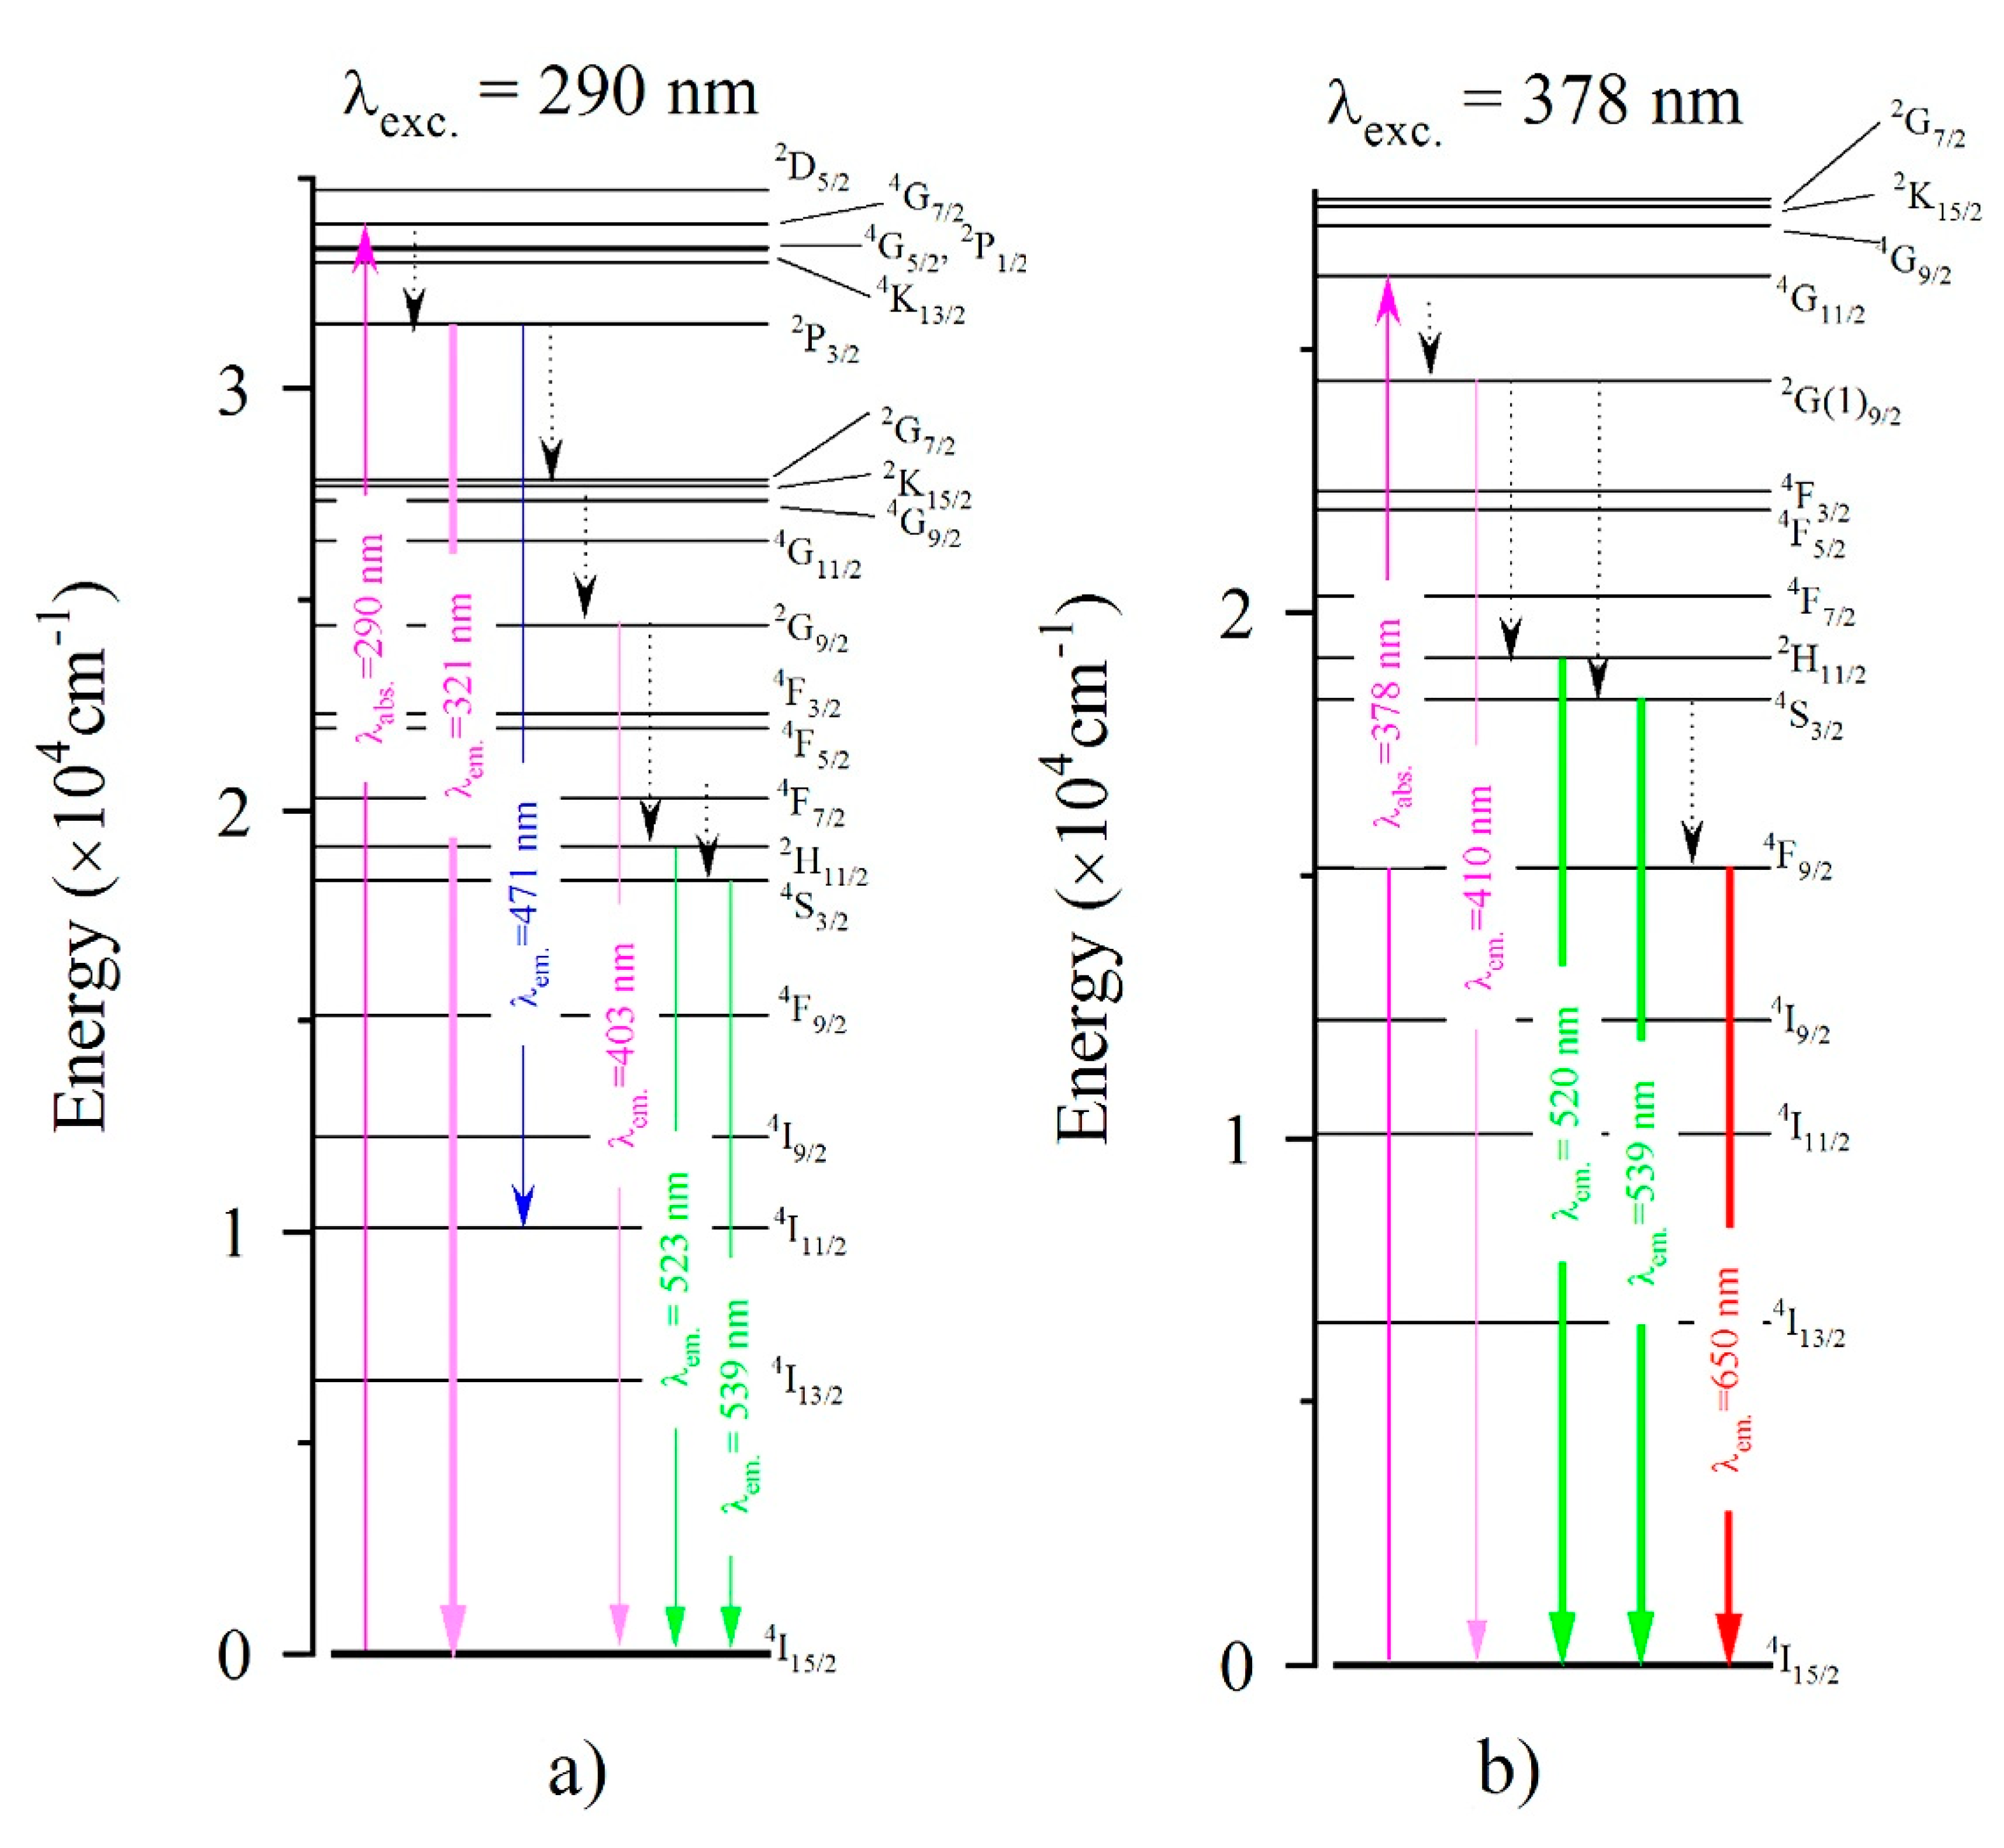
Taking into account the optical absorption spectra and the emission spectra, in Figure 7 we show the energy level diagram of the Er3+ ion. The emission bands, under excitation at 290 nm and 378 nm, are also shown.
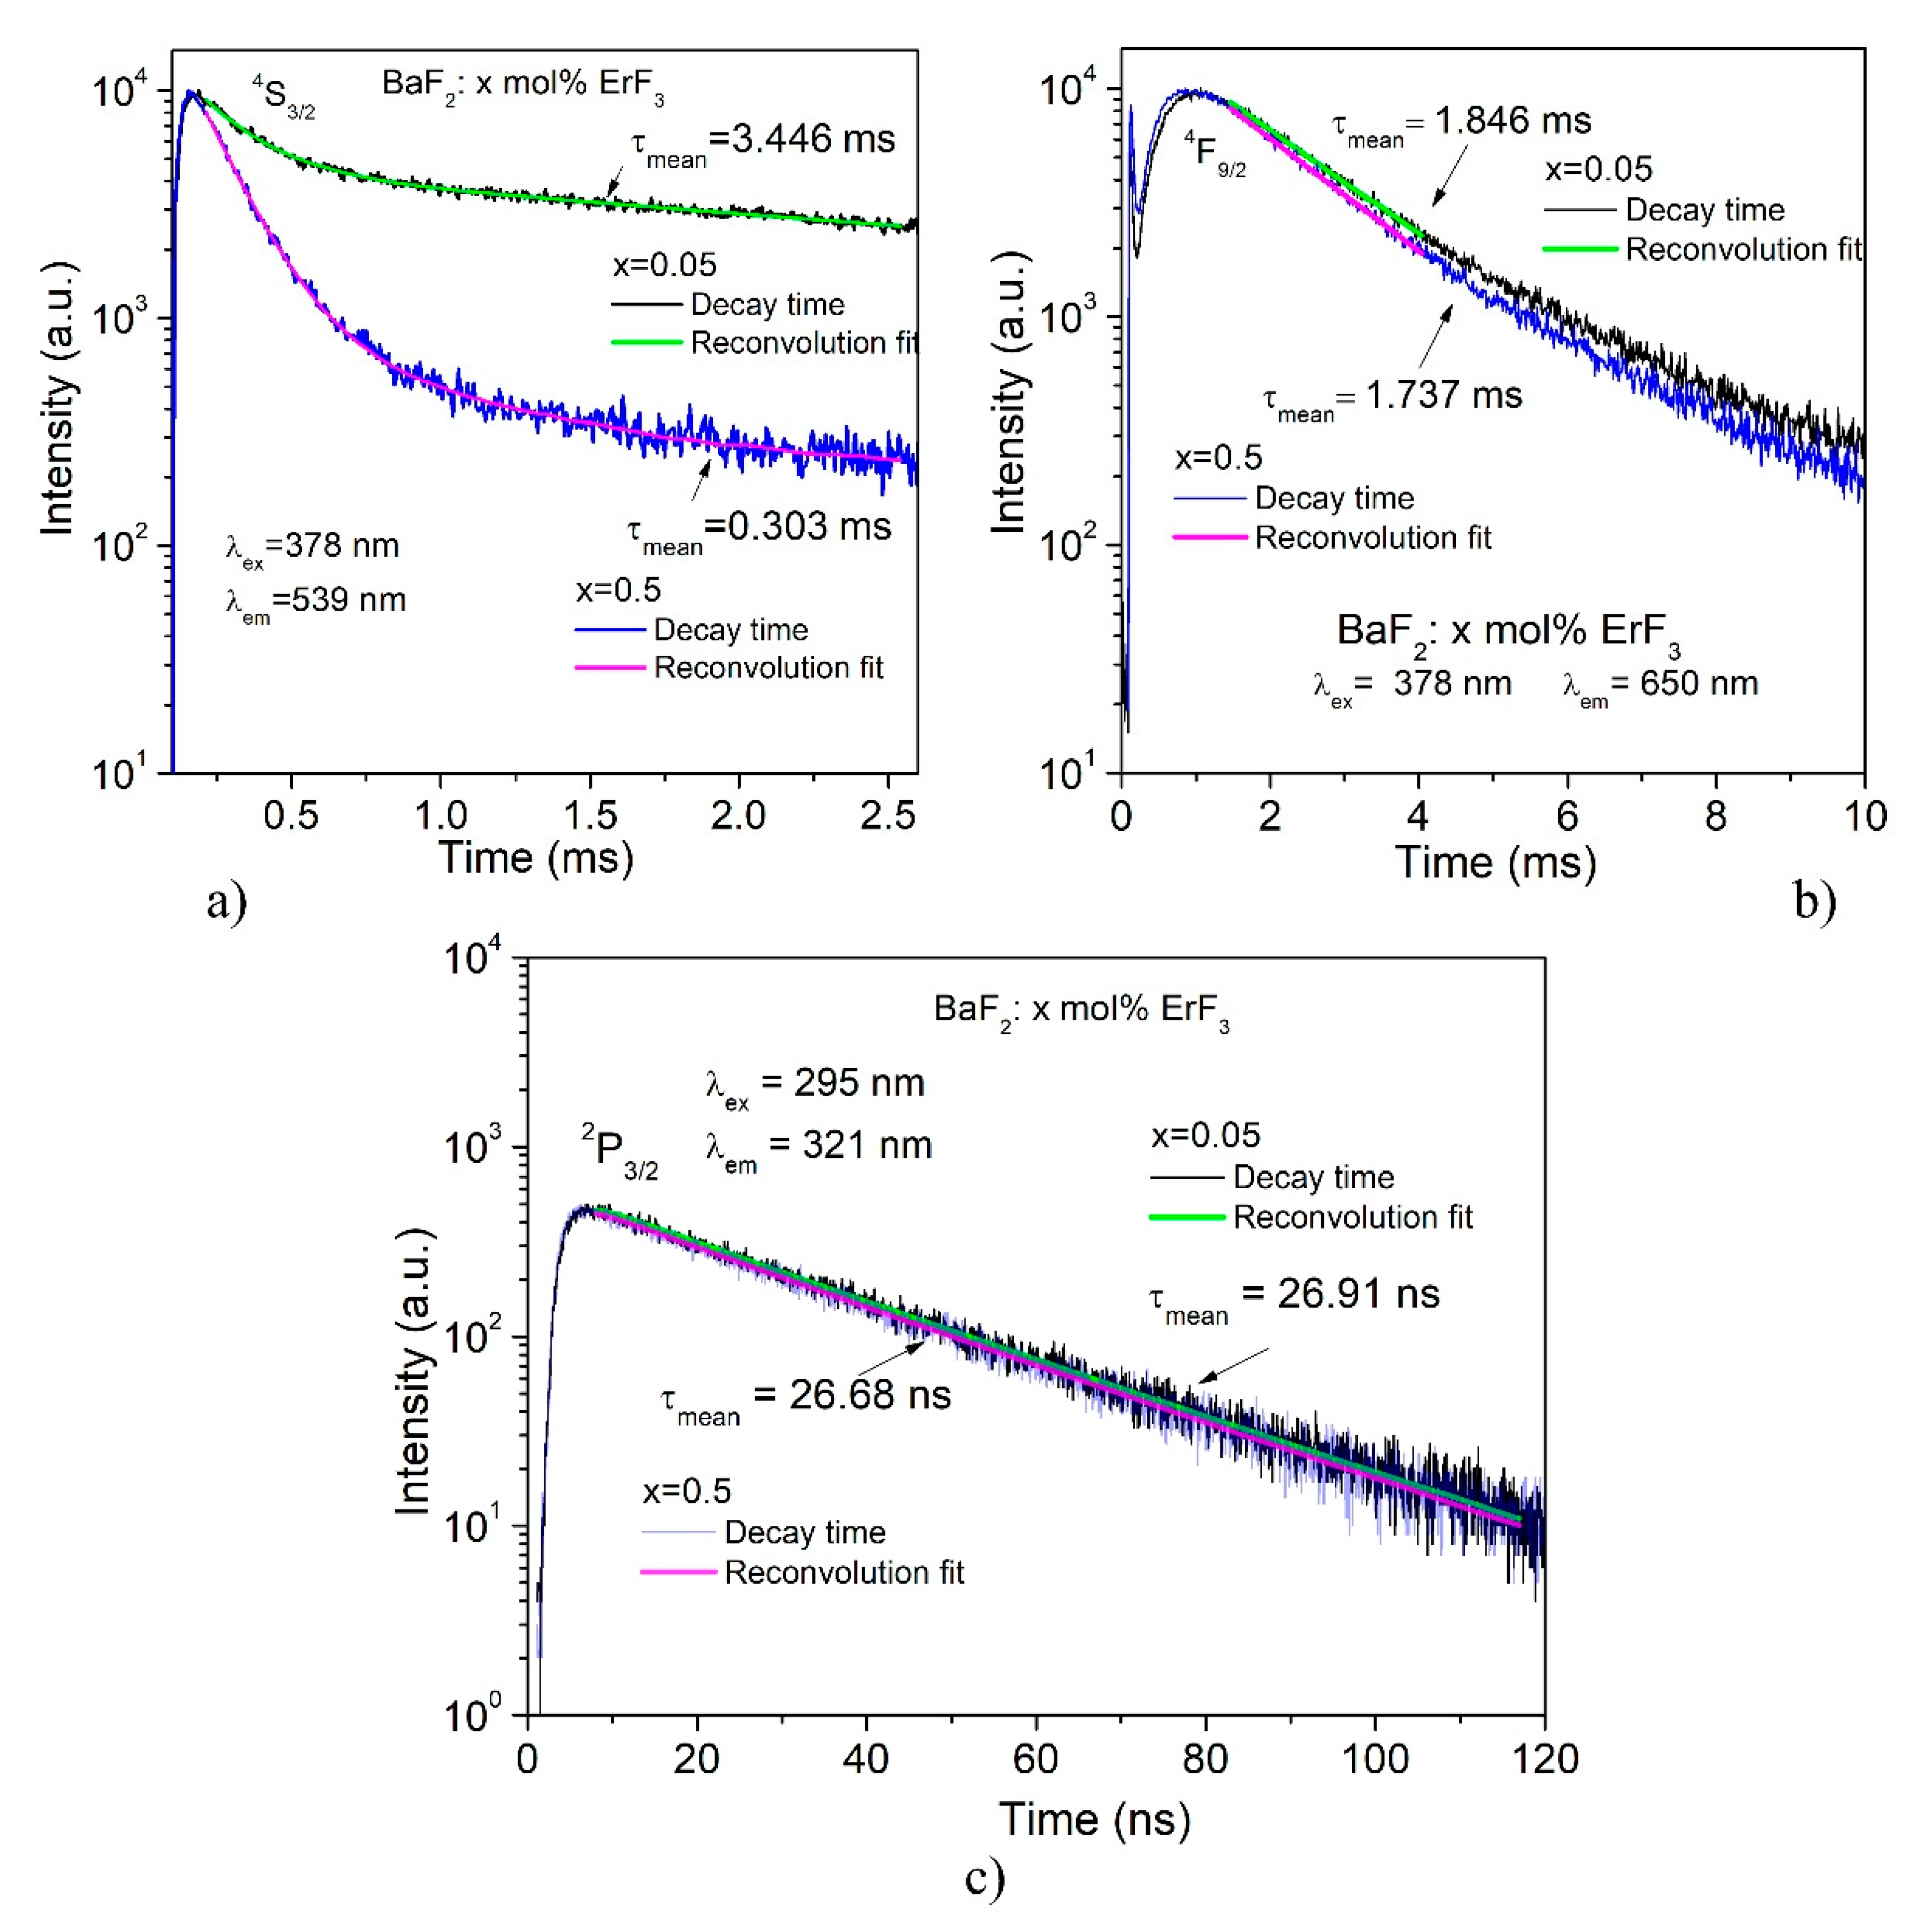
The time-resolved PL measurements give information about the decay times. Figure 8a,b shows the decay curves for the green emission (4S3/2 → 4I15/2 transition) and for the red emission (4F9/2 → 4I15/2 transition) for two ErF3 concentrations (0.05 and 0.5 mol%) in BaF2. The decay curves of all studied concentrations are given in the insert of the figure. The decay times corresponding to these emissions demonstrate non-mono exponential behavior and therefore it was fitted with a double exponential function. The decay curves of the 2P3/2 → 4I15/2 transition (UV emission, 321 nm) by excitation at 295 nm for two ErF3 concentrations (0.05 and 0.5 mol%) are shown in Figure 8c.
The mean decay times, τmean, for 4S3/2, 4F9/2 manifolds were calculated using Equation [24]:
where τ1 and τ2 are the radiative decays of the non-mono exponential fitting curve.
The obtained values of mean decay times are shown in Table 7.
The PL decay times of the green and red emissions by excitation at 378 nm are of the order of ms and vary with the Er3+ ion concentration, while the decay times for the emissions obtained by 290 nm excitation are of the order of ns and depend slightly on the Er3+ ion concentration. These values are comparable to those obtained (25 ns) by Yang et al. [25] for Ce:BaF2 for emission at 324 nm by 291 nm excitation.
4. Discussion
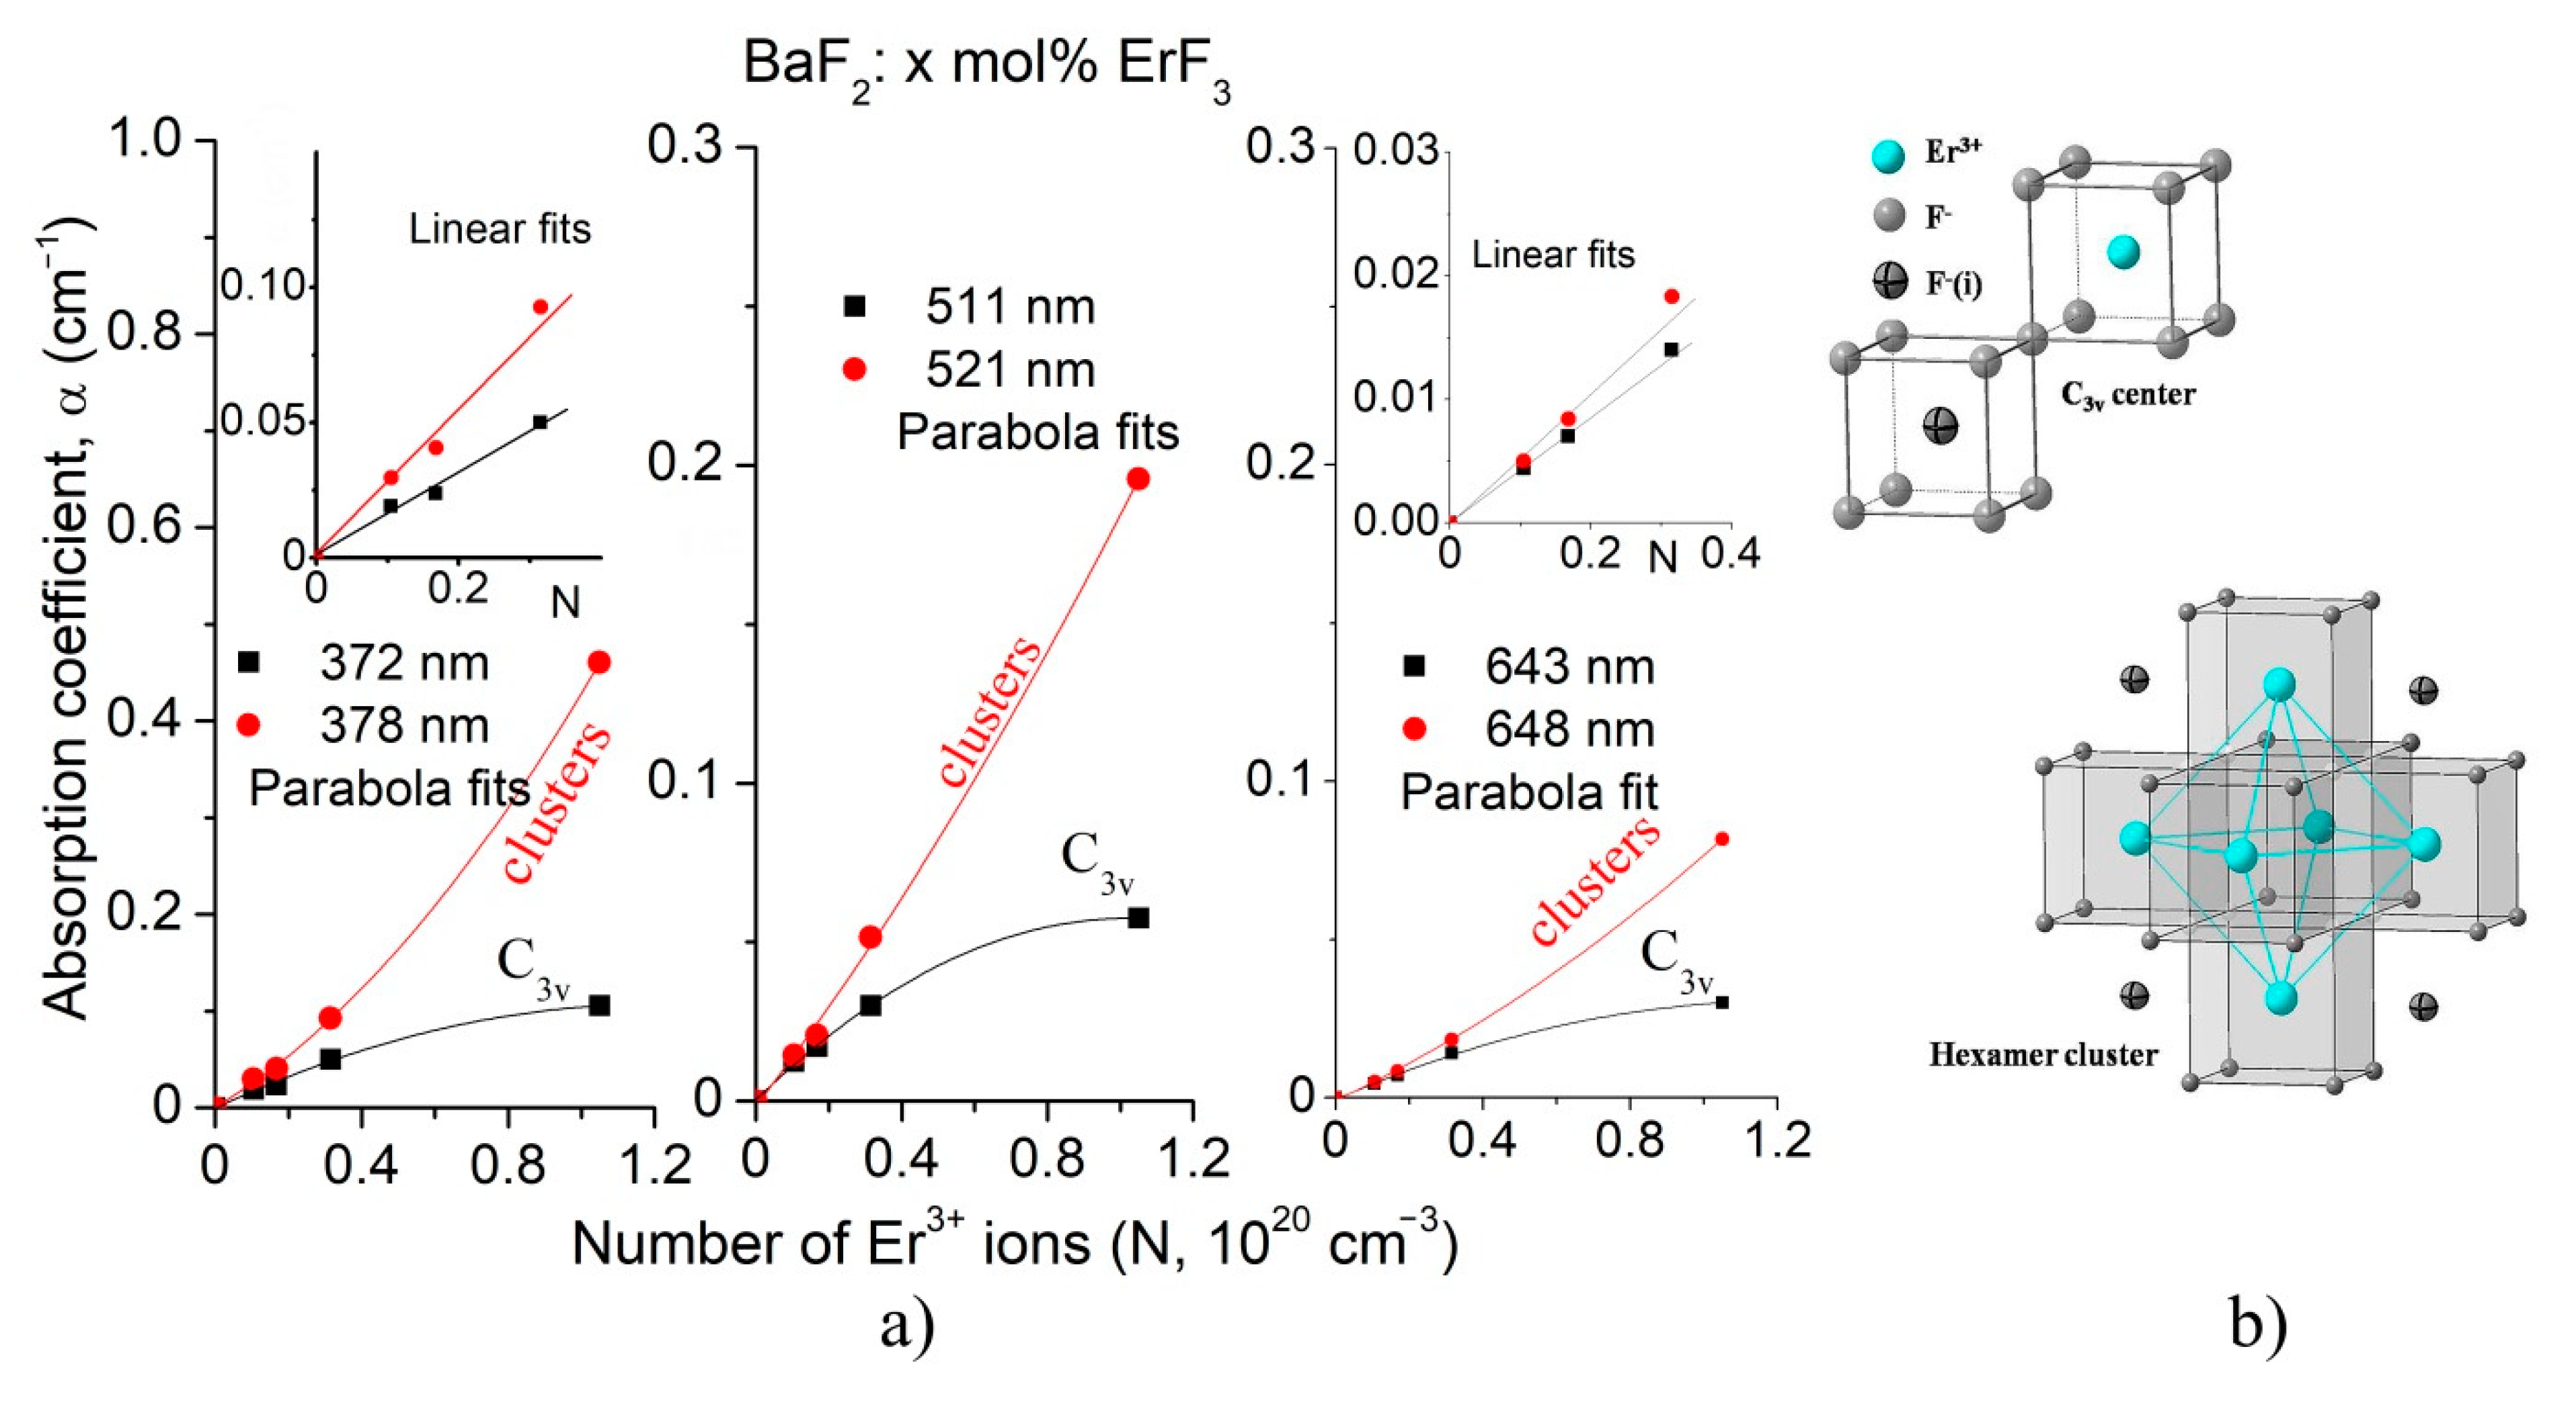
When trivalent ions (Er3+ ions in our case) are dissolved in BaF2, the Er3+ ions replace the Ba2+ ions in the lattice. The charge compensation process takes place in order to maintain the neutrality of the system. This process is performed by placing the interstitial fluorine ions in different positions relative to the Er3+ ions. At very low RE concentrations (<0.01), only isolated centers are created, namely centers with cubic (Oh), tetragonal (C4v) and trigonal (C3v) site symmetry. As concentration of the trivalent ions increases, in addition to isolated centers, various aggregates (clusters) are created [2,3,26,27]. The ten optical absorption bands, shown in Figure 3, correspond to the transitions from the ground state (4I15/2) to the excited states of the Er3+ ions. The absorption bands are broad and structured due to the various isolated centers and clusters created by the charge compensation effect. In lightly doped BaF2:ErF3 crystals, the dominant isolated center has C3v symmetry, as shown by Wells et al. [3]. Using the Gaussian multi-peaks decomposition, for the asterisk-specified bands in Figure 3, we obtained the following major peaks: 372 nm and 378 nm, 511 nm and 521 nm and 643 nm and 648 nm, respectively. We assigned the 372 nm, 511 nm and 643 nm peaks to the C3v (NNN) site, and the 378 nm, 521 nm and 648 nm peaks to clusters (aggregates) [28].
The influence of ErF3 concentration (or the number of Er3+ ions in the samples) on the intensity of these components is shown in Figure 9a. Overall, the intensity (the absorption coefficient, α) of these bands does not increase linearly with the number of Er3+ ions (N) in the BaF2, but parabolically. Up to relatively low ErF3 concentrations (~0.15 mol% ErF3 or 0.3 × 1020 cm−3 ions), both the intensity of the peaks associated with the C3v site and of the clusters increases linearly with ErF3 concentration, as presented in the inserts in Figure 9a. This behavior is normal because, at low ErF3 concentrations, the probability of creating both isolated centers (C3v) and clusters is approximately the same. As the concentration increases, much fewer C3v centers are created than clusters. According to Beer’s law, the absorption coefficient is proportional to the number of absorbent centers. As a result, the peak intensity corresponding to the C3v component (372 nm) will tend to saturate, while the intensity corresponding to the clusters (378 nm) will increase much more. Overall, the behavior shows a parabolic aspect (but of two kinds), as seen in Figure 9a. Other authors [3,4,6,29] also reported this behavior.
The majority of studies regarding luminescence RE ion-doped BaF2 v refer to emissions obtained mainly by pumping in the IR domain [14,15,16]. Comparing the emission spectra of our samples by excitation at λex = 290 nm and λex = 380 nm, it was concluded that the emission at 321 nm is the most intense (see Figure 5a and Figure 6a).
The emission spectra by excitation at 380 nm consist on three bands, one very weak blue band at about 405 nm, and the well-known green and red emissions (Figure 5a). These emissions are due to the transitions from 2G(1)9/2, 4S3/2 and 4F9/2 excited levels to the 4I15/2 ground level. The intensity of the green and red emissions are comparable; the green emission is ten times more intense than the blue emission. As ErF3 concentration increases, the intensities of the emission bands increase linearly (see Figure 5b). Other authors also reported emissions under excitation at 378 nm in a BaF2 host [15,16].
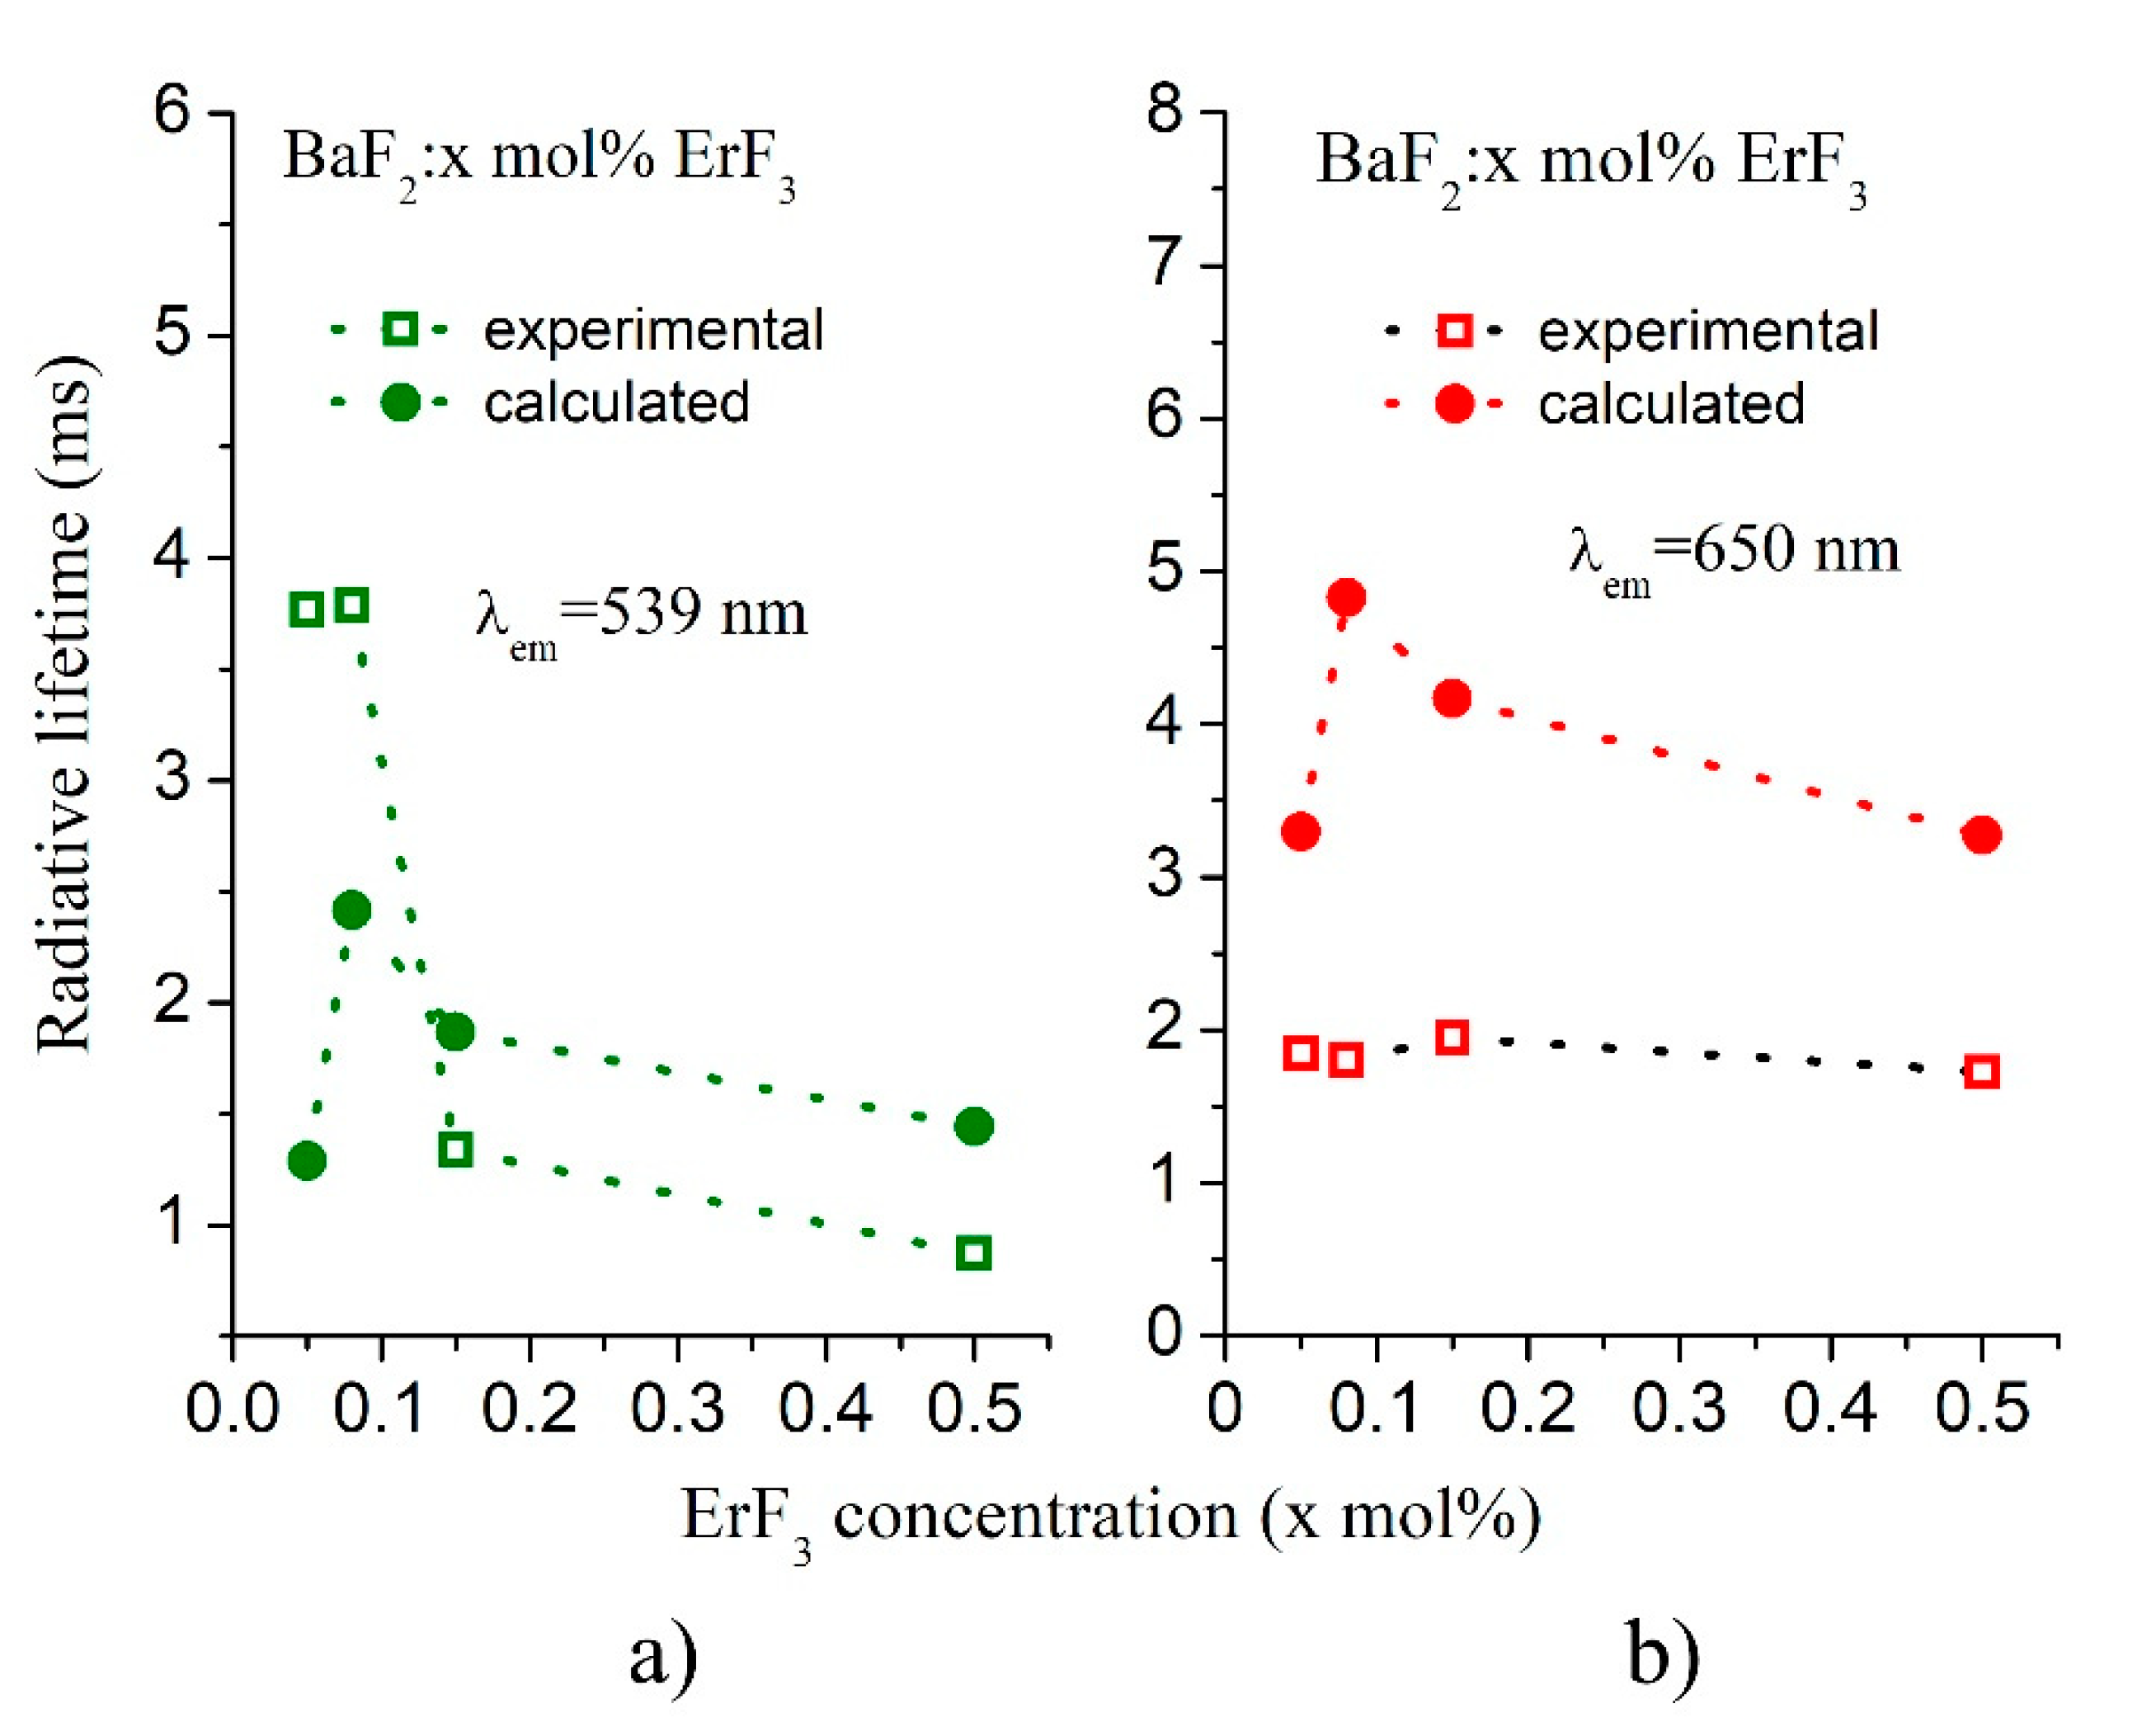
The influence of ErF3 concentration on the experimental and calculated radiative lifetime for the green emission and for the red emission is shown in Figure 10. The values of the calculated radiative lifetime are higher than the values found experimentally. The difference between the calculated lifetime and the experimentally measured lifetime is due to the errors with which the JO parameters are calculated.
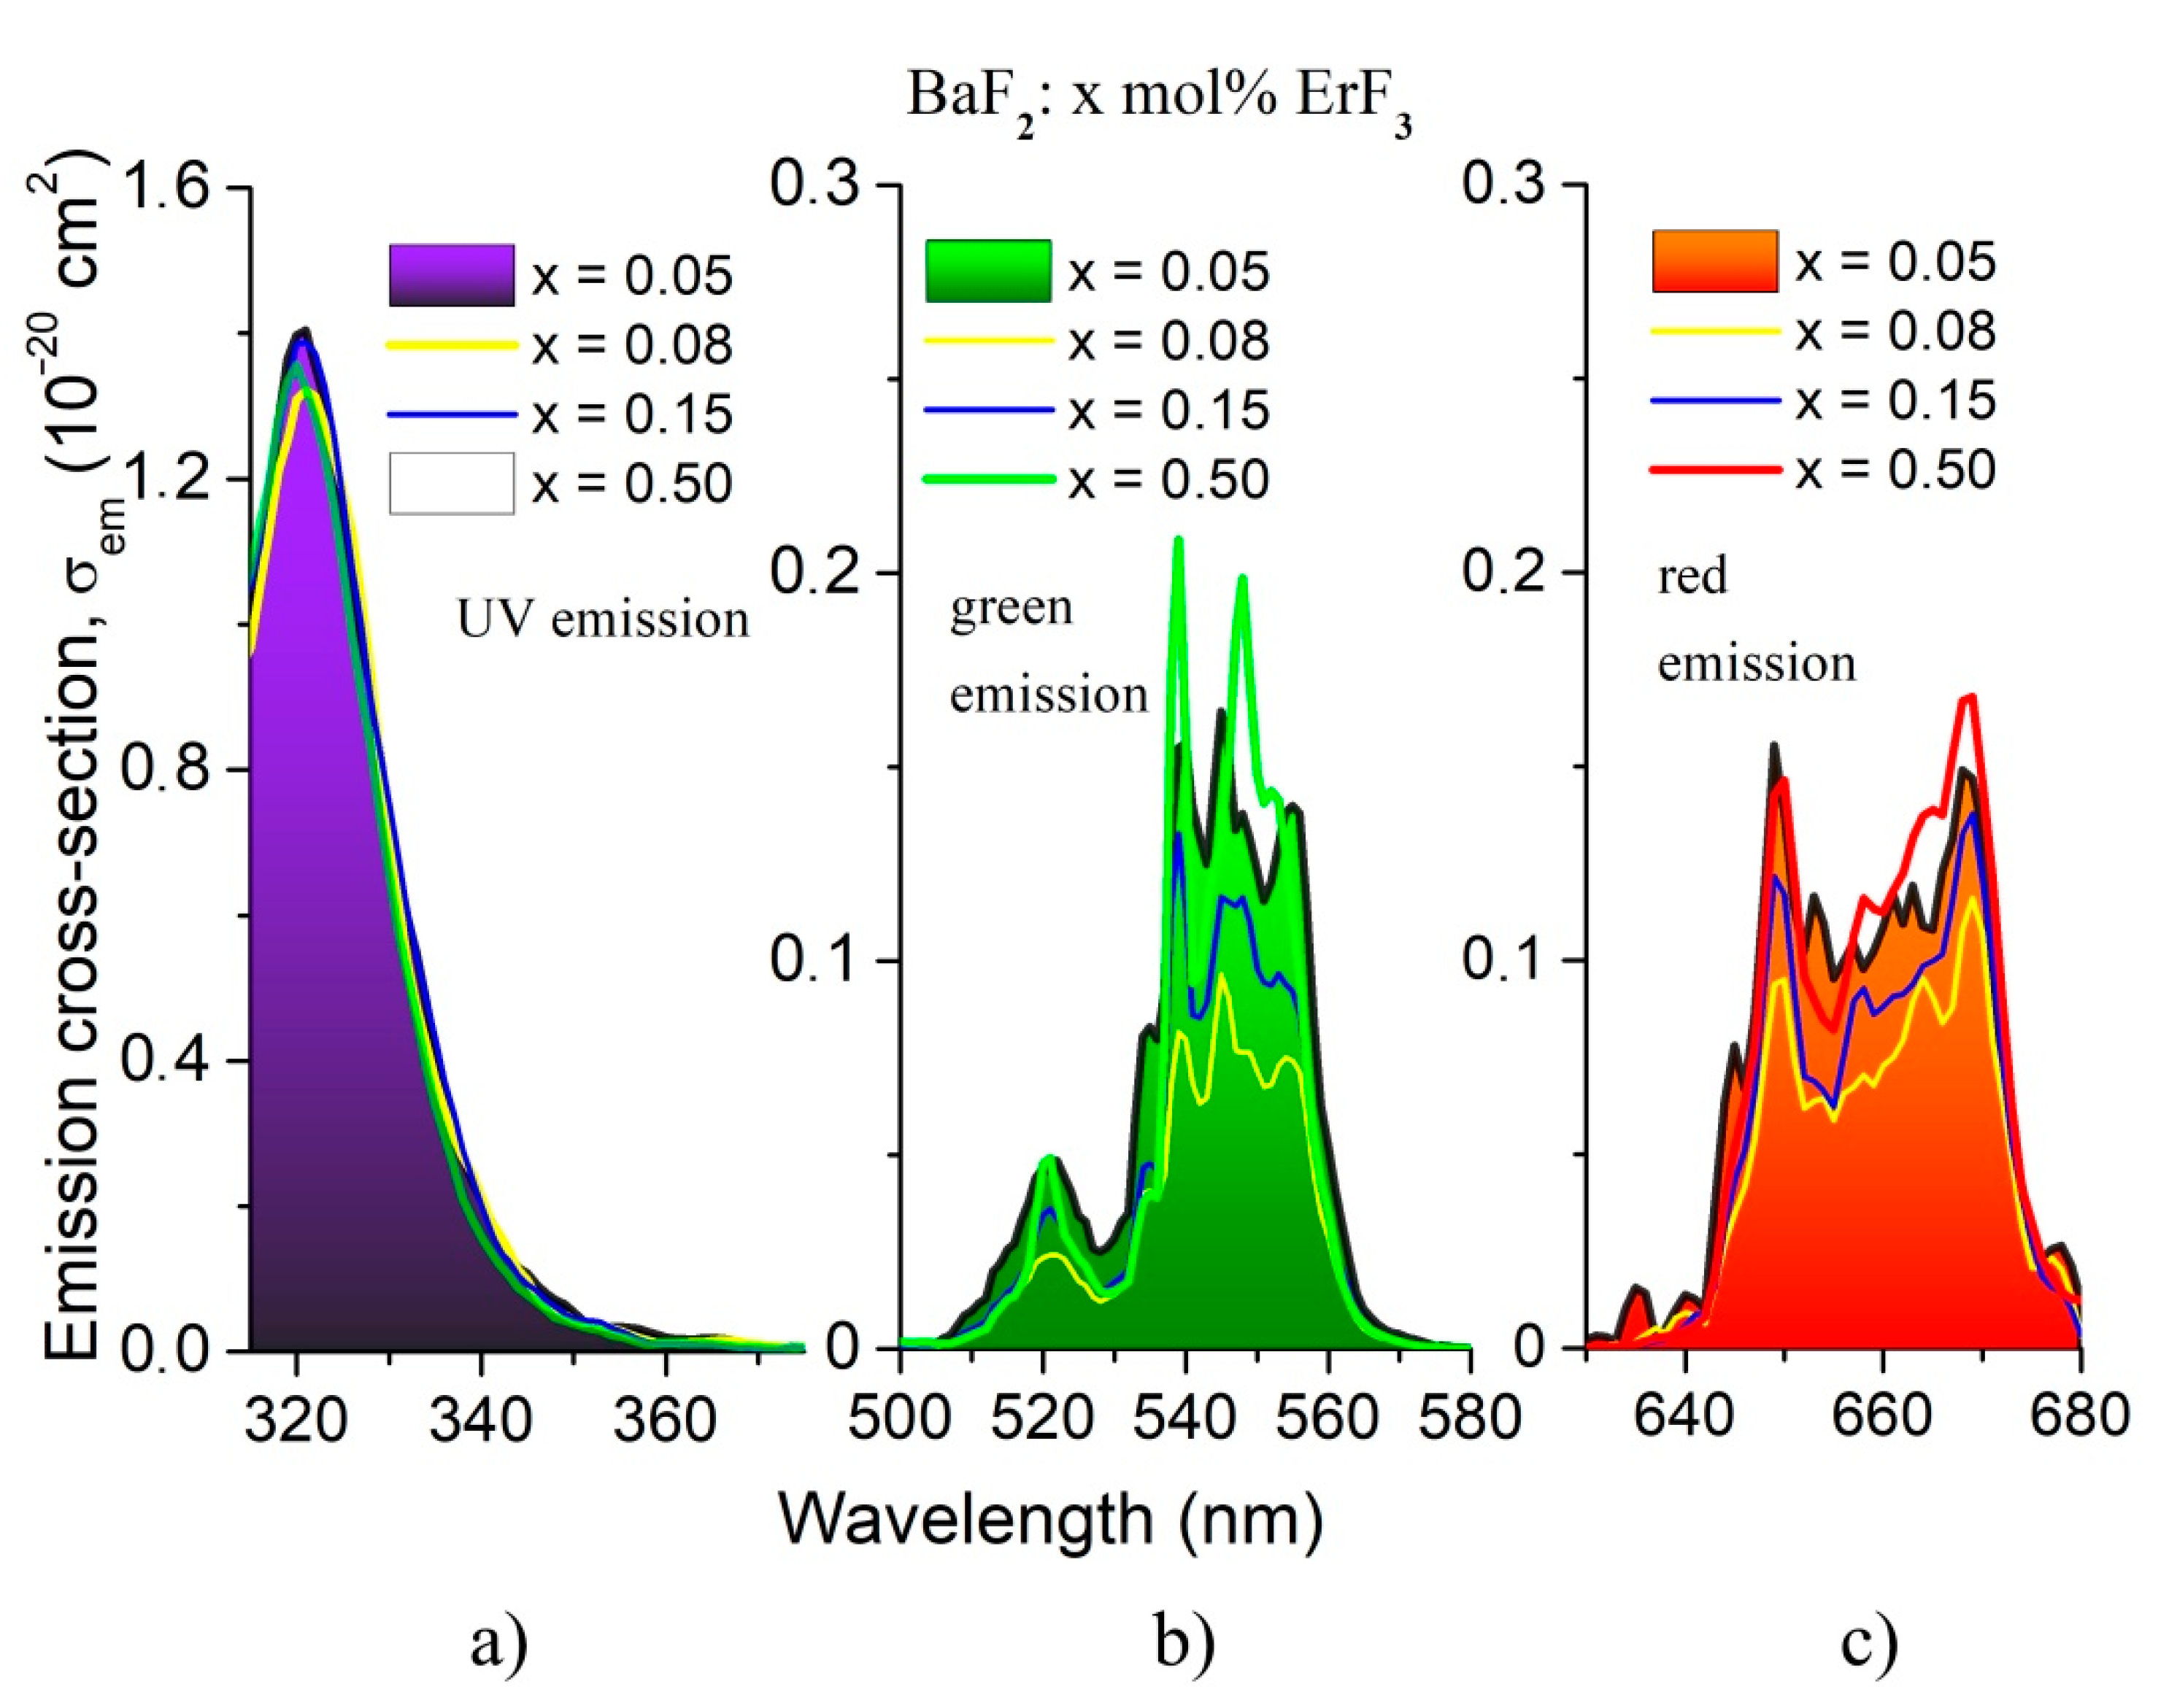
In order to estimate the emission cross-section, corresponding to the observed emissions, the Füchtbauer–Ladenburg relationship [30] was applied:
where I(λ) is the emission intensity at each wavelength, τmean is the mean radiative lifetime of the upper laser level and β is the branching ratio, n is the refractive index and c is the velocity of light. The UV, green and red emissions cross-sections are shown in Figure 11.
To evaluate the laser performance of our samples, the optical gain parameter , was calculated for every sample. The obtained values are given in Table 8.
The optical gain parameter varies with the ErF3 concentration for the green and red emissions, while for the UV emission, it does not vary. The highest value is obtained for the 0.05 mol% ErF3 concentration sample; therefore, this concentration should be more efficient as laser material in comparison with the other concentrations. The quantum efficiency for UV emission varies between 2.9% and 6.4%, and in the case of the red emission, it varies between 37.5% and 56%.
By excitation at 290 nm, the emission spectra reveal four weak emission bands in the visible domain and one band in UV, five times more intense than those in the visible domain (Figure 6a). The less intensive emissions peak at 403 nm, 471 nm, 523 nm and 539 nm. The intensities of these visible field emissions are five times weaker than those obtained by 378 nm excitation. The intensity of the UV emission (321 nm) is comparable with the intensity of the green emission obtained by 378 nm excitation. The intensities of the emissions vary parabolically with the ErF3 concentration (Figure 6b). This emission probably includes the self-trapped exciton (STE) component that involves non-linear behavior regarding Er3+ ion concentration in comparison to the red and green emissions pumped at 378 nm.
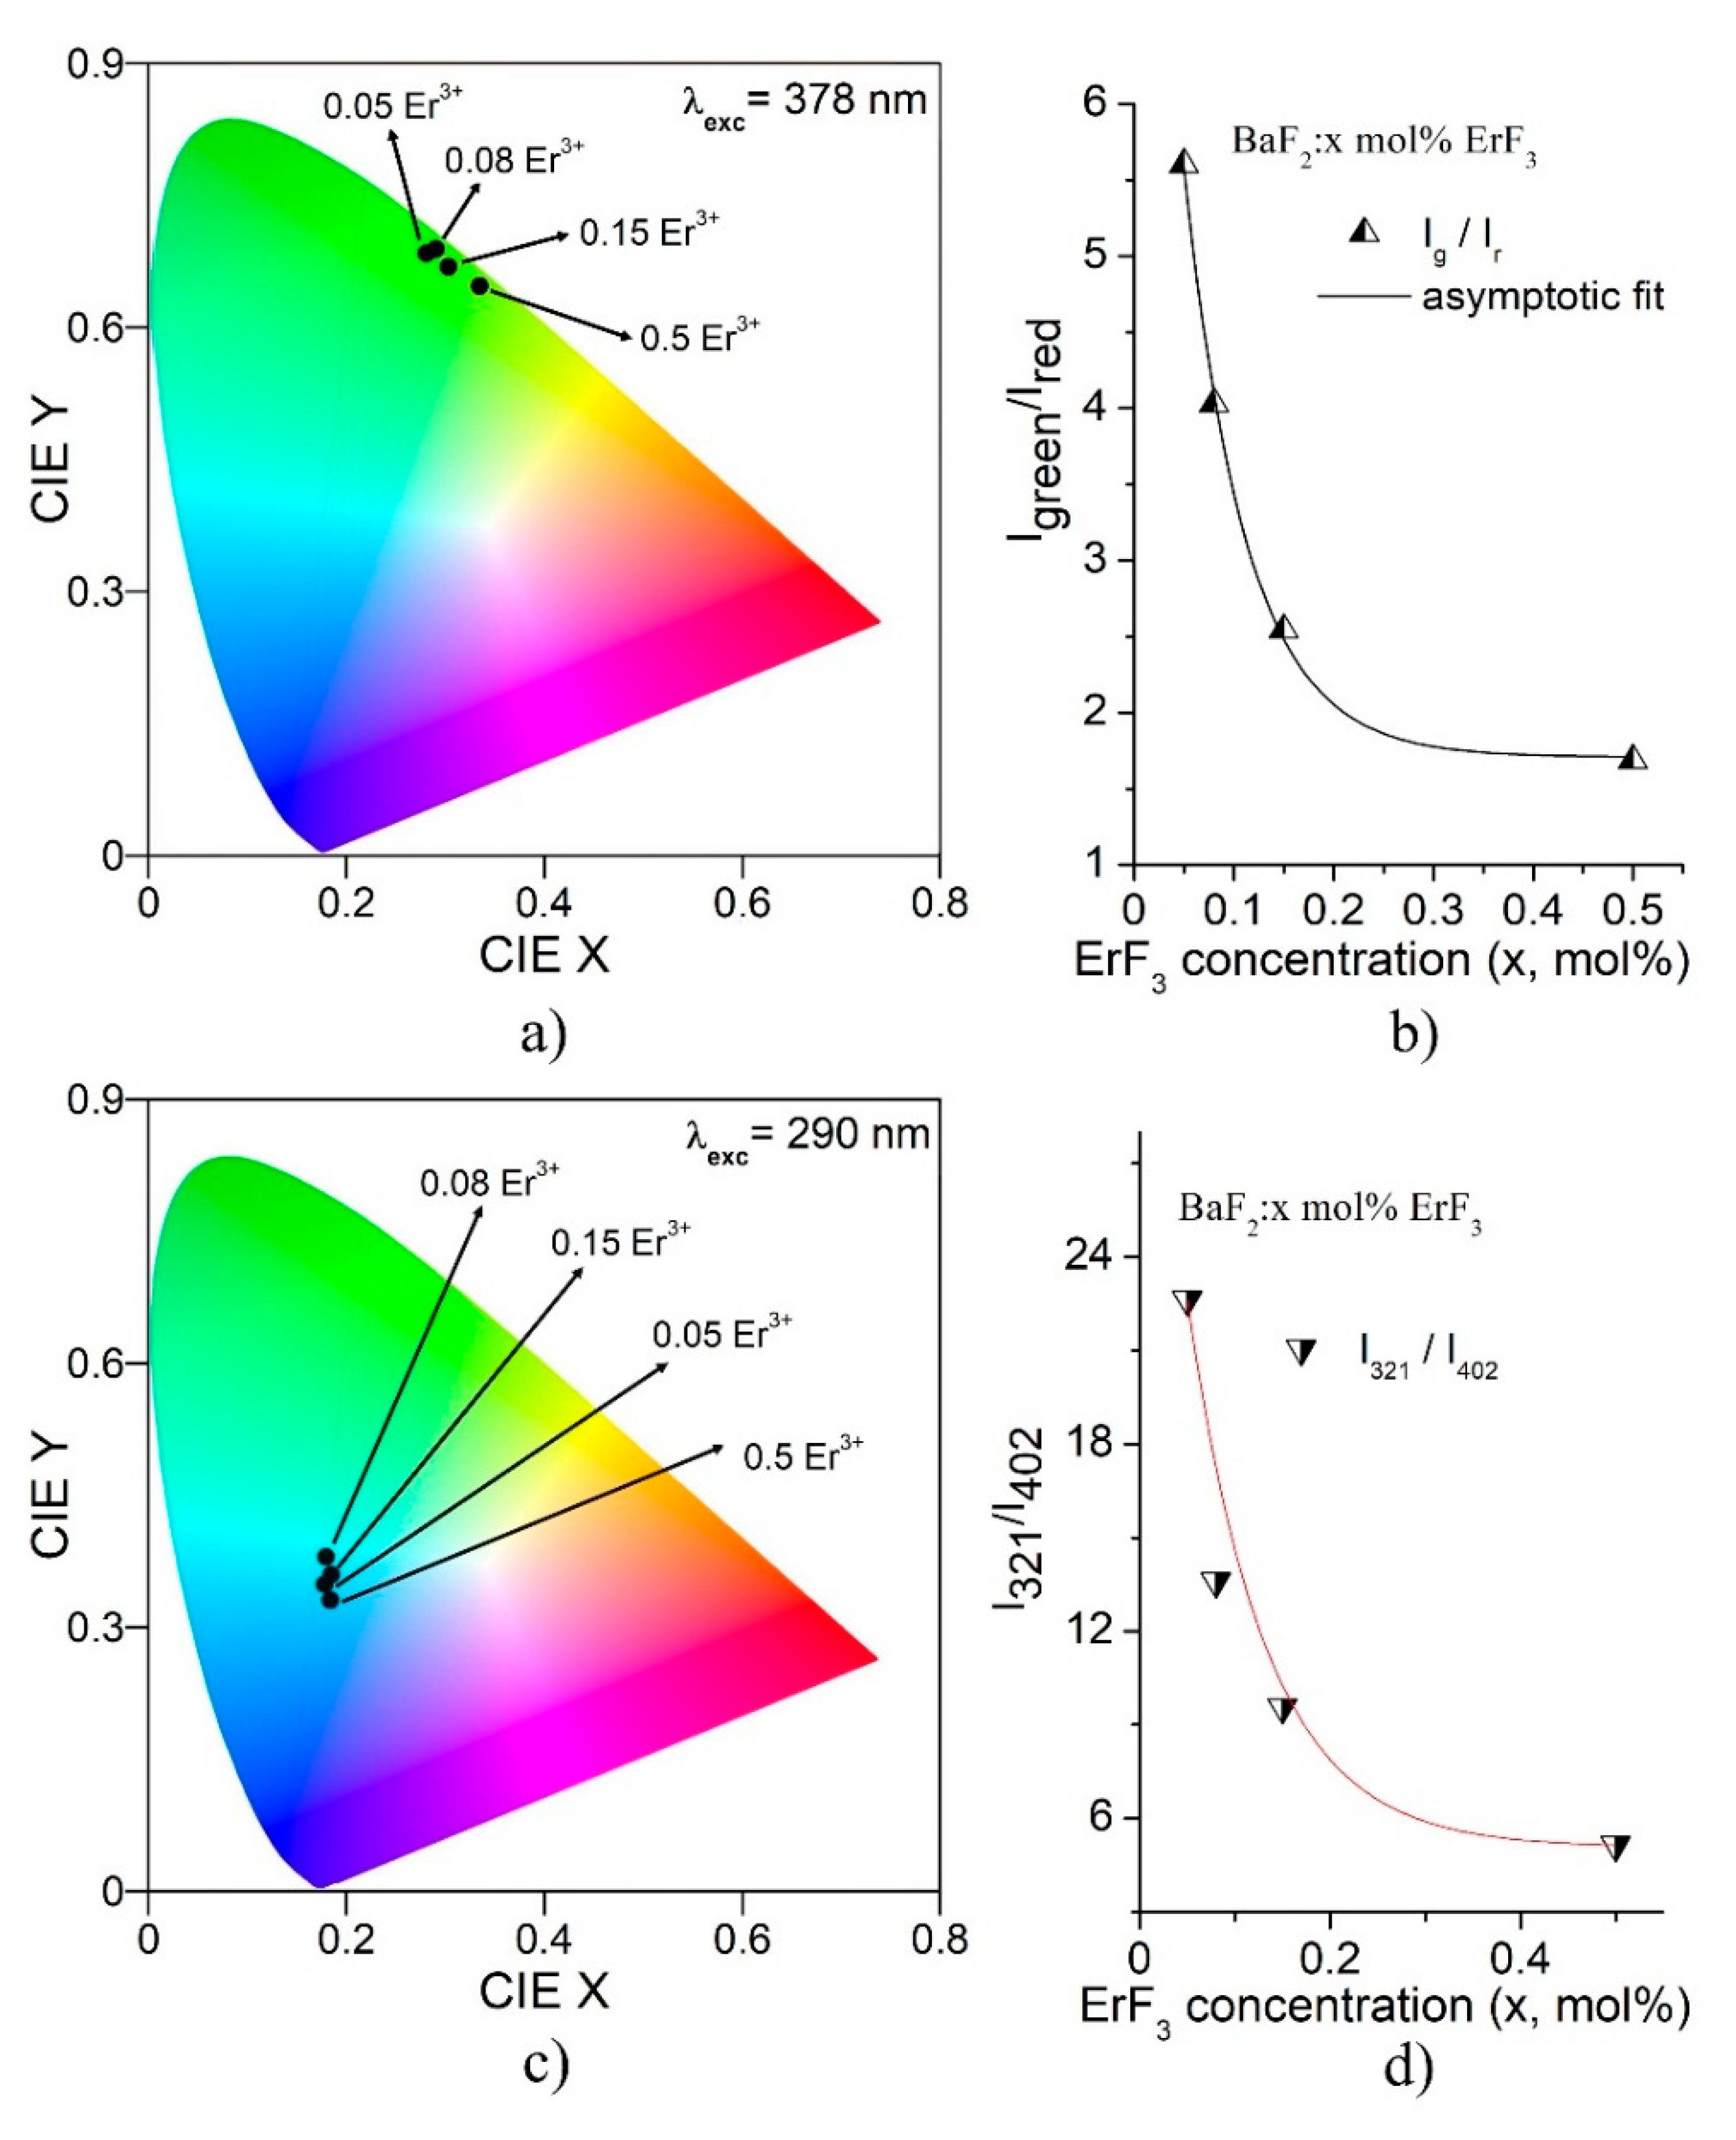
The International Commission on Illumination (CIE) charts for all the samples, for the emissions obtained under excitation at 378 nm and 290 nm, are shown in Figure 12a,c, respectively. The CIE coordinates were obtained using Gocie V2 software [31]. The CIE 1931 color coordinates are as follows. For the excitation at 378 nm, the color coordinates are: (X = 0.28, Y = 0.68) for 0.05 mol% Er3+, (X = 0.29, Y = 0.69) for 0.08 mol% Er3+, (X = 0.30, Y = 0.67) for 0.15 mol% Er3+ and (X = 0.33, Y = 0.65) for 0.5 mol% Er3+. For the excitation at 291 nm, the color coordinates are: (X = 0.18, Y = 0.35) for 0.05 mol% Er3+, (X = 0.18, Y = 0.38) for 0.08 mol% Er3+, (X = 0.18, Y = 0.36) for 0.15 mol% Er3+ and (X = 0.18, Y = 0.33) for 0.5 mol% Er3+. In the case of the emissions by 378 nm excitation, the ratio between the green (539 nm) intensity and the red (650 nm) intensity decreases from 5.6 to 1.7 (three times), as the ErF3 concentration increases (see Figure 12b). According to Figure 12a,b, the green emission is strong for concentrations up to ~0.2 mol% ErF3, therefore the green color dominates in these cases. For higher concentrations, the intensity of the red emission increases and the color moves to the yellow domain of the chart. In the case of the emissions obtained by 290 nm excitation, the ratio between the UV (321 nm) intensity and the violet (402 nm) intensity decreases four times, as the ErF3 concentration increases (see Figure 12d). For the ErF3 concentration higher than ~0.2 mol%, the intensity of the violet emission increases and the color moves a little to the blue region of the chart. Therefore, the blue color dominates.
The emission intensity corresponding to the lowest concentration (0.05 mol%) is comparable to that obtained for the 10 times higher concentration (0.5 mol%). The influence of the ErF3 concentration on this emission has not been reported previously. The emission at 321 nm is attributed to transition 2P3/2 → 4I15/2. The UV emission at 314 nm, corresponding to the 4D5/2 → 4I13/2 transition, was observed in Er:CaF2 crystals [22]. The emission at ~321 nm was observed in similar crystals using various excitation techniques, including thermo, radio, X-ray and photoluminescence [14,32,33,34]. Wojtowicz et al. [14,34] attributes this emission to the self-trapped exciton STE emission; they observed this emission when pumped in VUV range, near the band-gap wavelengths. Several concurring pumping channels were also observed.
When the 4G7/2 energy level (λ—290 nm) was pumped, the Er-bond exciton emission (at 321 nm) took place from the 2P3/2 manifold. As mentioned by Wojtowicz et al. [14], because the 2P3/2 level is in the middle of the STE emission band, the energy transfer from the STE to the Er3+ ion becomes effective. This could be the cause of the weak photoluminescence at 403 nm, 471 nm, 523 nm and 539 nm (Figure 6a). The STE component emission at 321 nm involves the 2P3/2 → 4I15/2 transition. This mechanism probably involves the emission at 471 nm, which can be attributed to transition 2P3/2 → 4I11/2 or to 4F7/2→4I15/2. The less intensive emissions at 403 nm, 523 nm and 539 nm can be attributed to the 2G(1)9/2 → 4I15/2 and 2H11/2, 4S3/2 → 4I15/2 transitions, respectively.
5. Conclusions
The optical and luminescence behavior of BaF2 crystals doped with ErF3 was investigated. The crystals were obtained by the Bridgman method. As the ErF3 concentration increases, the intensity of the absorption peaks corresponding to the clusters also increases, but stronger than the peaks attributed to the C3v site. In order to obtain the emission transition probabilities, branching ratios, radiative lifetimes and the gain parameter, the Judd–Ofelt approximation was used. The obtained parameters were compared with the measured values and those reported in the literature. The emission spectra obtained by 378 nm excitation reveal two major bands, the green (539 nm) and the red (650 nm) emissions. The highest value (6.8 × 10⁻²⁴ cm2·s) of the estimated gain parameter was obtained for the green emission for the 0.05 mol% ErF3 sample. For the red emission, the highest gain parameter was 3 × 10⁻²⁴ cm2·s. Therefore, this concentration should be more efficient for laser applications than the other concentrations. The quantum efficiency varies between 37.5% and 56%. Under excitation at 290 nm, along with the weak green and red emissions, a new, strong UV band (321 nm) was obtained. The gain parameter for the UV emission is an order of a magnitude smaller (~0.3 × 10⁻²⁴ cm2·s) than in the case of the green and red emissions obtained at 378 nm excitation. The gain parameter for the UV emission does not vary with the ErF3 concentration. The quantum efficiency varies between 2.9% and 6.4%. The influence of ErF3 concentration on the Judd–Ofelt parameters and on the luminescence of Er:BaF2 crystals has not been reported in the exiting literature.
Author Contributions
A.R.: investigation, formal analysis and writing—review & editing; M.S.: methodology, software, formal analysis, investigation, writing—review &editing, resources and funding acquisition; G.B.: formal analysis, investigation and writing—review & editing; I.N.: formal analysis, writing—review & editing and supervision; D.V.: formal analysis and resources. All authors have read and agreed to the published version of the manuscript.
Funding
This work was supported by grant no. 02-1-1107-2011/2021 item 86 and no. 05-6-1119-2014/2023 item 103, ANCSI-JINR Dubna, of the JINR order, no. 365/11.05.2021.
Institutional Review Board Statement
Not applicable.
Informed Consent Statement
Not applicable.
Data Availability Statement
The data presented in this study are available on request from the corresponding author.
Conflicts of Interest
The authors declare no conflict of interest.
References
- Hahn, D. Calcium Fluoride and Barium Fluoride Crystals in Optics. Opt. Photon. 2014, 9, 45–48. [Google Scholar] [CrossRef]
- Catlow, R.A. Defect properties of anion-excess alkaline-earth fluorides. I. Low defect concentrations. J. Phys. C Solid State Phys. 1976, 9, 1845–1856. [Google Scholar] [CrossRef]
- Wells, J.P.R.; Dean, T.; Reeves, R.J. Site selective spectroscopy of the C3v symmetry centre in Er3+ doped BaF2. J. Lumin. 2002, 96, 239–248. [Google Scholar] [CrossRef]
- Andeen, C.G.; Fontanella, J.J.; Wintersgill, M.C.; Welcher, P.J.; Kimble, R.J., Jr.; Matthews, G.E., Jr. Clustering in rare-earth-doped alkaline earth fluorides. J. Phys. 1981, 14, 3557–3575. [Google Scholar] [CrossRef]
- Edgar, A.; Welsh, H.K. Dielectric relaxation and EPR studies of Gd3+-F- dipoles in strontium and barium fluoride. J. Phys. C Solid State Phys. 1979, 12, 703–713. [Google Scholar] [CrossRef]
- Nicoara, I.; Stef, M. Charge compensating defects study of YbF3-doped BaF2 crystals using dielectric loss. Phys. Status Solid B 2016, 253, 397–403. [Google Scholar] [CrossRef]
- Nicoara, I.; Stef, M.; Buse, G.; Racu, A. Growth and characterization of ErF3 doped BaF2 crystals. J. Cryst. Growth 2020, 547, 125817. [Google Scholar] [CrossRef]
- Vañó-Galván, S.; Gárate, M.T.; Fleta-Asín, B.; Hidalgo, Á.; Fernández-Guarino, M.; Bermejo, T.; Jaén, P. Analysis of the Cost Effectiveness of Home-Based Phototherapy With Narrow-Band UV-B Radiation Compared With Biological Drugs For the Treatment of Moderate to Severe Psoriasis. Actas Dermo Sifiliográficas 2012, 103, 127–137. [Google Scholar] [CrossRef]
- Stef, M.; Nicoara, I.; Racu, A.; Buse, G.; Vizman, D. Spectroscopic properties of the gamma irradiated ErF3-doped BaF2 crystals. Radiat. Phys. Chem. 2020, 176, 109024. [Google Scholar] [CrossRef]
- Kaminskii, A.A. Crystalline Lasers: Physical Processes and Operating Schemes; CRC Press: Boca Raton, FL, USA, 1996. [Google Scholar]
- Kaminskii, A. Laser crystals and ceramics: Recent advances. Laser Photon. Rev. 2007, 1, 93–177. [Google Scholar] [CrossRef]
- Joubert, M.F.; Guy, S.; Jacquier, B. Model of the photon-avalanche effect. Phys. Rev. B 1993, 48, 10031. [Google Scholar] [CrossRef]
- Patel, D.N.; Reddy, R.B.; Nash-Stevenson, S.K. Diode-pumped violet energy upconversion in BaF2:Er3+. Appl. Opt. 1998, 33, 7805–7808. [Google Scholar] [CrossRef]
- Wojtowicz, A.J. VUV spectroscopy of BaF2: Er. Opt. Mater. 2009, 31, 474–478. [Google Scholar] [CrossRef]
- Zhang, X.; Chen, Z.; Qiu, J. Mechanistic investigation of upconversion luminescence in Er3+-doped BaCl2, BaF2 and NaYF4 phosphors. Mater. Chem. Phys. 2015, 162, 76–81. [Google Scholar] [CrossRef]
- Bitam, A.; Khiari, S.; Diaf, M.; Boubekri, H.; Boulma, E.; Bensalem, C.; Guerbous, L.; Jouart, J.P. Spectroscopic investigation of Er3+ doped BaF2 single crystal. Opt. Mater. 2018, 82, 104–109. [Google Scholar] [CrossRef]
- Witkowski, M.E.; Wojtowicz, A.J. High and low spin energy states of the Tb3+ 4f75d configuration in BaF2. Opt. Mater. 2011, 33, 1535–1539. [Google Scholar] [CrossRef]
- Orlovskii, Y.V.; Basiev, T.T.; Pukhov, K.K.; Alimov, O.K.; Glushkov, N.A.; Konyushkin, V.A. Low-phonon BaF2: Ho3+, Tm3+ doped crystals for 3.5–4 μm lasing. Opt. Mater. 2010, 32, 599–611. [Google Scholar] [CrossRef]
- Chaveza, D.; Garcia, C.R.; Oliva, J.; Montes, E.; Mtz-Enriquez, A.I.; Garcia-Lobato, M.A.; Diaz-Torres, L.A. Effect of Yb3+ concentration on the green-yellow upconversion emission of S rGe4O9:Er3+ phosphors. Ceram. Intern. 2019, 45, 16911–16917. [Google Scholar] [CrossRef]
- Judd, B.R. Optical Absorption Intensities of Rare-Earth Ions. Phys. Rev. 1962, 127, 750. [Google Scholar] [CrossRef]
- Ofelt, G.S. Intensities of Crystal Spectra of Rare-Earth Ions. J. Chem. Phys. 1962, 37, 511. [Google Scholar] [CrossRef]
- Preda, E.; Stef, M.; Buse, G.; Pruna, A.; Nicoara, I. Concentration dependence of the Judd–Ofelt parameters of Er3+ ions in CaF2 crystals. Phys. Scr. 2009, 79, 035304. [Google Scholar] [CrossRef]
- Nicoara, D.; Nicoara, I. An improved Bridgman-Stockbarger crystal growth system. Mater. Sci. Eng. 1988, A102, L1–L5. [Google Scholar] [CrossRef]
- Madirov, E.I.; Konyushkin, V.A.; Nakladov, A.N.; Fedorov, P.P.; Bergfeldt, T.; Busko, D.; Howard, I.A.; Richards, B.S.; Kuznetsov, S.V.; Turshatov, A.J. An up-conversion luminophore with high quantum yield and brightness based on BaF2:Yb3+,Er3+ single crystals. Mater. Chem. C 2021, 9, 3493–3503. [Google Scholar] [CrossRef]
- Yang, F.; Chen, J.; Zhang, L.; Zhu, R. Development of BaF2 crystals for future HEP experiments at the intensity frontiers. In Proceedings of the 2016 IEEE Nuclear Science Symposium, Medical Imaging Conference and Room-Temperature Semiconductor Detector Workshop (NSS/MIC/RTSD), Strasbourg, France, 29 October–6 November 2016; pp. 1–4. [Google Scholar] [CrossRef]
- Mujaji, M.; Burrows, J.; Jackson, R.A. Optical spectroscopy of the Nd3+ and Nd3+–Gd3+/Yb3+ centres in BaF2 crystals and calculations on lanthanide-doped BaF2. J. Lumin. 2014, 151, 106–110. [Google Scholar] [CrossRef]
- Petit, V.; Camy, P.; Doualan, J.; Moncorgé, R. Refined analysis of the luminescent centers in the Yb3+: CaF2 laser crystal. J. Lumin. 2007, 122, 5–7. [Google Scholar] [CrossRef]
- Tallant, D.R.; Wright, J.C. Selective laser excitation of charge compensated sites in CaF2:Er3+. J. Chem. Phys. 1975, 63, 2074–2085. [Google Scholar] [CrossRef]
- Andeen, C.; Link, D.; Fontanella, V. Cluster-associated relaxations in rare-earth-doped calcium fluoride. Phys. Rev. 1977, 16, 3762–3767. [Google Scholar] [CrossRef]
- Deren, P.J.; Mahiou, R. Spectroscopic characterisation of LaAlO3 crystals doped with Er3+ ions. Opt. Mater. 2007, 29, 766–772. [Google Scholar] [CrossRef]
- Justin Thomas, K.R. Departament of Chemistry, Indian Institute of Technology Roorkee, India, 2009. Available online: http://faculty.iitr.ac.in/~krjt8fcy/gocie.html (accessed on 11 July 2021).
- Mao, R.; Zhang, L.; Zhu, R.Y. LSO/LYSO Crystals for Future HEP Experiments. J. Phys. Conf. Ser. 2011, 293, 012004. [Google Scholar] [CrossRef] [Green Version]
- Maghrabi, M.; Townsend, P.D. Thermoluminescence spectra of rare earth doped Ca, Sr and Ba fluorides. J. Phys. Condens. Matter 2001, 13, 5817–5831. [Google Scholar] [CrossRef]
- Wojtowicz, A.J.; Janus, S. VUV luminescence of BaF2: Er and (Ba,La)F2:Er. Synchrotron Radiat. Nat. Sci. 2008, 7, 45–46. [Google Scholar]
Figure 1.
(a) As-grown BaF2: 0.08 mol% ErF3 crystal and (b) cleaved samples; the studied slice 7 is indicated. (c) As-grown BaF2: 0.15 mol% ErF3 crystal and (d) cleaved samples.
Figure 1.
(a) As-grown BaF2: 0.08 mol% ErF3 crystal and (b) cleaved samples; the studied slice 7 is indicated. (c) As-grown BaF2: 0.15 mol% ErF3 crystal and (d) cleaved samples.

Figure 2.
XRD pattern of BaF2: 0.08 mol% ErF3 sample.

Figure 3.
Optical absorption spectra of BaF2: x mol% ErF3 crystals. The insert shows the influence of the Er3+ ion number on the intensity of the main absorption bands. The asterisks indicate the absorption bands used for Judd–Ofelt (JO) analysis.
Figure 3.
Optical absorption spectra of BaF2: x mol% ErF3 crystals. The insert shows the influence of the Er3+ ion number on the intensity of the main absorption bands. The asterisks indicate the absorption bands used for Judd–Ofelt (JO) analysis.

Figure 4.
Influence of the ErF3 concentration on the Judd–Ofelt parameters, Ωt (10−20 cm2). The values corresponding to the concentration of 0.2 mol% ErF3 are designated by open symbols and come from paper [9].
Figure 4.
Influence of the ErF3 concentration on the Judd–Ofelt parameters, Ωt (10−20 cm2). The values corresponding to the concentration of 0.2 mol% ErF3 are designated by open symbols and come from paper [9].

Figure 5.
(a) Room temperature emission spectra of BaF2: x mol% ErF3 samples by λexc = 378 nm excitation. (b) Influence of the ErF3 concentration on the PL intensity of the green and red emissions.
Figure 5.
(a) Room temperature emission spectra of BaF2: x mol% ErF3 samples by λexc = 378 nm excitation. (b) Influence of the ErF3 concentration on the PL intensity of the green and red emissions.

Figure 6.
(a) Room temperature emission spectra of BaF2: x mol% ErF3 samples by λexc = 290 nm excitation. (b) Influence of the ErF3 concentration on the PL intensity of the UV emission (321 nm) and of the less intense emissions, at 402 nm and 471 nm.
Figure 6.
(a) Room temperature emission spectra of BaF2: x mol% ErF3 samples by λexc = 290 nm excitation. (b) Influence of the ErF3 concentration on the PL intensity of the UV emission (321 nm) and of the less intense emissions, at 402 nm and 471 nm.

Figure 7.
The energy-level diagram of Er3+ ions. The emission bands: (a) under excitation at 290 nm and (b) at 380 nm, are also shown.
Figure 7.
The energy-level diagram of Er3+ ions. The emission bands: (a) under excitation at 290 nm and (b) at 380 nm, are also shown.

Figure 8.
(a) The decay curves of the 4S3/2 → 4I15/2 transition (green emission, 539 nm) by excitation at 378 nm for two ErF3 concentrations (0.05 and 0.5 mol%). (b) The decay curves of the 4F9/2 → 4I15/2 transition (red emission, 650 nm) by excitation at 378 nm for two ErF3 concentrations (0.05 and 0.5 mol%). (c) The decay curves of the 2P3/2 → 4I15/2 transition (UV emission, 321 nm) by excitation at 295 nm for two ErF3 concentrations (0.05 and 0.5 mol%).

Figure 9.
(a) Influence of the ErF3 concentration on the intensity of the components of the three absorption bands specified by asterisk in Figure 3. (b) The sketches of the C3v center and hexamer cluster.
Figure 9.
(a) Influence of the ErF3 concentration on the intensity of the components of the three absorption bands specified by asterisk in Figure 3. (b) The sketches of the C3v center and hexamer cluster.

Figure 10.
Influence of ErF3 concentration on the experimental and calculated radiative lifetime for (a) the green emission and (b) the red emission.
Figure 10.
Influence of ErF3 concentration on the experimental and calculated radiative lifetime for (a) the green emission and (b) the red emission.

Figure 11.
Emission cross-sections of BaF2: x mol% ErF3 crystals: (a) the UV emission; (b) the green emission; and (c) the red emission. The UV, green and red emissions of the 0.05 mol% ErF3 sample are highlighted.
Figure 11.
Emission cross-sections of BaF2: x mol% ErF3 crystals: (a) the UV emission; (b) the green emission; and (c) the red emission. The UV, green and red emissions of the 0.05 mol% ErF3 sample are highlighted.

Figure 12.
CIE coordinates for the emissions of BaF2: x mol% ErF3 samples. (a) For emissions obtained at 378 nm excitation; (b) ErF3 concentration dependence of the green to red intensity ratio (Ig/Ir); (c) CIE coordinates for emissions obtained at 290 nm excitation; (d) ErF3 concentration dependence of the 321 nm to 402 nm intensity ratio (I321/I402).


Table 1.
Slice parameters. The cleavage plane is (111).
| BaF2: x mol% ErF3 | ||
|---|---|---|
| x | d (mm) Slice Thickness | N (1020 cm−3) Er3+ Ion Concentration |
| 0.05 (Slice 8) | 2.21 | 0.105 |
| 0.08 (Slice 7) | 2.32 | 0.168 |
| 0.15 (Slice 9) | 2.37 | 0.315 |
| 0.50 (Slice 9) | 2.62 | 1.050 |
Table 2.
The mean wavelength, the wavelength range and the integrated absorption cross-section, , of the selected absorption peaks.
Table 2.
The mean wavelength, the wavelength range and the integrated absorption cross-section, , of the selected absorption peaks.
| Transition 4I15/2 ↓ | λmean (nm) | Wavelength Range (nm) | ||||
|---|---|---|---|---|---|---|
| BaF3: x mol% ErF3 | ||||||
| x = 0.05 | 0.08 | 0.15 | 0.50 | |||
| 4I9/2 | 802 | 788–808 | 0.001 | 0.003 | 0.005 | 0.023 |
| 4F9/2 | 653 | 619–680 | 0.020 | 0.023 | 0.051 | 0.066 |
| 2H(2)11/2 | 519 | 502–532 | 0.025 | 0.033 | 0.071 | 0.086 |
| 4G11/2 | 377 | 369–386 | 0.022 | 0.035 | 0.072 | 0.089 |
Table 3.
The influence of ErF3 concentration on the Judd–Ofelt parameters and on the spectroscopic quality factor (χ), including estimated errors of JO parameters.
Table 3.
The influence of ErF3 concentration on the Judd–Ofelt parameters and on the spectroscopic quality factor (χ), including estimated errors of JO parameters.
| Ωi (10−20 cm2) | ErF3 Concentration (mol%) | |||
|---|---|---|---|---|
| 0.05 | 0.08 | 0.15 | 0.50 | |
| Ω2 | 0.7083 ± 0.31 | 0.6073 ± 0.50 | 0.6749 ± 0.34 | 0.6678 ± 0.51 |
| Ω4 | 0.0495 ± 0.02 | 0.1397 ± 0.03 | 0.1118 ± 0.02 | 0.1376 ± 0.037 |
| Ω6 | 0.8036 ± 0.05 | 0.4271 ± 0.08 | 0.5525 ± 0.06 | 0.7152 ± 0.08 |
| Χ = Ω4/Ω6 | 0.06163 | 0.32717 | 0.20232 | 0.19237 |
Table 4.
Measured and calculated absorption line strengths (10−22 cm2) for the four samples.
| BaF3: x mol% ErF3 | x= | 0.05 | 0.08 | 0.15 | 0.50 | ||||
|---|---|---|---|---|---|---|---|---|---|
| 4I15/2 ↓ Transition | λ (nm) | ||||||||
| 4I9/2 | 802 | 1.62 | 1.65 | 2.89 | 2.84 | 2.51 | 2.48 | 3.14 | 3.09 |
| 4F9/2 | 653 | 39.7 | 39.76 | 27.2 | 27.21 | 31.51 | 31.50 | 40.41 | 40.40 |
| 2H(2)11/2 | 519 | 62.3 | 59.94 | 49.0 | 52.98 | 55.07 | 57.81 | 55.78 | 59.87 |
| 4G11/2 | 377 | 75.1 | 77.04 | 71.17 | 68.10 | 76.44 | 74.31 | 80.09 | 76.92 |
| ΔSrms [×10–20 cm2] | 0.031 | 0.050 | 0.035 | 0.052 | |||||
Table 5.
The radiative emission probabilities (AJJ’), the branching ratios (β) and the radiative lifetimes (τrad).
Table 5.
The radiative emission probabilities (AJJ’), the branching ratios (β) and the radiative lifetimes (τrad).
| BaF2: x mol% ErF3 | |||||||||||||
|---|---|---|---|---|---|---|---|---|---|---|---|---|---|
| Transitions | λmean (nm) | x = 0.05 | x = 0.08 | x = 0.15 | x = 0.5 | ||||||||
(s−1) | β | τrad (ms) | (s−1) | β | τrad (ms) | (s−1) | β | τrad (ms) | (s−1) | β | τrad (ms) | ||
| 4I13/2 → 4I15/2 | 1522 | 71.9 | 1 | 13.9 | 52.5 | 1 | 19.1 | 59 | 1 | 16.9 | 67.6 | 1 | 14.8 |
| 4I11/2 → 4I15/2 →4I13/2 | 976 2778 | 54.4 6.5 | 0.89 0.11 | 16.4 | 30.0 3.6 | 0.89 0.11 | 29.8 | 38.2 4.6 | 0.89 0.11 | 23.3 | 48.6 5.9 | 0.89 0.11 | 18.4 |
| 4I9/2 → 4I15/2 →4I13/2 →4I11/2 | 802 1739 4651 | 5.7 20.40.2 | 0.22 0.78 ~0 | 38 | 9.85 10.9 0.12 | 0.47 0.52 ~0 | 47.9 | 8.6 14.1 0.1 | 0.38 0.62 ~0 | 43.9 | 10.71 18.2 0.2 | 0.37 0.63 ~0 | 34.4 |
| 4F9/2 → 4I15/2 →4I13/2 →4I11/2 →4I9/2 | 653 1156 1980 3448 | 261.5 8.7 30.5 2.6 | 0.86 0.03 0.1 ~0 | 3.3 | 178.9 7.1 18.8 2.5 | 0.86 0.03 0.09 0.01 | 4.8 | 207.2 7.7 22.3 2.5 | 0.86 0.03 0.09 0.01 | 4.2 | 265.7 9.6 27.7 2.6 | 0.87 0.03 0.09 0.01 | 3.3 |
| 4S3/2 → 4I15/2 →4I13/2 →4I11/2 →4I9/2 →4F9/2 | 543 844 1212 1639.4 3125 | 521.5 217.7 15.7 22 0.3 | 0.67 0.28 0.02 0.03 ~0 | 1.3 | 277.2 115.7 8.5 12.6 0.2 | 0.67 0.28 0.02 0.03 ~0 | 2.4 | 358.6 149.6 10.9 15.8 0.2 | 0.67 0.28 0.02 0.03 ~0 | 1.9 | 464.2 193.7 14.1 20.4 0.3 | 0.67 0.28 0.02 0.03 ~0 | 1.4 |
| 2H(2)11/2 → 4I15/2 →4I13/2 →4I11/2 →4I9/2 →4F9/2 →4S3/2 | 519 791 1105 1449 2500 12,500 | 668.5 66.9 13.4 19.9 2.7 ~0 | 0.87 0.09 0.02 0.03 ~0 ~0 | 1.3 | 590.9 61.6 12.8 13.7 2.3 ~0 | 0.87 0.09 0.02 0.02 ~0 ~0 | 1.5 | 644.8 63.7 13.2 16.2 2.6 ~0 | 0.87 0.09 0.02 0.02 ~0 ~0 | 1.4 | 667.7 66.8 14.2 18.5 2.5 ~0 | 0.87 0.09 0.02 0.02 ~0 ~0 | 1.3 |
| 4F7/2 → 4I15/2 →4I13/2 →4I11/2 →4I9/2 →4F9/2 →4S3/2 →2H(2)11/2 | 486 725 980 1242 1942 5128 8696 | 1016.6 10.4 34.2 52.6 9.5 ~0 0.1 | 0.9 ~0 0.03 0.05 ~0 ~0 ~0 | 0.9 | 573.5 29.2 25.9 33.7 9.3 ~0 0.1 | 0.85 0.04 0.04 0.05 0.01 ~0 ~0 | 1.5 | 721.7 23.4 28.9 40.1 9.4 ~0 ~0 | 0.88 0.03 0.03 0.05 0.01 ~0 ~0 | 1.2 | 932.1 28.7 36.7 48.9 9.5 ~0 ~0 | 0.88 0.03 0.03 0.05 0.01 ~0 ~0 | 0.9 |
Table 6.
The calculated (τrad) and measured radiative lifetime (τ) by other authors.
| Energy Level | λm (nm) | Calculated Lifetime (This Work) | ErF3 Concentration (mol%) | Measured Lifetime τ (ms) | |||
|---|---|---|---|---|---|---|---|
| 0.05 | 0.08 | 0.15 | 0.50 | ||||
| 4F9/2 | 653 | τrad (ms) | 3.297 | 4.826 | 4.164 | 3.273 | 2.21 [9] |
| 4S3/2 | 539 | 1.287 | 2.415 | 1.869 | 1.443 | 1.1 [9], 0.56 [16] 0.88 [13] | |
| 2H(2)11/2 | 522 | 1.296 | 1.468 | 1.351 | 1.299 | 0.95 [9] | |
| 2P3/2 | 321 | 0.674 | 0.420 | 0.906 | 0.714 | 0.48 [9] | |
Table 7.
Experimental lifetime values obtained using reconvolution fit.
Lifetime | Energy Level | λm [nm] | ErF3 Concentration (mol%) | |||
|---|---|---|---|---|---|---|
| 0.05 | 0.08 | 0.15 | 0.50 | |||
| (ns) | 2P3/2 | 321 | 26.909 | 26.836 | 26.369 | 26.683 |
| (ms) | 4S3/2 | 539 | 3.446 | 3.288 | 0.736 | 0.303 |
| (ms) | 4F9/2 | 650 | 1.846 | 1.812 | 1.948 | 1.737 |
Table 8.
The estimated gain parameters (G) for the red, green and UV emissions.
| BaF2: x mol% ErF3 | |||||
|---|---|---|---|---|---|
| G (×10−24 cm2·s) | x = 0.05 | x = 0.08 | x = 0.15 | x = 0.5 | x = 0.2 [9] |
| UV emission | 0.37 | 0.35 | 0.36 | 0.35 | - |
| Green emission | 6.8 | 3.4 | 2.1 | 4.7 | 3.3 |
| Red emission | 3.0 | 1.8 | 2.5 | 2.8 | 6.4 |
Publisher’s Note: MDPI stays neutral with regard to jurisdictional claims in published maps and institutional affiliations. |
© 2021 by the authors. Licensee MDPI, Basel, Switzerland. This article is an open access article distributed under the terms and conditions of the Creative Commons Attribution (CC BY) license (https://creativecommons.org/licenses/by/4.0/).
Share and Cite
MDPI and ACS Style
Racu, A.; Stef, M.; Buse, G.; Nicoara, I.; Vizman, D. Luminescence Properties and Judd–Ofelt Analysis of Various ErF3 Concentration-Doped BaF2 Crystals. Materials 2021, 14, 4221. https://0-doi-org.brum.beds.ac.uk/10.3390/ma14154221
AMA Style
Racu A, Stef M, Buse G, Nicoara I, Vizman D. Luminescence Properties and Judd–Ofelt Analysis of Various ErF3 Concentration-Doped BaF2 Crystals. Materials. 2021; 14(15):4221. https://0-doi-org.brum.beds.ac.uk/10.3390/ma14154221
Chicago/Turabian StyleRacu, Andrei, Marius Stef, Gabriel Buse, Irina Nicoara, and Daniel Vizman. 2021. "Luminescence Properties and Judd–Ofelt Analysis of Various ErF3 Concentration-Doped BaF2 Crystals" Materials 14, no. 15: 4221. https://0-doi-org.brum.beds.ac.uk/10.3390/ma14154221
Note that from the first issue of 2016, this journal uses article numbers instead of page numbers. See further details here.