
Optimization of Bio-Foamed Concrete Brick Strength via Bacteria Based Self-Healing and Bio-Sequestration of CO2


 , , ,
, , , 
Abstract
:
1. Introduction
2. Materials and Methods
2.1. Materials
2.1.1. Cement
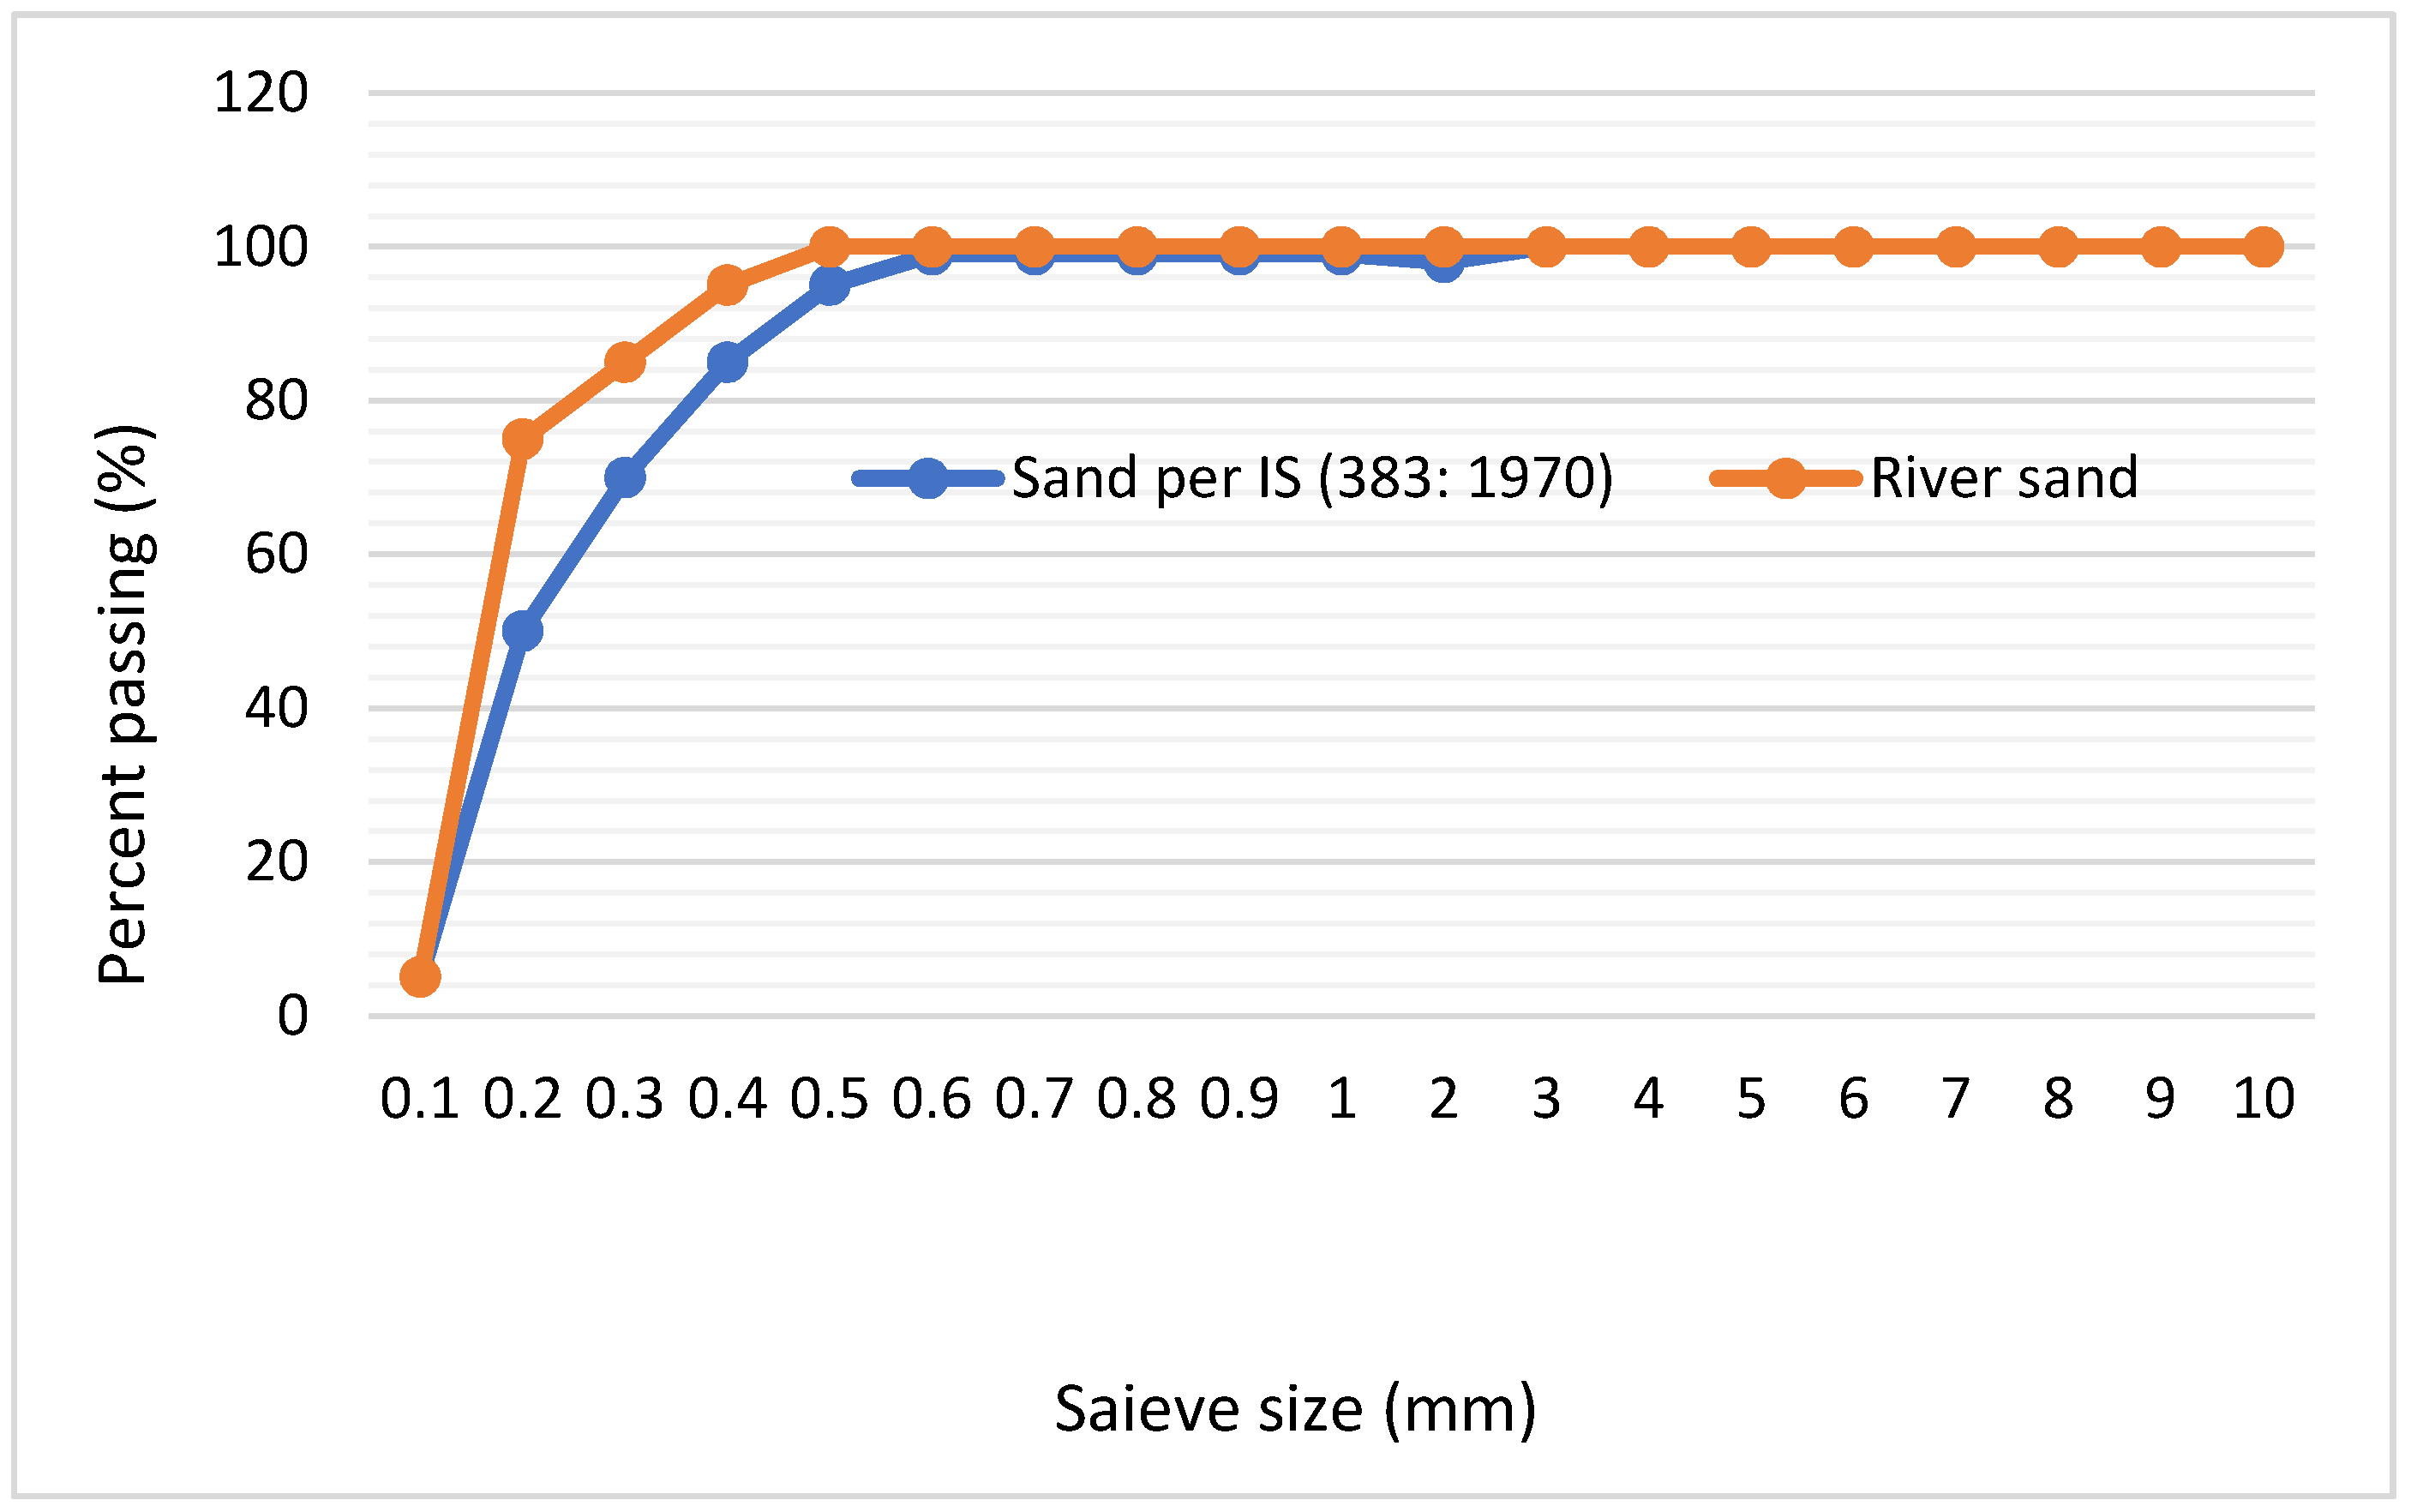
2.1.2. Sand
2.1.3. Water
2.1.4. Bacteria
2.1.5. Foam Agent
2.2. Methods
2.2.1. Design of Experiments
2.2.2. Mixture Design
2.2.3. Specimen Preparation and Curing
3. Results and Discussion
3.1. Screening Stage Analysis (2k Factorial Design)
3.2. Compressive Strength of B-FCB (2k Factorial Analysis)
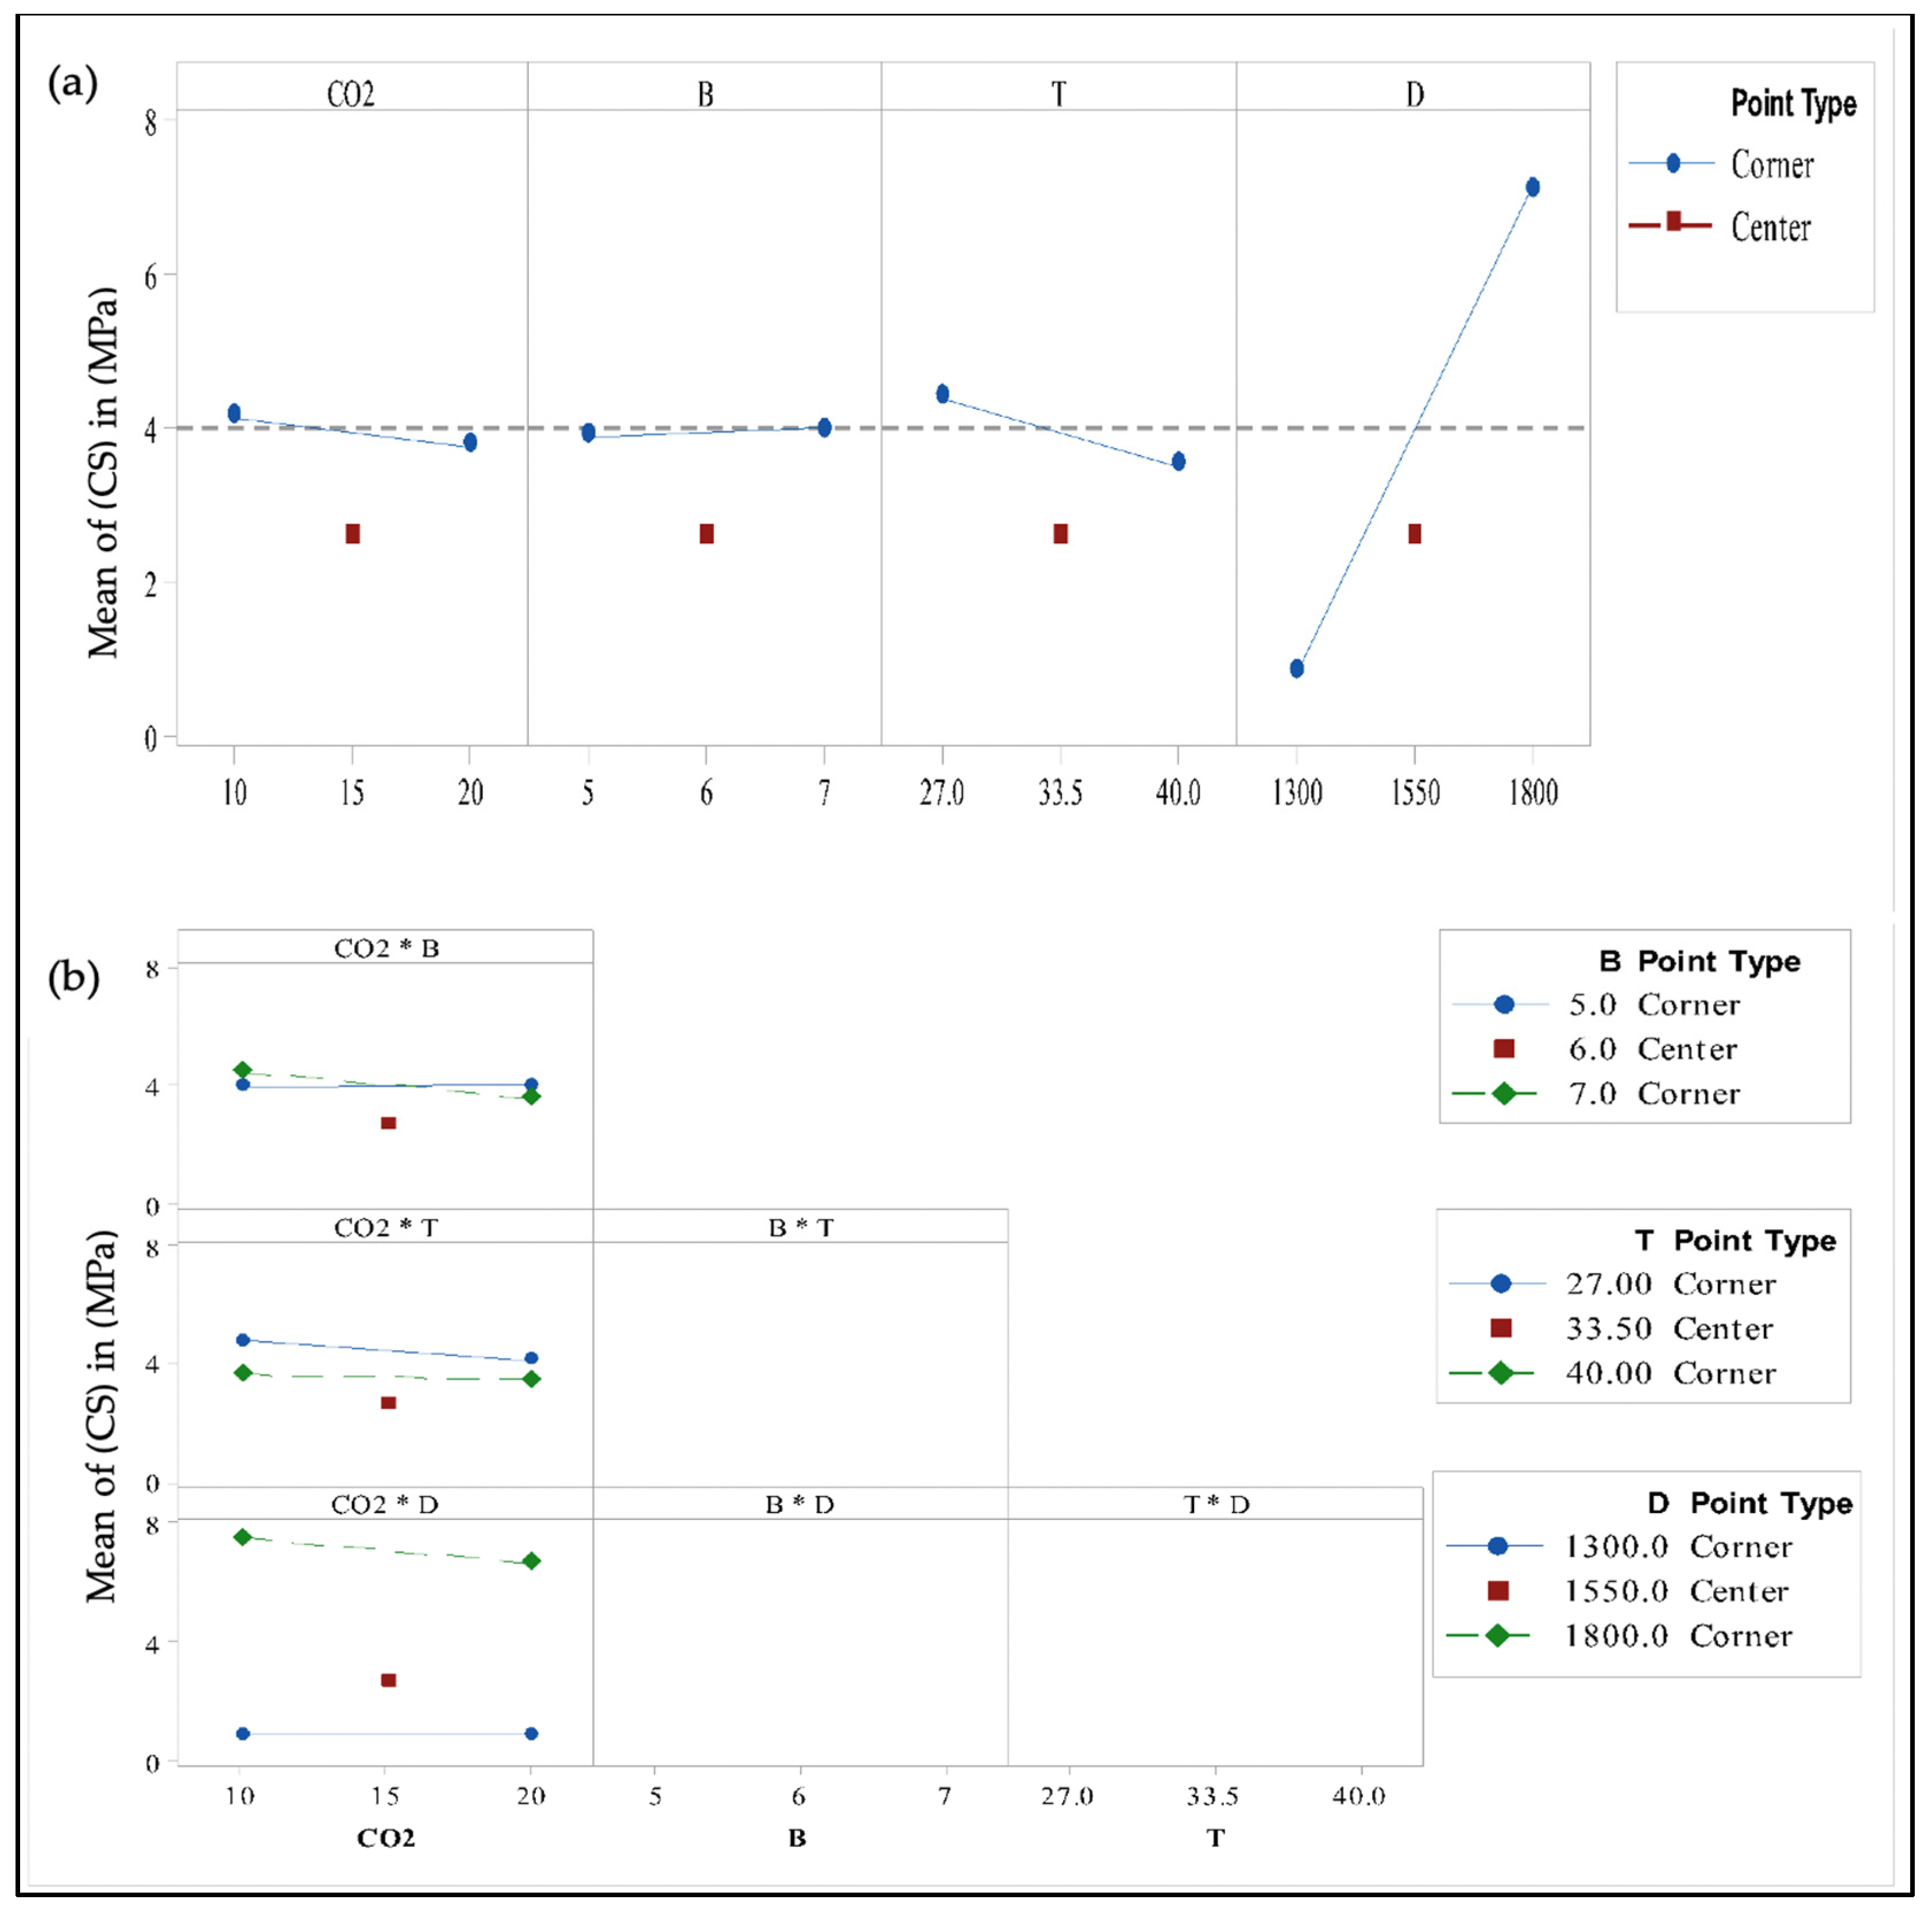
3.2.1. ANOVA Analysis, Main Effect and Interaction Plots
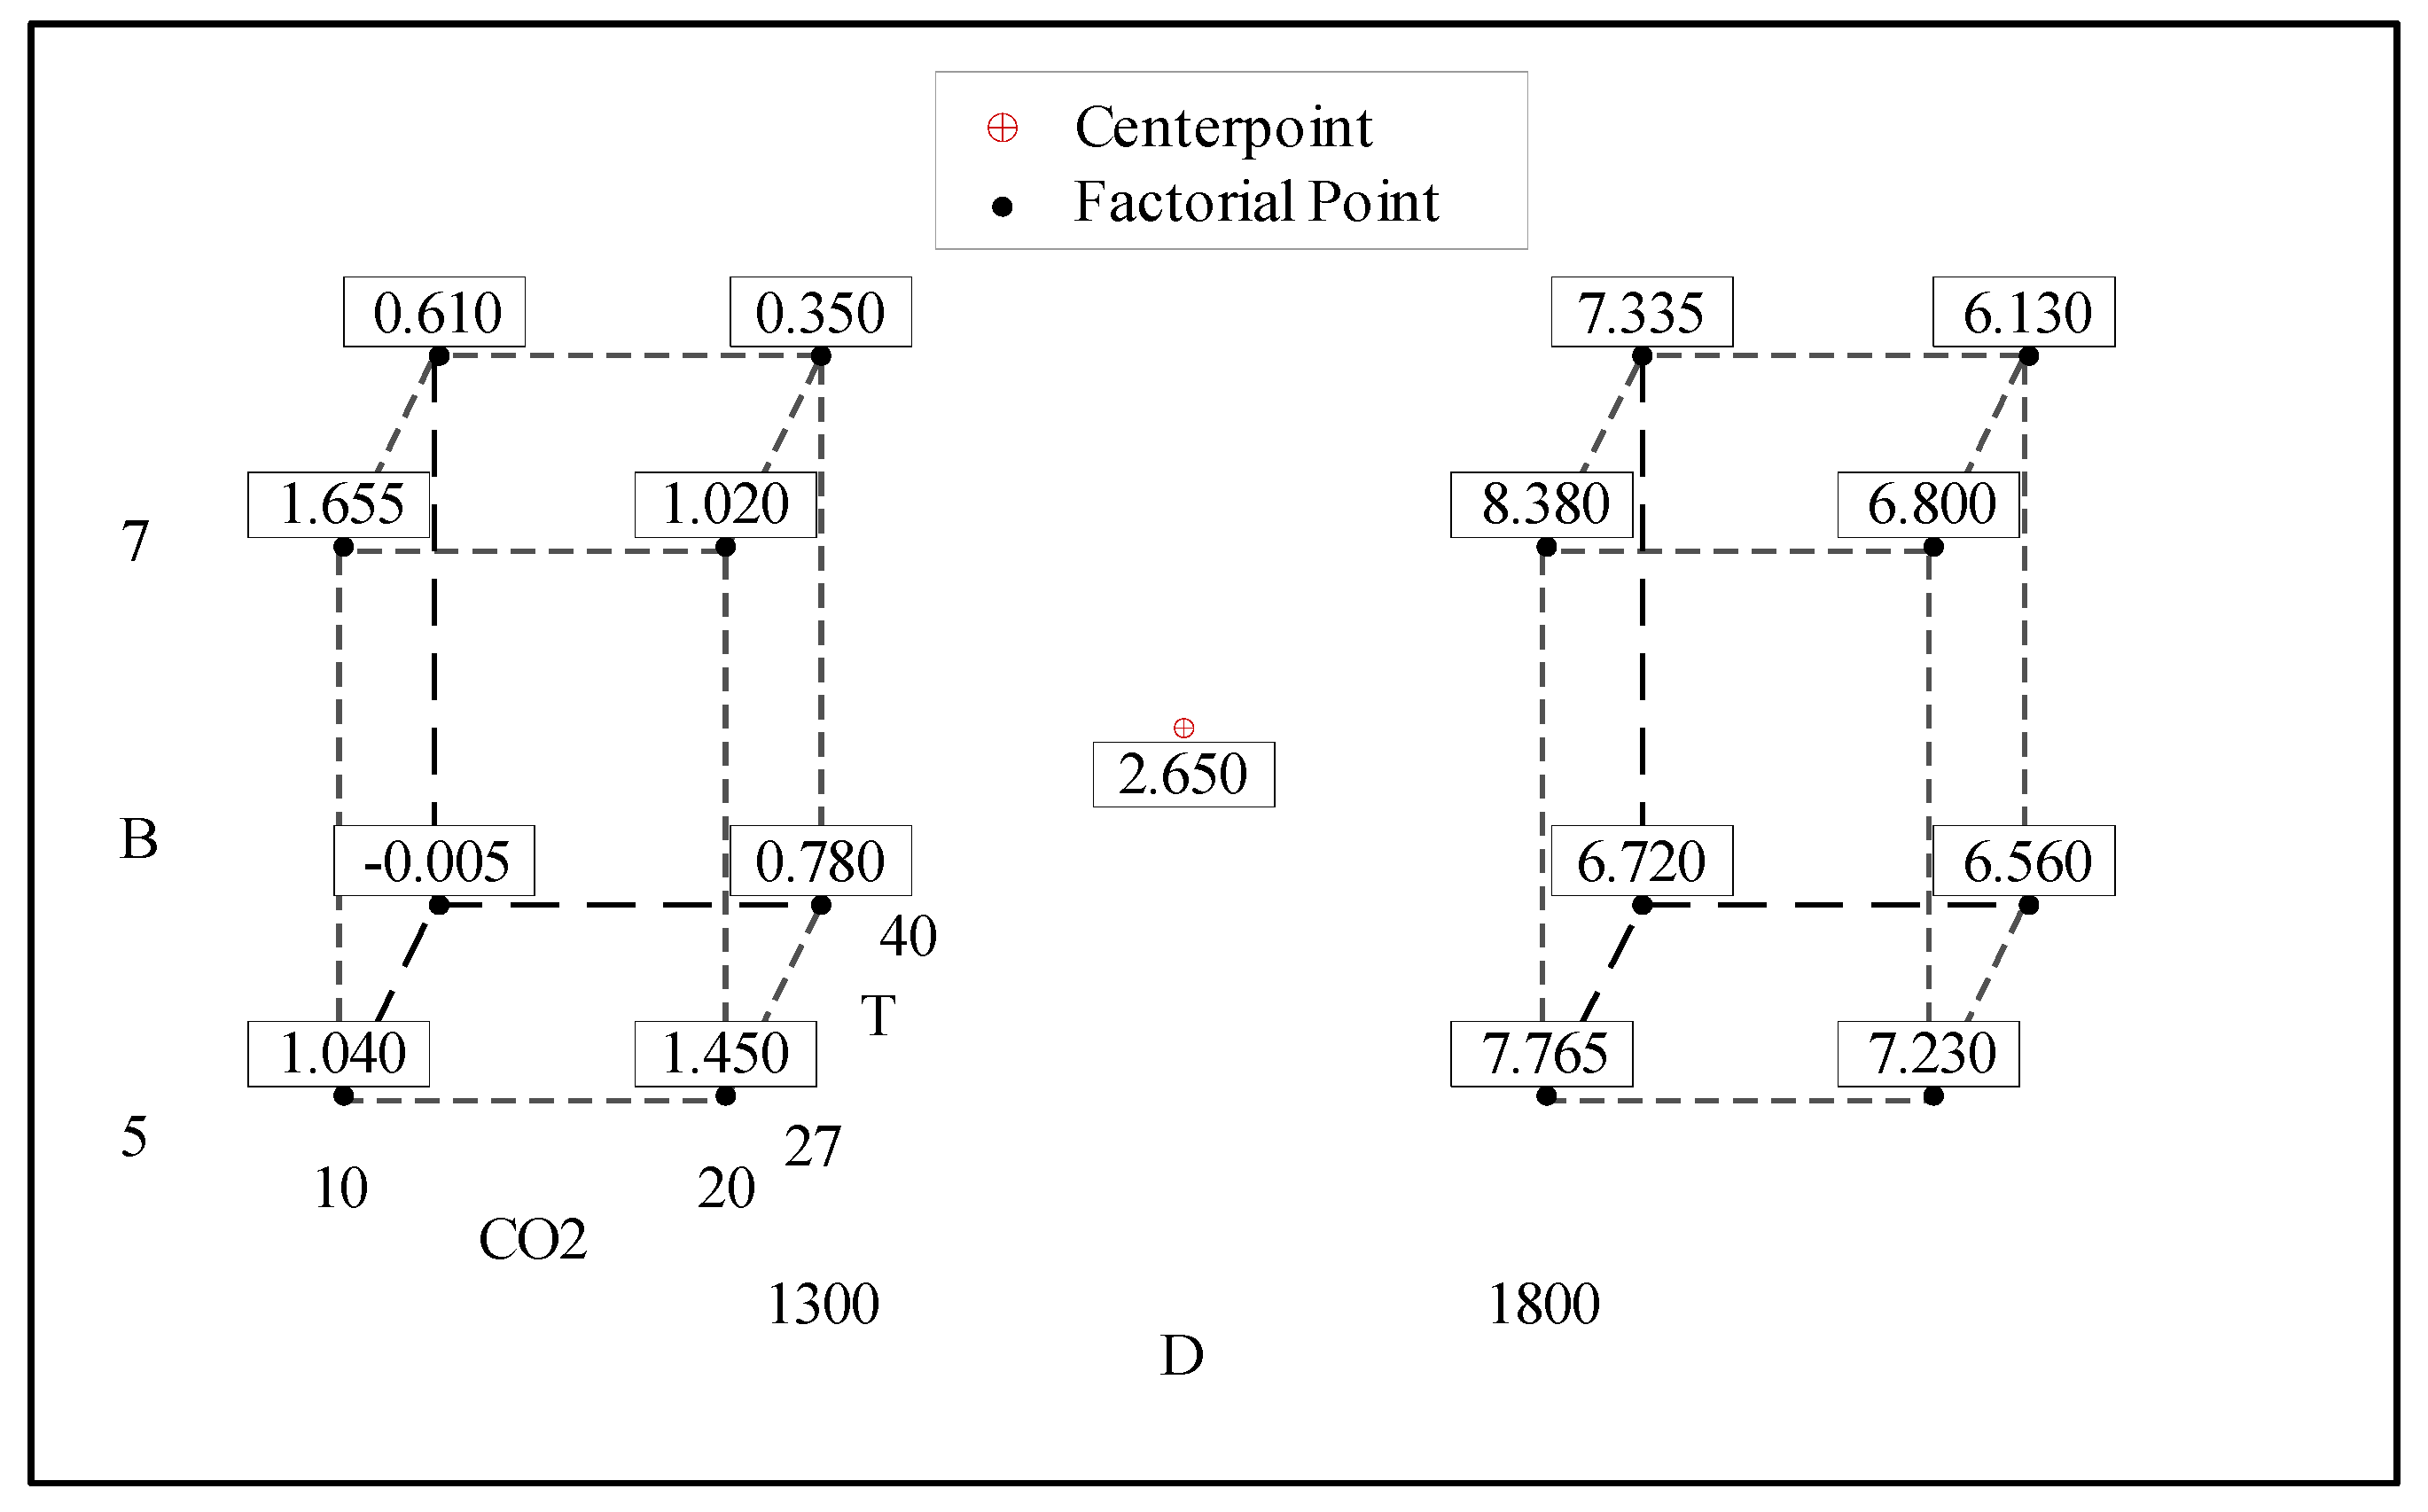
3.2.2. Cube Plot of B-FCB Compressive Strength
3.3. Analysis of Response Surface Methodology (RSM) Results
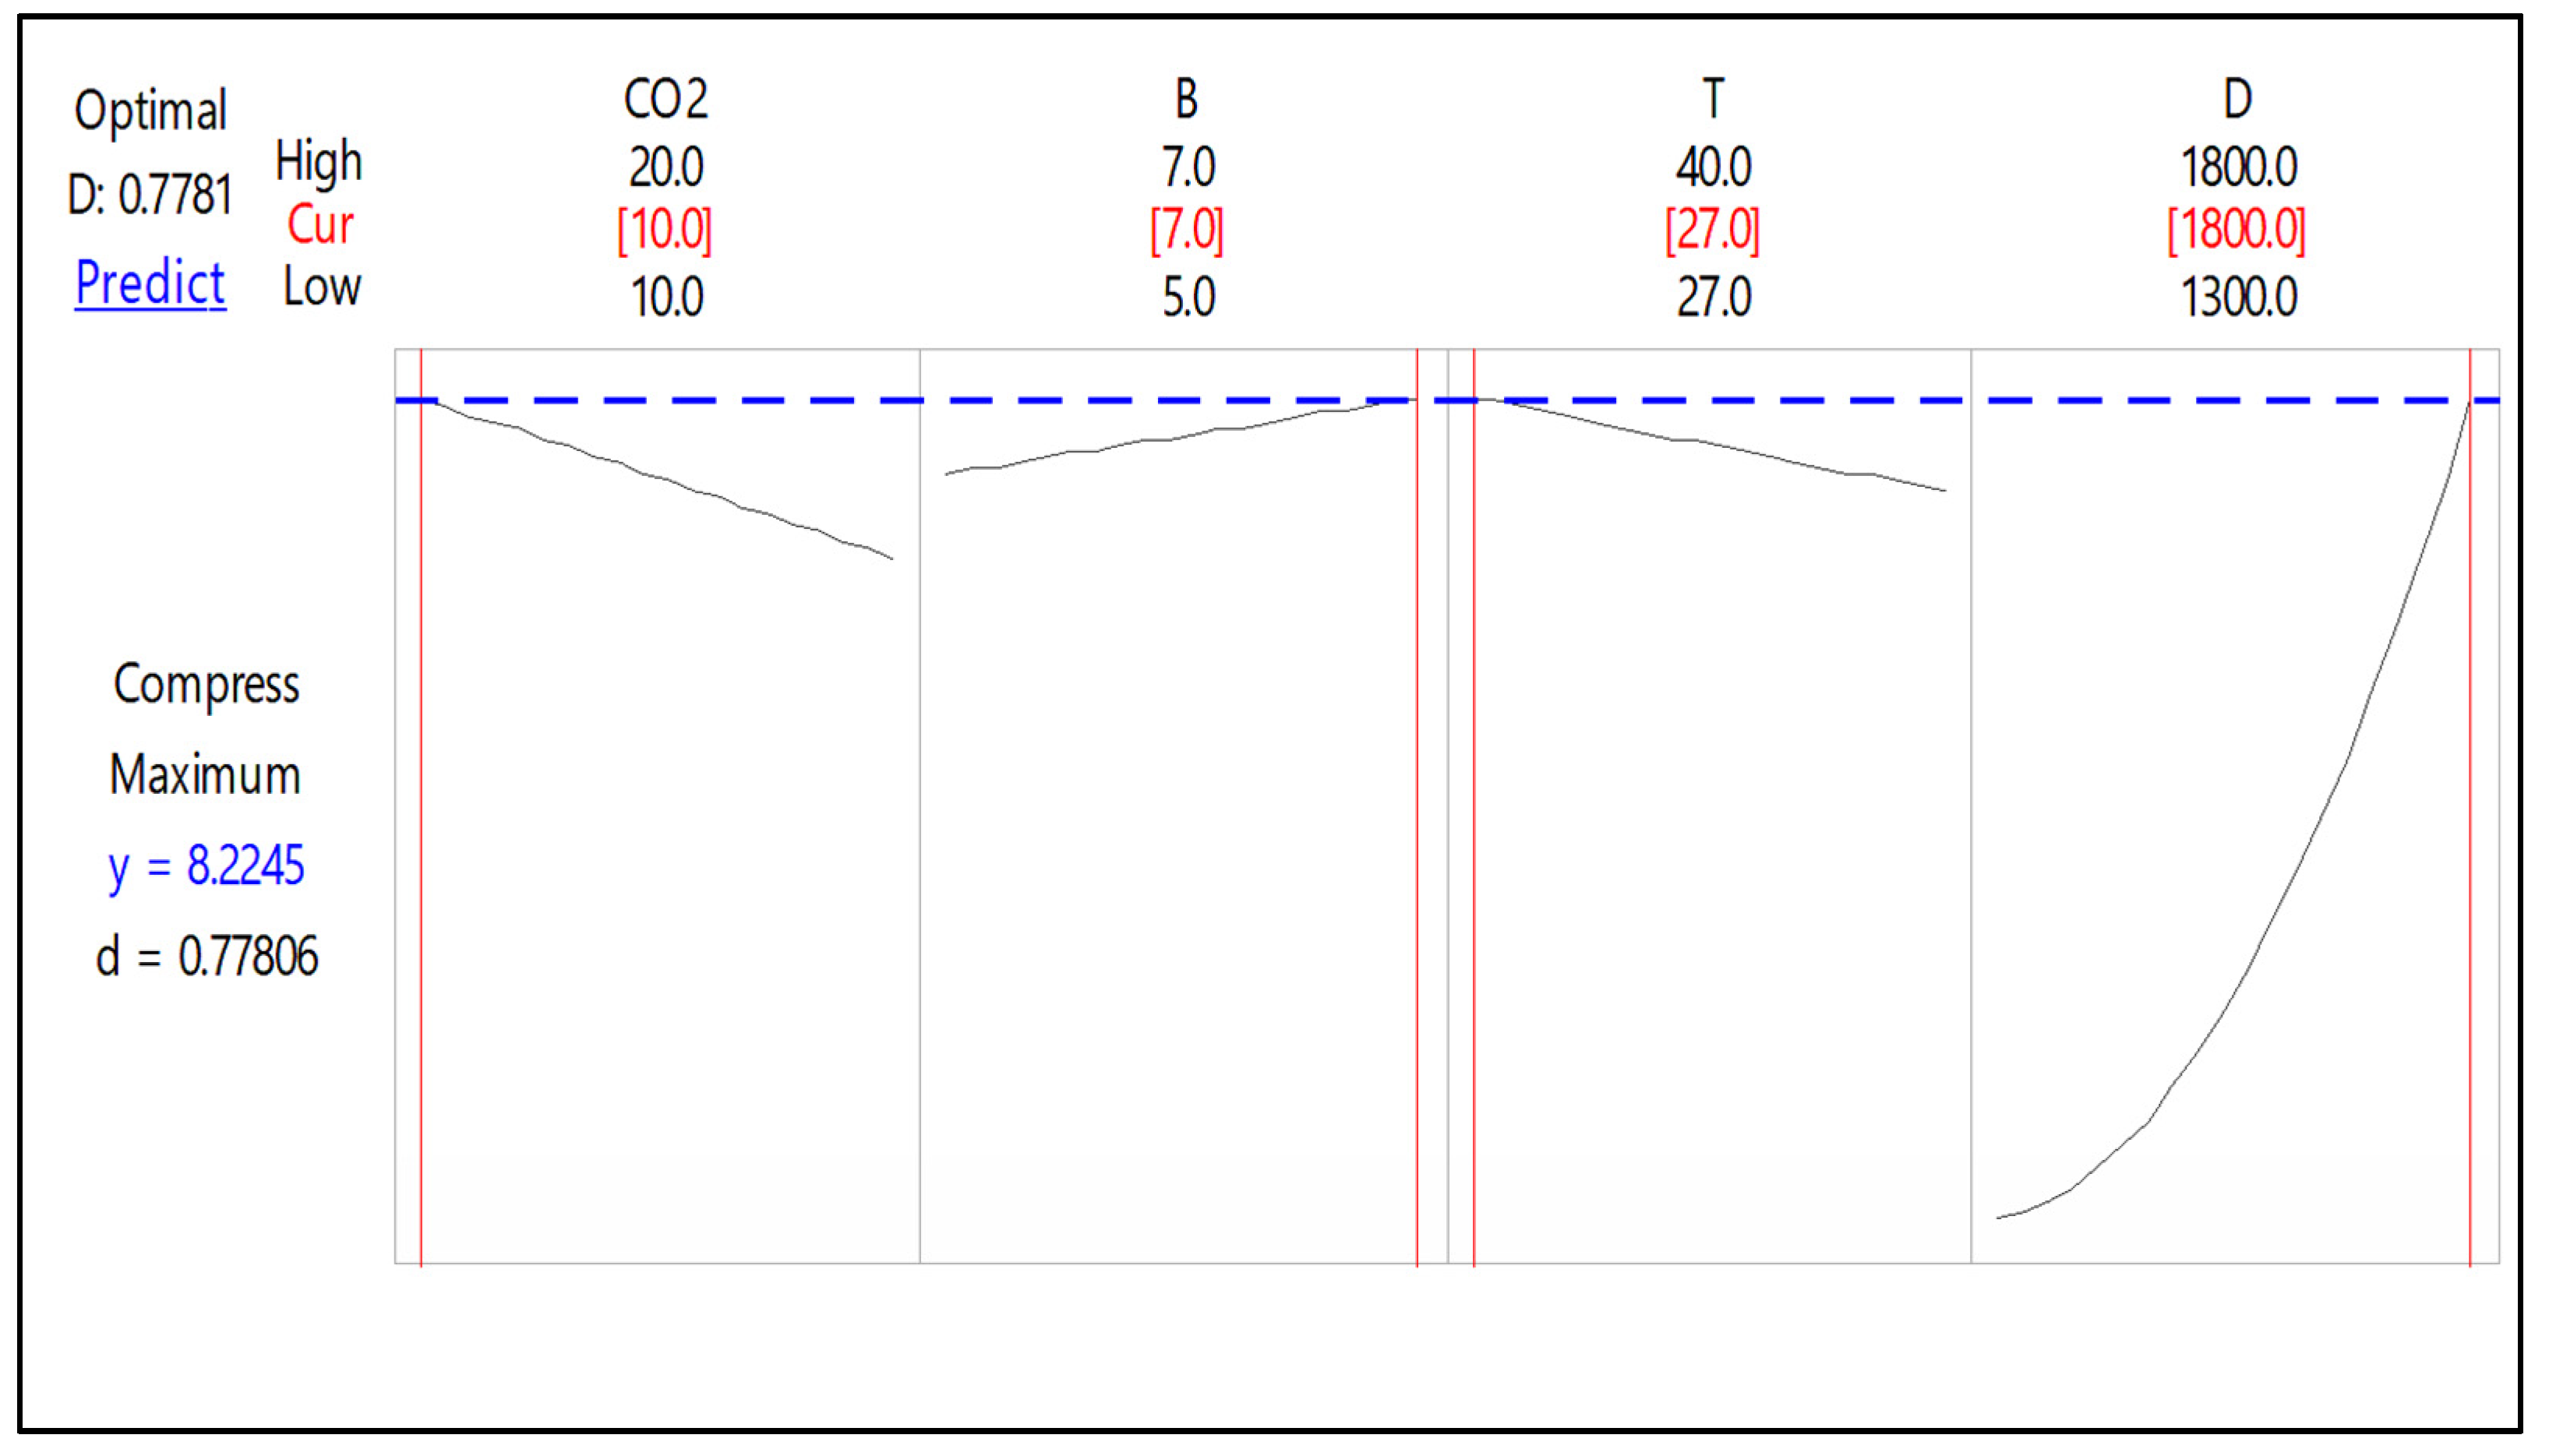
3.3.1. Optimisation of Compressive Strength for B-FCB
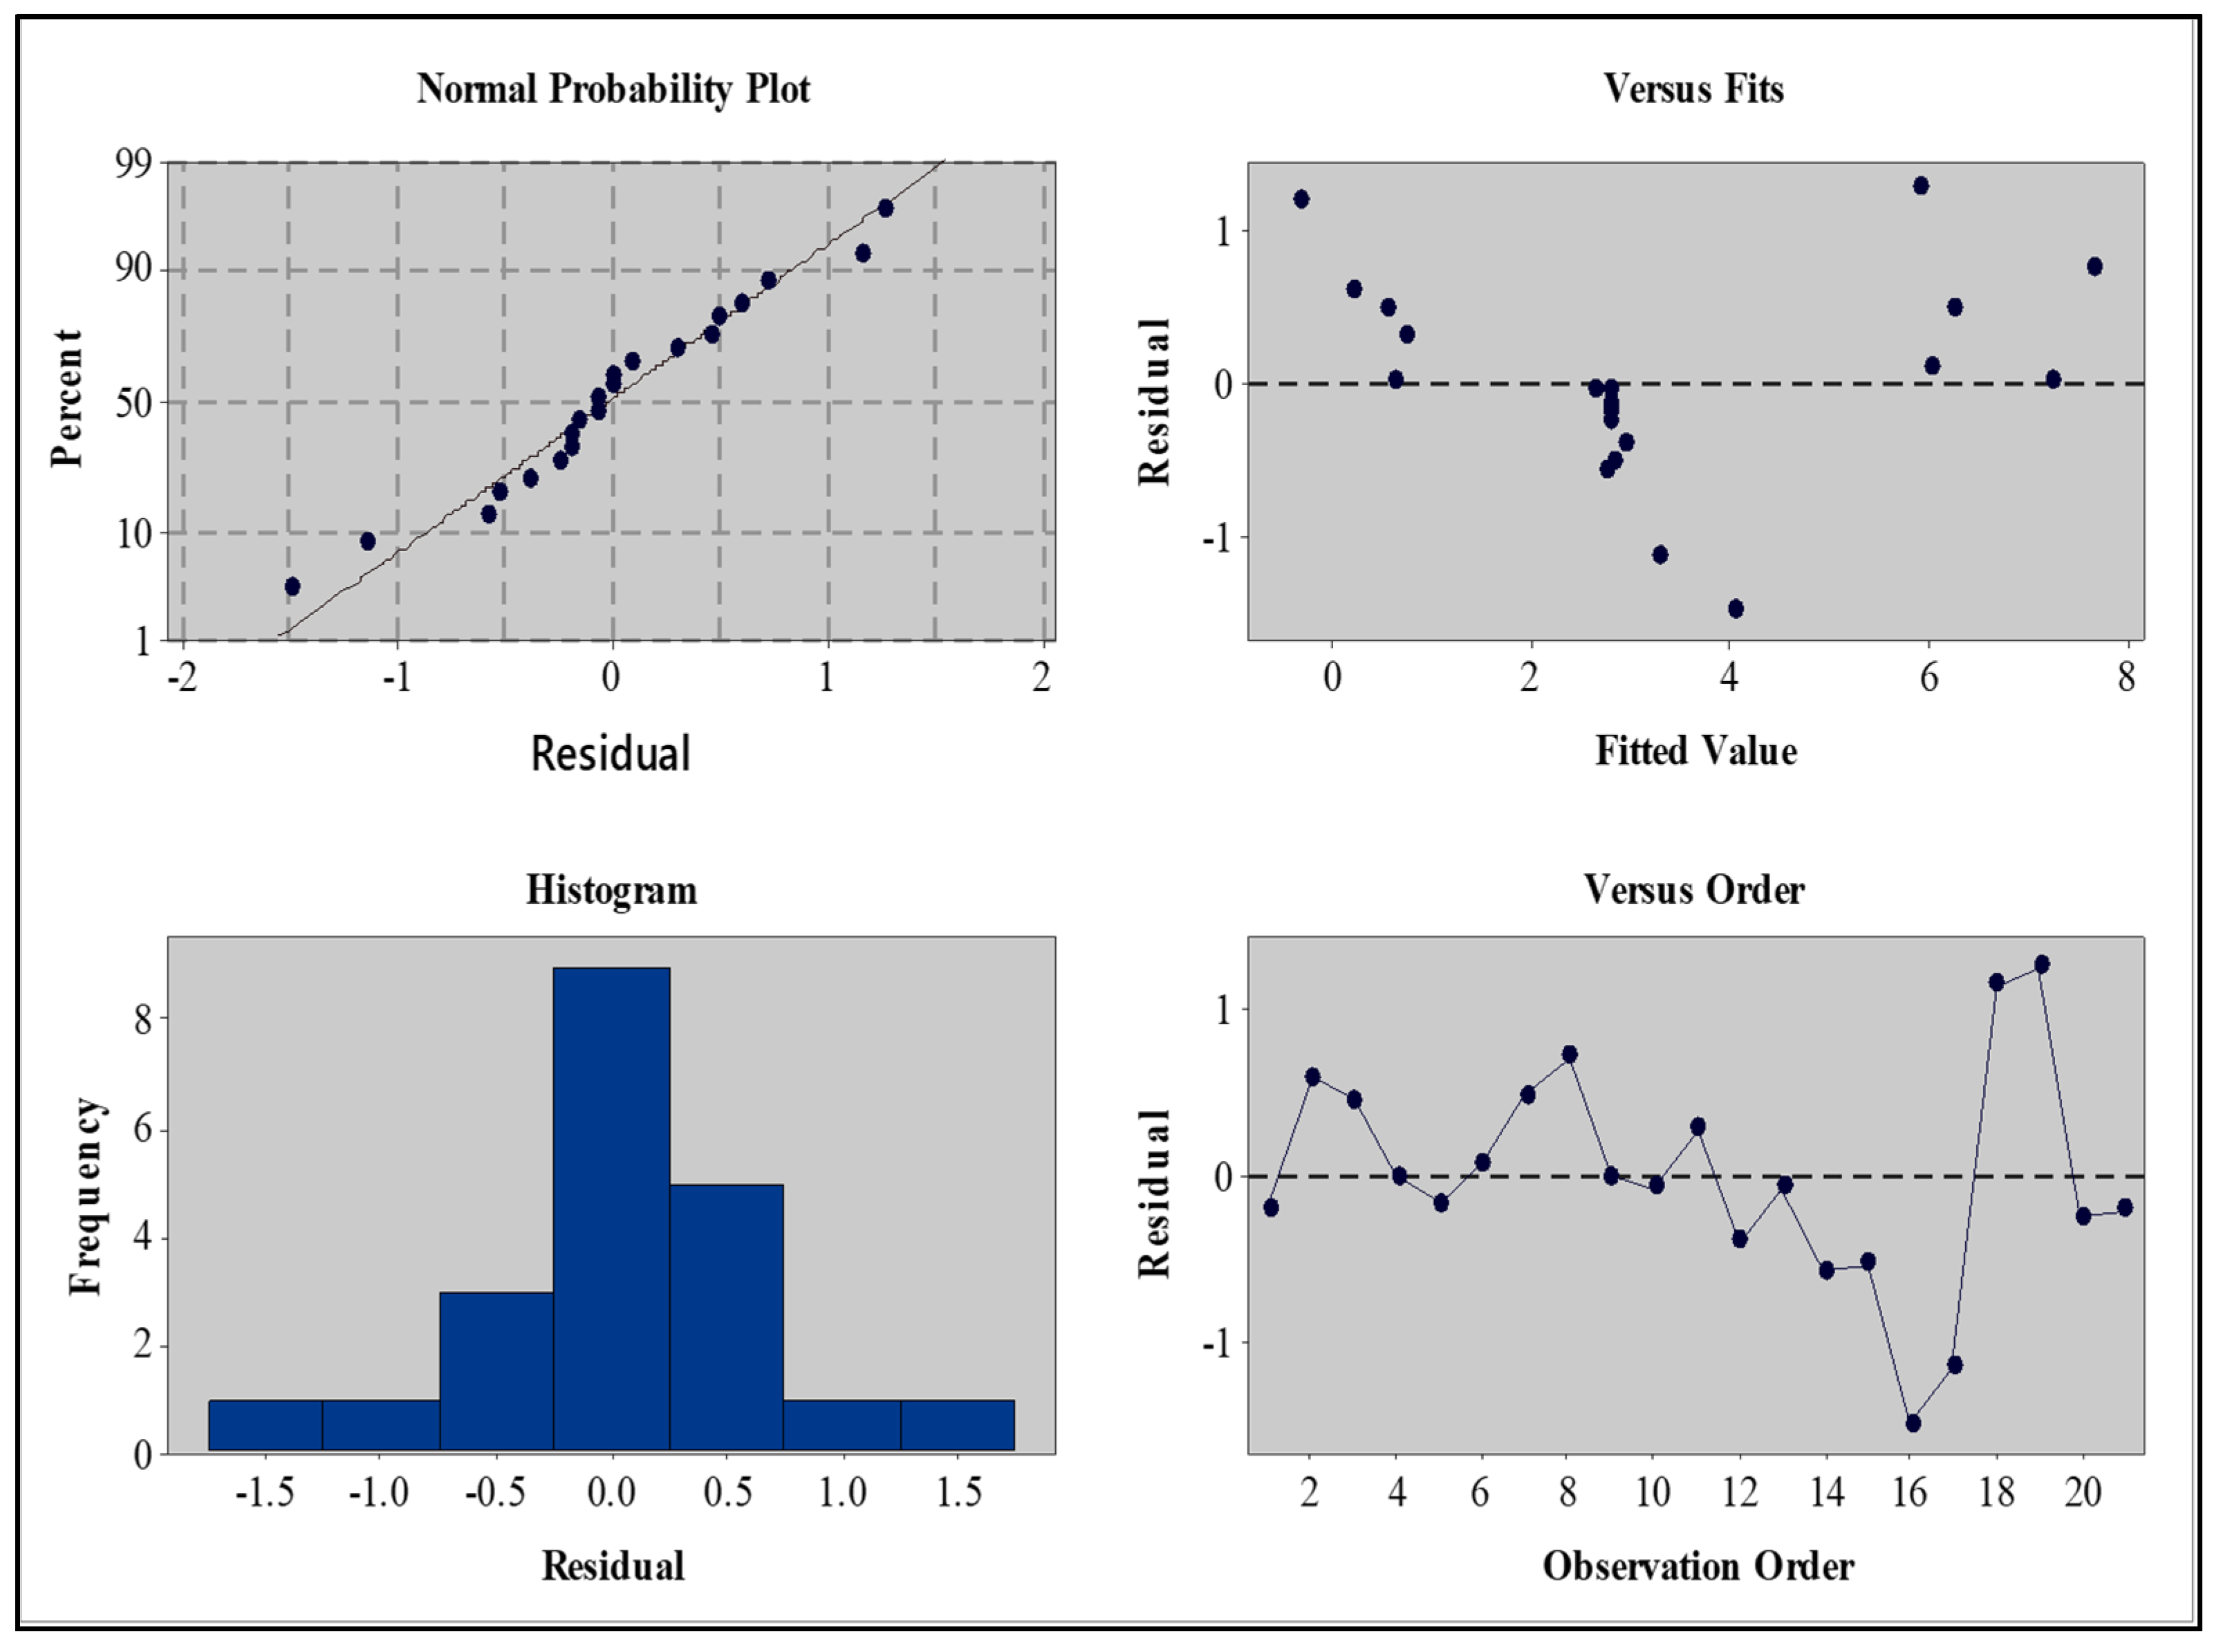
Residual Plot for B-FCB Compressive Strength
Analysis of RSM-ANOVA for Compressive Strength of B-FCB
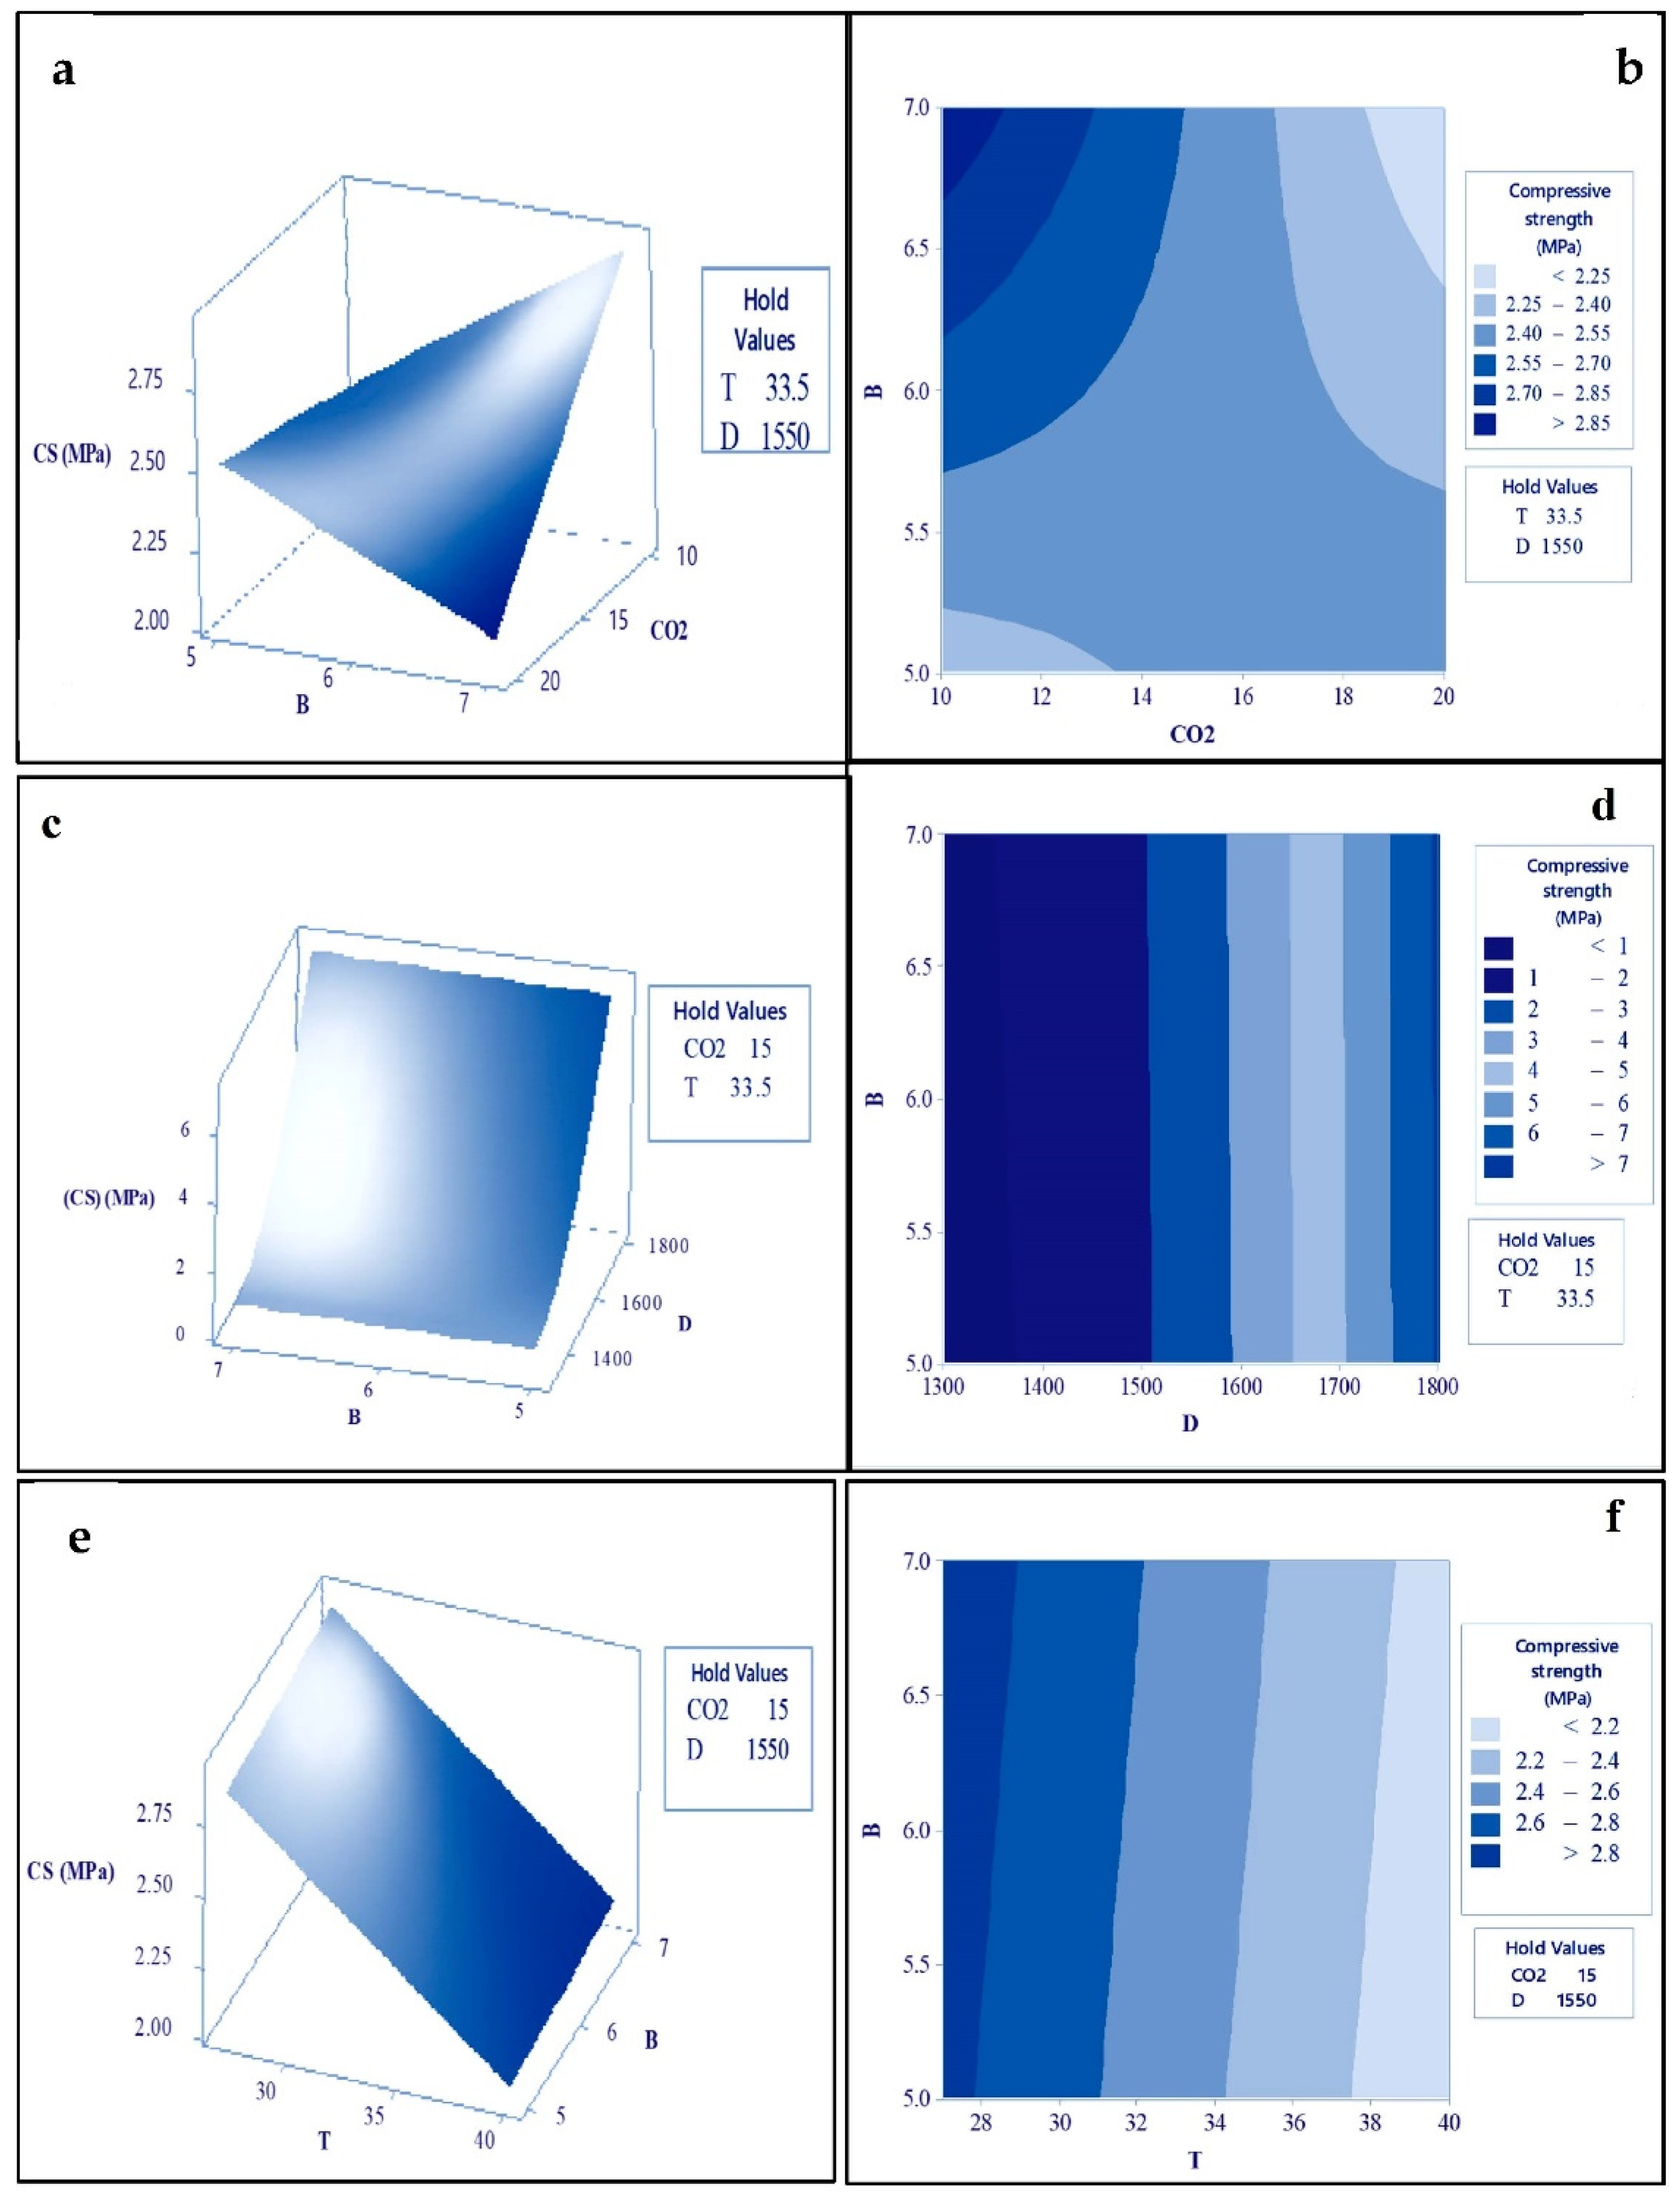
Response Surface and Contour Plots for the Compressive Strength of B-FCB
Optimization Plots for Compressive Strength of B-FCB
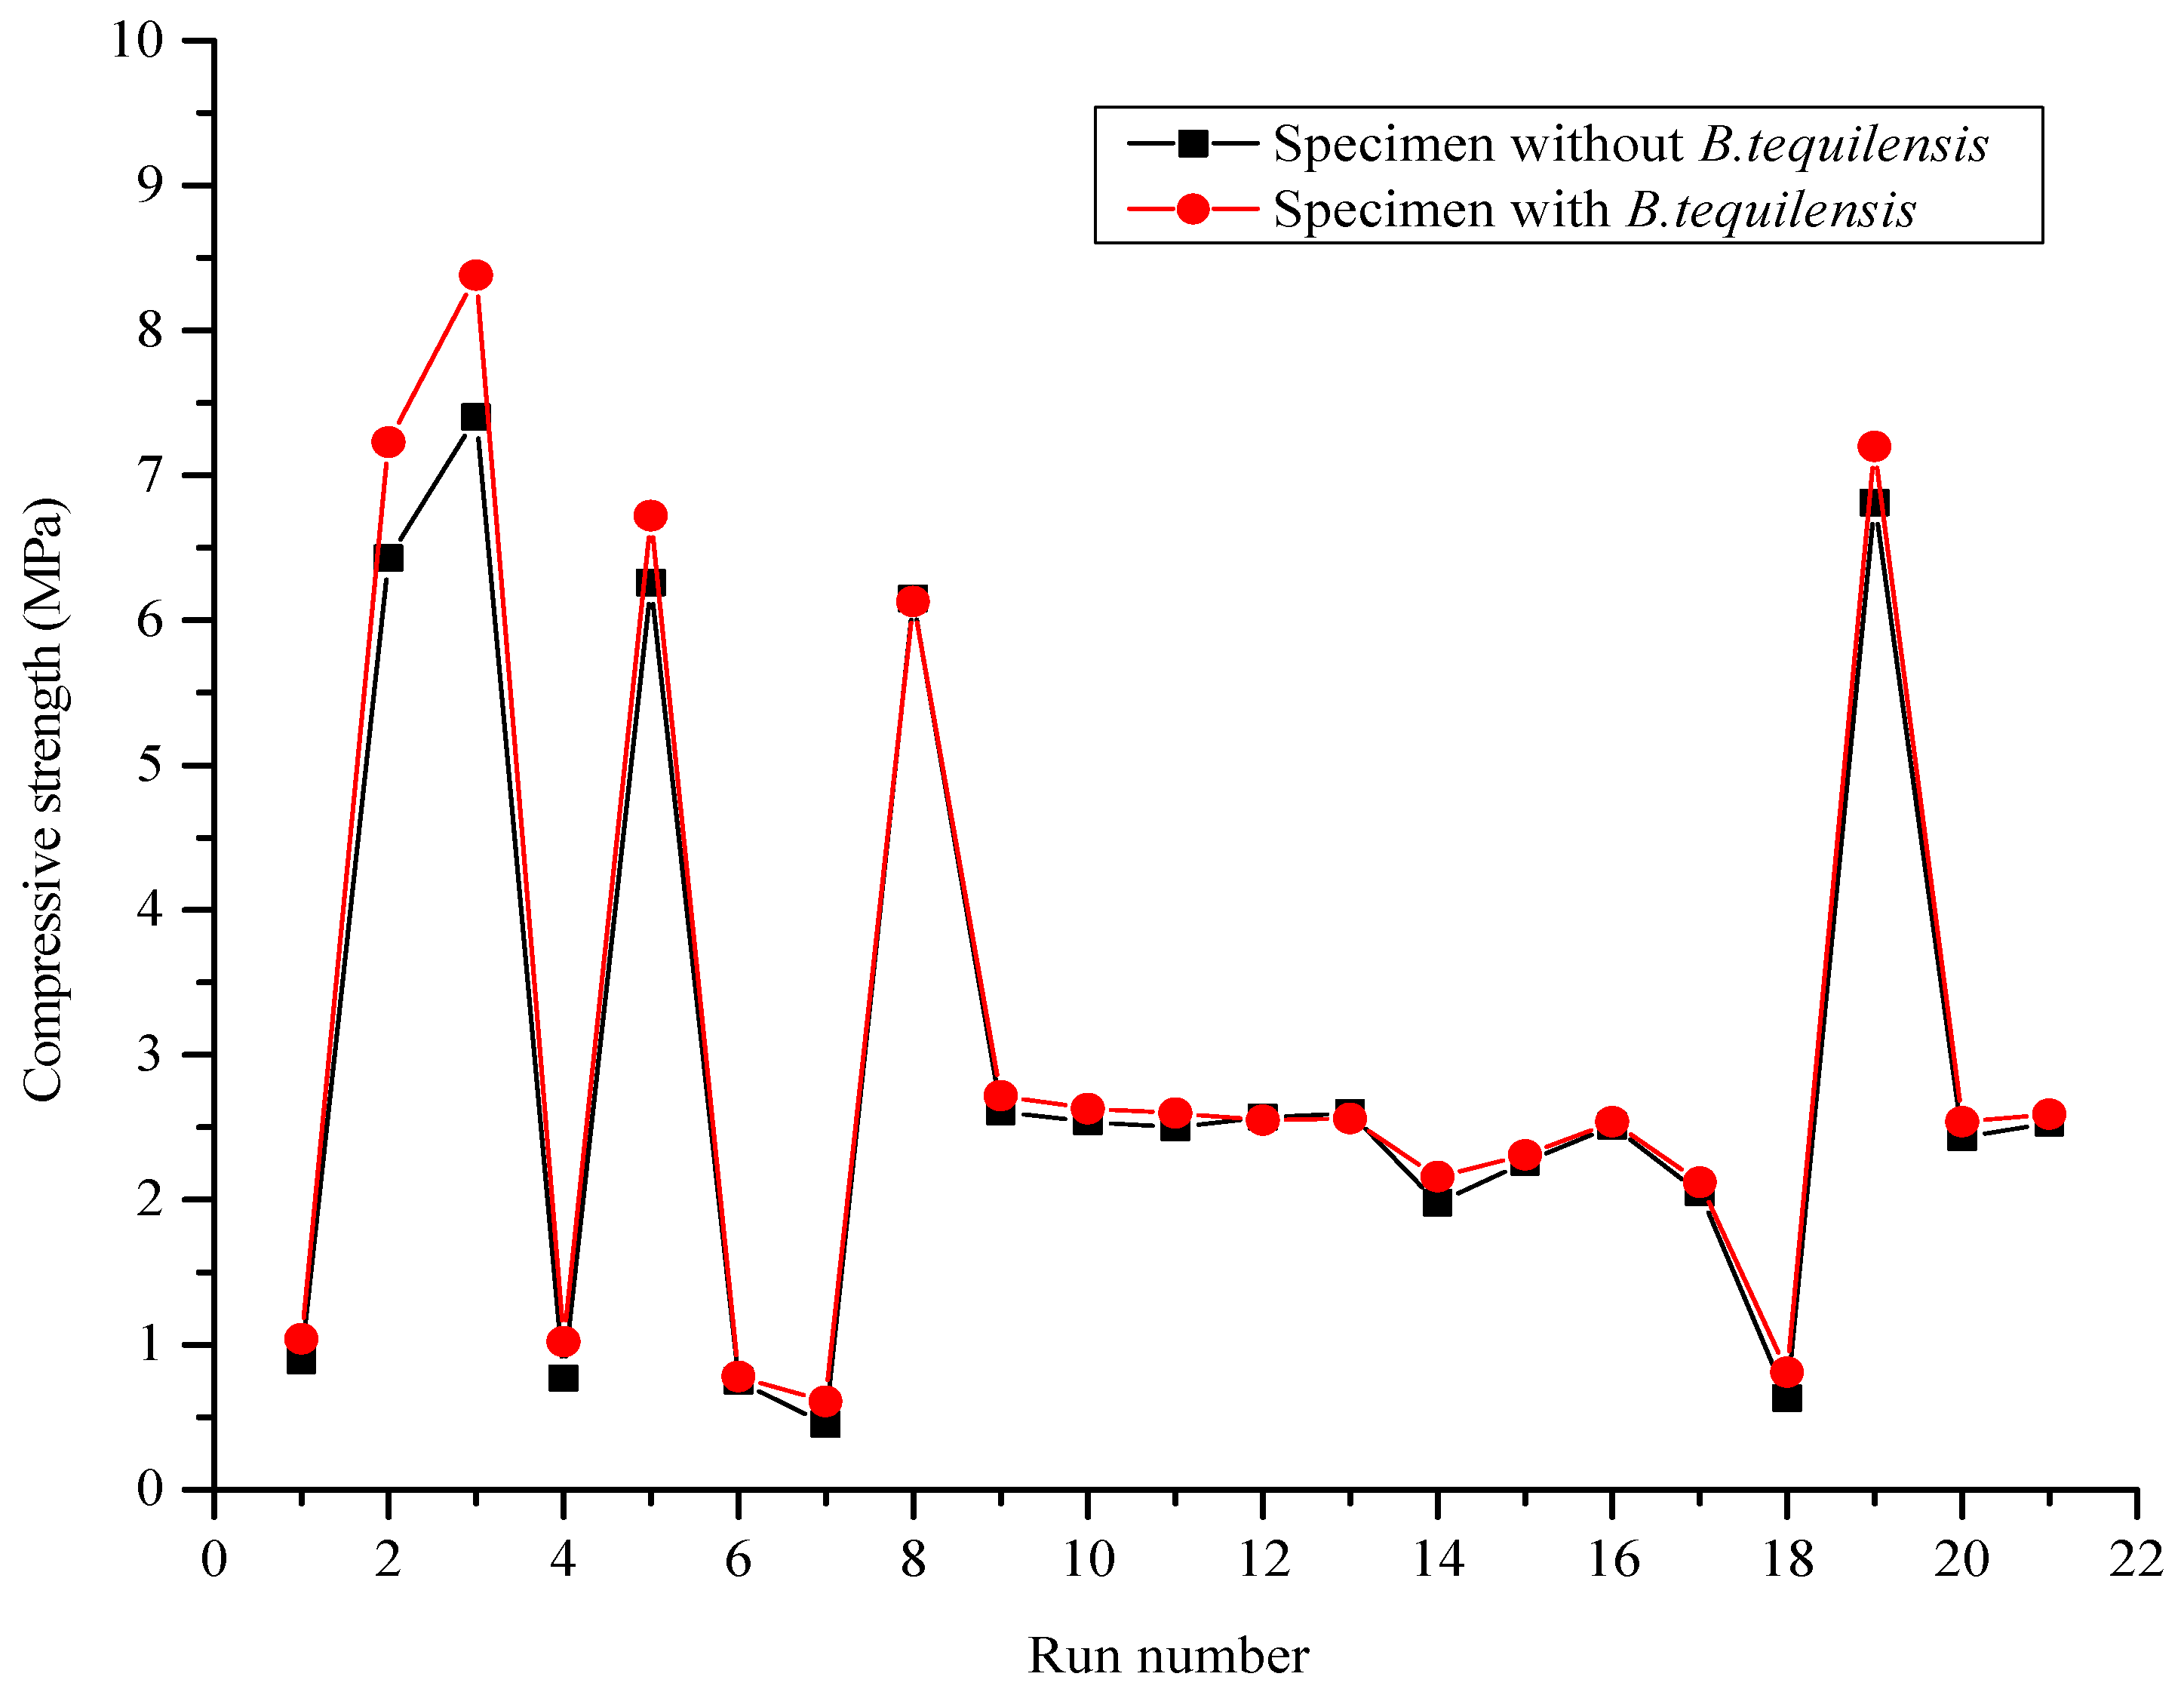
3.3.2. Comparison of Compressive Strength between FCB and B-FCB
4. Microstructure Analysis
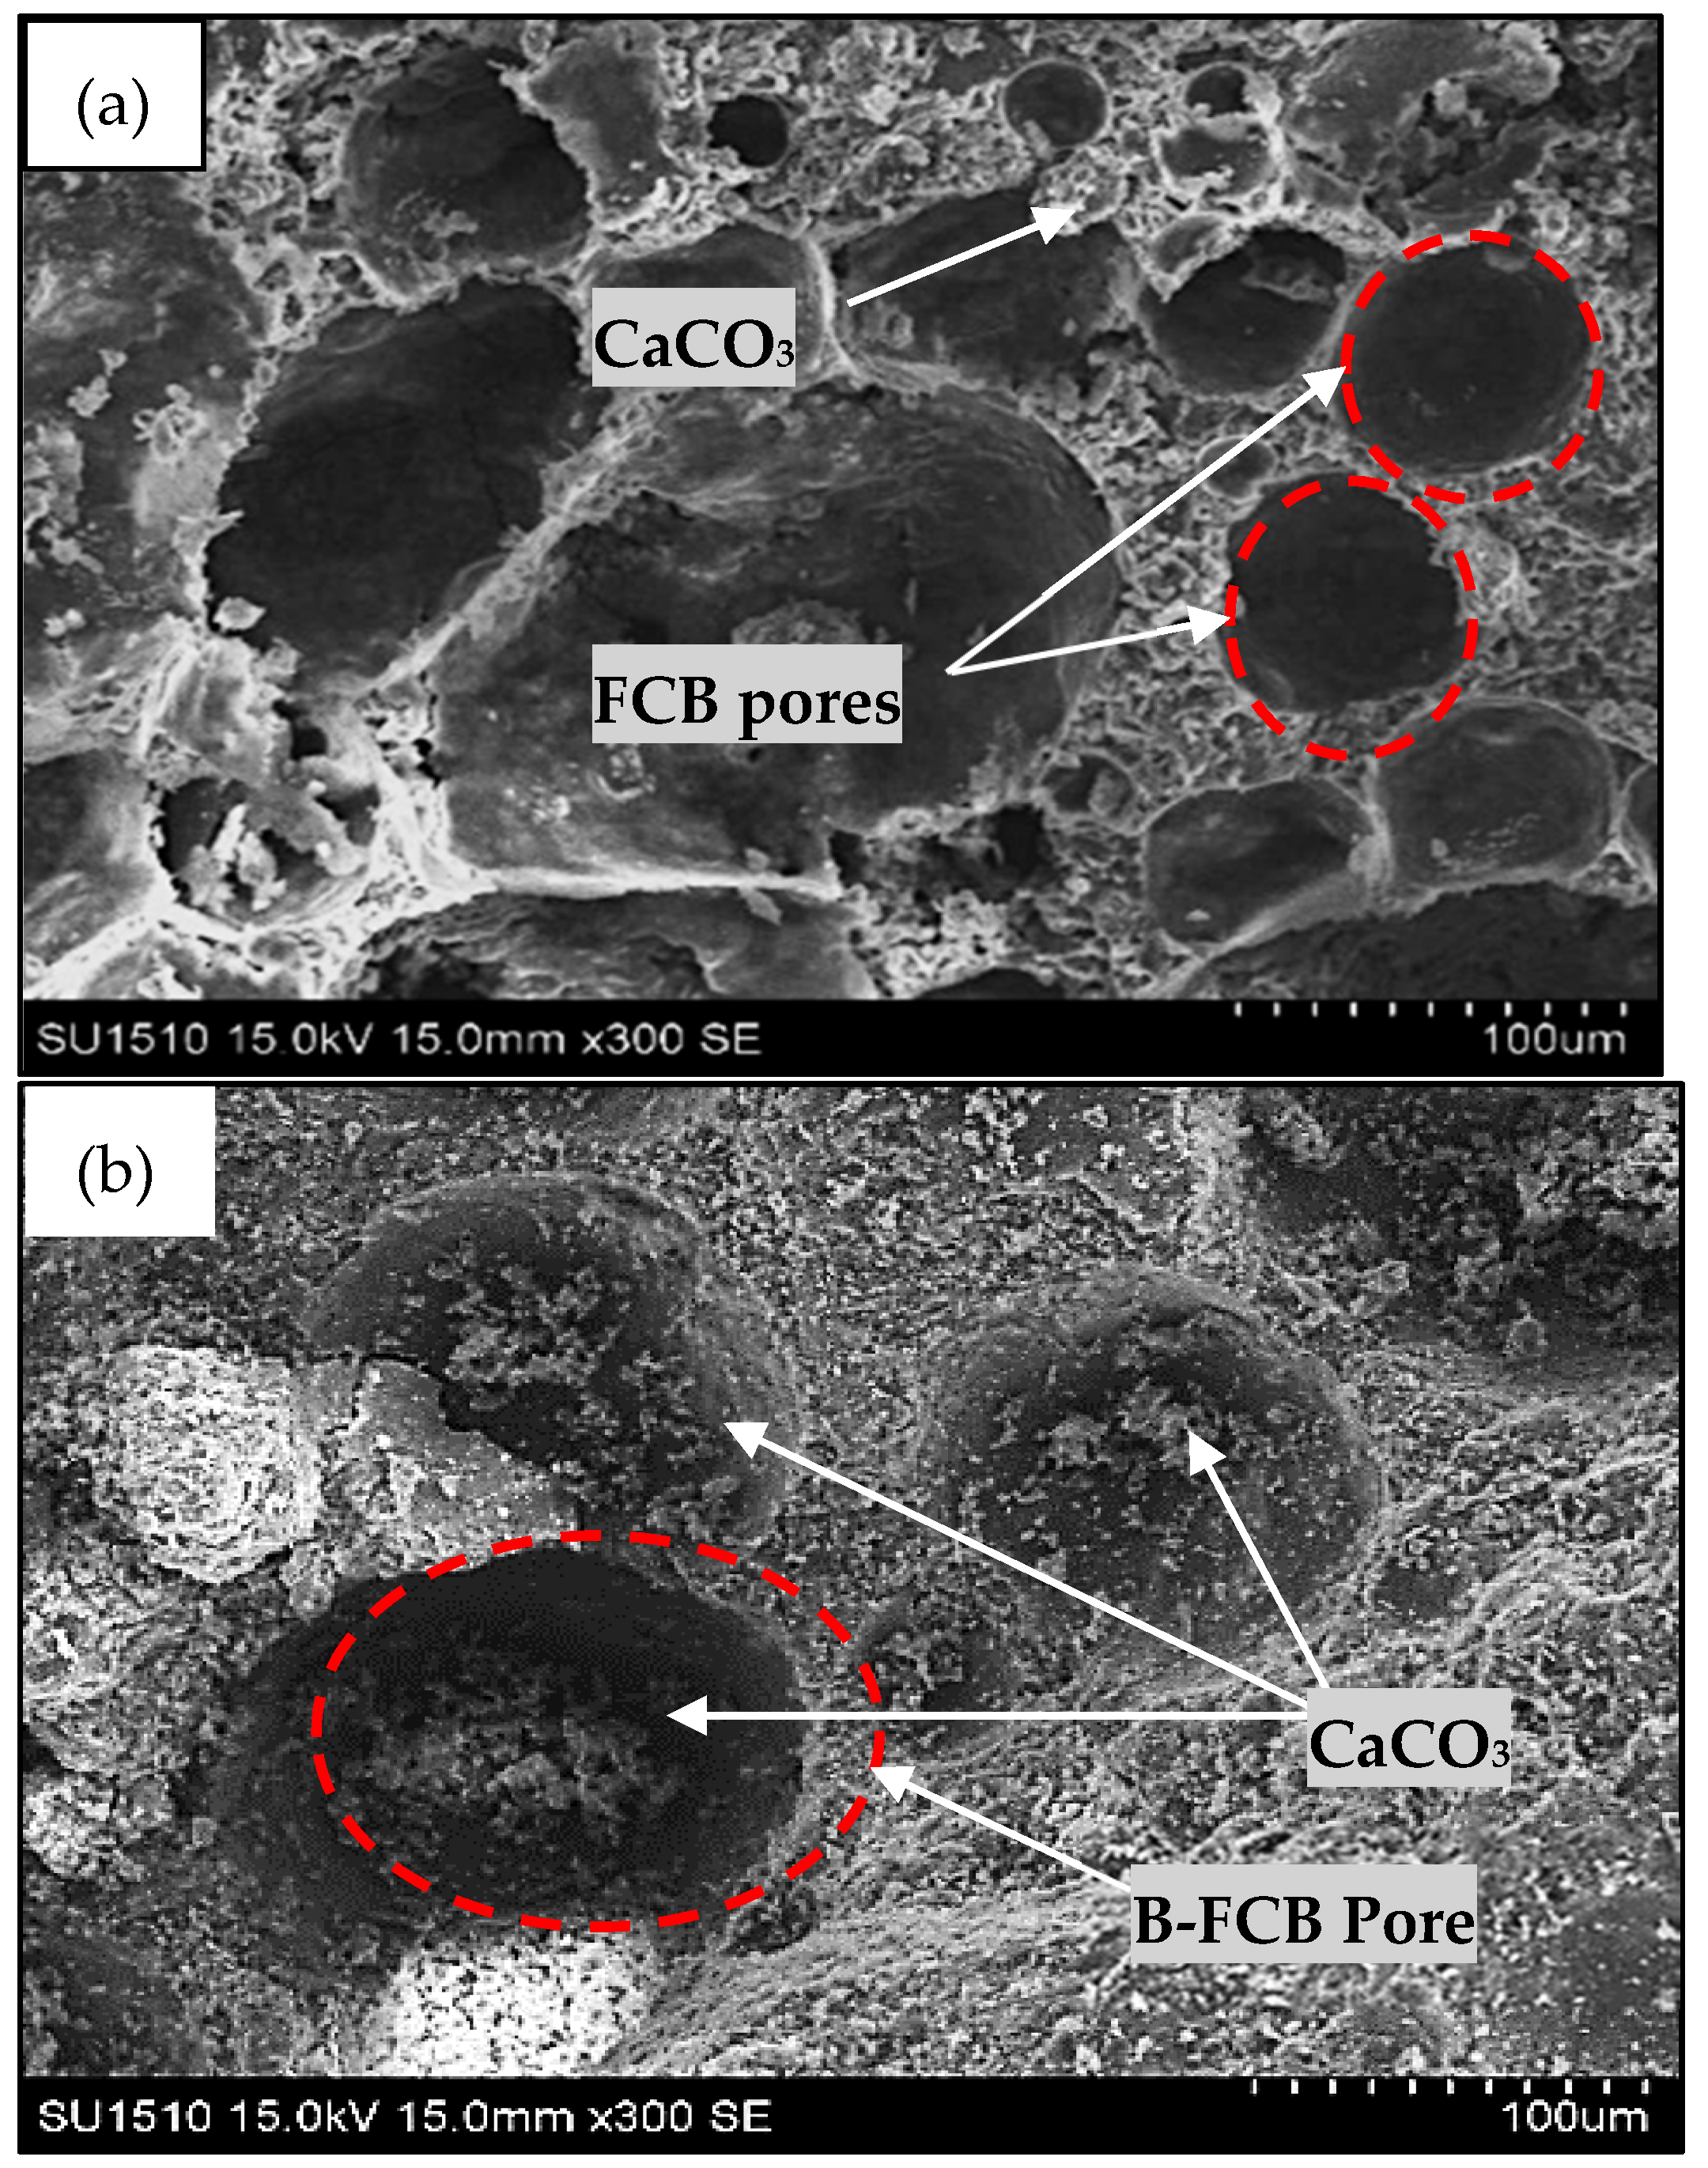
4.1. Healing Process and Porosity Determination
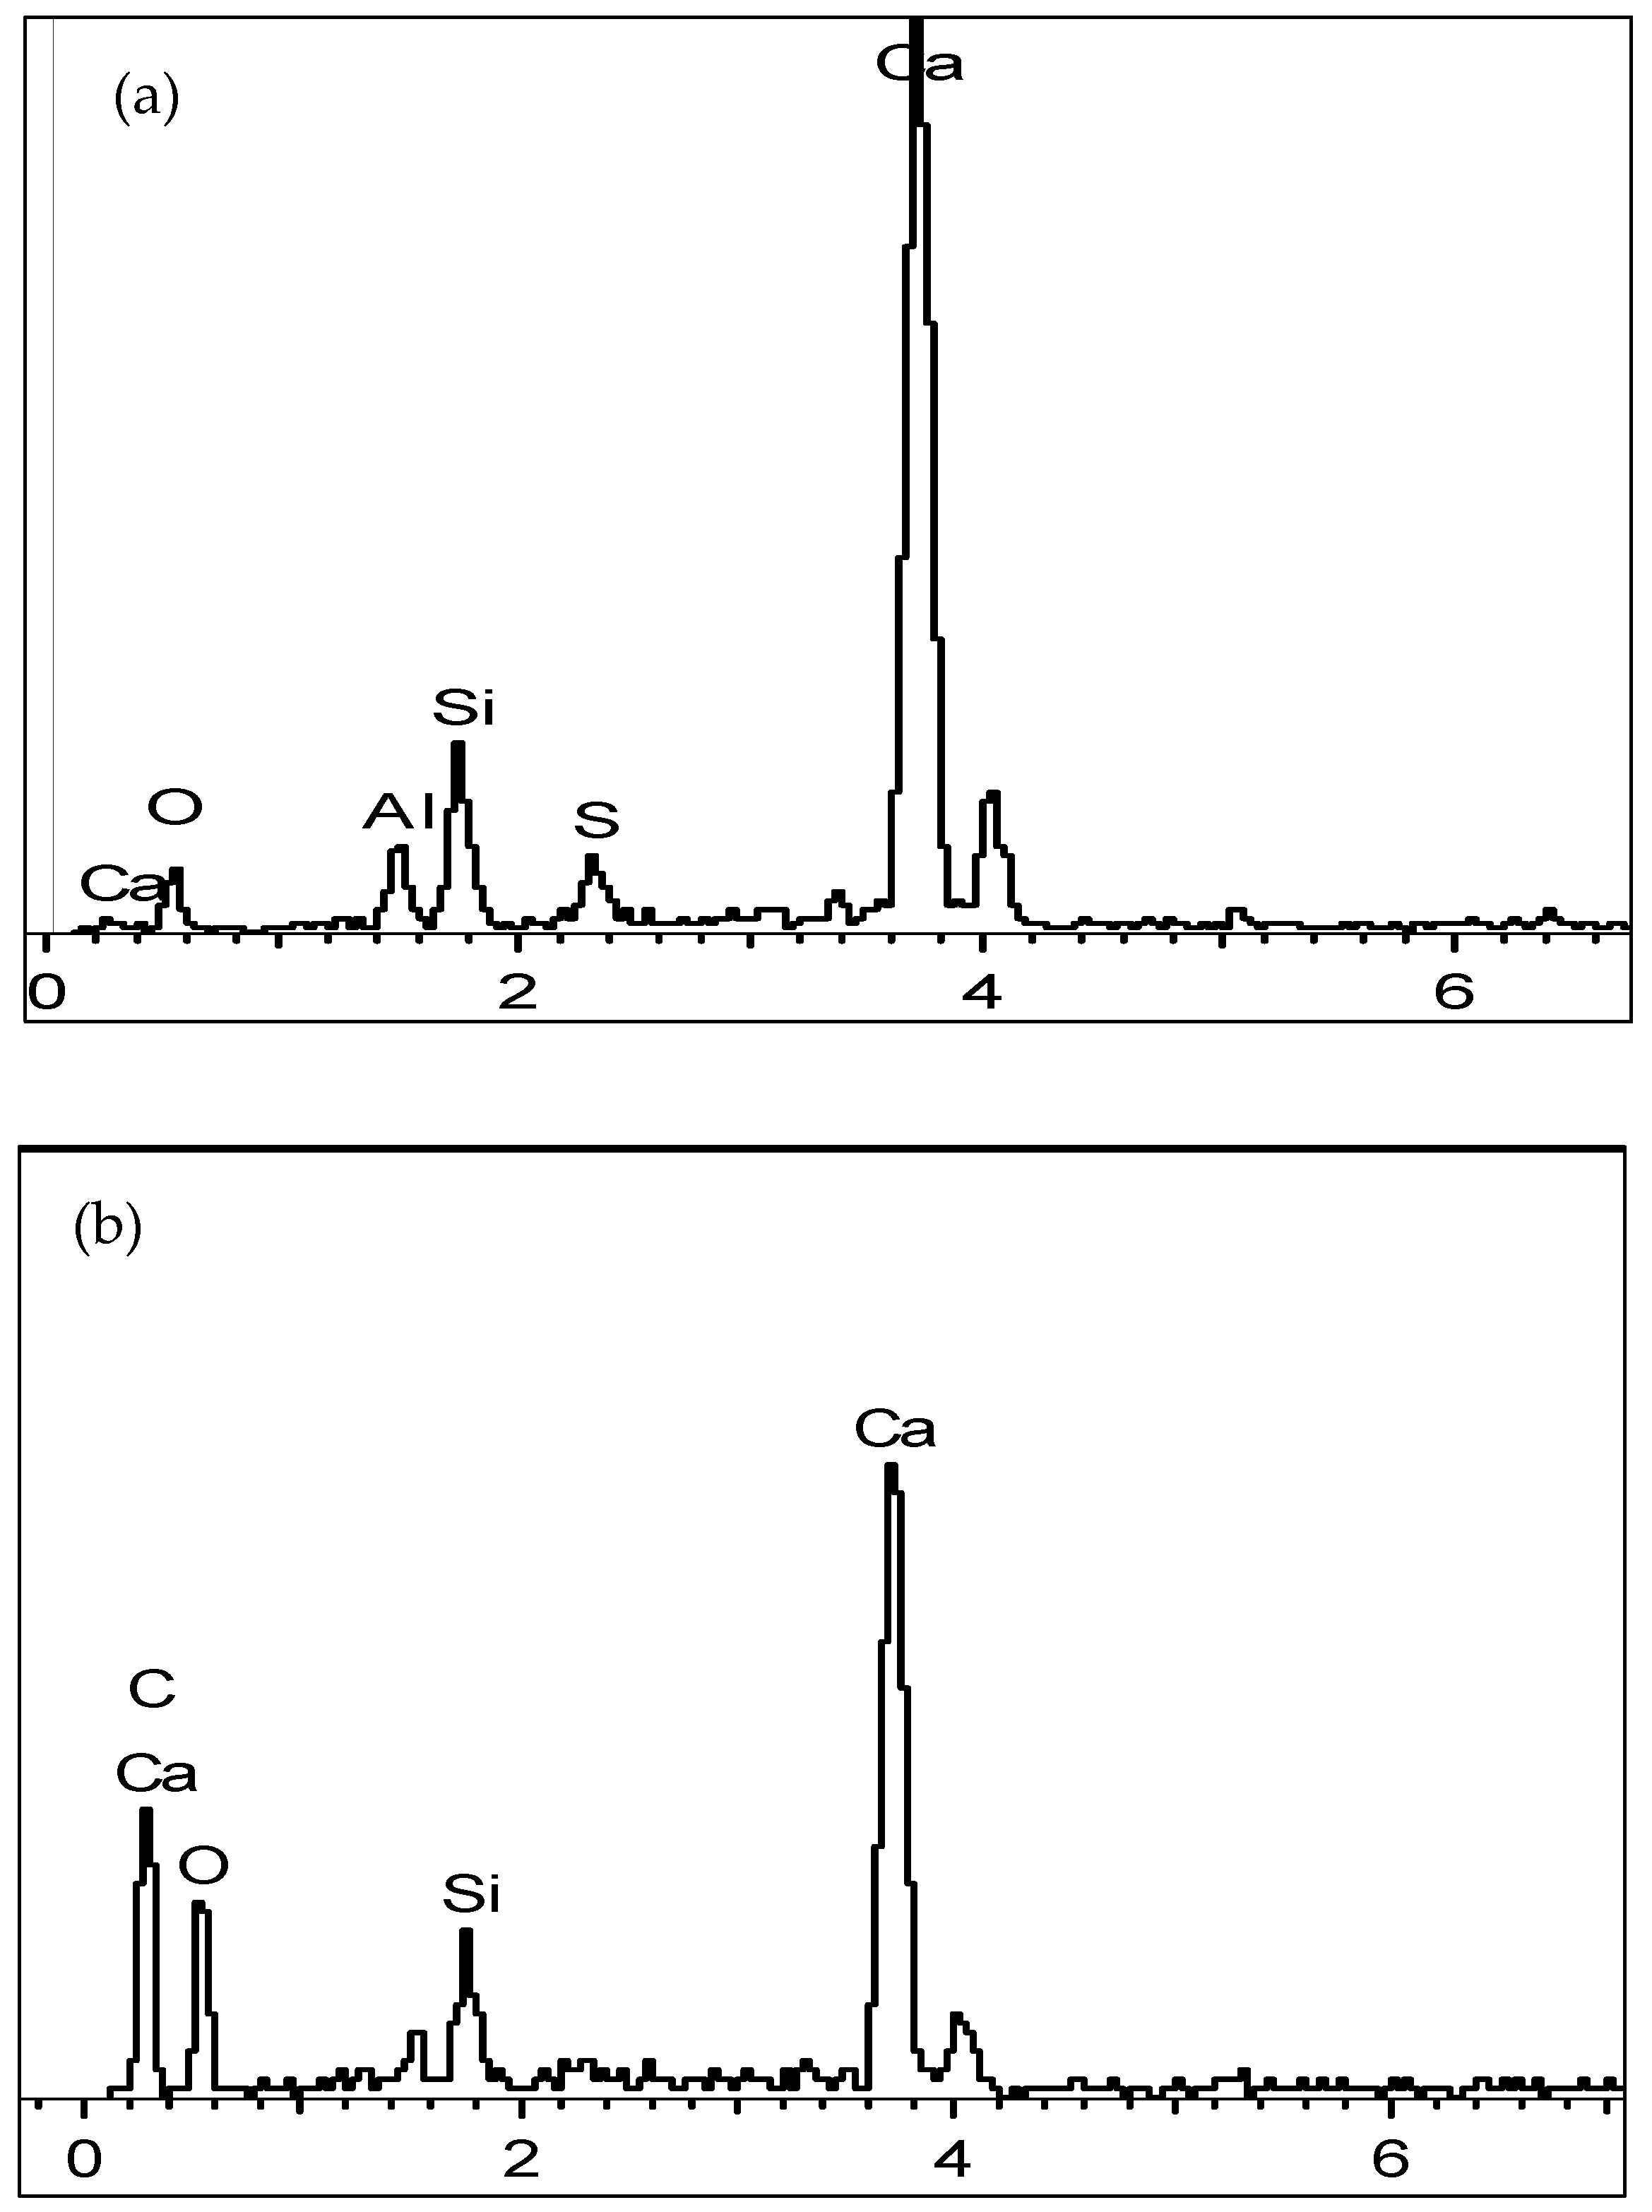
4.2. Elemental Analysis of FCB and B-FCB
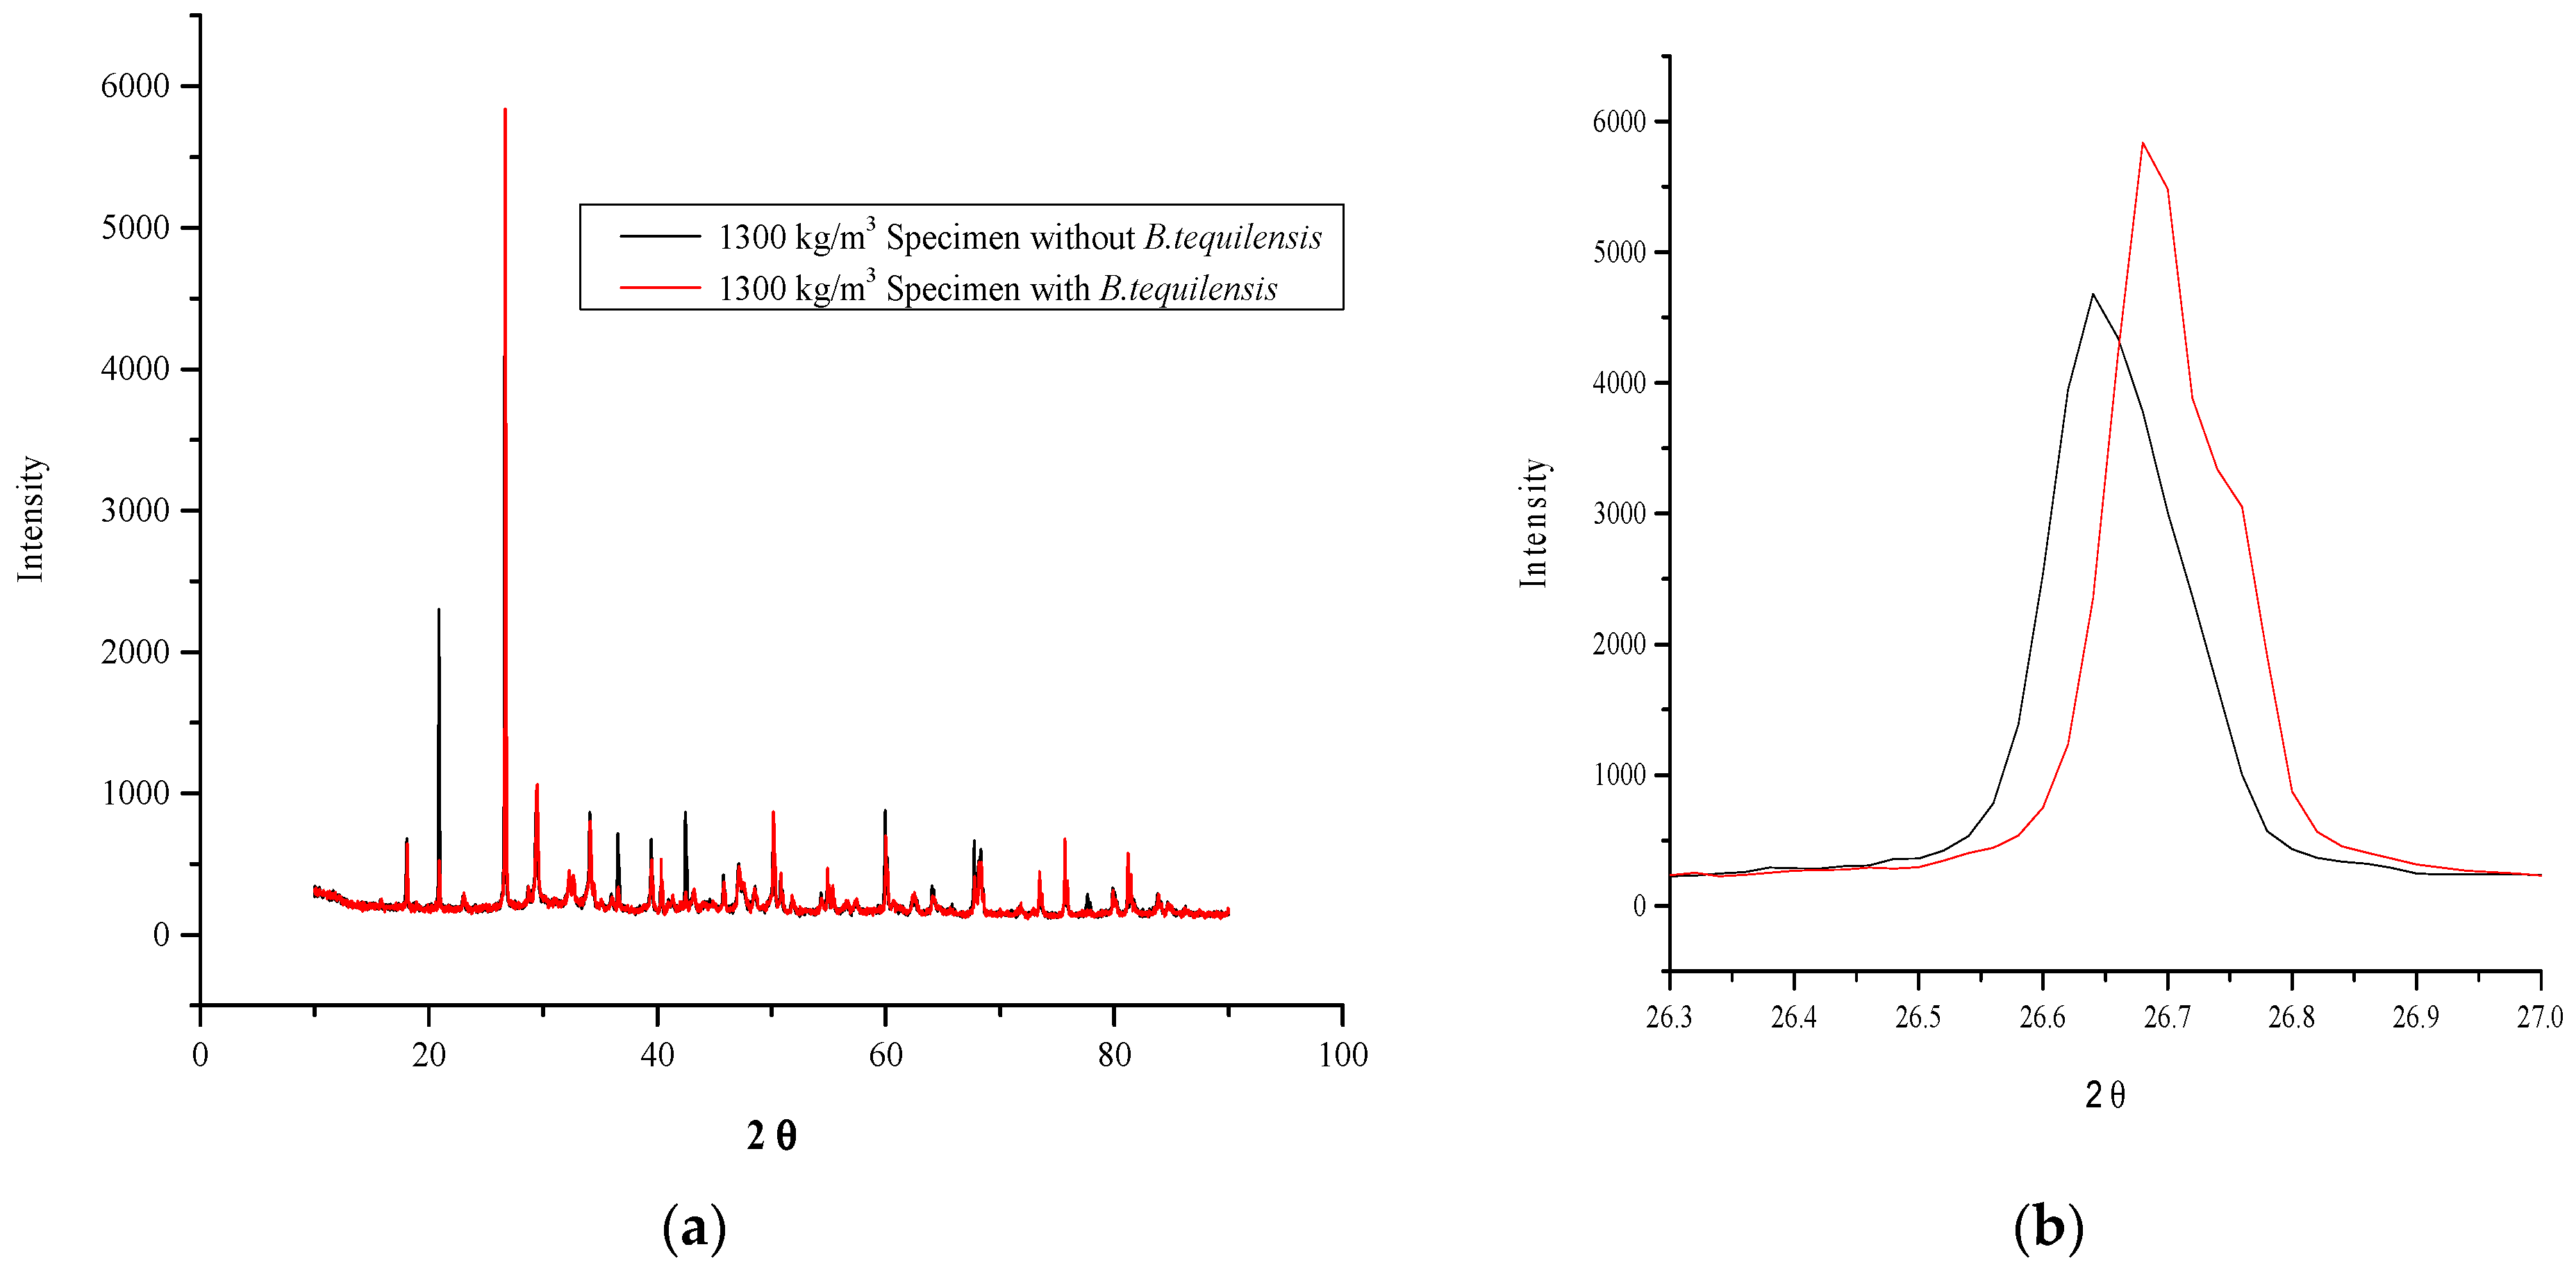
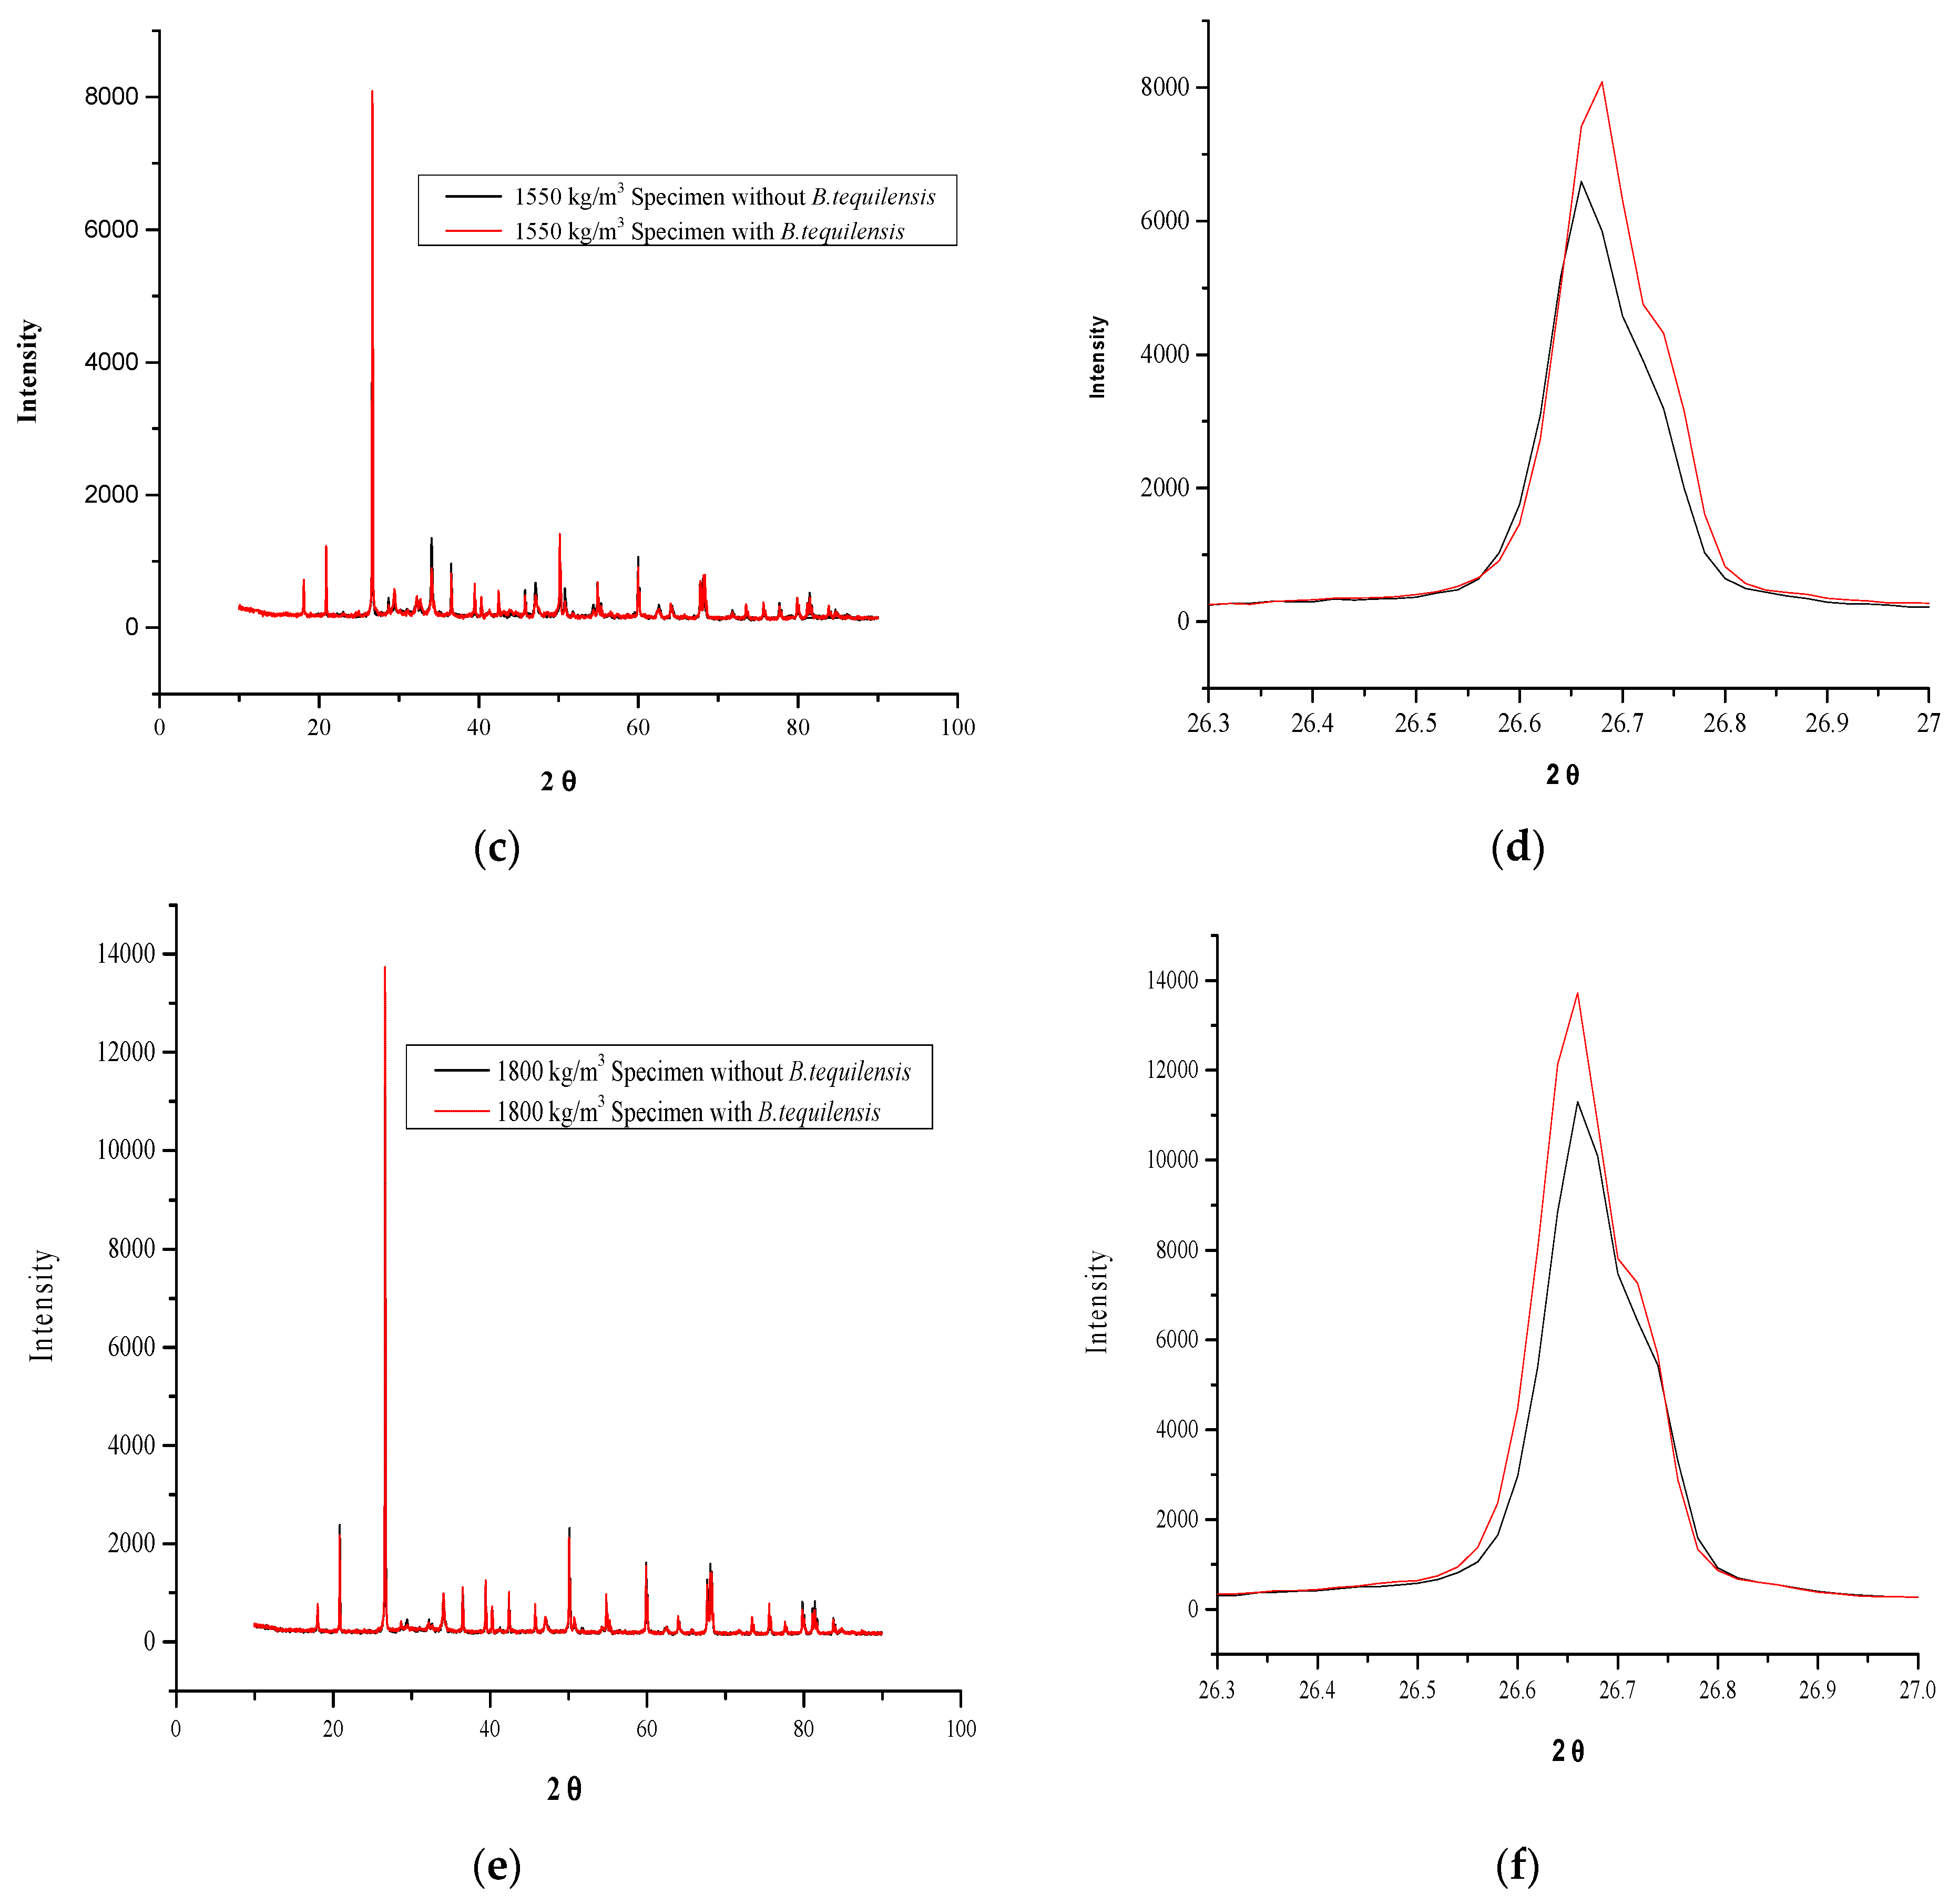
4.3. Crystallinity Analysis of FCB and B-FCB
5. Conclusions
Author Contributions
Funding
Institutional Review Board Statement
Informed Consent Statement
Data Availability Statement
Acknowledgments
Conflicts of Interest
References
- Karthikeyan, C.; Rajeswari, S.; Maruthamuthu, S.; Subramanian, K.; Rajagopal, G. Biogenic Ammonia for CO2 Capturing and Electrochemical Conversion into Bicarbonate and Formate. J. CO2 Util. 2014, 6, 53–61. [Google Scholar] [CrossRef]
- Alshalif, A.F.; Irwan, J.M.; Othman, N.; Al-Gheethi, A.A.; Shamsudin, S. A Systematic Review on Bio-Sequestration of Carbon Dioxide in Bio-Concrete Systems: A Future Direction. Eur. J. Environ. Civ. Eng. 2020, 1, 2116–7214. [Google Scholar] [CrossRef]
- Jiang, J.; Lu, Z.; Niu, Y.; Li, J.; Zhang, Y. Study on the Preparation and Properties of High-Porosity Foamed Concretes Based on Ordinary Portland Cement. Mater. Des. 2016, 92, 949–959. [Google Scholar] [CrossRef]
- Benhelal, E.; Zahedi, G.; Shamsaei, E.; Bahadori, A. Global Strategies and Potentials to Curb CO2 emissions in Cement Industry. J. Clean. Prod. 2013, 51, 142–161. [Google Scholar] [CrossRef]
- Haselbach, L.M.; Thomle, J.N. An Alternative Mechanism for Accelerated Carbon Sequestration in Concrete. Sustain. Cities Soc. 2014, 12, 25–30. [Google Scholar] [CrossRef]
- Ranjbar, N.; Behnia, A.; Alsubari, B.; Moradi Birgani, P.; Jumaat, M.Z. Durability and Mechanical Properties of Self-Compacting Concrete Incorporating Palm Oil Fuel Ash. J. Clean. Prod. 2016, 112, 723–730. [Google Scholar] [CrossRef]
- Khaliq, W.; Ehsan, M.B. Crack Healing in Concrete Using Various Bio Influenced Self-Healing Techniques. Constr. Build. Mater. 2016, 102, 349–357. [Google Scholar] [CrossRef]
- Castro-Alonso, M.J.; Montañez-Hernandez, L.E.; Sanchez-Muñoz, M.A.; Macias Franco, M.R.; Narayanasamy, R.; Balagurusamy, N. Microbially Induced Calcium Carbonate Precipitation (MICP) and Its Potential in Bioconcrete: Microbiological and Molecular Concepts. Front. Mater. 2019, 6, 1–15. [Google Scholar] [CrossRef]
- Zhang, J.; Liu, Y.; Feng, T.; Zhou, M.; Zhao, L.; Zhou, A.; Li, Z. Immobilizing Bacteria in Expanded Perlite for the Crack Self-Healing in Concrete. Constr. Build. Mater. 2017, 148, 610–617. [Google Scholar] [CrossRef]
- Othman, N.; Irwan, J.; Alshalif, A.; Anneza, L. Effect of Ureolytic Bacteria on Compressive Strength and Water Permeability on Bio-Concrete. In Advances in Civil, Architectural, Structural and Constructional Engineering, Proceedings of the International Conference on Civil, Architectural, Structural and Constructional Engineering, DONG-A University, Busan, Korea, 21–23 August 2015; CRC Press: Boca Raton, FL, USA, 2016; pp. 335–338. [Google Scholar]
- Power, I.M.; Harrison, A.L.; Dipple, G.M.; Southam, G. Carbon Sequestration via Carbonic Anhydrase Facilitated Magnesium Carbonate Precipitation. Int. J. Greenh. Gas Control 2013, 16, 145–155. [Google Scholar] [CrossRef]
- Alonso, M.J.C.; Ortiz, C.E.L.; Perez, S.O.G.; Narayanasamy, R.; Fajardo San Miguel, G.D.J.; Hernández, H.H.; Balagurusamy, N. Improved Strength and Durability of Concrete through Metabolic Activity of Ureolytic Bacteria. Environ. Sci. Pollut. Res. 2018, 25, 21451–21458. [Google Scholar] [CrossRef]
- Sharma, D.; Goyal, S. Accelerated Carbonation Curing of Cement Mortars Containing Cement Kiln Dust: An Effective Way of CO2 Sequestration and Carbon Footprint Reduction. J. Clean. Prod. 2018, 192, 844–854. [Google Scholar] [CrossRef]
- Possan, E.; Thomaz, W.A.; Aleandri, G.A.; Felix, E.F.; dos Santos, A.C.P. CO2 Uptake Potential Due to Concrete Carbonation: A Case Study. Case Stud. Constr. Mater. 2017, 6, 147–161. [Google Scholar]
- Siddique, R.; Chahal, N.K. Effect of Ureolytic Bacteria on Concrete Properties. Constr. Build. Mater. 2011, 25, 3791–3801. [Google Scholar] [CrossRef]
- Alshalif, A.F.; Juki, M.I.; Othman, N.; Al-Gheethi, A.A.; Khalid, F.S. Improvement of Mechanical Properties of Bio-Concrete Using Enterococcus Faecalis and Bacillus Cereus. Environ. Eng. Res. 2019, 24, 630–637. [Google Scholar] [CrossRef]
- Faisal Alshalif, A.; Irwan, J.M.; Othman, N.; Zamer, M.M.; Anneza, L.H. Carbon Dioxide (CO2) Sequestration in Bio-Concrete, An Overview. MATEC Web Conf. 2017, 103, 2–9. [Google Scholar] [CrossRef] [Green Version]
- Muthu Kumar, E.; Ramamurthy, K. Effect of Fineness and Dosage of Aluminium Powder on the Properties of Moist-Cured Aerated Concrete. Constr. Build. Mater. 2015, 95, 486–496. [Google Scholar] [CrossRef]
- Kumar, R.; Lakhani, R.; Tomar, P. A Simple Novel Mix Design Method and Properties Assessment of Foamed Concretes with Limestone Slurry Waste. J. Clean. Prod. 2018, 171, 1650–1663. [Google Scholar] [CrossRef]
- Alshalif, A.F.; Irwan, J.M.; Othman, N.; Al-Gheethi, A.; Hassan, A.; Nasser, I.M. Potential of Carbonic Anhydrase and Urease Bacteria for Sequestration of CO2 into Aerated Concrete. MATEC Web Conf. 2018, 250, 1–11. [Google Scholar] [CrossRef] [Green Version]
- Chen, B.; Wu, Z.; Liu, N. Experimental Research on Properties of High-Strength Foamed Concrete. J. Mater. Civ. Eng. 2012, 24, 113–118. [Google Scholar]
- Cizer, Ö.; Ruiz-Agudo, E.; Rodriguez-Navarro, C. Kinetic Effect of Carbonic Anhydrase Enzyme on the Carbonation Reaction of Lime Mortar. Int. J. Archit. Herit. 2018, 12, 779–789. [Google Scholar] [CrossRef]
- Li, L.; Zheng, Q.; Li, Z.; Ashour, A.; Han, B. Bacterial Technology-Enabled Cementitious Composites: A Review. Compos. Struct. 2019, 225, 111–170. [Google Scholar] [CrossRef]
- Nambiar, E.K.K.; Ramamurthy, K. Models Relating Mixture Composition to the Density and Strength of Foam Concrete Using Response Surface Methodology. Cem. Concr. Compos. 2006, 28, 752–760. [Google Scholar] [CrossRef]
- Shekh, A.Y.; Krishnamurthi, K.; Mudliar, S.N.; Yadav, R.R.; Fulke, A.B.; Devi, S.S.; Chakrabarti, T. Recent Advancements in Carbonic Anhydrase–Driven Processes for CO2 Sequestration: Minireview. Crit. Rev. Environ. Sci. Technol. 2012, 42, 1419–1440. [Google Scholar] [CrossRef]
- Giri, A.; Banerjee, U.C.; Kumar, M.; Pant, D. Intracellular Carbonic Anhydrase from Citrobacter Freundii and Its Role in Bio-Sequestration. Bioresour. Technol. 2018, 267, 789–792. [Google Scholar] [CrossRef]
- Branch, J.L.; Kosson, D.S.; Garrabrants, A.C.; He, P.J. The Impact of Carbonation on the Microstructure and Solubility of Major Constituents in Microconcrete Materials with Varying Alkalinities Due to Fly Ash Replacement of Ordinary Portland Cement. Cem. Concr. Res. 2016, 89, 297–309. [Google Scholar] [CrossRef] [Green Version]
- Nguyen, T.T.; Bui, H.H.; Ngo, T.D.; Nguyen, G.D. Experimental and Numerical Investigation of Influence of Air-Voids on the Compressive Behaviour of Foamed Concrete. Mater. Des. 2017, 130, 103–119. [Google Scholar] [CrossRef]
- Namsone, E.; Šahmenko, G.; Korjakins, A. Durability Properties of High Performance Foamed Concrete. Procedia Eng. 2017, 172, 760–767. [Google Scholar] [CrossRef]
- Tan, X.; Han, F.; Zhao, F. Preparation of Autoclaved Foamed Concrete Block from Fly Ash and Carbide Slag. MATEC Web Conf. 2018, 142, 1–6. [Google Scholar] [CrossRef]
- Li, W.; Chen, W.-S.; Zhou, P.-P.; Yu, L.-J. Influence of Enzyme Concentration on Bio-Sequestration of CO2 in Carbonate Form Using Bacterial Carbonic Anhydrase. Chem. Eng. J. 2013, 232, 149–156. [Google Scholar] [CrossRef]
- Snoeck, D.; Dewanckele, J.; Cnudde, V.; De Belie, N. X-ray Computed Microtomography to Study Autogenous Healing of Cementitious Materials Promoted by Superabsorbent Polymers. Cem. Concr. Compos. 2016, 65, 83–93. [Google Scholar] [CrossRef]
- Zhang, J.L.; Wang, C.G.; Wang, Q.L.; Feng, J.L.; Pan, W.; Zheng, X.C. A binary concrete crack self-healing system containing oxygen-releasing tablet and bacteria and its Ca2+- precipitation performance. Appl. Microbiol. Biotechnol. 2016, 100, 10295–10306. [Google Scholar] [CrossRef] [PubMed]
- Dahalan, F.A.; Mohamed Najib, M.Z.; Salim, M.R.; Ujang, Z. Characteristics of Developed Granules Containing Phototrophic Aerobic Bacteria for Minimizing Carbon Dioxide Emission. Int. Biodeterior. Biodegrad. 2015, 102, 15–23. [Google Scholar]
- Chang, E.E.; Pan, S.Y.; Chen, Y.H.; Tan, C.S.; Chiang, P.C. Accelerated Carbonation of Steelmaking Slags in a High-Gravity Rotating Packed Bed. J. Hazard. Mater. 2012, 227–228, 97–106. [Google Scholar] [CrossRef]
- Hosseini Balam, N.; Mostofinejad, D.; Eftekhar, M. Use of Carbonate Precipitating Bacteria to Reduce Water Absorption of Aggregates. Constr. Build. Mater. 2017, 141, 565–577. [Google Scholar] [CrossRef]
- Abdel Gawwad, H.A.; Mohamed, S.A.E.-A.; Mohammed, S.A. Impact of Magnesium Chloride on the Mechanical Properties of Innovative Bio-Mortar. Mater. Lett. 2016, 178, 39–43. [Google Scholar] [CrossRef]


| Chemical Compound | Concentration (%) |
|---|---|
| SiO2 | 20.6 |
| Al2O3 | 5.4 |
| Fe2O3 | 4.2 |
| SO3 | 2.2 |
| K2O | 0.6 |
| CaO | 64.8 |
| MgO | 2.2 |
| Level | Bacteria Concentration (Cell/mL) | B. tequilensis Concentration (g/L) | Value Used in (RSM) |
|---|---|---|---|
| Low (−1) | 3 × 10⁵ | 0.001 | 5 |
| Centre (0) | 3 × 10⁶ | 0.01 | 6 |
| High (1) | 3 × 10⁷ | 0.1 | 7 |
| Factor Symbol | Parameter | Levels | Unit | ||
|---|---|---|---|---|---|
| Low (−1) | Centre (0) | High (+1) | |||
| CO2 | CO2 Concentration | 10 | 15 | 20 | (%) |
| B | B. tequilensis concentration | 3 × 10⁵ | 3 × 10⁶ | 3 × 10⁷ | (cell/mL) |
| T | Temperature | 27 | 33.5 | 40 | (°C) |
| D | Density of concrete | 1300 | 1550 | 1800 | (kg/m3) |
| Run No. | Density (kg/m3) | Cement (kg/m3) | Fine Sand (kg/m3) | Water (L/m3) | T (°C) | CO2 (%) | B (Cell/mL) |
|---|---|---|---|---|---|---|---|
| 1 | 1300 | 553.2 | 746.8 | 276.6 | 27 | 10 | 3 × 10⁵ |
| 2 | 1800 | 766 | 1034 | 383 | 40 | 10 | 3 × 10⁵ |
| 3 | 1300 | 553.2 | 746.8 | 276.6 | 40 | 20 | 3 × 10⁵ |
| 4 | 1800 | 766 | 1034 | 383 | 27 | 20 | 3 × 10⁵ |
| 5 | 1300 | 553.2 | 746.8 | 276.6 | 40 | 10 | 3 × 10⁷ |
| 6 | 1800 | 766 | 1034 | 383 | 27 | 10 | 3 × 10⁷ |
| 7 | 1300 | 553.2 | 746.8 | 276.6 | 27 | 20 | 3 × 10⁷ |
| 8 | 1800 | 766 | 1034 | 383 | 40 | 20 | 3 × 10⁷ |
| 9 | 1550 | 659.5 | 890.4 | 329.7 | 33.5 | 15 | 3 × 10⁶ |
| 10 | 1550 | 659.5 | 890.4 | 329.7 | 33.5 | 15 | 3 × 10⁶ |
| 11 | 1550 | 659.5 | 890.4 | 329.7 | 33.5 | 15 | 3 × 10⁶ |
| 12 | 1550 | 659.5 | 890.4 | 329.7 | 33.5 | 10 | 3 × 10⁶ |
| 13 | 1550 | 659.5 | 890.4 | 329.7 | 33.5 | 20 | 3 × 10⁶ |
| 14 | 1550 | 659.5 | 890.4 | 329.7 | 33.5 | 15 | 3 × 10⁵ |
| 15 | 1550 | 659.5 | 890.4 | 329.7 | 33.5 | 15 | 3 × 10⁷ |
| 16 | 1550 | 659.5 | 890.4 | 329.7 | 27.0 | 15 | 3 × 10⁶ |
| 17 | 1550 | 659.5 | 890.4 | 329.7 | 40.0 | 15 | 3 × 10⁶ |
| 18 | 1300 | 553.2 | 746.8 | 276.6 | 33.5 | 15 | 3 × 10⁶ |
| 19 | 1800 | 766 | 1034 | 383 | 33.5 | 15 | 3 × 10⁶ |
| 20 | 1550 | 659.5 | 890.4 | 329.7 | 33.5 | 15 | 3 × 10⁶ |
| 21 | 1550 | 659.5 | 890.4 | 329.7 | 33.5 | 15 | 3 × 10⁶ |
| Std. Run No. | Input Variables | ||||
|---|---|---|---|---|---|
| Uncoded Value | Responses | ||||
| Density (kg/m3) | Bacteria (Cell/mL) | Temperature (°C) | CO2 (%) | Compressive Strength of B-FCB (MPa) | |
| 1 | 1300 | 3 × 10⁵ | 27 | 10 | 0.90 |
| 2 | 1800 | 3 × 10⁵ | 27 | 20 | 7.23 |
| 3 | 1800 | 3 × 10⁷ | 27 | 10 | 8.38 |
| 4 | 1300 | 3 × 10⁷ | 27 | 20 | 1.02 |
| 5 | 1800 | 3 × 10⁵ | 40 | 10 | 6.72 |
| 6 | 1300 | 3 × 10⁵ | 40 | 20 | 0.78 |
| 7 | 1300 | 3 × 10⁷ | 40 | 10 | 0.61 |
| 8 | 1800 | 3 × 10⁷ | 40 | 20 | 6.13 |
| 9 | 1550 | 3 × 10⁶ | 33.5 | 15 | 2.72 |
| 10 | 1550 | 3 × 10⁶ | 33.5 | 15 | 2.63 |
| 11 | 1550 | 3 × 10⁶ | 33.5 | 15 | 2.60 |
| Source | DF | Adj SS | Adj MS | F-Value | p-Value | Effect | Ranking |
|---|---|---|---|---|---|---|---|
| Model | 8 | 84.964 | 10.620 | 2723.220 | 0.000 | - | - |
| Linear | 4 | 79.991 | 19.997 | 5127.640 | 0.000 | - | - |
| CO2 | 1 | 0.316 | 0.316 | 81.030 | 0.012 | −0.397 | 5 |
| B | 1 | 0.017 | 0.017 | 4.390 | 0.171 | 0.092 | 7 |
| T | 1 | 1.470 | 1.470 | 377.080 | 0.003 | −0.857 | 2 |
| D | 1 | 78.187 | 78.187 | 20,048.080 | 0.000 | 6.252 | 1 |
| 2-Way Interactions | 3 | 1.062 | 0.354 | 90.840 | 0.011 | - | - |
| CO2*B | 1 | 0.546 | 0.546 | 140.000 | 0.007 | 0.522 | 3 |
| CO2*T | 1 | 0.070 | 0.070 | 18.030 | 0.051 | 0.187 | 6 |
| CO2*T | 1 | 0.446 | 0.446 | 114.490 | 0.009 | −0.472 | 4 |
| Curvature | 1 | 3.910 | 3.910 | 1002.660 | 0.001 | - | - |
| Error | 2 | 0.007 | 0.004 | - | - | - | - |
| Total | 10 | 84.972 | - | - | - | - | - |
| Std. Run No. | Input Variables | ||||
|---|---|---|---|---|---|
| Uncoded Value | Responses | ||||
| Density (kg/m3) | Bacteria (Cell/mL) | Temperature (°C) | CO2 (%) | Compressive Strength of B-FCB (MPa) | |
| 1 | 1300 | 3 × 10⁵ | 27.0 | 10 | 0.9 |
| 2 | 1800 | 3 × 10⁵ | 27.0 | 20 | 7.23 |
| 3 | 1800 | 3 × 10⁷ | 27.0 | 10 | 8.38 |
| 4 | 1300 | 3 × 10⁷ | 27.0 | 20 | 1.02 |
| 5 | 1800 | 3 × 10⁵ | 40.0 | 10 | 6.72 |
| 6 | 1300 | 3 × 10⁵ | 40.0 | 20 | 0.78 |
| 7 | 1300 | 3 × 10⁷ | 40.0 | 10 | 0.61 |
| 8 | 1800 | 3 × 10⁷ | 40.0 | 20 | 6.13 |
| 9 | 1550 | 3 × 10⁶ | 33.5 | 15 | 2.72 |
| 10 | 1550 | 3 × 10⁶ | 33.5 | 15 | 2.63 |
| 11 | 1550 | 3 × 10⁶ | 33.5 | 15 | 2.60 |
| 12 | 1550 | 3 × 10⁶ | 33.5 | 10 | 2.55 |
| 13 | 1550 | 3 × 10⁶ | 33.5 | 20 | 2.56 |
| 14 | 1550 | 3 × 10⁵ | 33.5 | 15 | 2.16 |
| 15 | 1550 | 3 × 10⁷ | 33.5 | 15 | 2.31 |
| 16 | 1550 | 3 × 10⁶ | 27.0 | 15 | 2.54 |
| 17 | 1550 | 3 × 10⁶ | 40.0 | 15 | 2.12 |
| 18 | 1300 | 3 × 10⁶ | 33.5 | 15 | 0.81 |
| 19 | 1800 | 3 × 10⁶ | 33.5 | 15 | 7.2 |
| 20 | 1550 | 3 × 10⁶ | 33.5 | 15 | 2.54 |
| 21 | 1550 | 3 × 10⁶ | 33.5 | 15 | 2.59 |
| Source | Degrees of Freedom | Sum of Squares | Mean Square | F-Value | p-Value |
|---|---|---|---|---|---|
| Model | 7 | 113.265 | 16.180 | 413.290 | 0.000 |
| Linear | 4 | 100.355 | 25.088 | 640.820 | 0.000 |
| CO2 | 1 | 0.250 | 0.249 | 6.380 | 0.025 |
| B | 1 | 0.027 | 0.027 | 0.690 | 0.421 |
| T | 1 | 1.482 | 1.482 | 37.860 | 0.000 |
| D | 1 | 98.596 | 98.596 | 2518.370 | 0.000 |
| Square | 1 | 11.918 | 11.917 | 304.400 | 0.000 |
| D*D | 1 | 11.918 | 11.917 | 304.400 | 0.000 |
| 2-Way Interaction | 2 | 0.993 | 0.496 | 12.680 | 0.001 |
| CO2*B | 1 | 0.546 | 0.546 | 13.950 | 0.003 |
| CO2*D | 1 | 0.447 | 0.446 | 11.400 | 0.005 |
| Error | 13 | 0.509 | 0.039 | - | - |
| Lack-of-Fit | 10 | 0.500 | 0.050 | 16.570 | 0.020 |
| Pure Error | 3 | 0.009 | 0.003 | ||
| Total | 20 | 113.774 | - | - | - |
| Standard deviation = 0.197865 R2 = 99.55% R2 adjusted = 99.31% Predicted R2 = 98.06% | |||||
Publisher’s Note: MDPI stays neutral with regard to jurisdictional claims in published maps and institutional affiliations. |
© 2021 by the authors. Licensee MDPI, Basel, Switzerland. This article is an open access article distributed under the terms and conditions of the Creative Commons Attribution (CC BY) license (https://creativecommons.org/licenses/by/4.0/).
Share and Cite
Alshalif, A.F.; Irwan, J.M.; Tajarudin, H.A.; Othman, N.; Al-Gheethi, A.A.; Shamsudin, S.; Altowayti, W.A.H.; Abo Sabah, S. Optimization of Bio-Foamed Concrete Brick Strength via Bacteria Based Self-Healing and Bio-Sequestration of CO2. Materials 2021, 14, 4575. https://0-doi-org.brum.beds.ac.uk/10.3390/ma14164575
Alshalif AF, Irwan JM, Tajarudin HA, Othman N, Al-Gheethi AA, Shamsudin S, Altowayti WAH, Abo Sabah S. Optimization of Bio-Foamed Concrete Brick Strength via Bacteria Based Self-Healing and Bio-Sequestration of CO2. Materials. 2021; 14(16):4575. https://0-doi-org.brum.beds.ac.uk/10.3390/ma14164575
Chicago/Turabian StyleAlshalif, Abdullah Faisal, J. M. Irwan, Husnul Azan Tajarudin, N. Othman, A. A. Al-Gheethi, S. Shamsudin, Wahid Ali Hamood Altowayti, and Saddam Abo Sabah. 2021. "Optimization of Bio-Foamed Concrete Brick Strength via Bacteria Based Self-Healing and Bio-Sequestration of CO2" Materials 14, no. 16: 4575. https://0-doi-org.brum.beds.ac.uk/10.3390/ma14164575