
Influence of Sand-Cement Ratio and Polycarboxylate Superplasticizer on the Basic Properties of Mortar Based on Water Film Thickness

 ,
,
Abstract
:1. Introduction
2. Materials and Methods
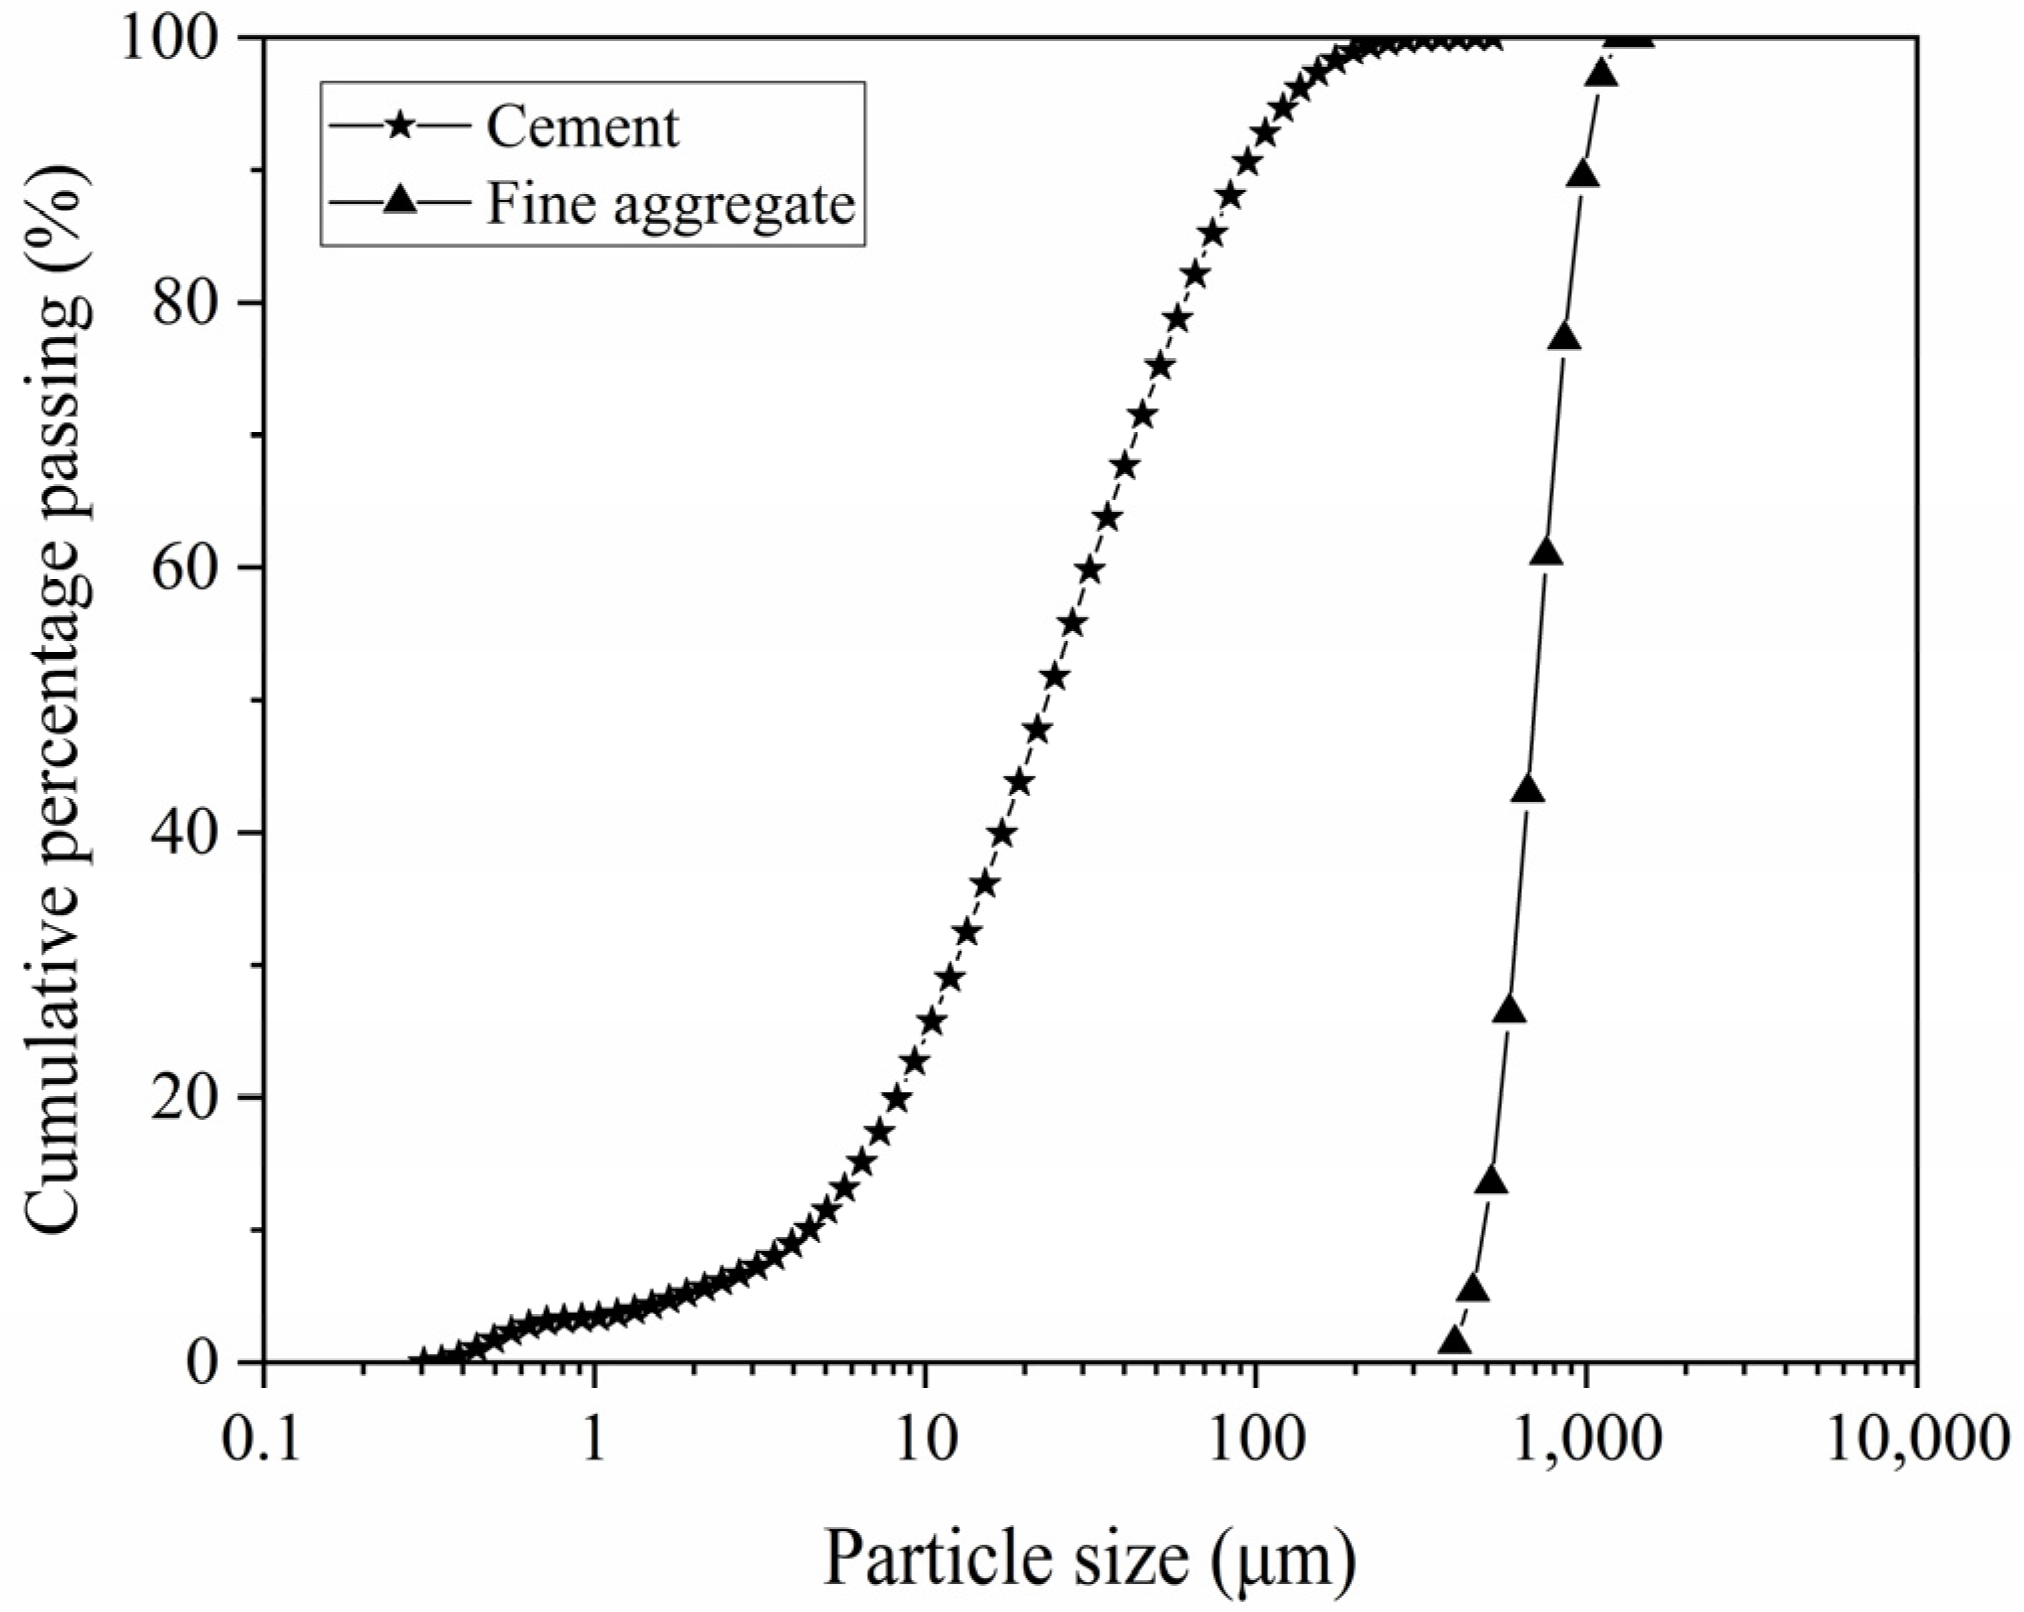
2.1. Materials
2.2. Mix Design
2.3. Testing Methods
2.3.1. Measuring Packing Density and Calculating Water Film Thickness
2.3.2. Measuring Cohesiveness
2.3.3. Measuring Flow Spread
2.3.4. Measuring Strength
3. Results and Discussion
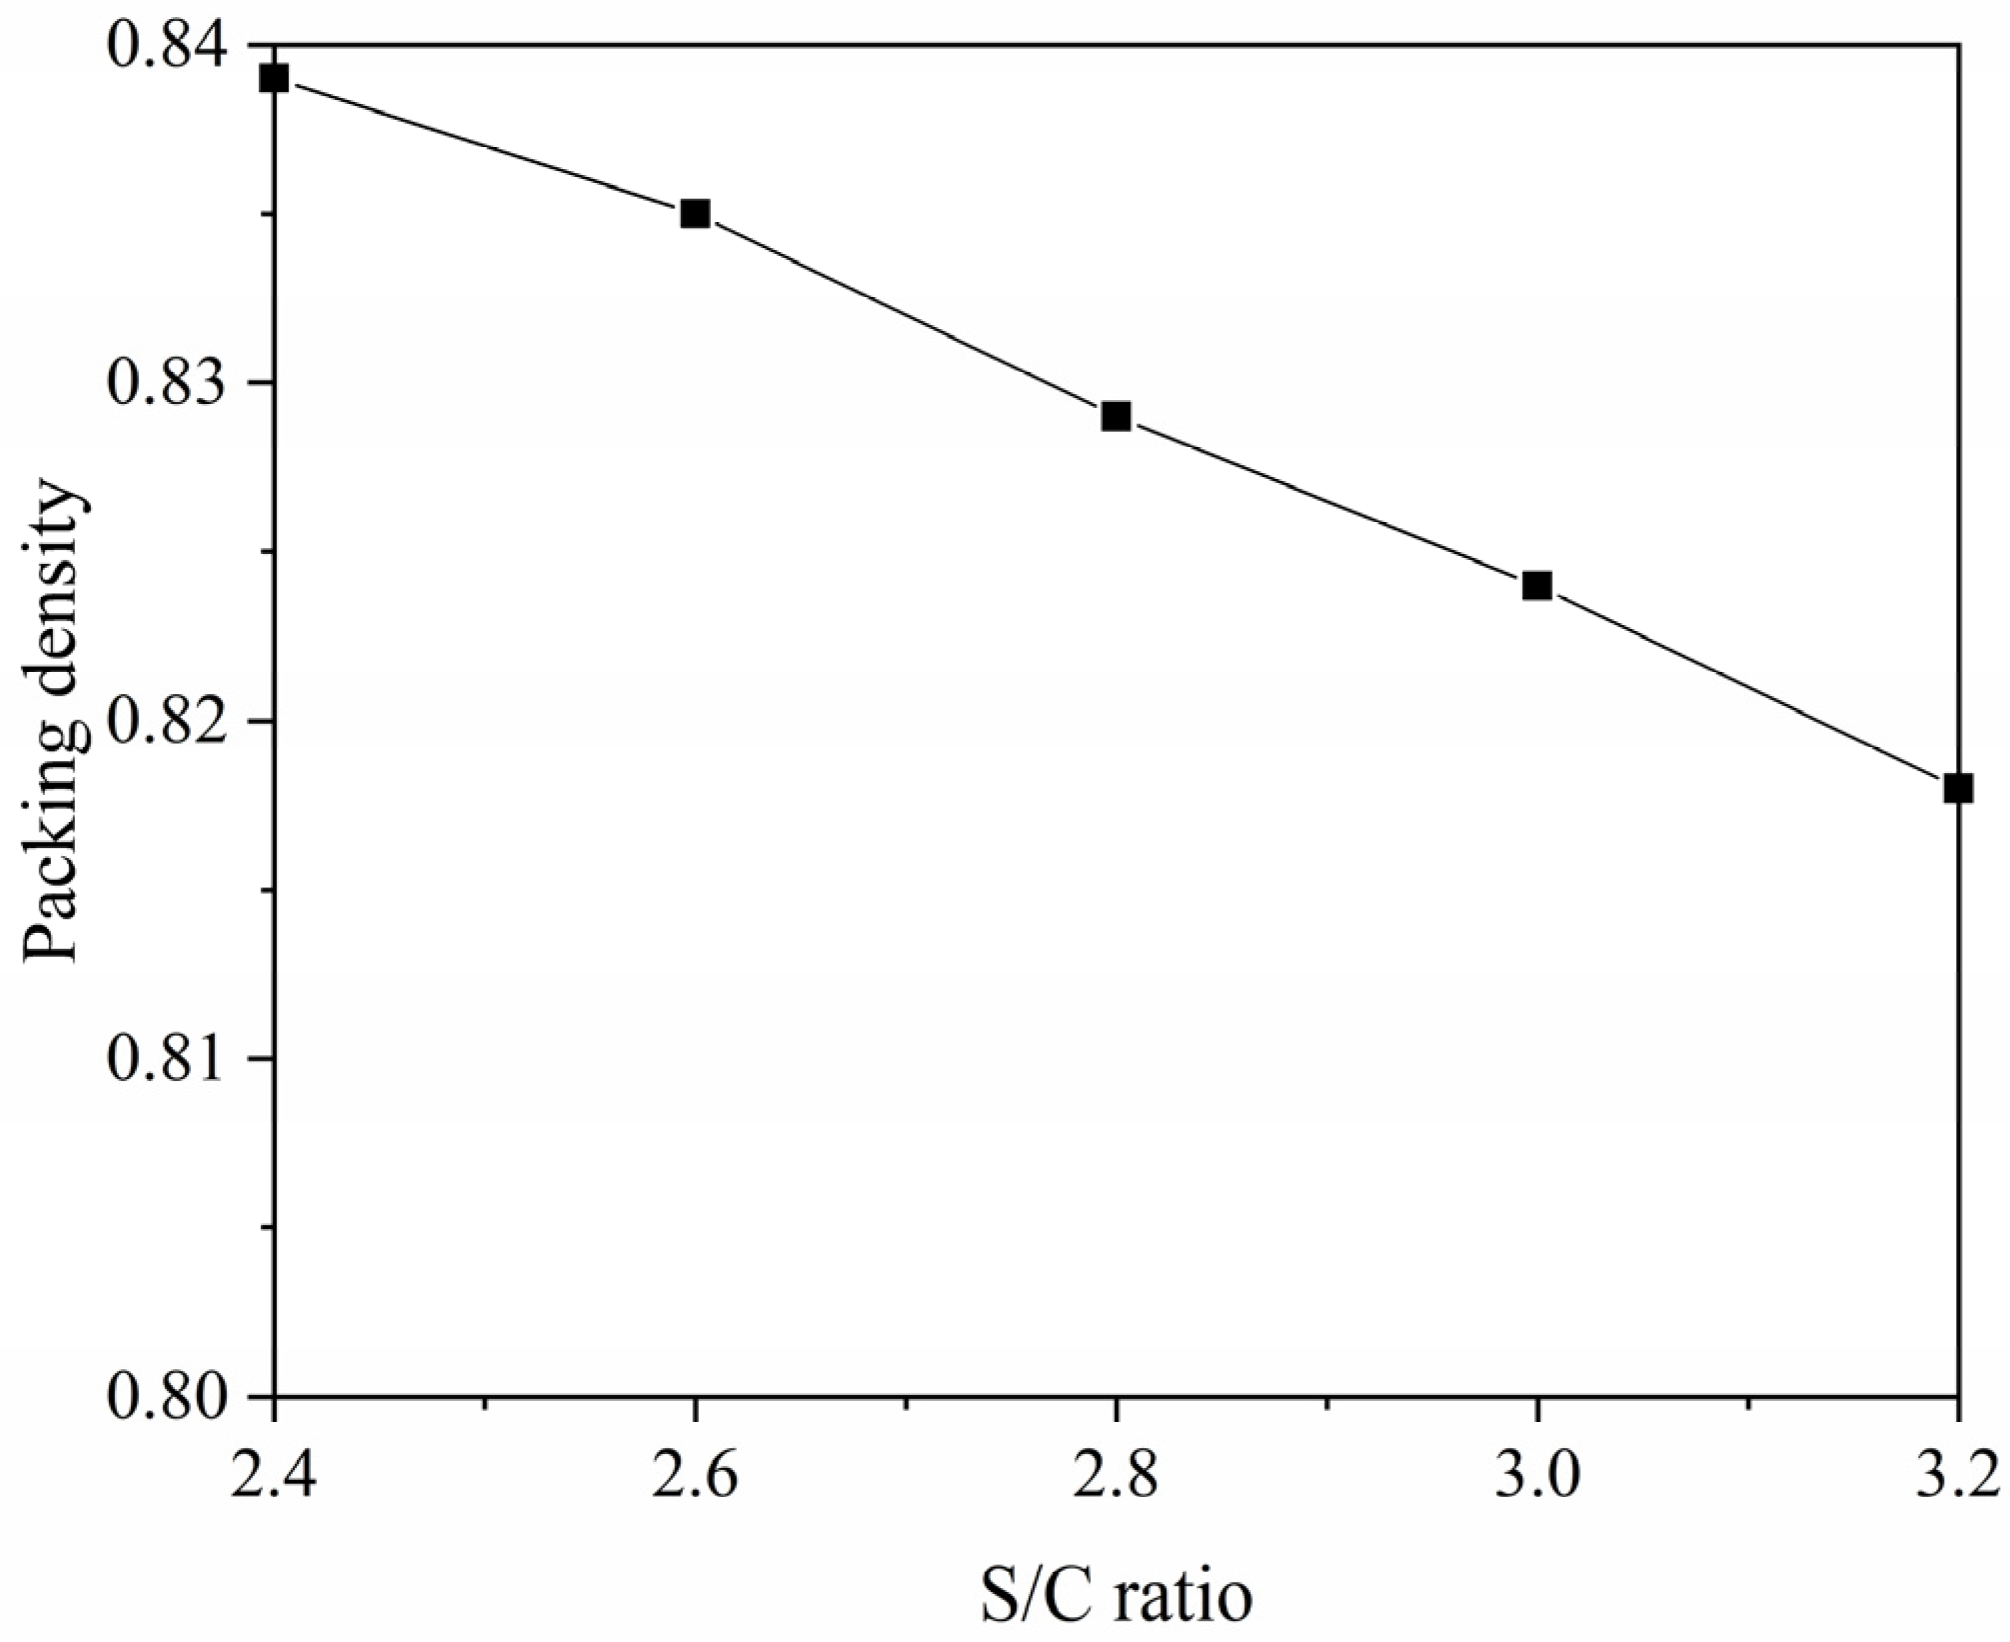
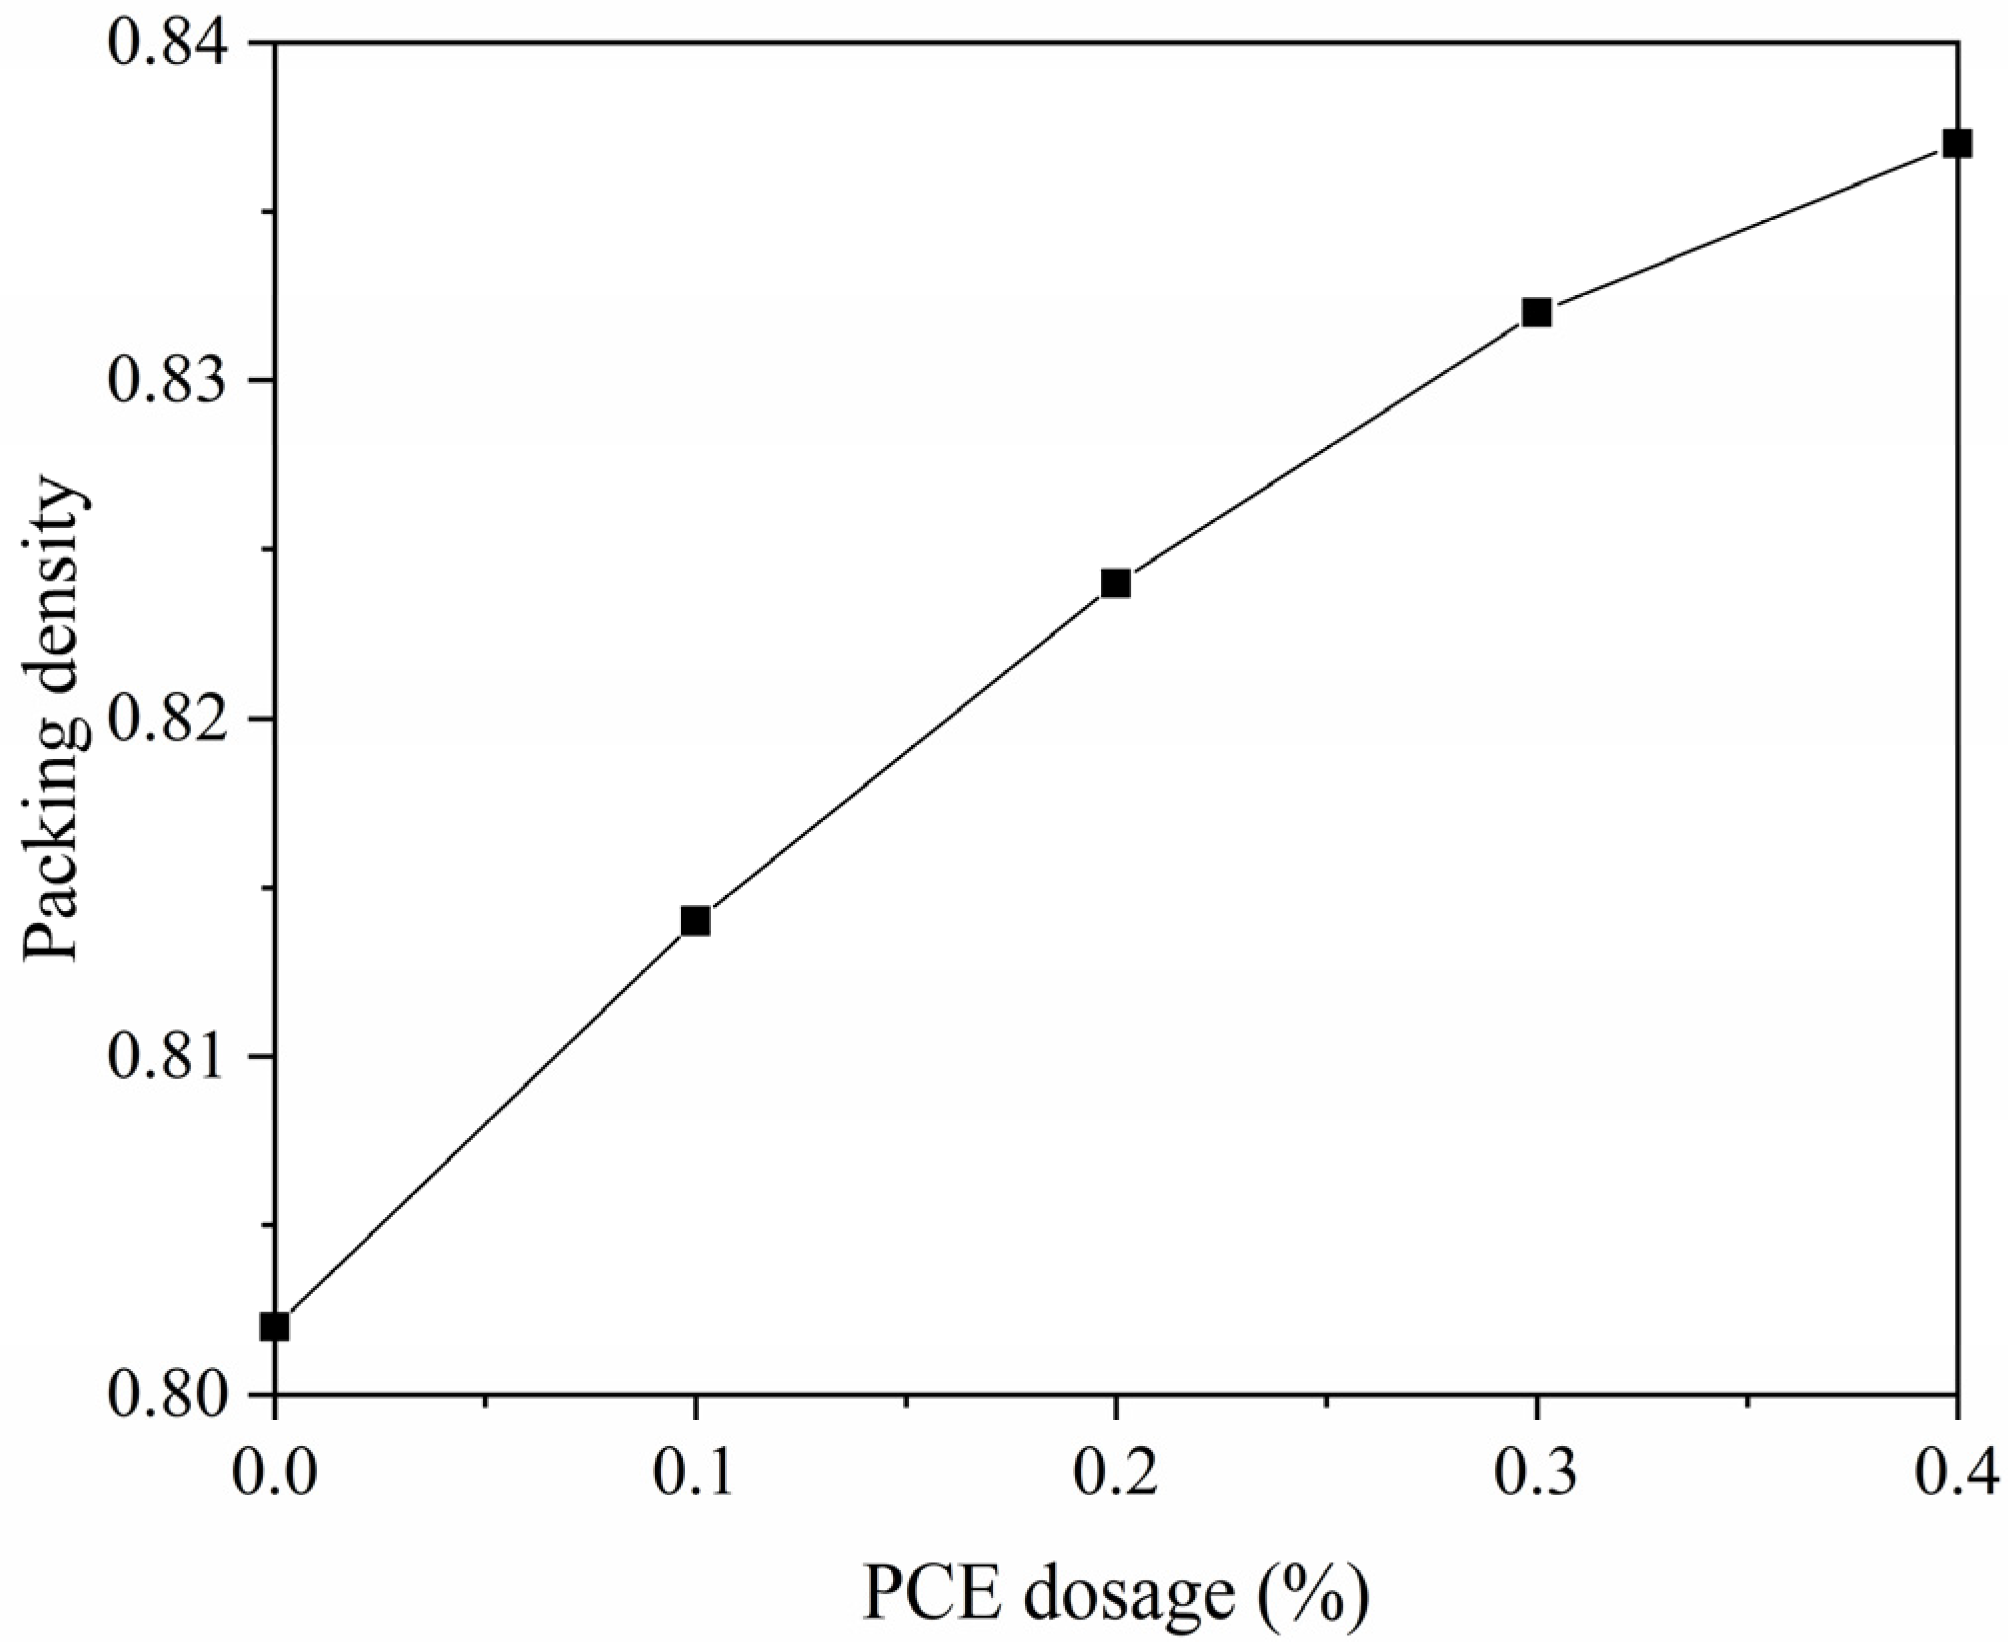
3.1. Packing Density
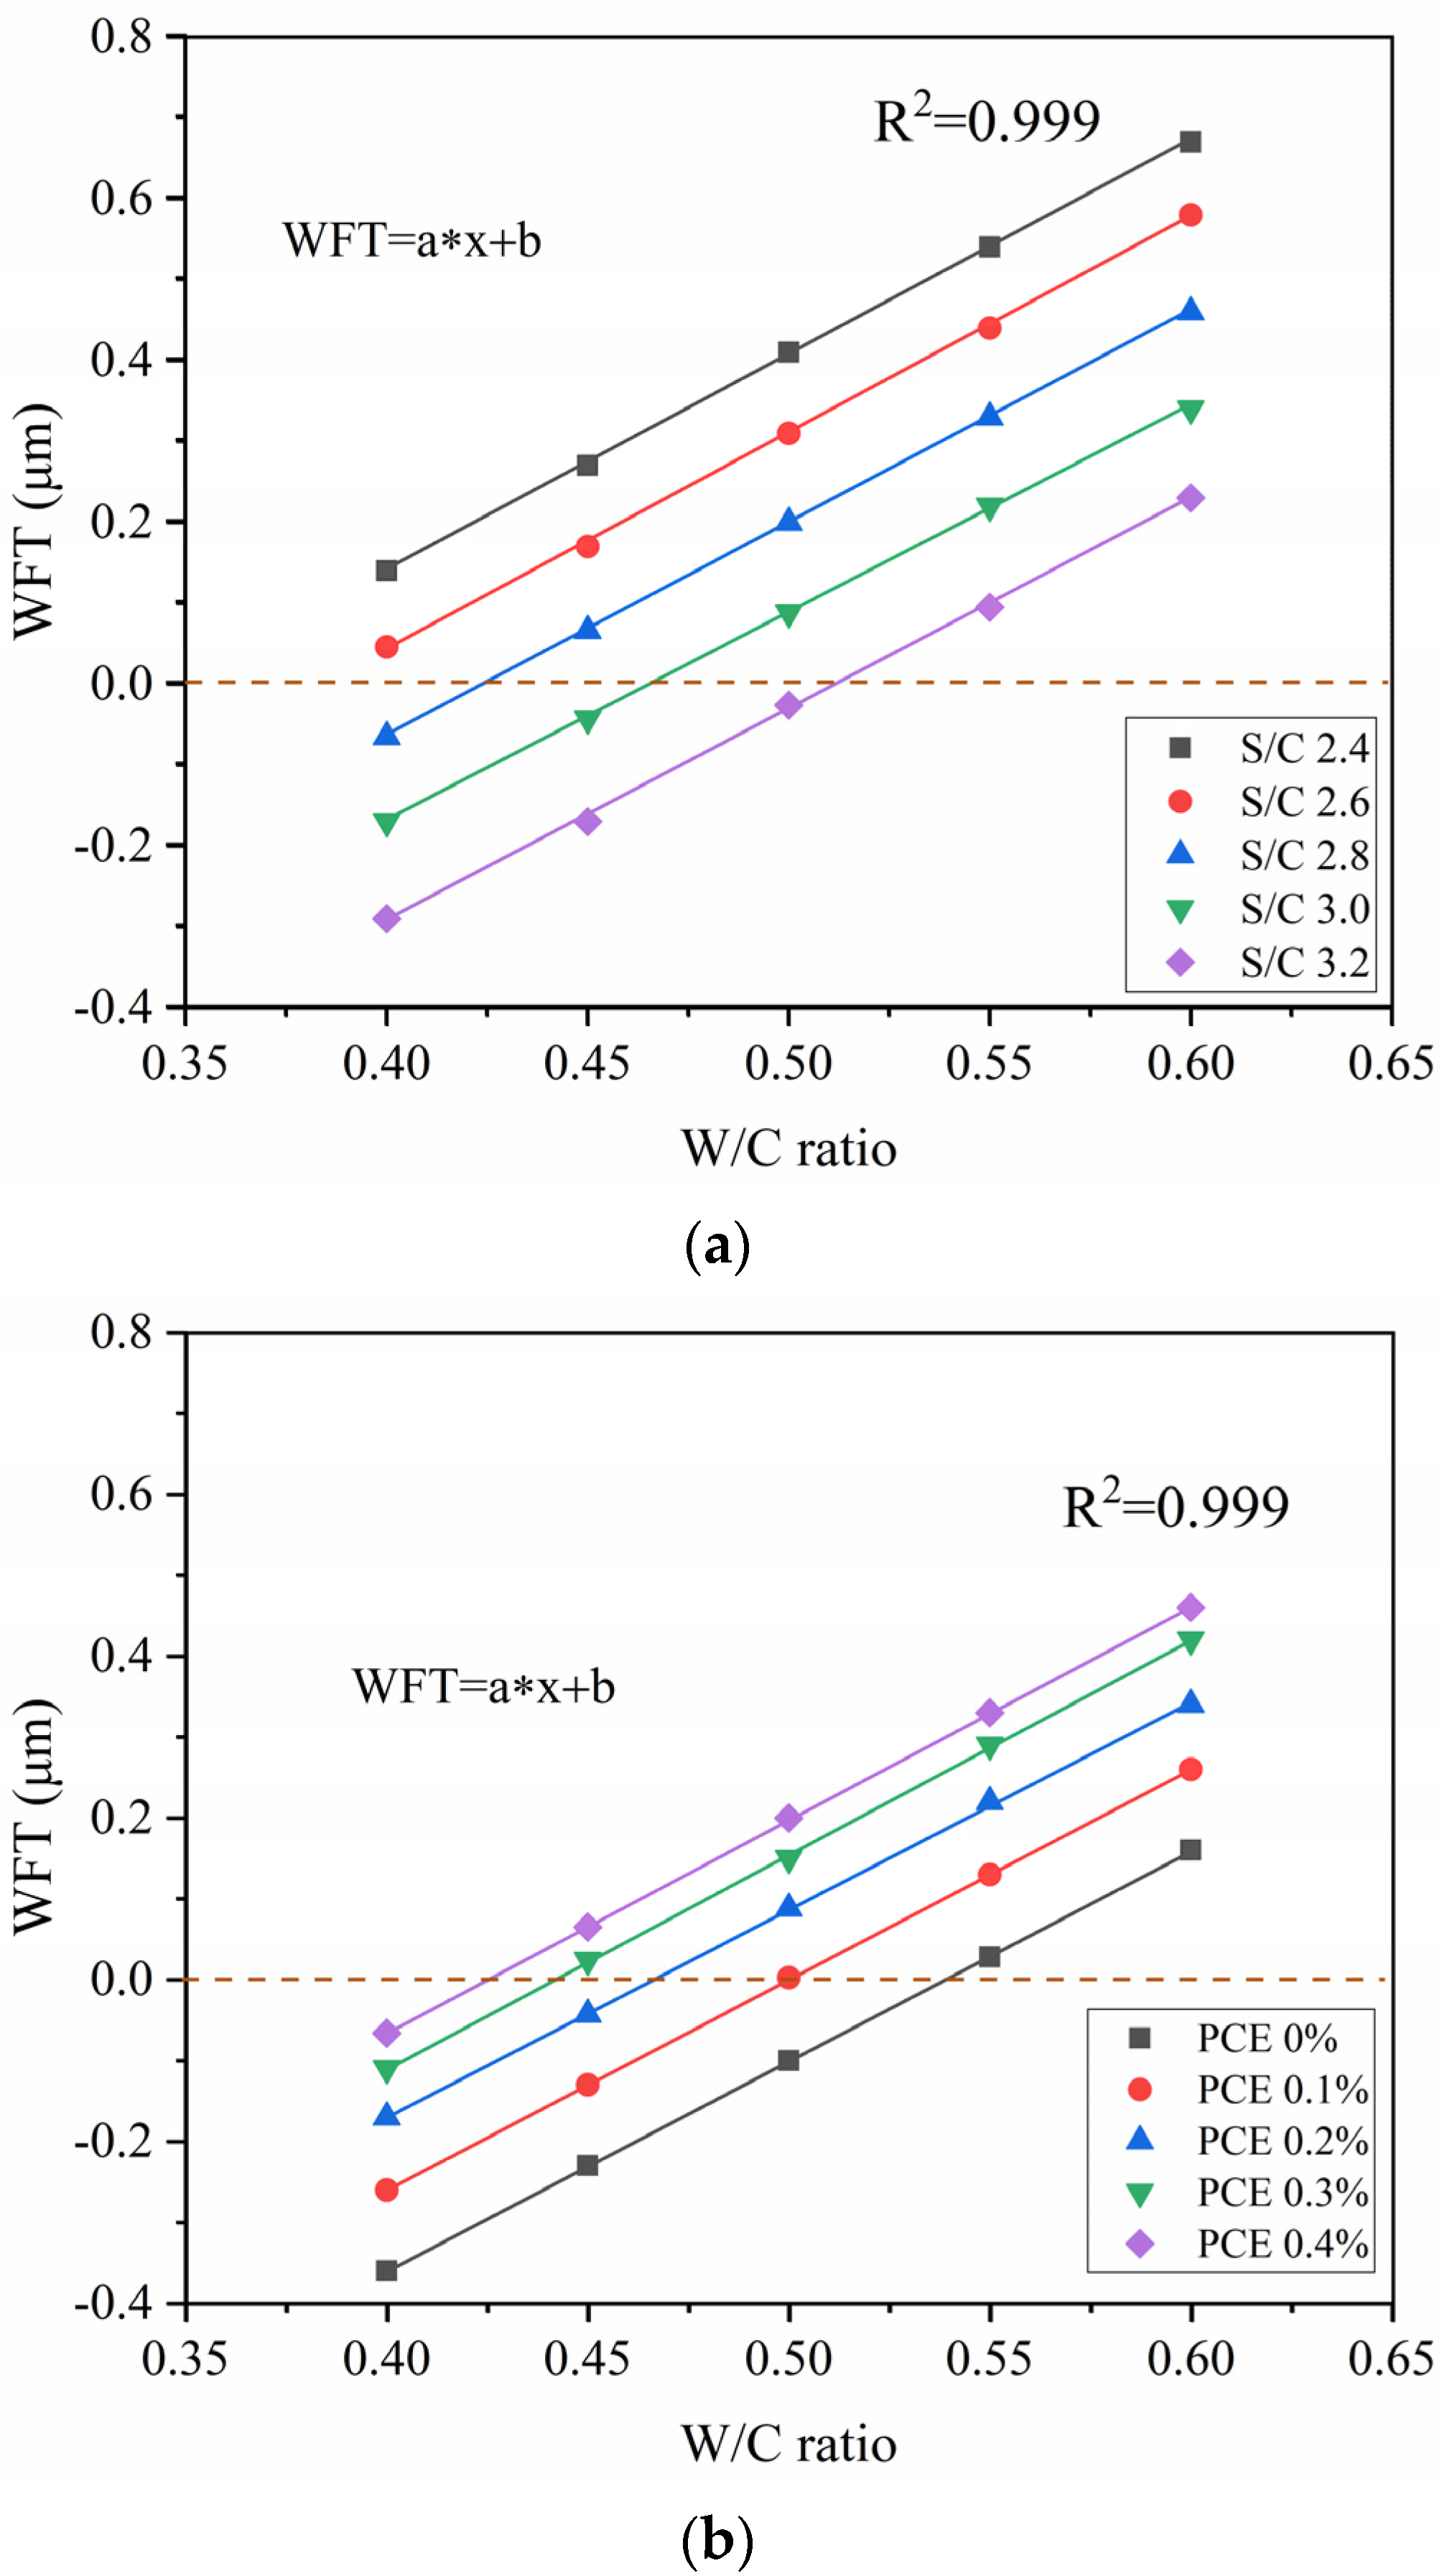
3.2. WFT Results
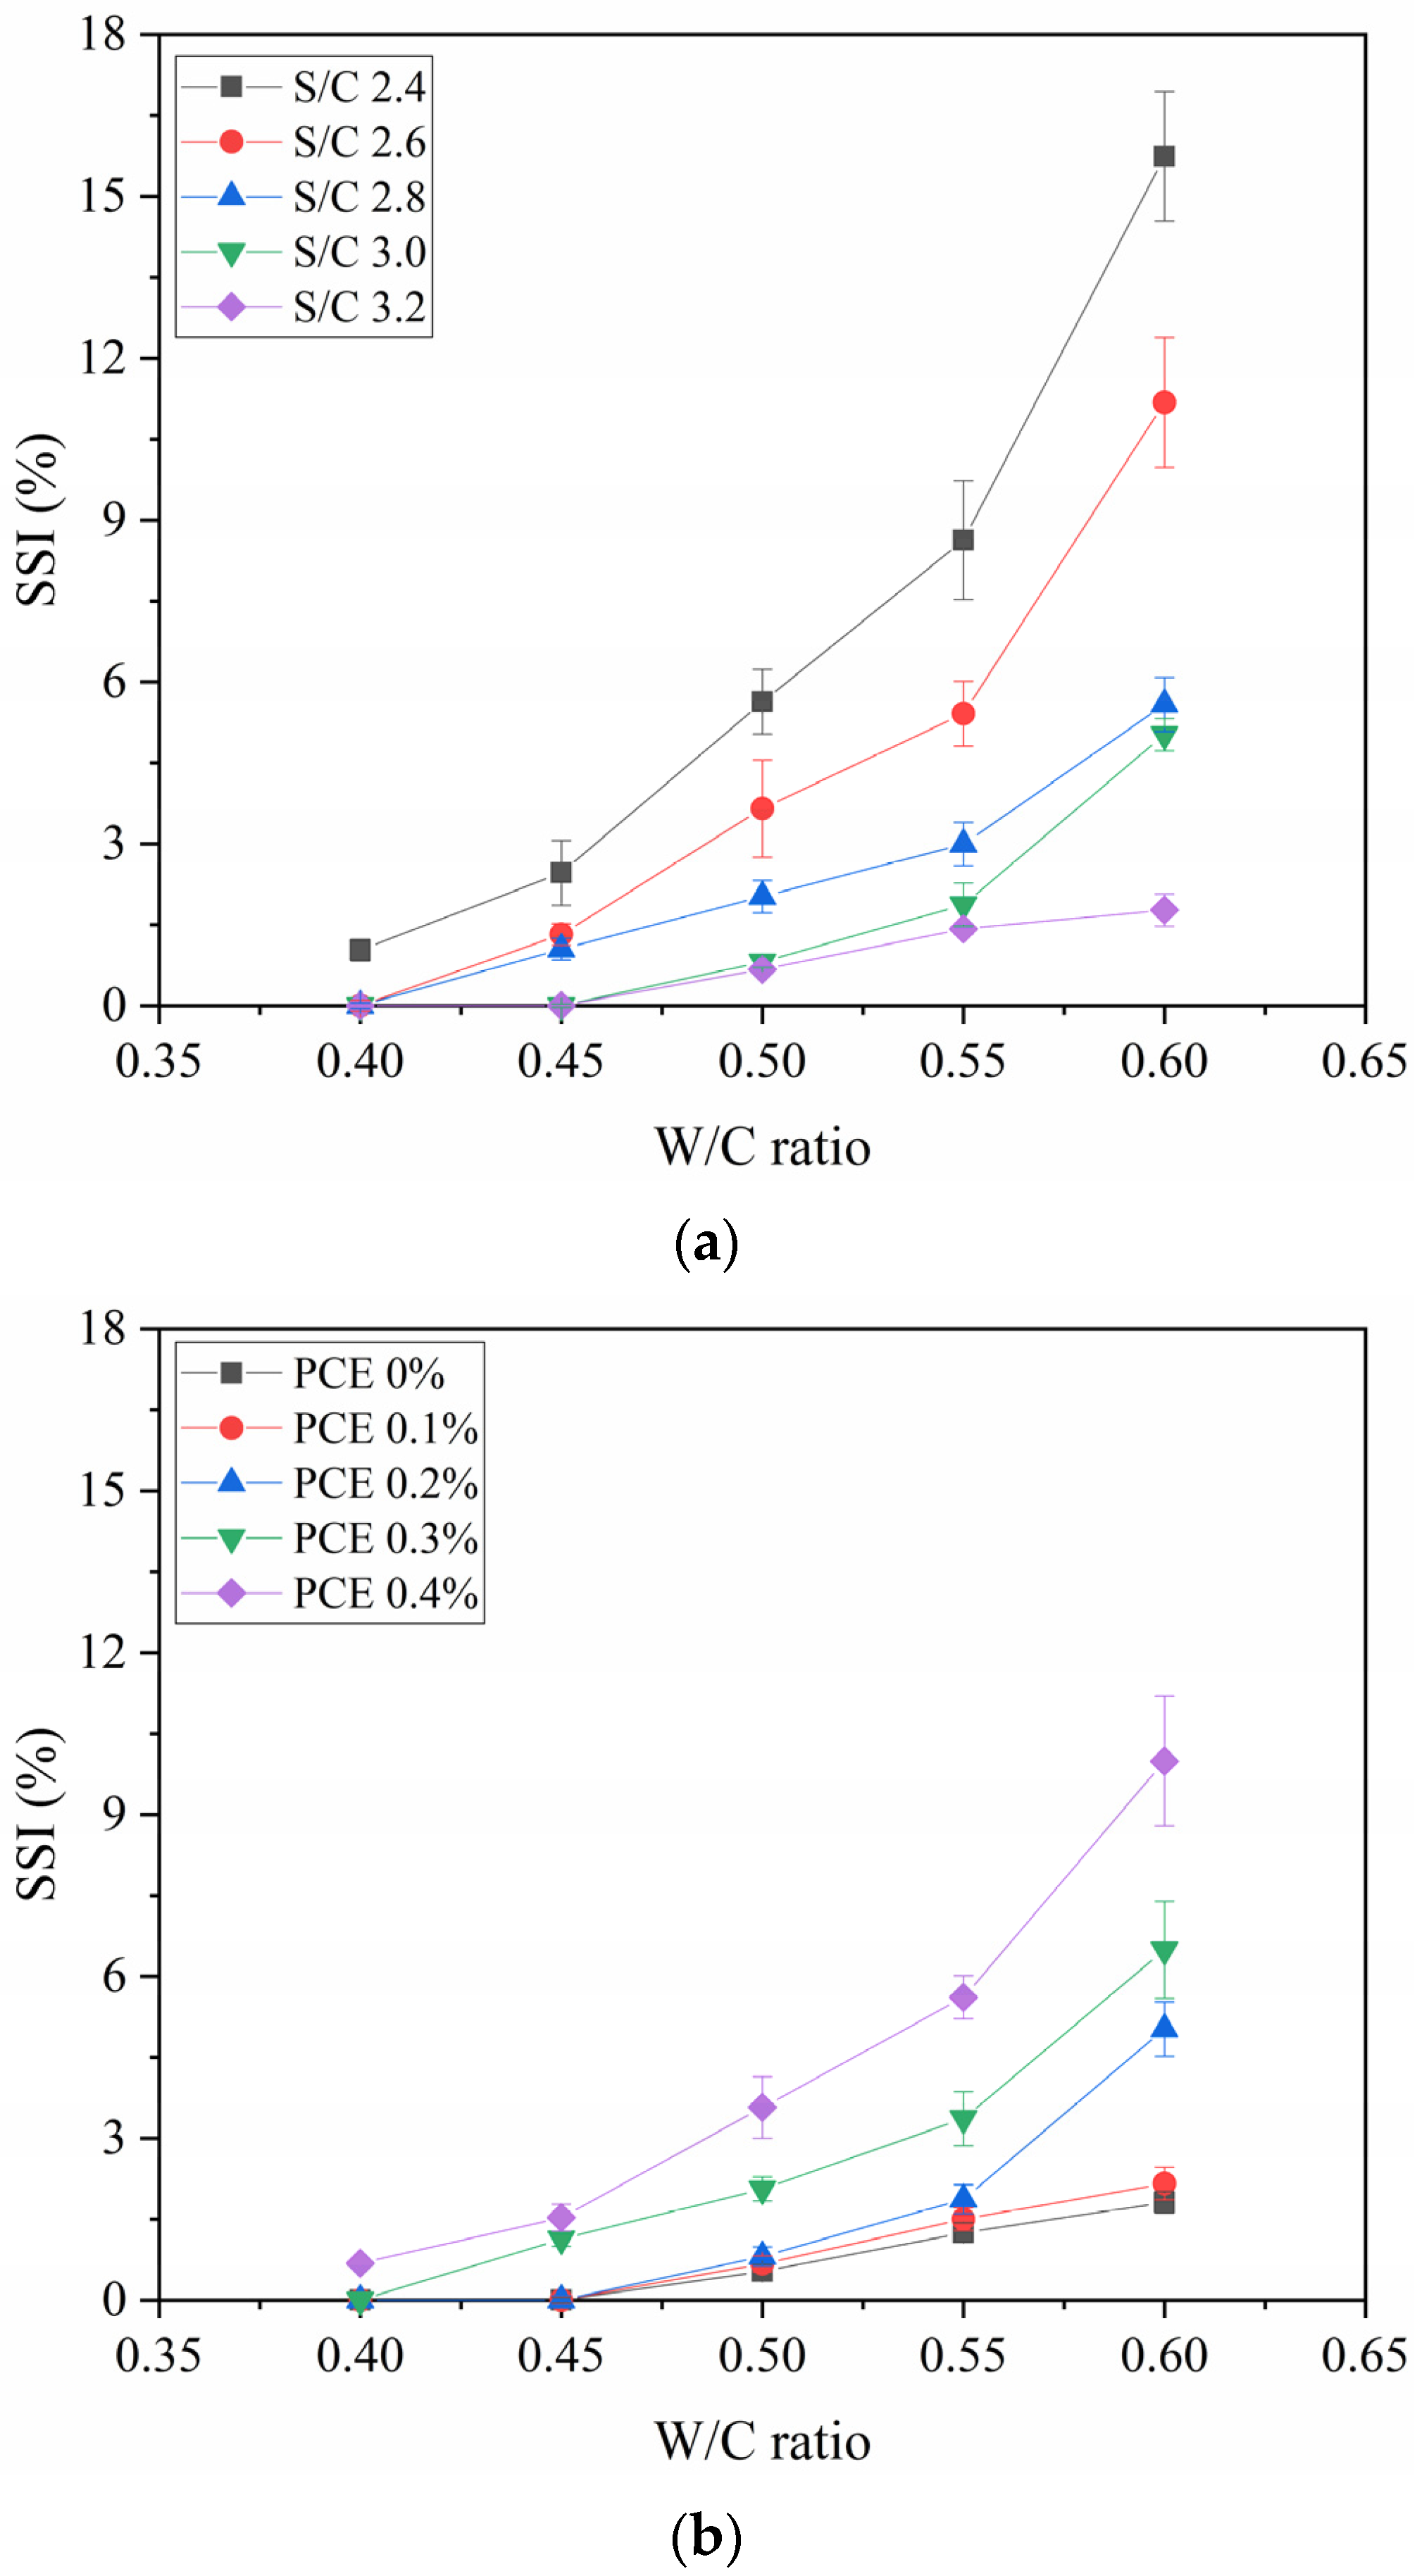
3.3. Cohesiveness
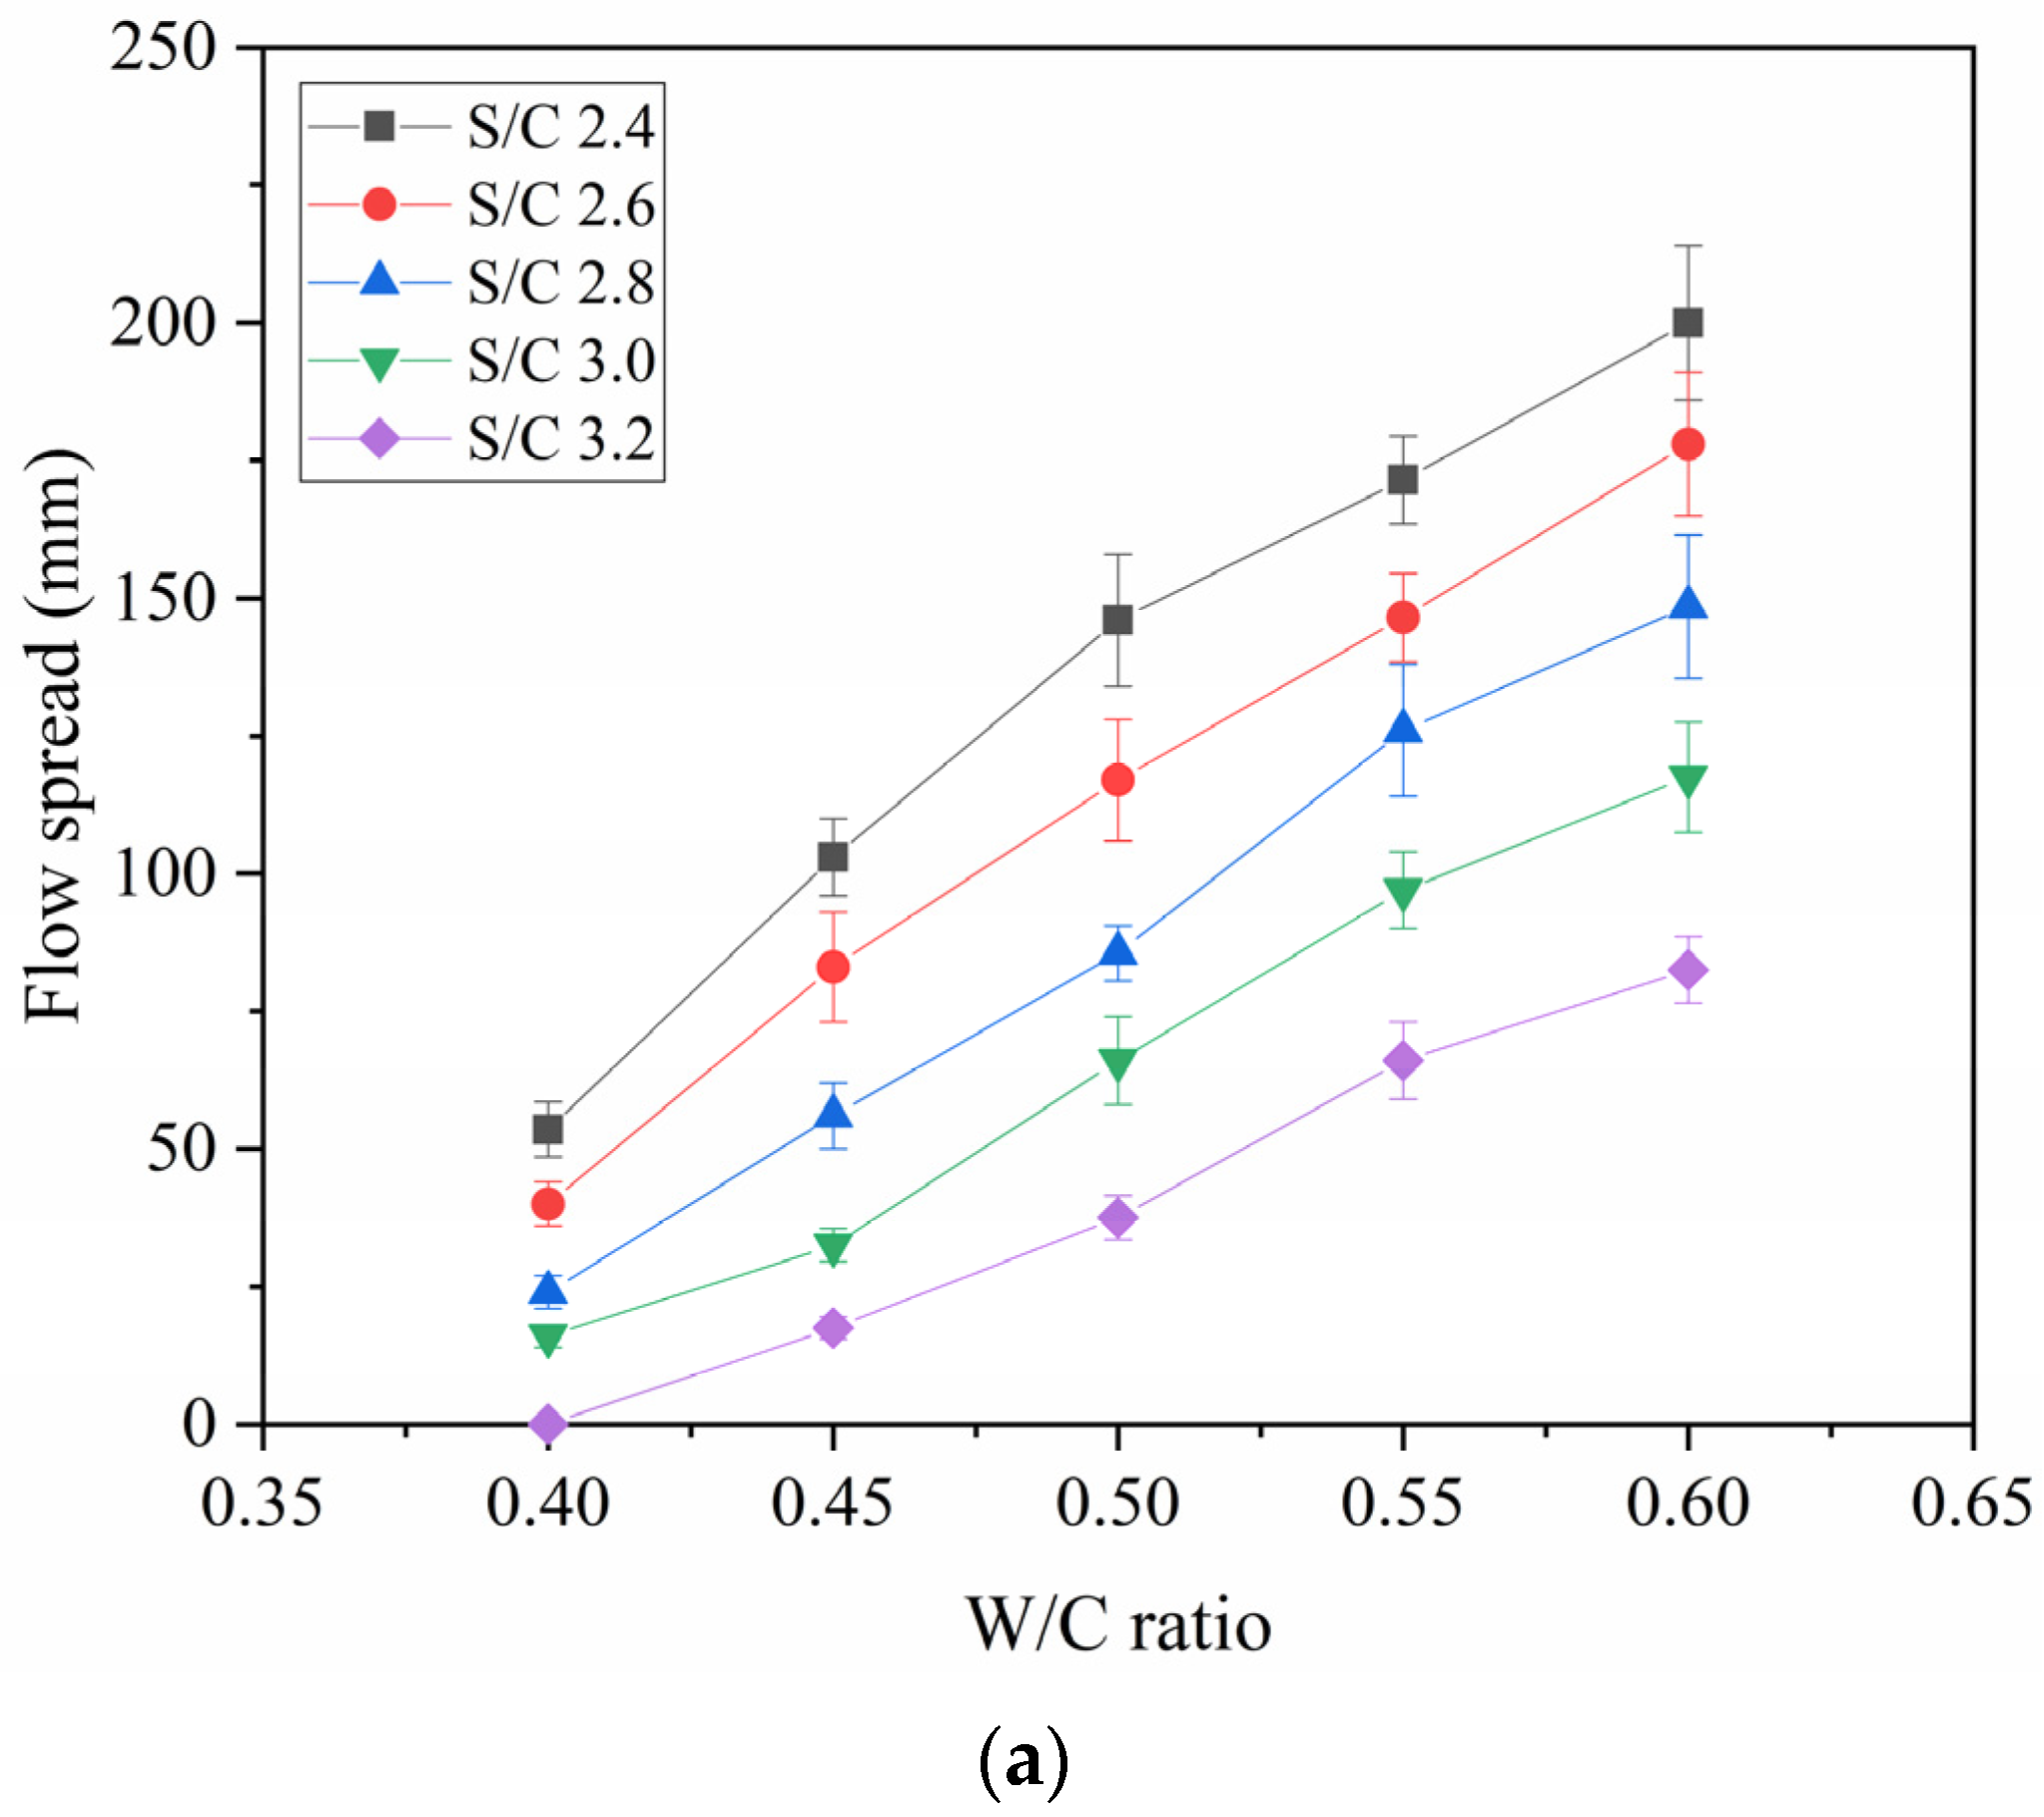
3.4. Flow Spread
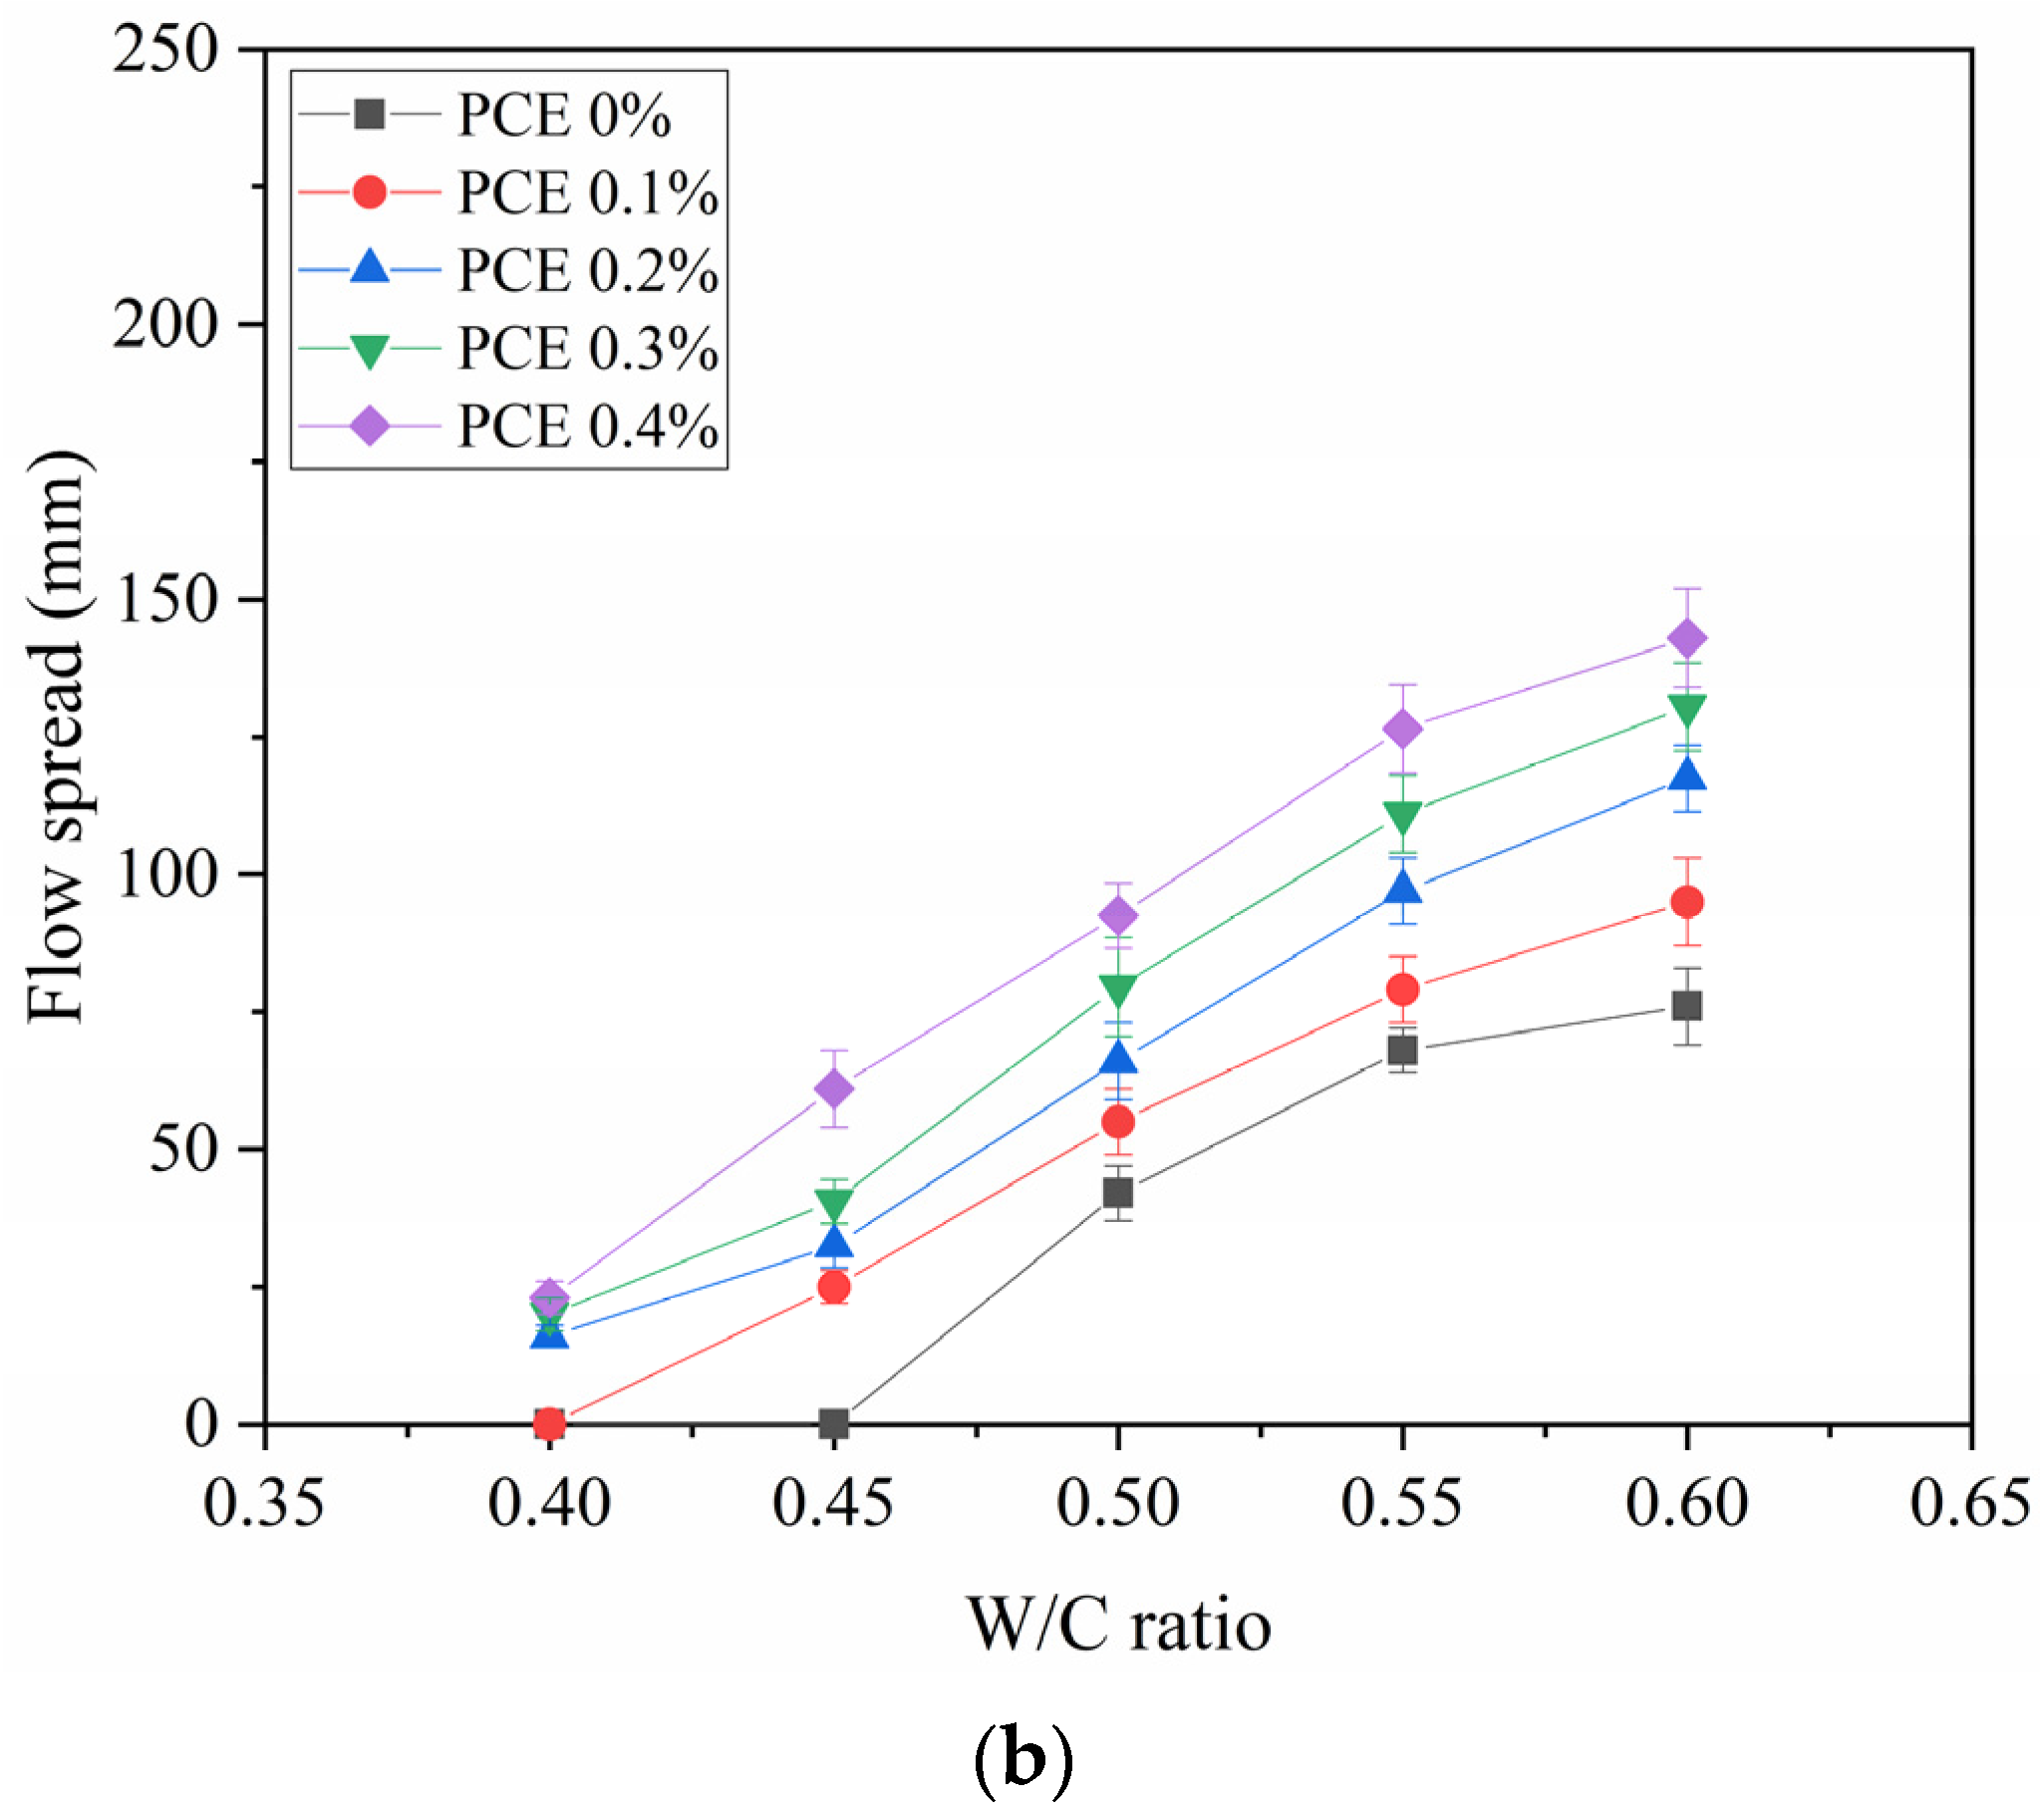
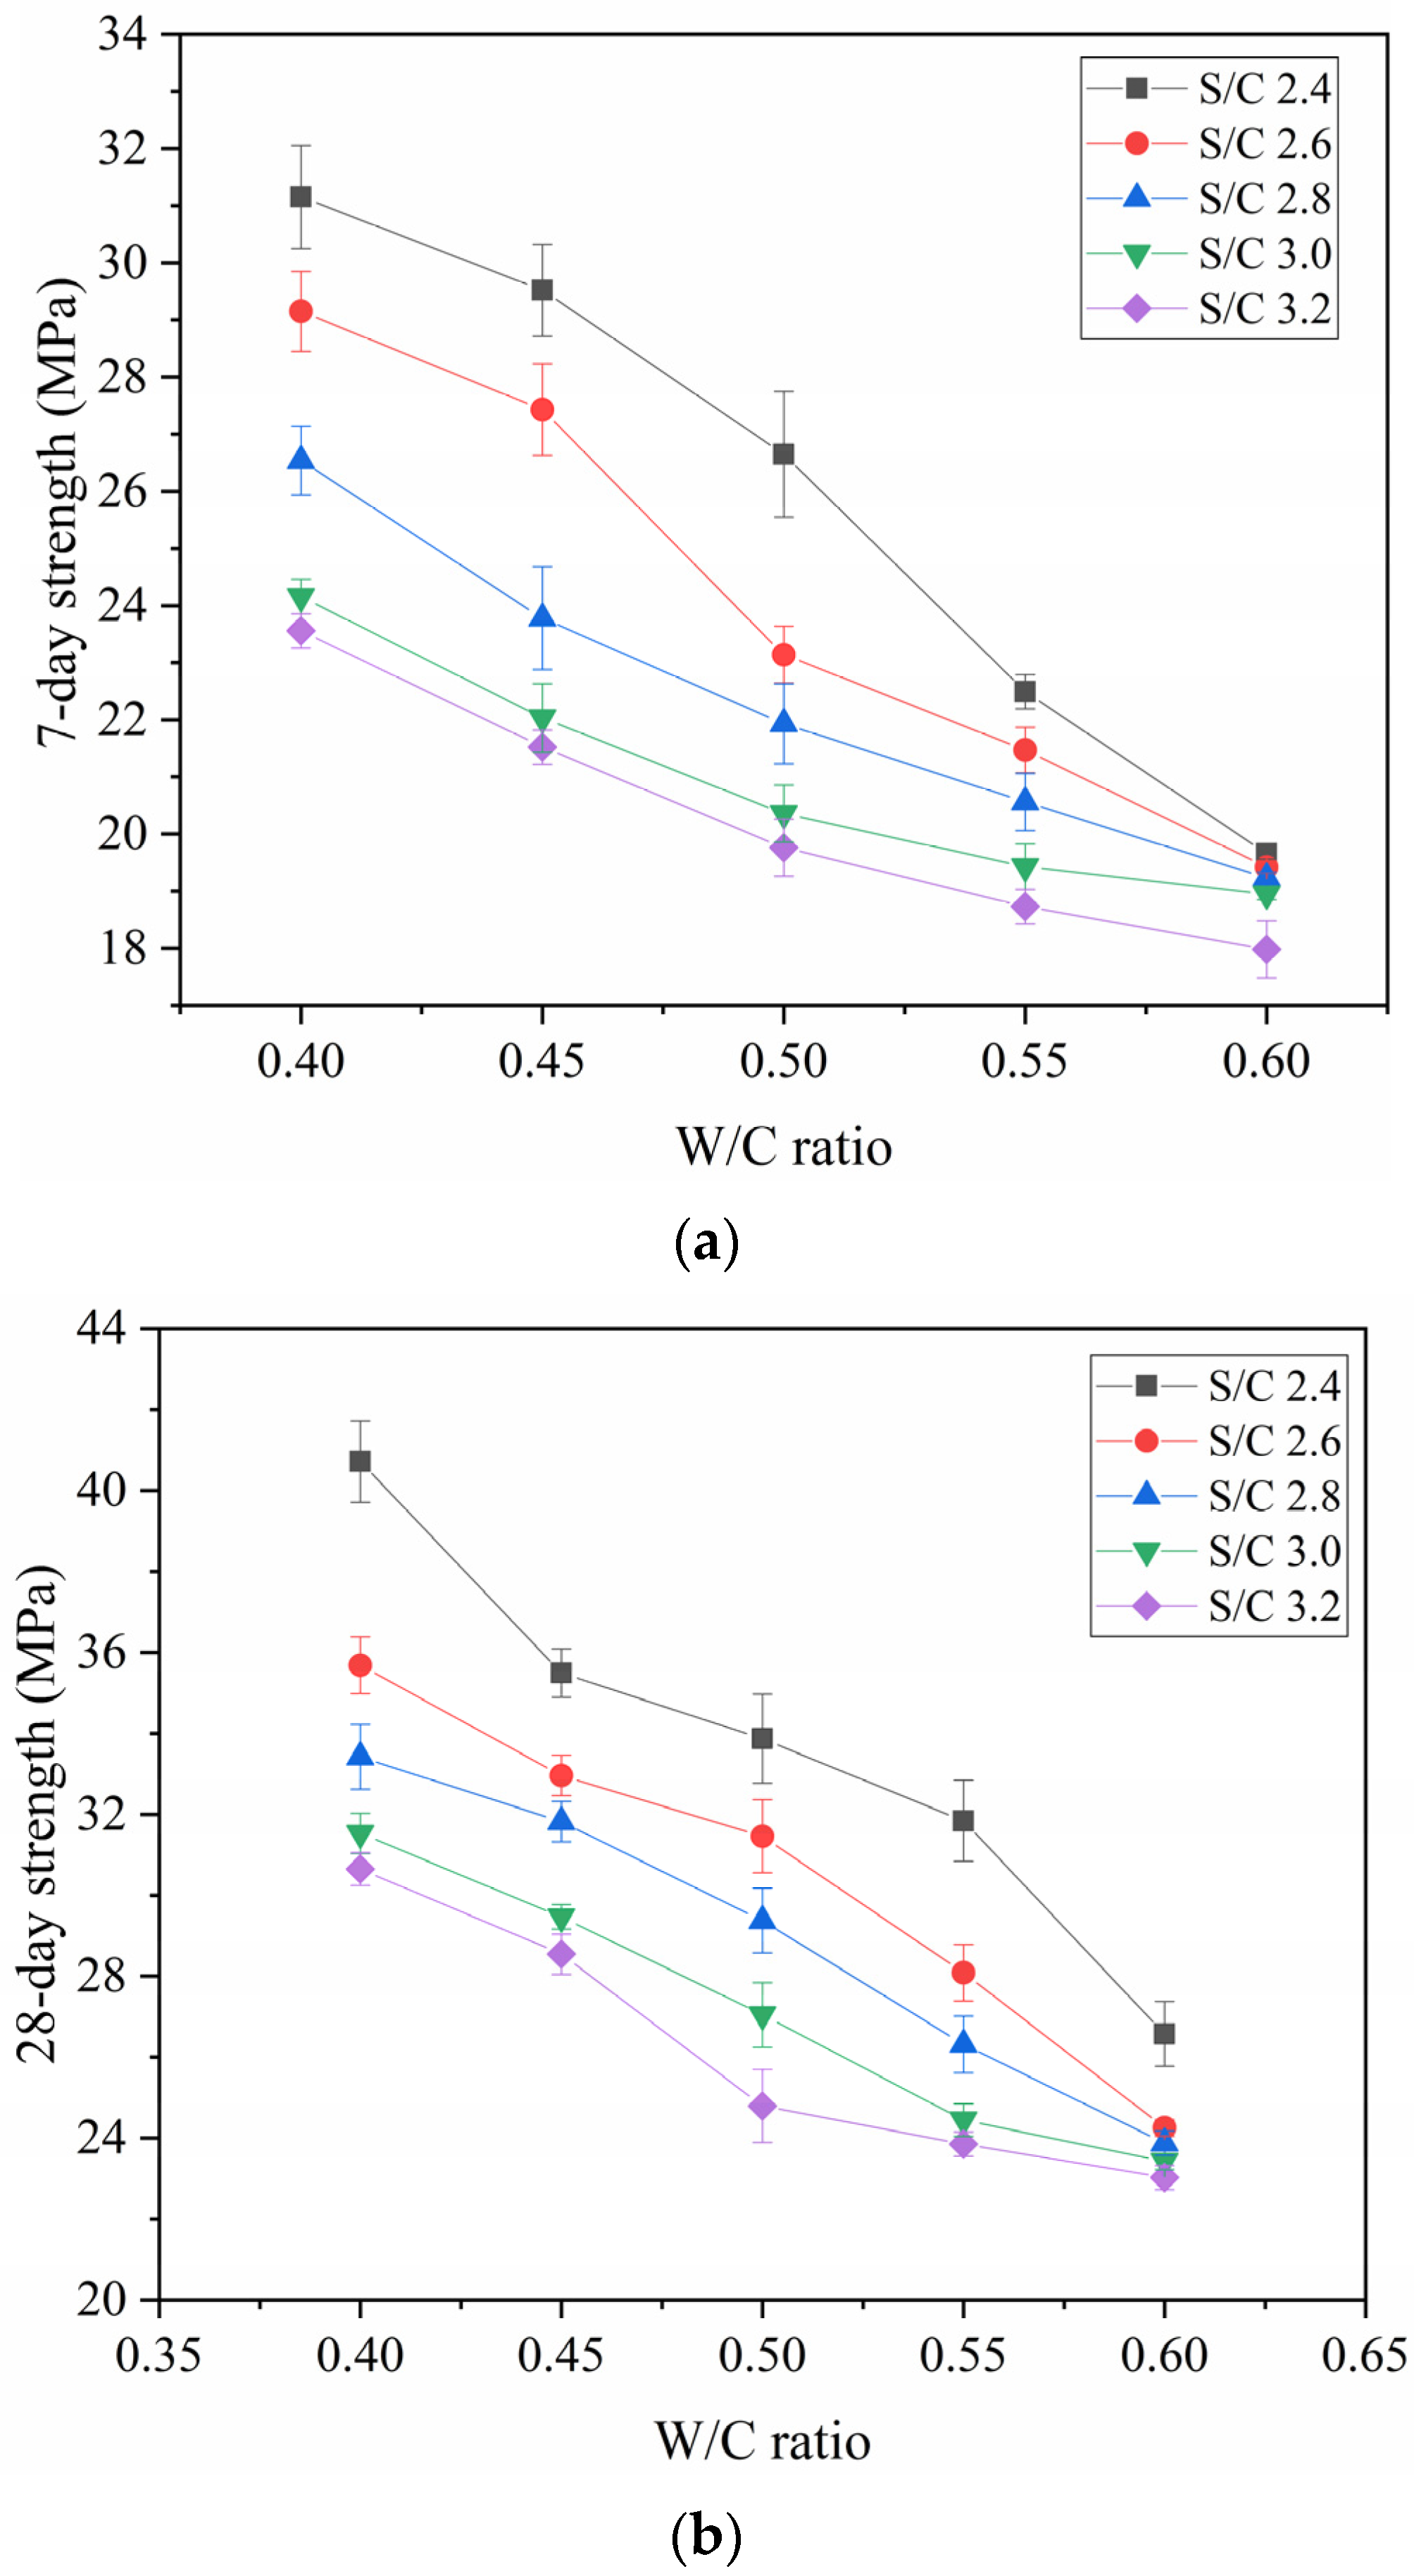
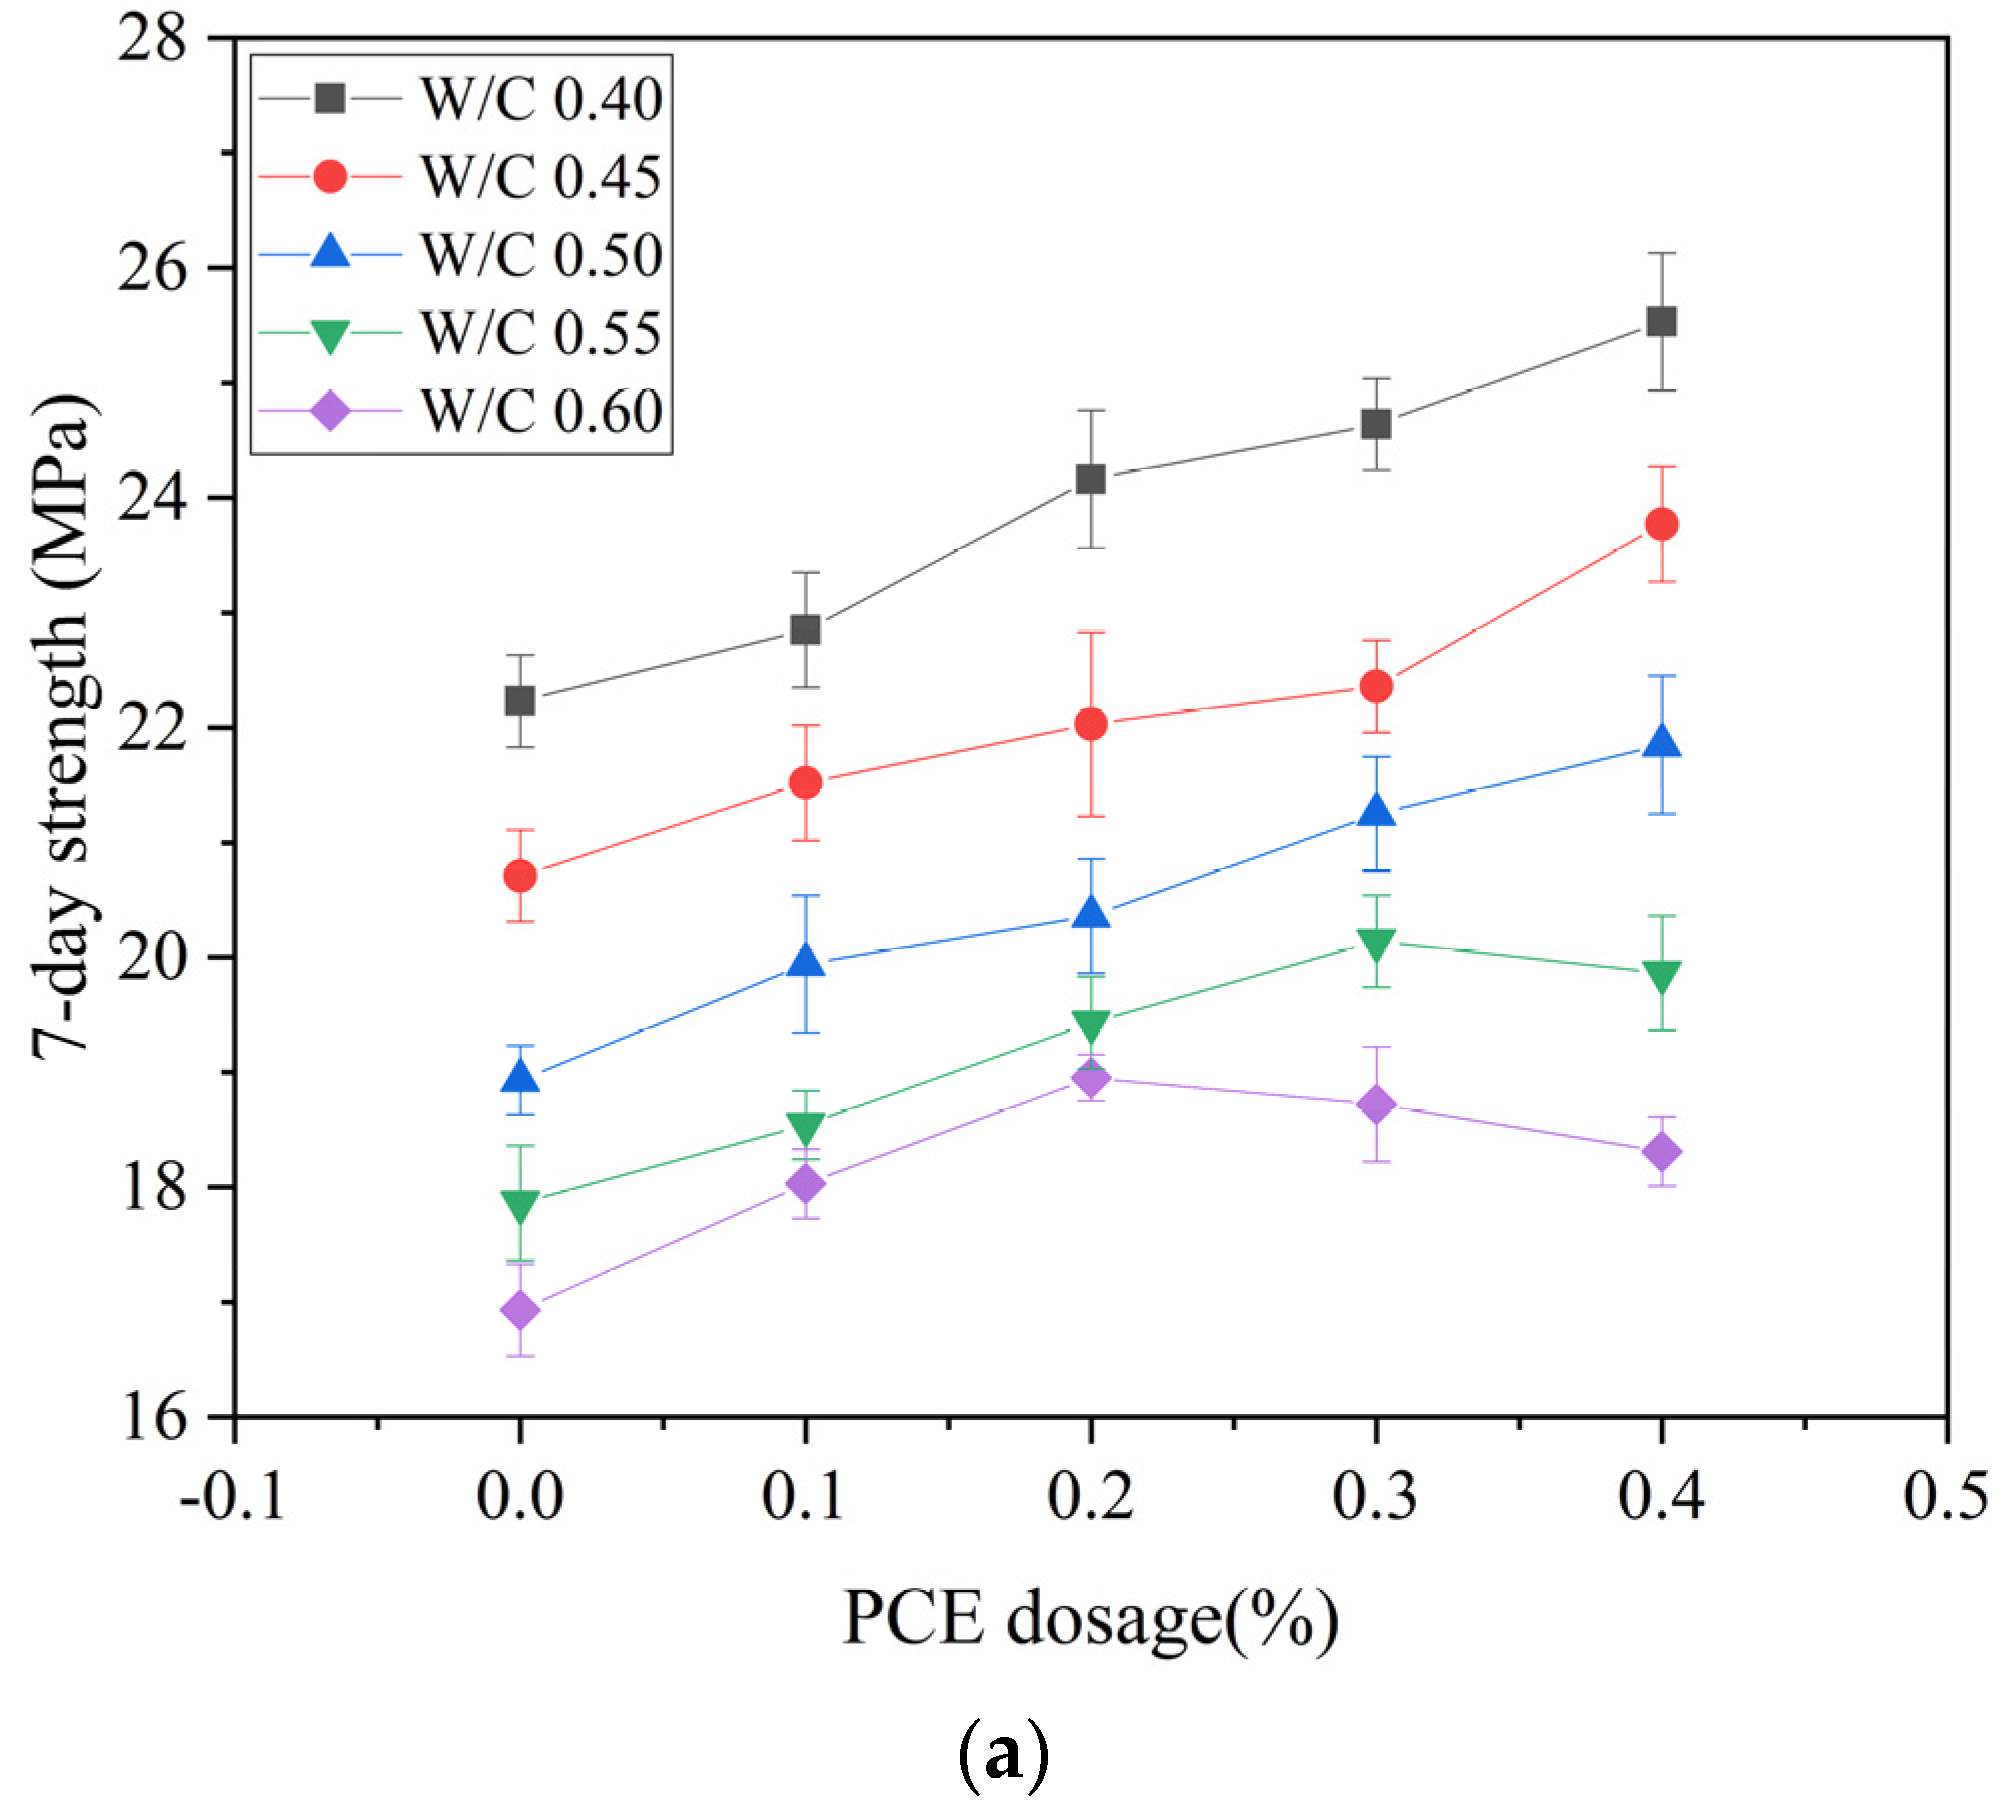
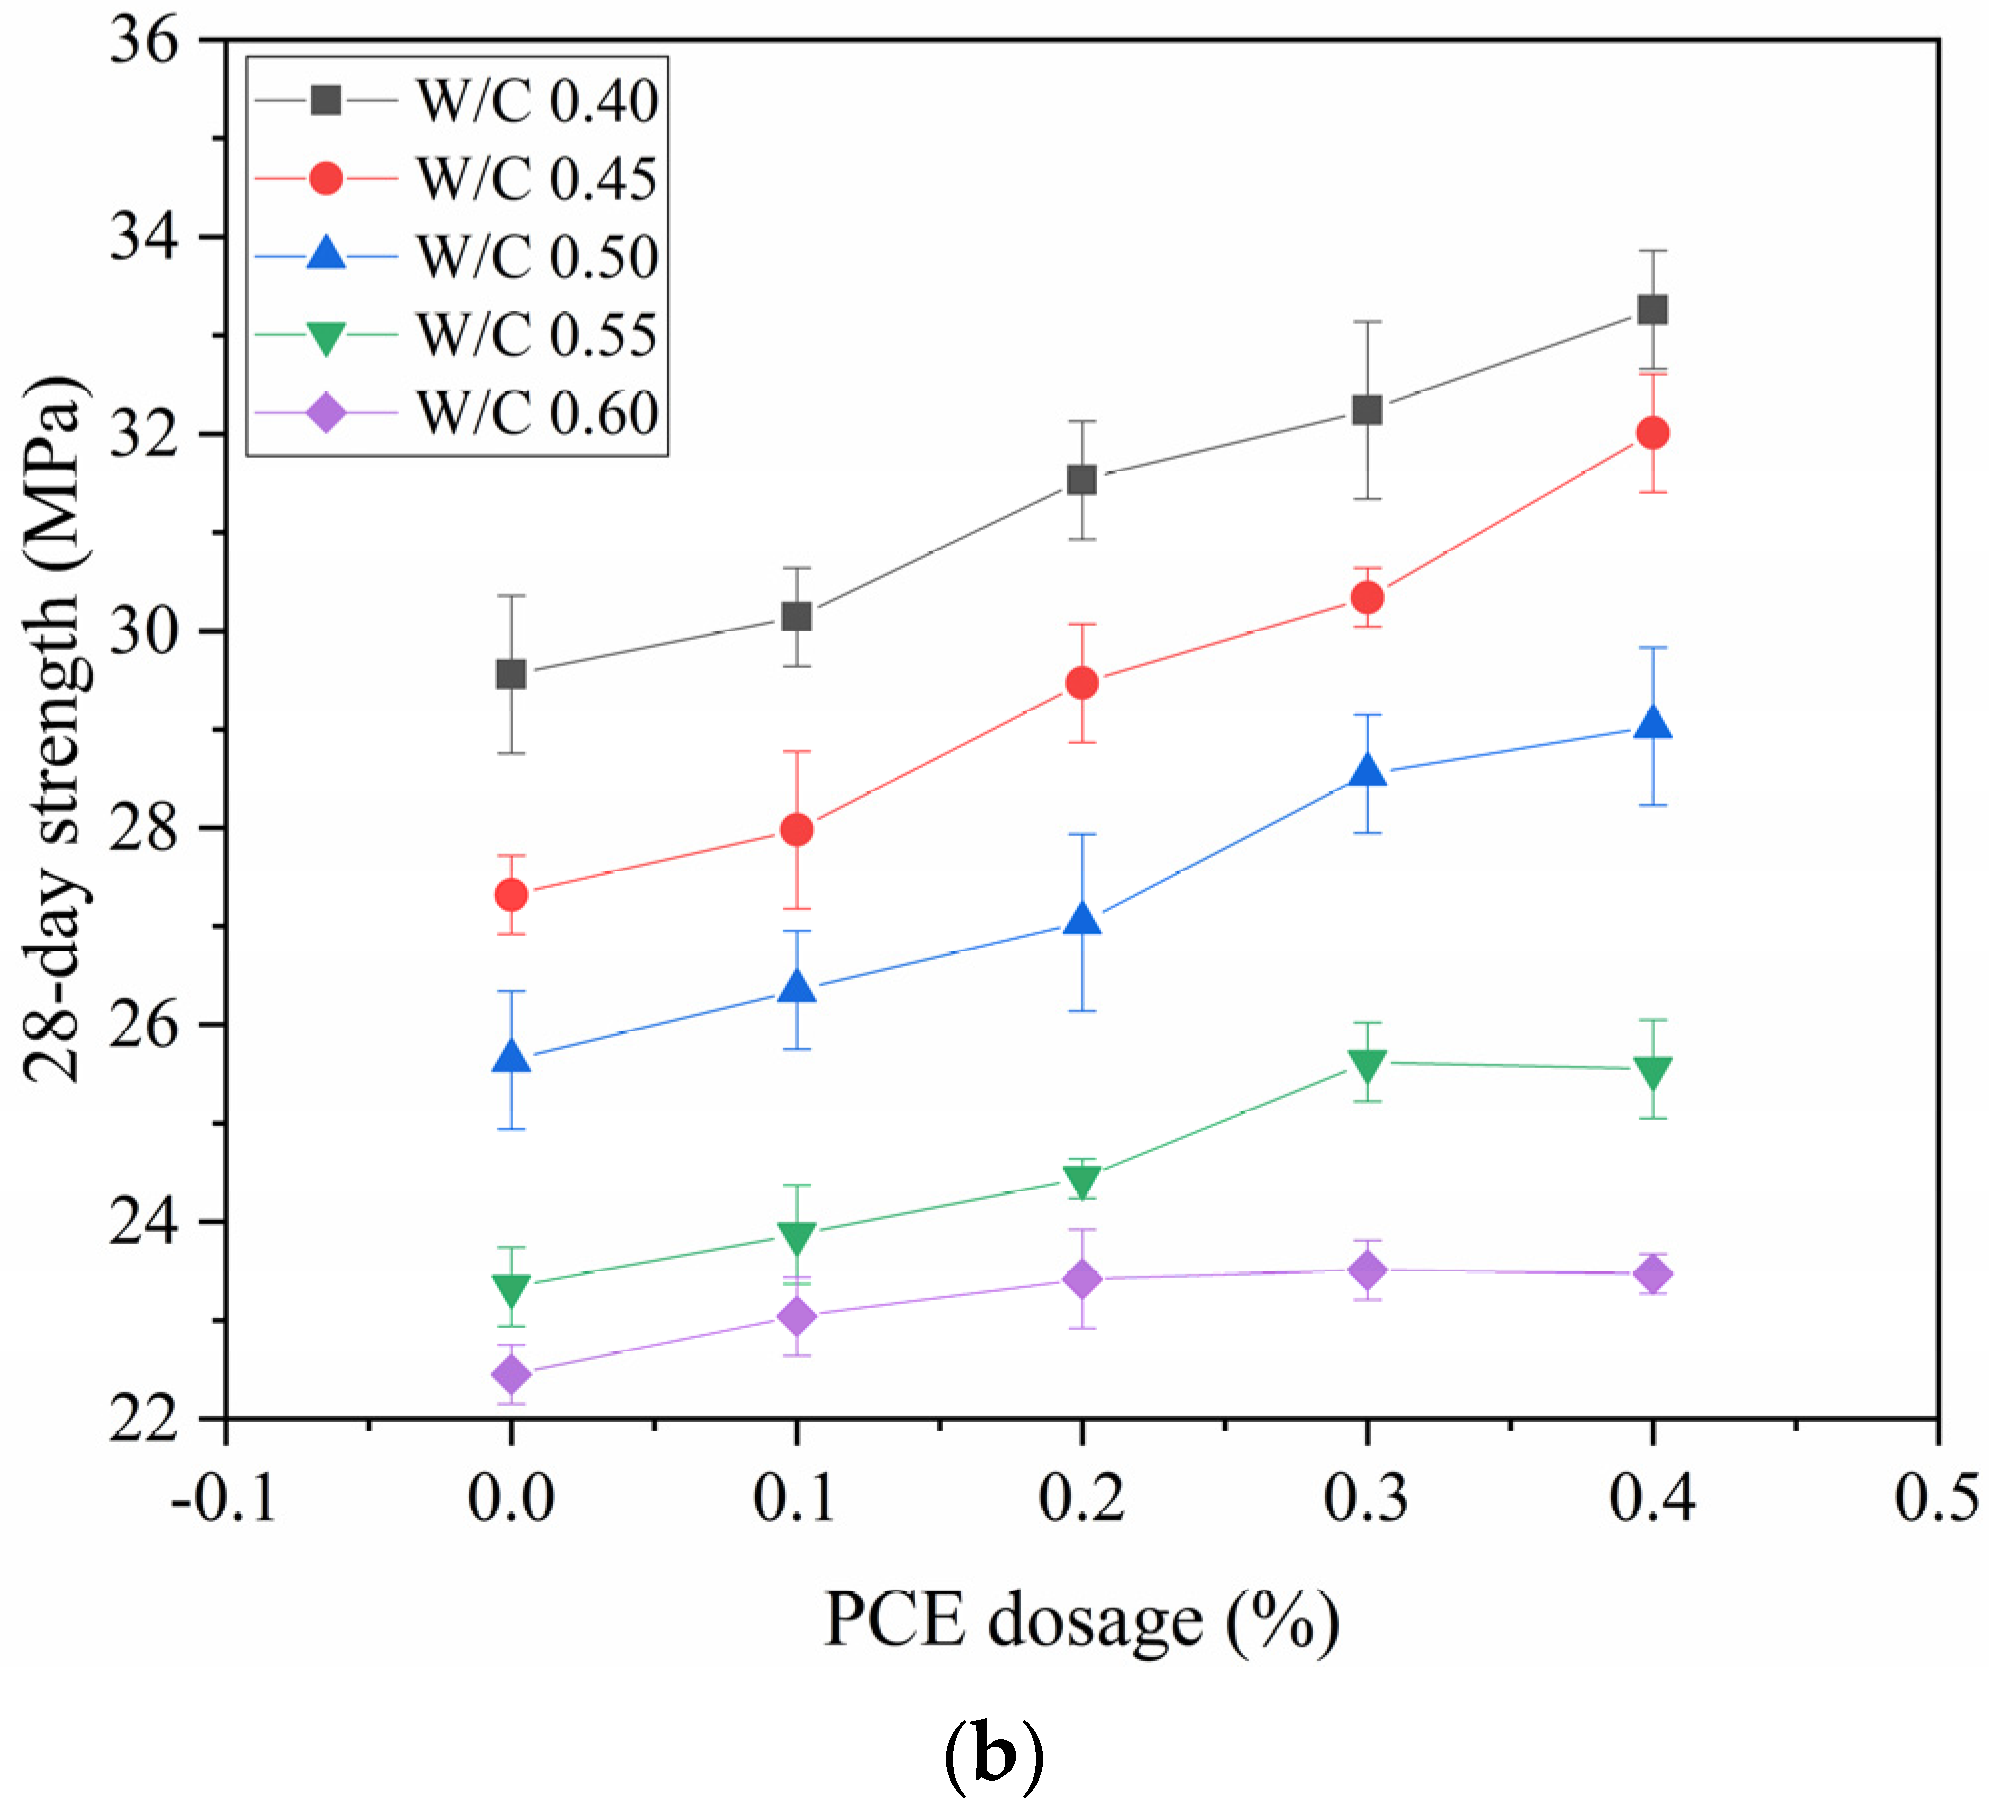
3.5. Strength
4. Roles of Water Film Thickness
4.1. Effects of WFT on Cohesiveness
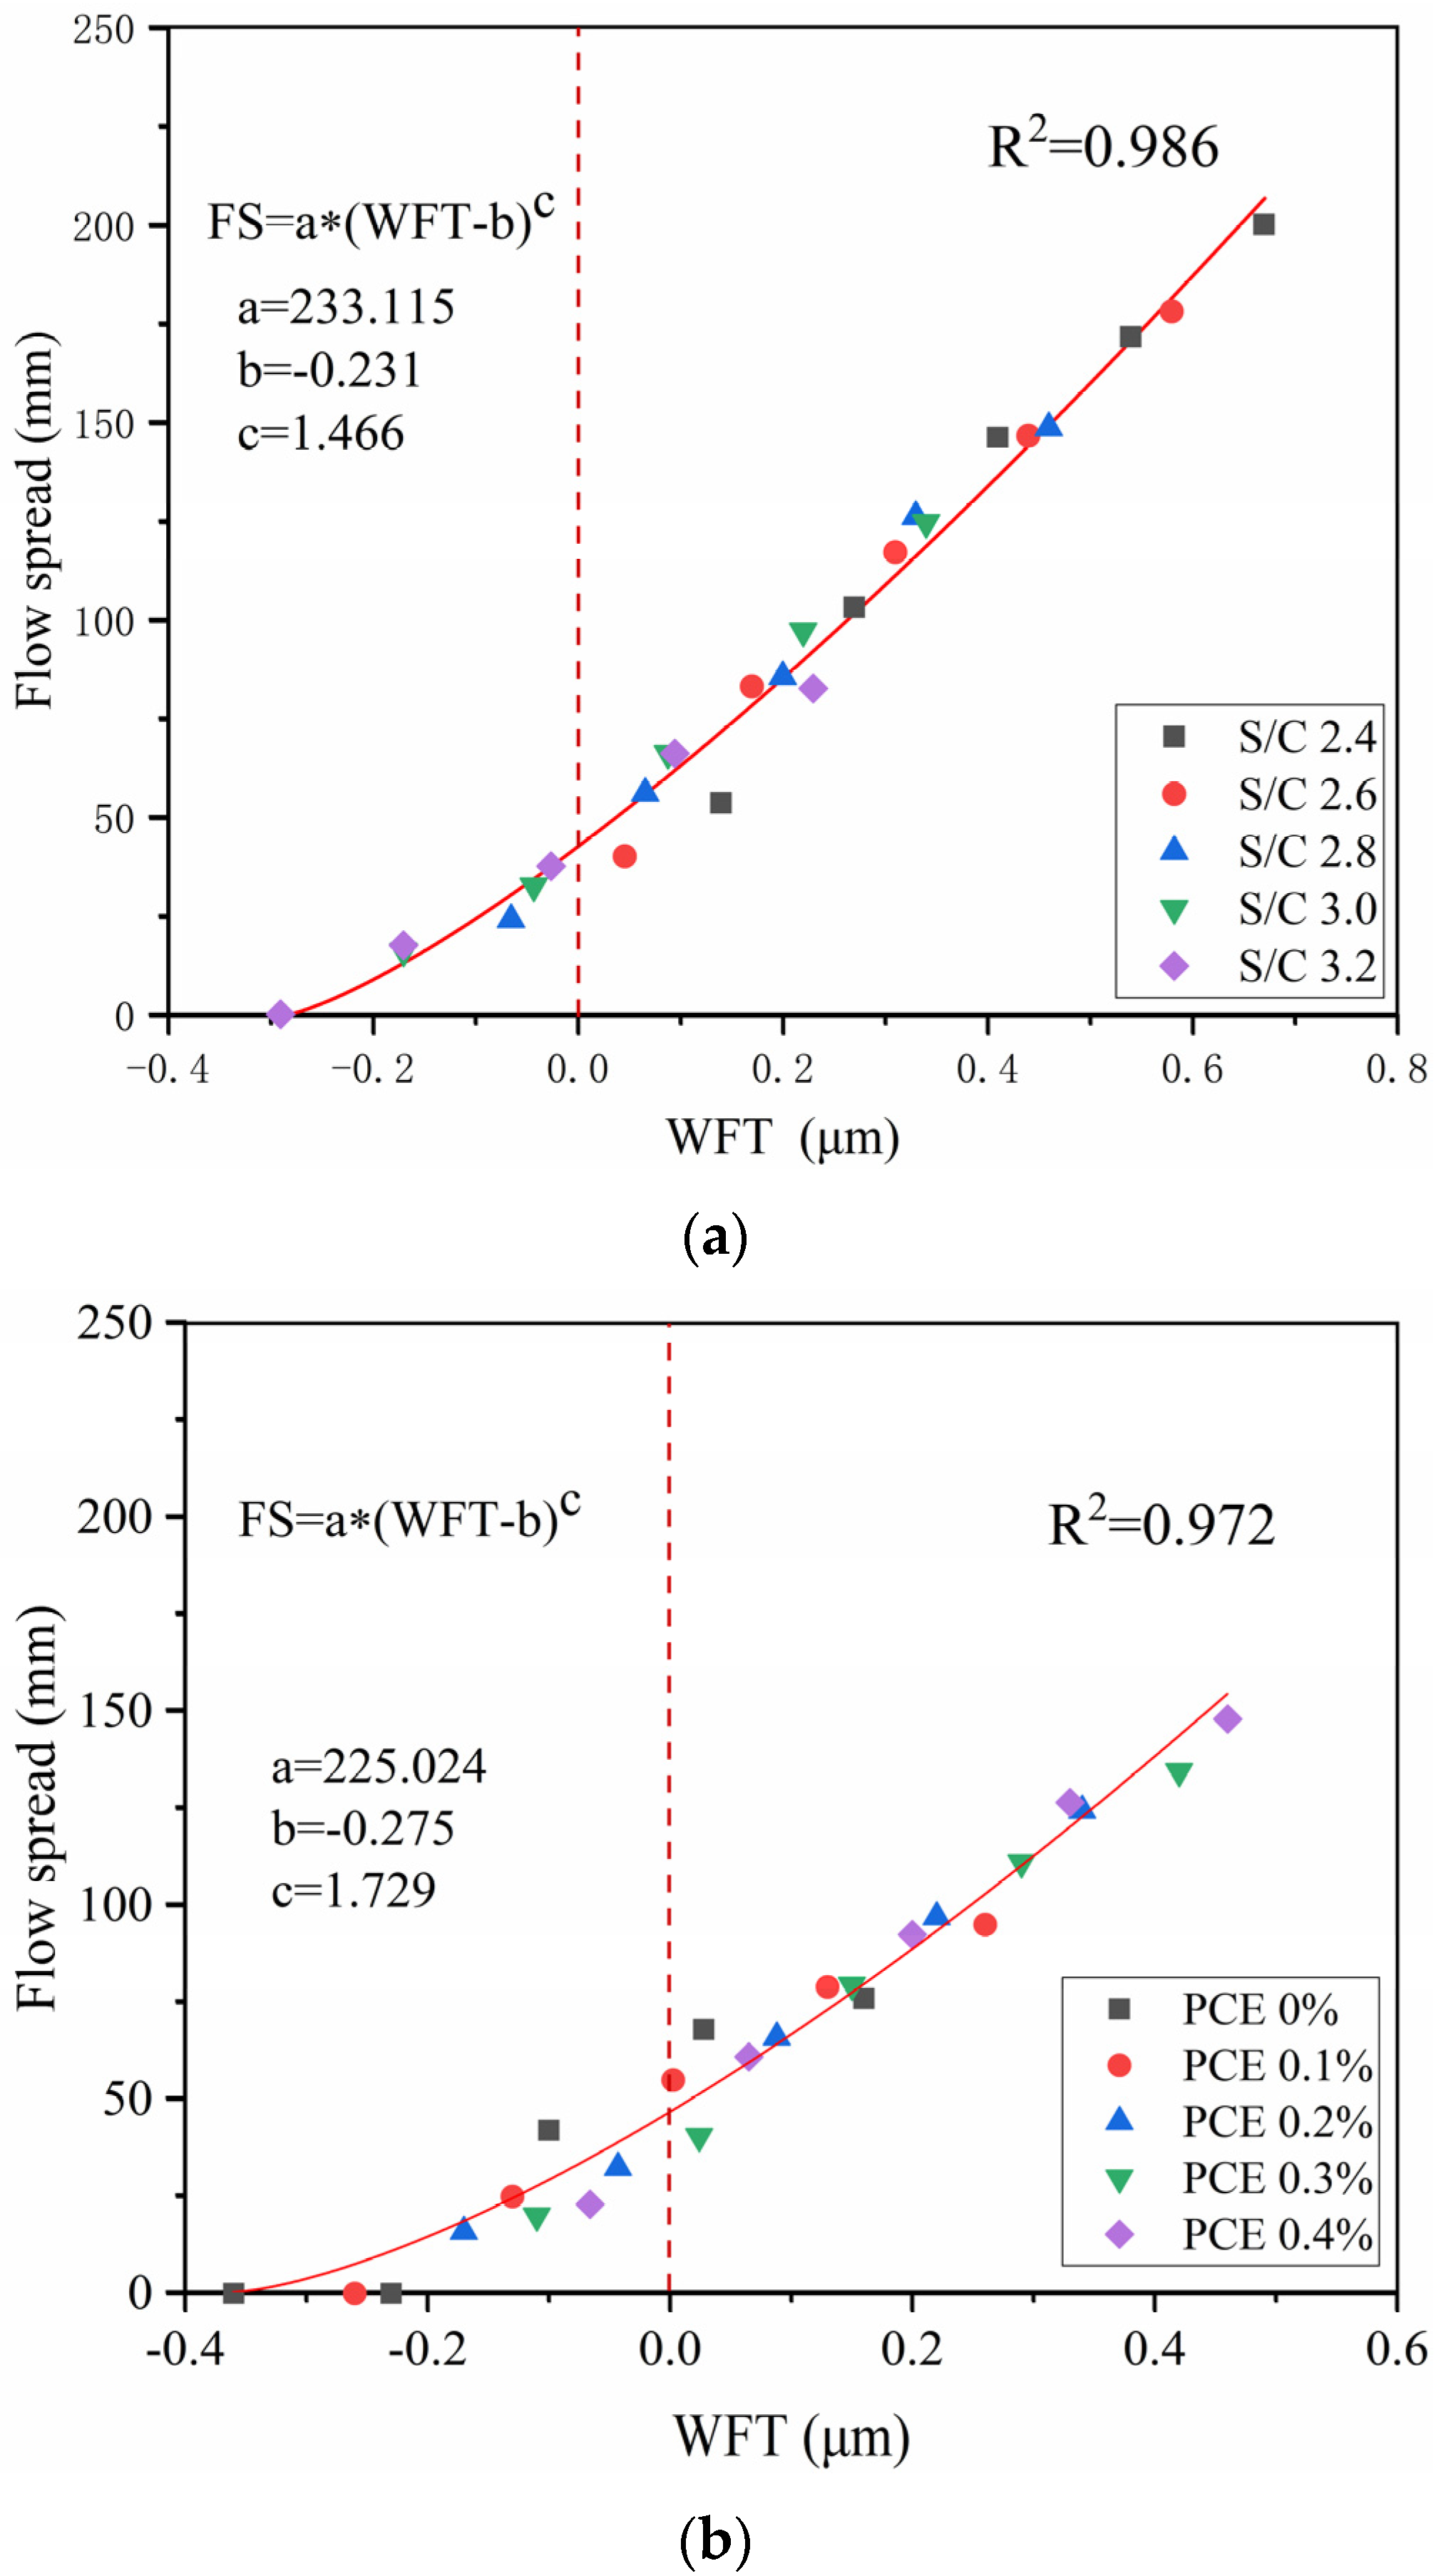
4.2. Effects of WFT on Flow Spread
5. Conclusions
- An increase in the S/C ratio will reduce the packing density of the mortar and the WFT but will also increase the cohesiveness, resulting in a decrease in the flow spread and mortar strength. The increase in the PCE dosage will increase the packing density of the mortar and the WFT but decrease the cohesiveness, leading to an increase in the flow spread of the mortar. When the W/C ratio is low, the S/C ratio has an obvious effect on strength, and the strength will increase with the increasing of the PCE dosage. When the W/C ratio is high, the PCE dosage has a saturation value. The PCE dosage exceeds the saturation value, and the strength of the mortar decreases as the PCE dosage increases.
- Different S/C ratios and PCE dosages affect the WFT, resulting in changes in the cohesiveness and flow spread of the mortar. When the WFT is positive, the effects of the S/C ratio and PCE dosage on the cohesiveness and flow spread of the mortar are more obvious. When the value of WFT is positive, the mixing ratio of the mortar is acceptable.
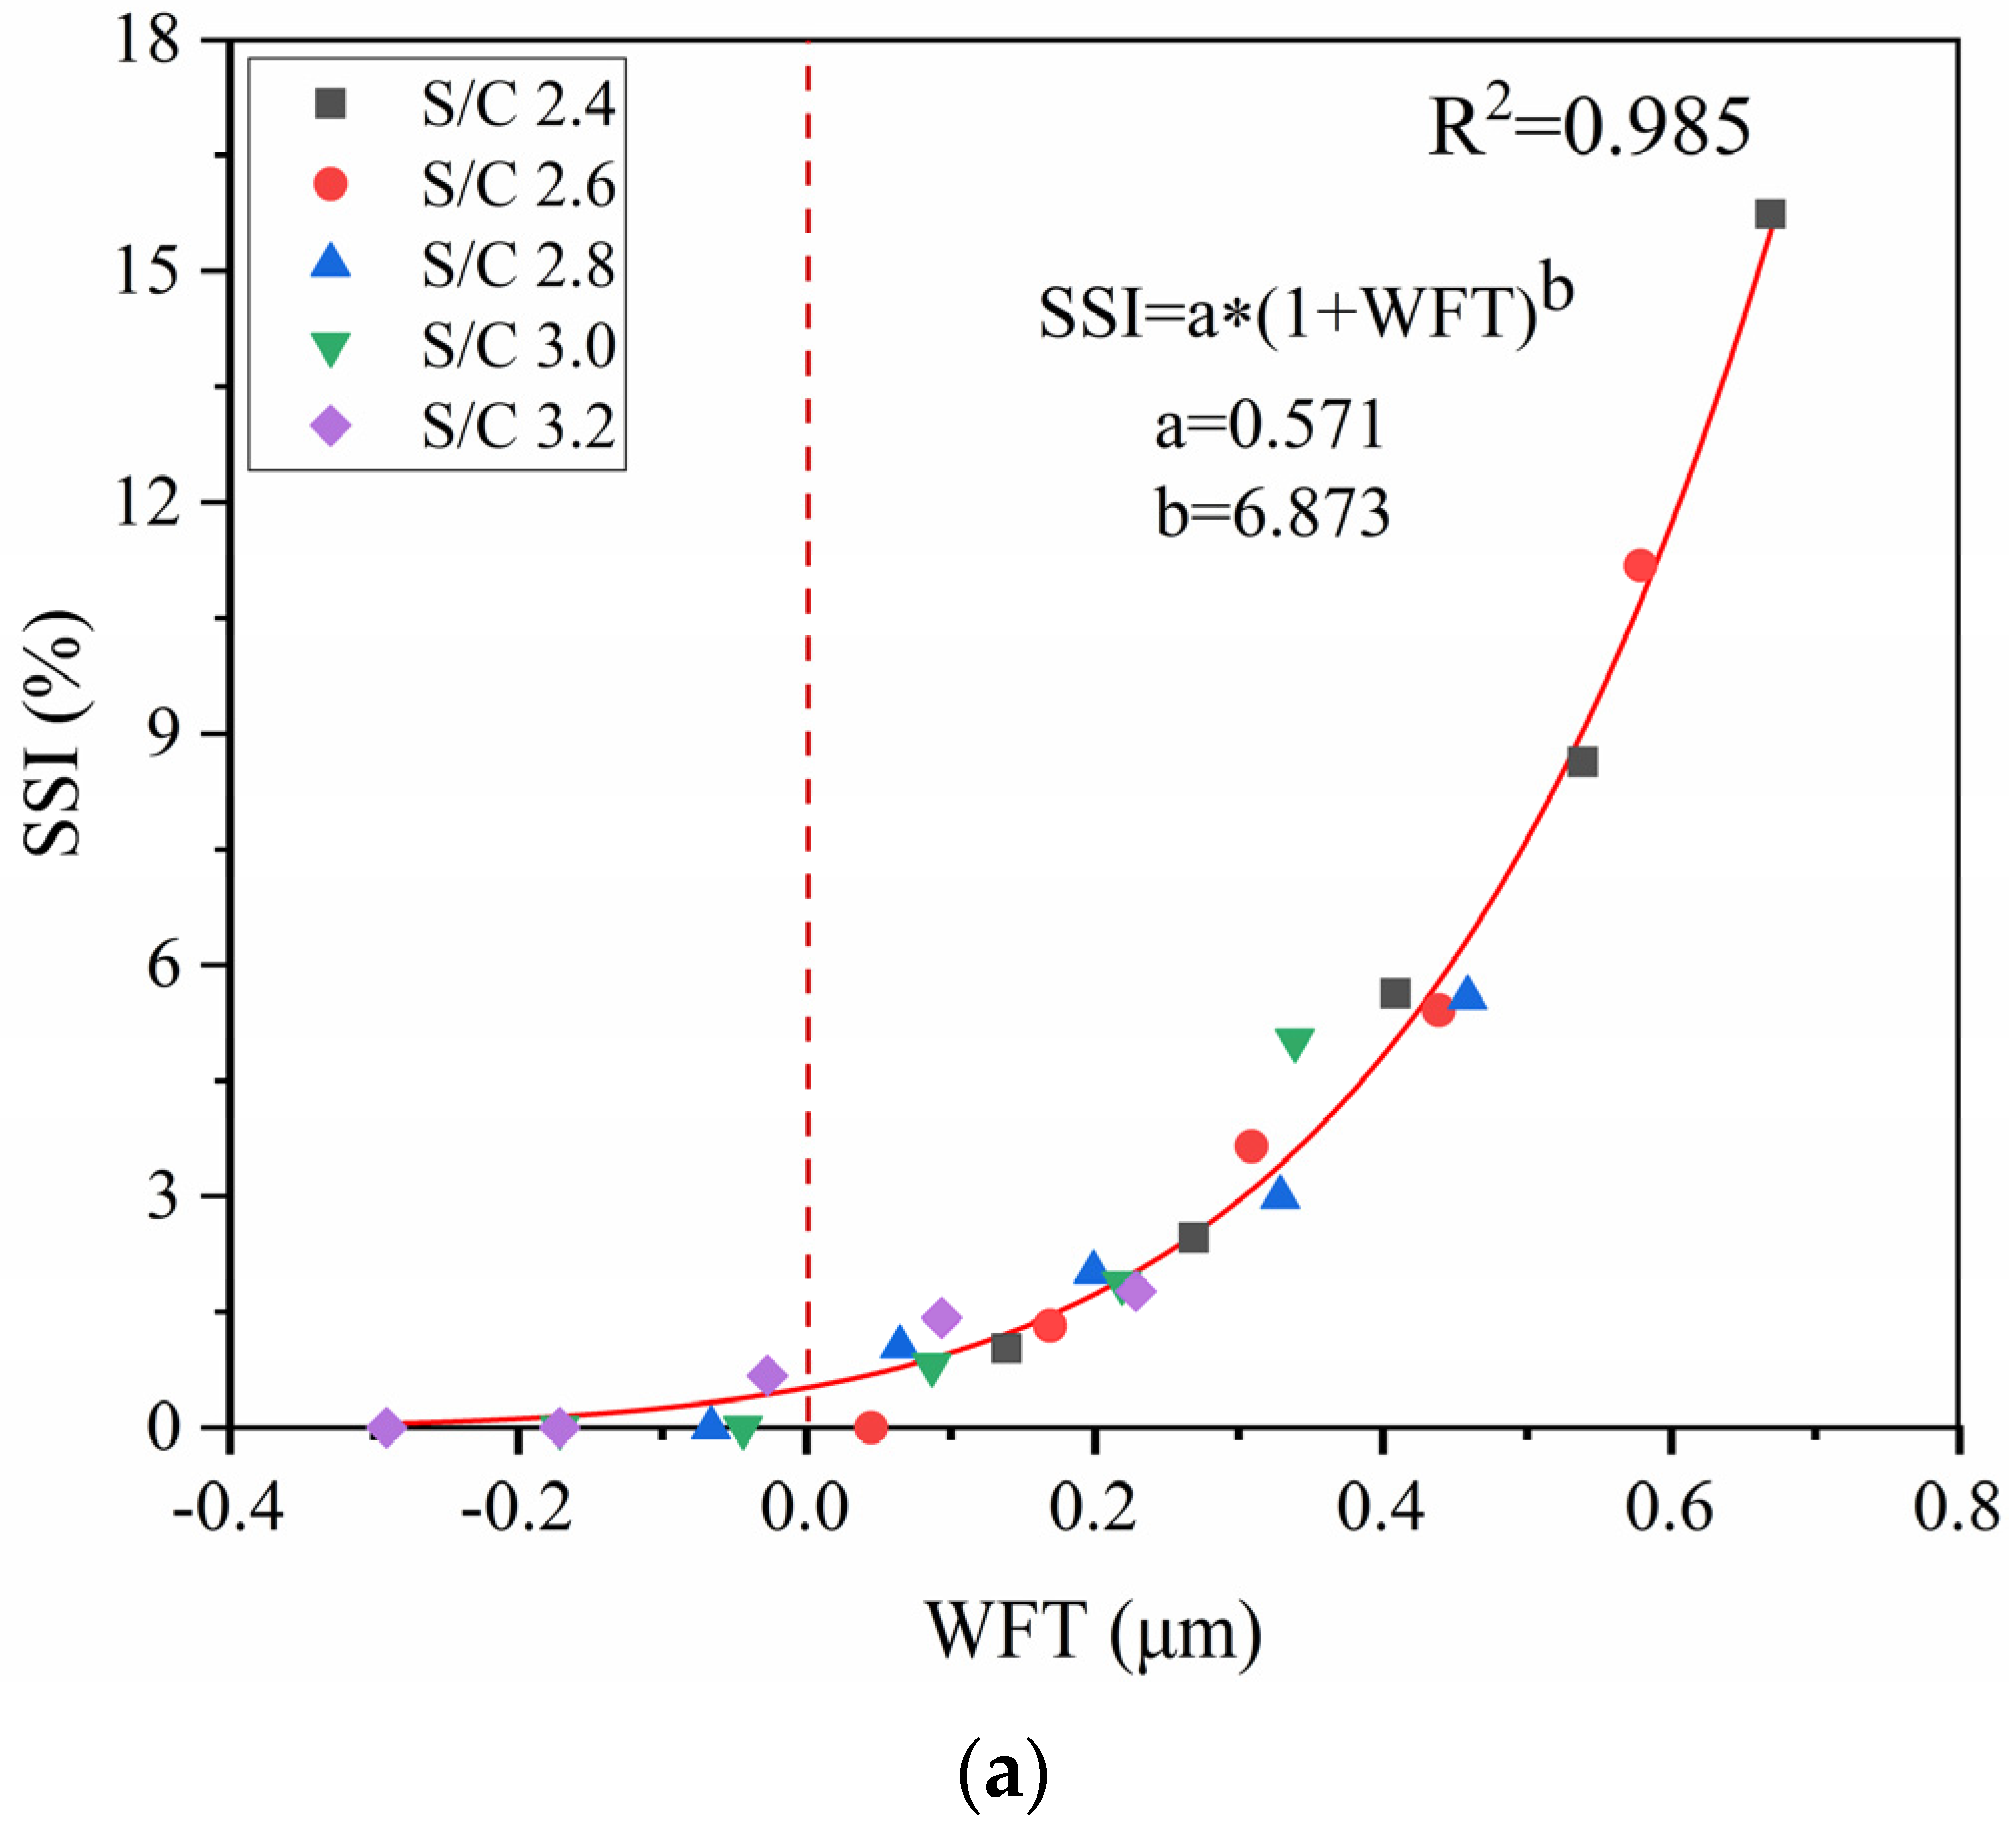
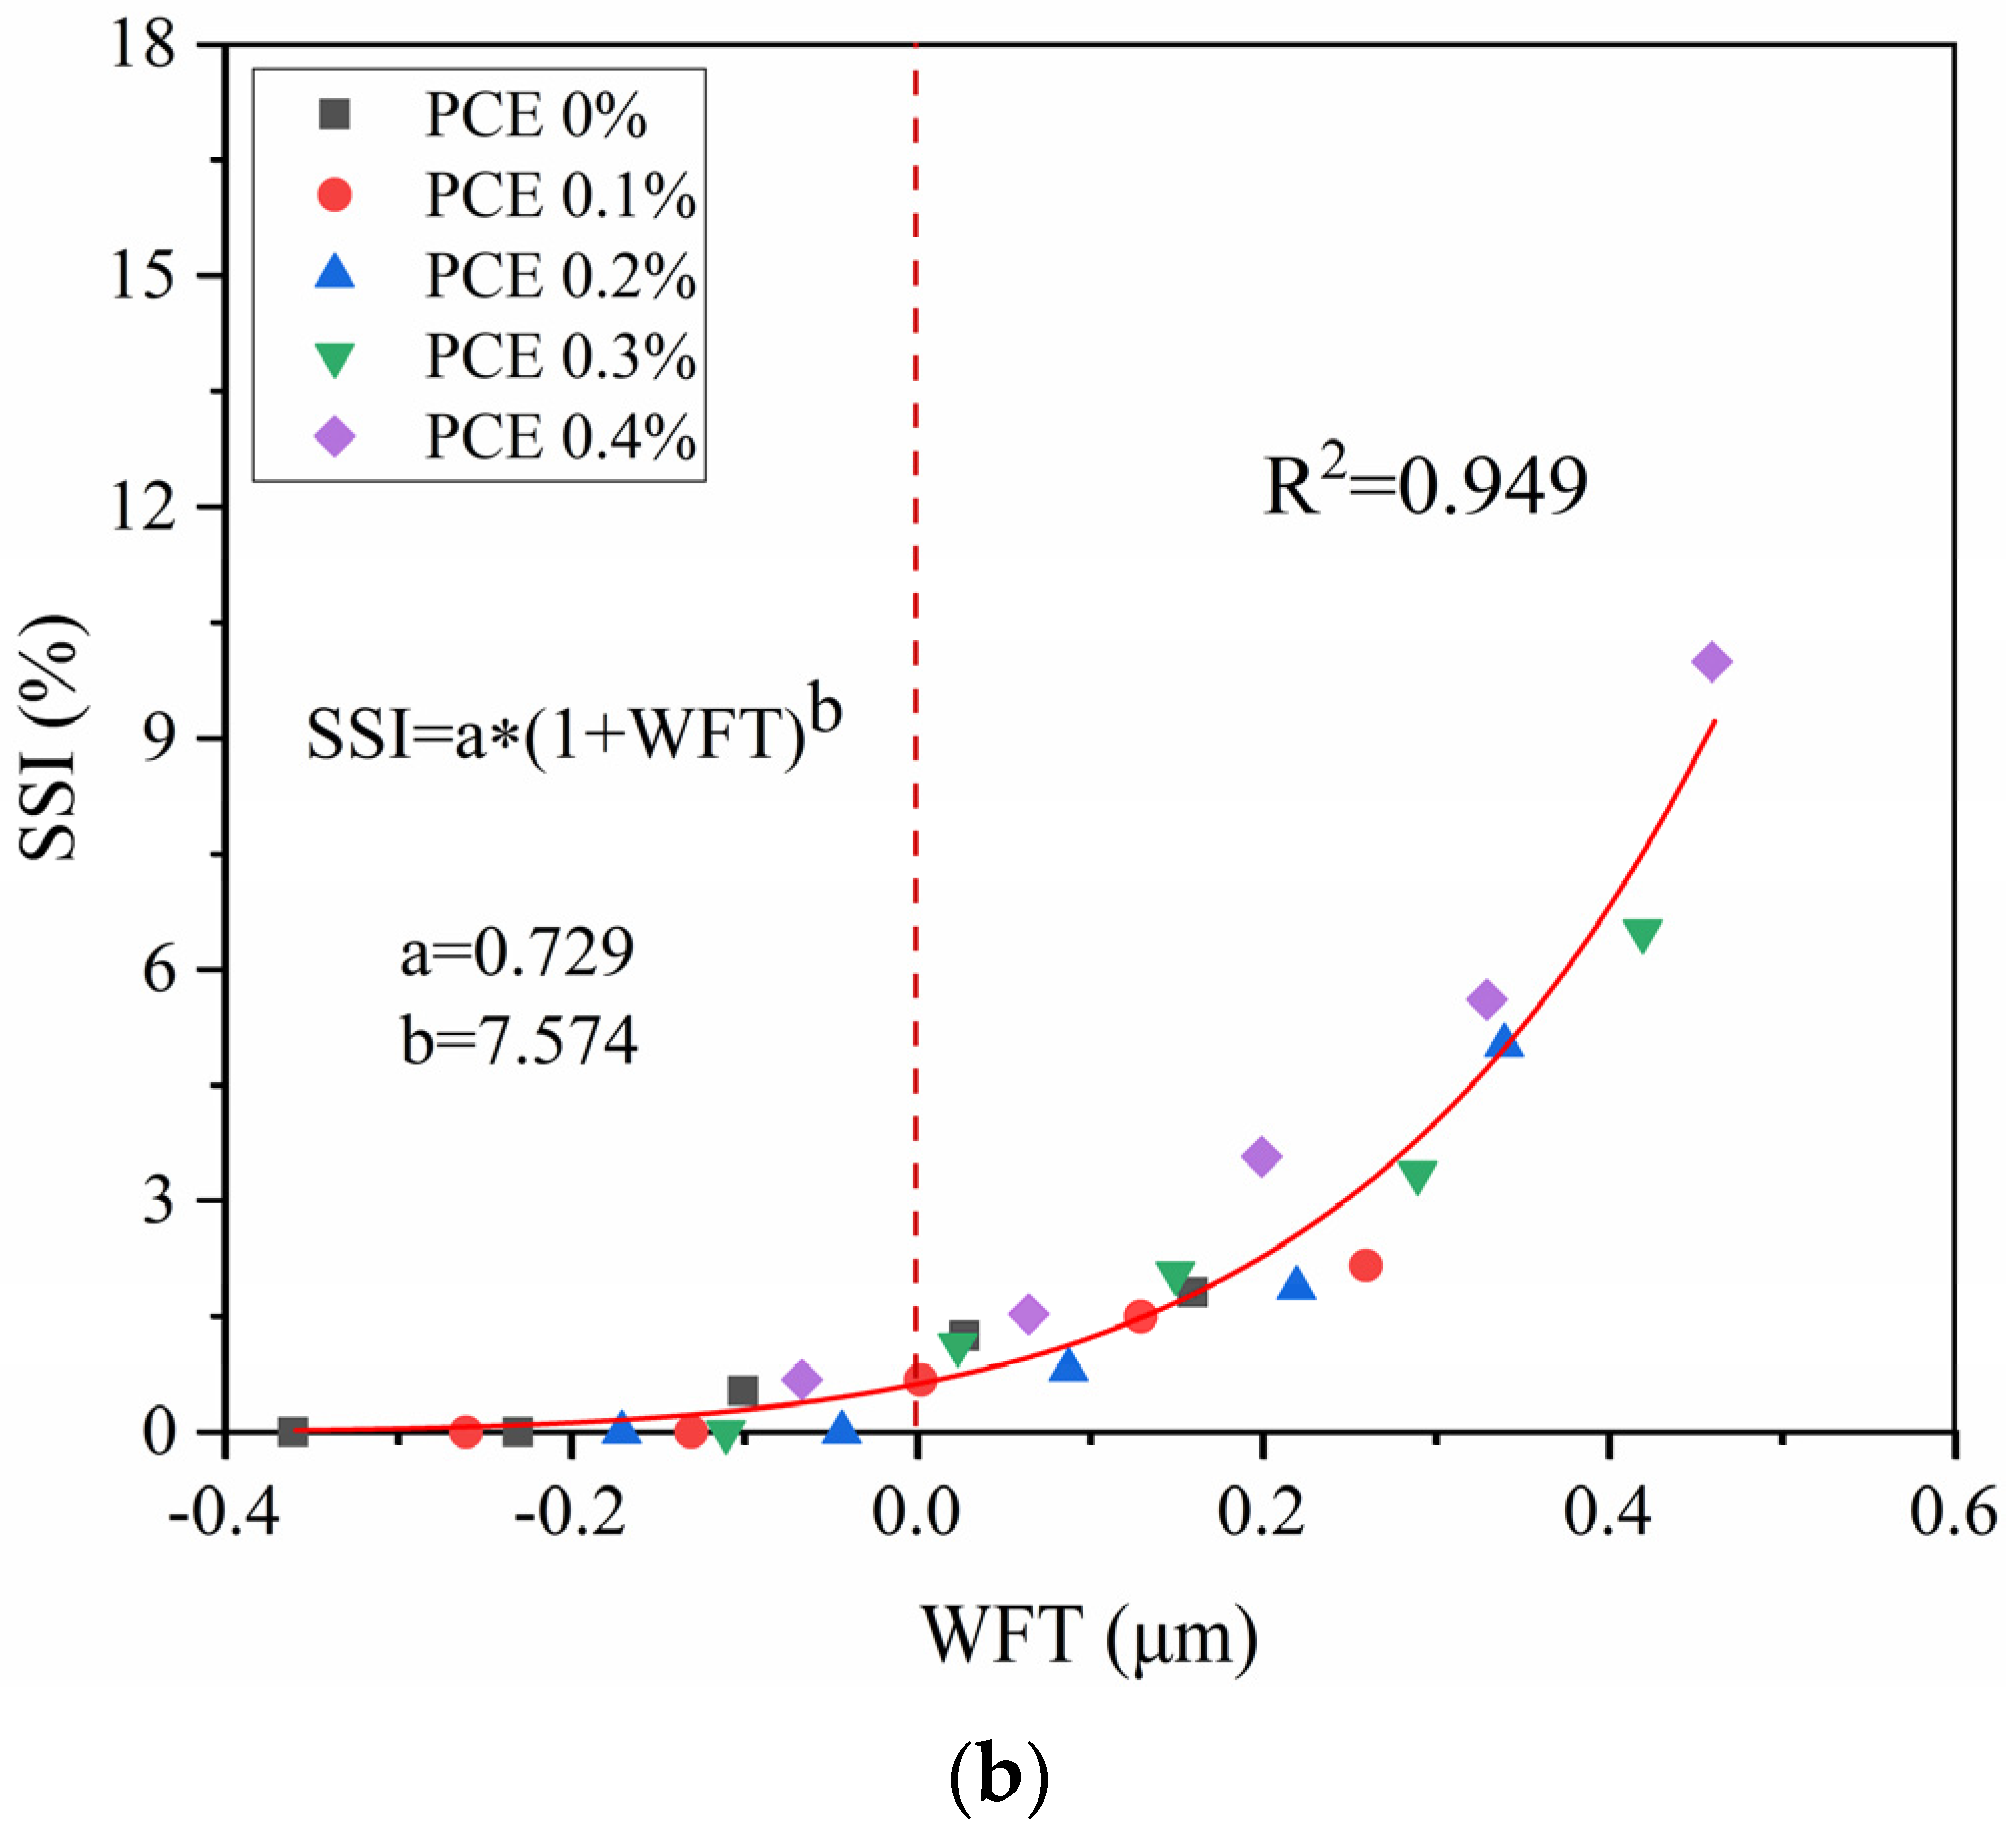
- Regardless of any changes in the S/C ratio or PCE dosage, the WFT has a good correlation with the flow spread and mortar cohesiveness. The WFT was calculated by the packing density of the mortar, which determined the cohesiveness and flow spread of the mortar. For every mortar sample, the relationship between the SSI and the WFT can be described by SSI = a × (1 + WFT)^b, and the relationship between the flow spread and the WFT can be described by FS = a × (WFT-b)^c. The cohesiveness and flow spread of the mortar can be predicted by the WFT.
Author Contributions
Funding
Institutional Review Board Statement
Informed Consent Statement
Data Availability Statement
Conflicts of Interest
References
- Kwan, A.K.H.; Li, L.G. Combined effects of water film thickness and paste film thickness on rheology of mortar. Mater. Struct. 2012, 45, 1359–1374. [Google Scholar] [CrossRef] [Green Version]
- Li, L.G.; Kwan, A.K. Concrete mix design based on water film thickness and paste film thickness. Cem. Concr. Compos. 2013, 39, 33–42. [Google Scholar] [CrossRef]
- Li, Y.; Chen, J.J.; Kwan, A.K.H. Roles of water film thickness in fresh and hardened properties of mortar. Adv. Cem. Res. 2013, 25, 171–182. [Google Scholar] [CrossRef] [Green Version]
- Qiu, J.; Guo, Z.; Yang, L.; Jiang, H.; Zhao, Y. Effects of packing density and water film thickness on the fluidity behaviour of cemented paste backfill. Powder Technol. 2020, 359, 27–35. [Google Scholar] [CrossRef]
- Rosquoët, F.; Alexis, A.; Khelidj, A.; Phelipot, A. Experimental study of cement grout: Rheological behavior and sedimentation. Cem. Concr. Res. 2003, 33, 713–722. [Google Scholar] [CrossRef] [Green Version]
- Liu, H.; Sun, X.; Du, H.; Lu, H.; Ma, Y.; Shen, W.; Tian, Z. Effects and threshold of water film thickness on multi-mineral cement paste. Cem. Concr. Compos. 2020, 112, 103677. [Google Scholar] [CrossRef]
- Li, L.; Zhao, Z.; Zhu, J.; Kwan, A.; Zeng, K. Combined effects of water film thickness and polypropylene fibre length on fresh properties of mortar. Constr. Build. Mater. 2018, 174, 586–593. [Google Scholar] [CrossRef]
- Kwan, A.K.; Li, L.G. Combined effects of water film, paste film and mortar film thicknesses on fresh properties of concrete. Constr. Build. Mater. 2014, 50, 598–608. [Google Scholar] [CrossRef]
- Zhang, R.; Panesar, D.K. New approach to calculate water film thickness and the correlation to the rheology of mortar and concrete containing reactive MgO. Constr. Build. Mater. 2017, 150, 892–902. [Google Scholar] [CrossRef]
- Yuli, W.; Hang, H.; Xiaoxing, L. Influences of aggregate micro fines on the packing of fresh mortar and the per-formances of mortar. Compos. Part B Eng. 2019, 164, 493–498. [Google Scholar] [CrossRef]
- Wu, Q.; An, X.; Liu, C. Effect of polycarboxylate-type superplasticizer on the paste fluidity based on the water film thickness of flocs. Sci. China Ser. E Technol. Sci. 2014, 57, 1522–1531. [Google Scholar] [CrossRef]
- Wong, H.H.C.; Kwan, A.K.H. Packing density of cementitious materials: Part 1—measurement using a wet pack-ing method. Mater. Struct. 2007, 41, 689–701. [Google Scholar] [CrossRef]
- Kwan, A.K.H.; Wong, H.H.C. Packing density of cementitious materials: Part 2—packing and flow of OPC + PFA + CSF. Mater. Struct. 2007, 41, 773–784. [Google Scholar] [CrossRef]
- Kang, S.H.; Kim, J.J.; Kim, D.J.; Chung, Y.-S. Effect of sand grain size and sand-to-cement ratio on the interfacial bond strength of steel fibers embedded in mortars. Constr. Build. Mater. 2013, 47, 1421–1430. [Google Scholar] [CrossRef]
- Mingli, C.; Ling, X.U.; Cong, Z. Influence of Calcium Carbonate Whisker on Rheology of Cement Mortar with Different Water–Cement Ratios and Sand–Cement Ratios. J. Chin. Ceram. Soc. 2016, 44, 246–252. [Google Scholar] [CrossRef]
- Ghasemi, Y.; Emborg, M.; Cwirzen, A. Exploring the relation between the flow of mortar and specific surface area of its constituents. Constr. Build. Mater. 2019, 211, 492–501. [Google Scholar] [CrossRef]
- Ye, H.; Gao, X.; Wang, R.; Wang, H. Relationship among particle characteristic, water film thickness and flowability of fresh paste containing different mineral admixtures. Constr. Build. Mater. 2017, 153, 193–201. [Google Scholar] [CrossRef]
- Mehdipour, I.; Khayat, K. Effect of particle-size distribution and specific surface area of different binder systems on packing density and flow characteristics of cement paste. Cem. Concr. Compos. 2017, 78, 120–131. [Google Scholar] [CrossRef]
- Huang, H.; Qian, C.; Zhao, F.; Qu, J.; Guo, J.; Danzinger, M. Improvement on microstructure of concrete by polycarboxylate superplasticizer (PCE) and its influence on durability of concrete. Constr. Build. Mater. 2016, 110, 293–299. [Google Scholar] [CrossRef]
- Ma, Y.; Bai, J.; Shi, C.; Sha, S.; Zhou, B. Effect of PCEs with different structures on hydration and properties of cementitious materials with low water-to-binder ratio. Cem. Concr. Res. 2021, 142, 106343. [Google Scholar] [CrossRef]
- Burgos-Montes, O.; Palacios, M.; Rivilla, P.; Puertas, F. Compatibility between superplasticizer admixtures and cements with mineral additions. Constr. Build. Mater. 2012, 31, 300–309. [Google Scholar] [CrossRef]
- He, Y.; Zhang, X.; Shui, L.; Wang, Y.; Gu, M.; Wang, X.; Wang, H.; Peng, L. Effects of PCEs with various carboxylic densities and functional groups on the fluidity and hydration performances of cement paste. Constr. Build. Mater. 2019, 202, 656–668. [Google Scholar] [CrossRef]
- Liebscher, M.; Lange, A.; Schröfl, C.; Fuge, R.; Mechtcherine, V.; Plank, J.; Leonhardt, A. Impact of the molecular architecture of polycarboxylate superplasticizers on the dispersion of multi-walled carbon nanotubes in aqueous phase. J. Mater. Sci. 2016, 52, 2296–2307. [Google Scholar] [CrossRef]
- Zhang, Y.; Kong, X. Correlations of the dispersing capability of NSF and PCE types of superplasticizer and their impacts on cement hydration with the adsorption in fresh cement pastes. Cem. Concr. Res. 2015, 69, 1–9. [Google Scholar] [CrossRef]
- Tian, H.; Kong, X.; Su, T.; Wang, D. Comparative study of two PCE superplasticizers with varied charge density in Portland cement and sulfoaluminate cement systems. Cem. Concr. Res. 2019, 115, 43–58. [Google Scholar] [CrossRef]
- Mehdipour, I.; Khayat, K. Effect of SCM Content and Binder Dispersion on Packing Density and Compressive Strength of Sustainable Cement Paste. ACI Mater. J. 2016, 113, 361–372. [Google Scholar] [CrossRef]
- Guo, Z.; Qiu, J.; Jiang, H.; Xing, J.; Sun, X.; Ma, Z. Flowability of ultrafine-tailings cemented paste backfill incorporating superplasticizer: Insight from water film thickness theory. Powder Technol. 2021, 381, 509–517. [Google Scholar] [CrossRef]
- Kwan, A.; Fung, W. Roles of water film thickness and SP dosage in rheology and cohesiveness of mortar. Cem. Concr. Compos. 2012, 34, 121–130. [Google Scholar] [CrossRef]
- Adjoudj, M.; Ezziane, K.; Kadri, E.H.; Soualhi, H. Study of the Rheological Behavior of Mortar with Silica Fume and Superplasticizer Admixtures According to the Water Film Thickness. KSCE J. Civ. Eng. 2017, 22, 2480–2491. [Google Scholar] [CrossRef]
- Kwan, A.; Fung, W. Effects of SP on flowability and cohesiveness of cement-sand mortar. Constr. Build. Mater. 2013, 48, 1050–1057. [Google Scholar] [CrossRef]
- Fung, W.; Kwan, A. Role of water film thickness in rheology of CSF mortar. Cem. Concr. Compos. 2010, 32, 255–264. [Google Scholar] [CrossRef]
- Kwan, A.K.H.; Wong, H.H.C. Effects of packing density, excess water and solid surface area on flowability of ce-ment paste. Adv. Cem. Res. 2008, 20, 1–11. [Google Scholar] [CrossRef] [Green Version]
- Kwan, A.; Fung, W. Packing density measurement and modelling of fine aggregate and mortar. Cem. Concr. Compos. 2009, 31, 349–357. [Google Scholar] [CrossRef]
- Li, L.G.; Zhao, Z.; Kwan, A.K.H.; Zhu, J. Roles of water film thickness and polypropylene fibre content in fresh properties of mortar. Adv. Cem. Res. 2017, 29, 71–80. [Google Scholar] [CrossRef]
- Wen, M.D.; Chen, J.J.; Ma, A.M.; Gao, Y.S. A Study of the Rheological Properties and Strength Control Factors of Zeolite Mortar. J. WuYi Univ. 2019, 33, 43–51. [Google Scholar]
- Kwan, A.K.H.; Fung, W.W.S. Effects of CSF content on rheology and cohesiveness of mortar. Mag. Concr. Res. 2011, 63, 99–110. [Google Scholar] [CrossRef] [Green Version]
- Li, C.; Yan, B.; Wang, X.; Jiang, L.Z.; Zhou, W.; Bao, Y.X. Introduction of Revision of “Determination Methods of the Liquid Degree of the Cement Glue-sand” GB T2419. Constr. Technol. 2004, 33, 64–65. [Google Scholar]
- Chen, J.J.; Ng, P.L.; Li, L.G.; Kwan, A.K.H. Use of superfine zeolite in conjunction with silica fume—Effects on rheology and strength of ce-mentitious paste. Powder Technol. 2018, 328, 75–83. [Google Scholar] [CrossRef]
- Chen, J.; Kwan, A. Superfine cement for improving packing density, rheology and strength of cement paste. Cem. Concr. Compos. 2012, 34, 1–10. [Google Scholar] [CrossRef]
- Felekoglu, B.; Türkel, S.; Baradan, B. Effect of water/cement ratio on the fresh and hardened properties of self-compacting concrete. Build. Environ. 2007, 42, 1795–1802. [Google Scholar] [CrossRef]
- Silva, A.P.; Segadães, A.M.; Pinto, D.G.; Oliveira, L.A.; Devezas, T.C. Effect of particle size distribution and calcium aluminate cement on the rheological behaviour of all-alumina refractory castables. Powder Technol. 2012, 226, 107–113. [Google Scholar] [CrossRef]
- Guo, Y.; Zhang, T.; Wei, J.; Yu, Q.; Ouyang, S. Evaluating the distance between particles in fresh cement paste based on the yield stress and particle size. Constr. Build. Mater. 2017, 142, 109–116. [Google Scholar] [CrossRef]


| Materials | Chemical Compositions/% (by Mass) | Physical Properties | |||||||
|---|---|---|---|---|---|---|---|---|---|
| CaO | SiO2 | Al2O3 | Fe2O3 | MgO | SO3 | LOI | Density/(g·cm−3) | Specific Surface Area/(m2·kg−1) | |
| RC | 63.32 | 20.58 | 5.03 | 3.38 | 2.01 | 2.06 | 1.76 | 3.15 | 347 |
| Fine aggregate | - | >96 | - | - | - | - | - | 2.51 | 9.30 |
| S/C Ratio | PCE Dosage | W/C Ratio |
|---|---|---|
| 2.4, 2.6, 2.8, 3.0, 3.2 | 0.2% | 0.40, 0.45, 0.50, 0.55, 0.60 |
| 3.0 | 0%, 0.1%, 0.2%, 0.3%, 0.4% | 0.40, 0.45, 0.50, 0.55, 0.60 |
| Mix No. | Packing Density | Water Film Thickness (μm) |
|---|---|---|
| 2.4-0.2-0.40 | 0.839 | 0.14 |
| 2.4-0.2-0.45 | 0.27 | |
| 2.4-0.2-0.50 | 0.41 | |
| 2.4-0.2-0.55 | 0.54 | |
| 2.4-0.2-0.60 | 0.67 | |
| 2.6-0.2-0.40 | 0.835 | 0.046 |
| 2.6-0.2-0.45 | 0.17 | |
| 2.6-0.2-0.50 | 0.31 | |
| 2.6-0.2-0.55 | 0.44 | |
| 2.6-0.2-0.60 | 0.58 | |
| 2.8-0.2-0.40 | 0.829 | −0.065 |
| 2.8-0.2-0.45 | 0.066 | |
| 2.8-0.2-0.50 | 0.20 | |
| 2.8-0.2-0.55 | 0.33 | |
| 2.8-0.2-0.60 | 0.46 | |
| 3.0-0.2-0.40 | 0.824 | −0.17 |
| 3.0-0.2-0.45 | −0.043 | |
| 3.0-0.2-0.50 | 0.088 | |
| 3.0-0.2-0.55 | 0.22 | |
| 3.0-0.2-0.60 | 0.34 | |
| 3.2-0.2-0.40 | 0.818 | −0.29 |
| 3.2-0.2-0.45 | −0.17 | |
| 3.2-0.2-0.50 | −0.026 | |
| 3.2-0.2-0.55 | 0.095 | |
| 3.2-0.2-0.60 | 0.23 | |
| 3.0-0-0.40 | 0.802 | −0.36 |
| 3.0-0-0.45 | −0.23 | |
| 3.0-0-0.50 | −0.10 | |
| 3.0-0-0.55 | 0.028 | |
| 3.0-0-0.60 | 0.16 | |
| 3.0-0.1-0.40 | 0.814 | −0.26 |
| 3.0-0.1-0.45 | −0.13 | |
| 3.0-0.1-0.50 | 0.0026 | |
| 3.0-0.1-0.55 | 0.13 | |
| 3.0-0.1-0.60 | 0.26 | |
| 3.0-0.3-0.40 | 0.832 | −0.11 |
| 3.0-0.3-0.45 | 0.024 | |
| 3.0-0.3-0.50 | 0.15 | |
| 3.0-0.3-0.55 | 0.29 | |
| 3.0-0.3-0.60 | 0.42 | |
| 3.0-0.4-0.40 | 0.837 | −0.066 |
| 3.0-0.4-0.45 | 0.065 | |
| 3.0-0.4-0.50 | 0.20 | |
| 3.0-0.4-0.55 | 0.33 | |
| 3.0-0.4-0.60 | 0.46 |
| S/C Ratio | PCE Dosage | a | b | The Critical Value of the W/C Ratio |
|---|---|---|---|---|
| 2.4 | 0.2% | 2.68 | −0.91 | 0.34 |
| 2.6 | 0.2% | 2.70 | −1.02 | 0.38 |
| 2.8 | 0.2% | 2.64 | −1.12 | 0.42 |
| 3.0 | 0.2% | 2.59 | −1.19 | 0.46 |
| 3.2 | 0.2% | 2.65 | −1.35 | 0.51 |
| 3.0 | 0% | 2.61 | −1.40 | 0.54 |
| 3.0 | 0.1% | 2.61 | −1.30 | 0.50 |
| 3.0 | 0.3% | 2.69 | −1.17 | 0.43 |
| 3.0 | 0.4% | 2.65 | −1.12 | 0.42 |
Publisher’s Note: MDPI stays neutral with regard to jurisdictional claims in published maps and institutional affiliations. |
© 2021 by the authors. Licensee MDPI, Basel, Switzerland. This article is an open access article distributed under the terms and conditions of the Creative Commons Attribution (CC BY) license (https://creativecommons.org/licenses/by/4.0/).
Share and Cite
Zhang, Z.; Feng, Q.; Zhu, W.; Lin, X.; Chen, K.; Yin, W.; Lu, C. Influence of Sand-Cement Ratio and Polycarboxylate Superplasticizer on the Basic Properties of Mortar Based on Water Film Thickness. Materials 2021, 14, 4850. https://0-doi-org.brum.beds.ac.uk/10.3390/ma14174850
Zhang Z, Feng Q, Zhu W, Lin X, Chen K, Yin W, Lu C. Influence of Sand-Cement Ratio and Polycarboxylate Superplasticizer on the Basic Properties of Mortar Based on Water Film Thickness. Materials. 2021; 14(17):4850. https://0-doi-org.brum.beds.ac.uk/10.3390/ma14174850
Chicago/Turabian StyleZhang, Zhao, Qingge Feng, Weiwei Zhu, Xianhao Lin, Kao Chen, Wuxiao Yin, and Changhai Lu. 2021. "Influence of Sand-Cement Ratio and Polycarboxylate Superplasticizer on the Basic Properties of Mortar Based on Water Film Thickness" Materials 14, no. 17: 4850. https://0-doi-org.brum.beds.ac.uk/10.3390/ma14174850