
Experimental Investigation of the Phase Relations in the Fe-Zr-Y Ternary System

School of Material Science and Engineering, Central South University, Changsha 410083, China
*
Author to whom correspondence should be addressed.
Materials 2022, 15(2), 593; https://0-doi-org.brum.beds.ac.uk/10.3390/ma15020593
Submission received: 15 December 2021
/
Revised: 5 January 2022
/
Accepted: 11 January 2022
/
Published: 13 January 2022
(This article belongs to the Special Issue Phase Structure and Functional Properties of Materials)
Abstract
:The phase relations of the Fe-Zr-Y system at 973 K and 1073 K were experimentally investigated by using the equilibrated alloys. New ternary compounds τ3-Fe3ZrY and τ4-Fe10Zr5Y2 were found in this ternary system. The solubility of Y in Fe2Zr was measured to be 3.5 at.% and the third component can hardly dissolve in the other binary intermetallic phases. Experiments have verified that Fe2.9Zr0.5Y0.5 has a solid solubility ranging from Fe73Zr12Y14 to Fe77Zr9Y13.
1. Introduction
Due to the use of nuclear fusion and the third-generation nuclear fission reactors, zirconium-based alloys have been widely studied as important nuclear cladding materials [1,2,3,4,5]. This relies on their specific characteristics: excellent corrosion resistance, good mechanical properties, high resistance to radiation damage and a low cross section of capture for thermal neutrons [6]. The Fe-Zr-Y system is an important member of the zirconium-based nuclear cladding materials, the high temperature resistance and radiation resistance of which can be greatly improved after oxidation [7,8,9,10,11]. Although the Fe-Zr-Y system has excellent prospects, there are still some problems that limit its applications in industry. For example, when the temperature of a nuclear reactor core continuously rises, the Fe-Zr-Y system may be at risk of being unstable [12].
An efficient and effective solution to this problem is to obtain a comprehensive and profound understanding on phases of different components and rule out the phases that are unstable at high temperatures in advance. which is of vital importance for the applications of the Fe-Zr-Y system [13]. The purpose of this work is to explore the phase diagram of the Fe-Zr-Y system at high temperature in order to intuitively express the relationship between phases under the thermodynamic equilibrium state so as to provide a basic theoretical guide for the research, development, and design of new materials.
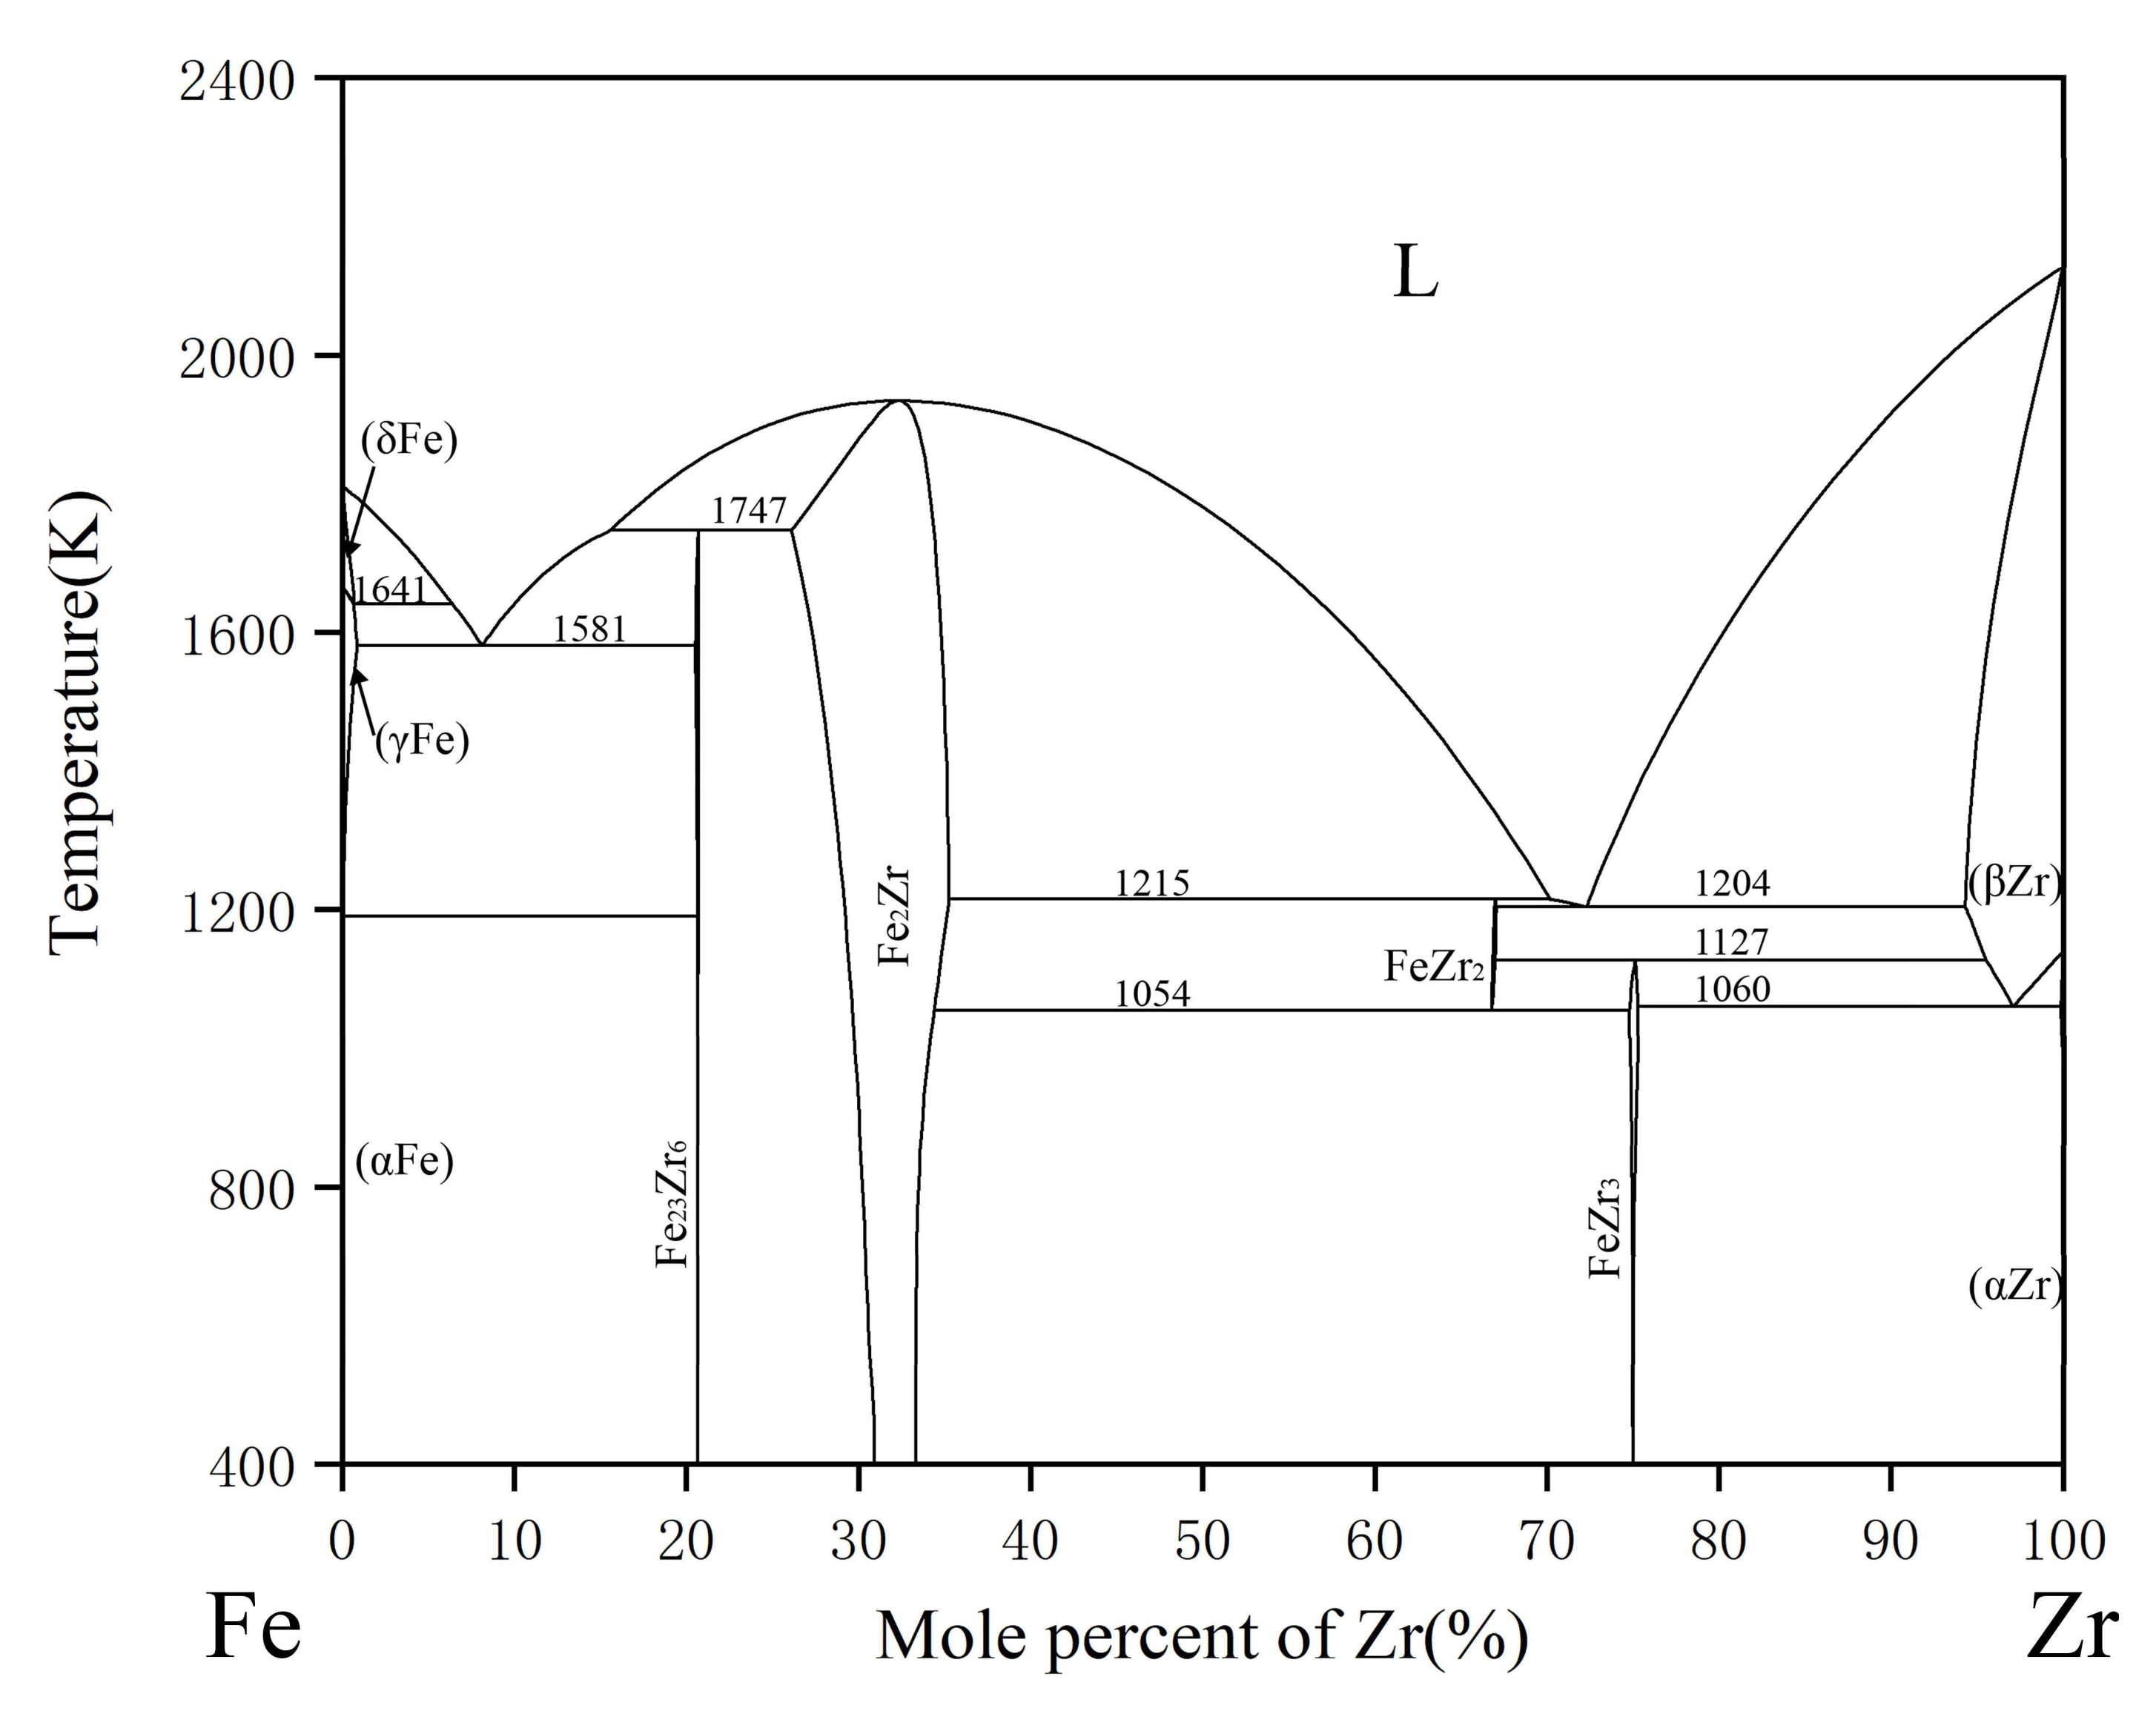
The experimental investigations on the phase relations of the Fe-Zr-Y system [14,15,16,17,18,19,20] have been carried out, and several assessments of thermodynamic data have been obtained [21,22,23,24,25,26]. Although there are some controversies about the stability of hex-Fe2Zr and Fe23Zr6, it is widely accepted that both of the two phases exist [3]. According to the results of X-ray and magnetic measurements, Kai et al. [27] confirmed the presence of hexagonal Fe2Zr, which had the same structure of MgNi2. Subsequently, Stein et al. [28] found the Fe2Zr phase of C36-type structure through heat treatment at 1563 K. Meanwhile, Liu et al. [16] confirmed the existence of Fe23Zr6 by using a transmission electron microscope (TEM) and a scanning transmission electron microscope (STEM). Recently, Yang et al. [29] and Lu et al. [30] applied first-principles calculations to evaluate the formation enthalpy of compounds in Fe-Zr system, in which Fe23Zr6 was considered as a stable phase. After a thorough survey and thermodynamic evaluations based on a number of experiments, the binary phase diagrams reported by Lu et al. [30] were finally adopted in this work. As shown in Figure 1, among the four intermetallic phases, only Fe2Zr phase has an obvious homogeneity range. In other phases, FeZr2 appears in the temperature range of 1215–1054 K, and FeZr3 is formed through peritectoid reaction.
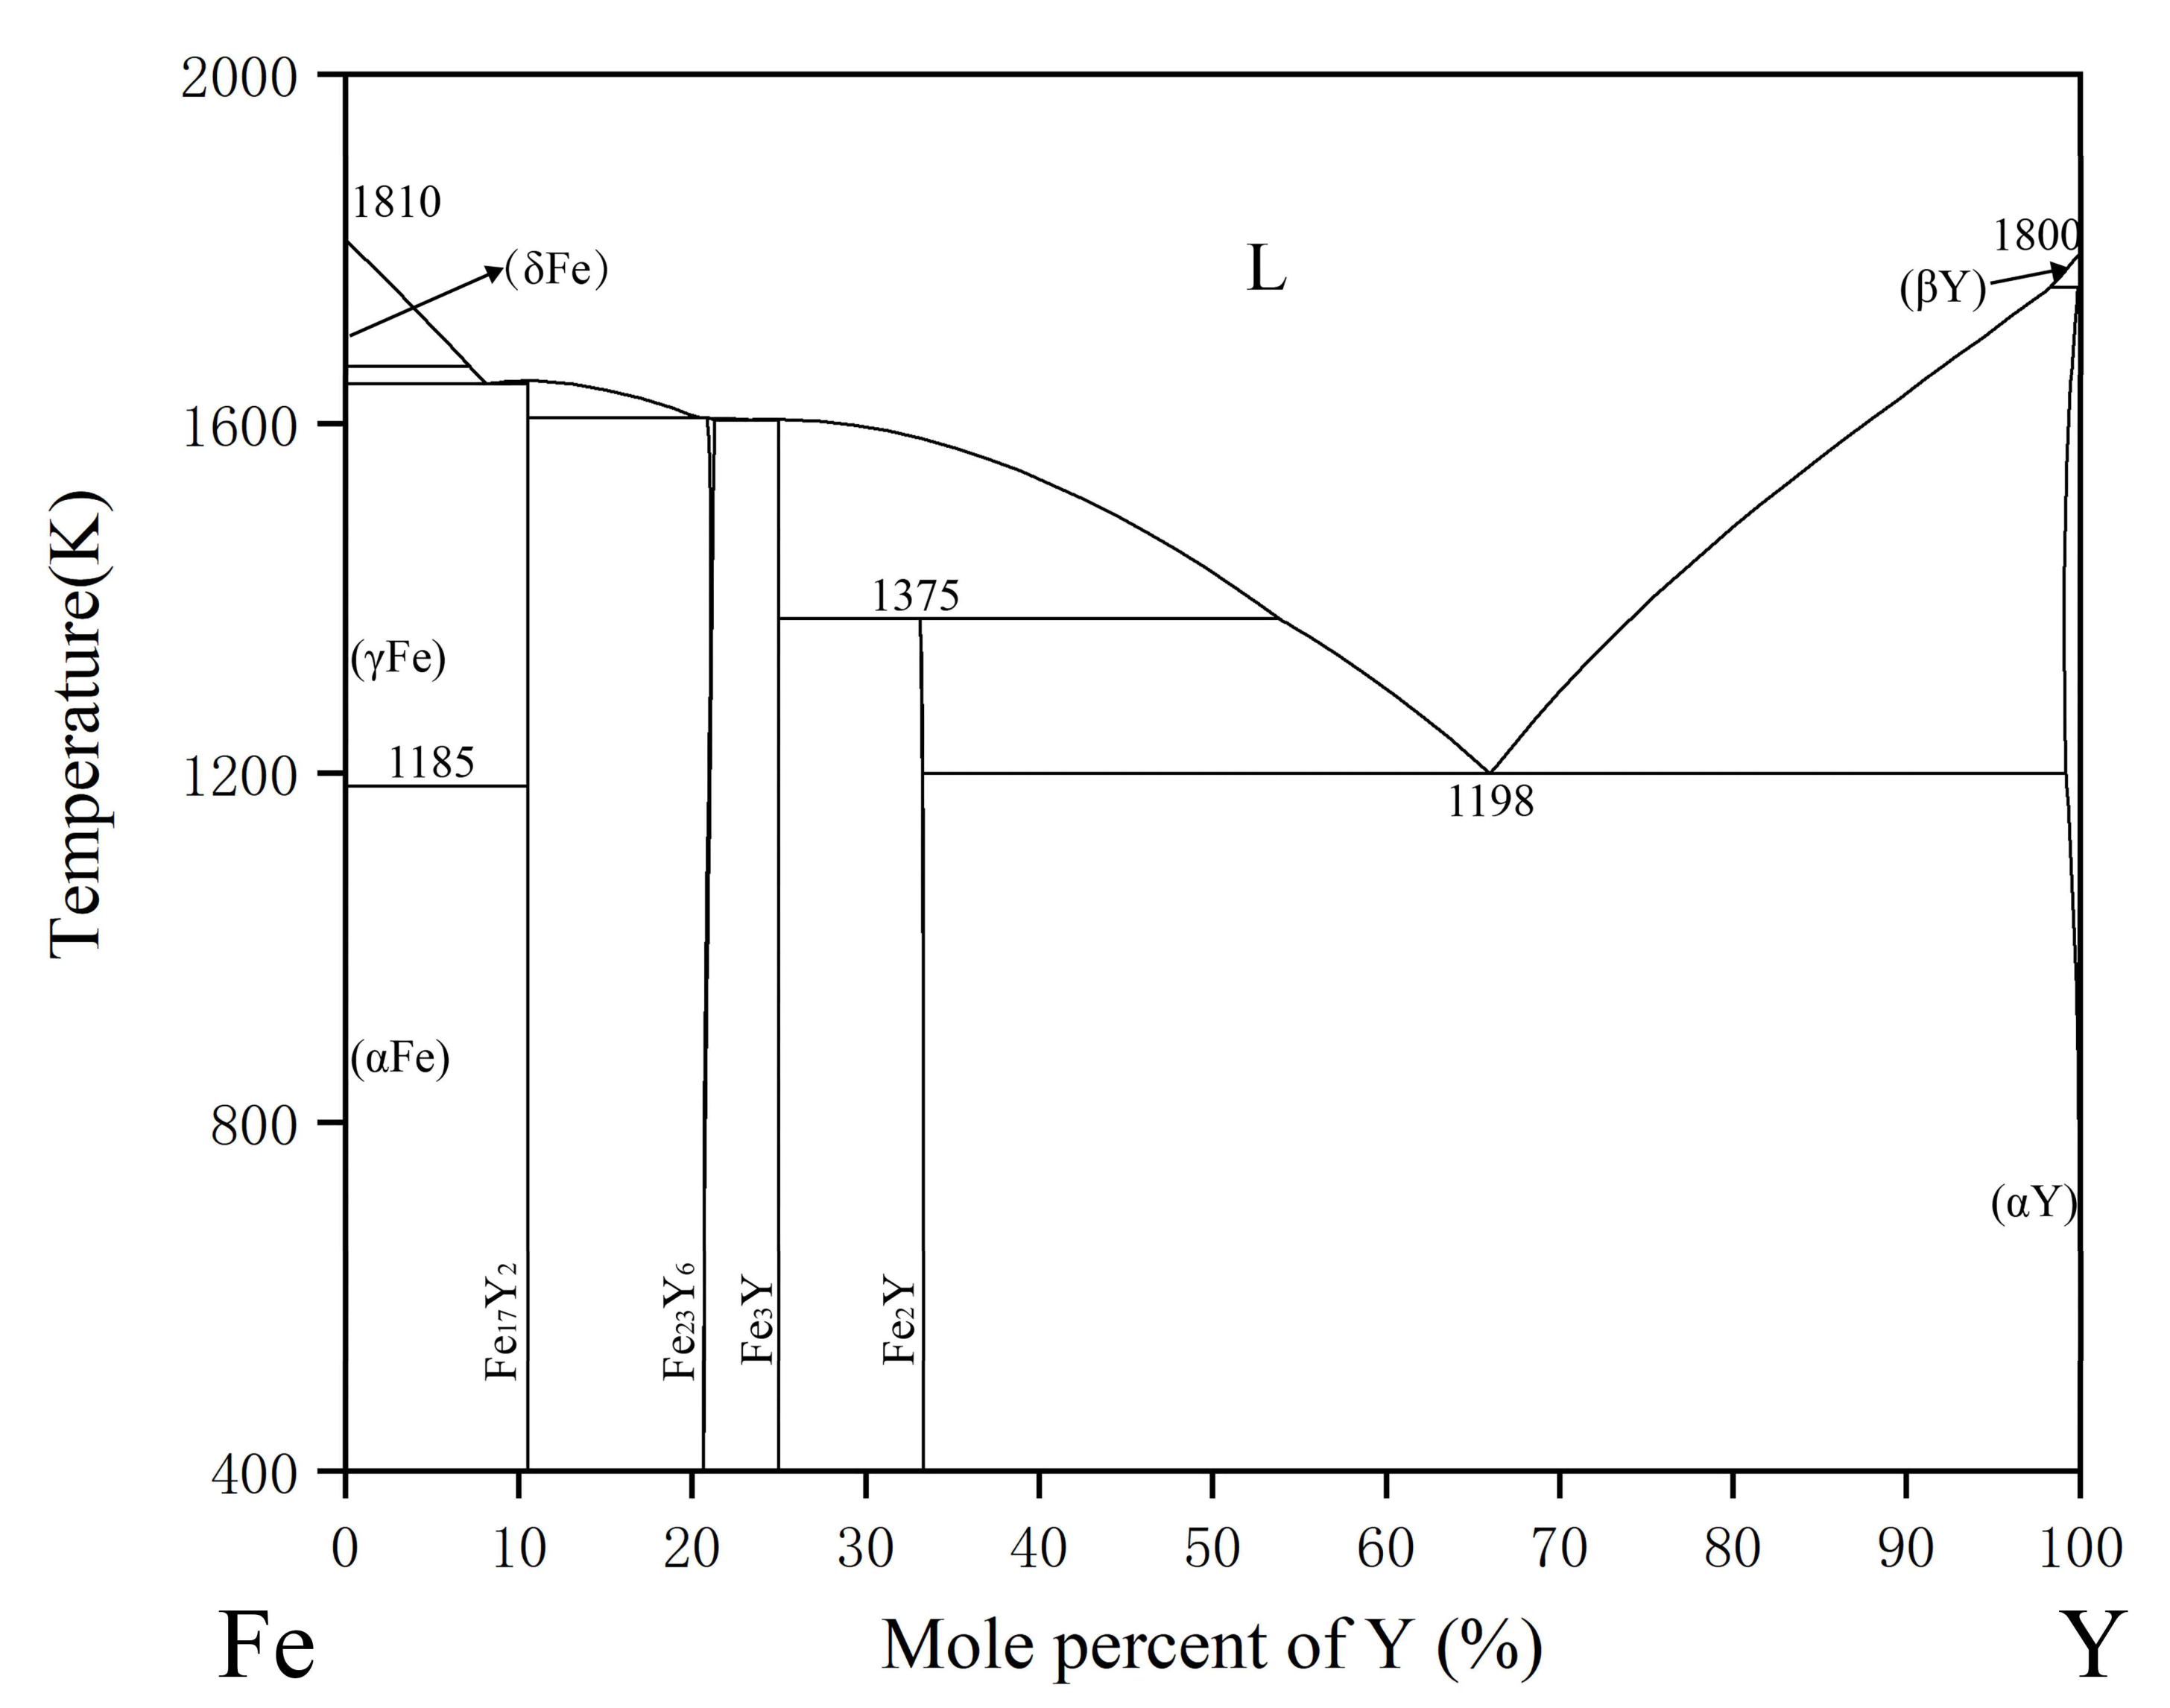
Domagala et al. [31] reported the Fe-Y phase diagram for the first time in the whole composition range. Then, a thermodynamic assessment was carried out by Gschneider et al. [32] Recently, Zhang et al. studied the crystallography and thermodynamics of the compounds in the system, which provided a basis for further optimization of the Fe-Y system [33]. Figure 2 shows the Fe-Y phase diagram with four intermetallic compounds: Fe17Y2, Fe23Y6, Fe3Y and Fe2Y. Based on the previous research work mentioned above, Saenko et al. [34] reported the thermodynamic optimization of the Fe-Y binary system, as shown in Figure 2.
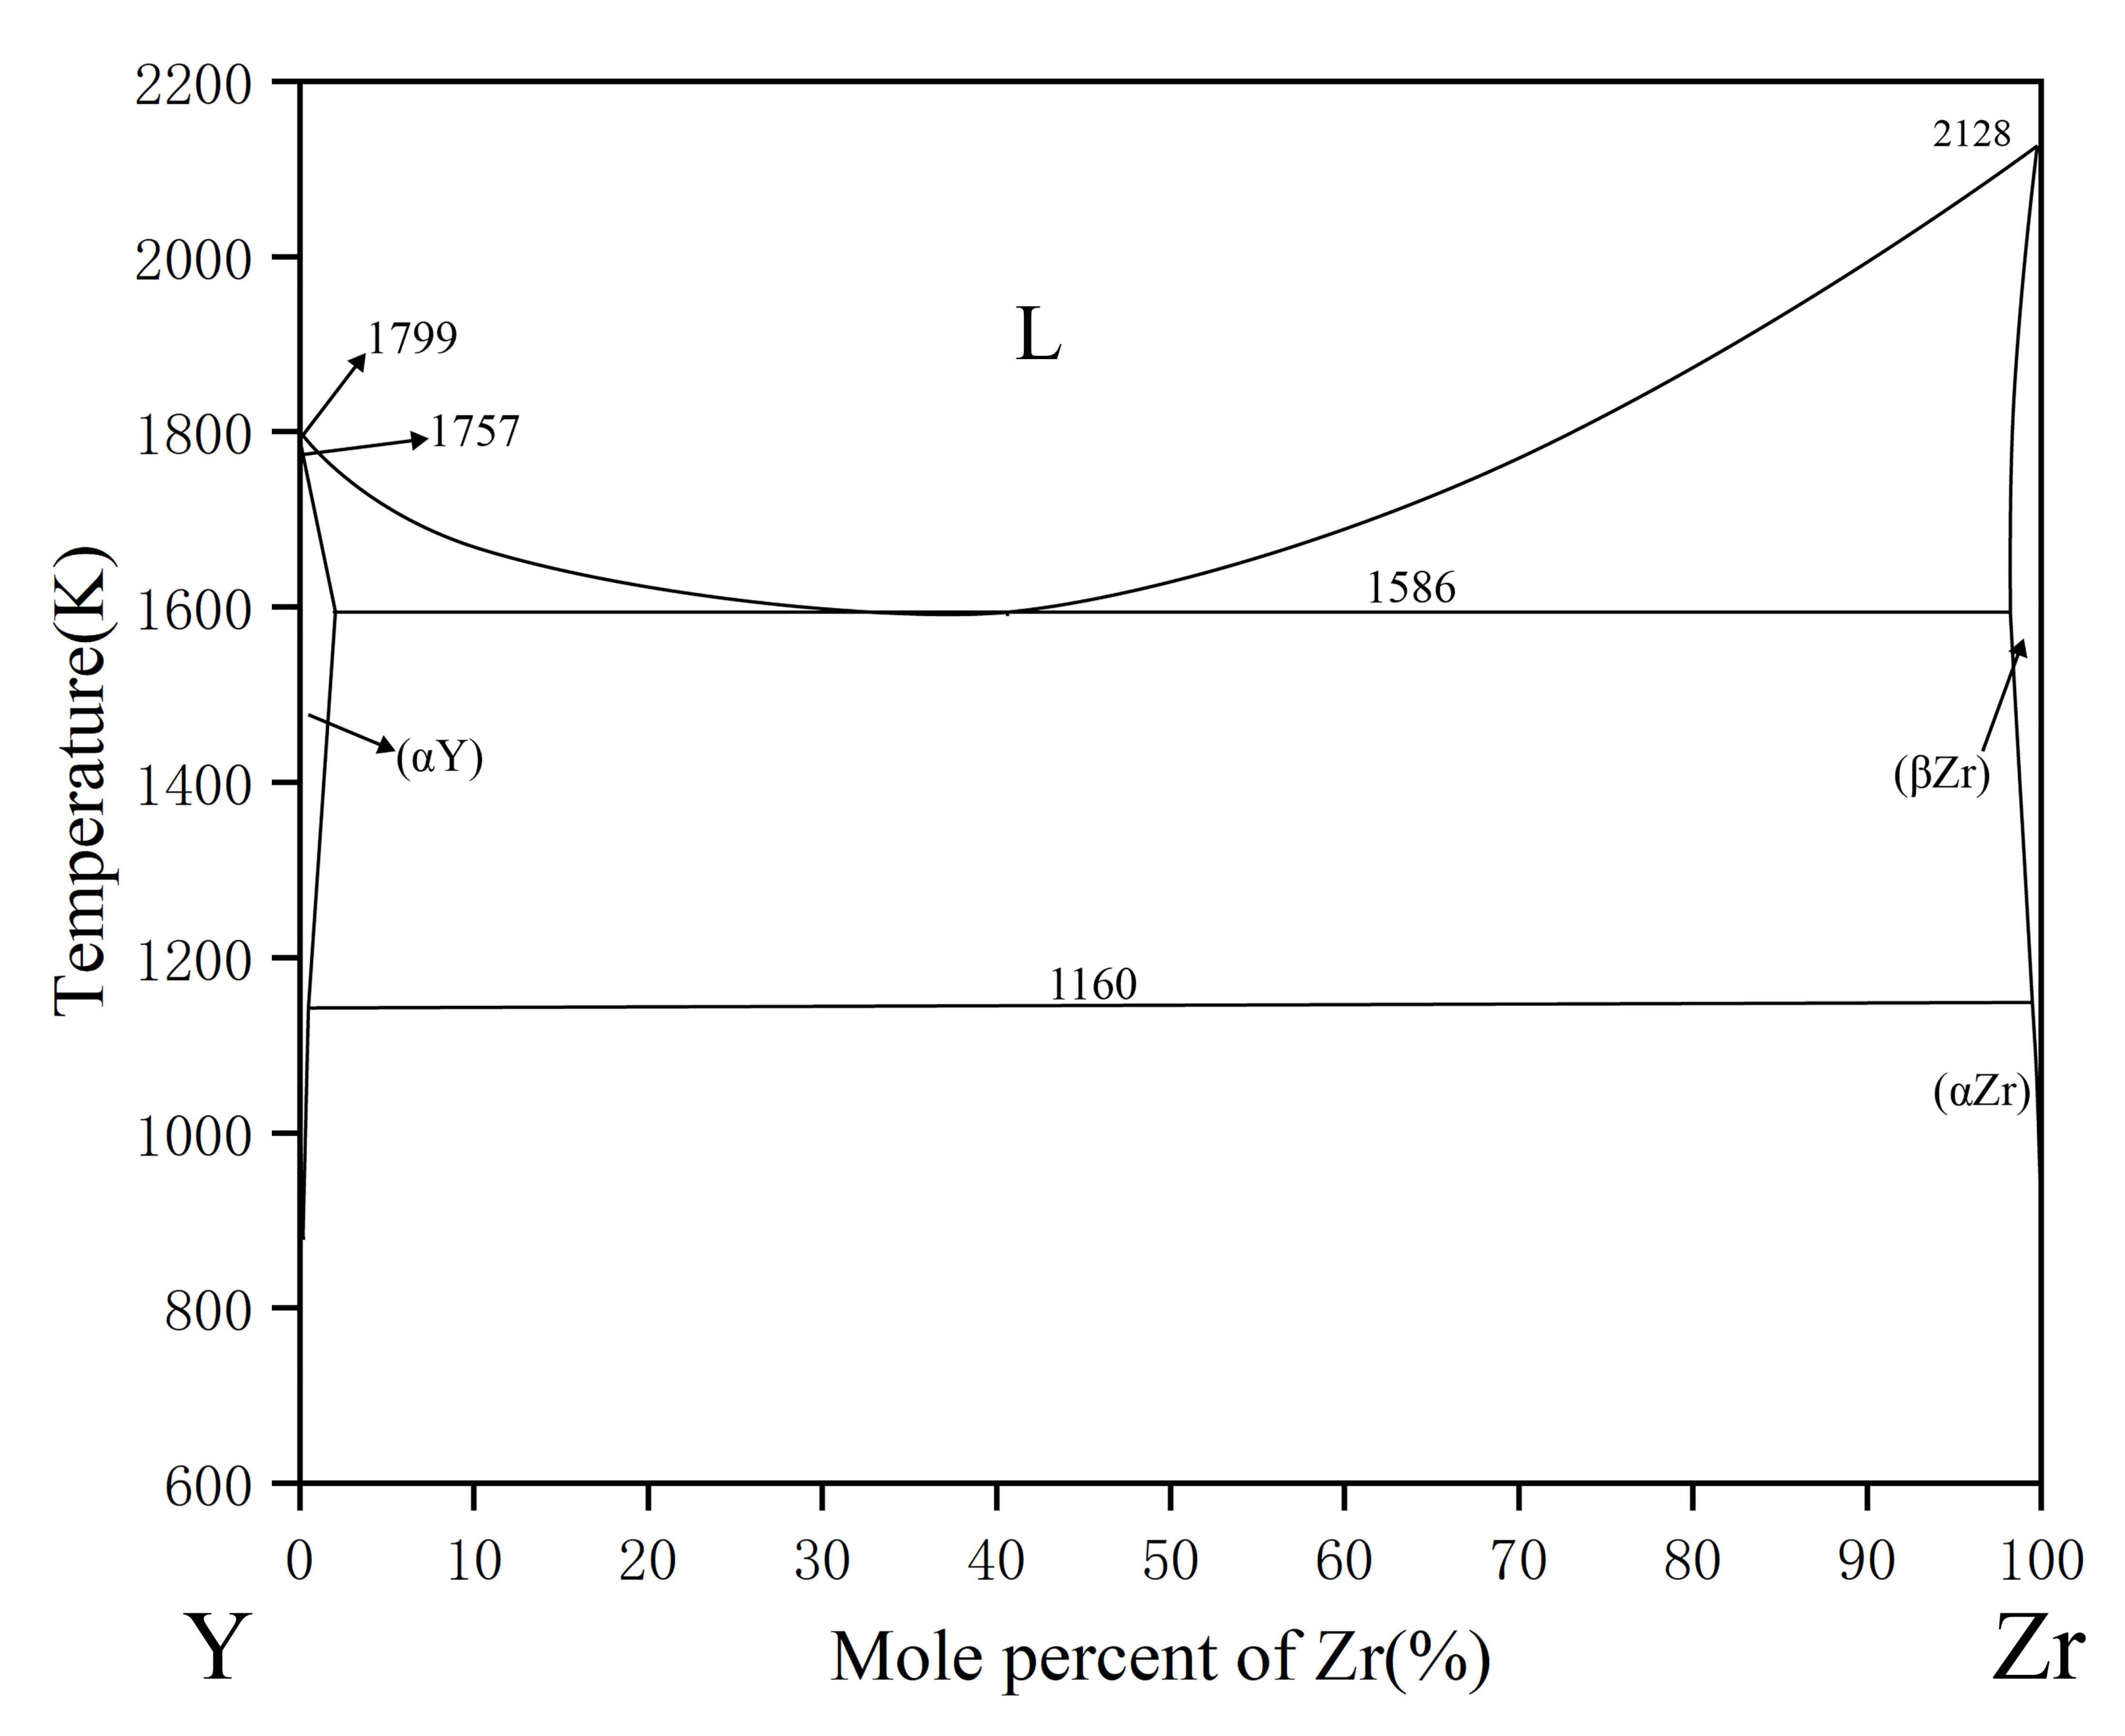
The phase equilibrium relation of Zr-Y phase diagram was first studied by Wang [35], based on which Palenzona and Ciraflci [36] optimized the thermodynamic data. Recently, Flandorfer et al. [37] constructed the thermodynamic database of Zr-Y system. The calculated phase diagram used in this work adopts the latest thermodynamic parameters reported by Bu et al. [38], as shown in Figure 3.
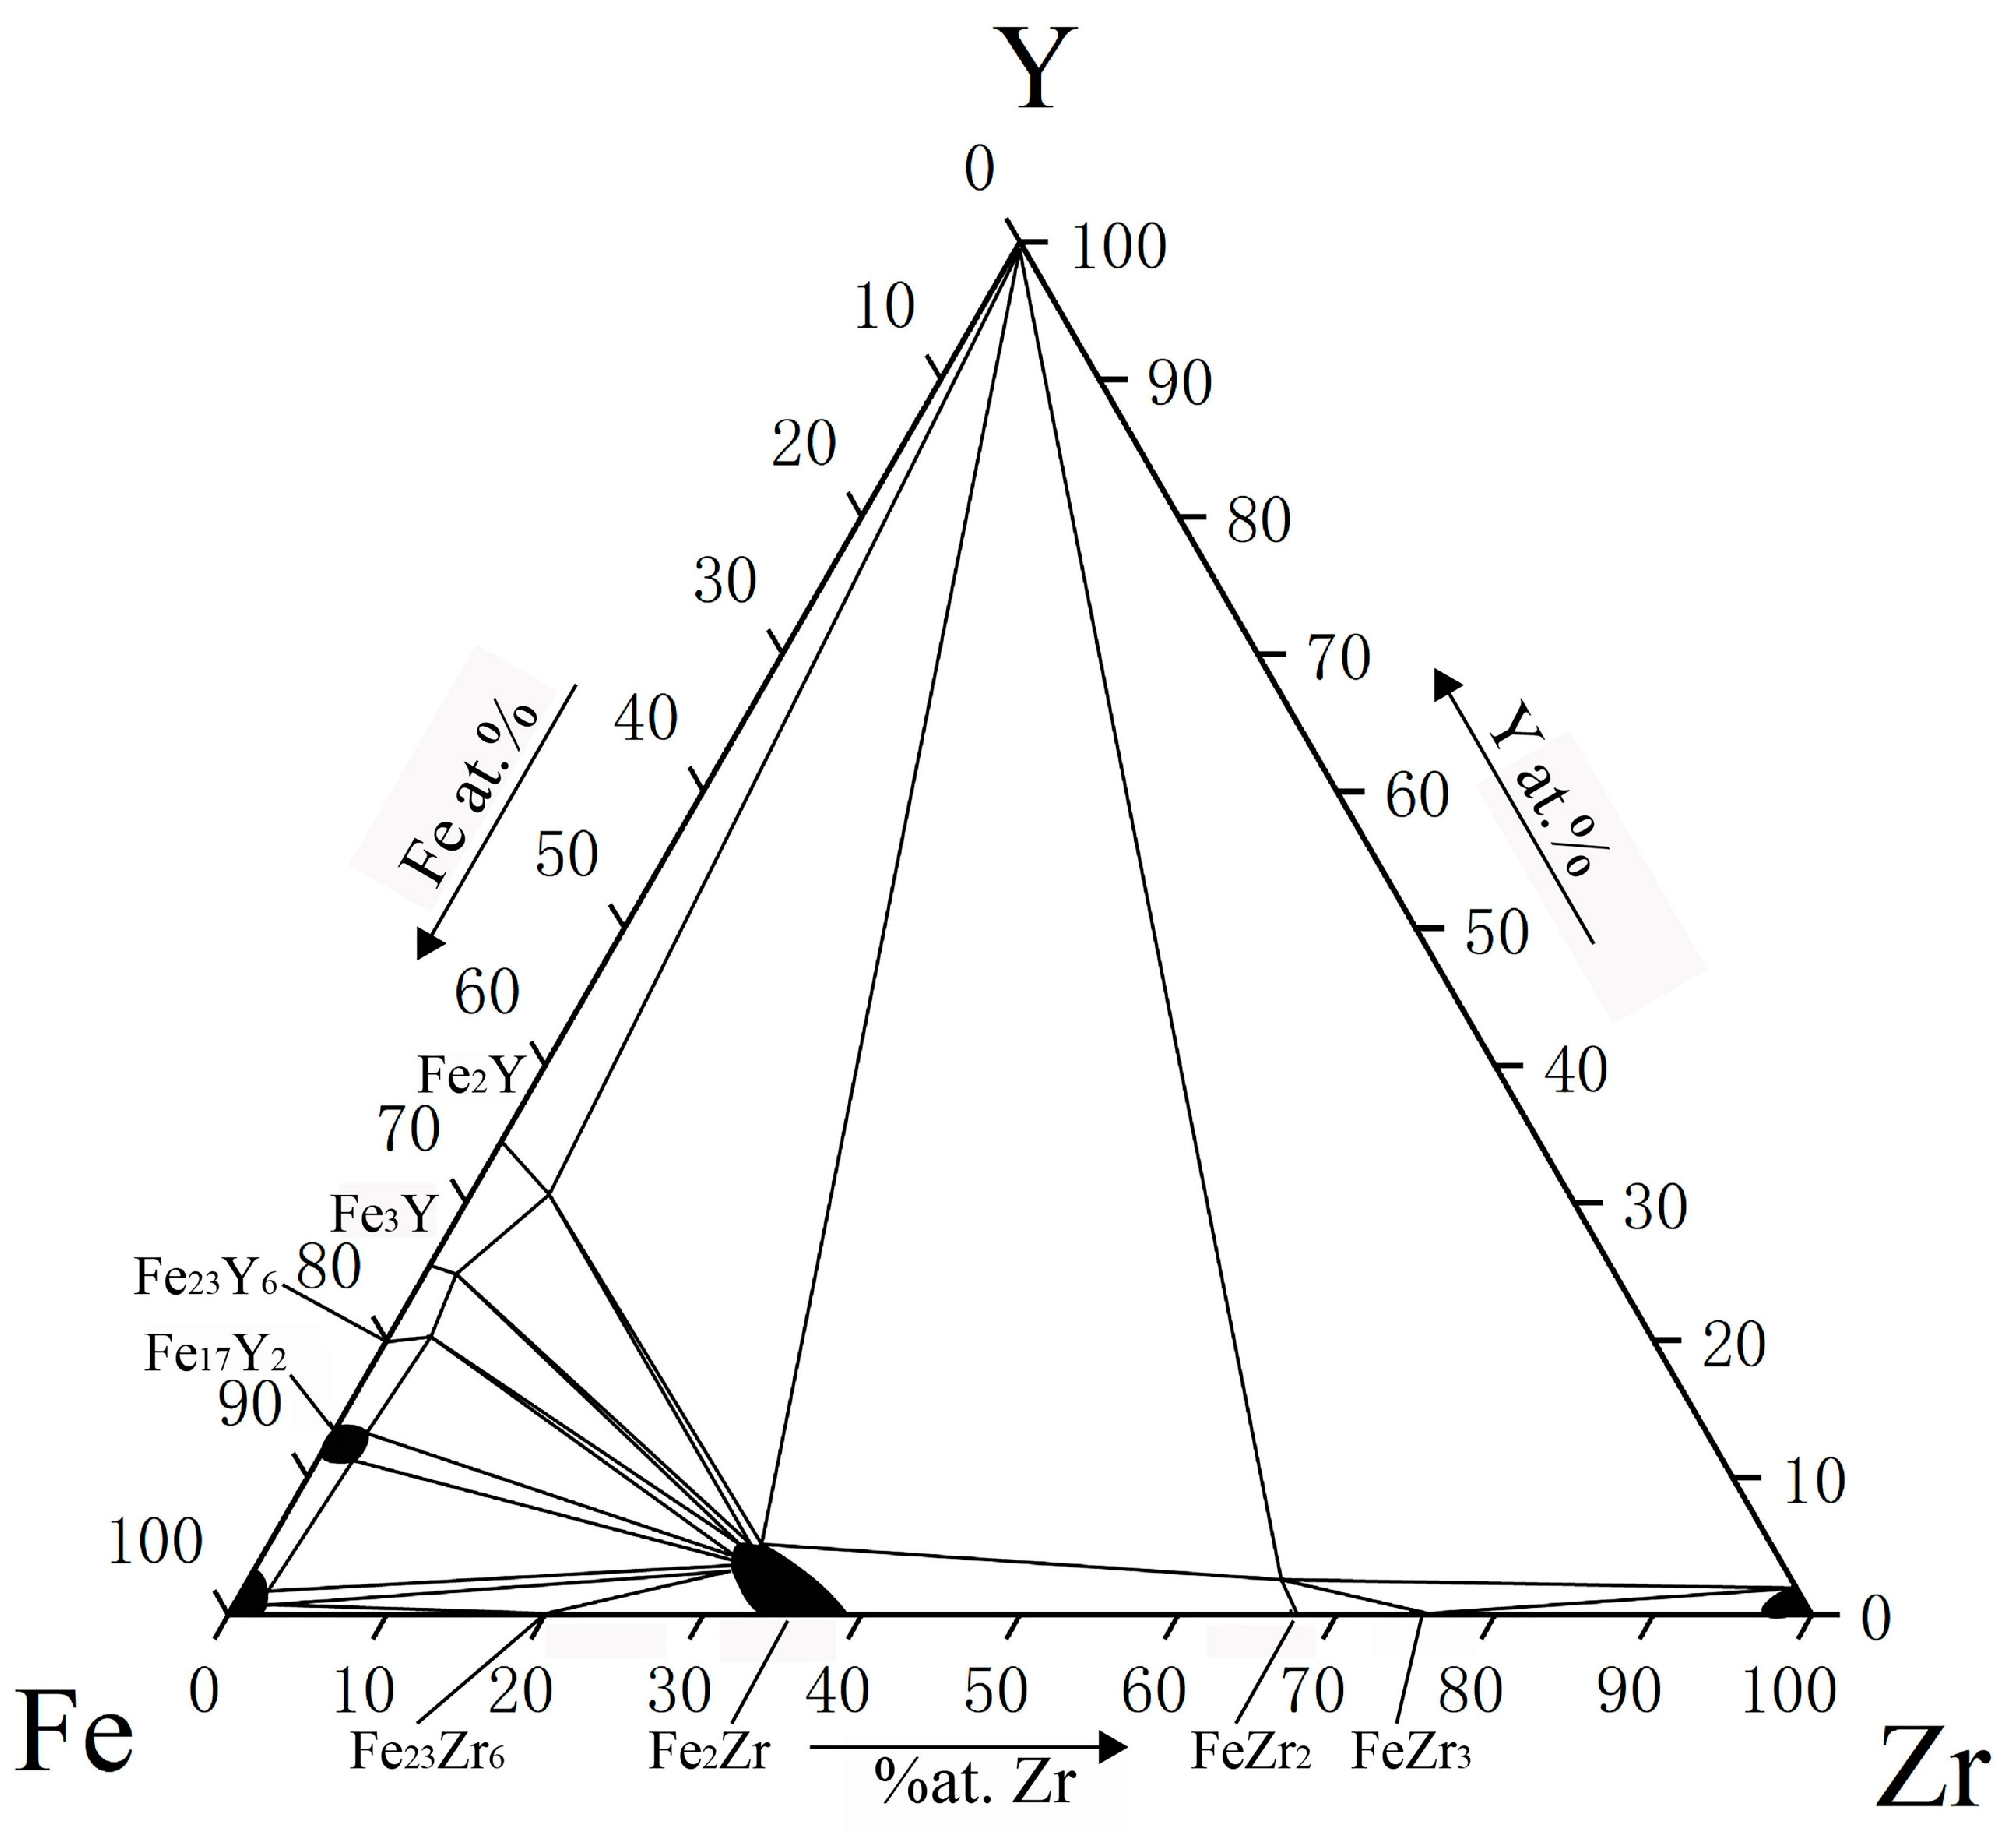
Research on the phase relationships and ternary compounds of Fe-Zr-Y ternary systems was relatively limited. In 1986, by combining three related binary phase diagrams, Harchenko et al. [39] measured the 1070K isothermal section of the Fe-Zr-Y ternary system for the first time, but no ternary compounds were discovered, as shown in Figure 4. In 1989, Jifan et al. reported Fe9Zr2Y phase with ThMn12 structure [40]. At the same time, Itoh et al. also found Fe2.9Zr0.5Y0.5 phase of Orthorhombic type [41]. The binary and ternary phases, the crystal structure and lattice parameters that were previously reported are listed in Table 1.
2. Experimental Procedures
The phase relationship of the Fe-Zr-Y system was studied through the equilibrium alloy method of static measurements. Iron rod (99.99 wt.%), zirconium rod (99.99 wt.%) and yttrium block (99.99 wt.%) were selected as raw materials. The weight of the samples was controlled around 12 g, with an error of ±0.005 g. The samples were placed in a non-expendable arc melting furnace with high purity argon atmosphere. At the same time, a sponge titanium button was added as the oxygen absorber to prevent oxidation. Each alloy button was melted for at least 4 times to ensure its uniformity. The alloy buttons were divided into two parts and sealed in the quartz tubes filled with argon. According to the reported heat treatment processes of similar systems [3], 60 and 90 days were set as the annealing times for 700 °C and 800 °C, respectively. After annealing, the samples were quenched in cold water to preserve the microstructure at high temperature.
The morphology and phase compositions of the alloy were analyzed by electron probe microanalysis (EPMA, JAXA-8800R, JEOL, 15 kV, 1 × 10⁻⁸ A, Tokyo, Japan). X-ray diffraction was employed (XRD, Rigaku d-max/2550 VB, Cu K, 40 kV, 250 mA, Tokyo, Japan) to analyze the crystal structure of typical alloys, with the scanning range of 10–90° and a speed of 0.133°/s. Backscattering electron (BSE) images of the alloy samples were acquired using a scanning electron microscope (SEM, TESCAN MIRA3 LMH, 15 kV, working distance of 15 mm, Brno, The Czech Republic).
3. Experimental Results
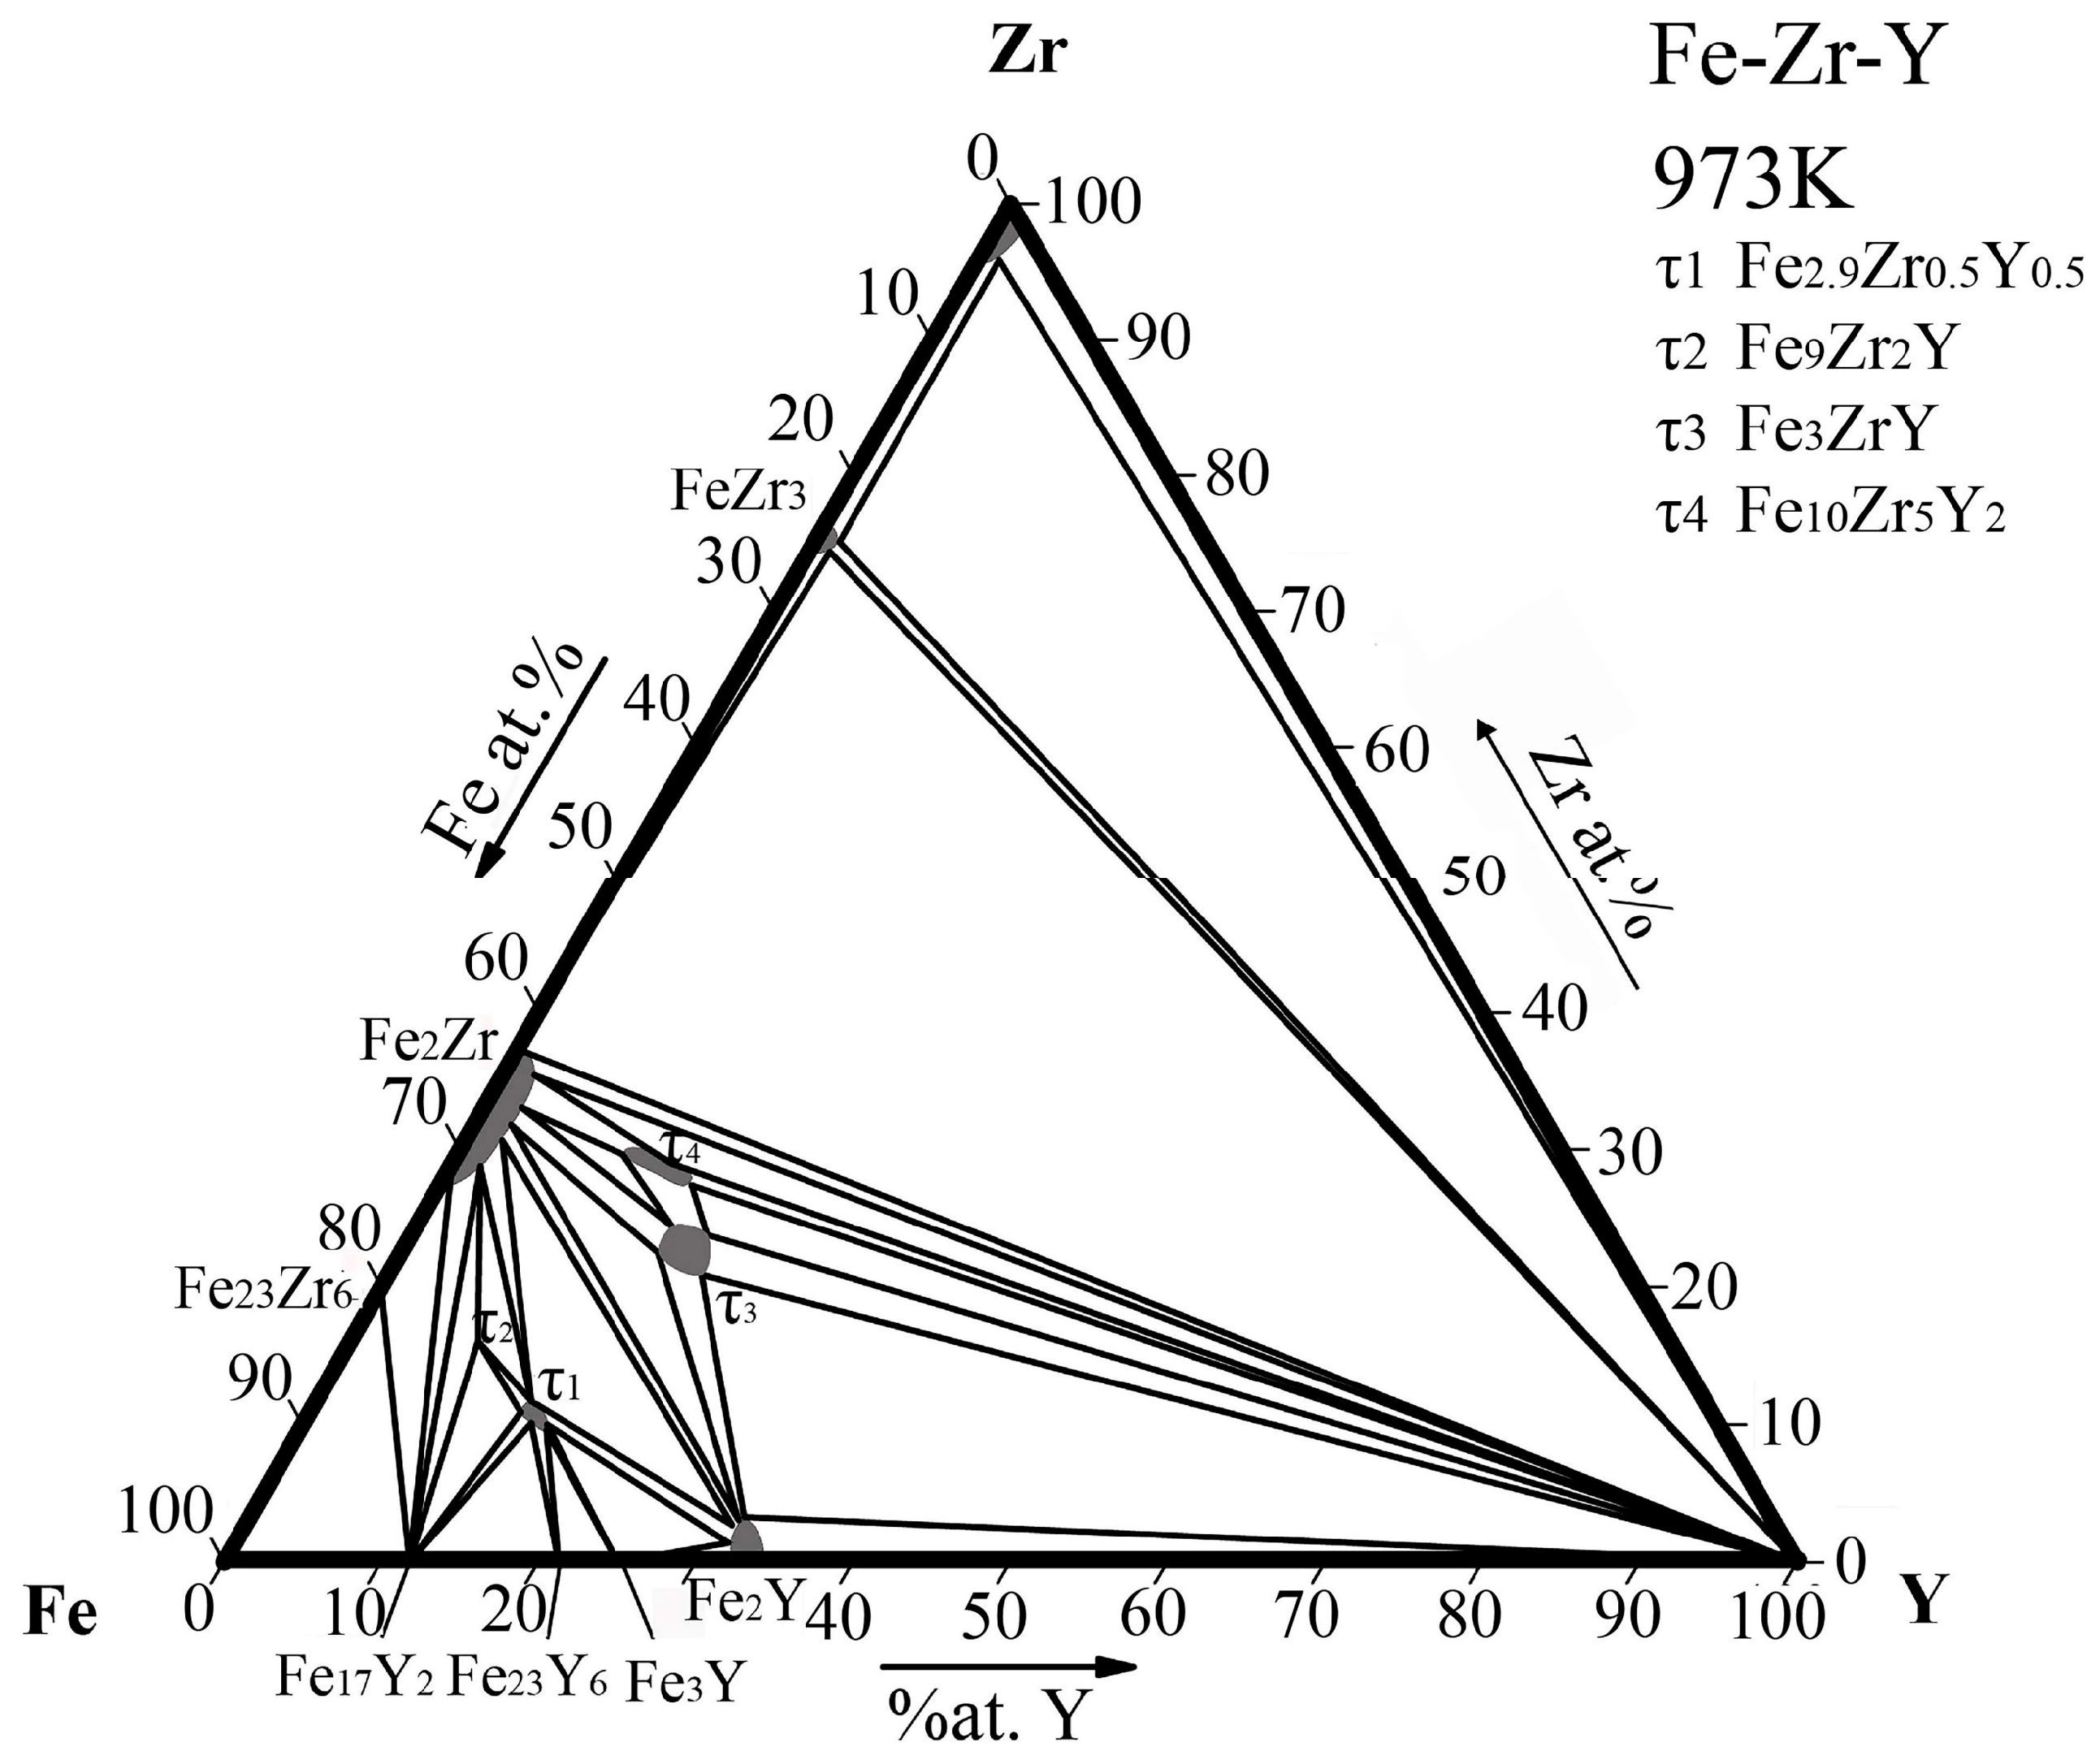
Based on the phase equilibrium data of 24 alloy samples, the isothermal section of the Fe-Zr-Y ternary system at 973 K was determined for the first time, as shown in Figure 5. A total of 12 three-phase regions and 12 two-phase regions were measured. In this isothermal section, there are four ternary compounds, among which, τ1, τ3 and τ4 have solid solubility intervals, and seven binary compounds, three of which have solid solubility, which are Fe2Zr, FeZr3, Fe2Y.
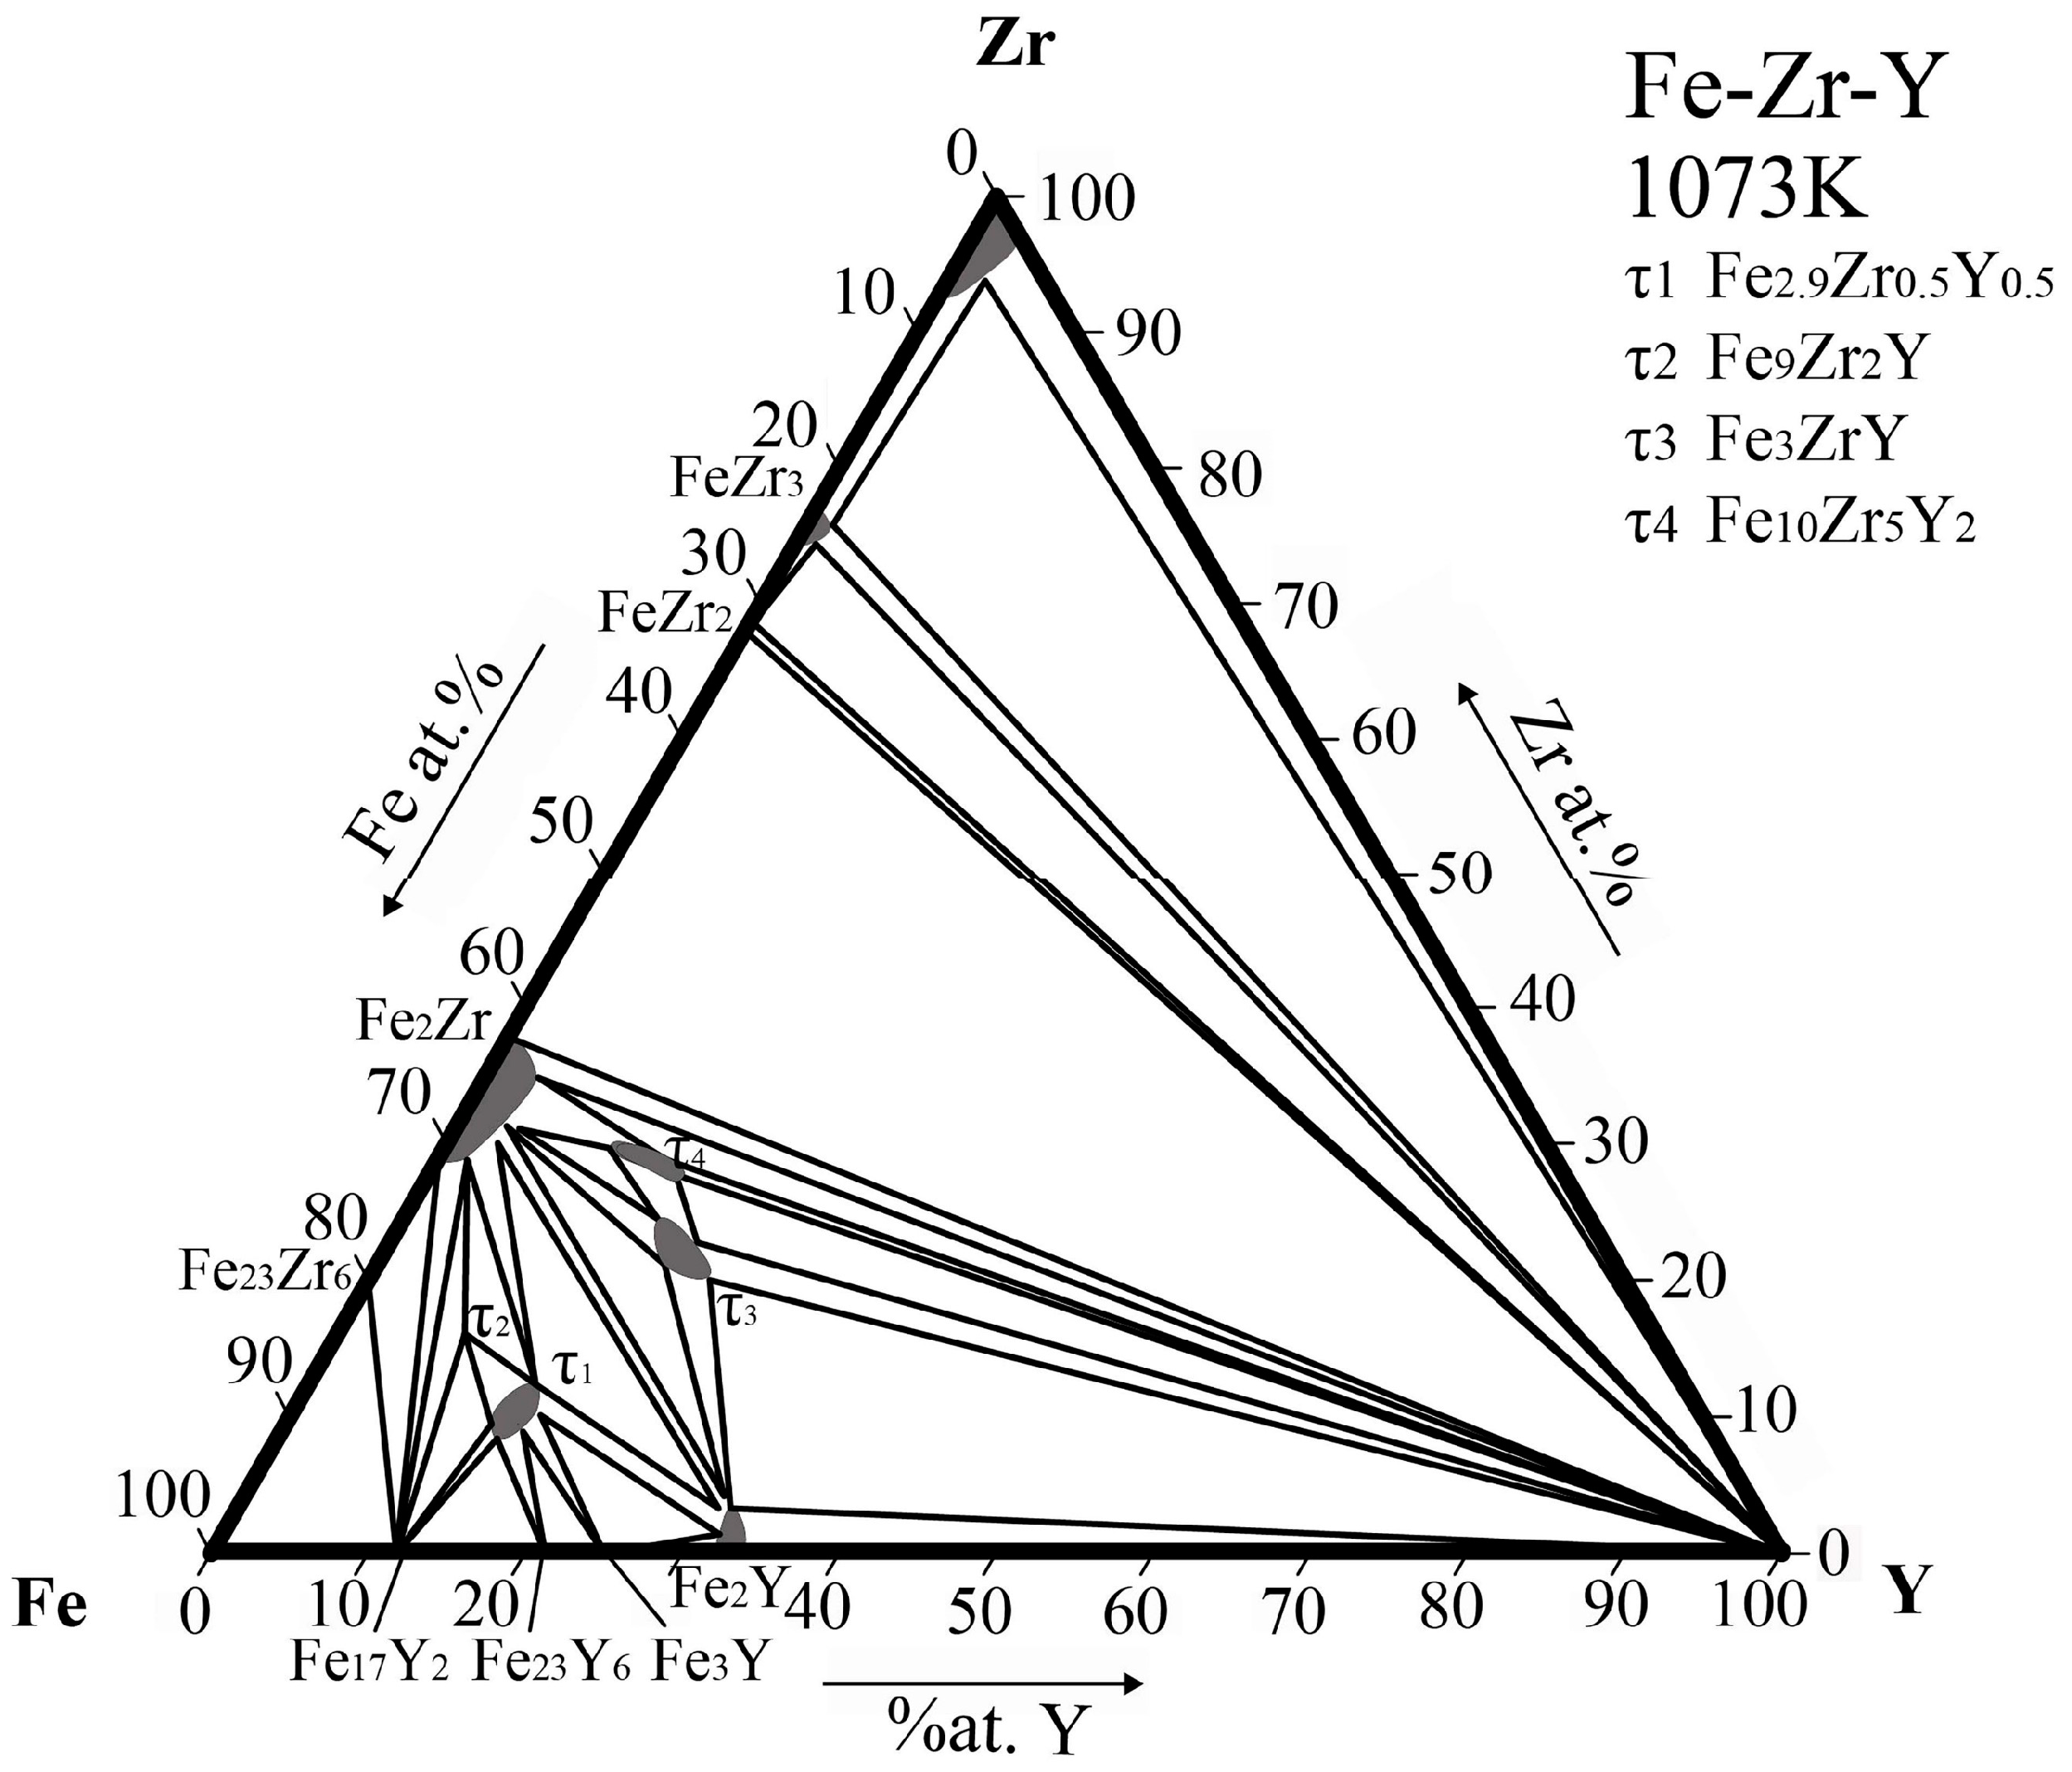
The isothermal section of Fe-Zr-Y ternary system at 1073 K is similar to the system at 973 K except that the maximum solid solubility of compounds τ1 and τ3 are slightly higher at 1073 K. Additionally, FeZr2 as a high temperature phase appeared at 1073 K. This is consistent with the binary optimized phase diagram, and therefore its appearance is reasonable and in accordance with expectation [30]. The 1073 K isothermal section obtained in this work is shown in Figure 6.
4. Discussion
The experimental data obtained from SEM, EPMA, XRD and EBSD examination were analyzed to determine the isothermal section and the phase relationship of the Fe-Zr-Y ternary system at 973 K and 1073 K. The phase relations in several key alloys were discussed in detail as follows.
4.1. Phase Equilibria at 973 K
A total of 24 alloy samples were prepared for the study of the phase equilibria of the Fe-Zr-Y ternary system at 973 K. The constituent phases of each alloy sample were summarized in Table 2.
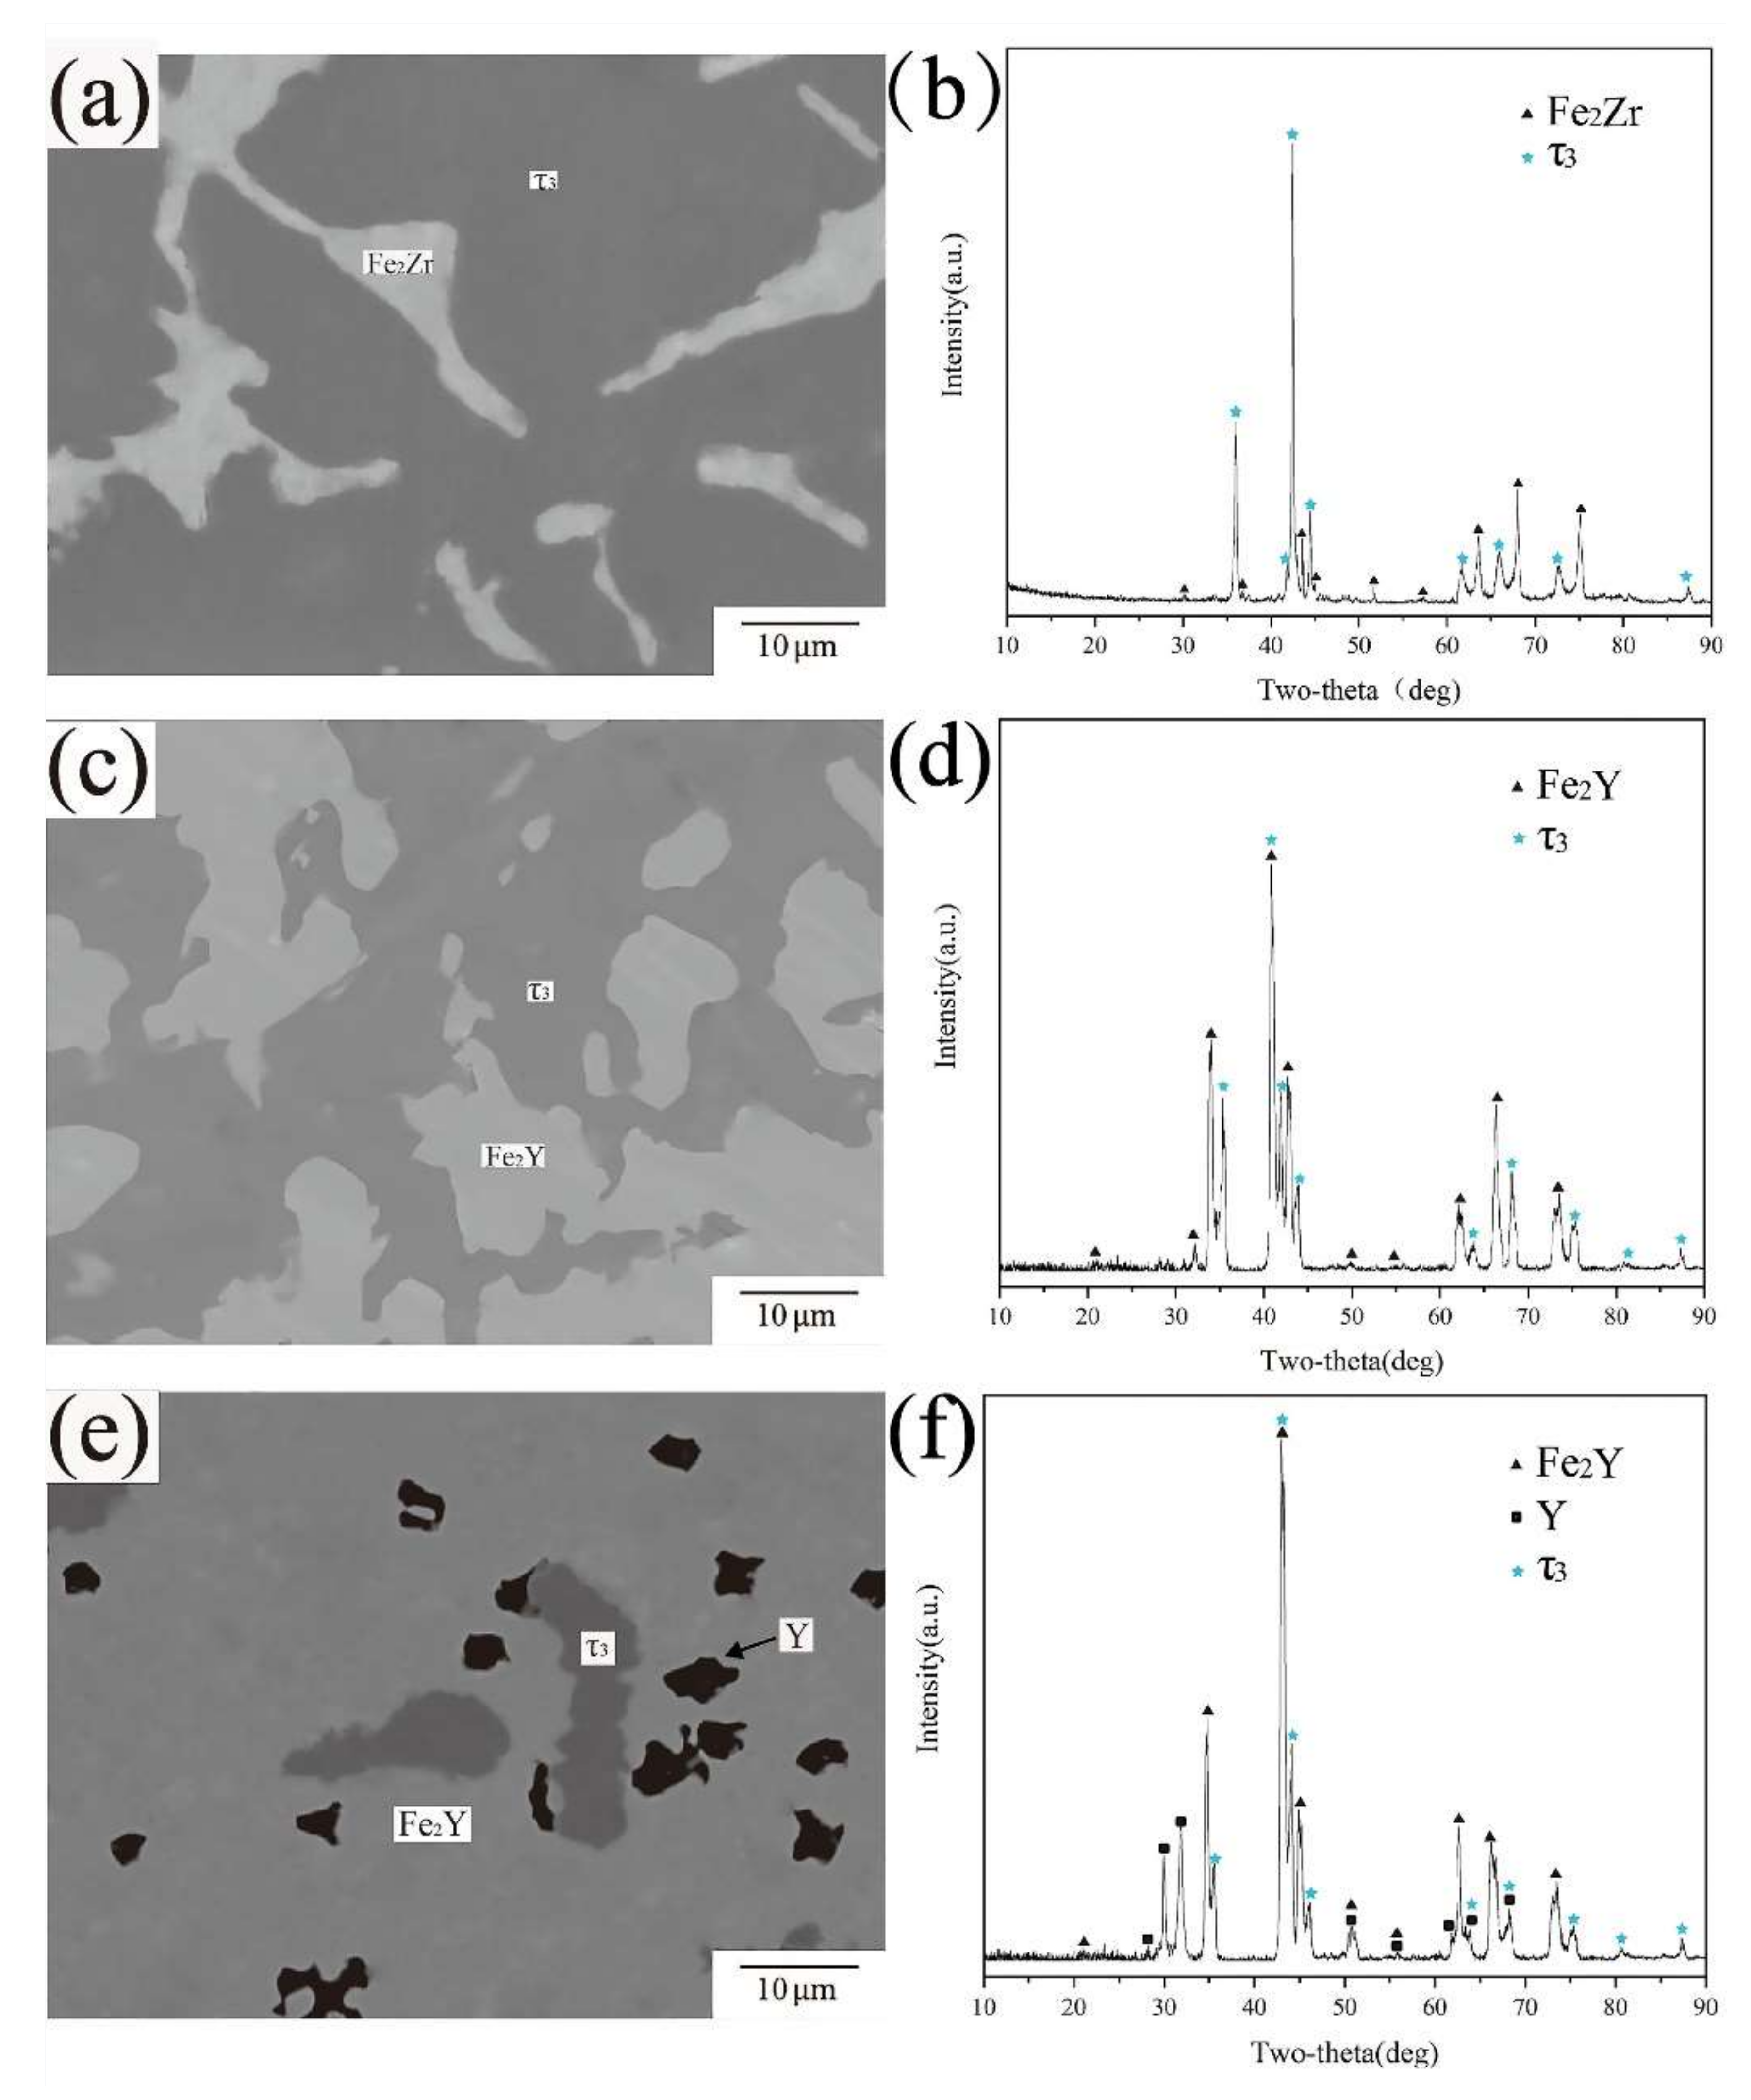
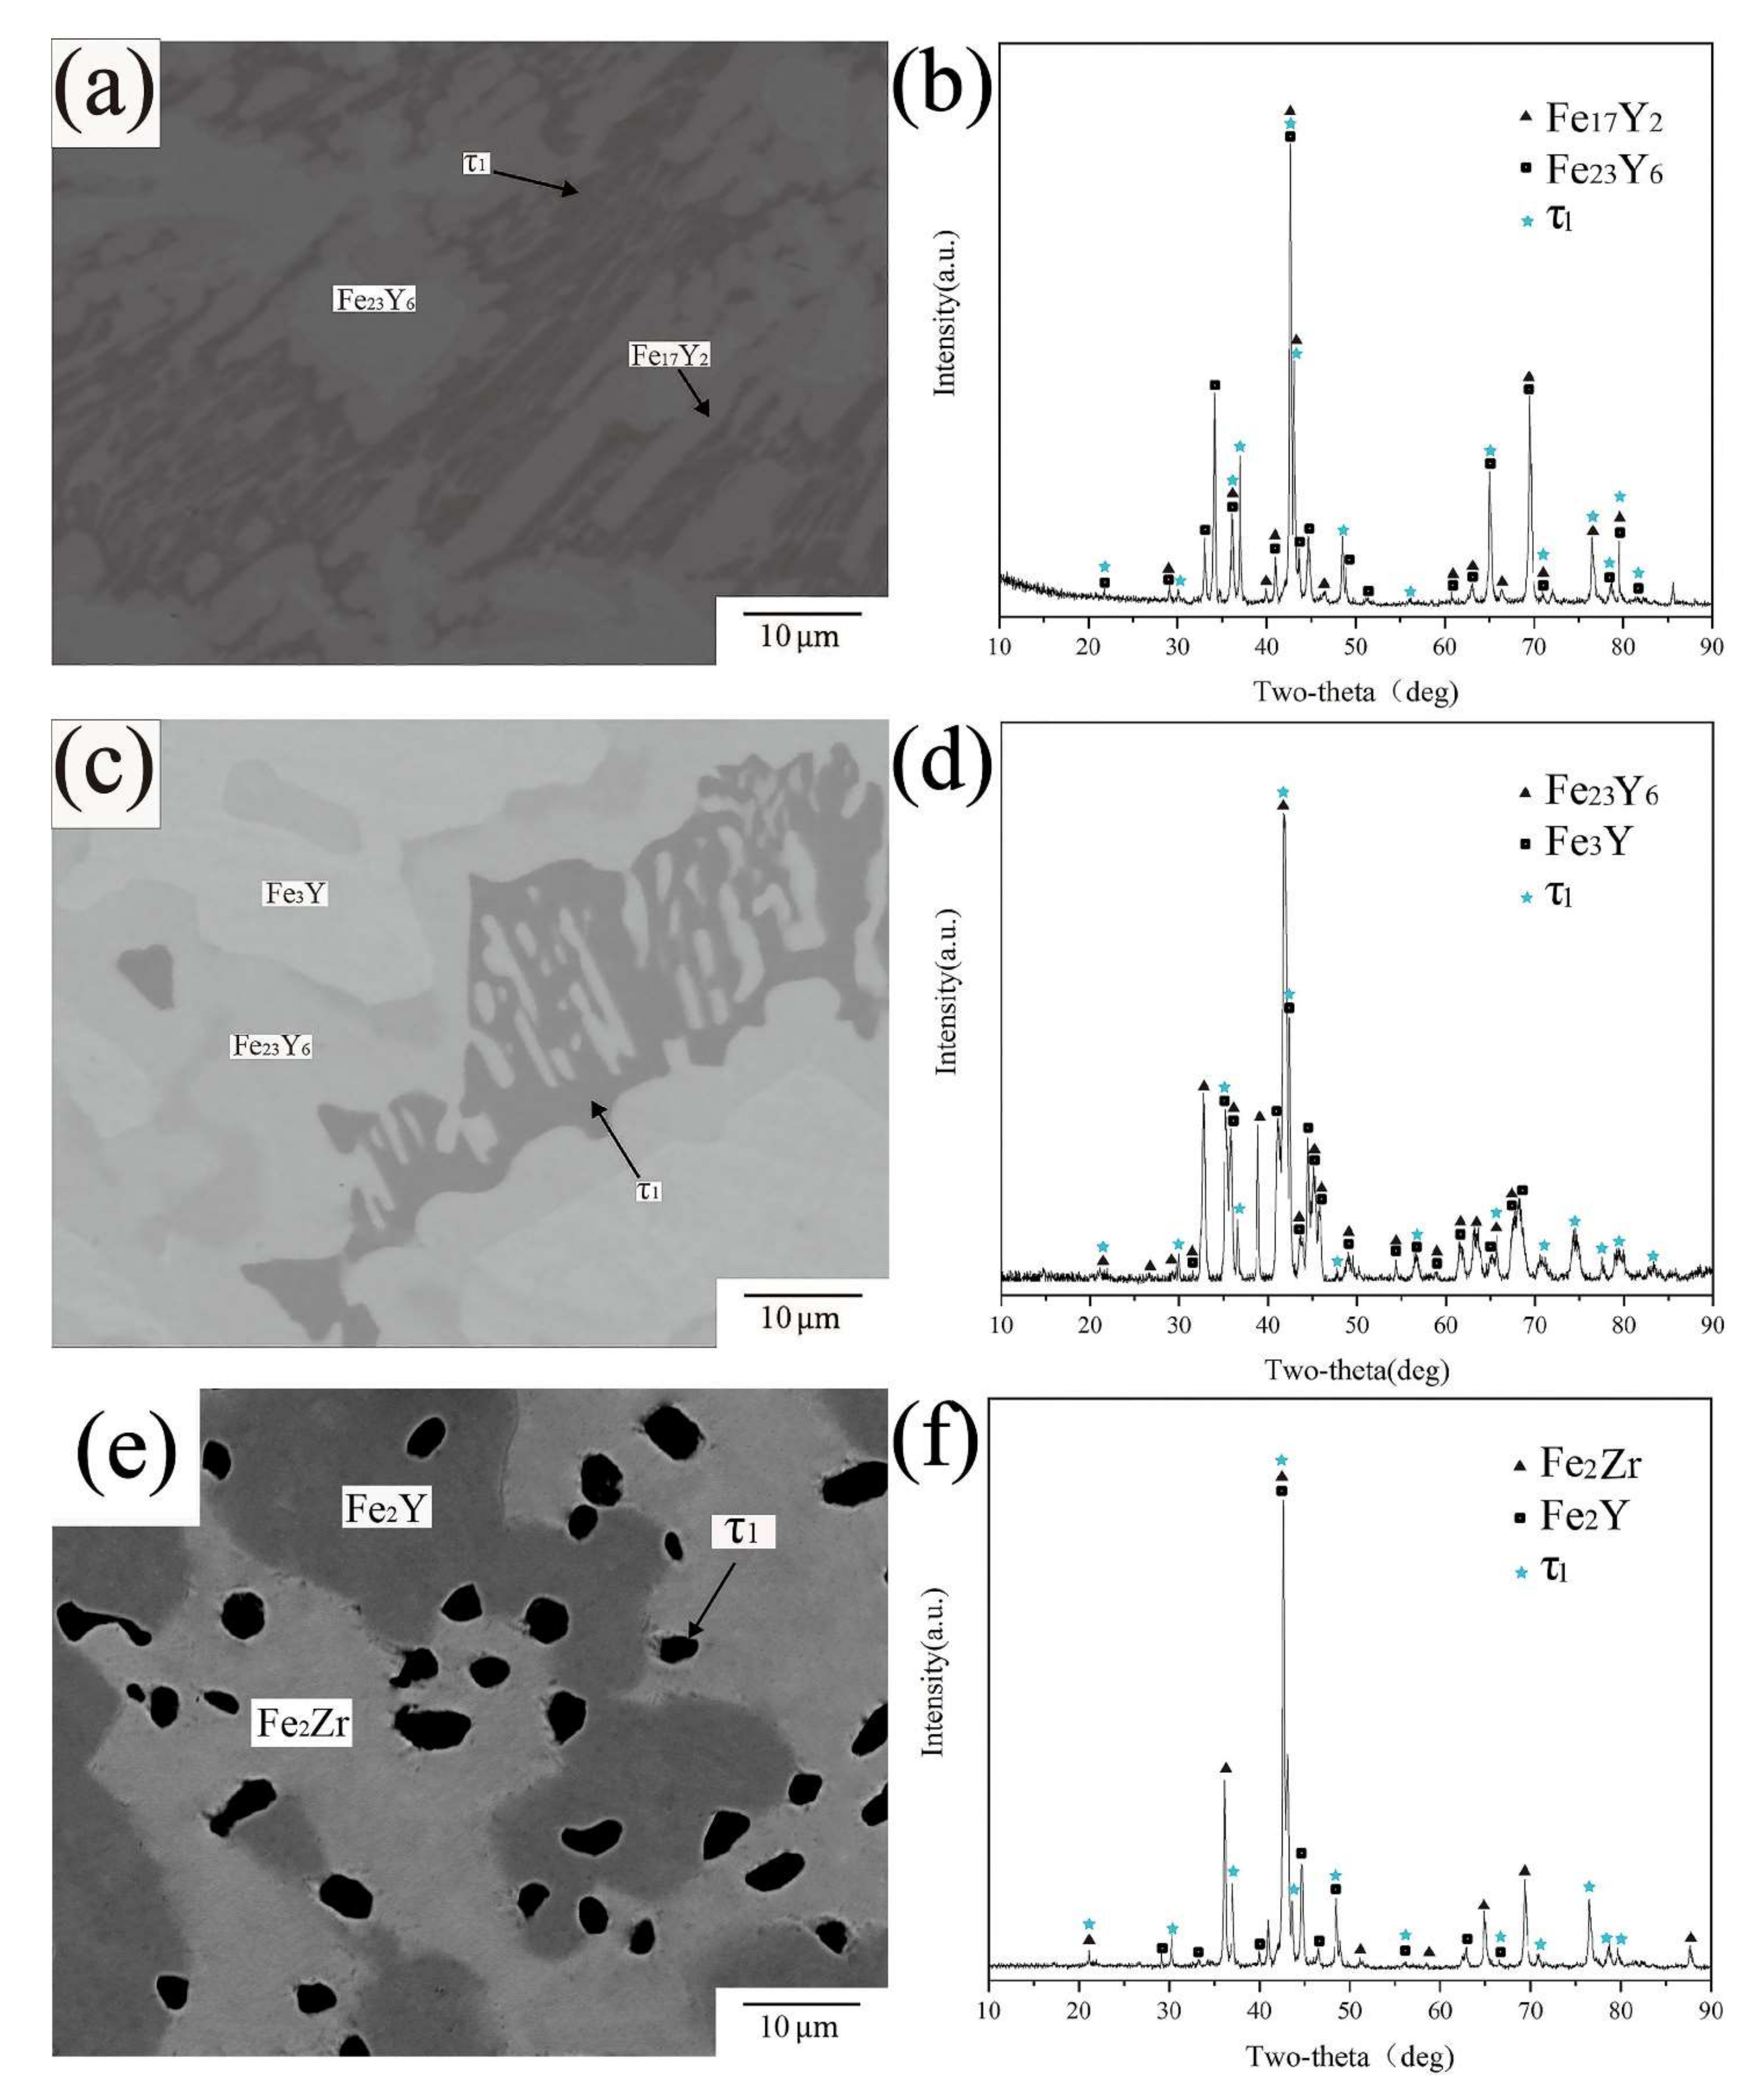
BSE images and XRD patterns of alloy samples A7, A13 and A24 are shown in Figure 7a,c,e). EPMA-WDS results show that the dark gray phases in A7, A13 and A24 have the same composition, close to Fe60Zr20Y20, so they are confirmed as the same phase. However, this composition is different from the existing ternary compounds in the Fe-Zr-Y system. For the further identification of this phase, XRD analysis was performed on all three samples. In the XRD patterns of the three alloys, there are unrecorded characteristic peaks, the positions of which are basically fixed. Only a few peaks have slight displacement, which may be due to the change in lattice parameters. According to the above analysis, the ternary compound was identified as a new phase with the chemical formula Fe3ZrY and named τ3. Since no single phase of τ3 was obtained in this work, follow-up experiments are needed to explore the crystal structure of τ3.
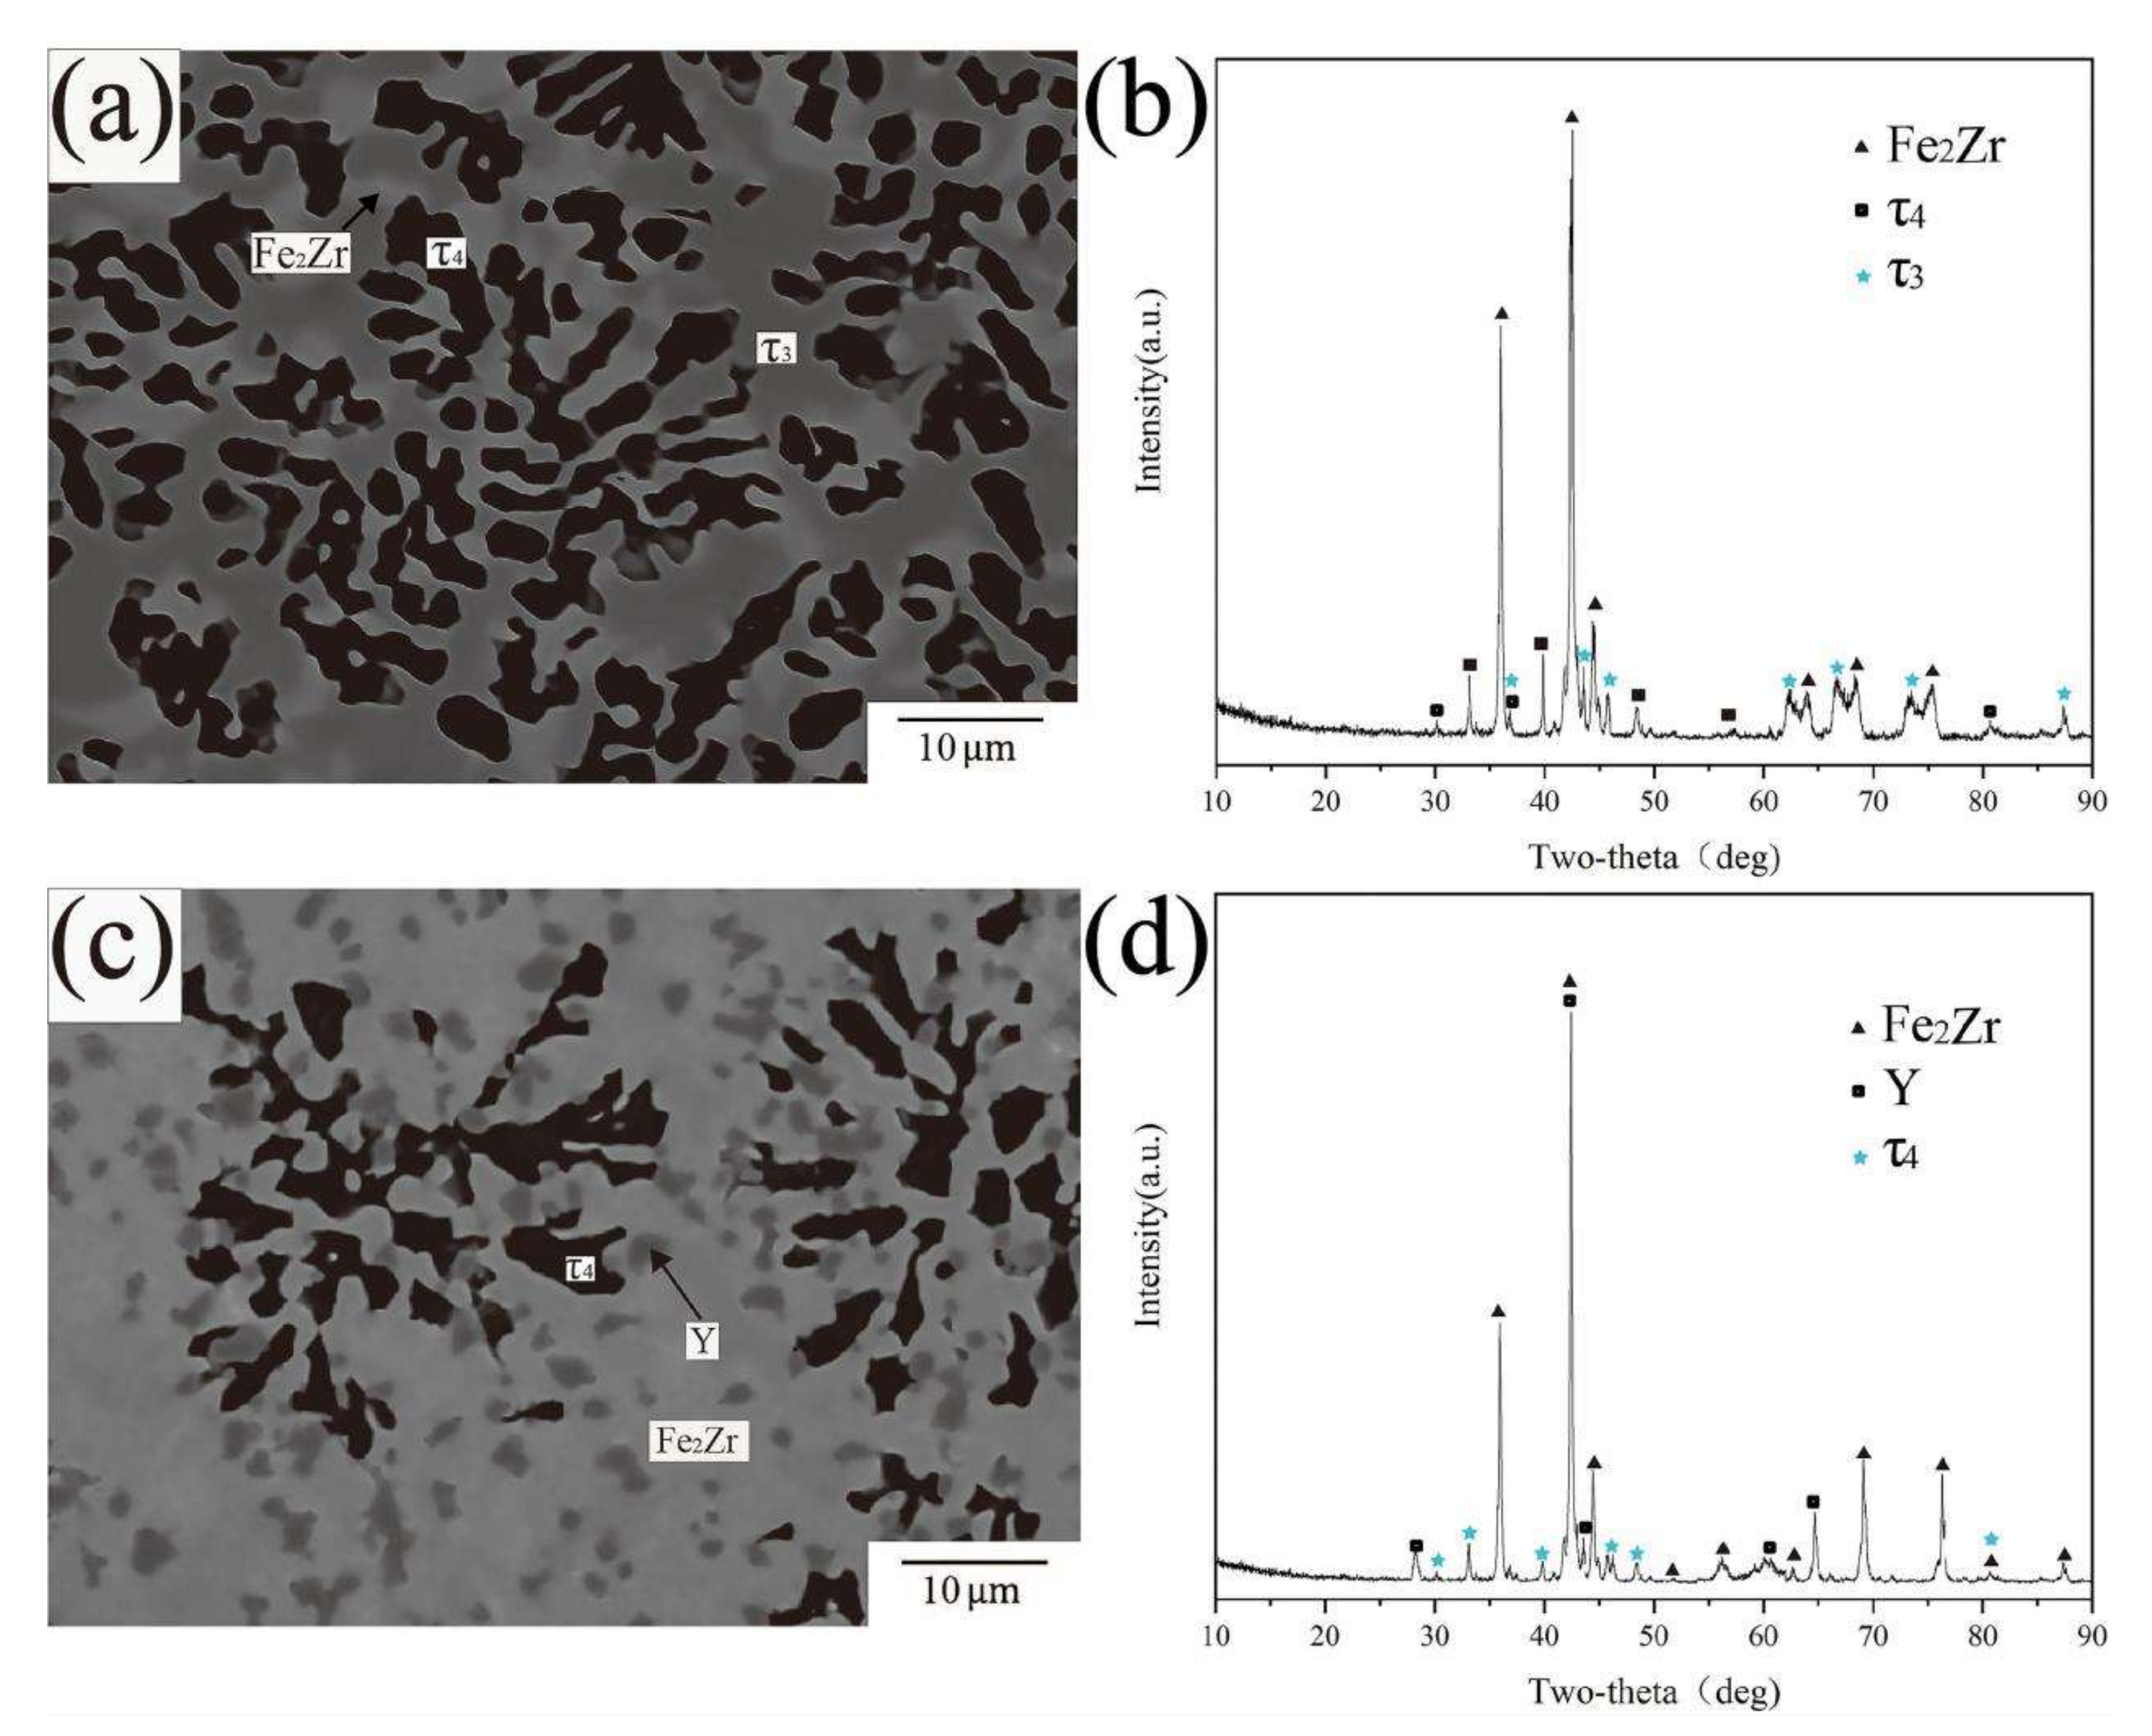
There are three phases in the BSE images of alloy samples A2 and A9 (Figure 8a,c). According to the results of XRD and EPMA-WDS tests, all the phases are already identified except for the black phase. The compositions of the black phase in Figure 8a,c are Fe59.7Zr29.6Y10.5 and Fe56.2Zr27.9Y15.9, respectively. The stoichiometric ratios represent some differences between the two compositions, so the black phase was initially considered to be two different compounds. However, the XRD patterns (Figure 8b,d) show that the characteristic peaks of the two matched up, indicating that the crystal structures of the two phases were consistent, thus the two phases were confirmed to be the same compound. No ternary compound with similar stoichiometric ratio and diffraction peak matching was found in PDF cards. According to the results described above, the black phase was defined as the new ternary compound Fe10Zr5Y2 and named as τ4.
The BSE images of alloy samples A5, A10 and A17 are shown in Figure 9a,c,e. The black phase in A10 and the dark gray phase in A5 and A17 have the same atomic ratio of Fe2.9Zr0.5Y0.5, which was denoted as τ1 phase. The XRD (as shown in Figure 9b,d,f) characteristic peaks of compound τ1 have fixed positions, which are different from all the existing PDF cards. According to the reported literature [41], Fe2.9Zr0.5Y0.5 was considered to be transformed from Fe3Y, as Zr atoms replaced Y atoms in Fe3Y. In the study of Itoh et al. [41], Fe3Y did not exist in the Fe-Zr-Y system, as it was considered to be present in the form of Fe2.9ZrxY1−x (0 ≤ x ≤ 1), meaning that Y would be replaced by Zr until Y disappears completely. This conclusion was not adopted in this work due to the following reasons: (1) Fe2.9Zr0.5Y0.5 would be adjacent to Fe3Y phase according to the reported theory [41], which is not consistent with what is shown in Figure 9a,c,e. Although there is Fe3Y shown in Figure 9c, it is separated by Fe23Y6, and τ1 is completely wrapped by Fe23Y6 instead of Fe3Y. (2) If Fe2.9ZrxY1−x (0 ≤ x ≤1) phase exists, the solubility range of Zr in Fe3Y would pass through most of the phase equilibrium region, which violates the law of phase equilibrium relation. In conclusion, the phase Fe2.9ZrxY1−x (0 ≤ x ≤ 1) is not adopted in this work.
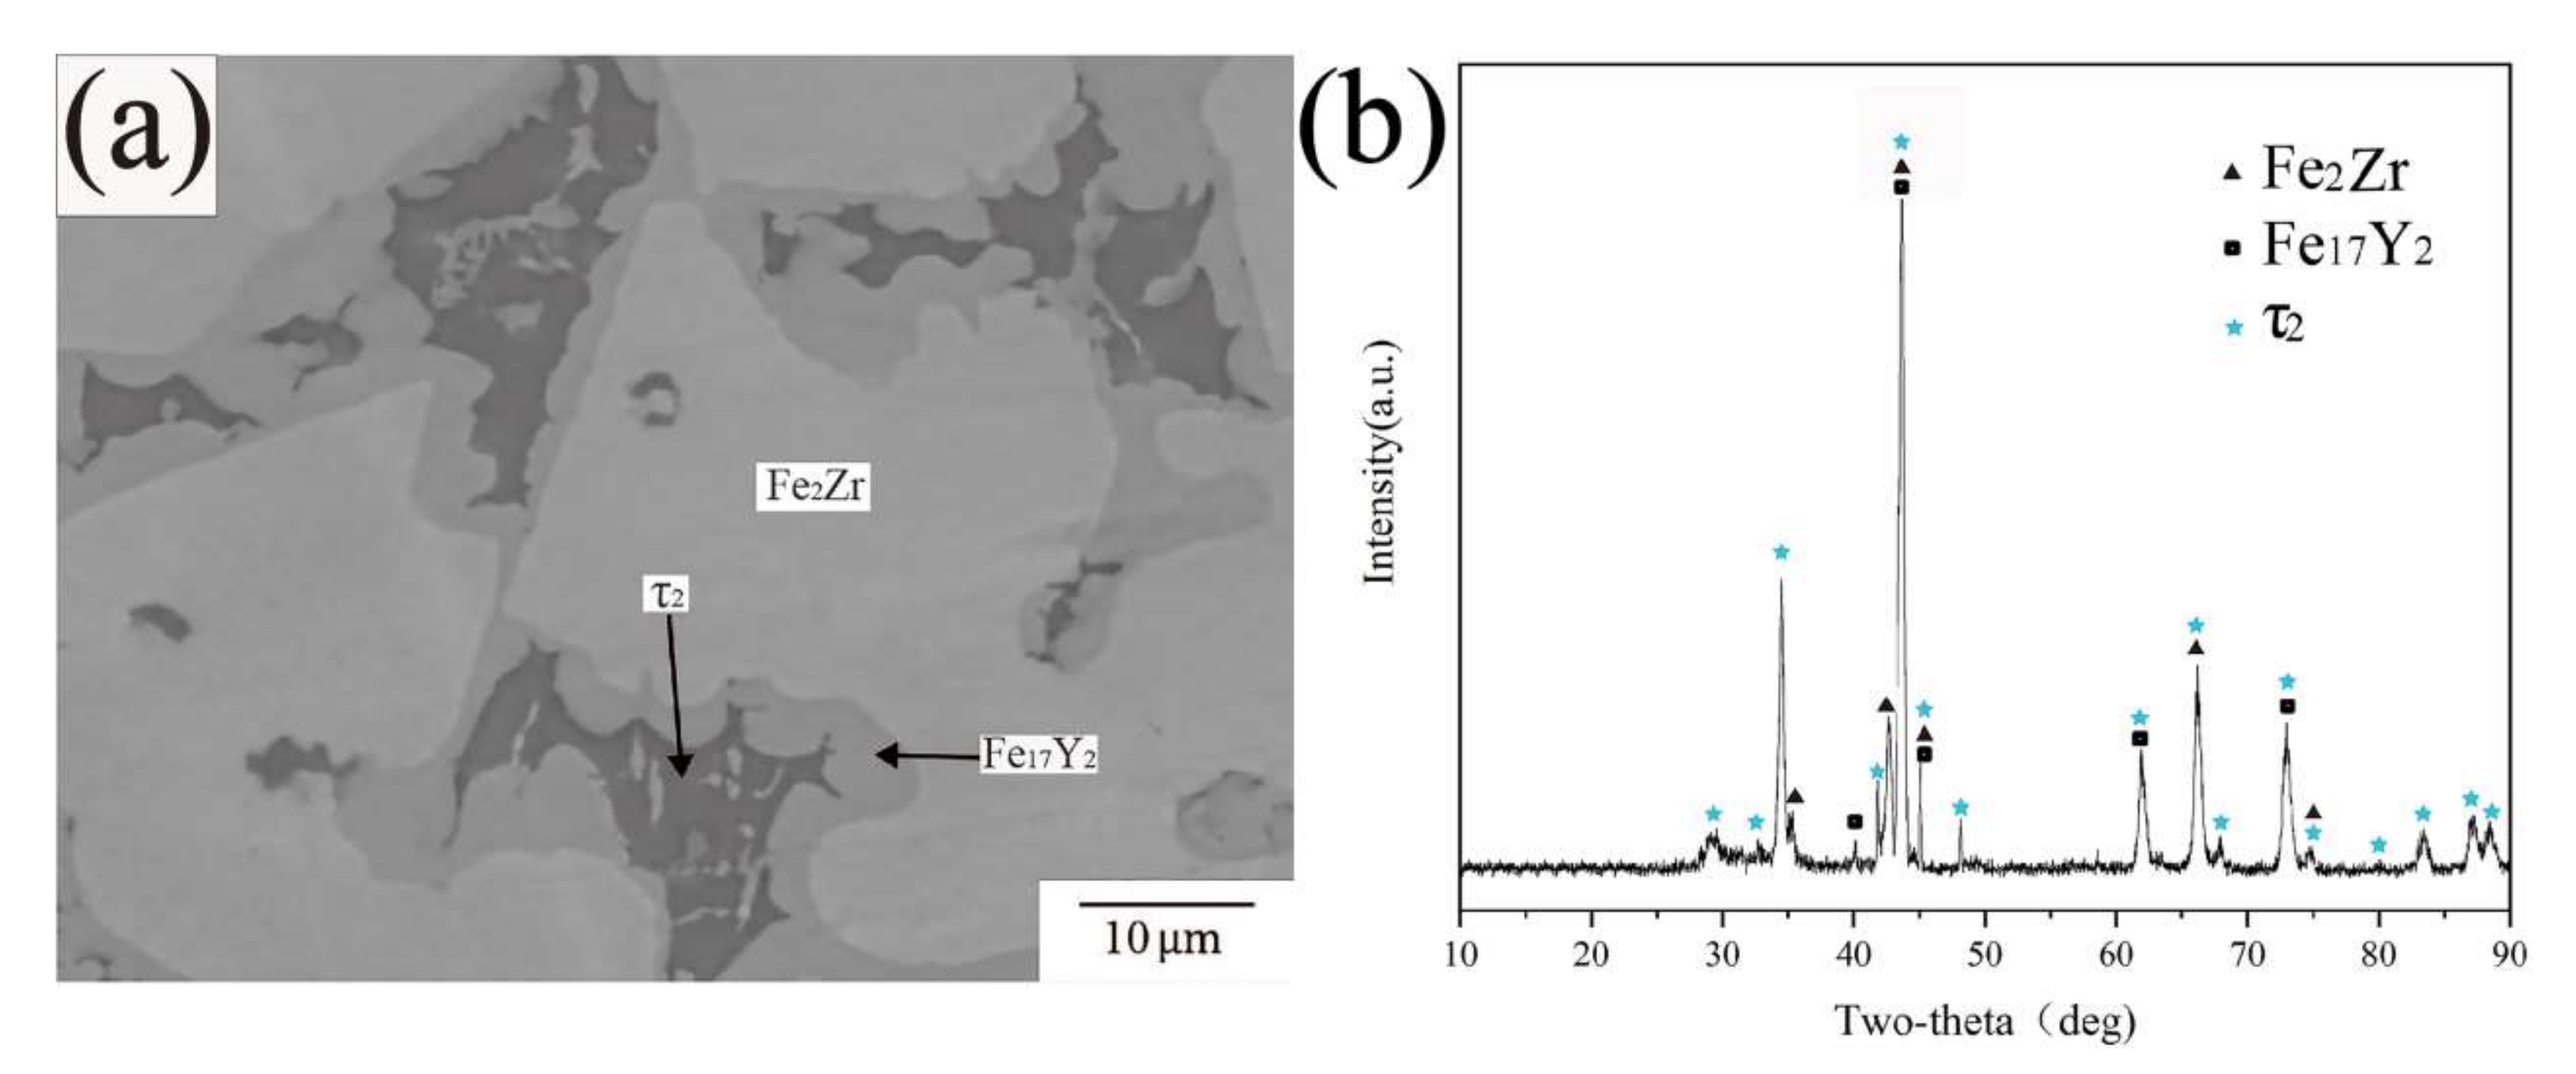
BSE image Figure 10a illustrates the phase composition in alloy A4, which is composed of three phases. The results of EPMA-WDS show the continuously distributed matrix phase and the gray phase had the composition of Fe68.1Zr29.3Y2.6 and Fe88.2Y11.8, and were, respectively, determined as Fe2Zr and Fe17Y2 according to the XRD results of Figure 10b. The black phase labeled τ2 was presumed to be an unknown ternary compound at first, because the diffraction peaks cannot be matched by any PDF card corresponding to the crystal structure of the stable solid phase in the ternary system. However, they are indexed by a ThMn12 type crystal structure and obtain the characteristic peaks of Fe9Zr2Y, which coincide with τ2 in the literature [40]. Therefore, τ2 phase was finally identified as the ternary compound Fe9Zr2Y.
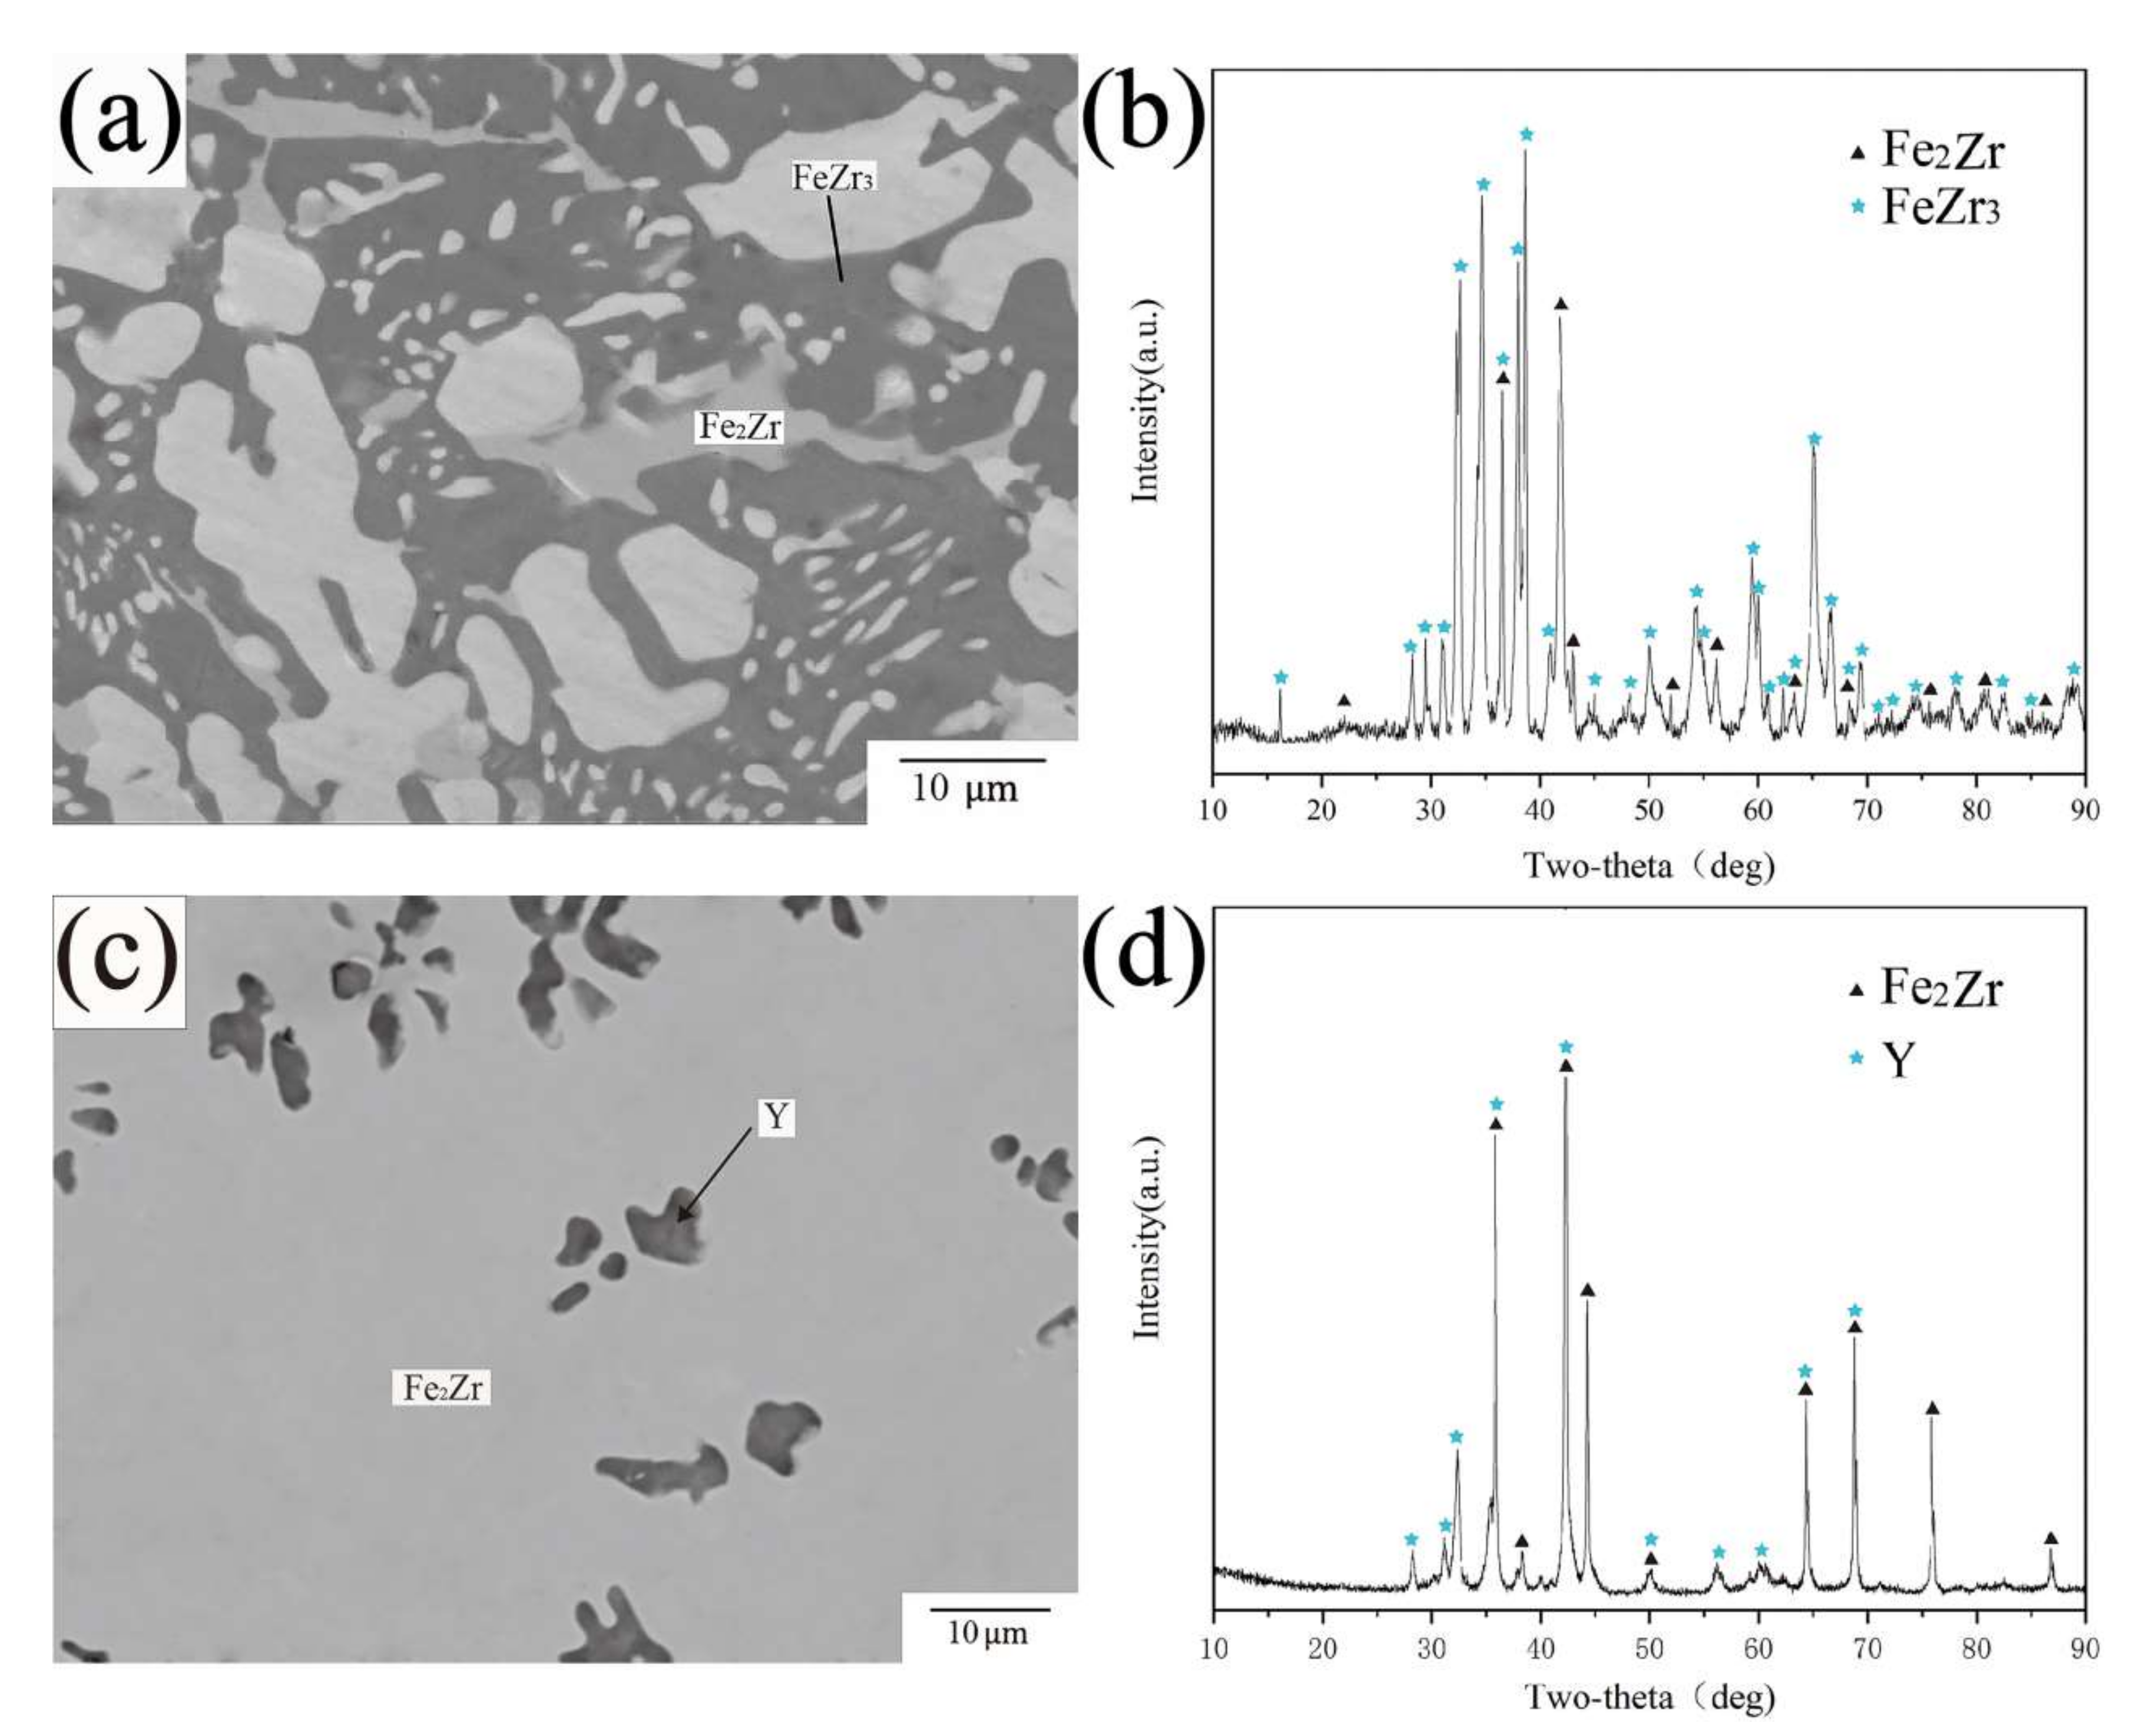
Figure 11 shows the BSE images and XRD patterns of A16 and A18. According to the data from EPMA-WDS, the maximum atomic percentage of Zr in Fe2Zr is 37.6 at 973 K in A16. Combining Figure 11c with Figure 5, it can be seen that Y tends to precipitate in the form of metal simple substance most of the time, which is in accord with the results obtained by Nouri et al. [38] Meanwhile, Y phase is dispersed, indented and porous, which can be mainly ascribed to the result of rapid galvanic corrosion of the (Y), which acts as anode with Continuous-distributed matrix as cathode during polishing (or exposure to the moisture) [38].
4.2. Phase Equilibria at 1073 K
The phase equilibrium of the Fe-Zr-Y ternary system at 1073 K was also investigated in this work. A total of 25 alloy samples were annealed at 1073 K for 60 days. The phases and compositions of each alloy are listed in Table 3.
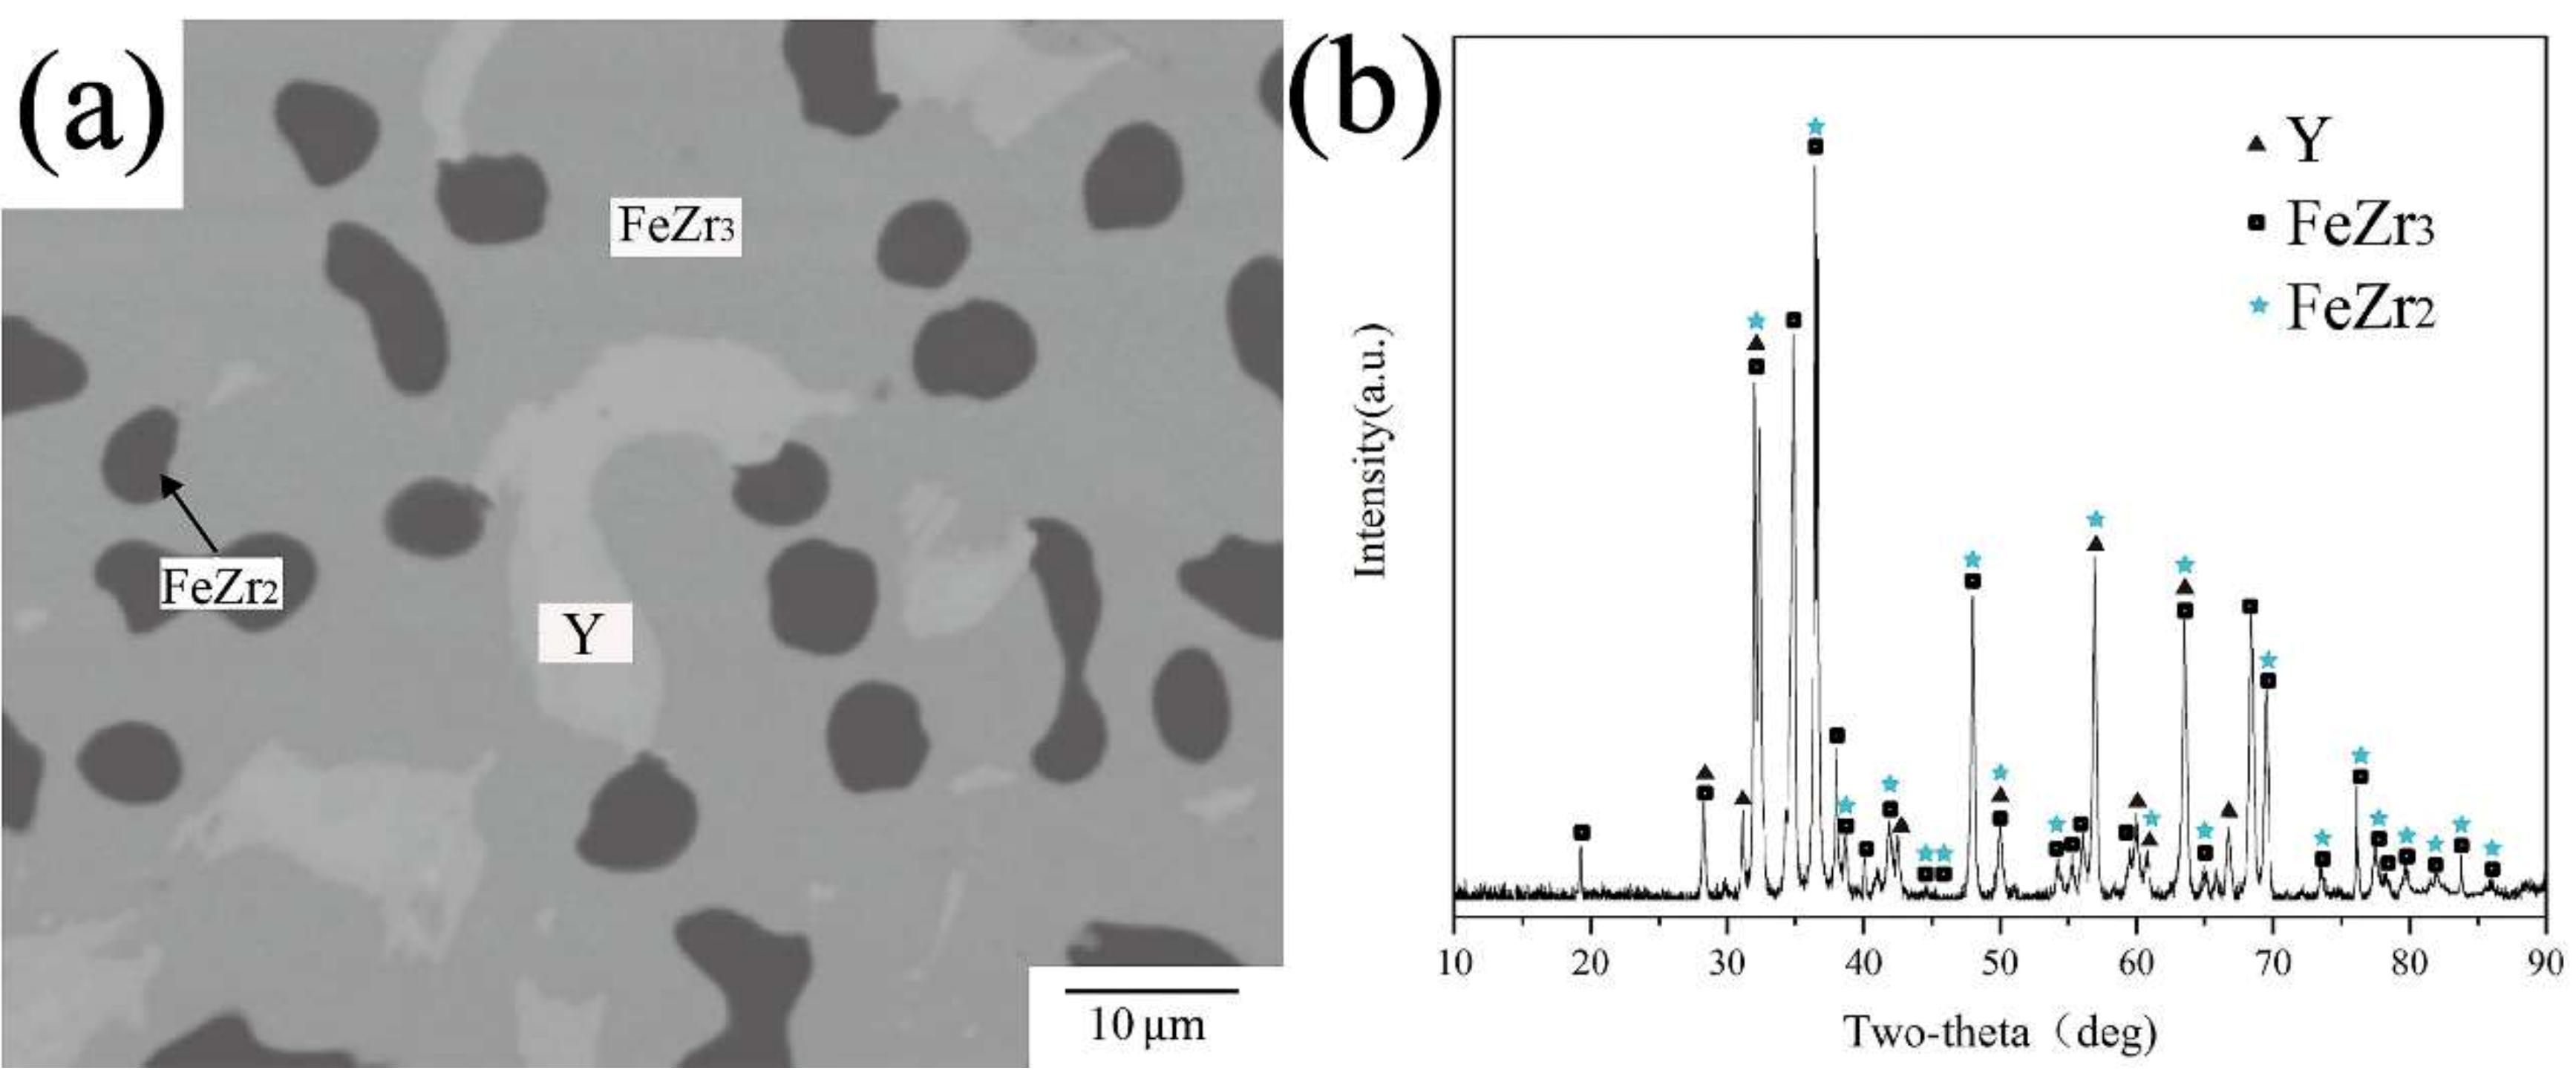
With the increase in temperature, the solid solubility region of τ1 and Fe2Zr becomes larger, and a new high temperature phase FeZr2 appears. This result is consistent with the binary phase diagram of Fe-Zr, but the exact formation temperature of FeZr2 had not been reported to date. The XRD pattern of B23 in Figure 12b shows the same characteristic peaks of FeZr2 as standard PDF cards. Combined with EPMA-WDS data, it can be seen that the dark phase in BSE image Figure 12a is the binary compound FeZr2.
5. Conclusions
In this work, the phase relationship of the Fe-Zr-Y ternary system at 973 K and 1073 K combined with EPMA-EDS, XRD and SEM results was studied systematically. There are twelve and thirteen three-phase regions measured at 973 K and 1073 K, respectively. At 1073 K, the solution ranges of τ1-Fe2.9Zr0.5Y0.5 are from Fe73Zr12Y14 to Fe77Zr9Y13. The maximum solid solubility of Y in Fe2Zr is 4 at.% and atomic ratio of Fe2Zr is from Fe62Zr38 to Fe71Zr29 at 1073 K. New ternary compounds τ3-Fe3ZrY and τ4-Fe10Zr5Y2 were investigated. Those isothermal sections at 1073 K and 973 K provide the possibility of providing a thermodynamic description of the system through the CALPHAD method, allowing more reliable extrapolations of the Fe-Zr-Y system to be used in the nuclear industry.
Author Contributions
Conceptualization, L.Z. and C.L.; methodology, X.Y.; software, Q.H.; validation, Y.W.; formal analysis, C.L. and X.Y.; investigation, C.L. and Q.S.; resources, Q.S. and Q.H.; data curation, C.L.; writing—original draft preparation, Q.S.; writing—review and editing, C.L.; visualization, L.L.; supervision, L.Z.; project administration, L.Z.; funding acquisition, L.Z. All authors have read and agreed to the published version of the manuscript.
Funding
The work was financially supported by National MCF Energy R&D Program of China (No. 2018YFE0306100), National Natural Science Foundation of China (No. 51871248) and Natural Science Foundation of Hunan Province, China (No. 2020JJ4739).
Institutional Review Board Statement
Not applicable.
Informed Consent Statement
Not applicable.
Data Availability Statement
Not applicable.
Conflicts of Interest
The authors declare no conflict of interest.
References
- Celbová, L.; Ashcheulov, P.; Klimša, L.; Kopeček, J.; Dragounová, K.A.; Luštinec, J.; Macák, J.; Škoda, R.; Kratochvílová, I. Diamond Coating Reduces Nuclear Fuel Rod Corrosion at Accidental Temperatures: The Role of Surface Electrochemistry and Semiconductivity. Materials 2021, 14, 6315. [Google Scholar] [CrossRef]
- Diniasi, D.; Golgovici, F.; Marin, A.H.; Negrea, A.D.; Fulger, M.; Demetrescu, I. Long-Term Corrosion Testing of Zy-4 in a LiOH Solution under High Pressure and Temperature Conditions. Materials 2021, 14, 4586. [Google Scholar] [CrossRef]
- Zou, N.; Lu, H.-J.; Liu, L.-L.; He, Y.-L.; Lu, X.-G. Experimental investigation of phase equilibria in the Fe-Hf-Zr system at 1173 K and 1373 K. Calphad 2021, 72, 102240. [Google Scholar] [CrossRef]
- Zhang, H.; Du, Y.; Shen, Z.; Zhou, P.; Peng, Y.; Liu, S.; Kong, Y.; Rajkumar, V.B. Thermodynamic modeling and solidified microstructure in the Mo–Nb–Zr ternary system. Calphad 2019, 66, 101630. [Google Scholar] [CrossRef]
- Zeng, Y.; Zhou, P.; Du, Y.; Mo, W.; Bai, B.; Wang, X.; Zhao, J. A thermodynamic description of the U−Ti−Zr system. Calphad 2018, 60, 90–97. [Google Scholar] [CrossRef]
- Nieva, N.; Corvalán, C.; Jiménez, M.J.; Gómez, A.; Arreguez, C.; Joubert, J.M.; Arias, D. Phase diagram of the Fe-Sn-Zr system at 800 °C. J. Nucl. Mater. 2017, 487, 186–191. [Google Scholar] [CrossRef]
- Wang, Y.; Xu, S.; Jia, H.; Tong, Z.; Zhou, Z. Influence of Zr addition on the microstructure and mechanical properties of 9CrTi-ODS steels. Nucl. Mater. Energy 2021, 29, 101101. [Google Scholar] [CrossRef]
- Gómez-Acebo, T. Summary report of CALPHAD XLII—San Sebastian, Spain, 2013. Calphad 2014, 45, 62–117. [Google Scholar] [CrossRef]
- Li, Z.; Chen, L.; Zhang, H.; Liu, S. High-Temperature Oxidation Properties and Microstructural Evolution of Nanostructure Fe-Cr-Al ODS Alloys. Materials 2021, 14, 526. [Google Scholar] [CrossRef]
- Zhou, X.; Li, G.; Shen, X.; Liu, Y. Tensile strength improvement of martensitic ODS steels with Zr and Hf additions. Mater. Sci. Eng. A 2022, 829, 142071. [Google Scholar] [CrossRef]
- Peng, S.; Lu, Z.; Yu, L. Effects of Y2O3/Ti/Zr addition on microstructure and hardness of ODS-CoCrFeNi HEAs produced by mechanical alloying and spark plasma sintering. J. Alloys Compd. 2021, 861, 157940. [Google Scholar] [CrossRef]
- Chang, K.-C.; Zhao, J.-R.; Hung, F.-Y. Effects of hyper-high-temperature solid-solution treatment on microstructure evolution and nanoprecipitation of the Al-Ni-Cu-Fe-Zr-Sc alloy manufactured by selective laser melting. J. Alloys Compd. 2021, 883, 160781. [Google Scholar] [CrossRef]
- Sundman, B.; Dupin, N.; Hallstedt, B. Algorithms useful for calculating multi-component equilibria, phase diagrams and other kinds of diagrams. Calphad 2021, 75, 102330. [Google Scholar] [CrossRef]
- Malakhova, T.; Alekseyeva, Z. The Zr-Fe phase diagram in the range 20–40 at.% Fe and the crystalline structure of the intermetallic compound Zr3Fe. J. Less Common Met. 1981, 81, 293–300. [Google Scholar] [CrossRef]
- Raghavan, V. Al-Fe-Zr (Aluminum-Iron-Zirconium). J. Phase Equilibria Diffus. 2010, 31, 459–462. [Google Scholar] [CrossRef]
- Liu, Y.; Allen, S.M.; Livingson, J.D. An investigation of Fe3Zr phase. Scr. Metall. Mater. 1995, 32, 1129–1132. [Google Scholar] [CrossRef]
- Granovsky, M.S.; Canay, M.; Lena, E.; Arias, D. Experimental investigation of the Zr corner of theternary Zr–Nb–Fe phase diagram. J. Nucl. Mater. 2002, 302, 1–8. [Google Scholar] [CrossRef]
- Zeng, L.; Xu, G.; Liu, L.; Bai, W.; Zhang, L. Experimental investigation of phase equilibria in the Ti-Fe-Zr system. Calphad 2018, 61, 20–32. [Google Scholar] [CrossRef]
- Ye, J.; Guan, R.; Zhao, H.; He, C.; Xiong, K. Effect of Zr Microalloying on the Microstructures and Strengthening Mechanism of As-Cast Al-Fe-Zr Alloys. Materials 2020, 13, 4744. [Google Scholar] [CrossRef]
- Malakhova, T.O.; Kobylkin, A.N. Phase diagram for Zr-Fe(0-66,6 at.%Fe). Izvestiya Akademii Nauk SSSR Metally 1982, 14, 205–209. [Google Scholar]
- Servant, C.; Gueneau, C.; Ansara, I. Experimental and thermodynamic assessment of the Fe-Zr system. J. Alloys Compd. 1995, 220, 19–26. [Google Scholar] [CrossRef]
- Saenko, I.; Kuprava, A.; Udovsky, A.; Fabrichnaya, O. Heat capacity measurement of Zr2Fe and thermodynamic re-assessment of the Fe–Zr system. Calphad 2019, 66, 101625. [Google Scholar] [CrossRef]
- Jiang, M.; Oikawa, K.; Ikeshoji, T.; Wulff, L.; Ishida, K. Thermodynamic Calculations of Fe-Zr and Fe-Zr-C Systems. J. Phase Equilibria Diffus. 2000, 22, 406–417. [Google Scholar] [CrossRef]
- Zou, N.; Lu, H.-J.; Gu, P.-W.; Wang, J.-Y.; Feng, X.-K.; Shen, J.-Y.; He, Y.-L.; Li, L.; Lu, X.-G. Thermodynamic assessment and glass forming ability prediction of the Zr-Fe-Cu system. Calphad 2019, 64, 175–184. [Google Scholar] [CrossRef]
- Rigaud, V.; Sundman, B.; Daloz, D.; Lesoult, G. Thermodynamic assessment of the Fe–Al–Zr phase diagram. Calphad 2009, 33, 442–449. [Google Scholar] [CrossRef]
- Cui, J.; Shen, Y.; Liu, X. Experimental investigation and thermodynamic modeling of the Fe−Si−Zr system. Calphad 2019, 65, 385–401. [Google Scholar] [CrossRef]
- Kai, K.; Nakamichi, T.; Yamamoto, M. Crystal Structures and Magnetic Properties of the Intermetallic Compnd Fe2Zr. J. Phys. Soc. 1968, 25, 1192. [Google Scholar] [CrossRef]
- Stein, F.; Sauthoff, G.; Palm, M. Experimental Determination of Intermetallic Phases, Phase Equilibria, and Invariant Reaction Temperatures in the Fe-Zr System. J. Phase Equilibria Diffus. 2002, 23, 480–494. [Google Scholar] [CrossRef]
- Yang, Y.; Tan, L.; Bei, H.; Busby, J.T. Thermodynamic modeling and experimental study of the Fe–Cr–Zr system. J. Nucl. Mater. 2013, 441, 190–202. [Google Scholar] [CrossRef]
- Lu, H.-J.; Zou, N.; Zhao, X.-S.; Shen, J.-Y.; Lu, X.-G.; He, Y.-L. Thermodynamic investigation of the Zr-Fe-Nb system and its applications. Intermetallics 2017, 88, 91–100. [Google Scholar] [CrossRef]
- Domagala, R.F.; Rausch, J.J.; Levinson, D.W. The systems Y-Fe, Y-Ni, and Y-Cu. Trans. Am. Soc. Met. 1961, 53, 139–155. [Google Scholar]
- Gschneidner, K.A., Jr. Rare Earth Alloys; D. Van Nostrand Company Inc.: Princeton, NJ, USA, 1961; Volume 60, p. 247. [Google Scholar]
- Zhang, W.; Liu, G.; Han, K. The Fe-Y (iron-yttrium) system. J. Phase Equilibria 1992, 13, 304–308. [Google Scholar] [CrossRef]
- Saenko, I.; Fabrichnaya, O.; Udovsky, A. New Thermodynamic Assessment of the Fe-Y System. J. Phase Equilibria Diffus. 2017, 38, 684–699. [Google Scholar] [CrossRef]
- Wang, R. Formation of metastable low temperature allotropie solid solutions in rare earth-zirconium systems. Metall. Trans. 1972, 3, 1213–1221. [Google Scholar] [CrossRef]
- Palenzona, A.; Cirafici, S. The Y-Zr (yttrium-zirconium) system. J. Phase Equilibria 1991, 12, 485–489. [Google Scholar] [CrossRef]
- Flandorfer, H.; Gröbner, J.; Stamou, A.; Hassiotis, N.; Saccone, A.; Rogl, P.; Wouters, R.; Seifert, H.; Macciò, D.; Ferro, R. Experimental investigation and thermodynamic calculation of the ternary system Mn–Y–Zr. Int. J. Mater. Res. 1997, 88, 529–538. [Google Scholar]
- Bu, M.J.; Wang, P.S.; Xu, H.H.; Liu, S.H.; Sha, C.S.; Du, Y.; Pan, F.S.; Tang, A.T. Experimental investigation and thermodynamic modeling of the Zr-Y system. J. Min. Metall. Sect. B Metall. 2010, 46, 181–192. [Google Scholar] [CrossRef]
- Harchenko, O.I.; Berezyuk, D.A.; Kryshtal, M.I. Ternary (Y,Ce)-Zr-Fe systems. Visn. L'vivs'kogo (Derzhavnogo) Univ. Seriya Khimichna 1984, 25, 26–28. [Google Scholar]
- Jifan, H.; Mingxi, L.; Rufeng, X.; Shougong, Z.; Zhenxi, W. Formation of Magnetic Phases in Y-Zr-Fe Compounds. Phys. Stat. Sol. 1989, 113, 127–129. [Google Scholar]
- Itoh, K.; Okagaki, T.; Kanematsu, K. Crystal Structure and Magnetic Properties of Y1-xZrxFe2.9. J. Phys. Soc. 1989, 58, 1787–1792. [Google Scholar] [CrossRef]
- Villars, P. Pearson’s Handbook Desk Edition: C. Data for Intermetallic Phases, volume 2. ASM Int. 1997, 1, 1143. [Google Scholar]
- Nouri, K.; Jemmali, M.; Walha, S.; Salah, A.B.; Dhahri, E.; Bessais, L. Experimental investigation of the Y-Fe-Ga ternary phase diagram: Phase equilibria and new isothermal section at 800 °C. J. Alloys Compd. 2017, 719, 256–263. [Google Scholar] [CrossRef]
Figure 1.
The calculated Fe-Zr phase diagram based on the work of Lu et al. [30].
Figure 1.
The calculated Fe-Zr phase diagram based on the work of Lu et al. [30].

Figure 2.
The calculated Fe-Y phase diagram based on the work of Saenko et al. [34].
Figure 2.
The calculated Fe-Y phase diagram based on the work of Saenko et al. [34].

Figure 3.
The calculated Y-Zr phase diagram based on the work of Bu et al. [38].
Figure 3.
The calculated Y-Zr phase diagram based on the work of Bu et al. [38].

Figure 4.
The 1070K isothermal section of the Fe-Zr-Y ternary system [39].
Figure 4.
The 1070K isothermal section of the Fe-Zr-Y ternary system [39].

Figure 5.
Isothermal section of the Fe-Zr-Y ternary system at 973 K determined in this work.

Figure 6.
Isothermal section of the Fe-Zr-Y ternary system at 1073 K obtained in this work.

Figure 7.
(a) BSE image of A13 (b) XRD pattern of A13 (c) BSE image of A1 of A24 (d) XRD pattern of A24 (e) BSE image of A7 (f) XRD pattern of A7.
Figure 7.
(a) BSE image of A13 (b) XRD pattern of A13 (c) BSE image of A1 of A24 (d) XRD pattern of A24 (e) BSE image of A7 (f) XRD pattern of A7.

Figure 8.
(a) BSE image of A2 (b) XRD pattern of A2 (c) BSE image of A9 (d) XRD pattern of A9.

Figure 9.
(a) BSE image of A5 (b) XRD pattern of A5 (c) BSE image of A17 (d) XRD pattern of A17 (e) BSE image of A10 (f) XRD pattern of A10.
Figure 9.
(a) BSE image of A5 (b) XRD pattern of A5 (c) BSE image of A17 (d) XRD pattern of A17 (e) BSE image of A10 (f) XRD pattern of A10.

Figure 10.
(a) BSE image of A4 (b) XRD pattern of A4.

Figure 11.
(a) BSE image of A16 (b) XRD pattern of A16 (c) BSE image of A18 (d) XRD pattern of A18.

Figure 12.
(a) BSE image of B23 (b) XRD pattern of B23.


Table 1.
Experimental and literature data on crystal structures and lattice parameters of the solid phases in the Fe-Zr-Y system.
Table 1.
Experimental and literature data on crystal structures and lattice parameters of the solid phases in the Fe-Zr-Y system.
| Phase | Phase Prototype | Space Group | Lattice Parameters (nm) | Reference | ||
|---|---|---|---|---|---|---|
| a | b | c | ||||
| α (Fe) | W | m | 0.29315 | / | / | [42] |
| δ (Fe) | W | m | 0.29315 | / | / | [42] |
| β (Zr) | W | m | 0.3568 | / | / | [42] |
| γ (Fe) | Cu | m | 0.36599 | / | / | [42] |
| α (Zr) | Mg | P63/mmc | 0.323178 | / | 0.514831 | [28] |
| Fe2Zr_C15 | MgCu2 | m | 0.702 | / | / | [28] |
| Fe23Zr6 | Mn23Th6 | m | 1.172 | / | / | [28] |
| FeZr2 | Al2Cu | I4/mcm | 0.638 | / | 0.56 | [28] |
| FeZr3 | BRe3 | Cmcm | 0.332 | 1.1 | 0.882 | [28] |
| Fe17Y2 | Th2Zn17 | m | 0.846 | / | 1.241 | [43] |
| Fe23Y6 | Th6Mn23 | m | 1.2082 | / | / | [43] |
| Fe3Y | PuNi3 | m | 0.515 | / | 2.46 | [43] |
| Fe2Y | MgCu2 | m | 7.363 | / | / | [43] |
| Fe9Zr2Y | ThMn12 | I4/mmm | 0.8662 | 0.8662 | 0.50226 | [40] |
| Fe2.9Zr0.5Y0.5 | / | / | 0.5067 | 0.8634 | 2.451 | [41] |
Table 2.
Constituent phases and compositions in the annealed Fe-Zr-Y alloys at 973 K for 90 days.
| Alloy (No.) | Chemical Composition | Nominal Composition (at.%) | Experimental Results (at.%) | Phase Determination | ||||
|---|---|---|---|---|---|---|---|---|
| Fe | Zr | Y | Fe | Zr | Y | |||
| A1 | Fe10Zr70Y20 | 10 | 70 | 20 | 62.61 | 37.23 | 0.16 | Fe2Zr |
| 24.35 | 74.42 | 1.23 | FeZr3 | |||||
| 0.29 | 0.13 | 99.58 | Y | |||||
| A2 | Fe60Zr30Y10 | 60 | 30 | 10 | 59.22 | 24.46 | 16.32 | τ3 |
| 59.77 | 29.61 | 10.62 | τ4 | |||||
| 65.85 | 31.84 | 2.31 | Fe2Zr | |||||
| A3 | Fe10Zr60Y30 | 10 | 60 | 30 | 23.31 | 75.16 | 1.53 | FeZr3 |
| 2.81 | 95.82 | 1.37 | Zr | |||||
| 98.87 | 0.15 | 0.98 | Y | |||||
| A4 | Fe77Zr16Y7 | 77 | 16 | 7 | 68.14 | 29.31 | 2.55 | Fe2Zr |
| 75.81 | 16.12 | 8.07 | τ2 | |||||
| 88.24 | 0.21 | 11.55 | Fe17Y2 | |||||
| A5 | Fe80Zr4Y16 | 80 | 4 | 16 | 75.49 | 10.12 | 14.39 | τ1 |
| 78.74 | 0.28 | 20.98 | Fe23Y6 | |||||
| 88.26 | 0.17 | 11.57 | Fe17Y2 | |||||
| A6 | Fe45Zr20Y35 | 45 | 20 | 35 | 57.34 | 23.89 | 18.77 | τ3 |
| 56.54 | 27.75 | 15.71 | τ4 | |||||
| 0.21 | 0.16 | 99.63 | Y | |||||
| A7 | Fe50Zr10Y40 | 50 | 10 | 40 | 59.14 | 21.3 | 19.56 | τ3 |
| 99.54 | 0.16 | 0.30 | Y | |||||
| 65.35 | 3.34 | 31.31 | Fe2Y | |||||
| A8 | Fe65Zr20Y15 | 65 | 20 | 15 | 65.86 | 31.84 | 2.30 | Fe2Zr |
| 61.11 | 22.54 | 16.35 | τ3 | |||||
| 65.38 | 3.36 | 31.26 | Fe2Y | |||||
| A9 | Fe55Zr30Y15 | 55 | 30 | 15 | 62.51 | 35.48 | 2.01 | Fe2Zr |
| 57.17 | 29.6 | 13.23 | τ4 | |||||
| 0.11 | 0.25 | 99.64 | Y | |||||
| A10 | Fe70Zr15Y15 | 70 | 15 | 15 | 74.62 | 11.77 | 13.61 | τ1 |
| 65.34 | 2.74 | 31.92 | Fe2Y | |||||
| 66.54 | 30.86 | 2.60 | Fe2Zr | |||||
| A11 | Fe62Zr32Y6 | 62 | 32 | 6 | 65.13 | 33.11 | 1.76 | Fe2Zr |
| 59.35 | 30.36 | 10.29 | τ4 | |||||
| A12 | Fe20Zr60Y20 | 20 | 60 | 20 | 0.15 | 0.24 | 99.61 | Y |
| 23.59 | 74.42 | 1.99 | FeZr3 | |||||
| A13 | Fe61Zr25Y14 | 61 | 25 | 14 | 59.44 | 24.42 | 16.14 | τ3 |
| 65.87 | 31.82 | 2.31 | Fe2Zr | |||||
| A14 | FeZr74Y25 | 1 | 74 | 25 | 1.52 | 96.93 | 1.55 | Zr |
| 0.14 | 0.18 | 99.68 | Y | |||||
| A15 | Fe15Zr84Y | 15 | 84 | 1 | 1.19 | 95.92 | 2.89 | Zr |
| 23.21 | 75.96 | 0.83 | FeZr3 | |||||
| A16 | Fe29Zr70Y | 29 | 70 | 1 | 24.33 | 74.41 | 1.26 | FeZr3 |
| 62.45 | 37.44 | 0.11 | Fe2Zr | |||||
| A17 | Fe75Zr6Y19 | 75 | 6 | 19 | 74.71 | 9.69 | 15.6 | τ1 |
| 75.33 | 0.25 | 24.42 | Fe3Y | |||||
| 78.75 | 0.33 | 20.92 | Fe23Y6 | |||||
| A18 | Fe55Zr30Y15 | 55 | 30 | 15 | 62.31 | 35.87 | 1.82 | Fe2Zr |
| 0.34 | 0.13 | 99.53 | Y | |||||
| A19 | Fe50Zr25Y25 | 50 | 25 | 25 | 56.25 | 27.91 | 15.84 | τ4 |
| 0.21 | 0.11 | 99.68 | Y | |||||
| A20 | Fe39ZrY60 | 39 | 1 | 60 | 65.45 | 1.86 | 32.69 | Fe2Y |
| 0.24 | 0.23 | 99.53 | Y | |||||
| A21 | Fe70ZrY29 | 70 | 1 | 29 | 66.87 | 0.16 | 32.97 | Fe2Y |
| 73.41 | 0.54 | 26.05 | Fe3Y | |||||
| A22 | Fe66Zr10Y24 | 66 | 10 | 24 | 65.66 | 2.74 | 31.6 | Fe2Y |
| 66.35 | 30.82 | 2.83 | Fe2Zr | |||||
| A23 | Fe4Zr8Y88 | 4 | 8 | 88 | 80.33 | 19.37 | 0.30 | Fe23Zr6 |
| 88.21 | 0.15 | 11.64 | Fe17Y2 | |||||
| 98.56 | 0.74 | 0.70 | Fe | |||||
| A24 | Fe60Zr18Y22 | 60 | 18 | 22 | 65.39 | 3.18 | 31.43 | Fe2Y |
| 60.25 | 21.24 | 18.51 | τ3 | |||||
Table 3.
Constituent phases and compositions in the annealed Fe-Zr-Y alloys at 1073 K for 60 days.
| Alloy (No.) | Chemical Composition | Nominal Composition (at.%) | Experimental Results (at.%) | Phase Determination | ||||
|---|---|---|---|---|---|---|---|---|
| Fe | Zr | Y | Fe | Zr | Y | |||
| B1 | Fe10Zr70Y20 | 10 | 70 | 20 | 62.21 | 37.72 | 0.07 | Fe2Zr |
| 31.72 | 67.37 | 0.91 | FeZr2 | |||||
| 0.13 | 0.21 | 99.66 | Y | |||||
| B2 | Fe60Zr30Y10 | 60 | 30 | 10 | 59.25 | 24.41 | 16.34 | τ3 |
| 59.73 | 29.66 | 10.61 | τ4 | |||||
| 65.42 | 31.21 | 3.37 | Fe2Zr | |||||
| B3 | Fe10Zr60Y30 | 10 | 60 | 30 | 24.34 | 74.48 | 1.18 | FeZr3 |
| 93.86 | 3.84 | 2.3 | Zr | |||||
| 0.35 | 0.13 | 99.52 | Y | |||||
| B4 | Fe77Zr16Y7 | 77 | 16 | 7 | 68.15 | 29.33 | 2.52 | Fe2Zr |
| 75.84 | 16.17 | 7.99 | τ2 | |||||
| 88.25 | 0.16 | 11.59 | Fe17Y2 | |||||
| B5 | Fe80Zr4Y16 | 80 | 4 | 16 | 77.48 | 9.59 | 12.93 | τ1 |
| 78.77 | 0.27 | 20.96 | Fe23Y6 | |||||
| 88.22 | 0.15 | 11.63 | Fe17Y2 | |||||
| B6 | Fe45Zr20Y35 | 45 | 20 | 35 | 57.63 | 22.74 | 19.63 | τ3 |
| 56.54 | 27.70 | 15.76 | τ4 | |||||
| 0.12 | 0.25 | 99.63 | Y | |||||
| B7 | Fe50Zr10Y40 | 50 | 10 | 40 | 58.29 | 20.01 | 21.7 | τ3 |
| 0.35 | 0.16 | 99.49 | Y | |||||
| 65.31 | 3.36 | 31.33 | Fe2Y | |||||
| B8 | Fe65Zr20Y15 | 65 | 20 | 15 | 65.47 | 31.28 | 3.25 | Fe2Zr |
| 60.55 | 21.16 | 18.29 | τ3 | |||||
| 65.34 | 12.61 | 22.05 | Fe2Y | |||||
| B9 | Fe55Zr30Y15 | 55 | 30 | 15 | 61.89 | 34.82 | 3.29 | Fe2Zr |
| 56.68 | 28.8 | 14.52 | τ4 | |||||
| 0.51 | 0.20 | 99.29 | Y | |||||
| B10 | Fe70Zr15Y15 | 70 | 15 | 15 | 73.14 | 12.48 | 14.38 | τ1 |
| 65.33 | 2.71 | 31.96 | Fe2Y | |||||
| 66.59 | 30.65 | 2.76 | Fe2Zr | |||||
| B11 | Fe62Zr32Y6 | 62 | 32 | 6 | 63.23 | 32.45 | 4.32 | Fe2Zr |
| 10.28 | 30.79 | 58.93 | τ4 | |||||
| B12 | Fe20Zr60Y20 | 20 | 60 | 20 | 0.41 | 0.38 | 99.21 | Y |
| 1.73 | 75.2 | 23.07 | FeZr3 | |||||
| B13 | Fe61Zr25Y14 | 61 | 25 | 14 | 60.17 | 23.12 | 16.71 | τ3 |
| 65.54 | 31.35 | 3.11 | Fe2Zr | |||||
| B14 | FeZr74Y25 | 1 | 74 | 25 | 1.81 | 96.55 | 1.64 | Zr |
| 0.15 | 0.25 | 99.6 | Y | |||||
| B15 | Fe15Zr84Y | 15 | 84 | 1 | 0.87 | 94.83 | 4.3 | Zr |
| 22.61 | 76.52 | 0.87 | FeZr3 | |||||
| B16 | Fe29Zr70Y | 29 | 70 | 1 | 24.45 | 74.89 | 0.66 | FeZr3 |
| 31.31 | 68.61 | 0.08 | FeZr2 | |||||
| B17 | Fe75Zr6Y19 | 75 | 6 | 19 | 75.74 | 9.57 | 14.69 | τ1 |
| 75.31 | 0.36 | 24.33 | Fe3Y | |||||
| 77.51 | 0.85 | 21.64 | Fe23Y6 | |||||
| B18 | Fe55Zr30Y15 | 55 | 30 | 15 | 61.94 | 36.13 | 1.93 | Fe2Zr |
| 0.10 | 0.21 | 99.69 | Y | |||||
| B19 | Fe50Zr25Y25 | 50 | 25 | 25 | 56.24 | 28.29 | 15.47 | τ4 |
| 0.32 | 0.15 | 99.53 | Y | |||||
| B20 | Fe39ZrY60 | 39 | 1 | 60 | 65.41 | 1.81 | 32.78 | Fe2Y |
| 0.14 | 0.32 | 99.54 | Y | |||||
| B21 | Fe70ZrY29 | 70 | 1 | 29 | 66.96 | 32.52 | 0.52 | Fe2Y |
| 75.06 | 0.10 | 24.84 | Fe3Y | |||||
| B22 | Fe66Zr10Y24 | 66 | 10 | 24 | 65.54 | 3.36 | 31.1 | Fe2Y |
| 66.11 | 30.91 | 2.98 | Fe2Zr | |||||
| B23 | Fe20Zr60Y20 | 20 | 60 | 20 | 22.95 | 75.47 | 1.58 | FeZr3 |
| 0.13 | 0.13 | 99.74 | Y | |||||
| 31.20 | 68.64 | 0.16 | FeZr2 | |||||
| B24 | Fe84.5Zr12.5Y3 | 84.5 | 12.5 | 3 | 80.31 | 19.61 | 0.08 | Fe23Zr6 |
| 88.87 | 0.83 | 10.3 | Fe17Y2 | |||||
| 99.15 | 0.17 | 0.68 | Fe | |||||
| B25 | Fe60Zr18Y22 | 60 | 18 | 22 | 65.32 | 3.37 | 31.31 | Fe2Y |
| 59.21 | 20.29 | 20.5 | τ3 | |||||
Publisher’s Note: MDPI stays neutral with regard to jurisdictional claims in published maps and institutional affiliations. |
© 2022 by the authors. Licensee MDPI, Basel, Switzerland. This article is an open access article distributed under the terms and conditions of the Creative Commons Attribution (CC BY) license (https://creativecommons.org/licenses/by/4.0/).
Share and Cite
MDPI and ACS Style
Li, C.; Song, Q.; Yang, X.; Wei, Y.; Hu, Q.; Liu, L.; Zhang, L. Experimental Investigation of the Phase Relations in the Fe-Zr-Y Ternary System. Materials 2022, 15, 593. https://0-doi-org.brum.beds.ac.uk/10.3390/ma15020593
AMA Style
Li C, Song Q, Yang X, Wei Y, Hu Q, Liu L, Zhang L. Experimental Investigation of the Phase Relations in the Fe-Zr-Y Ternary System. Materials. 2022; 15(2):593. https://0-doi-org.brum.beds.ac.uk/10.3390/ma15020593
Chicago/Turabian StyleLi, Chenbo, Qian Song, Xianwen Yang, Yuduo Wei, Qi Hu, Libin Liu, and Ligang Zhang. 2022. "Experimental Investigation of the Phase Relations in the Fe-Zr-Y Ternary System" Materials 15, no. 2: 593. https://0-doi-org.brum.beds.ac.uk/10.3390/ma15020593
Note that from the first issue of 2016, this journal uses article numbers instead of page numbers. See further details here.