
Investigation on Water Transformation and Pore Structure of Cement-Stabilized Dredged Sediment Based on NMR Technology

 ,
,
Abstract
:1. Introduction
2. Materials and Methods
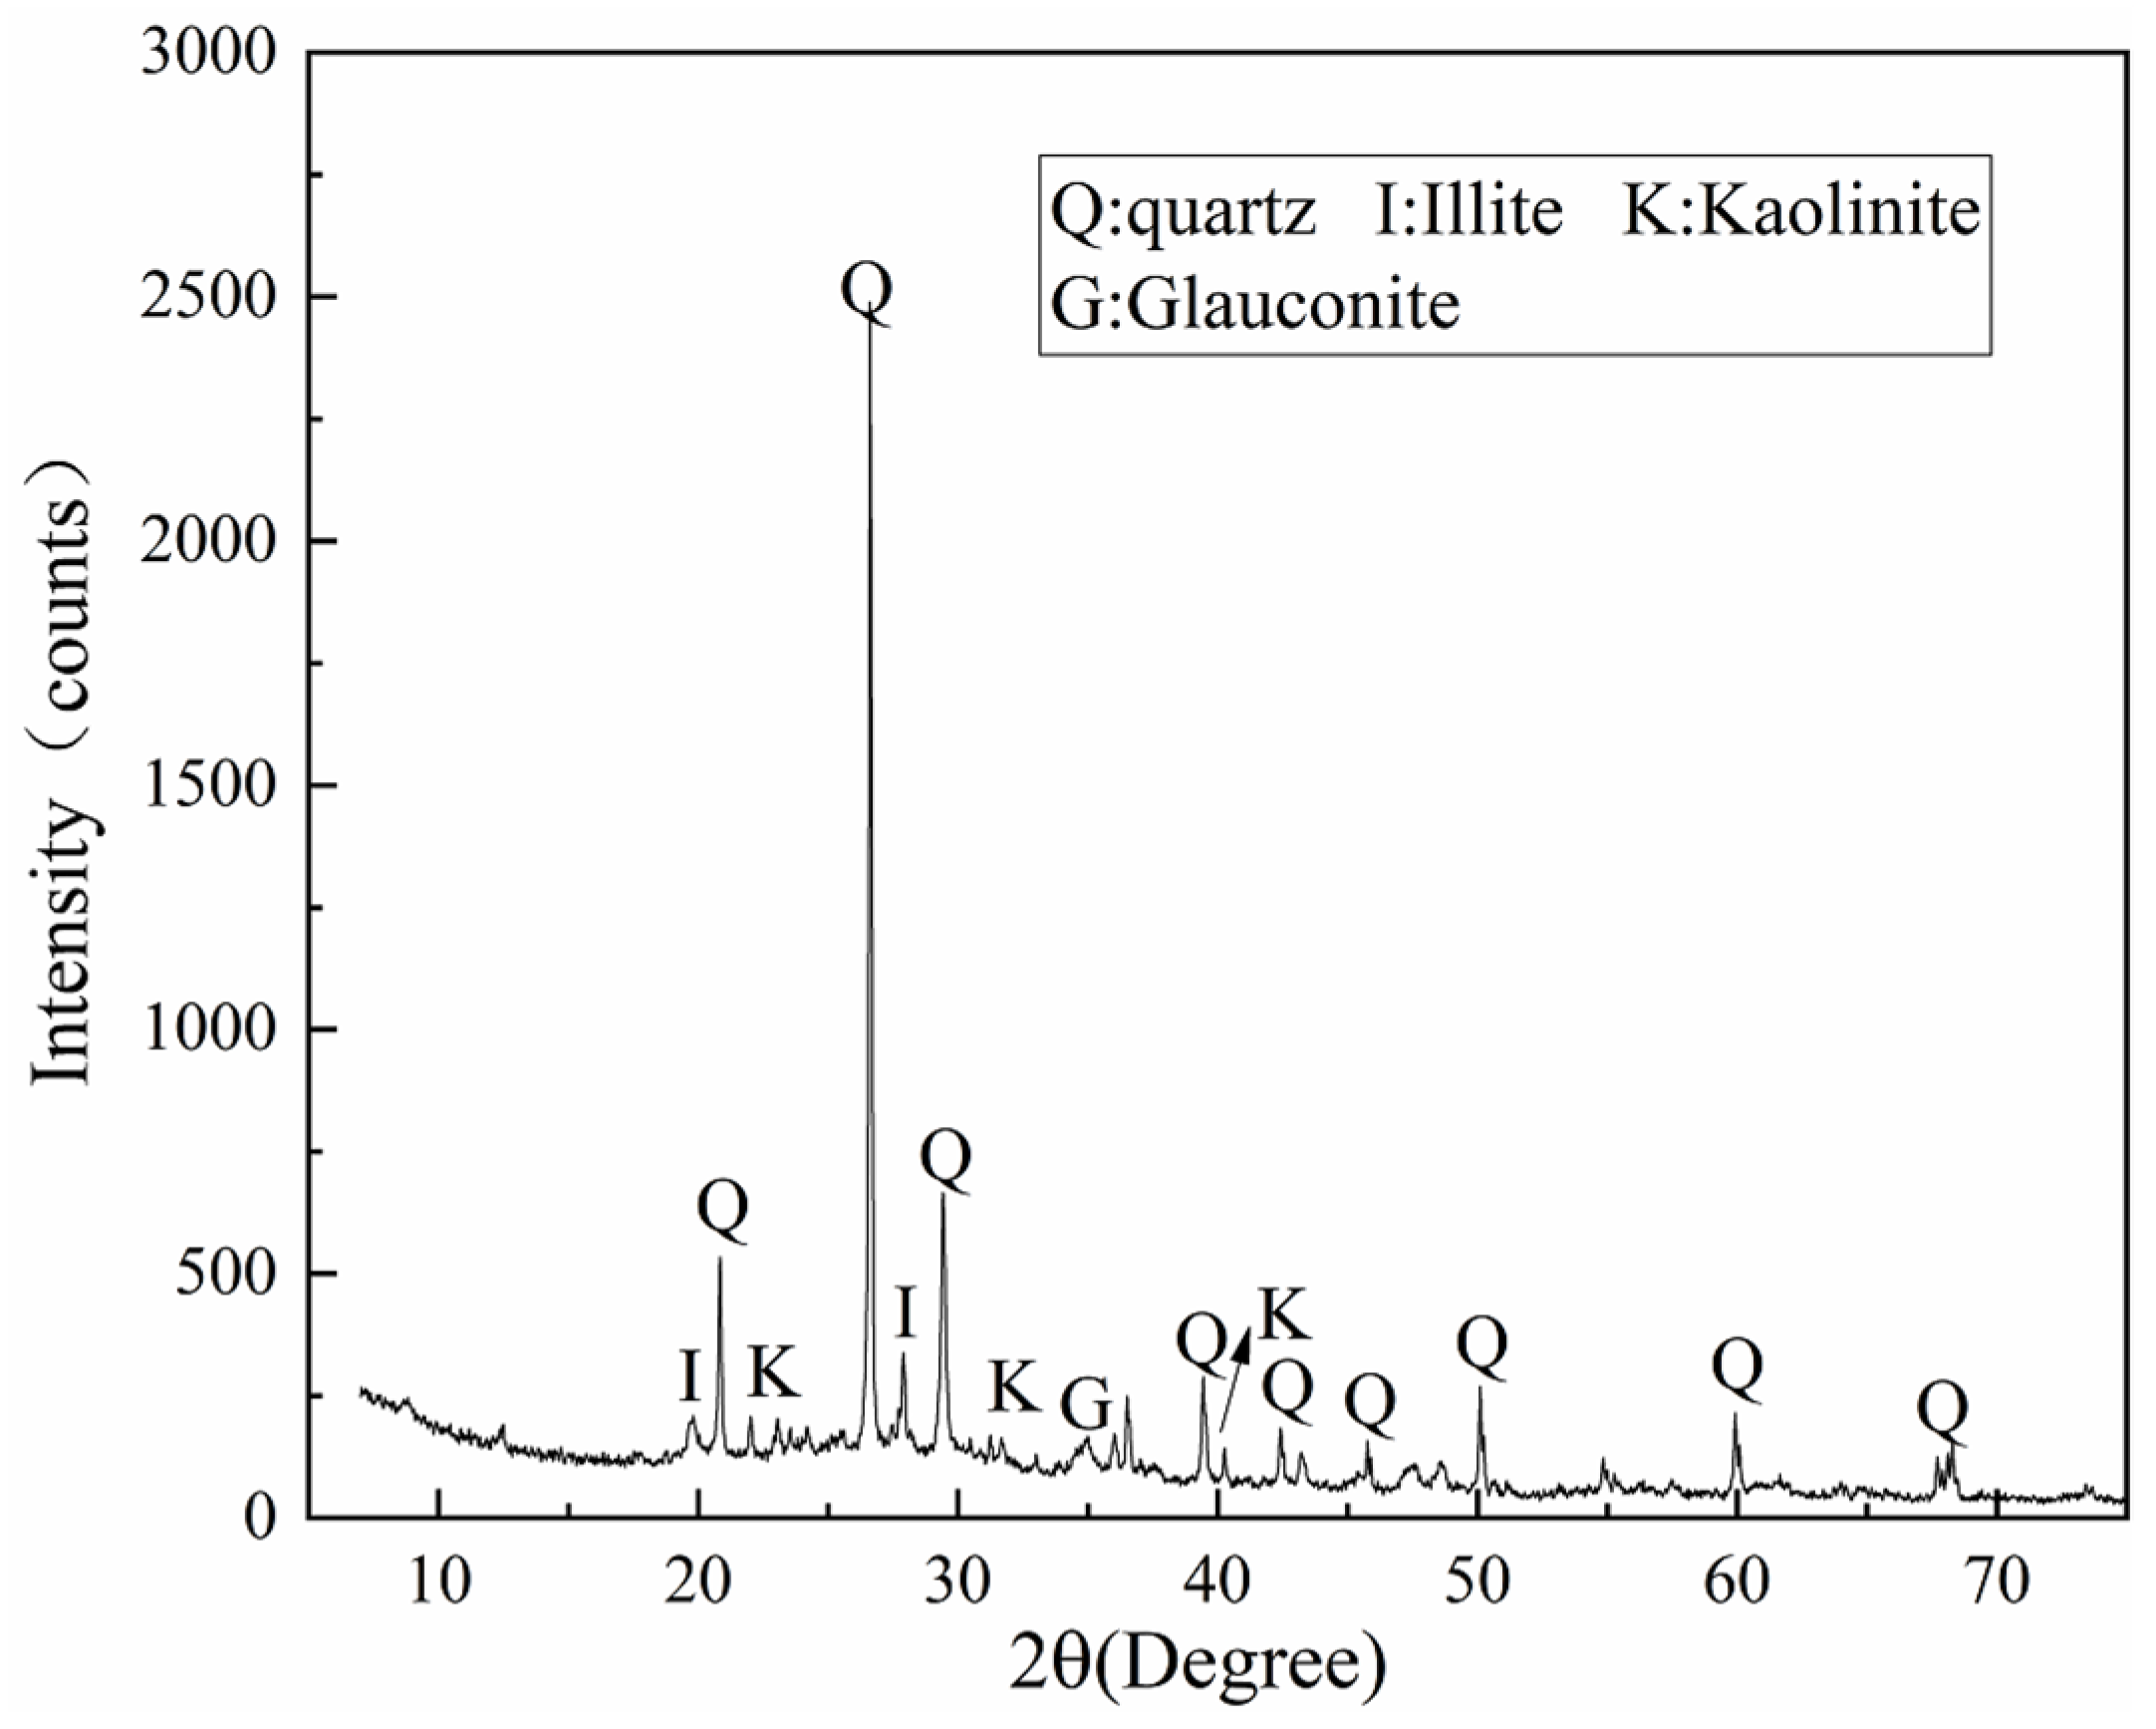
2.1. Raw Materials
2.2. Testing Methods
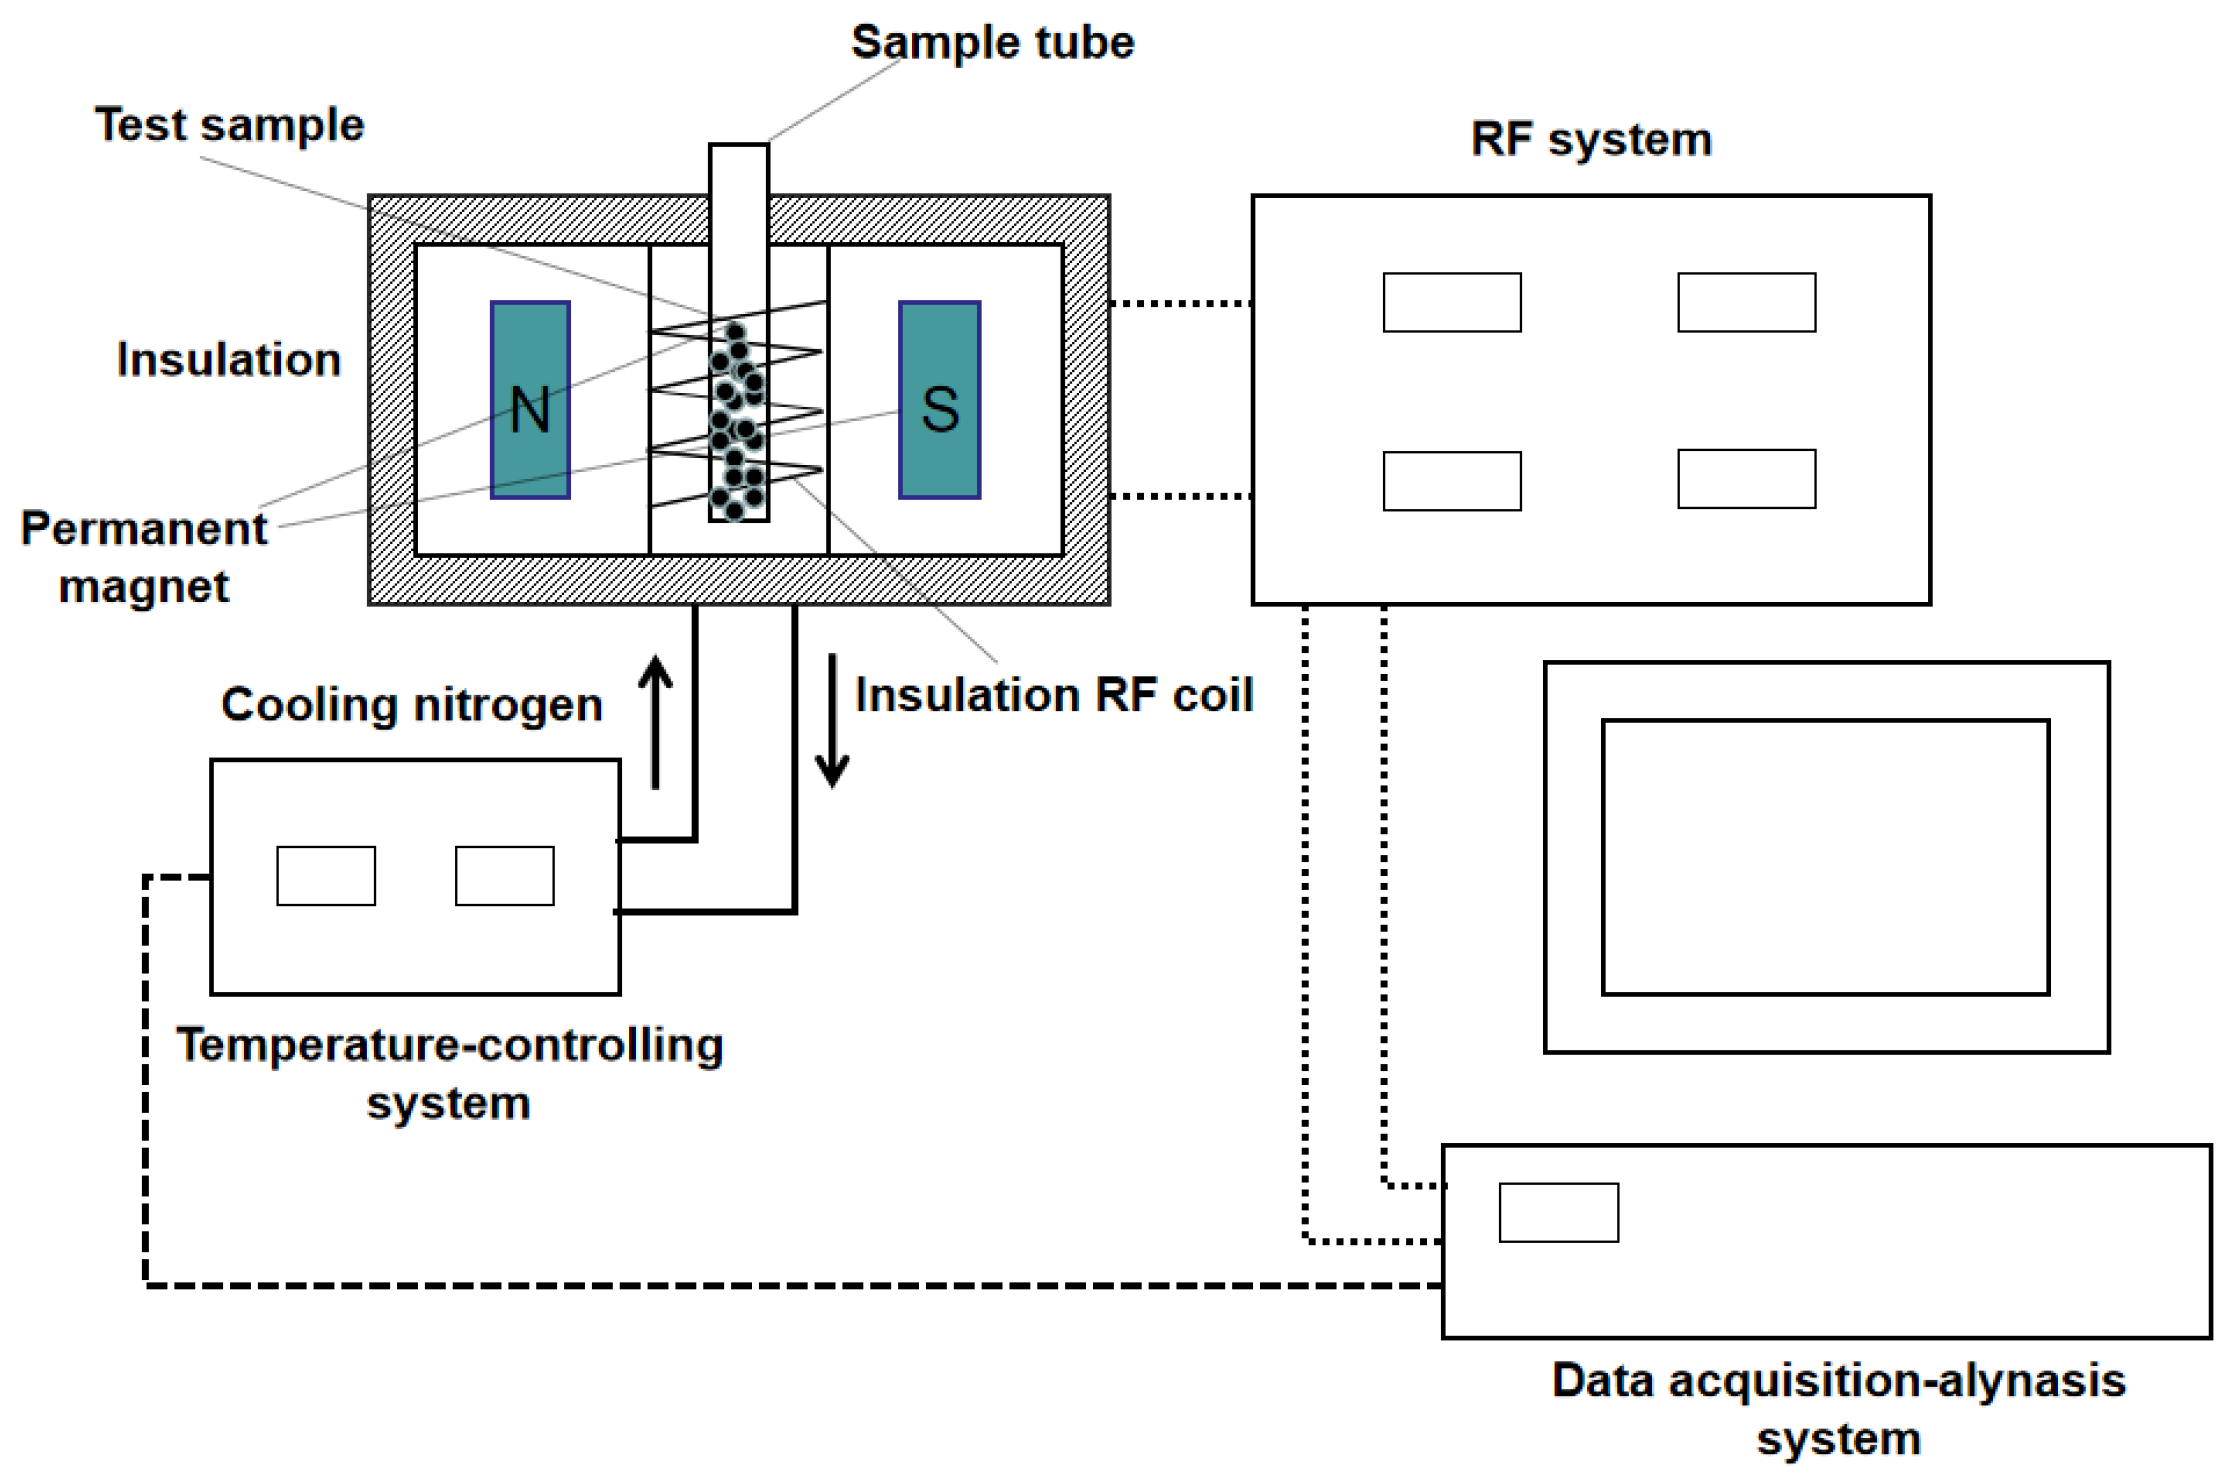
2.2.1. NMR Test
2.2.2. Geomechanical Tests
2.2.3. Microscopic Experiment
2.3. Mixed Design and Specimen Preparation
3. Results and Discussion
3.1. NMR Test Results
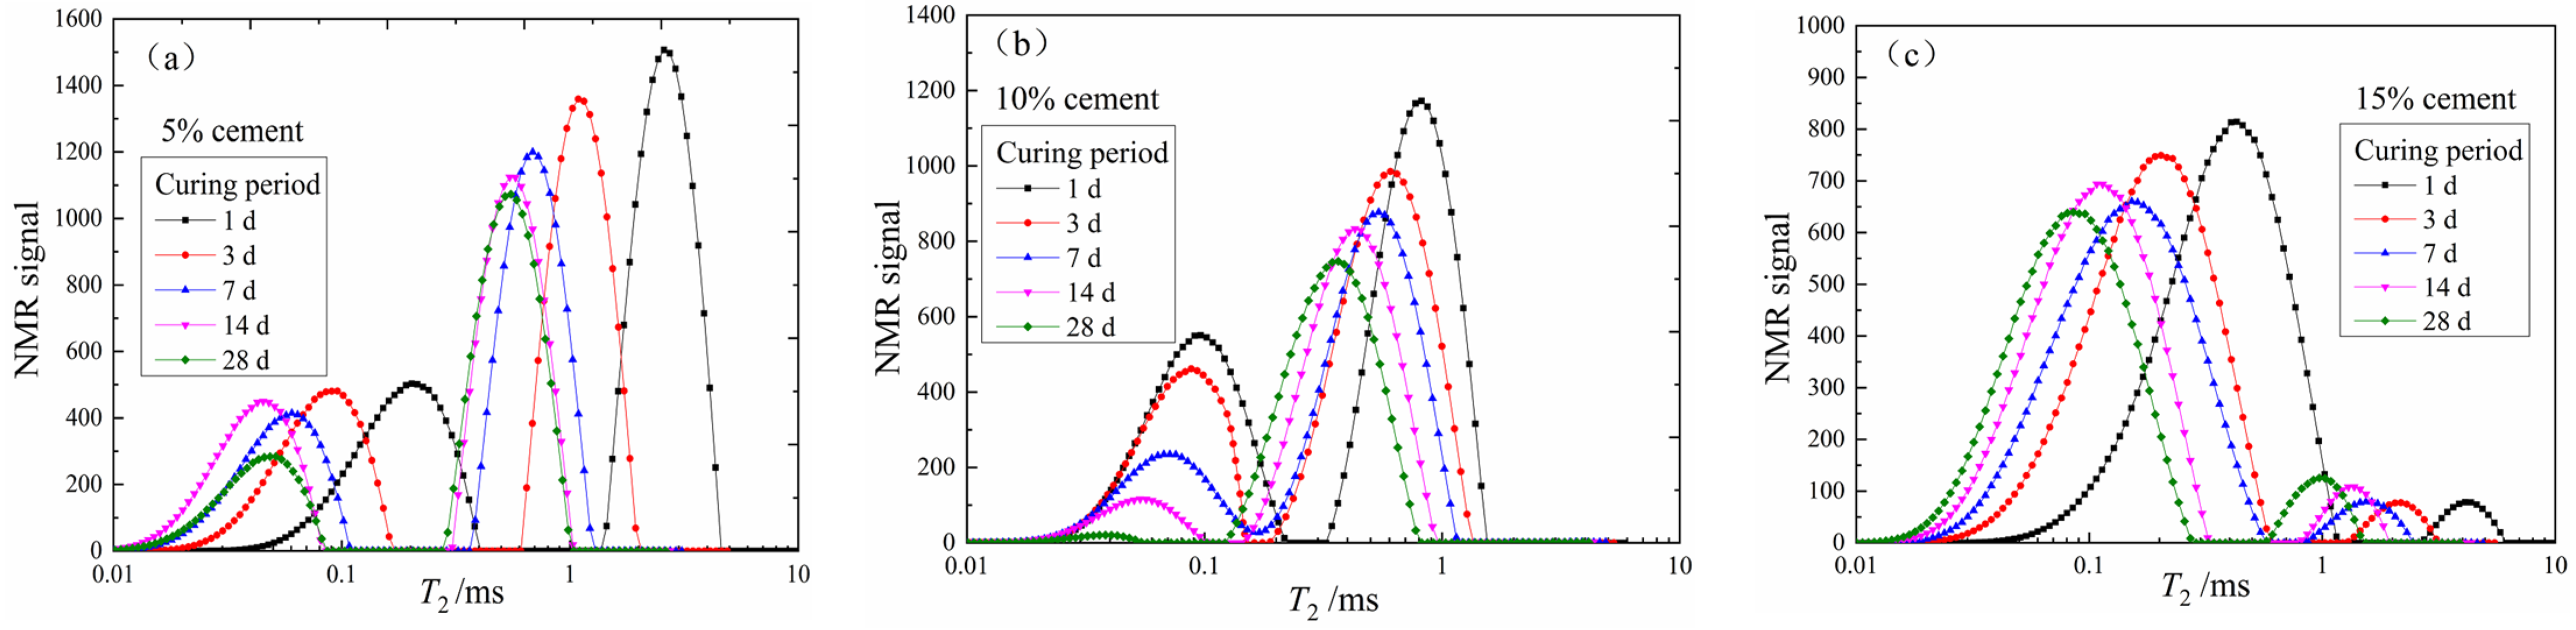
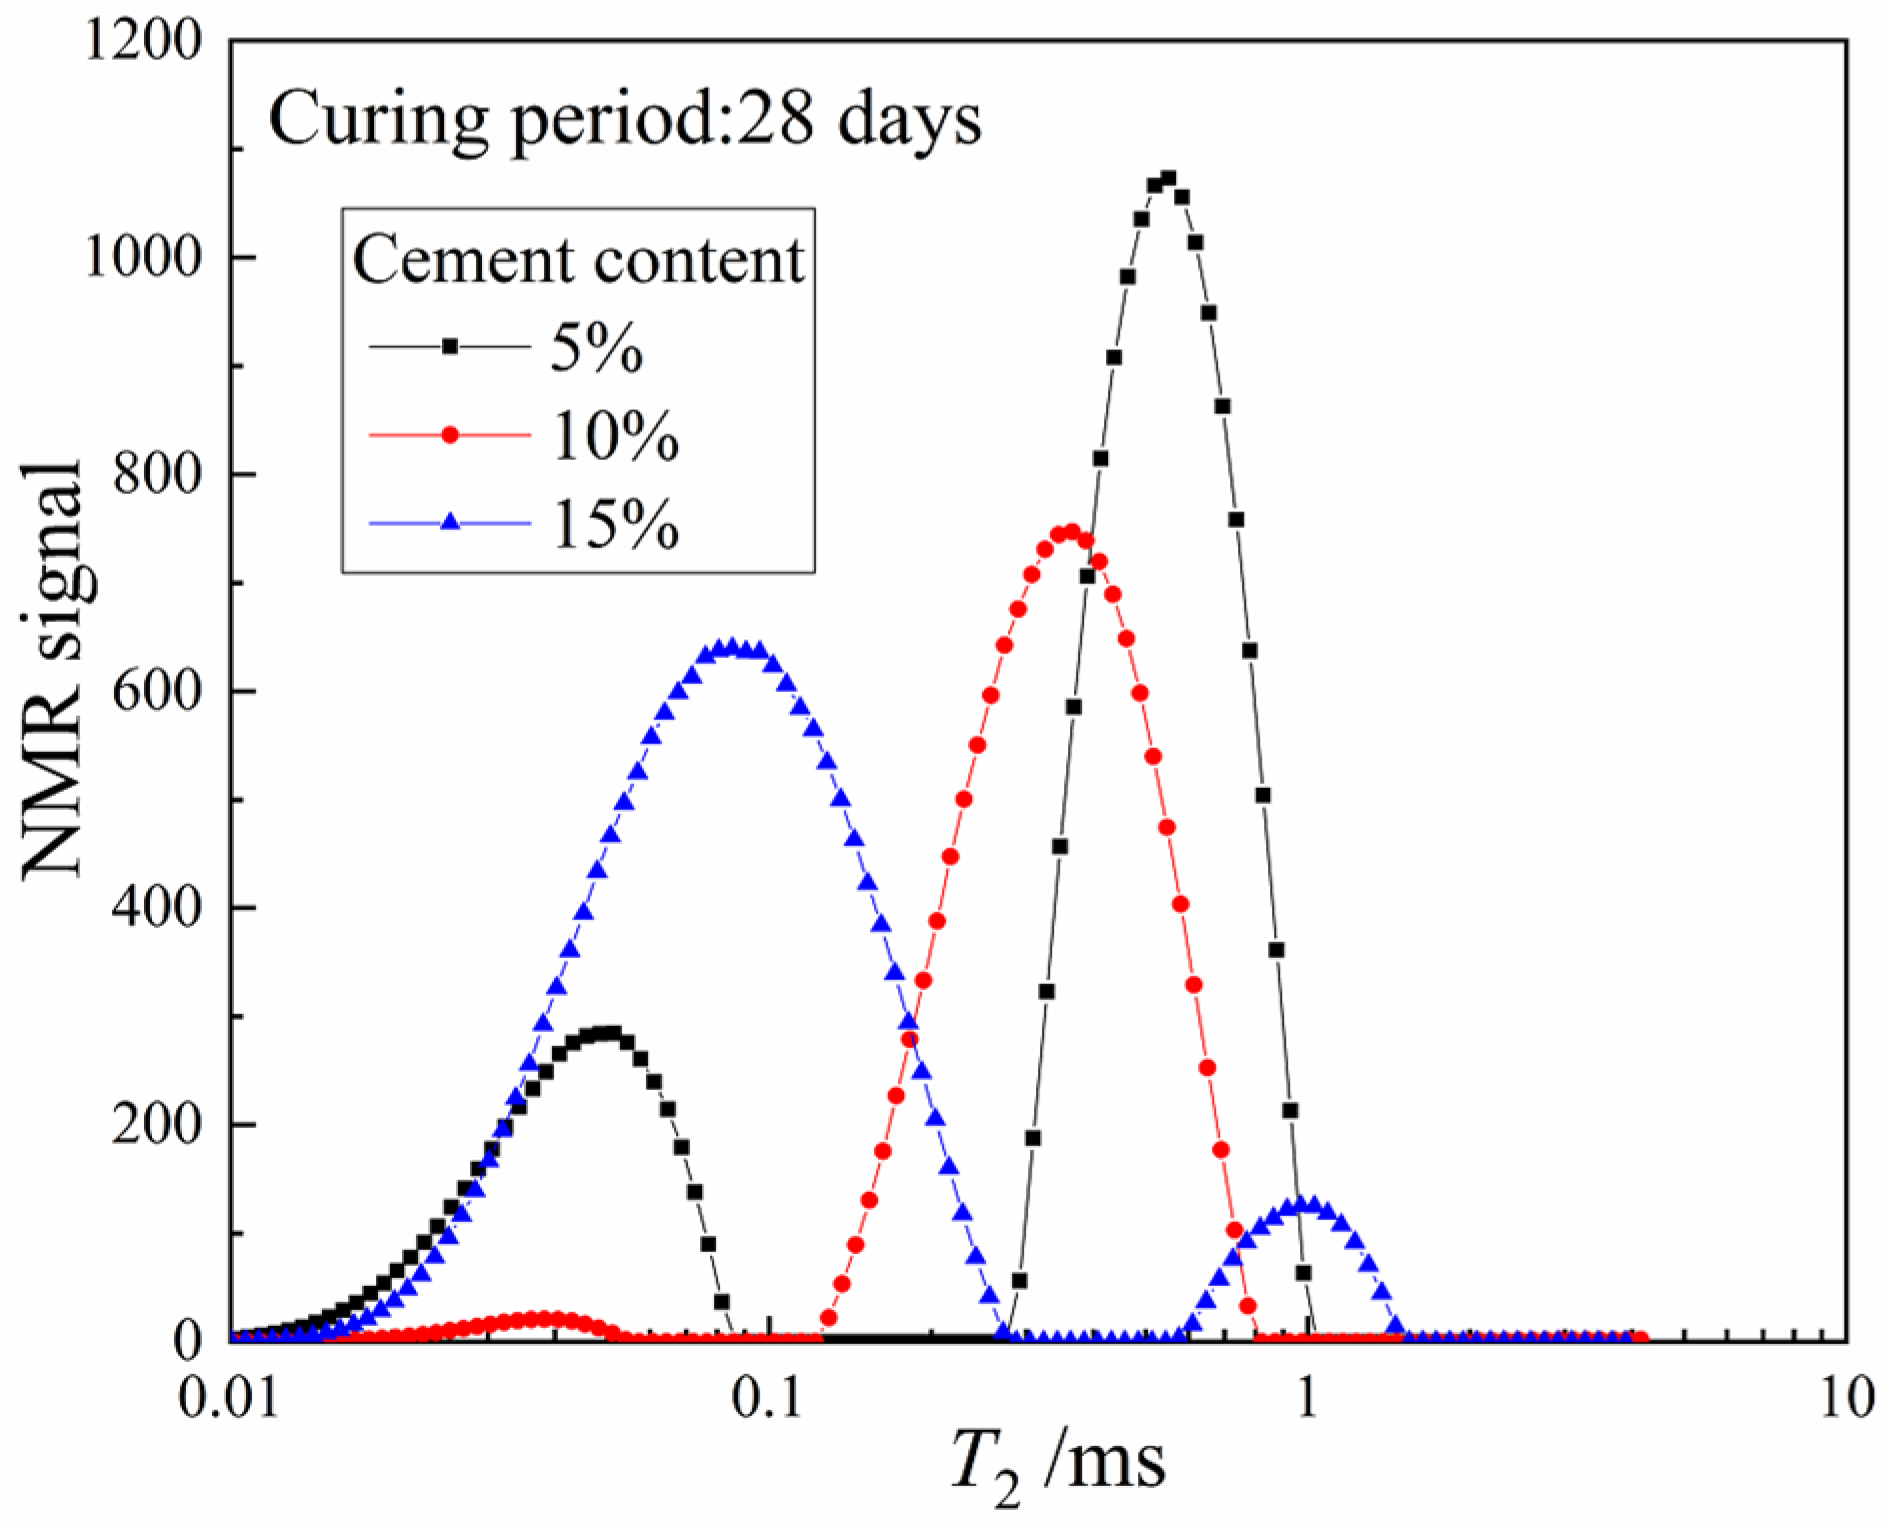
3.1.1. Characteristics of the T2 Distribution Curve
3.1.2. Water Transformation Mechanism during Cement Stabilization
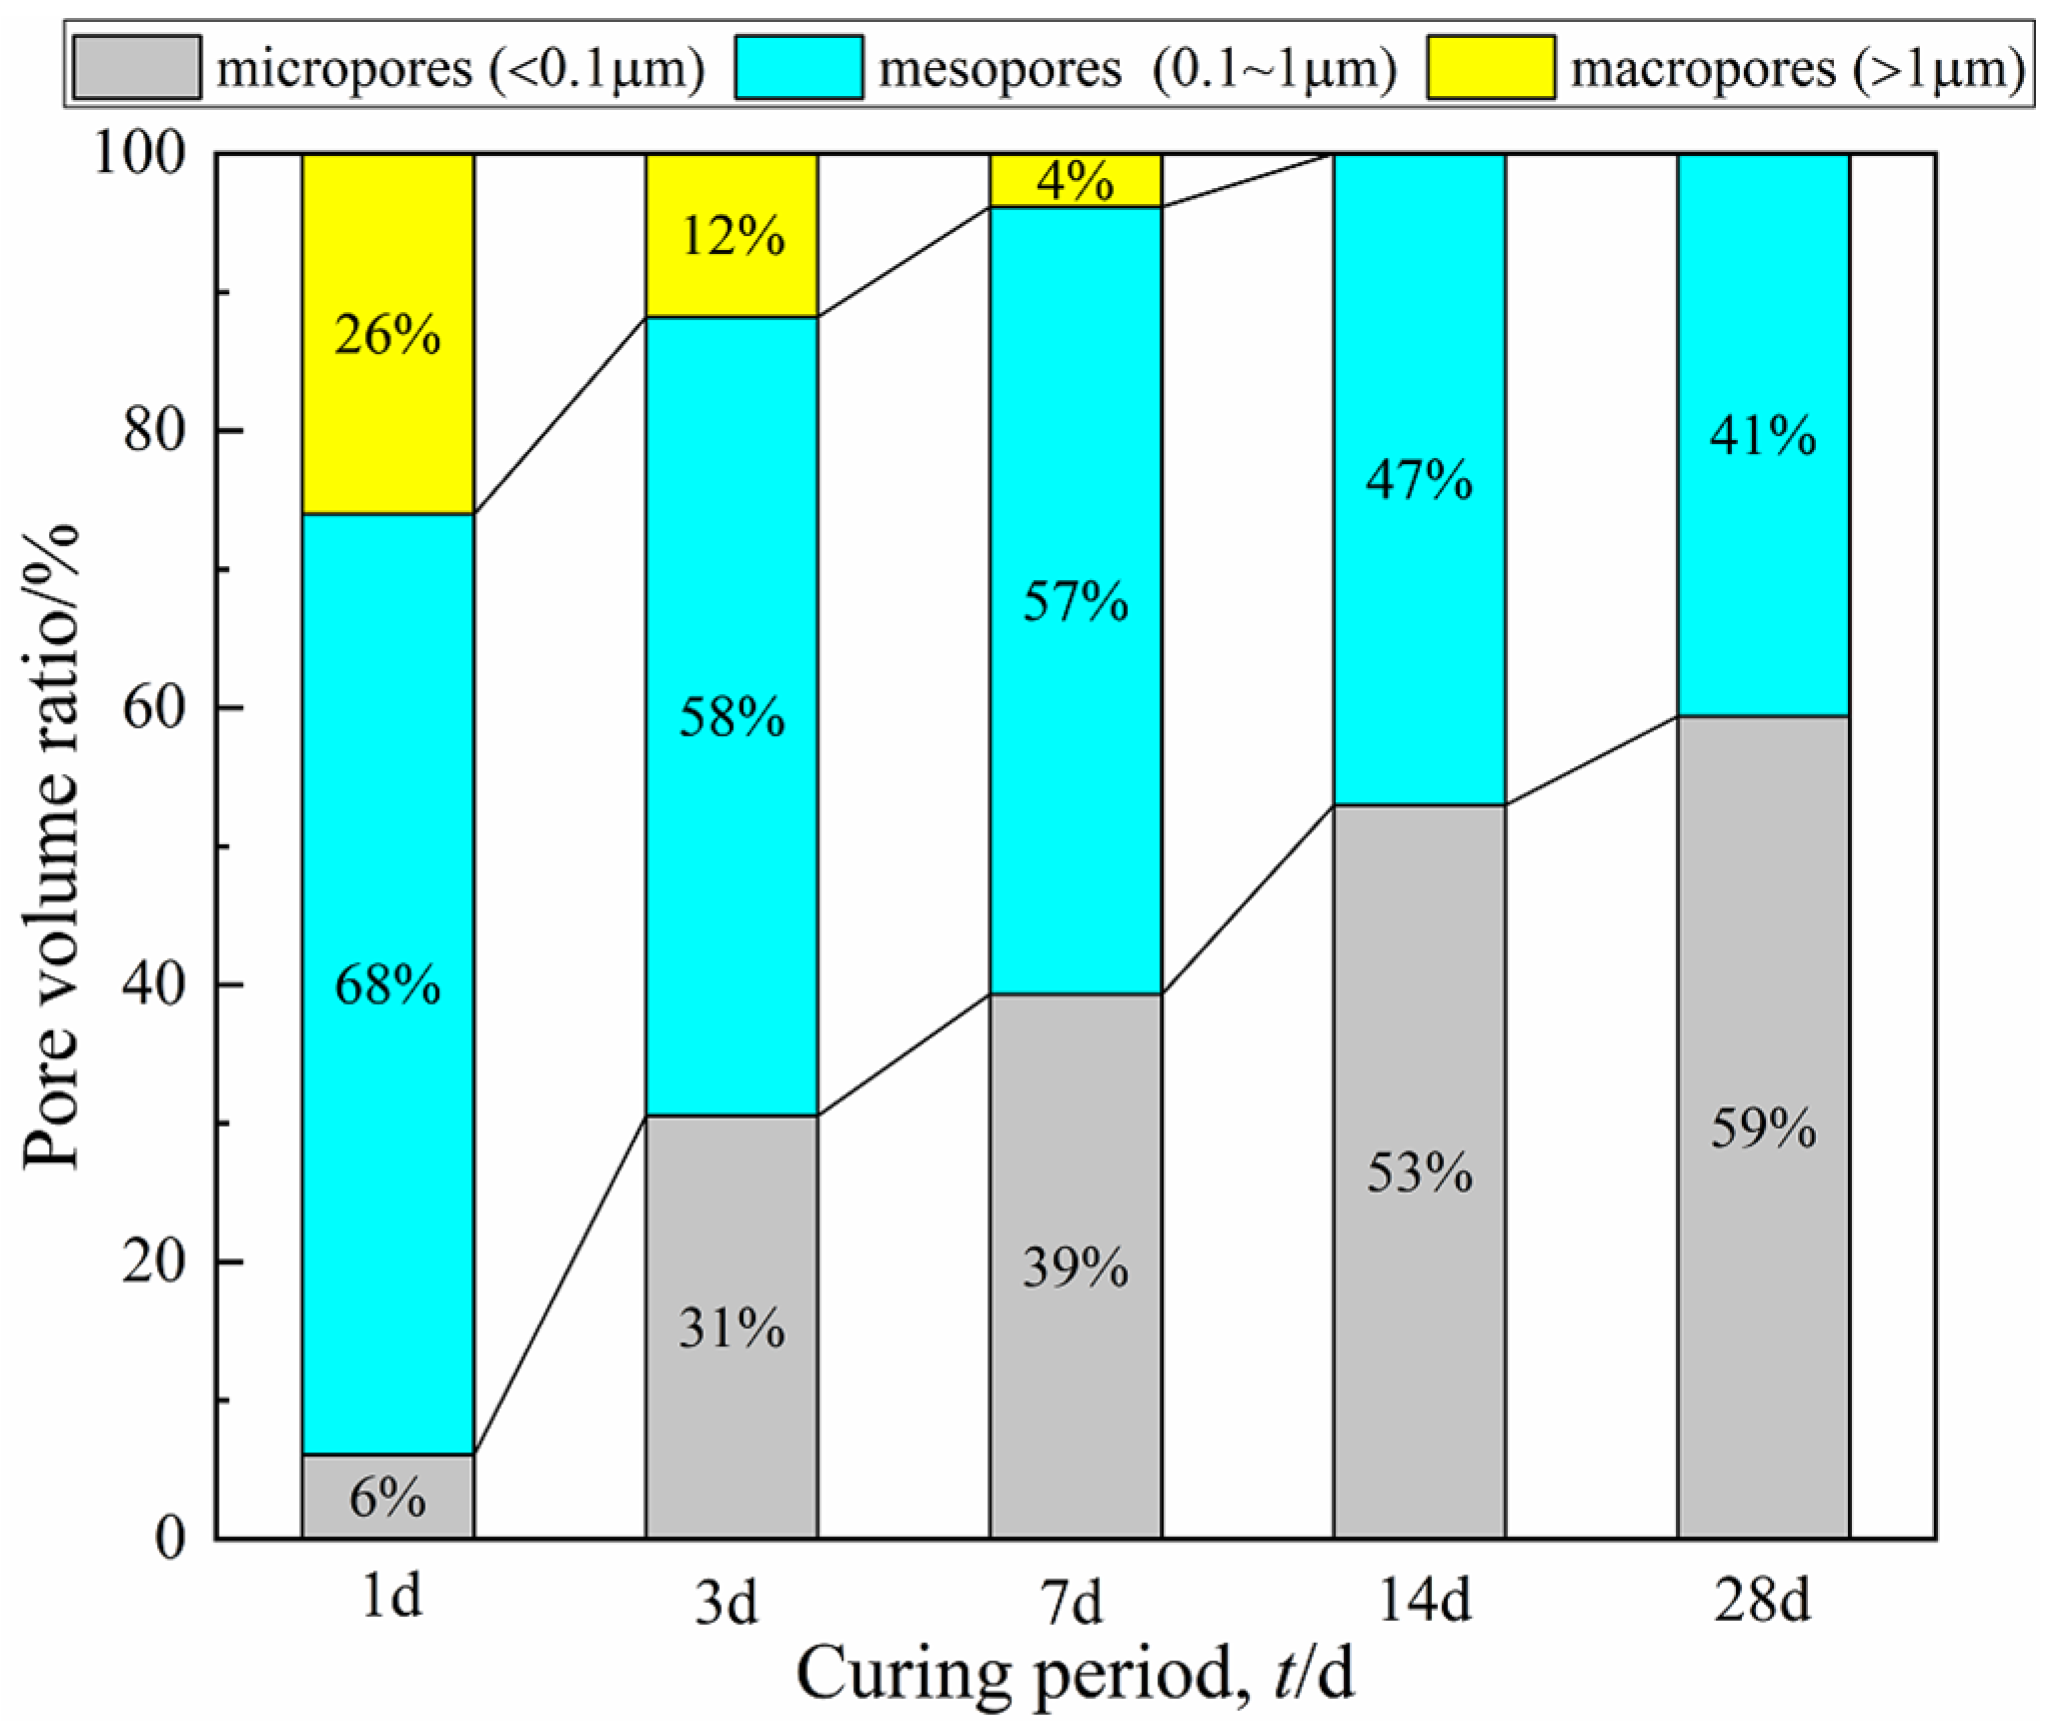
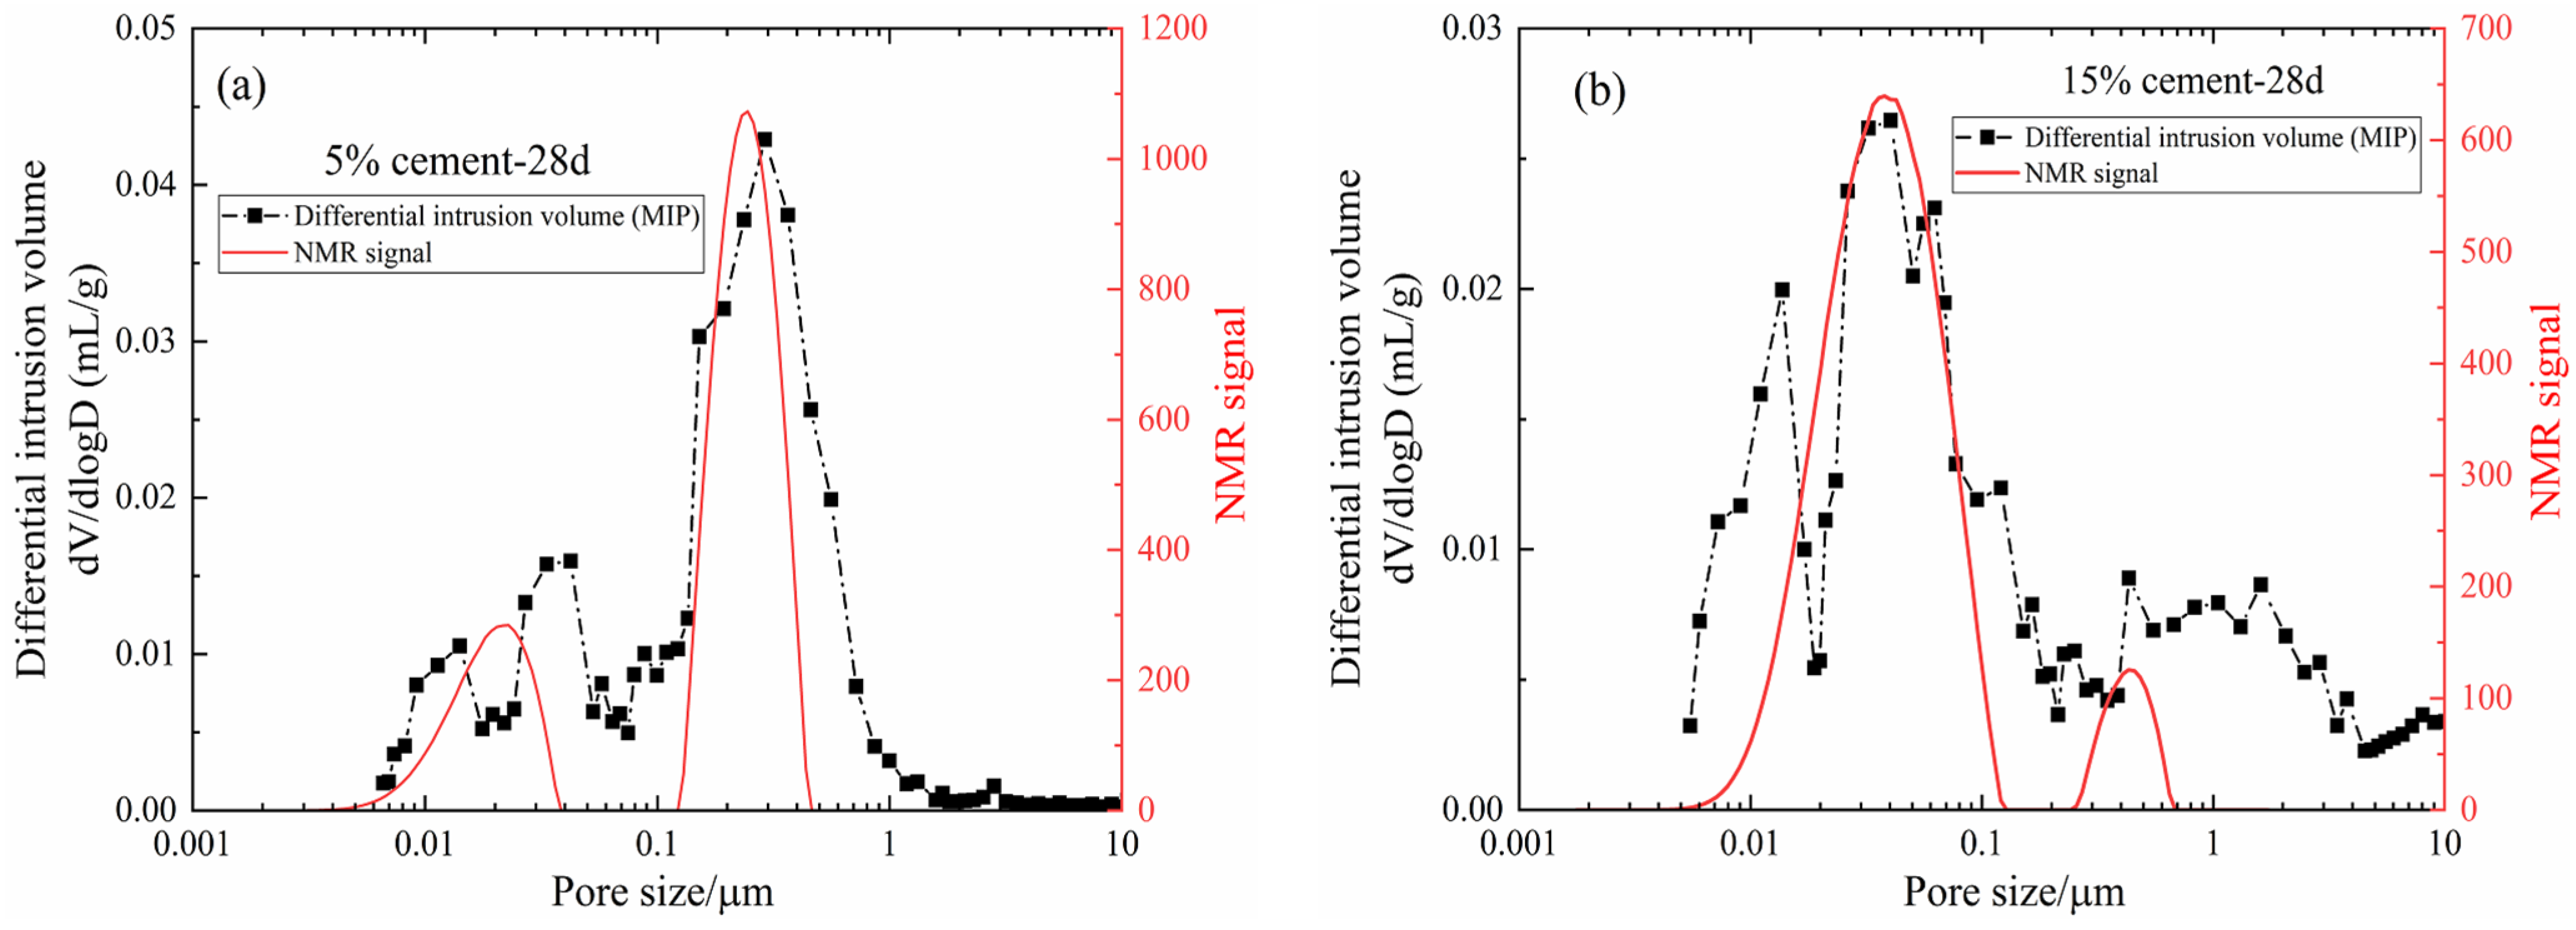
3.1.3. Pore Structure Characteristics
3.2. Geomechanical Properties (Strength and Permeability)
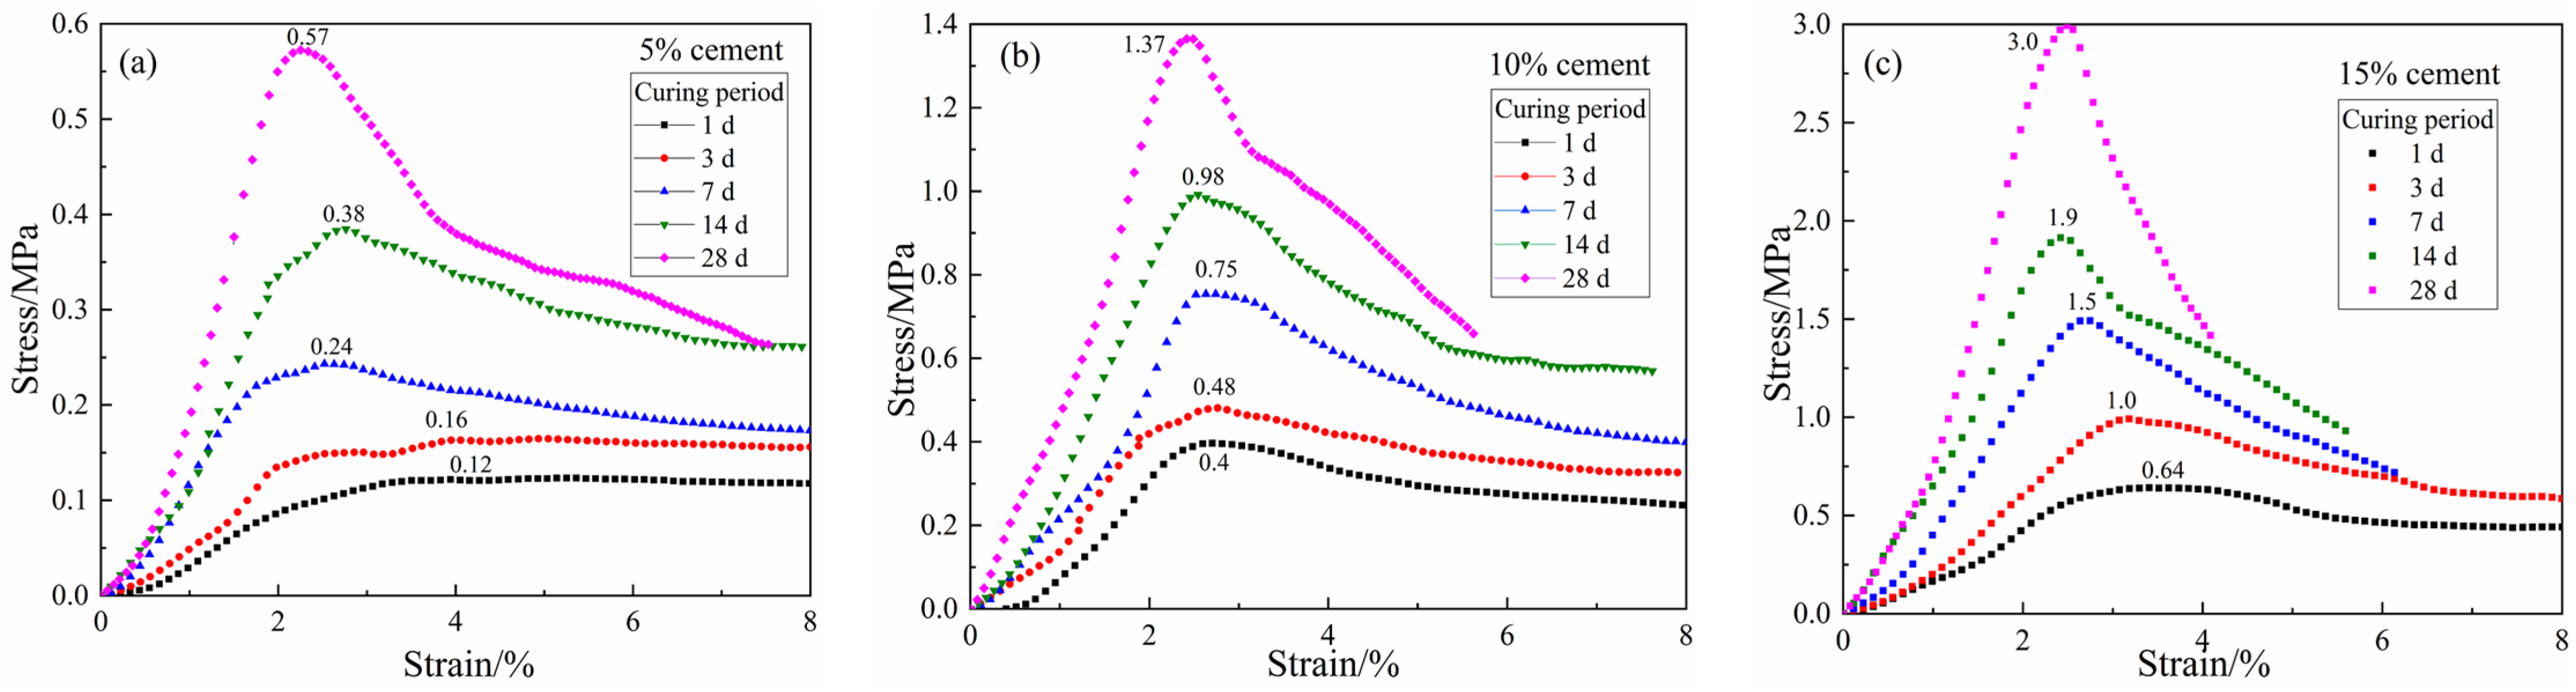
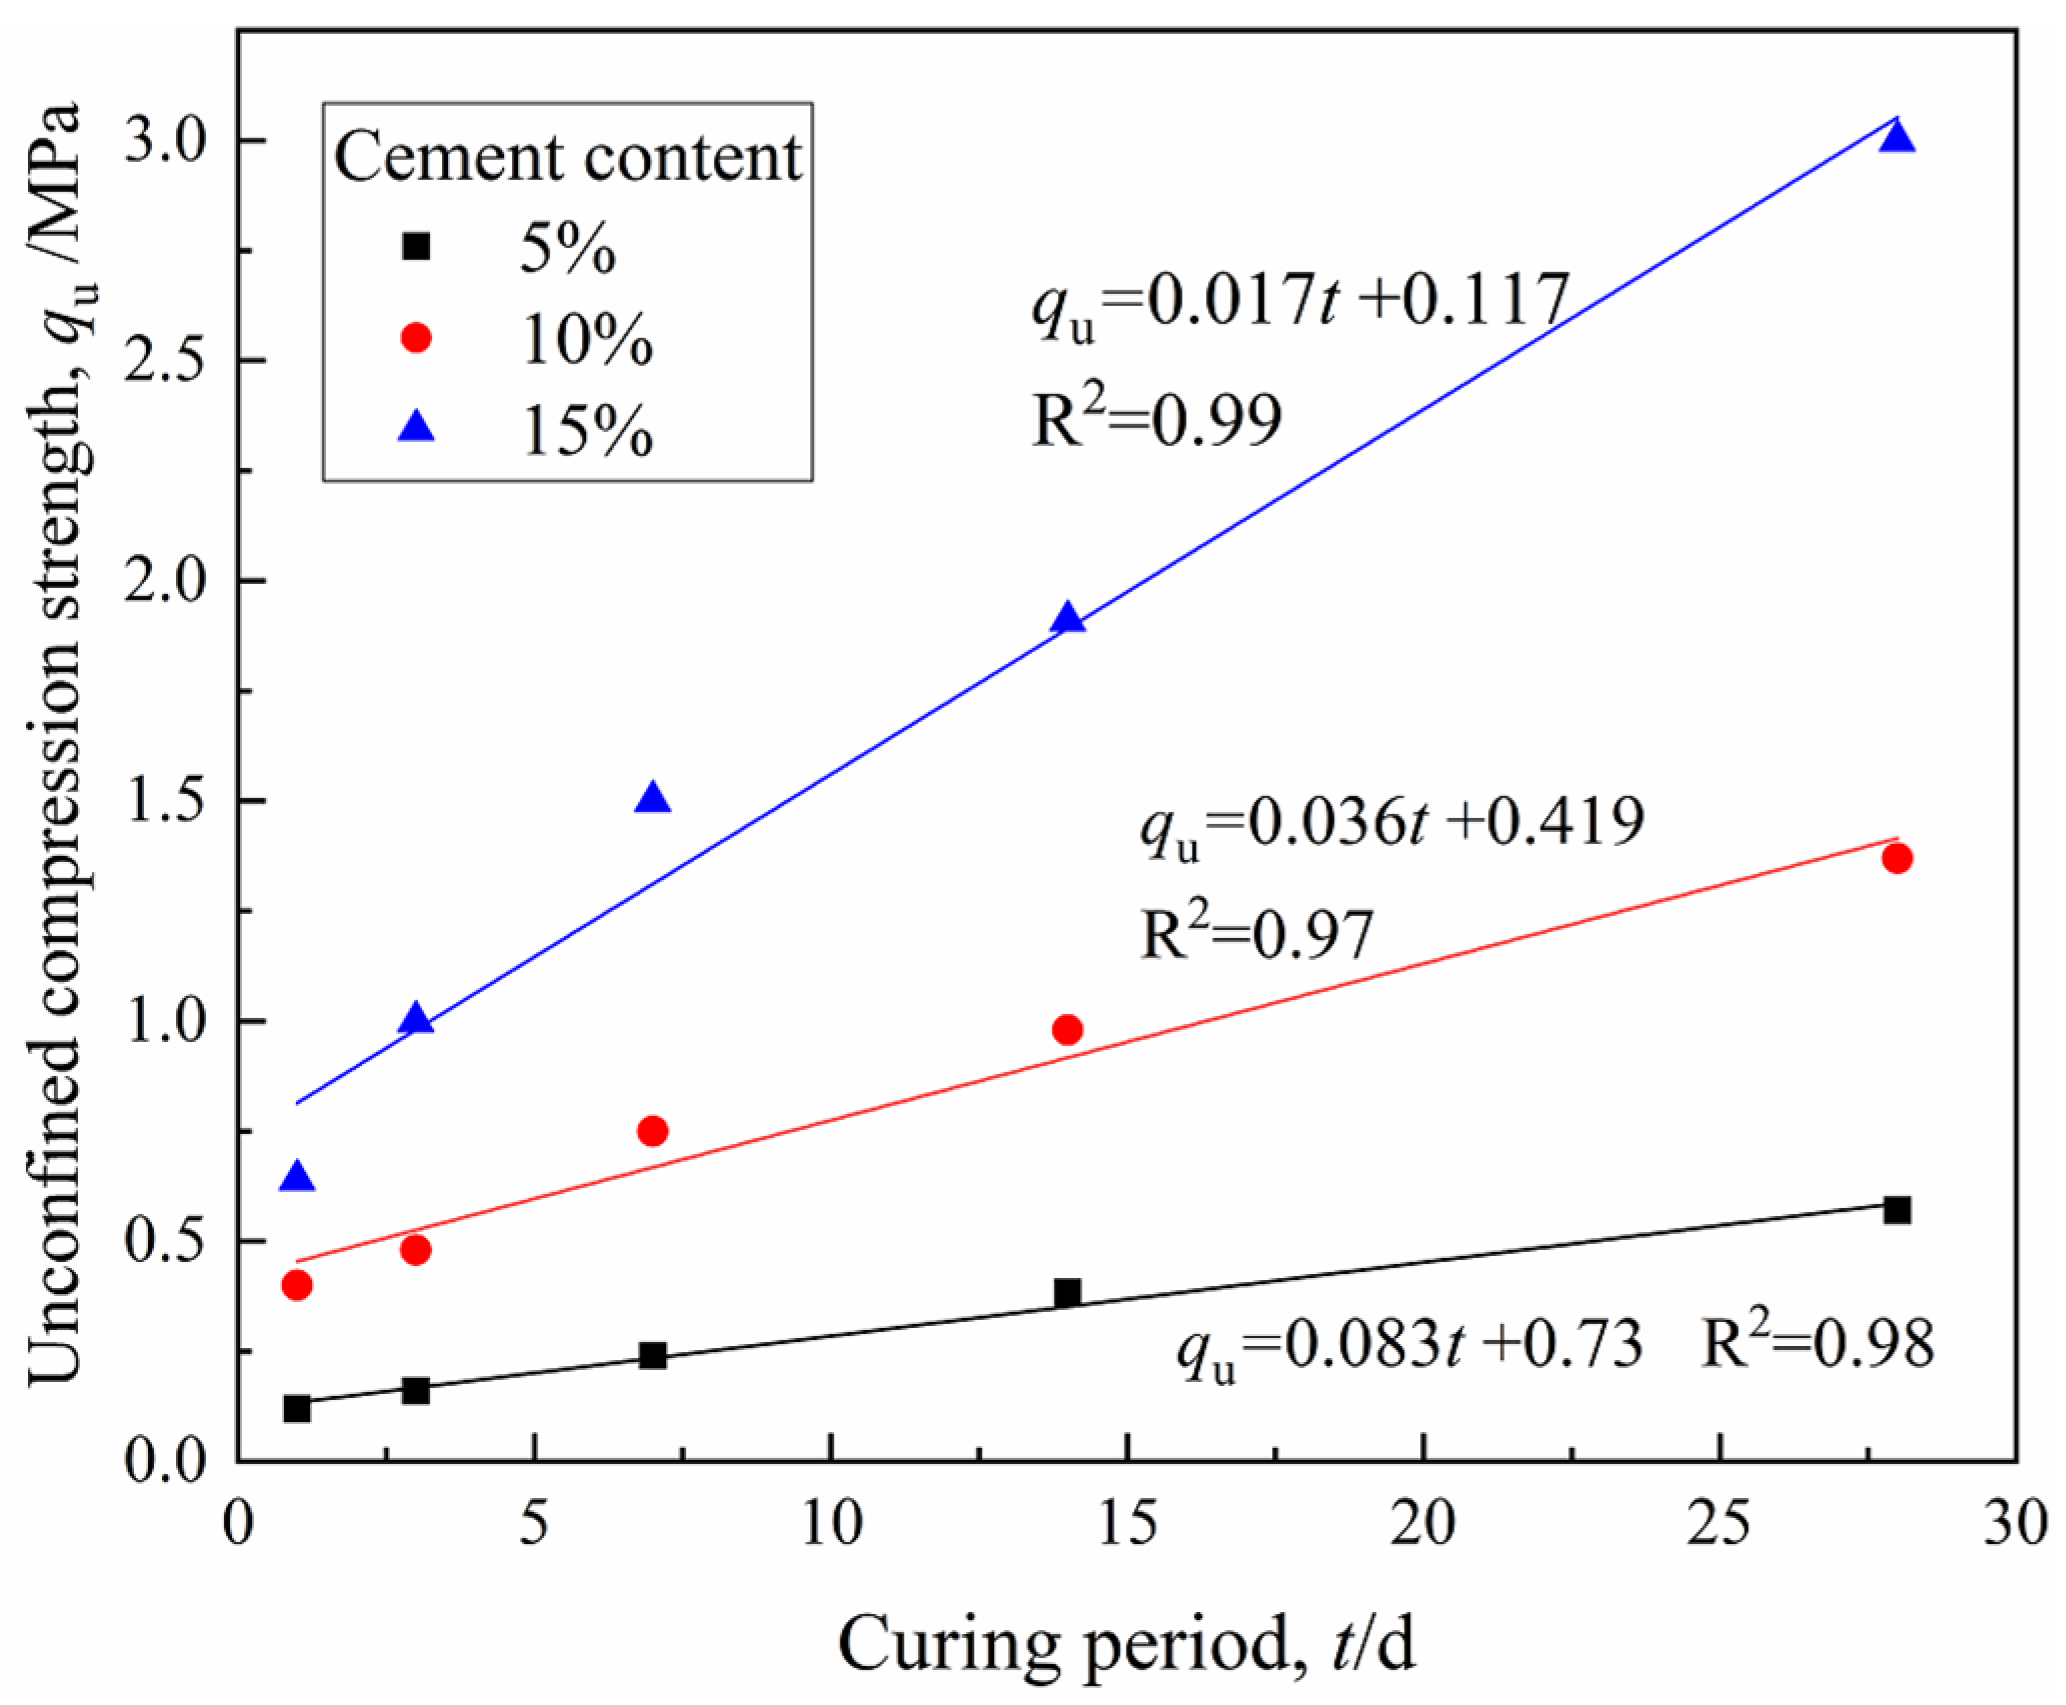
3.2.1. Stress–Strain Relationship and Strength Development
3.2.2. Hydraulic Conductivity
3.3. Quantitative Relationship between Macro-Geomechanical Properties and Microstructure
3.3.1. Relationship between Pore Structure Characteristics and Hydraulic Conductivity
3.3.2. Relationship between Strength and Water Distribution
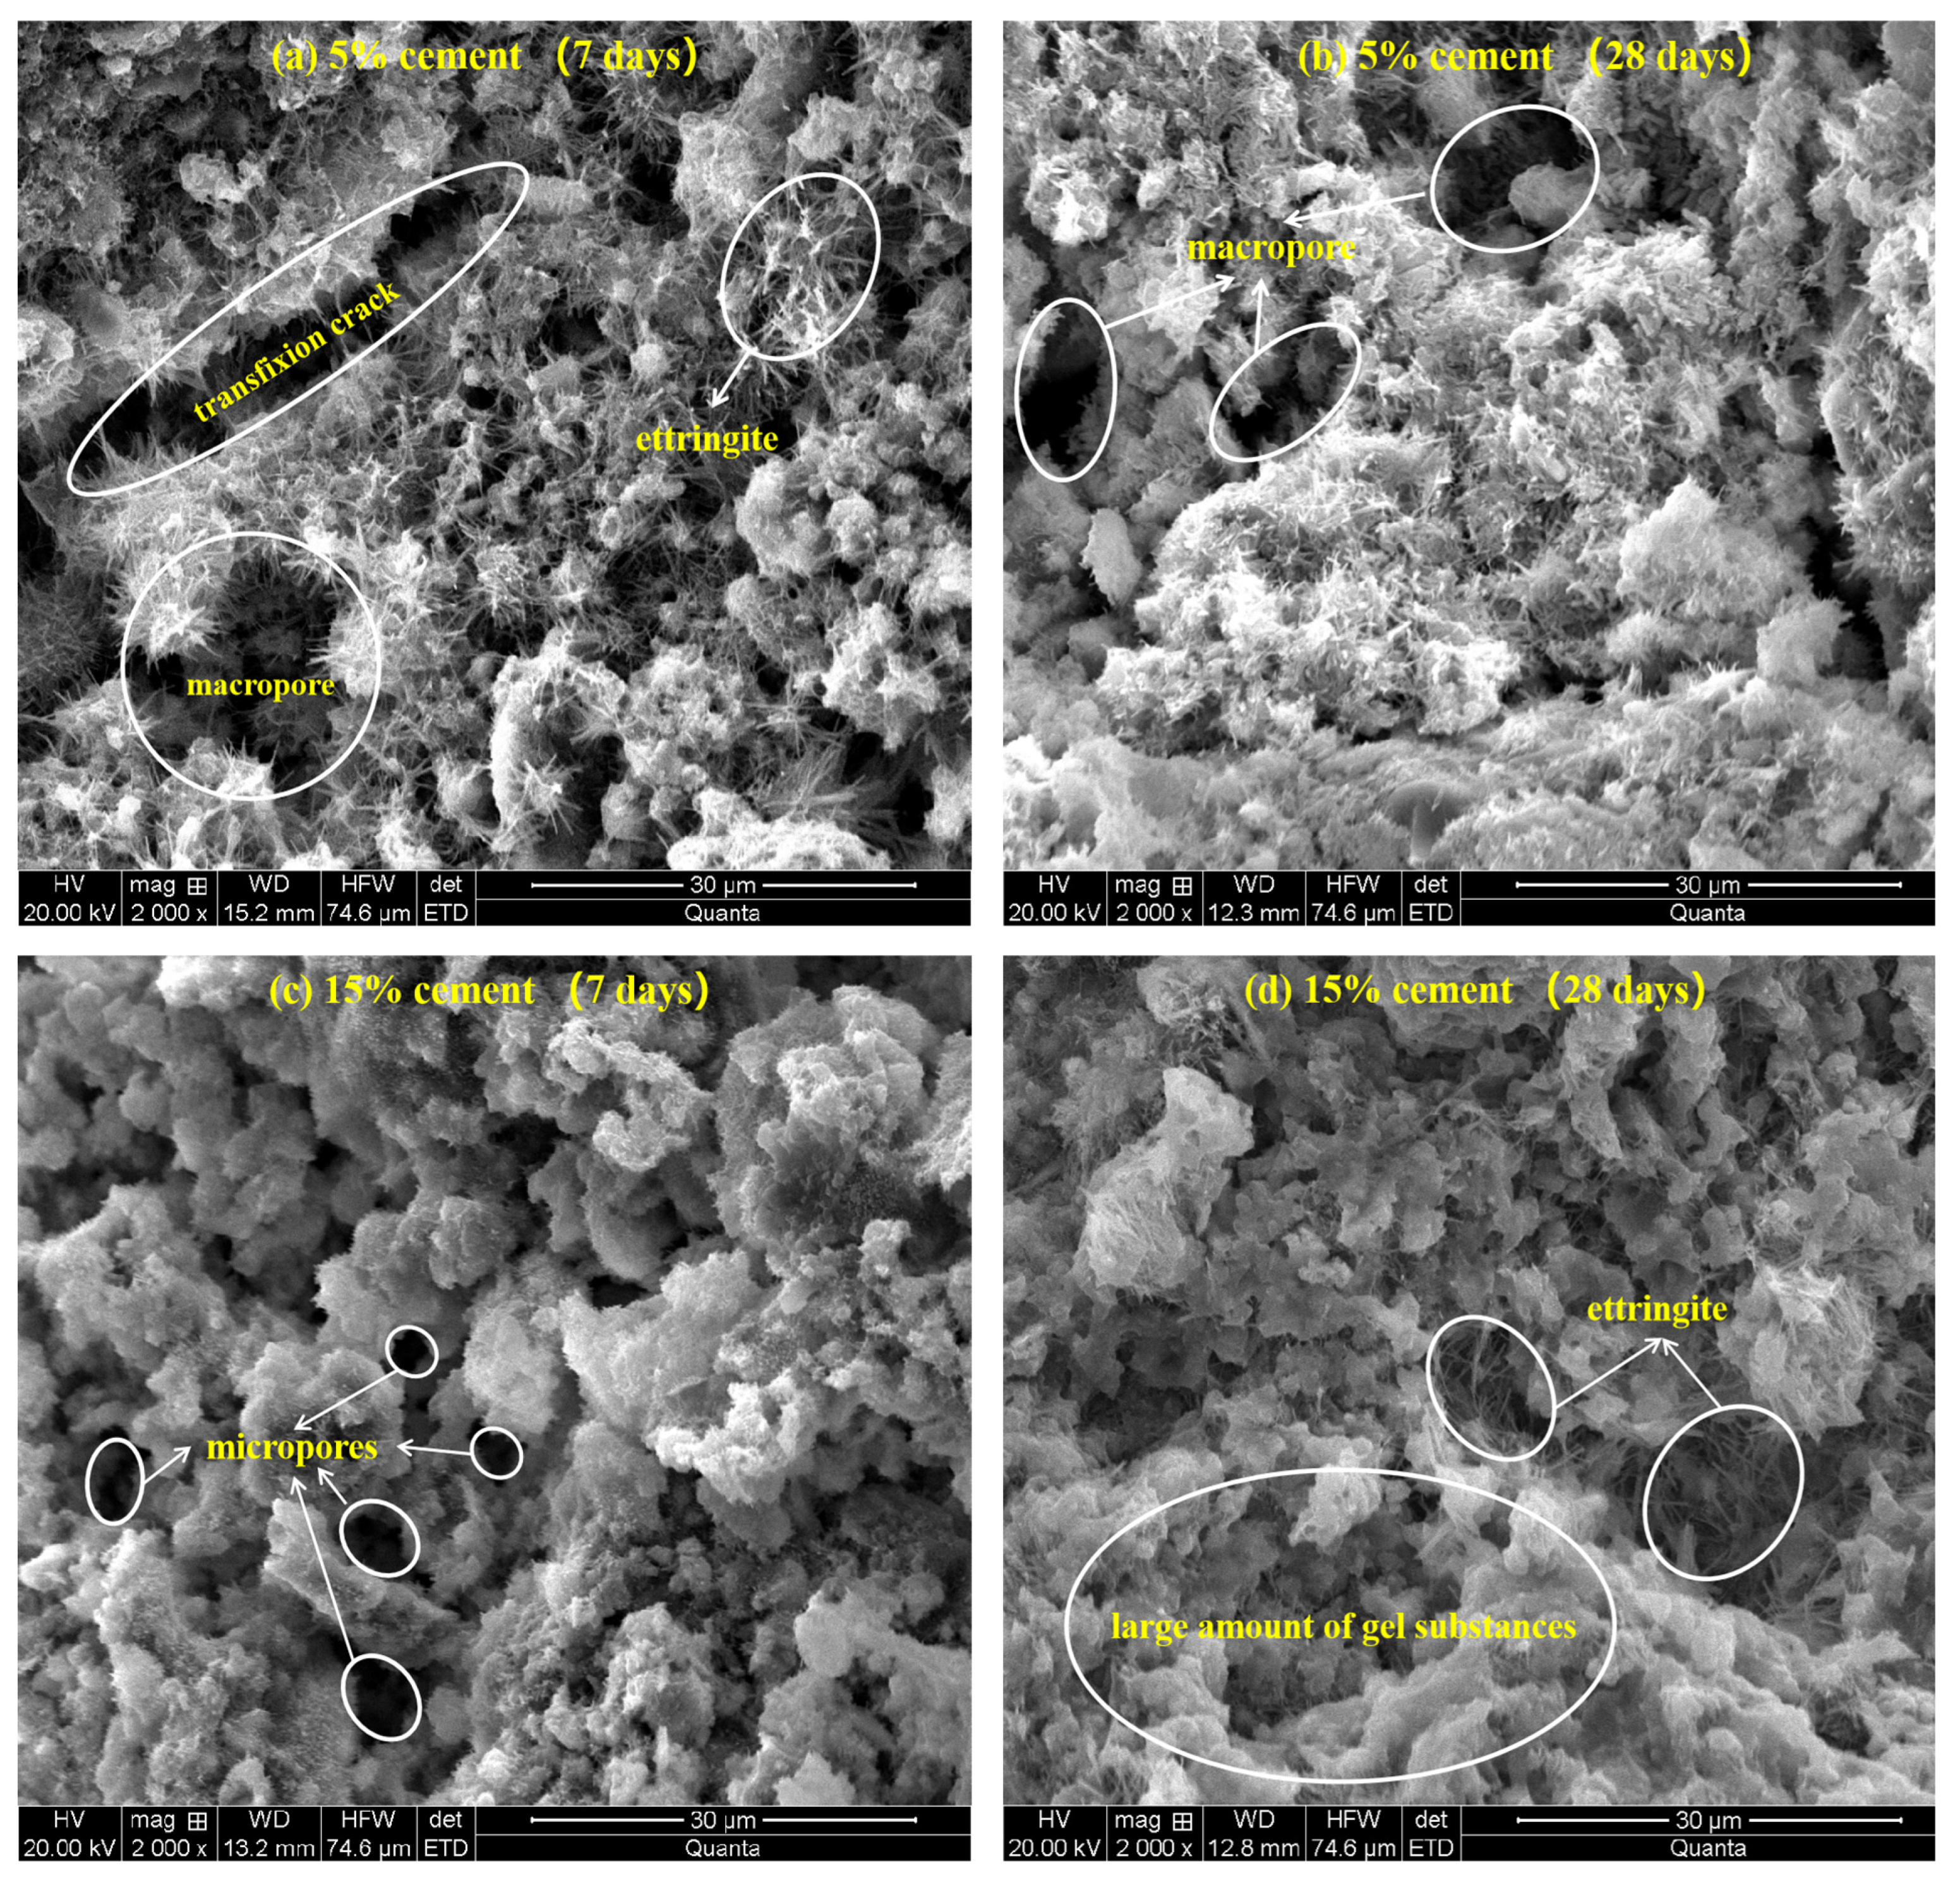
3.4. SEM Characterization
4. Discussion
5. Conclusions
- (1)
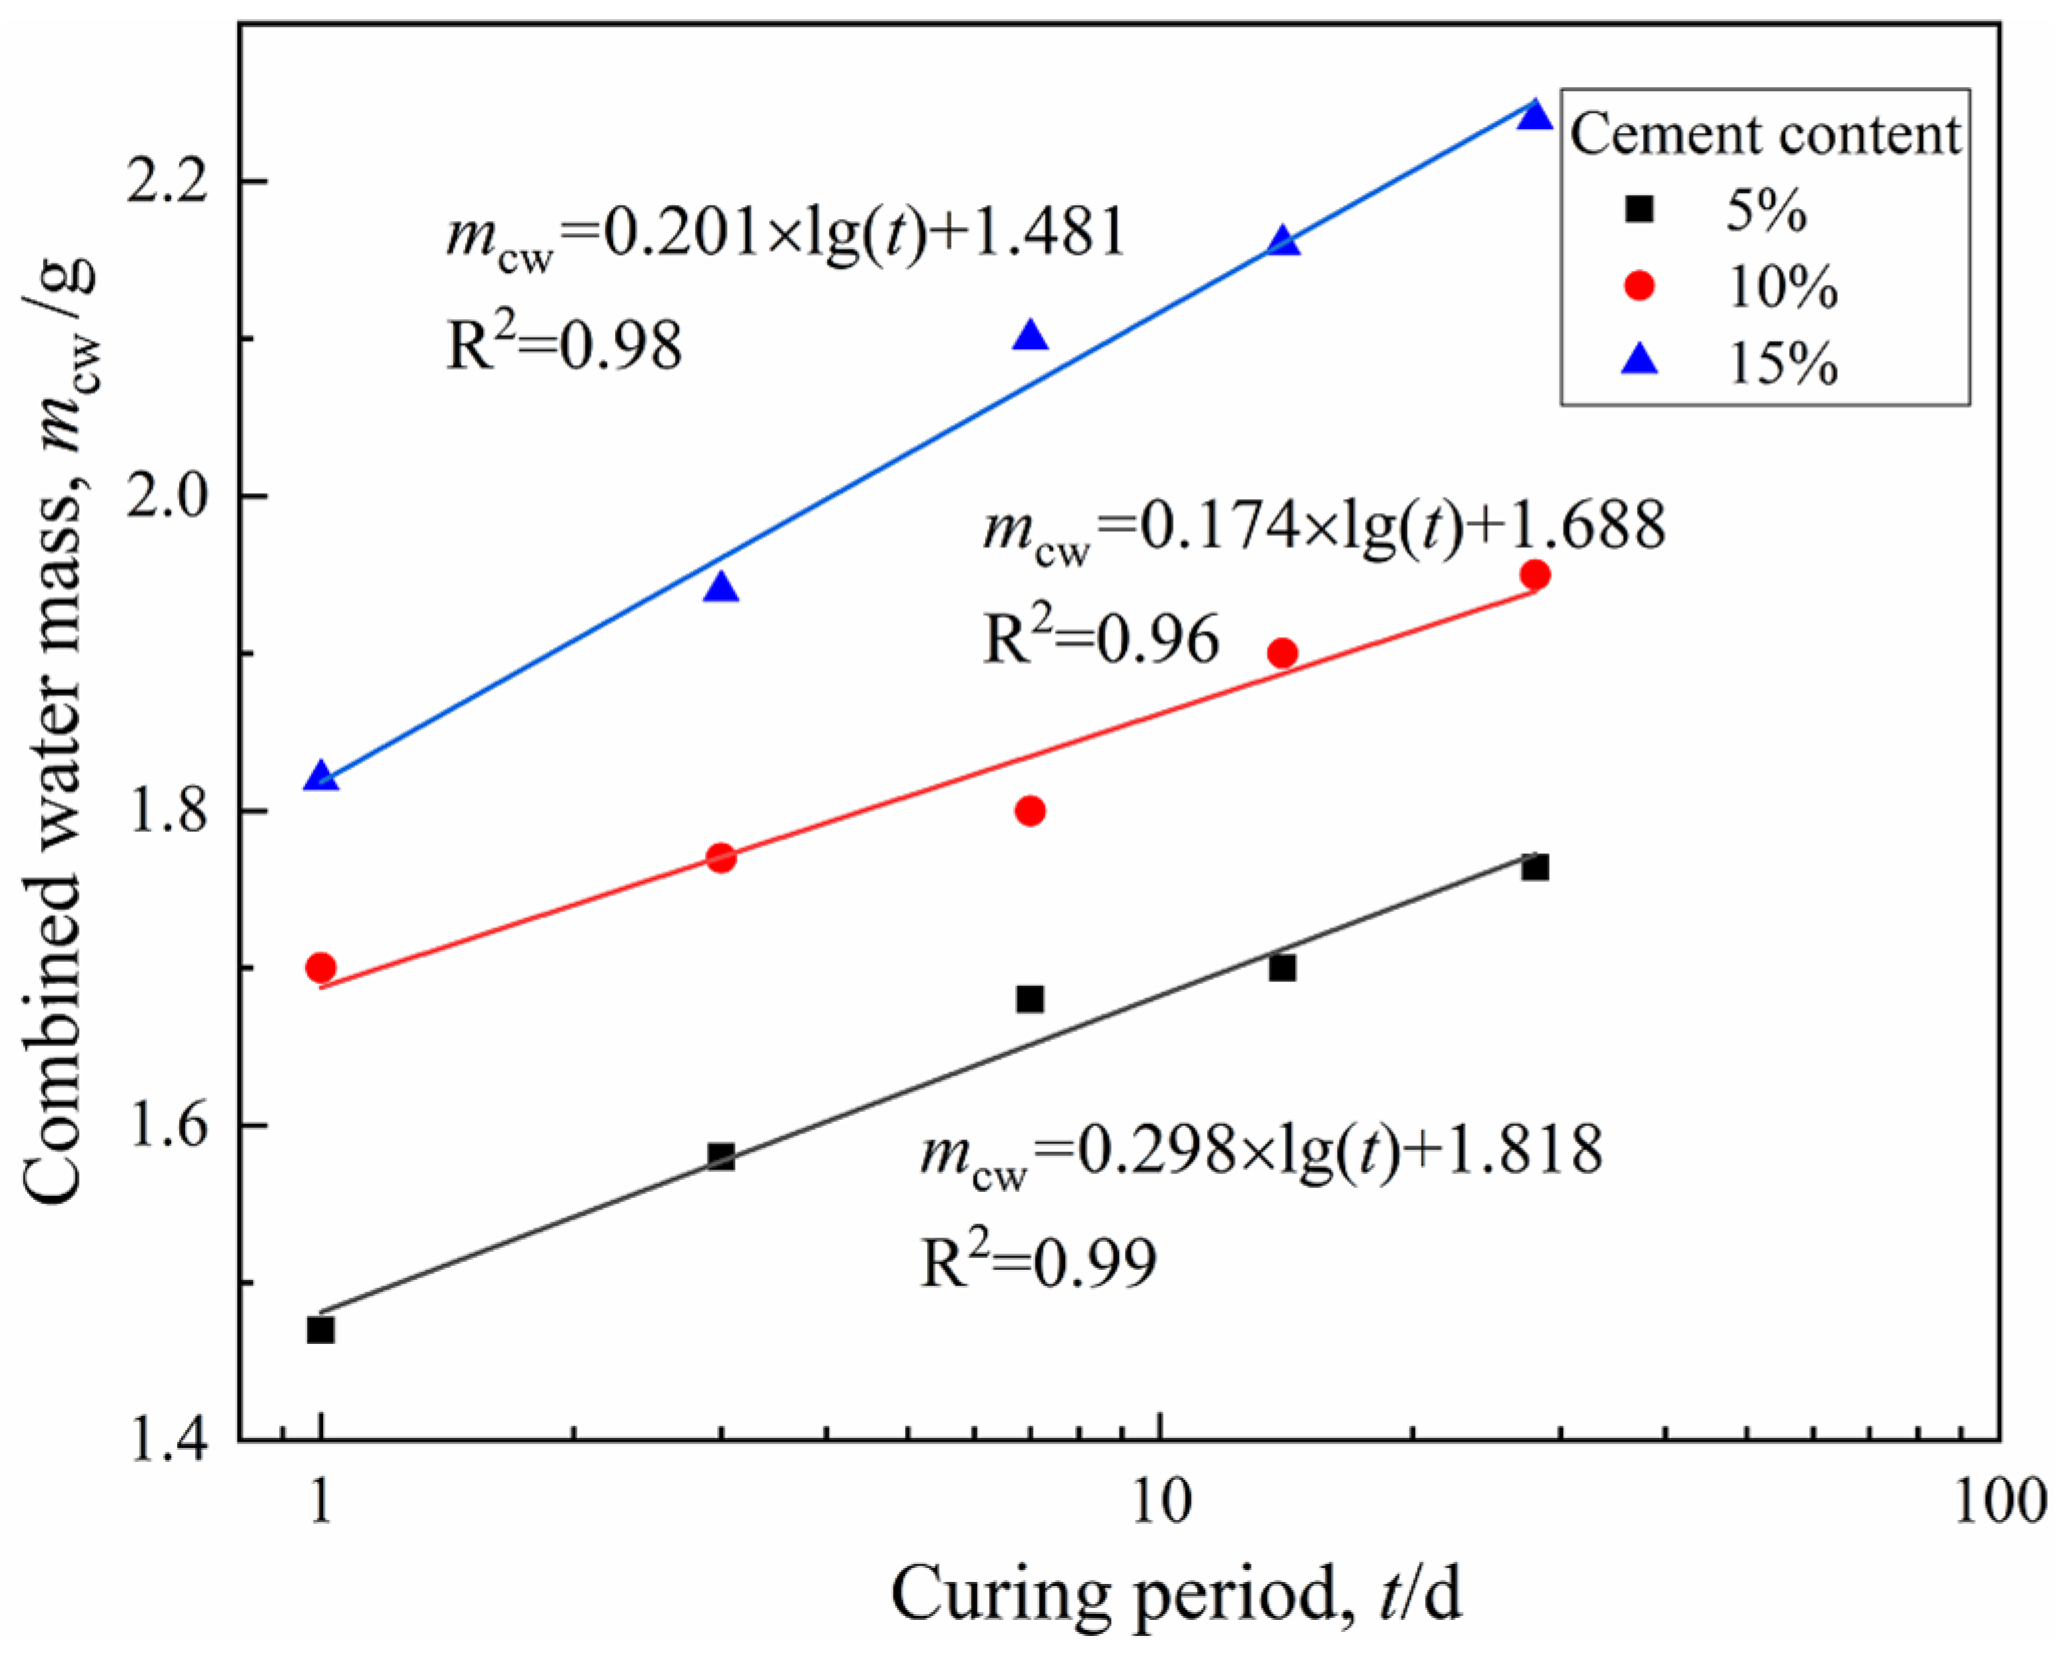
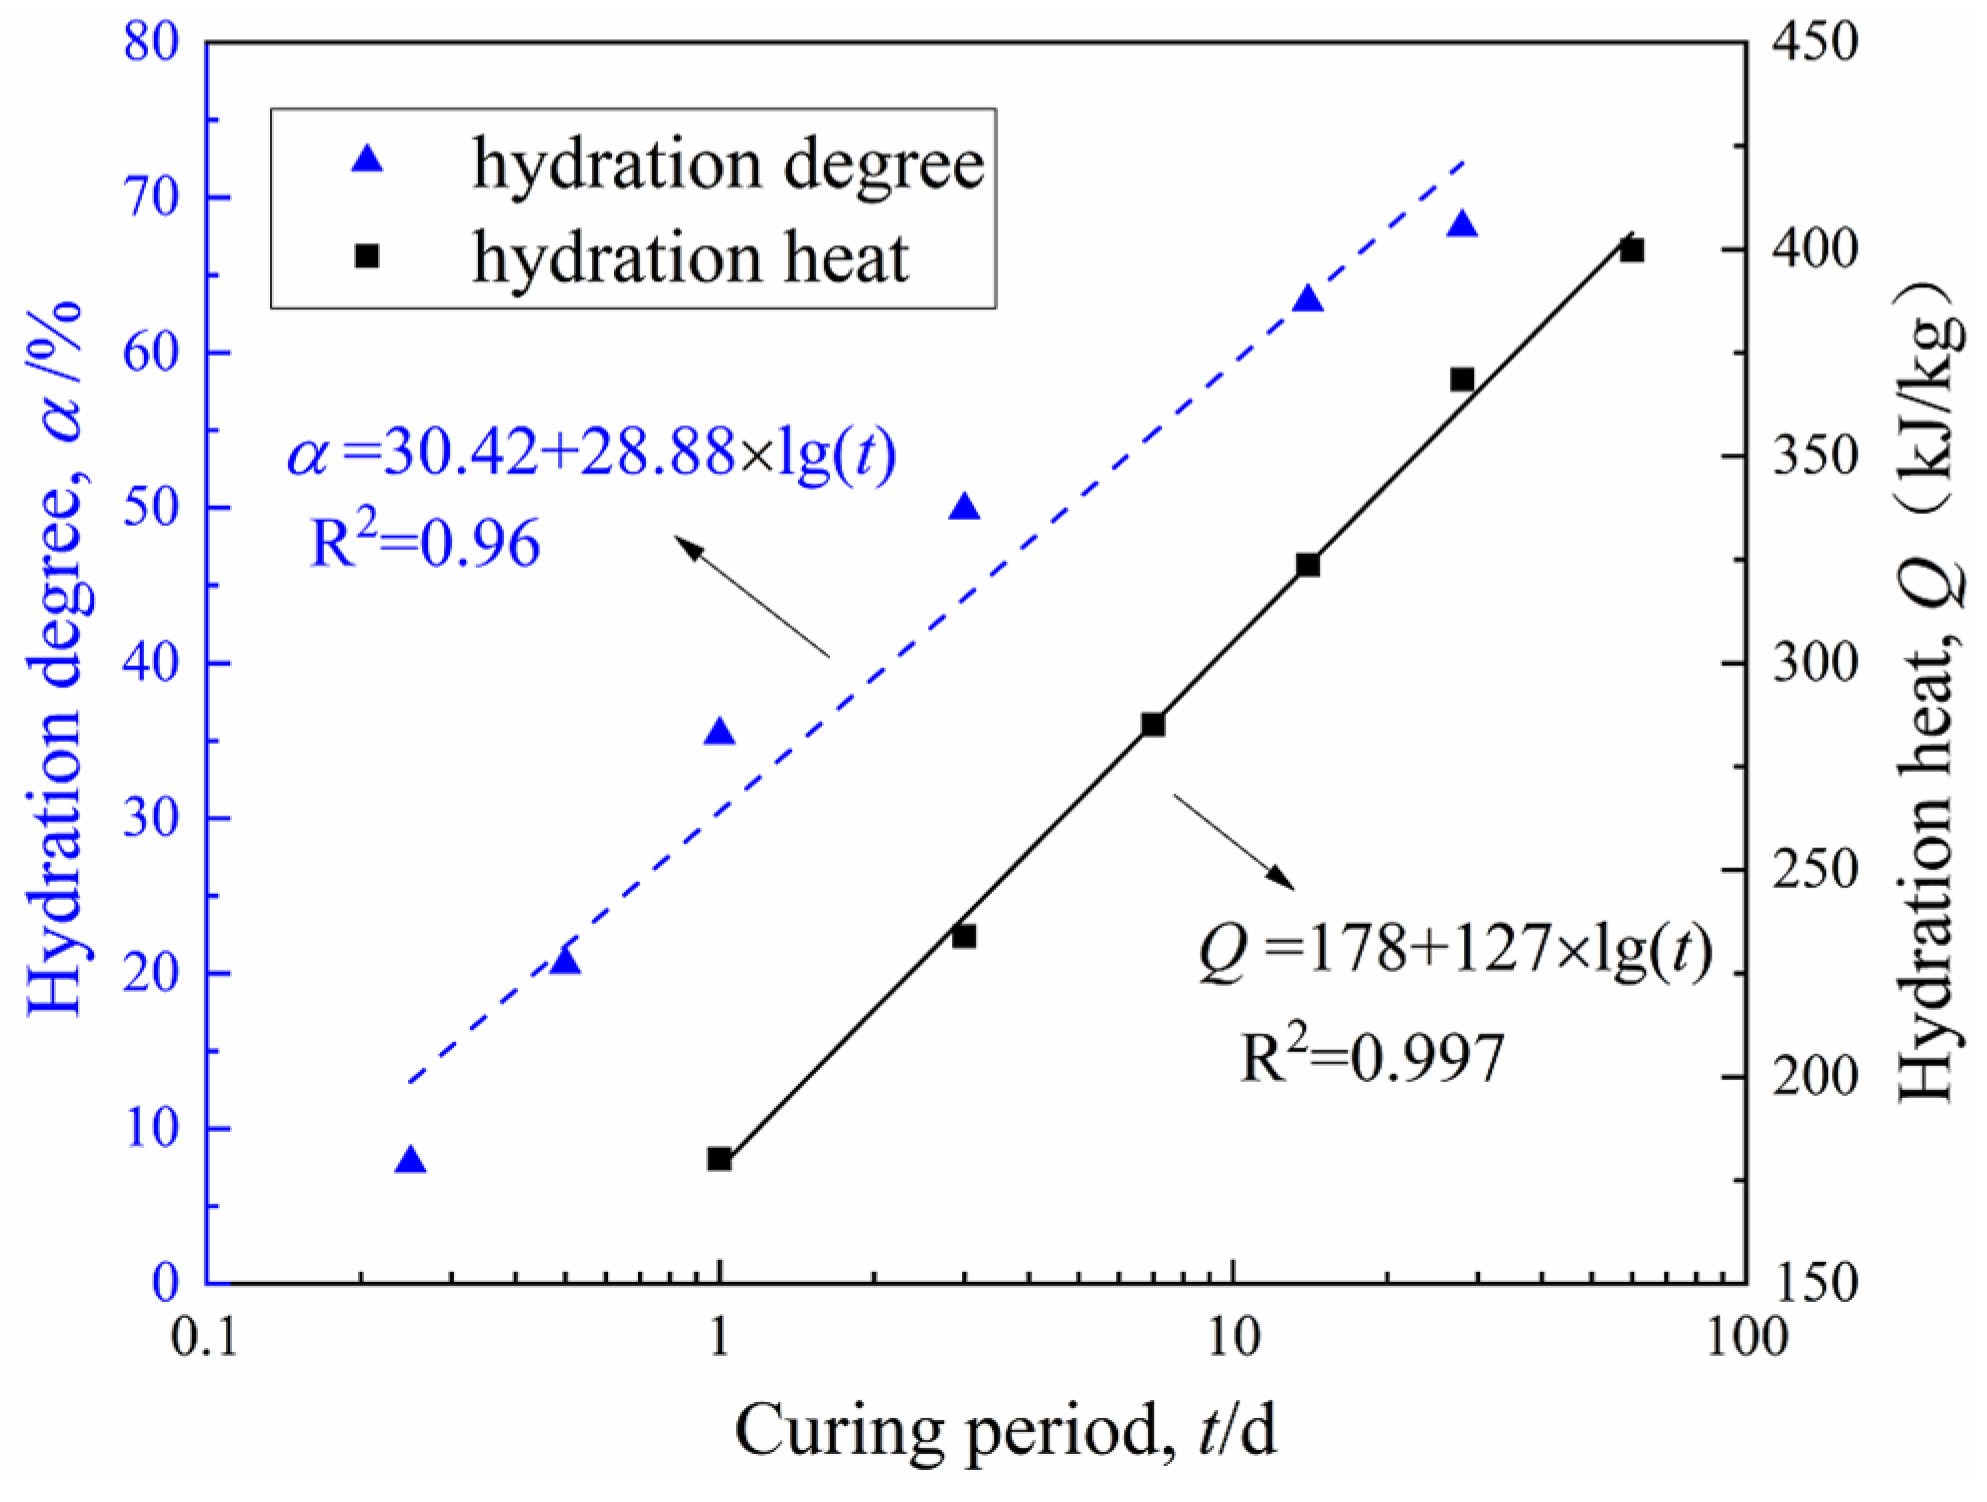
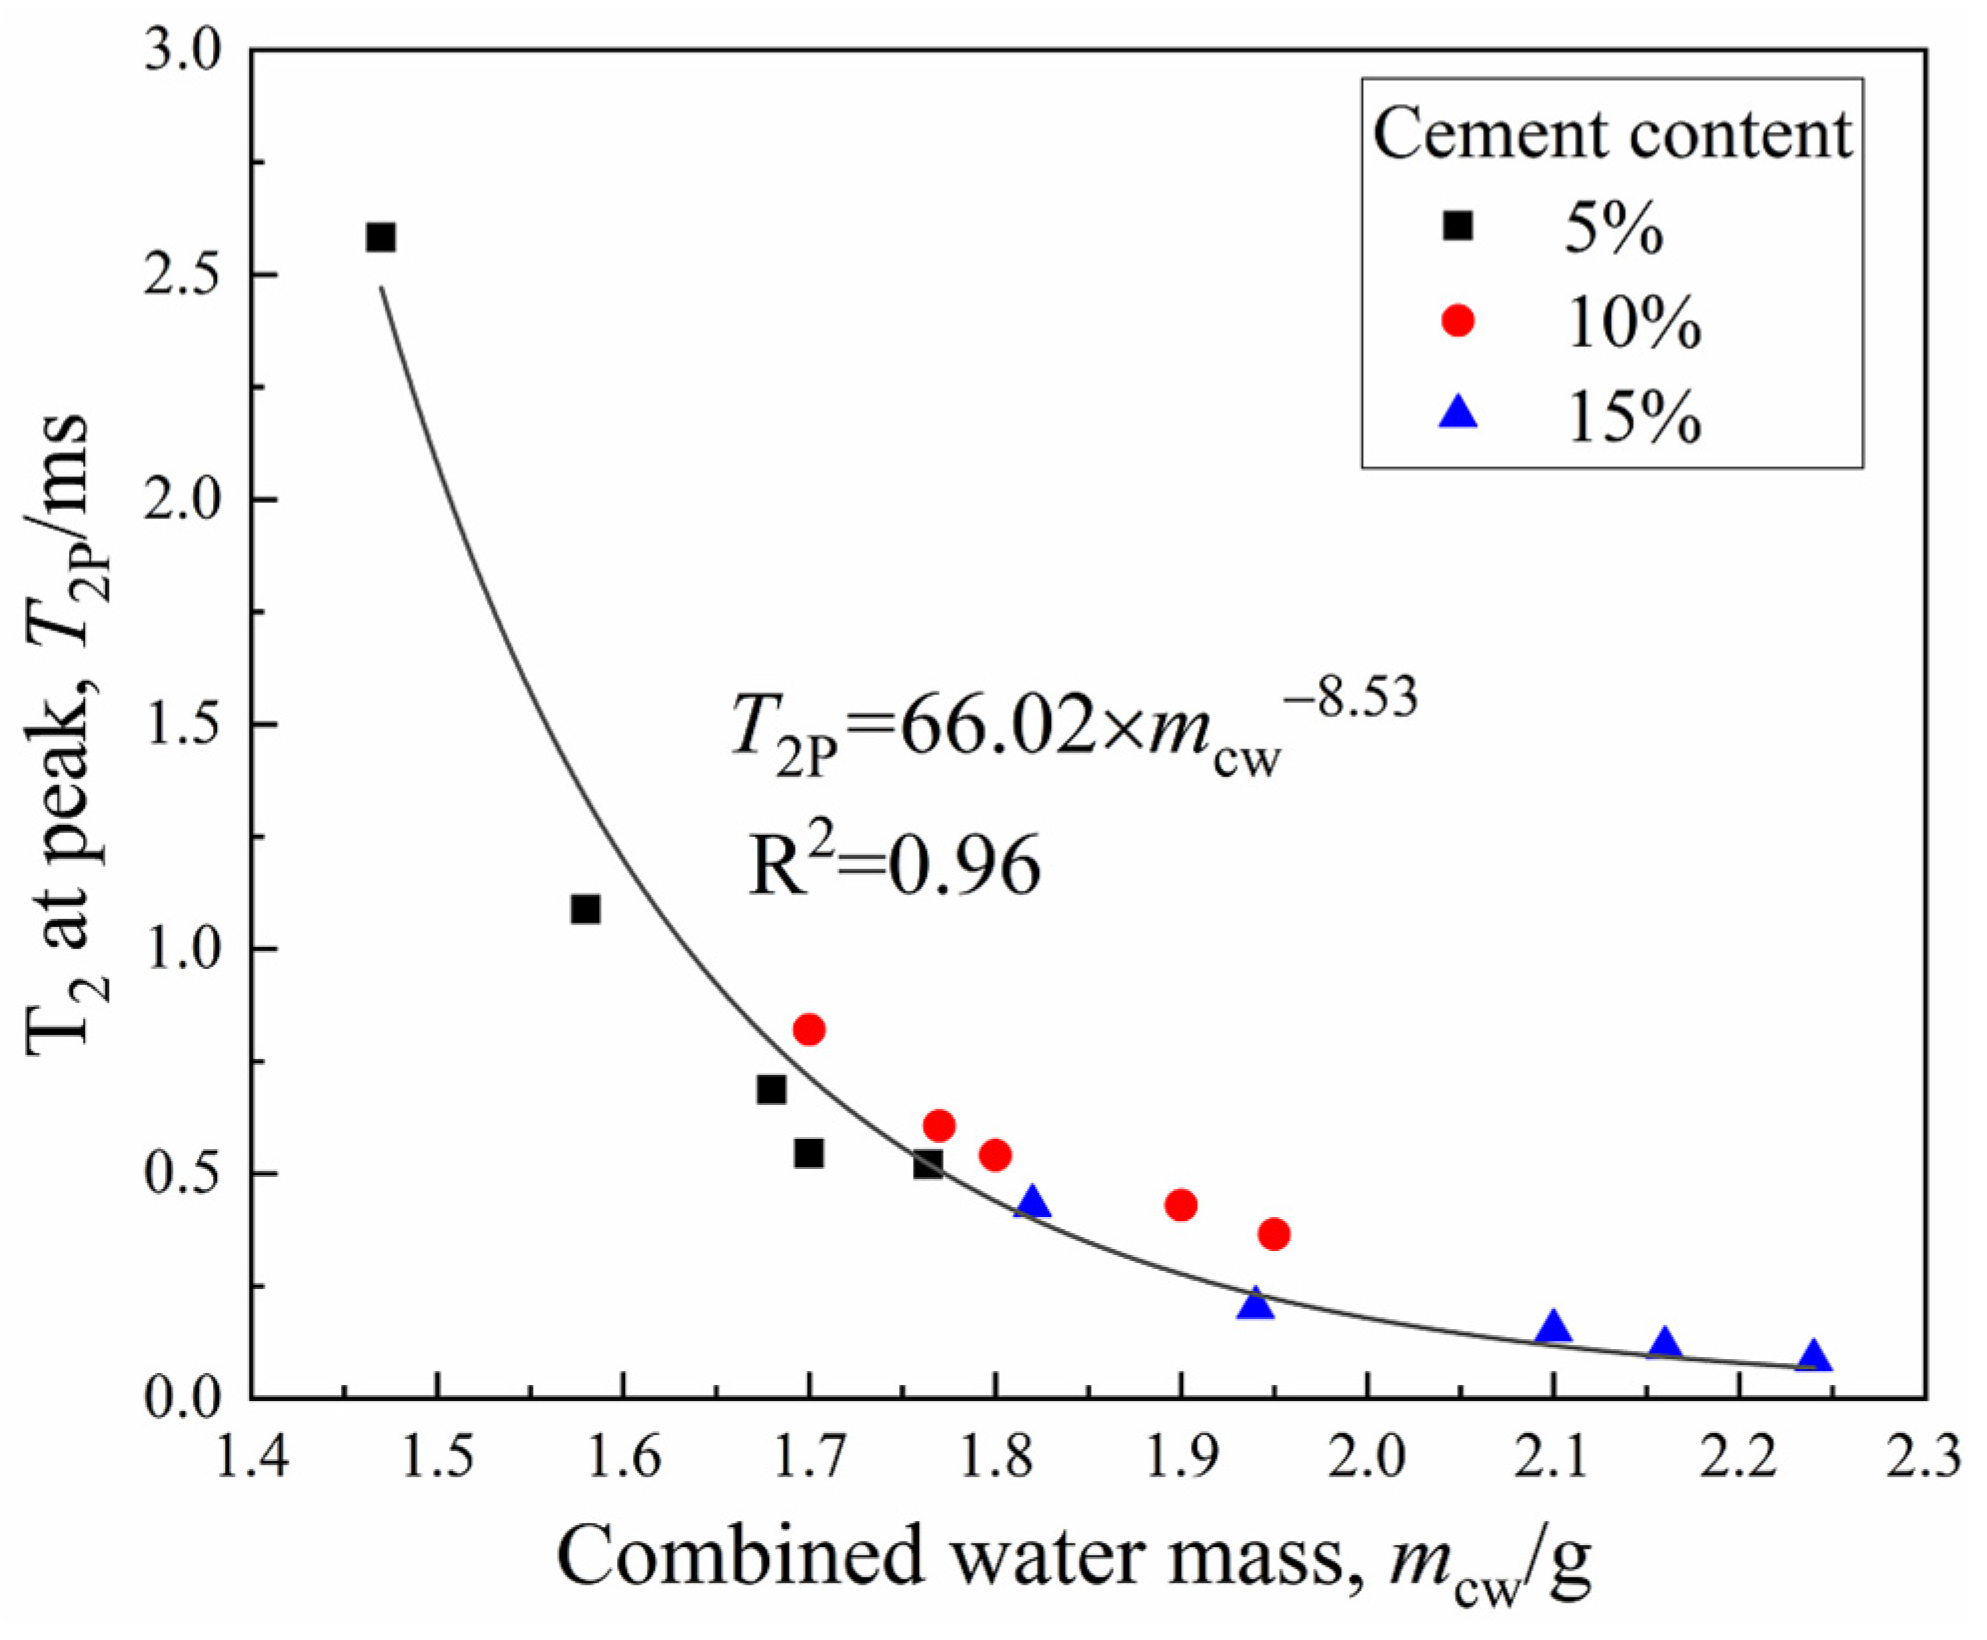
- The total peak area and the T2 at peak gradually decreased with an increasing curing period and cement content, indicating that more liquid pore water inside the CDS specimen transformed into combined water with cement hydration. The amount of combined water, mcw, which essentially characterized the hydration process of cement, presented a linear relationship with log (t).
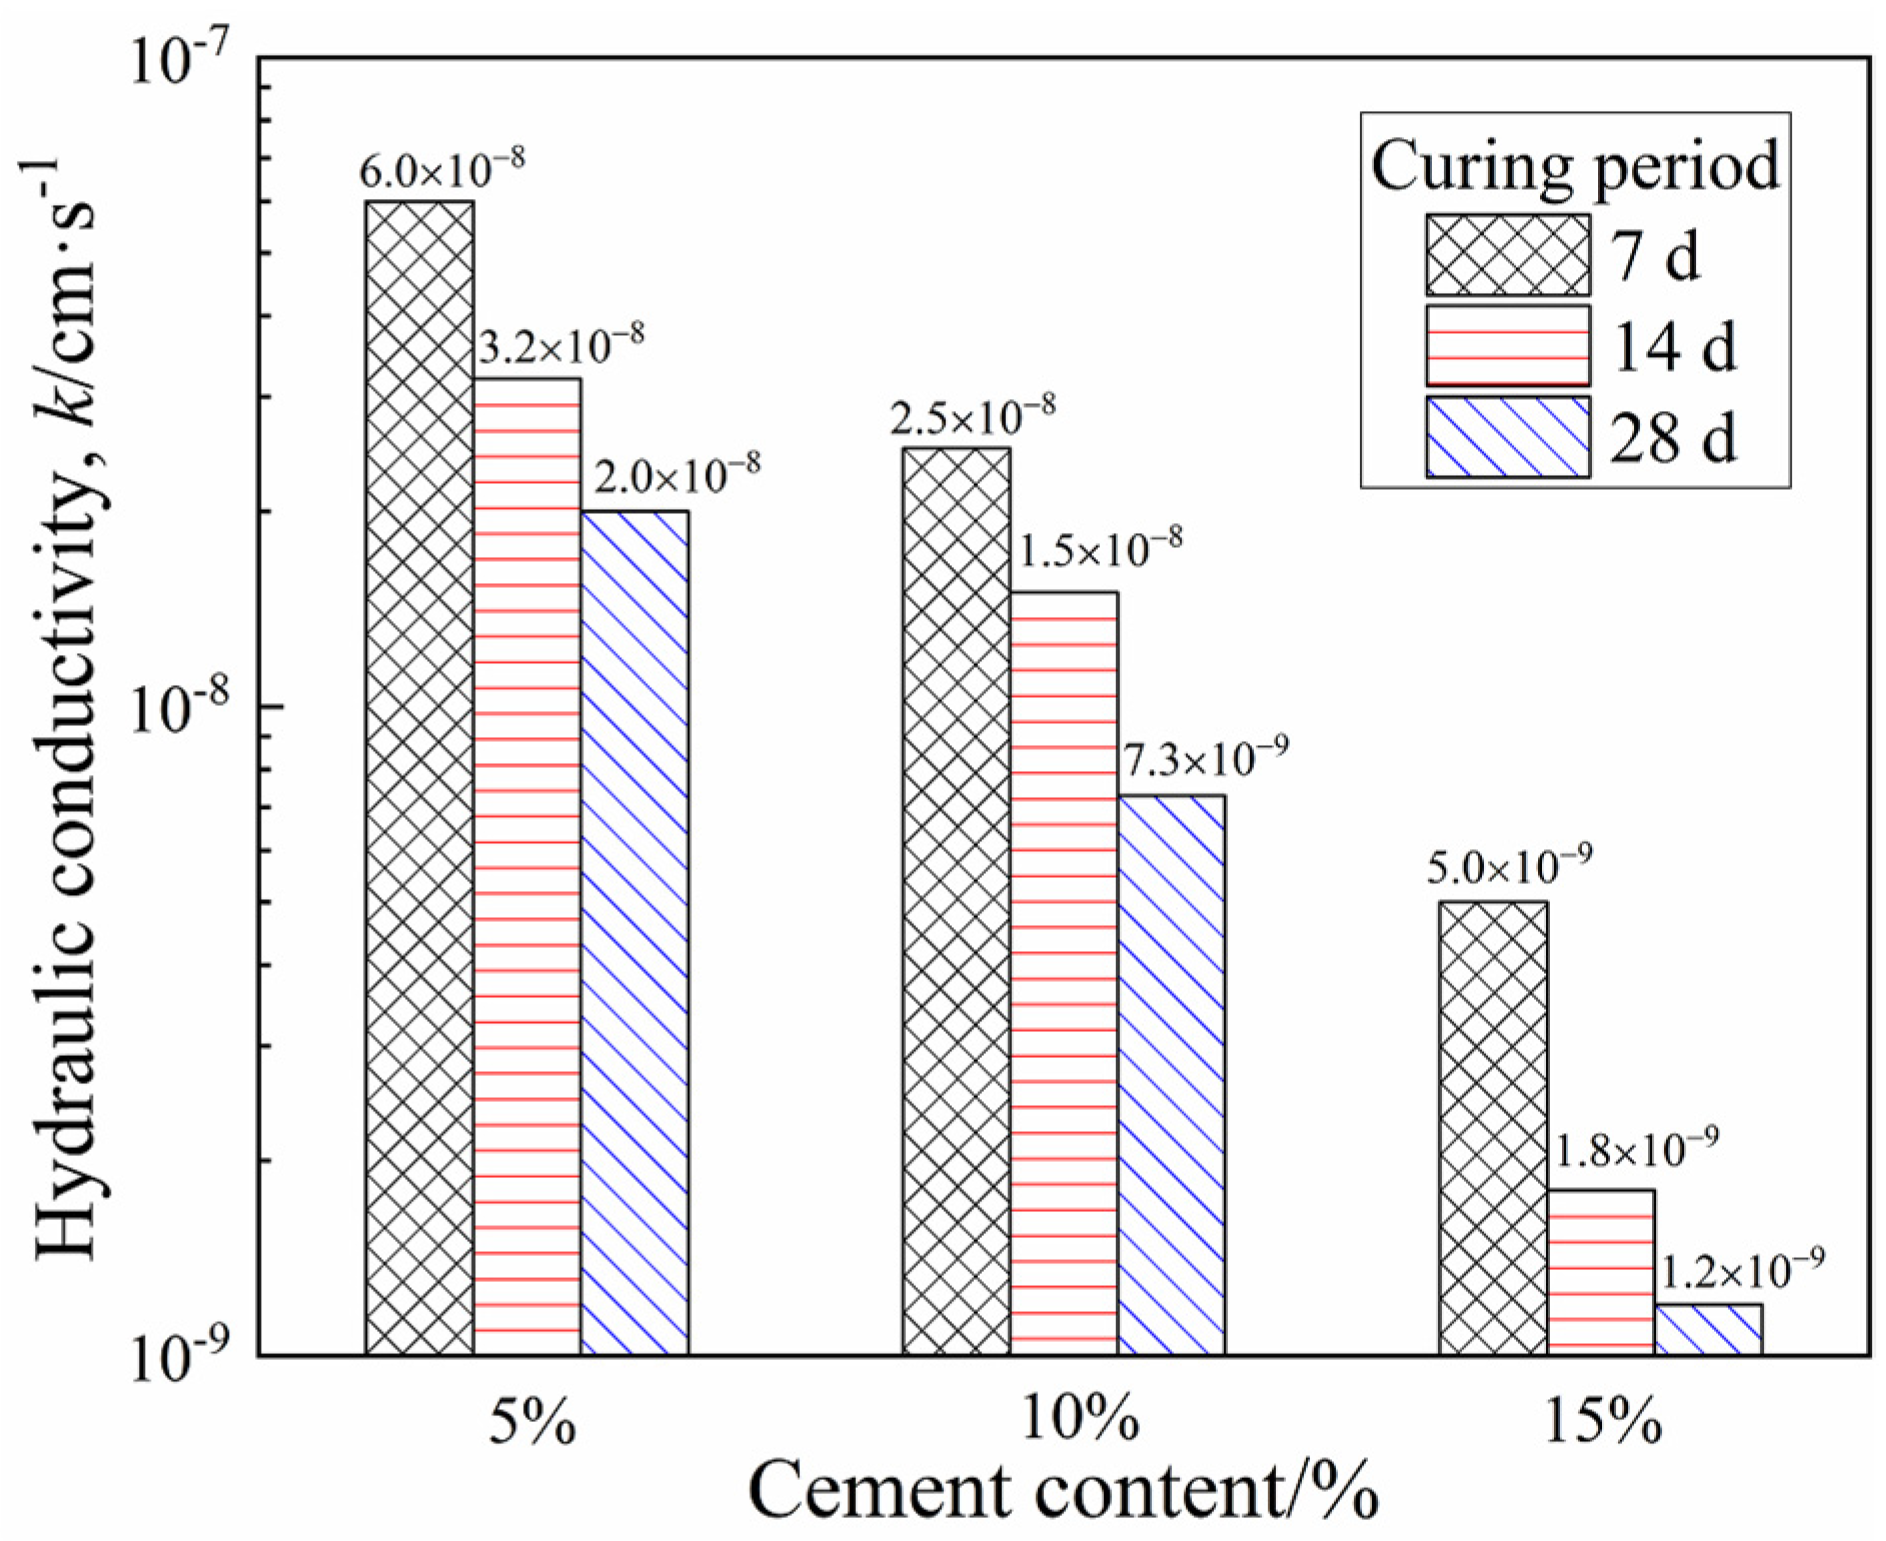
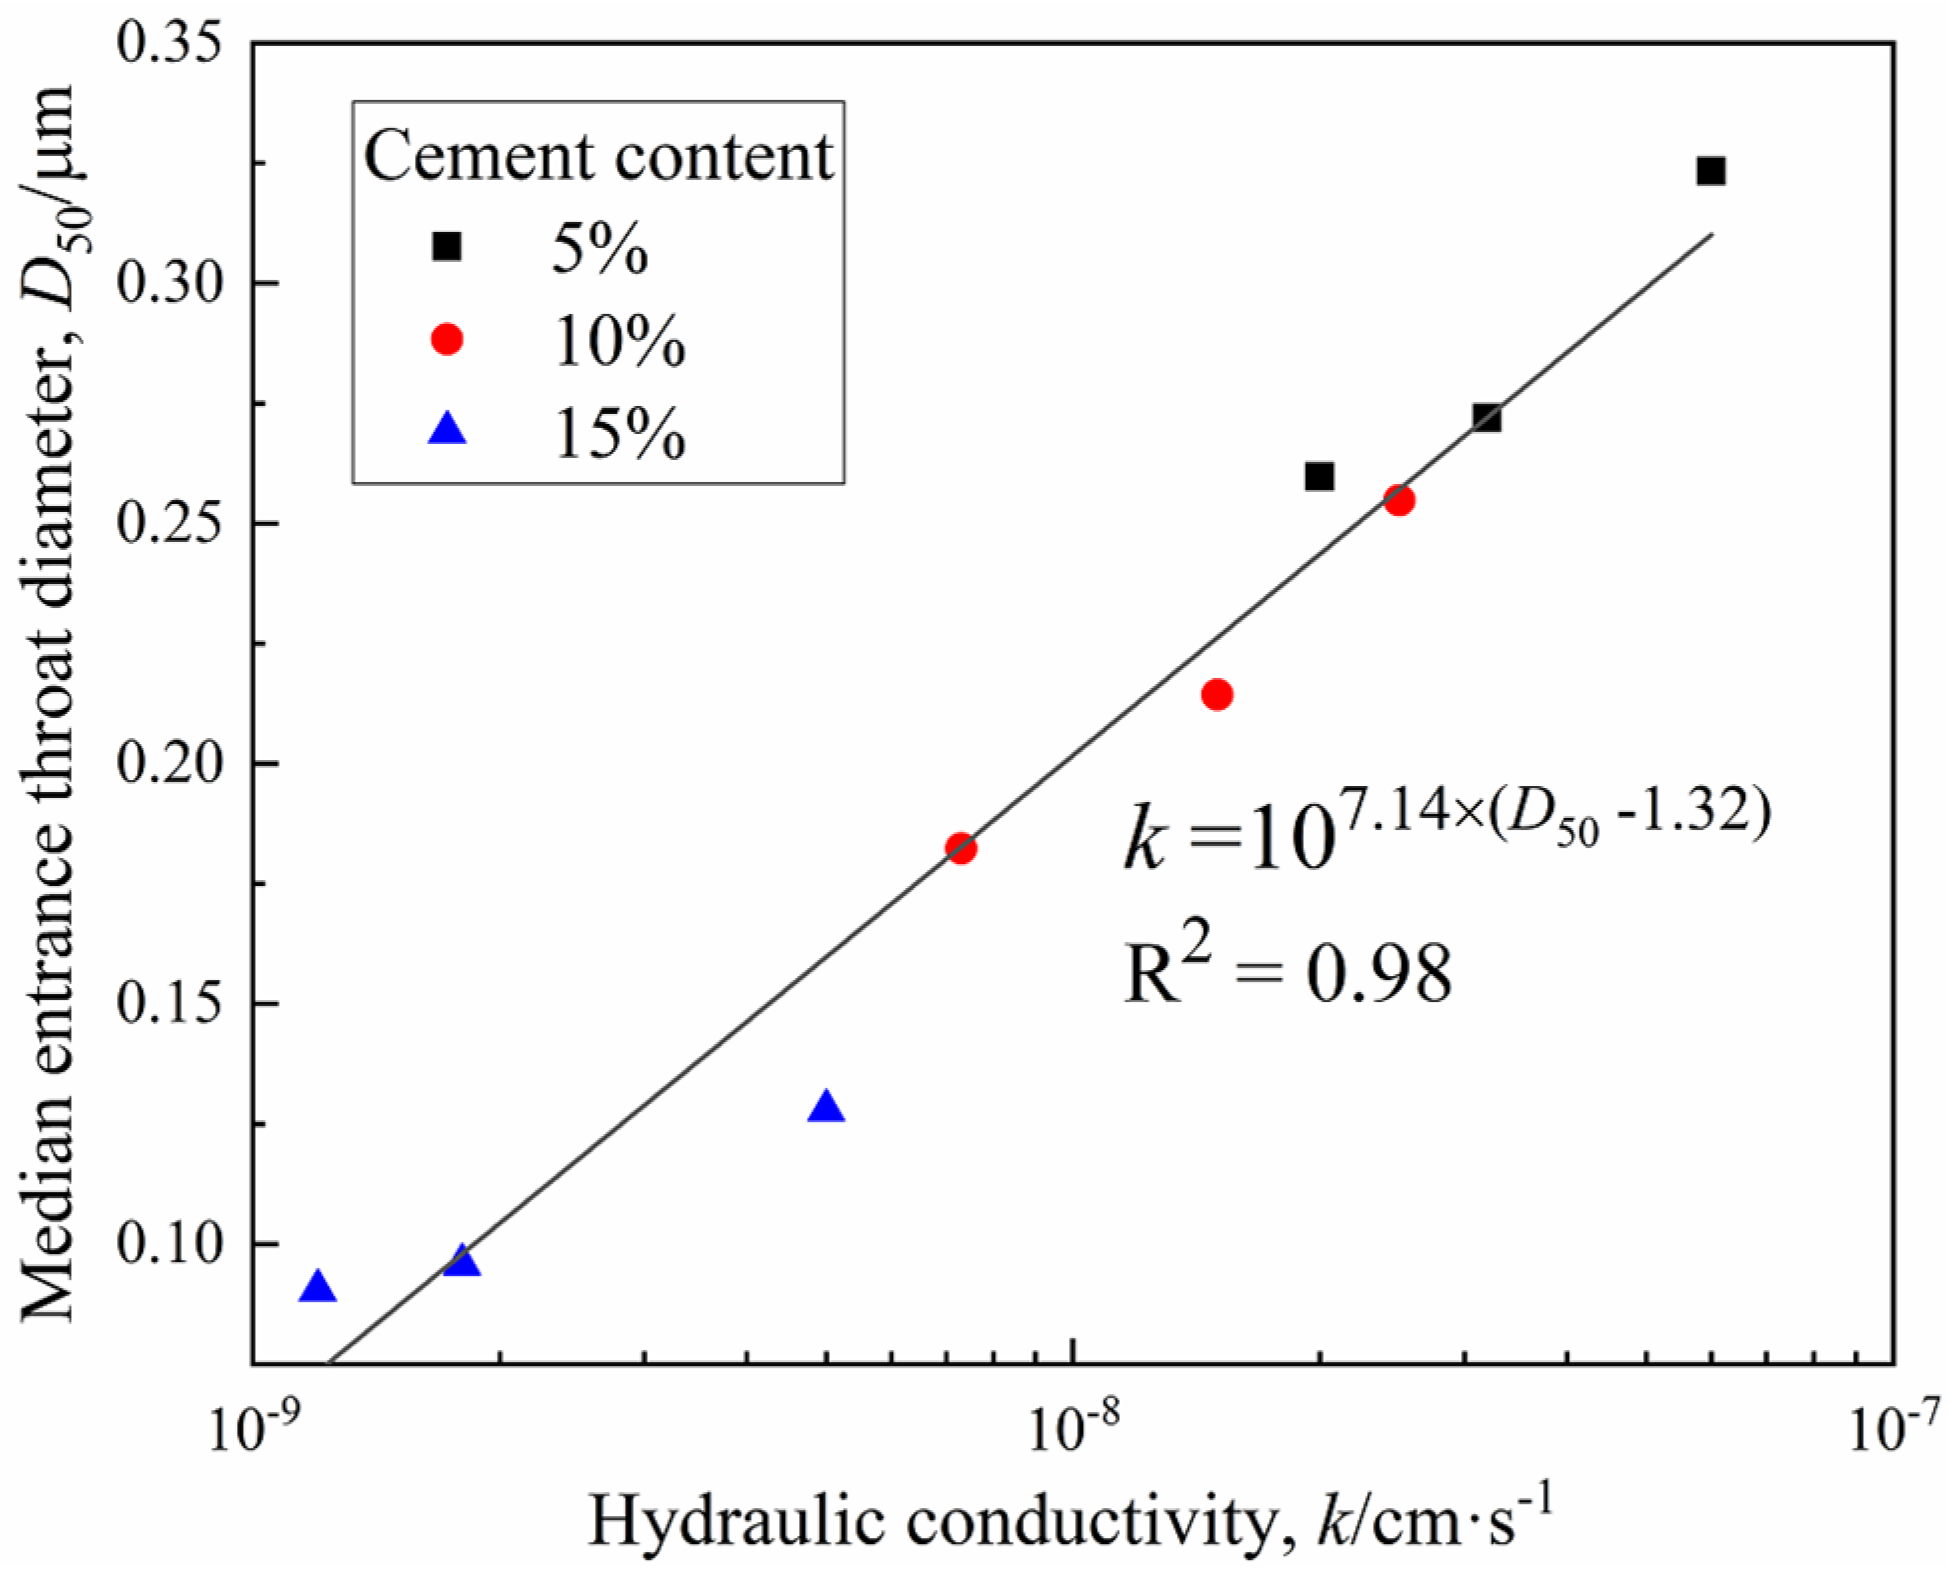
- (2)
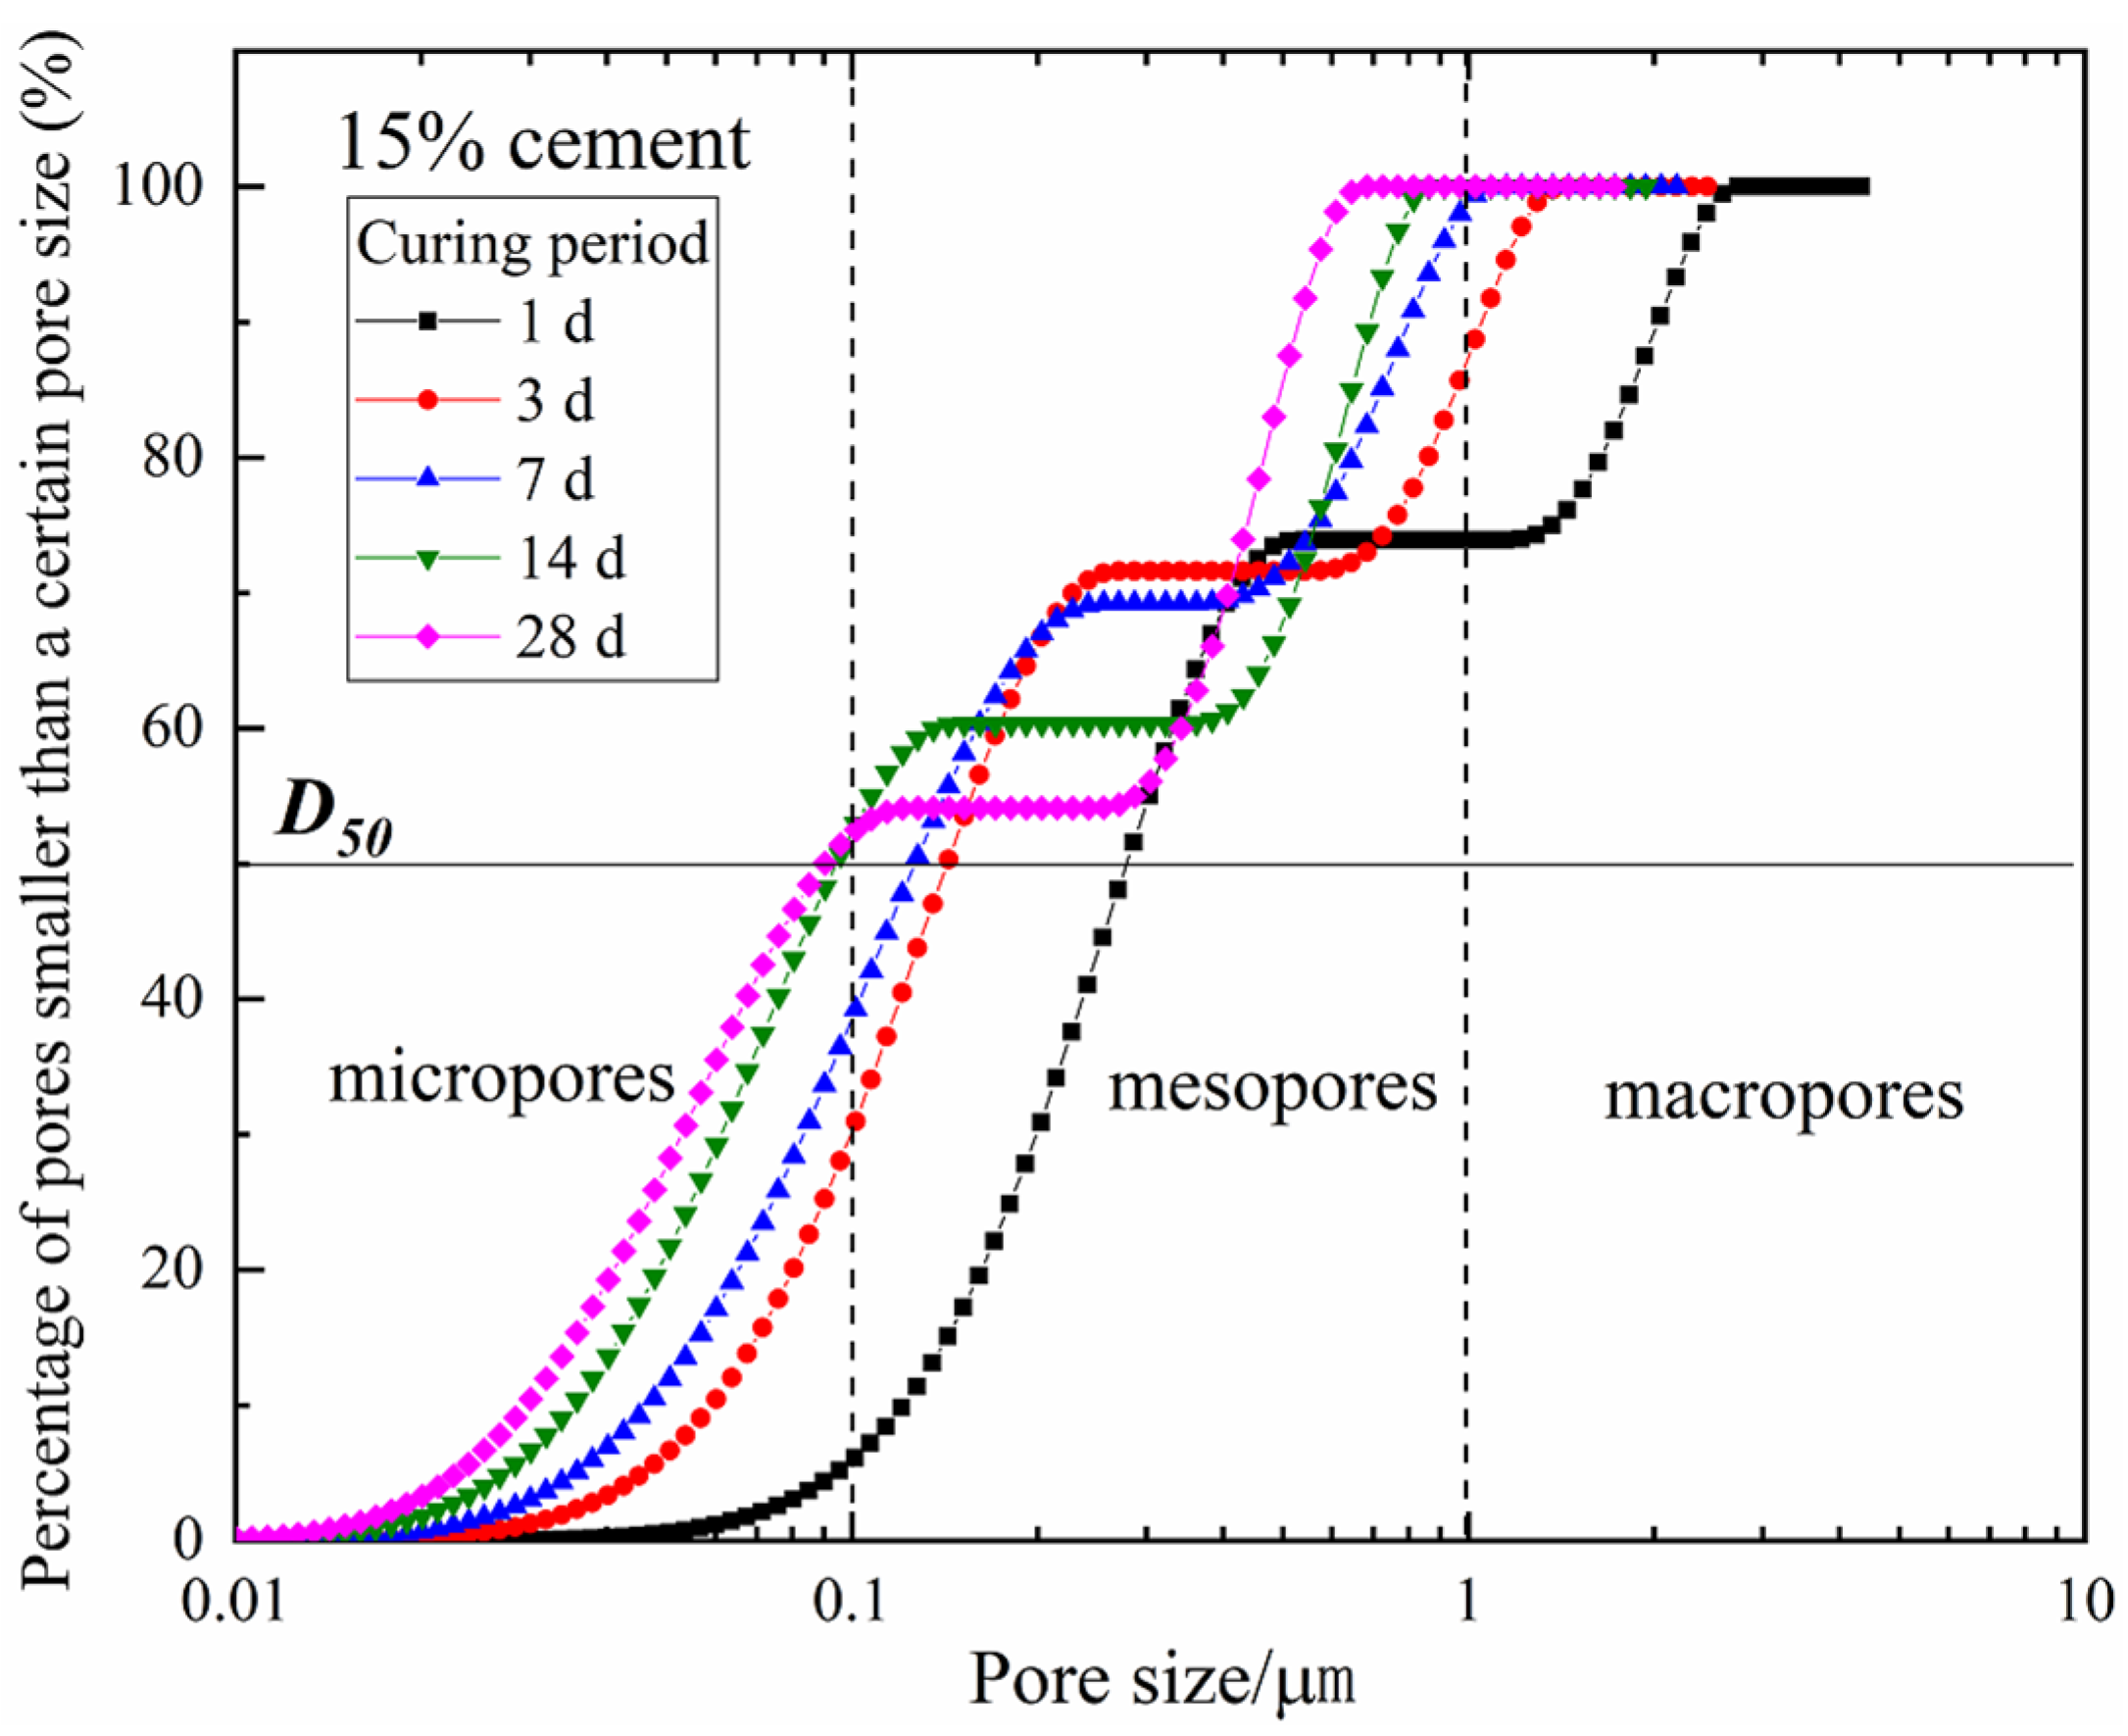
- The cementation and filling action of hydrates resulted in the transformation of large pores into smaller ones, then the proportion of mesopores and macropores gradually decreased with the curing period. In addition, the characteristics of the pore size distribution curves determined by the MIP and NMR were highly consistent. Given that there was an essential relationship between permeability and pore size distribution, the functional correlations of hydraulic conductivity k and micropore parameters D50 were established.
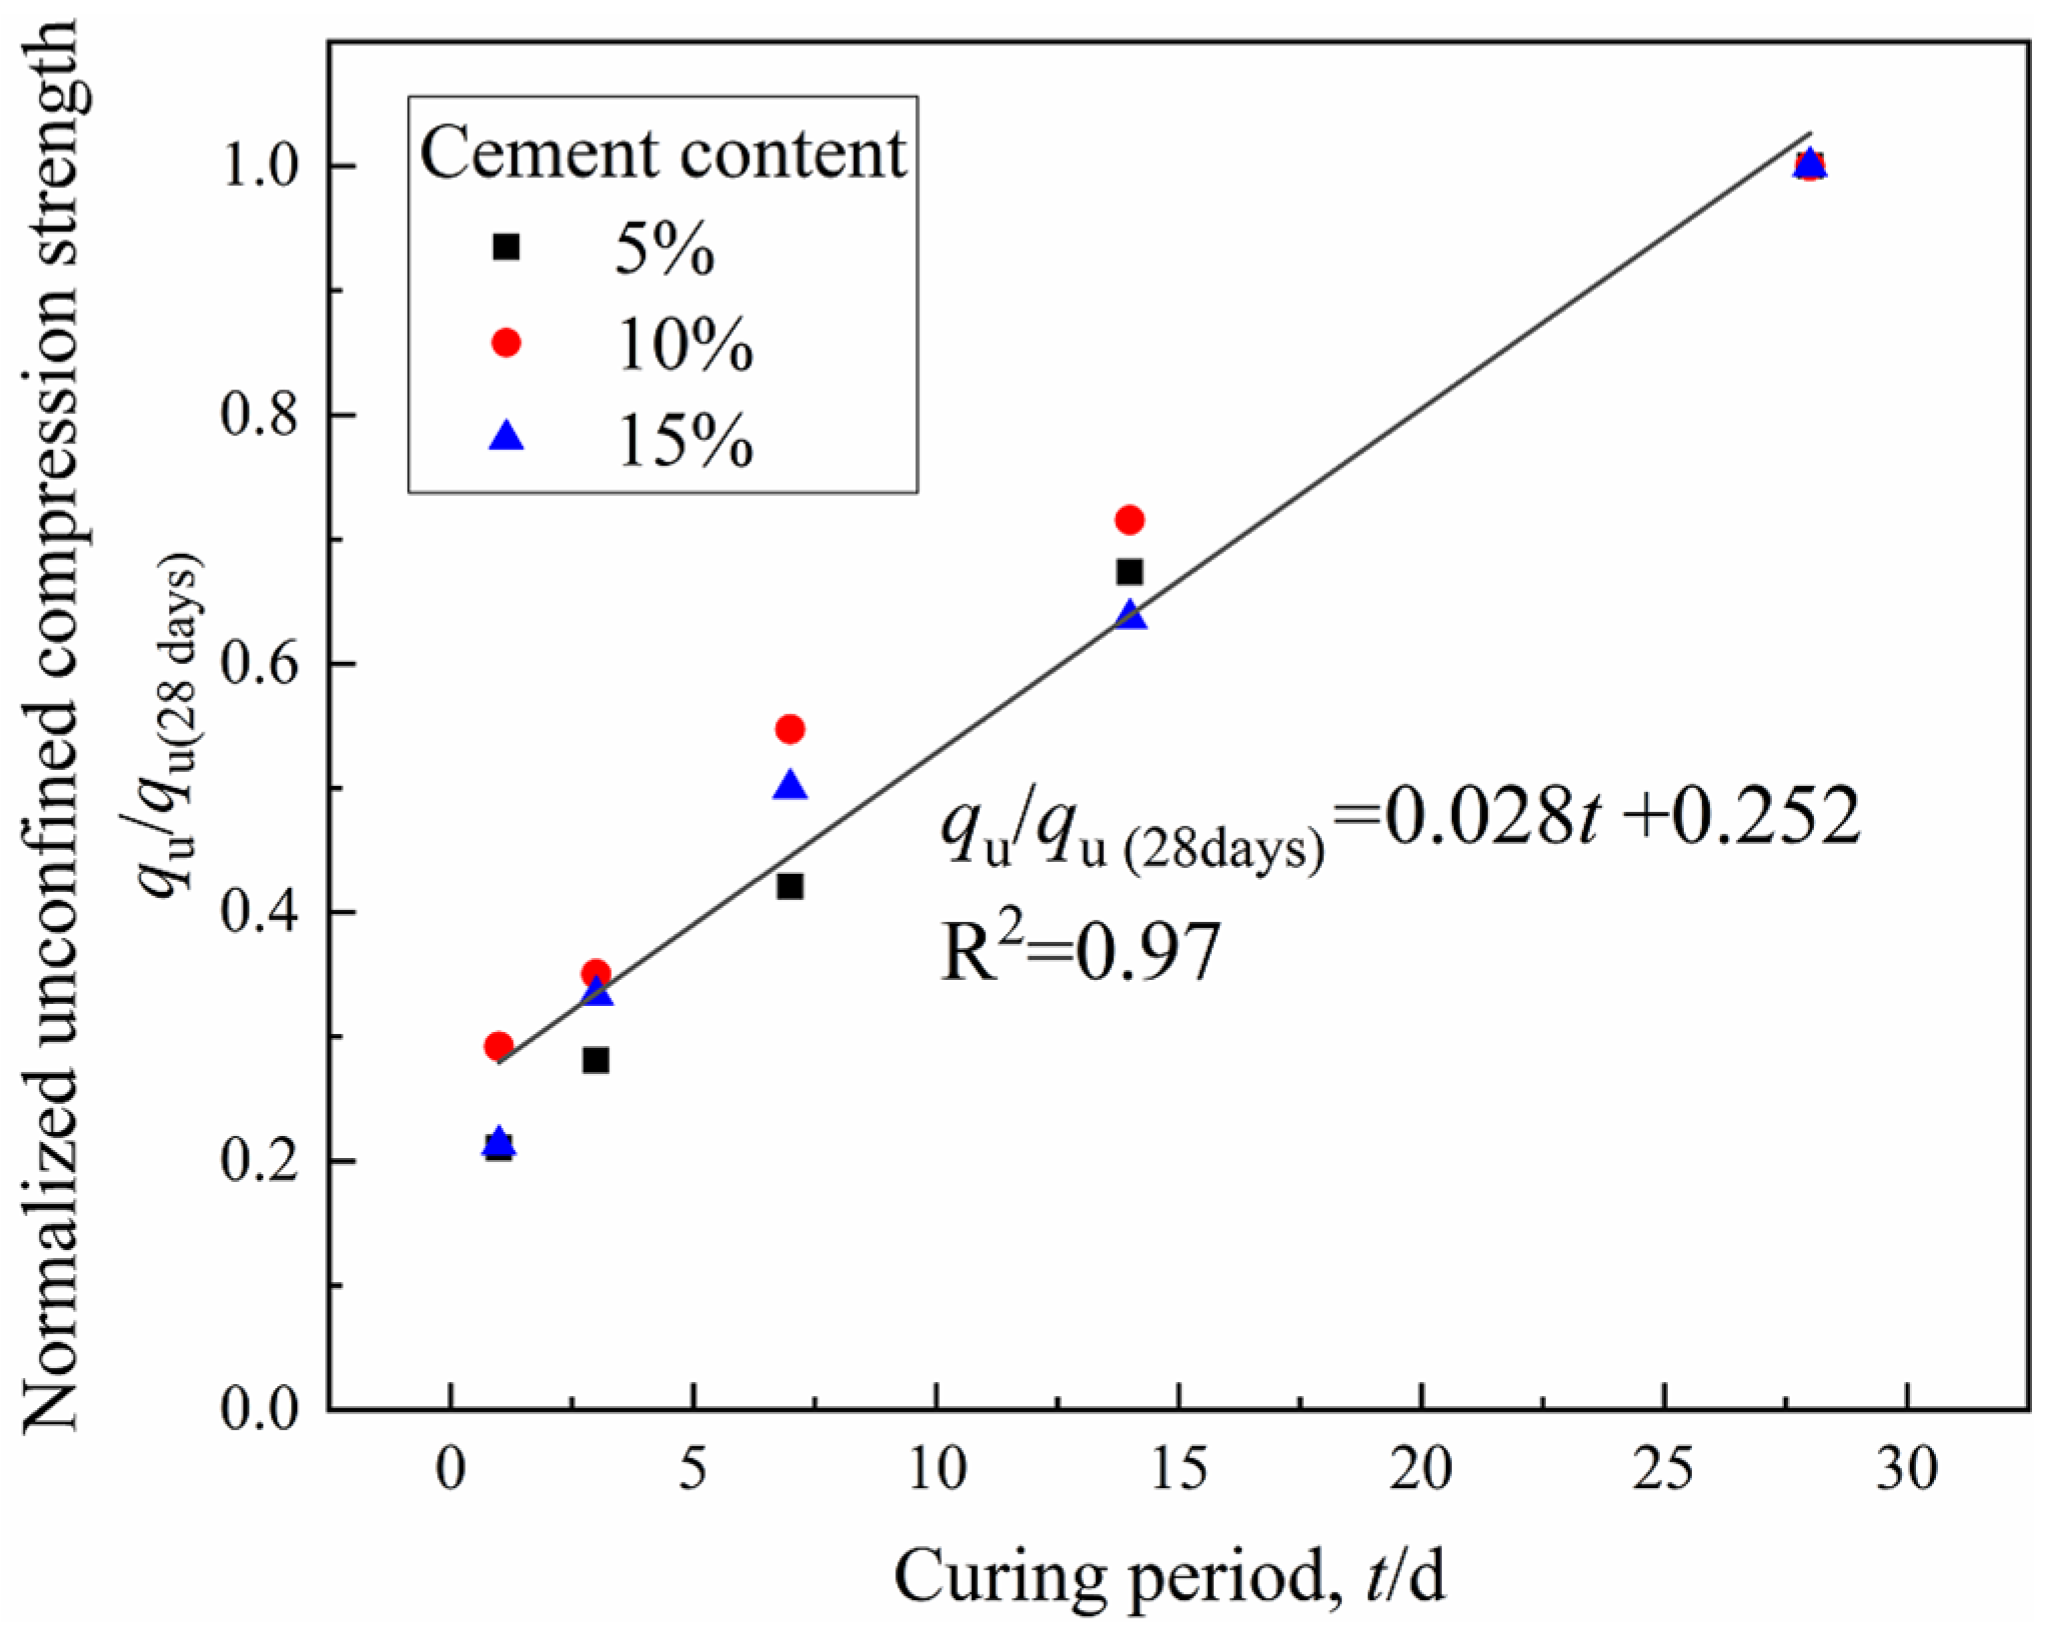
- (3)
- With the increase in the curing period, more hydrates contributed to the denser and firmer microstructure within the solidified matrix, and the stress–strain characteristic of CDS specimens changed from ductility to brittleness. Furthermore, the relationship between the normalized strength qu/qu−28d and curing period t can be characterized by a linear function.
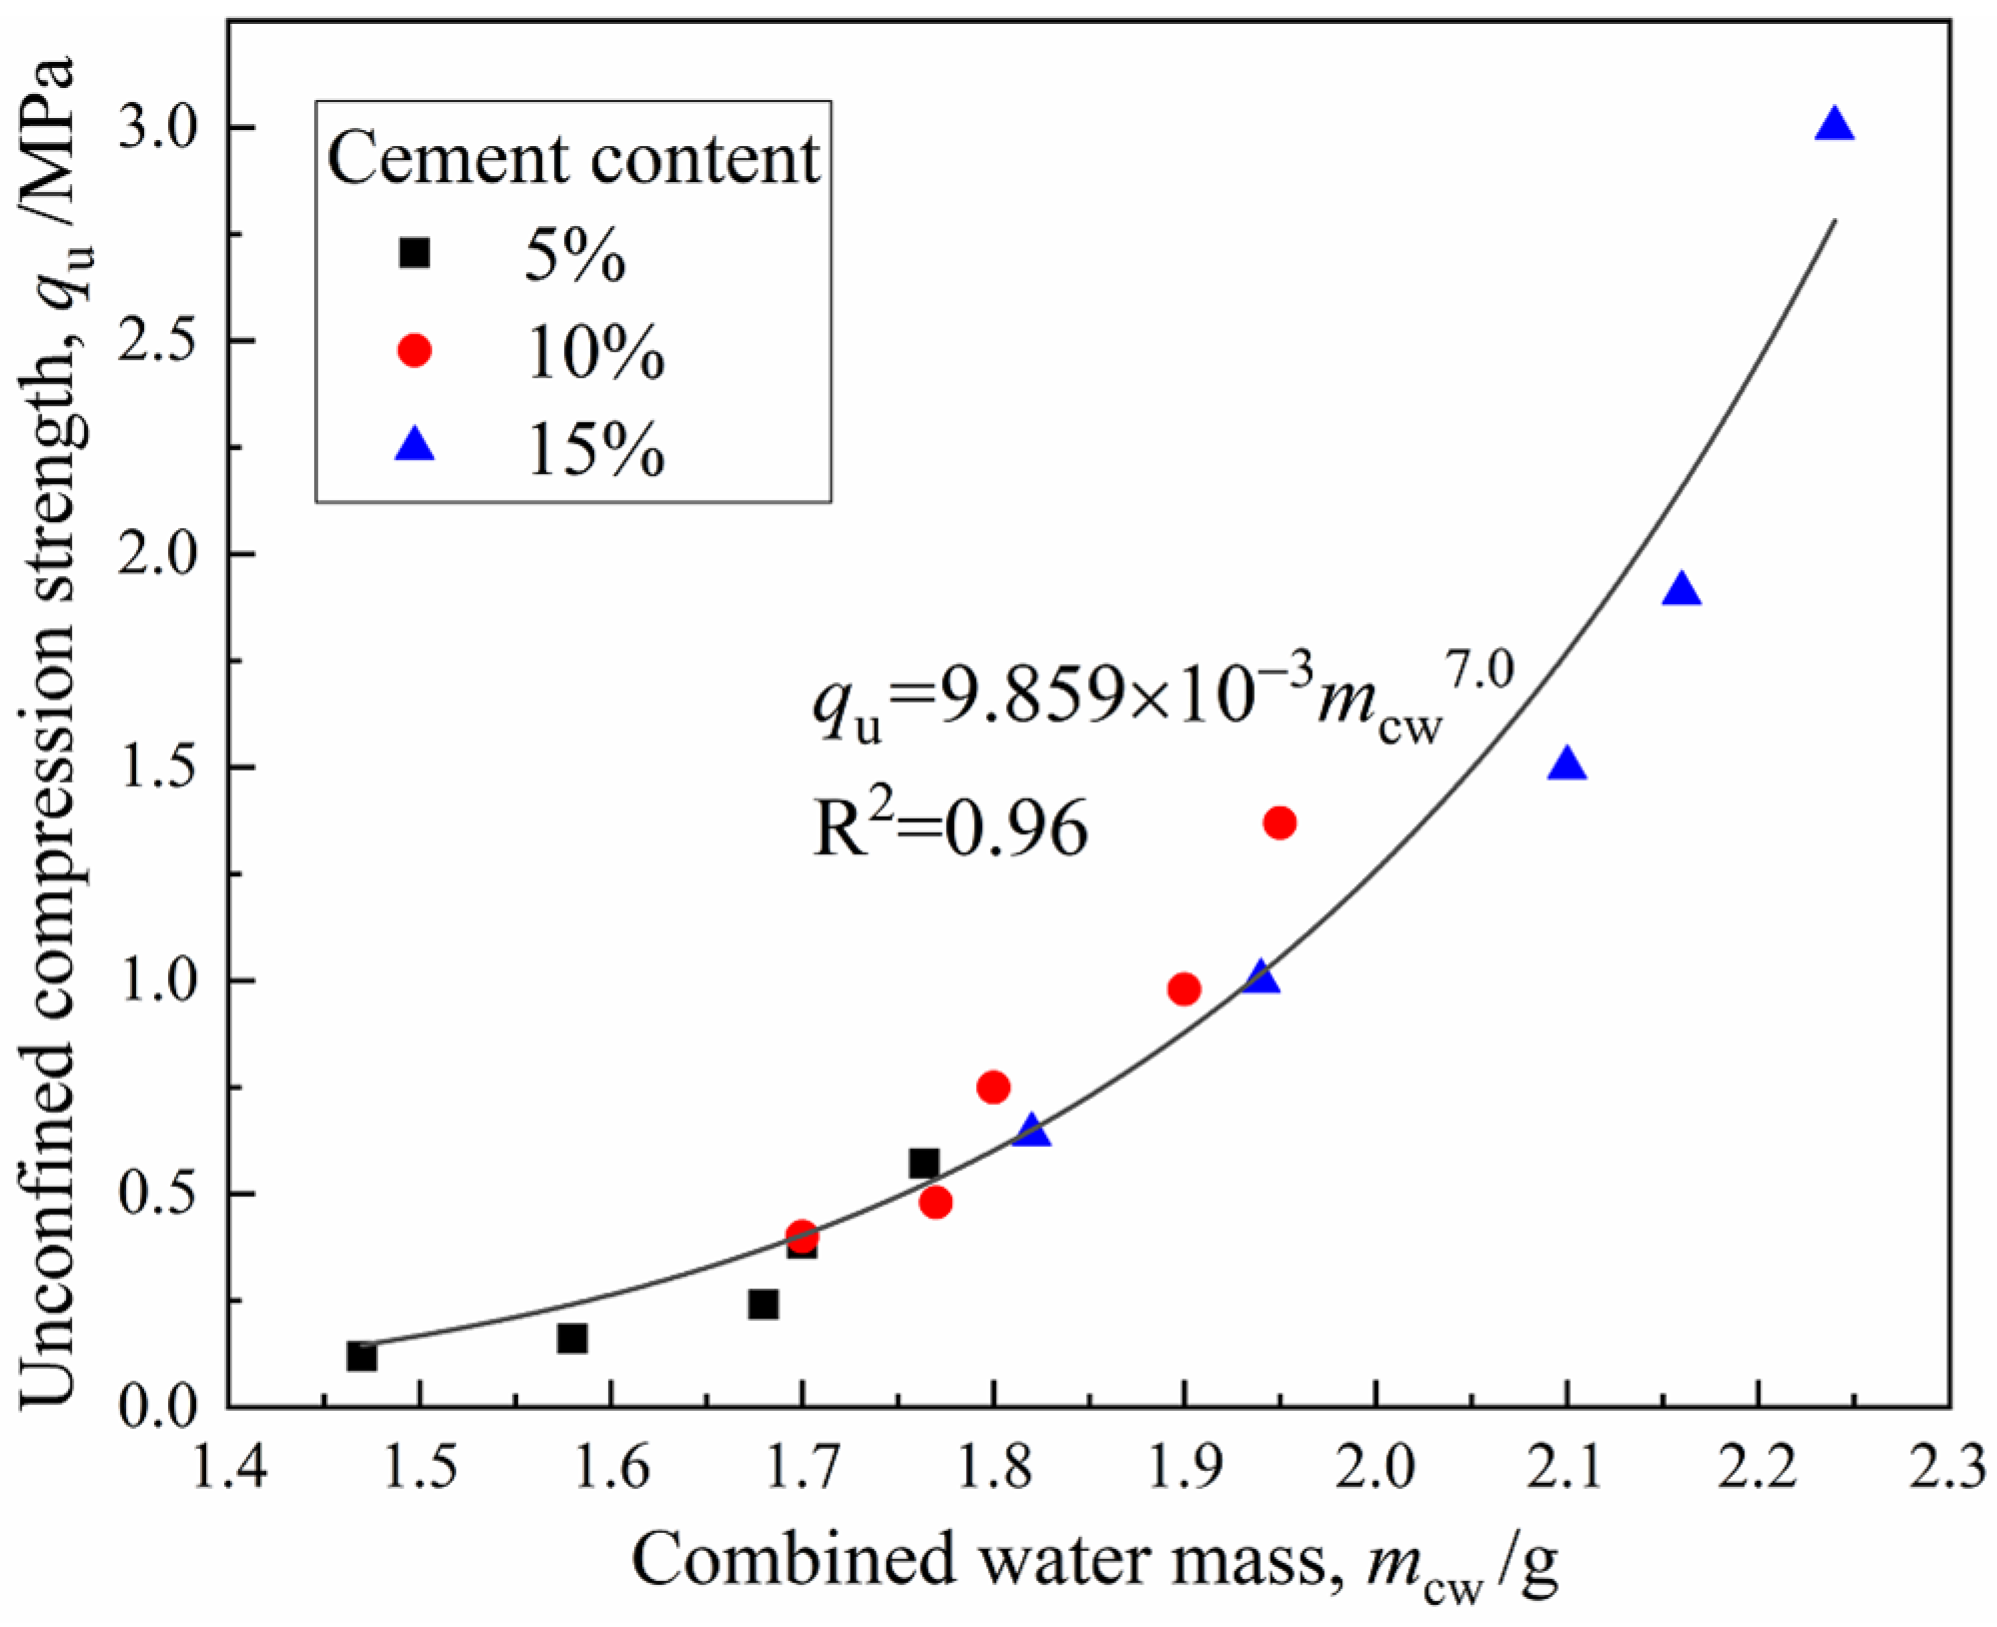
- (4)
- The parameter mcw can comprehensively characterize the influence of the curing period and cement content on the strength development of CDS from the view of a stabilization mechanism and qu increased exponentially with mcw. The microstructure characteristics measured by SEM revealed the evolution mechanism of strength and permeability more intuitively.
- (5)
- In the actual project of filling subgrade with CDS, increasing cement content can improve the strength and reduce hydraulic conductivity in a short term, which is helpful to promote the progress of some special projects with tight construction periods. In general, the curing period should be extended to at least 28 days, which is conducive to the full hydration and stabilization effect of cement.
Author Contributions
Funding
Institutional Review Board Statement
Informed Consent Statement
Data Availability Statement
Acknowledgments
Conflicts of Interest
References
- He, X.; Chen, Y.; Tan, X.; Wang, S.; Liu, L.J. Determining the water content and void ratio of cement-treated dredged soil from the hydration degree of cement. Eng. Geol. 2020, 279, 105892. [Google Scholar] [CrossRef]
- Lang, L.; Chen, B.; Li, N. Utilization of lime/carbide slag-activated ground granulated blast-furnace slag for dredged sludge stabilization. Mar. Georesources Geotechnol. 2020, 39, 659–669. [Google Scholar] [CrossRef]
- Wang, D.; Xiao, J.; Gao, X. Strength gain and microstructure of carbonated reactive MgO-fly ash solidified sludge from East Lake, China. Eng. Geol. 2019, 251, 37–47. [Google Scholar] [CrossRef]
- Bi, J.; Chian, S.C. Modelling of three-phase strength development of ordinary Portland cement- and Portland blast-furnace cement-stabilised clay. Geotechnique 2020, 70, 80–89. [Google Scholar] [CrossRef]
- Lang, L.; Chen, B.; Duan, H. Modification of nanoparticles for the strength enhancing of cement-stabilized dredged sludge. J. Rock Mech. Geotech. Eng. 2021, 13, 694–704. [Google Scholar] [CrossRef]
- Wang, D.; Gao, X.; Liu, X. Strength, durability and microstructure of granulated blast furnace slag-modified magnesium oxychloride cement solidified waste sludge. J. Clean. Prod. 2021, 292, 126072. [Google Scholar] [CrossRef]
- Zentar, R.; Dubois, V.; Abriak, N.E. Mechanical behaviour and environmental impacts of a test road built with marine dredged sediments. Resour. Conserv. Recycl. 2008, 52, 947–954. [Google Scholar] [CrossRef]
- Miraoui, M.; Zentar, R.; Abriak, N.E. Road material basis in dredged sediment and basic oxygen furnace steel slag. Constr. Build. Mater. 2012, 30, 309–319. [Google Scholar] [CrossRef]
- Siham, K.; Fabrice, B.; Edine, A.N. Marine dredged sediments as new materials resource for road construction. Waste Manag. 2008, 28, 919–928. [Google Scholar] [CrossRef] [PubMed]
- Wang, D.; Abriak, N.E.; Zentar, R. Dredged marine sediments used as novel supply of filling materials for road construction. Mar. Geotechnol. 2017, 35, 472–480. [Google Scholar] [CrossRef]
- Achour, R.; Abriak, N.E.; Zentar, R. Valorization of unauthorized sea disposal dredged sediments as a road foundation material. Environ. Technol. 2014, 35, 1997–2007. [Google Scholar] [CrossRef]
- Wang, D.; Zentar, R.; Abriak, N.E. Temperature-accelerated strength development in stabilized marine soils as road construction materials. J. Mater. Civ. Eng. 2017, 29, 04016281. [Google Scholar] [CrossRef]
- Dubois, V.; Abriak, N.E.; Zentar, R. The use of marine sediments as a pavement base material. Waste Manag. 2009, 29, 774–782. [Google Scholar] [CrossRef]
- Horpibulsuk, S.; Nagaraj, T.S.; Miura, N. Assessment of strength development in cement-admixed high water content clays with Abrams’ law as a basis. Géotechnique 2003, 53, 439–444. [Google Scholar] [CrossRef]
- Horpibulsuk, S.; Miura, N.; Nagaraj, T.S. Clay–Water/Cement Ratio Identity for Cement Admixed Soft Clays. J. Geotech. Geoenviron. Eng. 2005, 131, 187–192. [Google Scholar] [CrossRef]
- Yao, K.; Pan, Y.; Jia, L. Strength evaluation of marine clay stabilized by cementitious binder. Mar. Georesources Geotechnol. 2020, 38, 730–743. [Google Scholar] [CrossRef]
- Zhang, R.J.; Santoso, A.M.; Tan, T.S. Strength of high water-content marine clay stabilized by low amount of cement. J. Geotech. Geoenviron. Eng. 2013, 139, 2170–2181. [Google Scholar] [CrossRef]
- Zentar, R.; Abriak, N.E.; Dubois, V. Effects of salts and organic matter on Atterberg limits of dredged marine sediments. Appl. Clay Sci. 2009, 42, 391–397. [Google Scholar] [CrossRef]
- Zhu, W.; Chiu, C.F. Role of Soil Water in Cement-Based Treatment of Dredged Materials. In Advances in Environmental Geotechnics; Springer: Berlin/Heidelberg, Germany, 2010; pp. 395–404. [Google Scholar]
- Zhu, W.; Zhang, C.L.; Chiu, A. Soil–Water Transfer Mechanism for Solidified Dredged Materials. J. Geotech. Geoenviron. Eng. 2007, 133, 588–598. [Google Scholar] [CrossRef]
- Yu, J.; Sun, M.; He, S. Accumulative Deformation Characteristics and Microstructure of Saturated Soft Clay under Cross-River Subway Loading. Materials 2021, 14, 537. [Google Scholar] [CrossRef]
- Yao, C.; Wei, C.; Ma, T. Experimental Investigation on the Influence of Thermochemical Effect on the Pore–Water Status in Expansive Soil. Int. J. Geomech. 2021, 21, 04021080. [Google Scholar] [CrossRef]
- Tian, H.; Wei, C.; Wei, H. Freezing and thawing characteristics of frozen soils: Bound water content and hysteresis phenomenon. Cold Reg. Sci. Technol. 2014, 103, 74–81. [Google Scholar] [CrossRef]
- Tian, H.; Wei, C.; Wei, H. An NMR-based analysis of soil–water characteristics. Appl. Magn. Reson. 2014, 45, 49–61. [Google Scholar] [CrossRef]
- Rao, B.; Su, X.; Qiu, S. Meso-mechanism of mechanical dewatering of municipal sludge based on low-field nuclear magnetic resonance. Water Res. 2019, 162, 161–169. [Google Scholar] [CrossRef]
- Bird, N.; Preston, A.R.; Randall, E.W. Measurement of the size distribution of water-filled pores at different matric potentials by stray field nuclear magnetic resonance. Eur. J. Soil Sci. 2005, 56, 135–143. [Google Scholar] [CrossRef]
- Wang, Y.-W. Study on Hydration Model and Application of Mineral Admixture Cement; Zhejiang University: Zhejiang, China, 2014. (In Chinese) [Google Scholar]
- Dong, J.; Li, Z. Exothermic Model of Fly Ash-Cement System Hydration. Coal Ash China 2010, 6, 18–20. (In Chinese) [Google Scholar]
- Deng, Y.; Yue, X.; Liu, S. Hydraulic conductivity of cement-stabilized marine clay with metakaolin and its correlation with pore size distribution. Eng. Geol. 2015, 193, 146–152. [Google Scholar] [CrossRef]
- Wang, L.; Chen, L.; Tsang, D.W.C.W. Recycling dredged sediment into fill materials, partition blocks, and paving blocks: Technical and economic assessment. J. Clean. Prod. 2018, 199, 69–76. [Google Scholar] [CrossRef]
- Fan, X.; Zhu, W.; Qian, Y.; Wu, S.; Lin, N. Increasing the hydraulic conductivity of solidified sewage sludge for use as temporary landfill cover. Adv. Civ. Eng. 2019, 2019, 8163563. [Google Scholar] [CrossRef]
- Childs, E.C.; Collis-George, N. The permeability of porous materials. Proc. R. Soc. Lond. Ser. A Math. Phys. Sci. 1950, 201, 392–405. [Google Scholar]
- Xu, W.; Li, K.; Chen, L.; Kong, W.; Liu, C. The impacts of freeze-thaw cycles on saturated hydraulic conductivity and microstructure of saline-alkali soils. Sci. Rep. 2021, 11, 18655. [Google Scholar] [CrossRef] [PubMed]
- Yuan, S.Y.; Liu, X.F.; Buzzi, O. Effects of soil structure on the permeability of saturated Maryland clay. Geotechnique 2019, 69, 72–78. [Google Scholar] [CrossRef]
- Spagnoli, G.; Romero, E.; Fraccica, A.; Arroyo, M.; Gomez, R. The effect of curing conditions on the hydromechanical properties of a metakaolin-based soilcrete. Geotechnique 2020, 72, 455–469. [Google Scholar] [CrossRef]


| Parameters | Values |
|---|---|
| Specific gravity | 2.71 |
| Liquid limit, % | 50.0 |
| Plastic limit, % | 25.0 |
| Plastic index (IP) | 25.2 |
| Clay fraction (d < 0.005 mm), % | 21.0 |
| Silt fraction (0.005 mm < d < 0.075 mm), % | 64.0 |
| Sand fraction (d > 0.075 mm), % | 15.0 |
| Physical Property | Value | Chemical Composition (%) | Value | Mineral Composition | Value |
|---|---|---|---|---|---|
| Ignition loss, % | 3.76 | Silica, SiO2 | 21.3 | C3S, % | 56.54 |
| Specific gravity | 3.13 | Calcium oxide, CaO | 64.8 | C2S, % | 22.56 |
| Fineness, m2/kg | 354 | Alumina, Al2O3 | 5.2 | C3A, % | 8.32 |
| Initial setting time, min | 208 | Ferric oxide, Fe2O3 | 3.3 | C4AF, % | 10.32 |
| Final setting time, min | 258 | Magnesium oxide, MgO | 2.47 | ||
| UCS a in 3 d, MPa | 30.3 | Chloride, Cl− | 0.021 | ||
| UCS in 28 d, MPa | 43.2 | Sulfur oxide, SO3 | 2.83 | ||
| Sodium oxide, Na2O | 0.08 |
| Test Items | Curing Period (Days) | Cement Content (%) |
|---|---|---|
| NMR | 1, 3, 7, 14, 28 | 5%, 10%, 15% |
| UCS | 1, 3, 7, 14, 28 | 5%, 10%, 15% |
| HCT | 7, 14, 28 | 5%, 10%, 15% |
| SEM | 7, 28 | 5%, 15% |
| MIP | 28 | 5%, 15% |
Publisher’s Note: MDPI stays neutral with regard to jurisdictional claims in published maps and institutional affiliations. |
© 2022 by the authors. Licensee MDPI, Basel, Switzerland. This article is an open access article distributed under the terms and conditions of the Creative Commons Attribution (CC BY) license (https://creativecommons.org/licenses/by/4.0/).
Share and Cite
Wang, S.; He, X.; Cai, G.; Lang, L.; Ma, H.; Gong, S.; Niu, Z. Investigation on Water Transformation and Pore Structure of Cement-Stabilized Dredged Sediment Based on NMR Technology. Materials 2022, 15, 3178. https://0-doi-org.brum.beds.ac.uk/10.3390/ma15093178
Wang S, He X, Cai G, Lang L, Ma H, Gong S, Niu Z. Investigation on Water Transformation and Pore Structure of Cement-Stabilized Dredged Sediment Based on NMR Technology. Materials. 2022; 15(9):3178. https://0-doi-org.brum.beds.ac.uk/10.3390/ma15093178
Chicago/Turabian StyleWang, Shiquan, Xingxing He, Guanghua Cai, Lei Lang, Hongrui Ma, Shunmei Gong, and Zhiyong Niu. 2022. "Investigation on Water Transformation and Pore Structure of Cement-Stabilized Dredged Sediment Based on NMR Technology" Materials 15, no. 9: 3178. https://0-doi-org.brum.beds.ac.uk/10.3390/ma15093178