
Strengthening of 0.18 wt % C Steel by Cold Differential Speed Rolling


School of Materials Science and Engineering, Institute of Materials Technology, Yeungnam University, Gyeongsan 38541, Korea
*
Author to whom correspondence should be addressed.
Materials 2022, 15(10), 3717; https://0-doi-org.brum.beds.ac.uk/10.3390/ma15103717
Submission received: 6 May 2022
/
Revised: 18 May 2022
/
Accepted: 20 May 2022
/
Published: 22 May 2022
(This article belongs to the Section Metals and Alloys)
Abstract
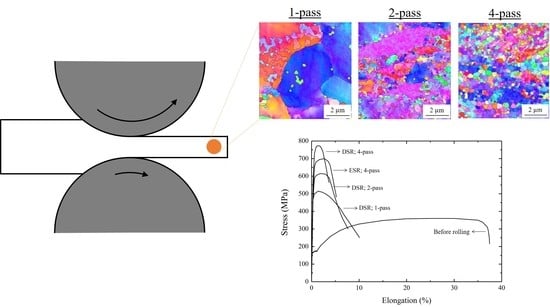
:Steel sheets containing 0.18 wt % C were deformed by differential speed rolling (DSR) up to four passes and compared to the steel sheets processed by equal speed rolling (ESR). Not only microstructure, but also mechanical properties and rolling load, were studied, which enlightens the relationship between microstructure, mechanical properties, and rolling load. Moreover, microstructure and properties resulting from ESR were systematically compared. During the rolling deformation, coarse grains were elongated first parallel to the rolling direction, and ultrafine grains were subsequently formed via continuous dynamic recrystallization. Microstructural analysis revealed that DSR was more effective than ESR in terms of achieving grain refinement and microstructure homogeneity. High-angle grain boundaries surrounding the ultrafine grains contributed to grain boundary strengthening, resulting in a dramatic increase in both hardness and strength after DSR. Although the steel was strengthened by rolling, the rolling load firstly increased and subsequently decreased as the number of passes increased, and lower force was required during DSR than during ESR. These can be explained by considering deformation volume and sticking friction.
1. Introduction
Rolling is the most widely employed metal forming process. Thus, various studies on the rolling process have been reported until now [1,2,3,4,5]. In recent years, differential speed rolling (DSR) has been regarded as one of the asymmetric rolling (ASR) methods in which the metallic or composite sheets were deformed between two distinctive rolls with different dimensions or speeds. As the name implied, DSR utilized the identical rolls driven under different rotational speeds at both high and room temperatures. Because DSR could successfully impose intensive shear strain throughout the thickness of the workpieces [6], many attempts have been made to achieve severe grain refinement in a variety of metallic materials, such as Mg [7], Ti [8], Al [9], and Fe [10] alloys.
An advantage of DSR is that a high degree of shear deformation is produced uniformly throughout the thickness. According to the texture prediction assisted by the finite element method (FEM), better texture was realized by DSR than by single-roll-driven rolling [11]. In addition, the mesh distortion obtained via FEM simulation suggested that the shear displacement was larger in DSR than in equal speed rolling (ESR) [12].
As a result of the effective shear deformation in DSR, ultrafine grain (UFG) structure with a high dislocation density was achieved regardless of the crystal structure of alloys [6]. The UFG structure developed gradually over the course of several rolling passes. At first, the grains elongated parallel to the rolling direction. As the accumulated thickness reduction increased, the UFG structure was generated throughout the thickness. In the case of Al alloys, it was reported that the relatively homogeneous microstructure with 0.7 μm grains was observed after four DSR passes when the roll speed ratio was 4 and the thickness reduction per pass was 30%. Moreover, these fine grains were surrounded by a higher fraction of high-angle grain boundaries (HAGB) than that of low-angle grain boundaries (LAGB) [13]. Indeed, a higher fraction of HAGB appeared in low-carbon steel sheets after DSR than after ESR [14].
The UFG microstructure with HAGB effectively contributed to the materials strength. Therefore, a DSR processed Cu sheet exhibited higher strength than an ESR processed Cu sheet [15]. Furthermore, the strength of the sheets produced by DSR was comparable to that produced by severe plastic deformation such as accumulative roll bonding (ARB) [15] and equal channel angular pressing (ECAP) [6].
Recently, the microstructure of low-carbon steels produced by DSR was studied. Hamad et al. analyzed UFG microstructure with HAGB and texture associated with both rolling and shear deformation after four DSR passes with the roll speed ratio of 4 [16]. Wronski and Bacroix also confirmed the texture with a shear component throughout the thickness after DSR with a roll speed ratio of 1.3 [17]. In addition, Hamad and Ko studied the effect of roll speed ratio and concluded that the fraction of ultrafine grains, as well as strength, increased by increasing the roll speed ratio from 1 to 4 [18]. Moreover, the UFG structure developed during DSR was found to be thermally stable upon annealing up to 798 K (525 °C) for 1 h [19]. Most of these studies focused on microstructure and texture evolution during DSR, and the mechanical properties were rarely studied, along with microstructure analysis.
In this regard, the present study investigated the strengthening of a 0.18 wt % C steel sheet, which was processed by DSR. The microstructure was analyzed, and hardness, as well as tensile properties, were investigated after the DSR process. Moreover, these features were compared with the counterpart produced by ESR to prove the efficacy of DSR on grain refinement and strengthening. Additionally, the rolling load was monitored throughout the process, and the load response was interpreted based on the material strength and deformation volume.
2. Materials and Methods
The composition of the steel sheets was Fe-0.18 C-0.5 Mn-0.012 Si-0.007 Cr (wt %). The steel was machined into 100 × 30 × 4.4 mm3 sheets. The sheets were homogenized at 1373 K (1100 °C) for 3 h and furnace cooled, which resulted in the mixed microstructure containing ferrite and 20% pearlite. The mean lineal intercept grain size of ferrite was 32 ± 4 µm.
Two identical rolls, each with a 220 mm diameter, were employed for DSR. The roll speed ratio was 4, while the lower roll speed was 5 rotations per minute. Thickness reduction per each pass was ~30%, which resulted in ~75% after 4 passes. The rolling was performed for 1, 2, and 4 passes. Lubrication was provided, and rolling load was monitored throughout the rolling process. Some sheets were also produced by 4 passes of ESR for comparison. All processes were completed at room temperature without rotating the sheets. Details of processing conditions are available elsewhere [16].
The microstructure after DSR was analyzed with a field-emission scanning electron microscope (FE-SEM, Hitachi S-4300, Tokyo, Japan) equipped with electron backscatter diffraction (EBSD). The specimens were cut in the middle of the RD-ND plane, mechanically polished, and etched with 2% picric acid in ethanol. EBSD samples were prepared by mechanical polishing, which was finished with colloidal silica. Ferritic regions were separated as a subset for EBSD analysis, which was performed by TSL OIM 6.1.3 (Mahwah, NJ, US). The step size for the EBSD acquisition was 0.020 µm. For the TEM (Tecnai G2 F20, Hillsboro, OR, US) analysis, thin foils were prepared via focused ion beam (FEI Quanta 3D FEG, Hillsboro, OR, USA).
Nanoindentation (Nanovea Nanoindenter, Irvine, CA, USA) was performed with a Berkovich indenter under a constant loading rate of 0.2 N s−1. Five different indentations were conducted to ensure the mechanical reproducibility in this study. Subsize dog-bone specimens for tensile testing were machined along the rolling direction according to ASTM E8; the gauge length was 25 mm. The tensile testing was performed by INSTRON 4411 (Norwood, MA, USA) with a constant displacement rate, which yielded the initial strain rate equal to 10−3 s−1.
3. Results and Discussion
3.1. Microstructural Evolution
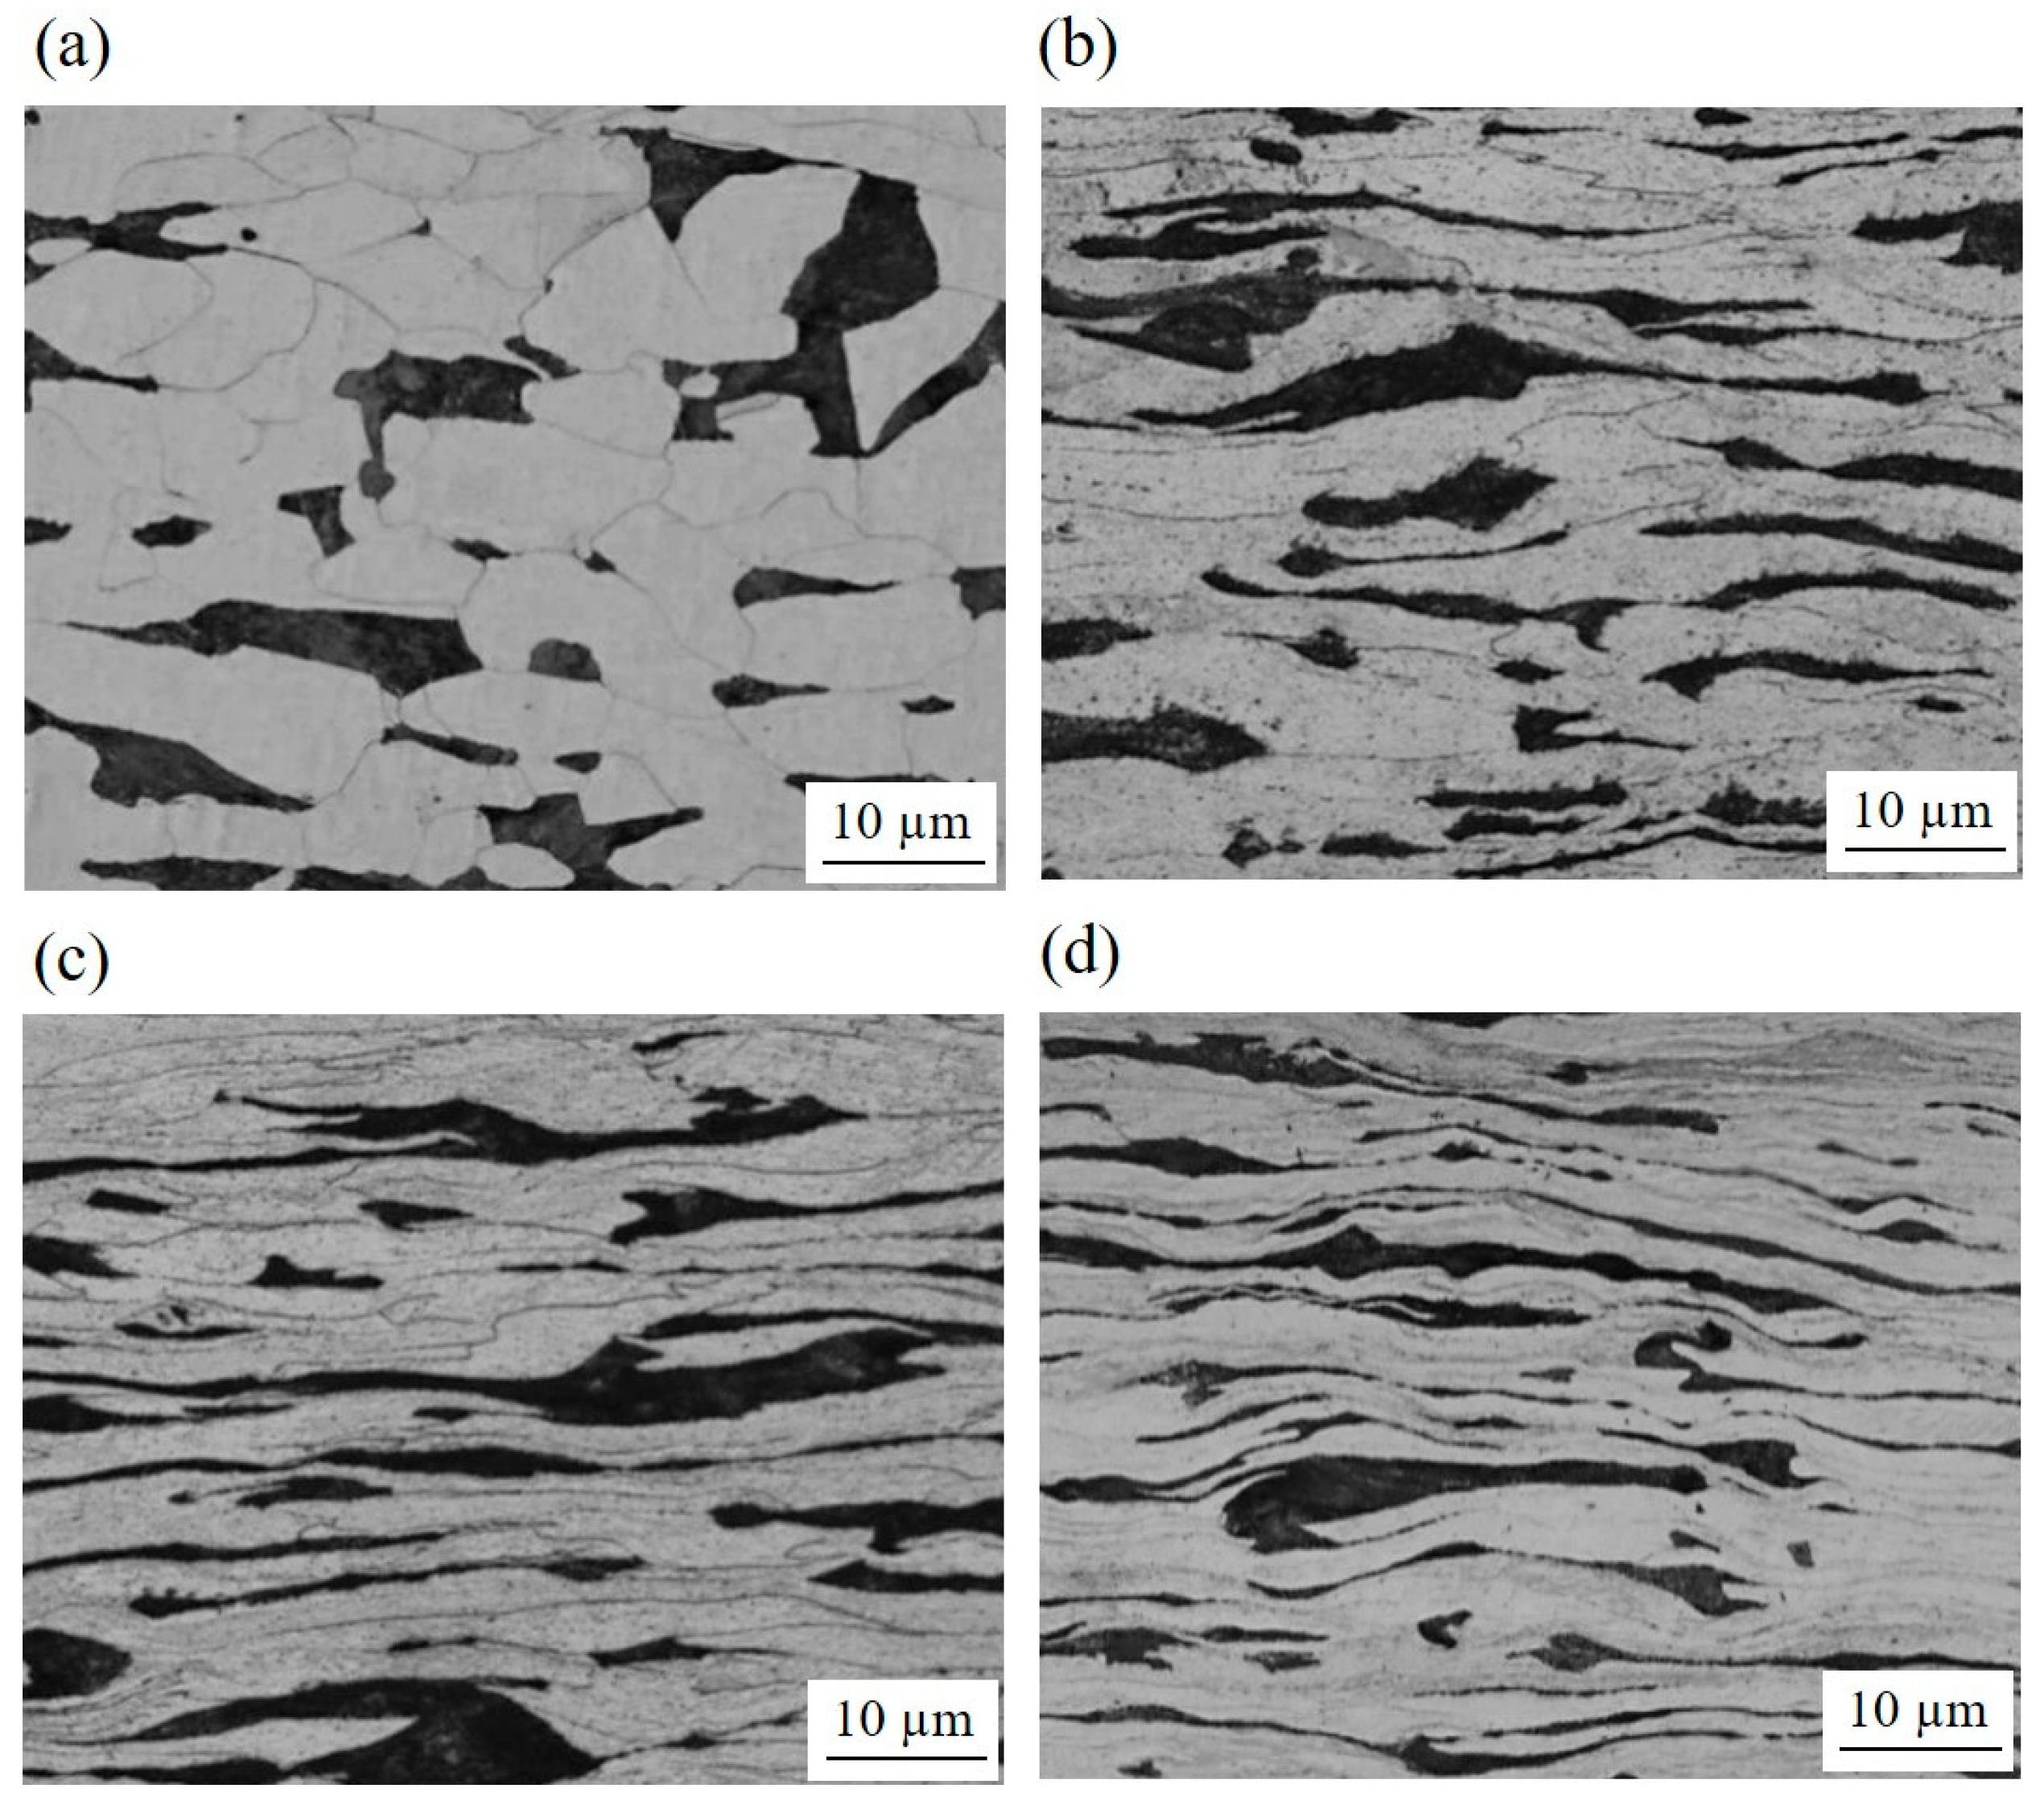
Optical micrographs revealed that the grains were elongated and distorted parallel to the rolling direction (Figure 1). The distortion became apparent after the second pass. However, the structure inside the deformed grains could not be resolved by an optical microscope.
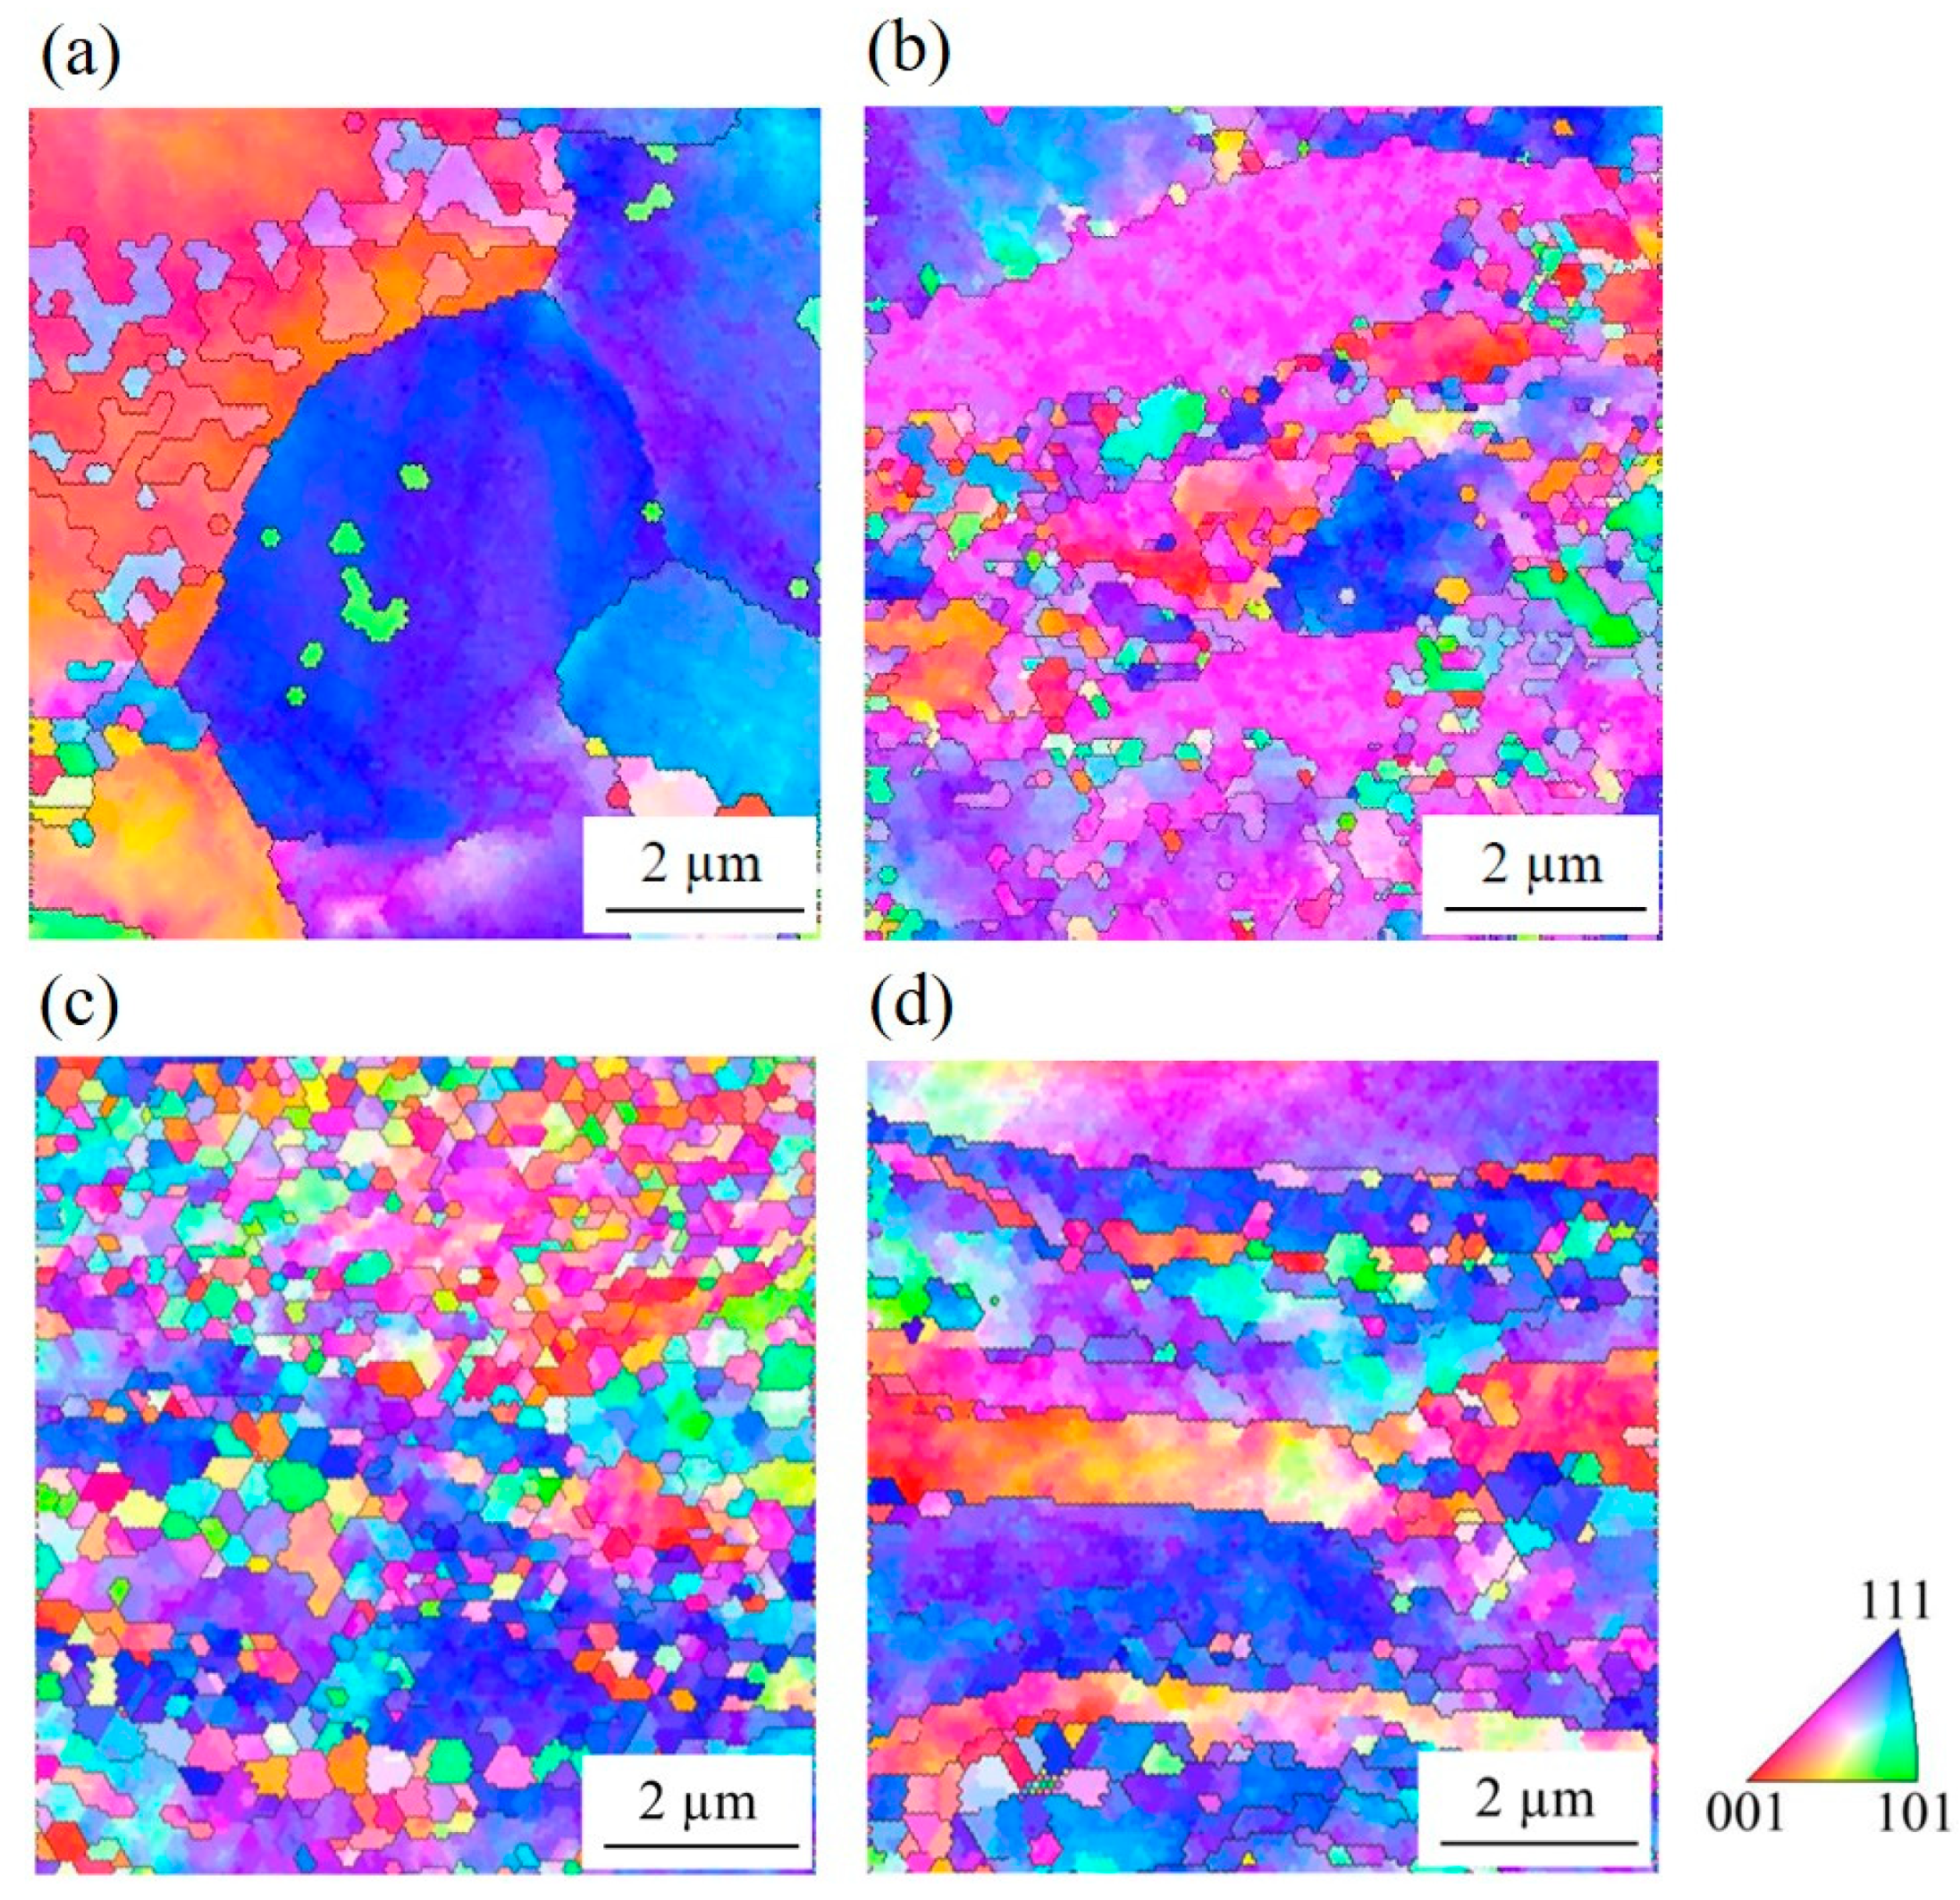
EBSD observation revealed the substructure within the elongated grains (Figure 2). After the first pass of DSR, the UFG structure rarely appeared. Only after the second pass did ultrafine grains develop actively at the grain boundaries of the elongated coarse grains, which generated necklace structure. After the fourth pass of DSR, the microstructure was mostly composed of the UFG structure, with a small fraction of the elongated grains. On the other hand, the microstructure, after the fourth pass of ESR, still contained a large fraction of elongated grains, along with some ultrafine grains.
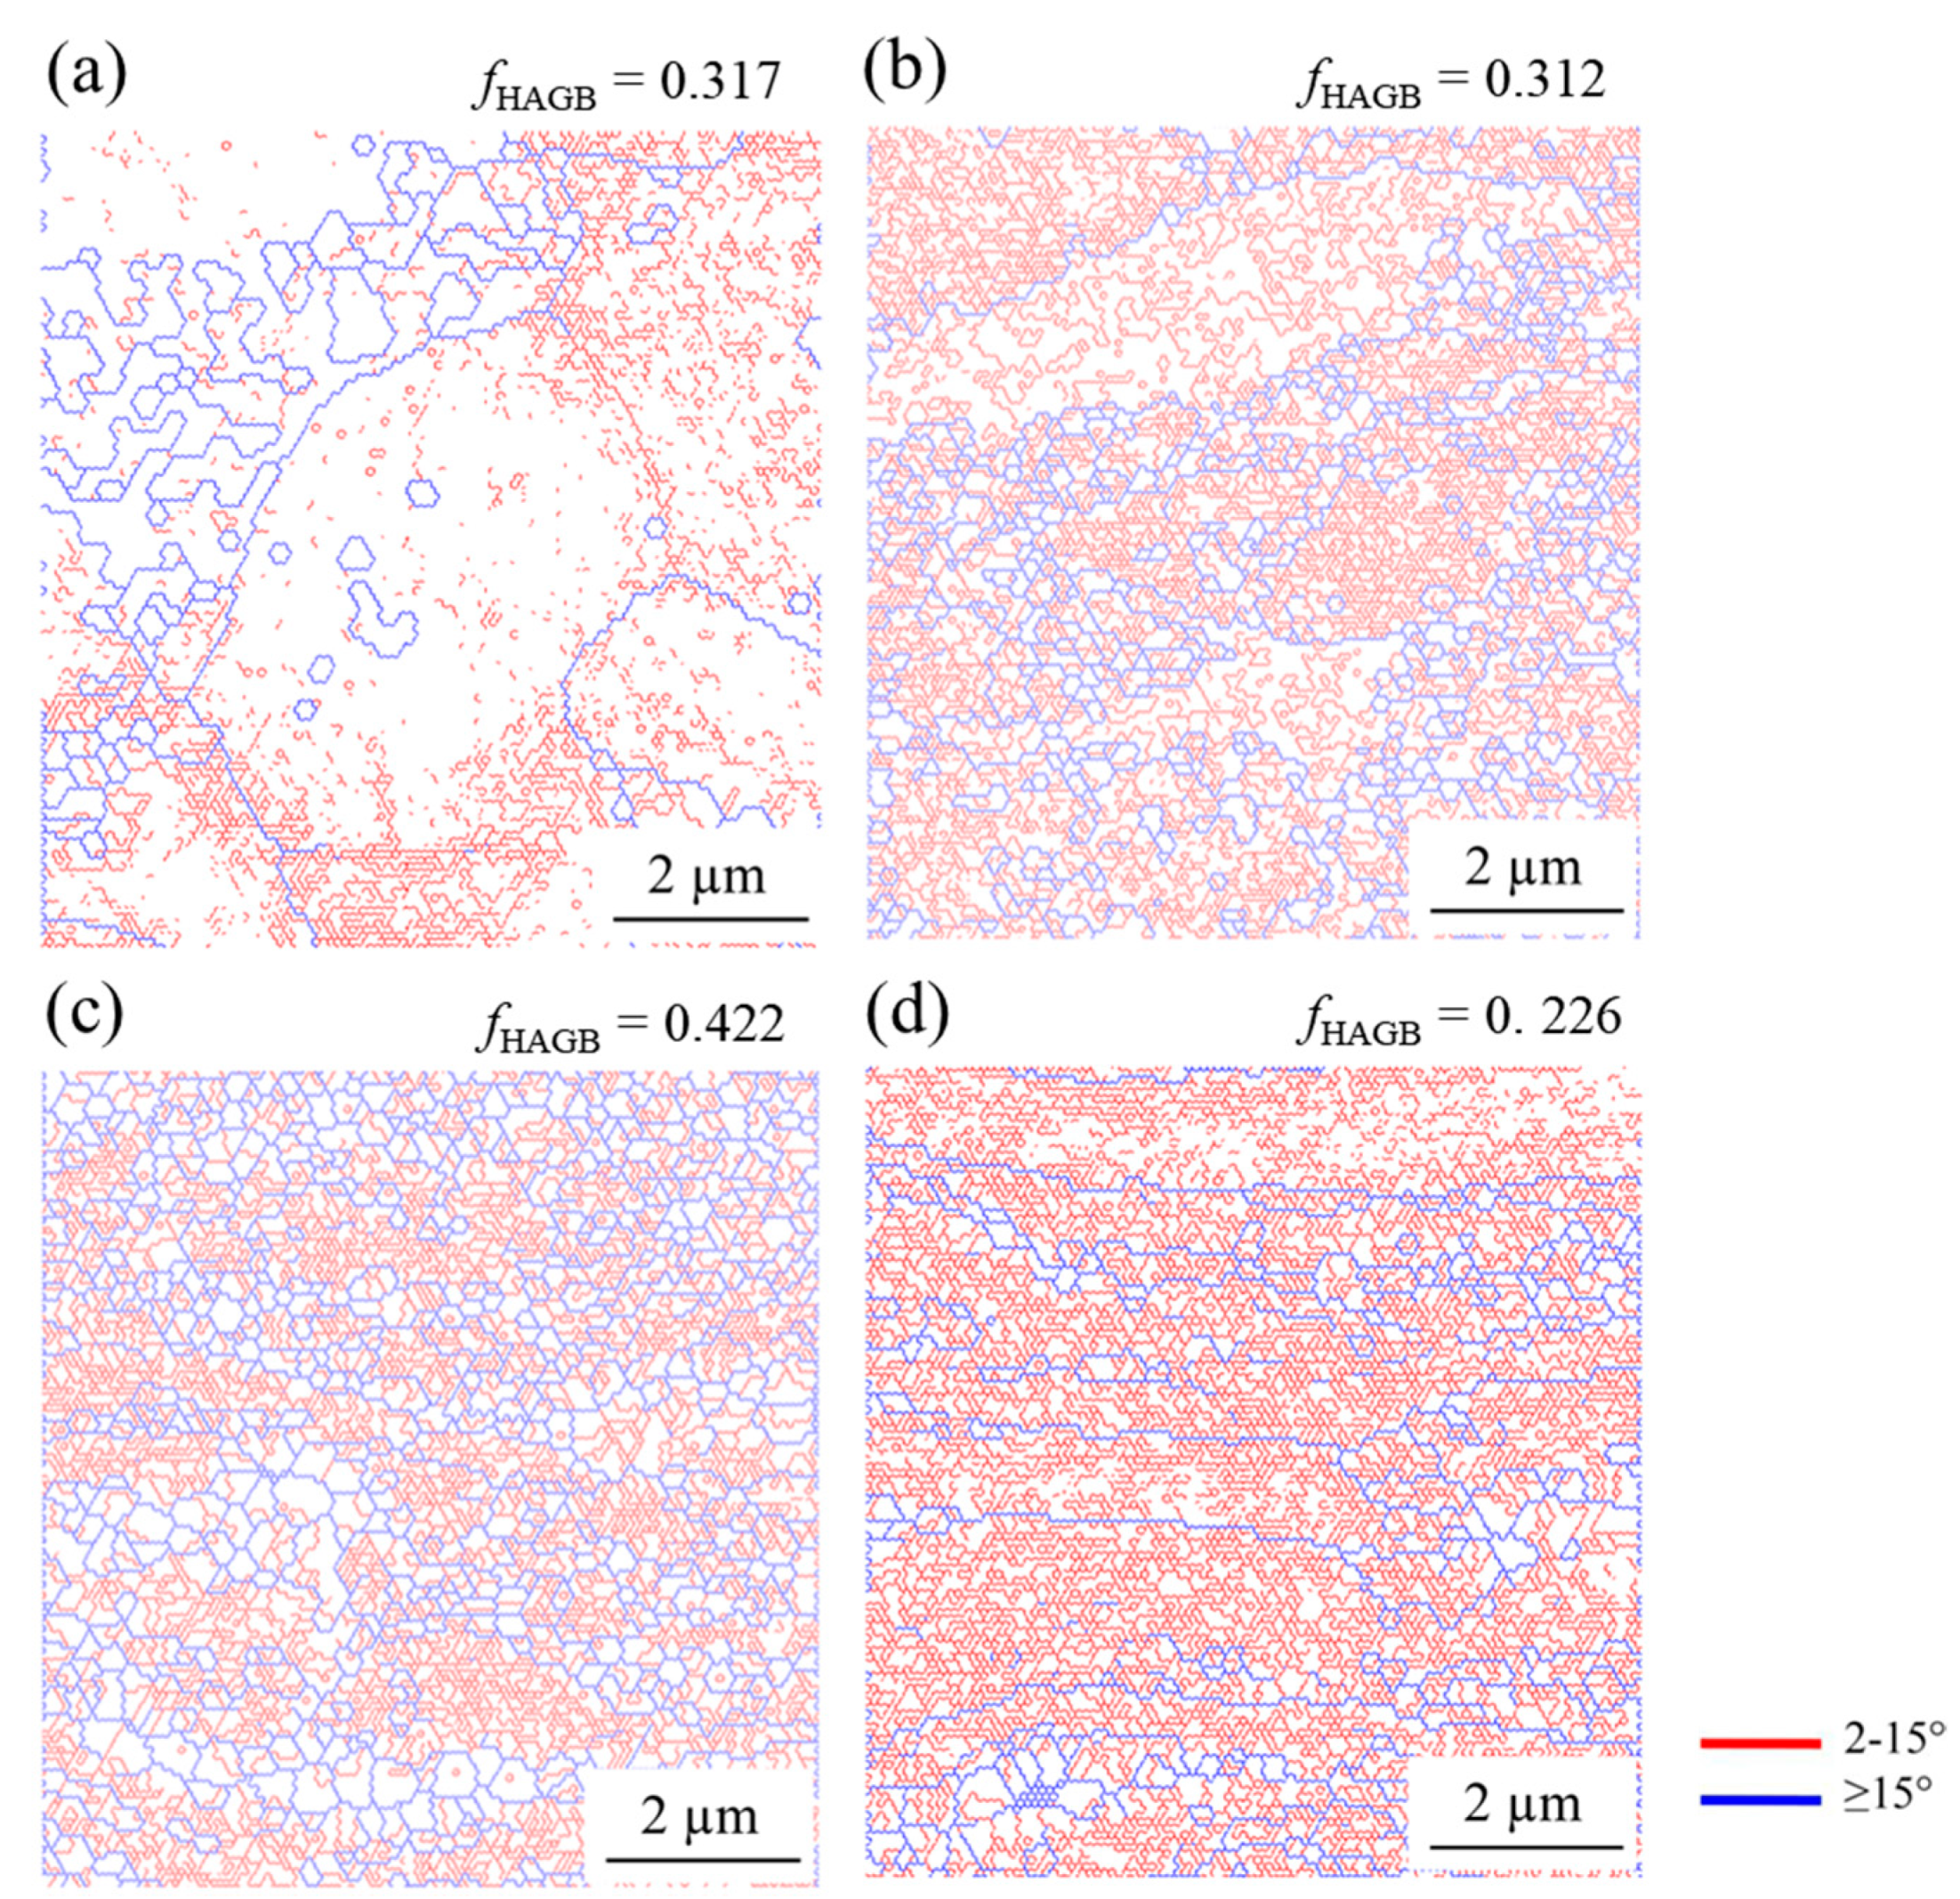
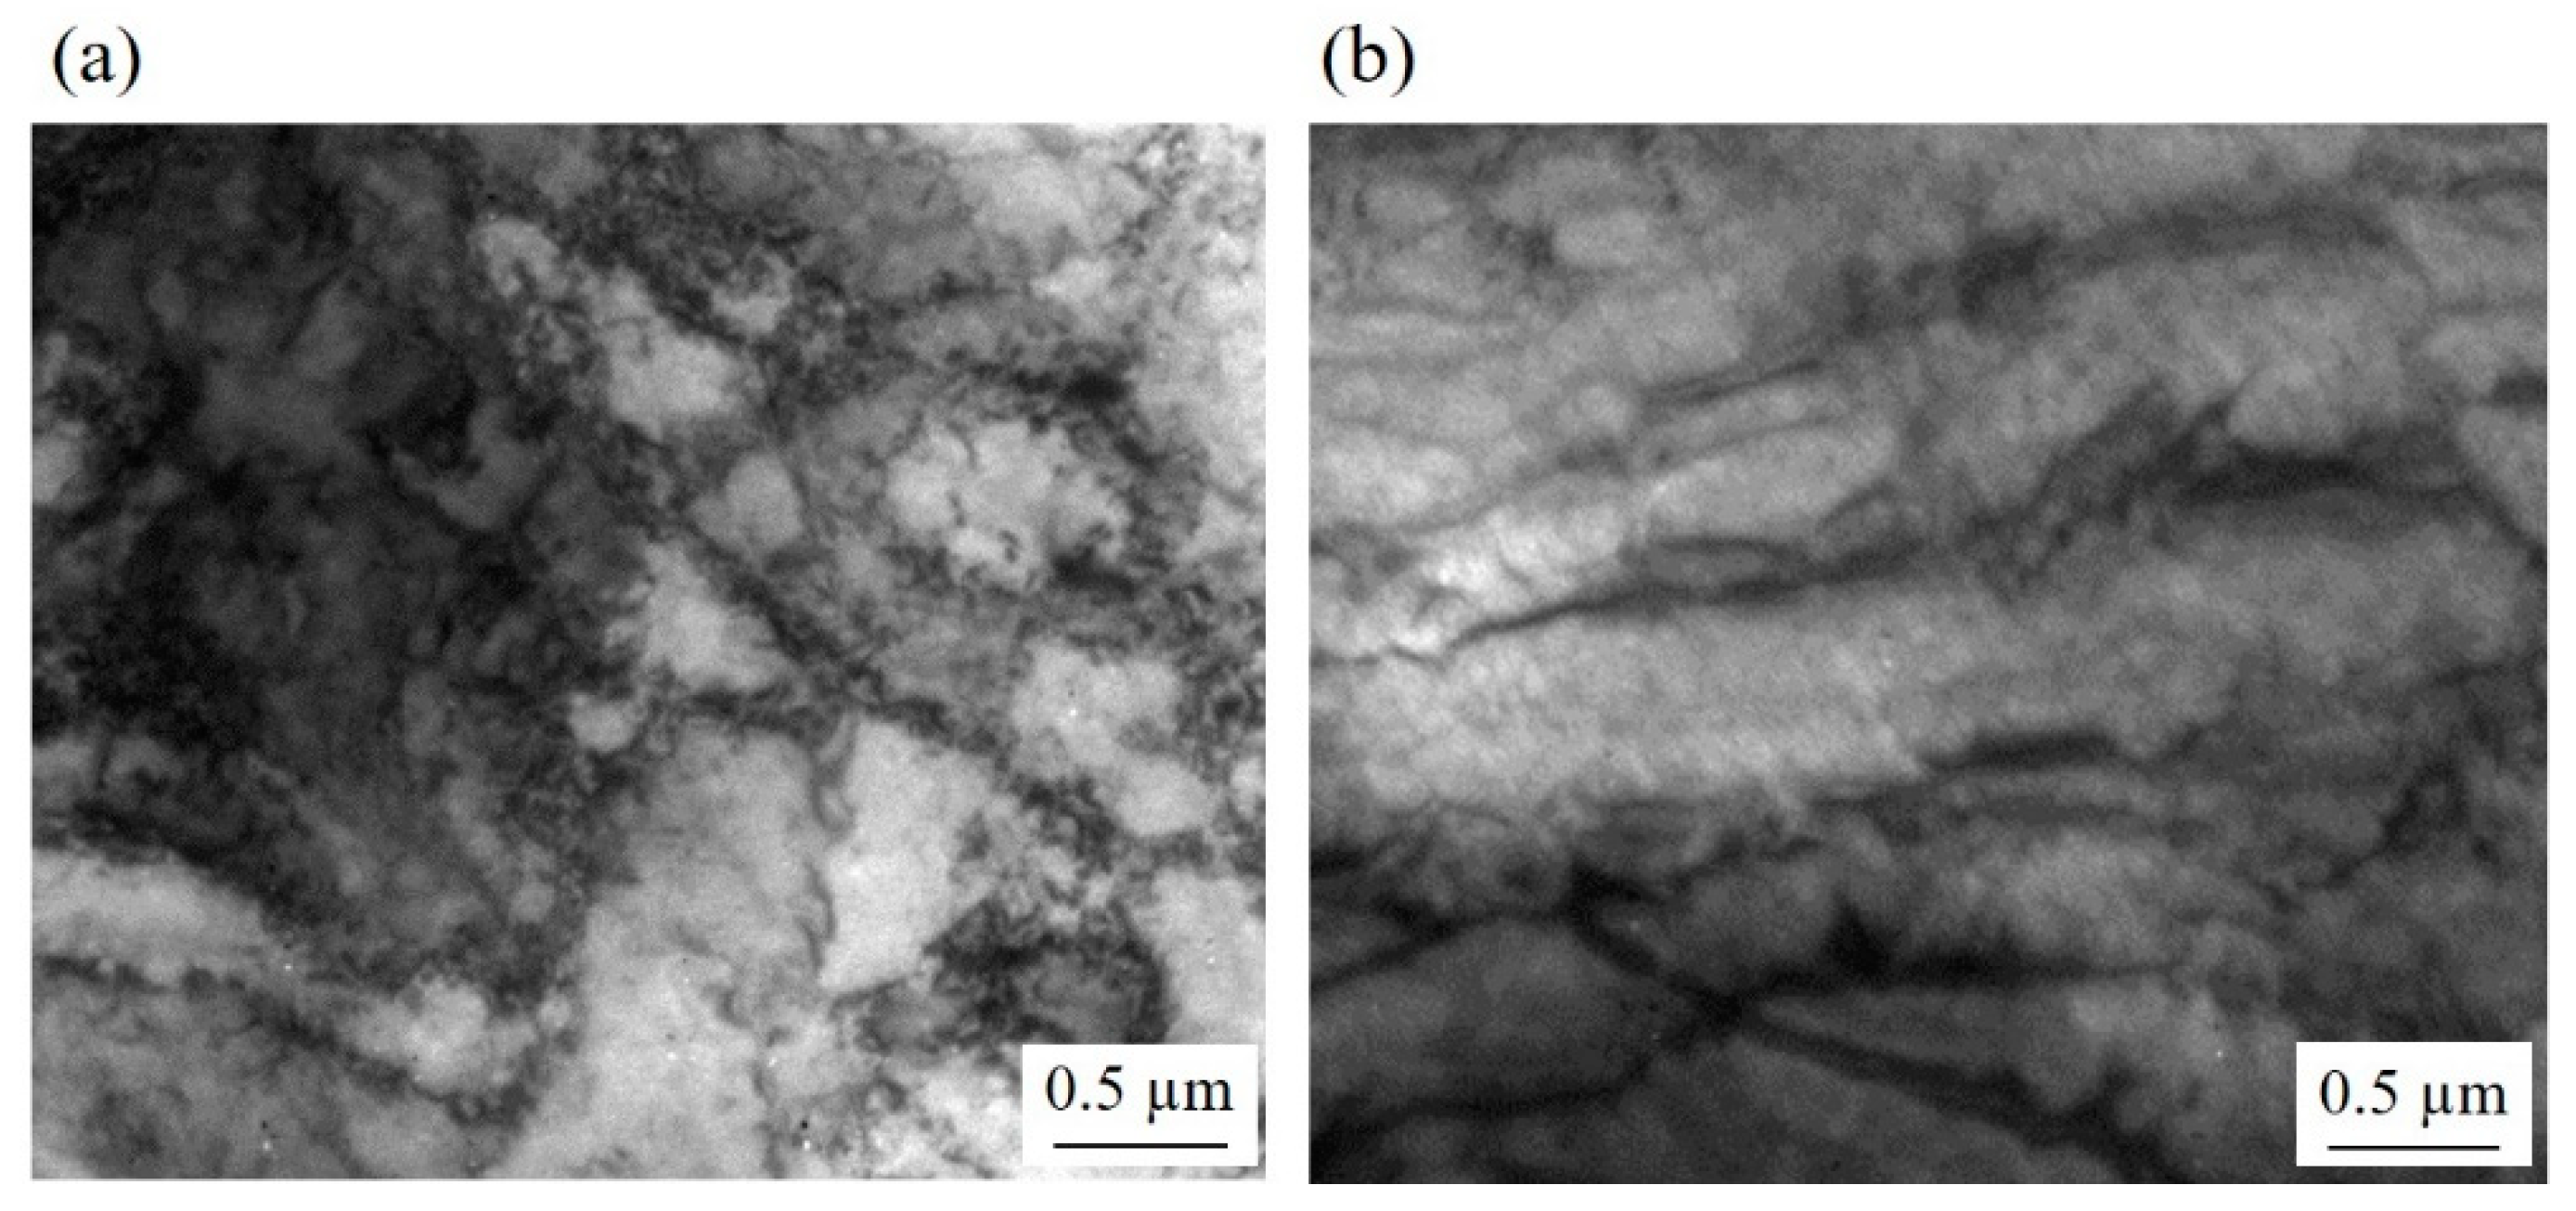
The microstructural difference between the samples became more pronounced when LAGB and HAGB were classified (Figure 3). The elongated grains contained a large fraction of LAGB, while the ultrafine grains were delineated by HAGB. Accordingly, the fraction of HAGB was lower in the samples after the second pass of DSR and after the fourth pass of ESR than in the alloy after the fourth pass of DSR. Consequently, the lineal intercept length of the grains surrounded by HAGB was shorter in the steel after the fourth DSR pass (0.38 ± 0.11 µm) than after the fourth ESR pass (0.65 ± 0.14 µm). Higher magnification images revealed the same trend in the deformed microstructure (Figure 4). Moreover, it was clearly observed that the grain boundaries of the UFG structure consisted of dislocations which were likely to have generated during the rolling.
The necklace structure and the alteration from elongated grains surrounded by LAGB to the UFG structure with HAGB were consistent with the microstructure formed via continuous dynamic recrystallization (cDRX). During severe plastic deformation at room temperature, polygonal grains became elongated, and a high density of dislocations were generated. The generated dislocations developed into fine cell structures whose boundaries were LAGB. As the deformation progressed, dislocations continuously accumulated at the cell boundaries. The combined Burgers vectors of these dislocations would increase the misorientation between the cells, and thereby, the boundaries gradually developed into HAGB [20,21]. Since the process occurs homogeneously throughout the material, it is referred to as “continuous”. As a result, the full UFG structure could be achieved.
3.2. Mechanical Behavior
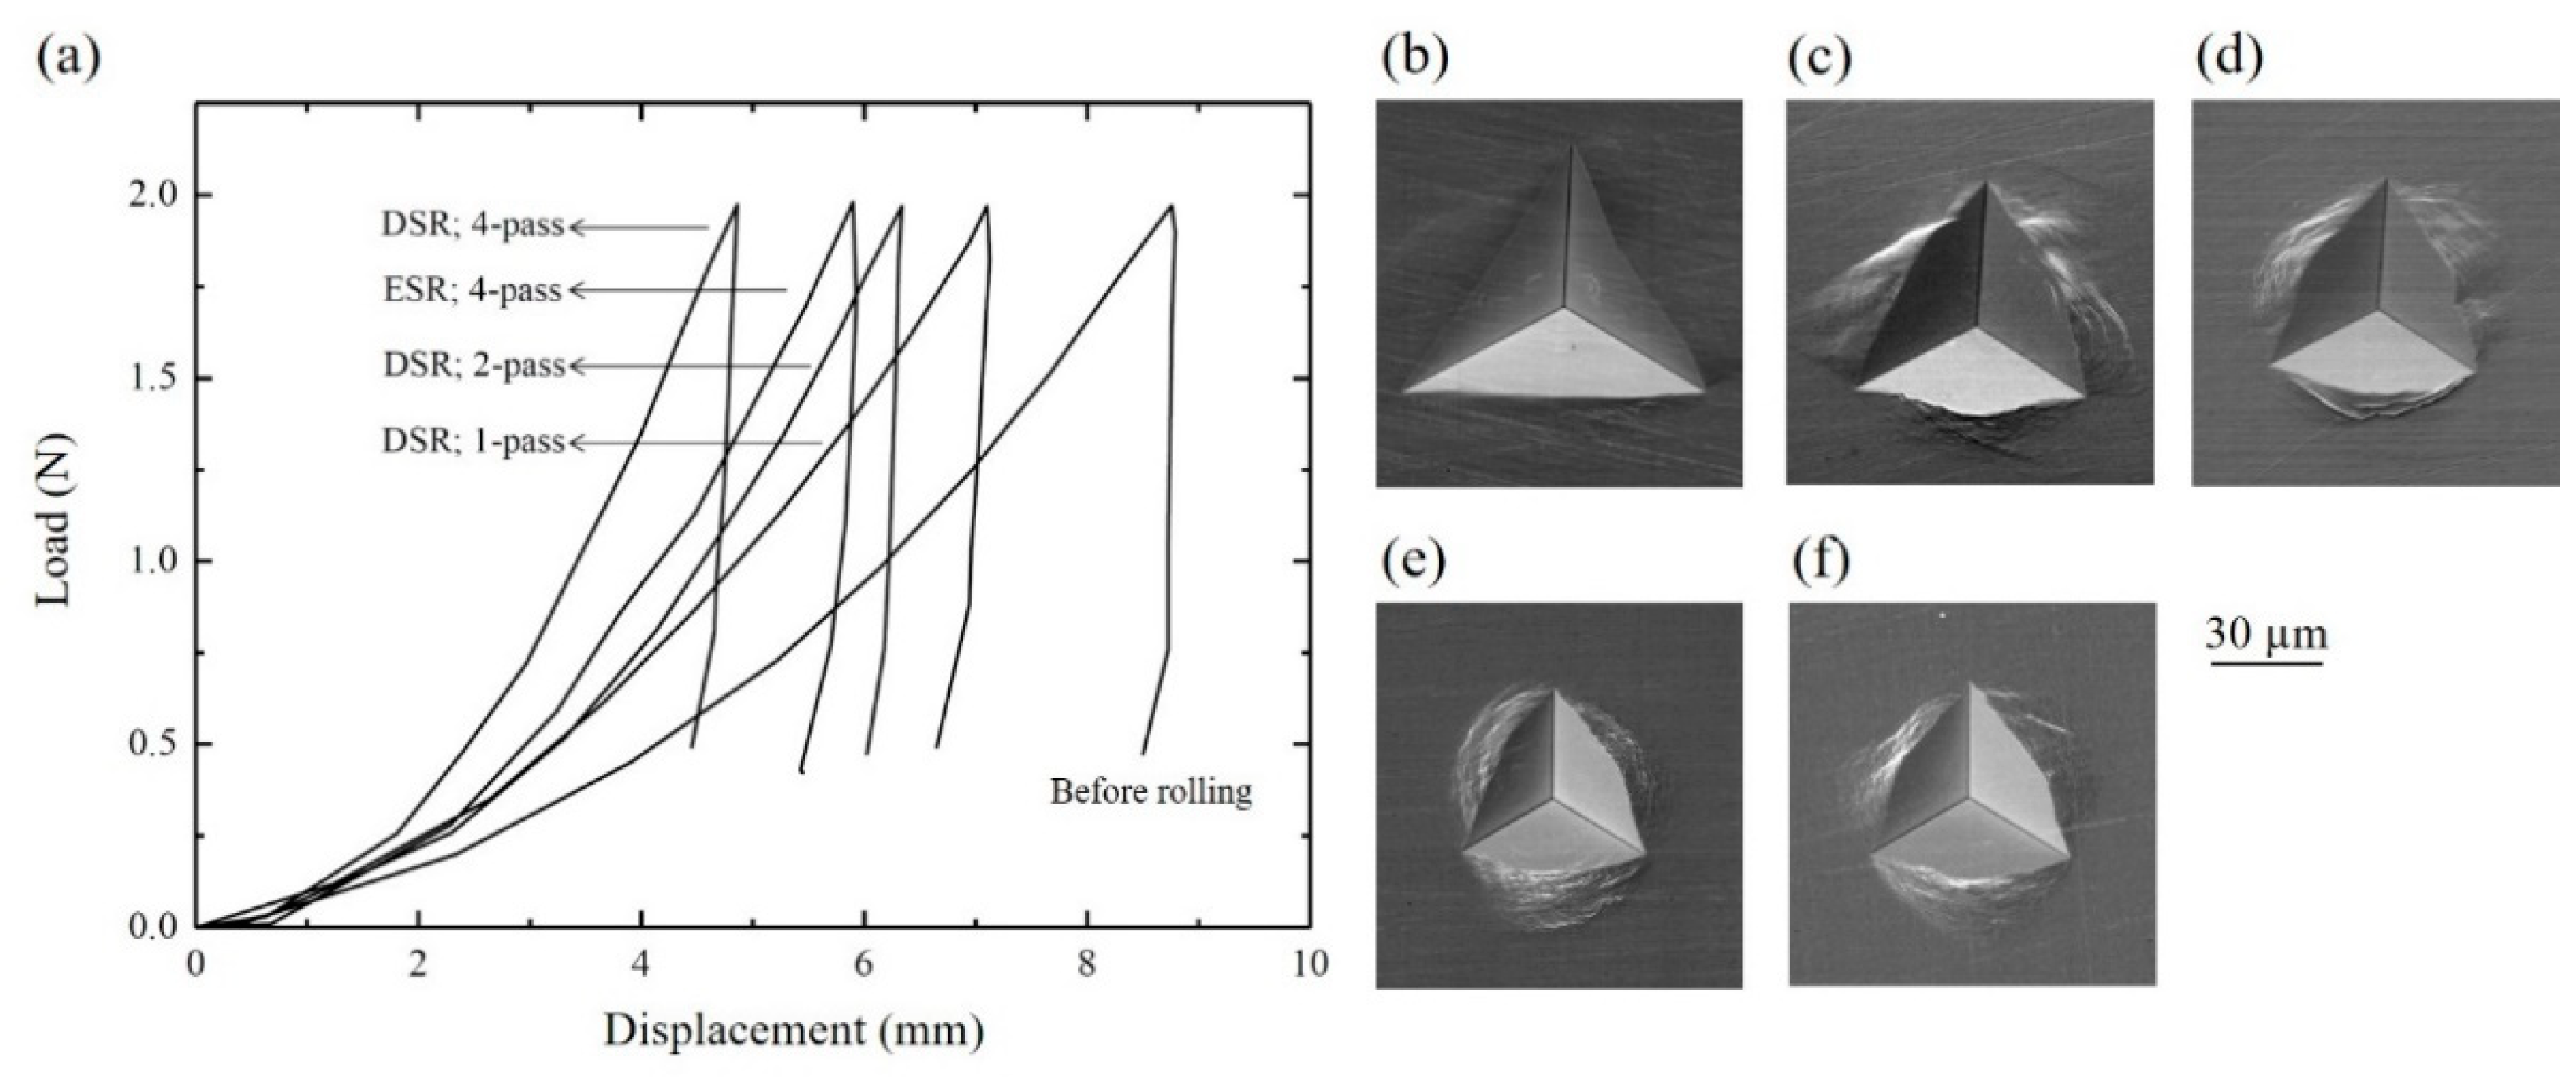
The hardness increased significantly with respect to the number of DSR passes. As the number of the DSR passes increased, the displacement at the peak load significantly decreased, and the contact area was reduced (Figure 5). As a result, the hardness effectively increased from 1.10 to 3.93 GPa after the 4 DSR passes (Table 1). Moreover, the hardness increase was more effective via DSR than via ESR. The elastic modulus did not change due to the rolling, and the values corresponded to the typical elastic modulus of steels, 208–209 GPa [22].
As shown in Figure 6, the overall tendency of the yield strength was consistent with that of nanoindentation in that both properties increased with an increasing of the number of passes. For instance, the yield strength of the sample after a 4-pass of DSR exhibited 780 MPa, which was approximately five times higher than prior to DSR. It was noted that the yield strength after the fourth pass of ESR was lower in comparison to the case of DSR. Furthermore, the total elongation was reduced as the number of passes increased; after the fourth pass of either DSR or ESR, the total elongation was <6%.
The microstructural analysis after DSR revealed a UFG structure with a high fraction of HAGB (Figure 2 and Figure 3) and a low density of dislocations within the grains (Figure 4). Therefore, it was likely that the dramatic increase in yield strength (Figure 6) came from grain boundary strengthening, which could be explained by Hall–Petch relation;
where Δσ is the yield strength increment due to grain boundary strengthening, kHP is the Hall–Petch coefficient, and d is grain size. Gladman and Pickering stated that the yield strength of the steels which were comprised of polygonal ferrite with less than 20% of pearlite was controlled by the ferrite matrix [23]. Moreover, they suggested kHP = 15.1 MPa mm0.5 to explain 93% of the published data. Accordingly, the grain boundary strengthening was calculated using Equation (1) and kHP = 15.1 MPa mm0.5. The results (Table 2) showed that grain boundary strengthening reasonably explained the strengthening. It was noted that the acquired grain size in this work was the lower limit where the Hall–Petch relation was valid. With finer grains, the grain boundary strengthening was no longer proportional to d−0.5 and was inversely proportional to d [24]. The discrepancy between the actual Δσ and calculated Δσ might come from a texture which was not considered. According to the work by Huang et al., texture would influence yield strength by altering the value of the Schmid factor [25].
In addition, the low ductility of the samples produced by DSR (Figure 6) was attributed to a low strain hardening rate. The ineffective strain hardening was mainly caused by two reasons, as suggested for UFG Cu [26]; the same explanation was also provided to interpret the low total elongation of UFG Ti [27]. Firstly, only a few dislocations in each grain would contribute to deformation. Since there were a number of grains within the material, quasi-static deformation could occur via the glide of only one or two dislocations in one grain per second. Secondly, there was sufficient time for dislocations to be trapped into the non-equilibrium grain boundaries as a kind of dynamic recovery. Both reasons contributed to the absence of dislocation accumulation, and, thereby, low strain hardening rate of the samples produced by DSR.
The achieved strength level and grain size by DSR were comparable to the low carbon steels processed by ECAP (Table 3). Although the total elongation was lower after DSR than after ECAP, the yield strength was the highest among the steels with a 0.2–1.5 µm grain size. Therefore, it is suggested that DSR is a promising method for grain refinement considering its advantages over other severe plastic deformation methods regarding sample dimension and being a continuous process. Moreover, with the present data, mechanical properties or microstructures can be predicted as a future study; that is, the number of passes which result in desired material properties can be estimated.
3.3. Load-Stroke Behavior during DSR
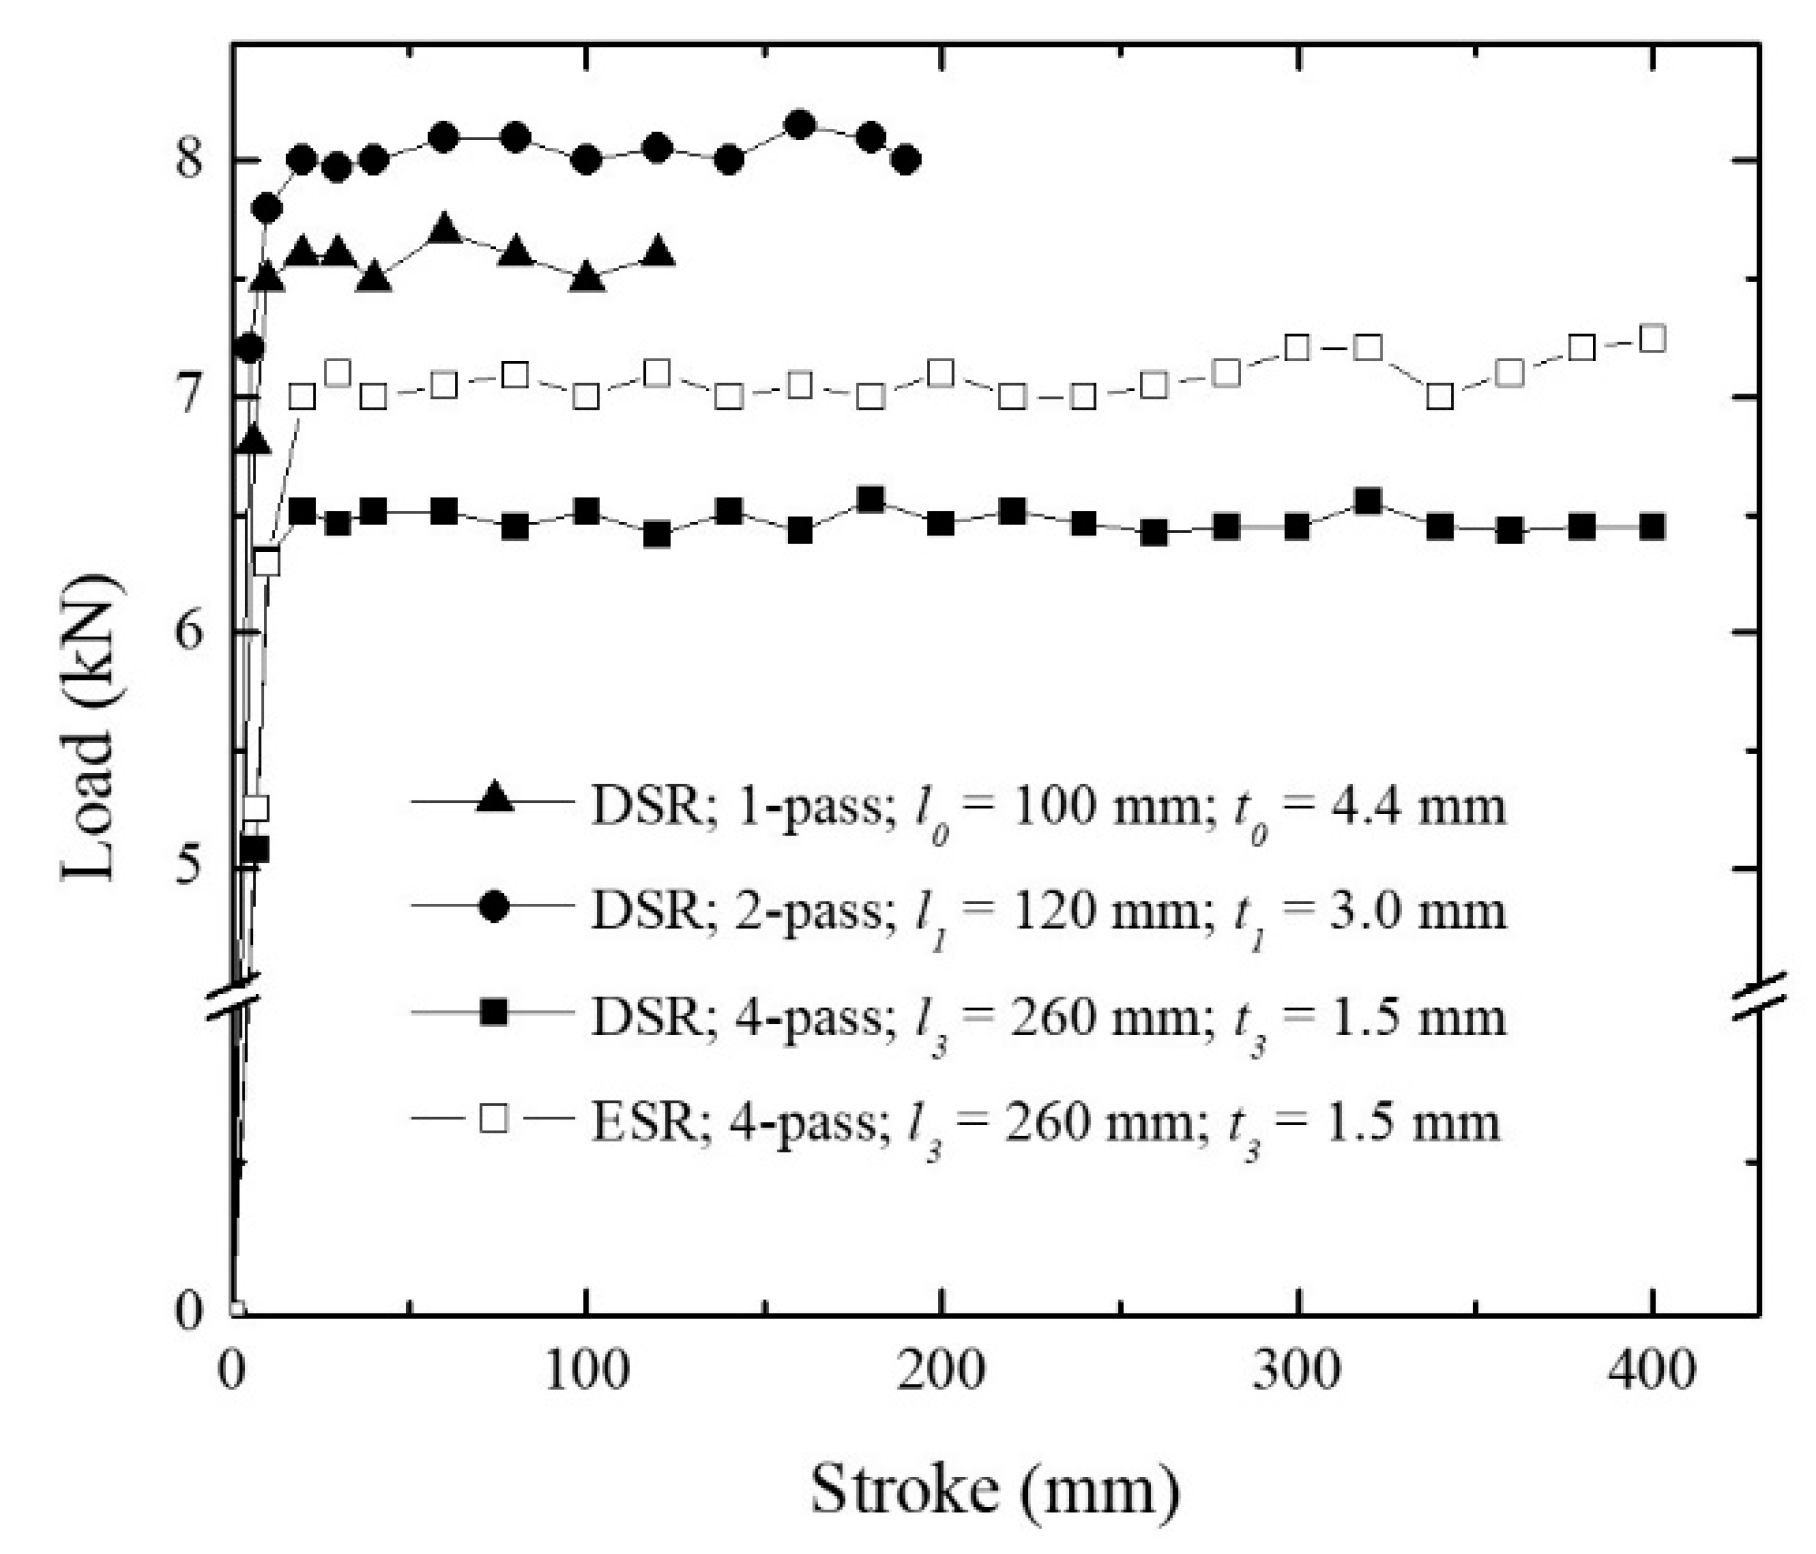
The rolling load was mostly constant during each passage of deformation above a specific stroke point (Figure 7). However, the value did not grow monotonously as the number of passes increased. It was found that the rolling load increased during the first two passes and reached ~8.1 kN and was reduced to ~6.5 kN for the fourth pass. Moreover, the rolling load during the fourth pass of ESR was higher than that of DSR, implying that DSR required less deformation energy than ESR did.
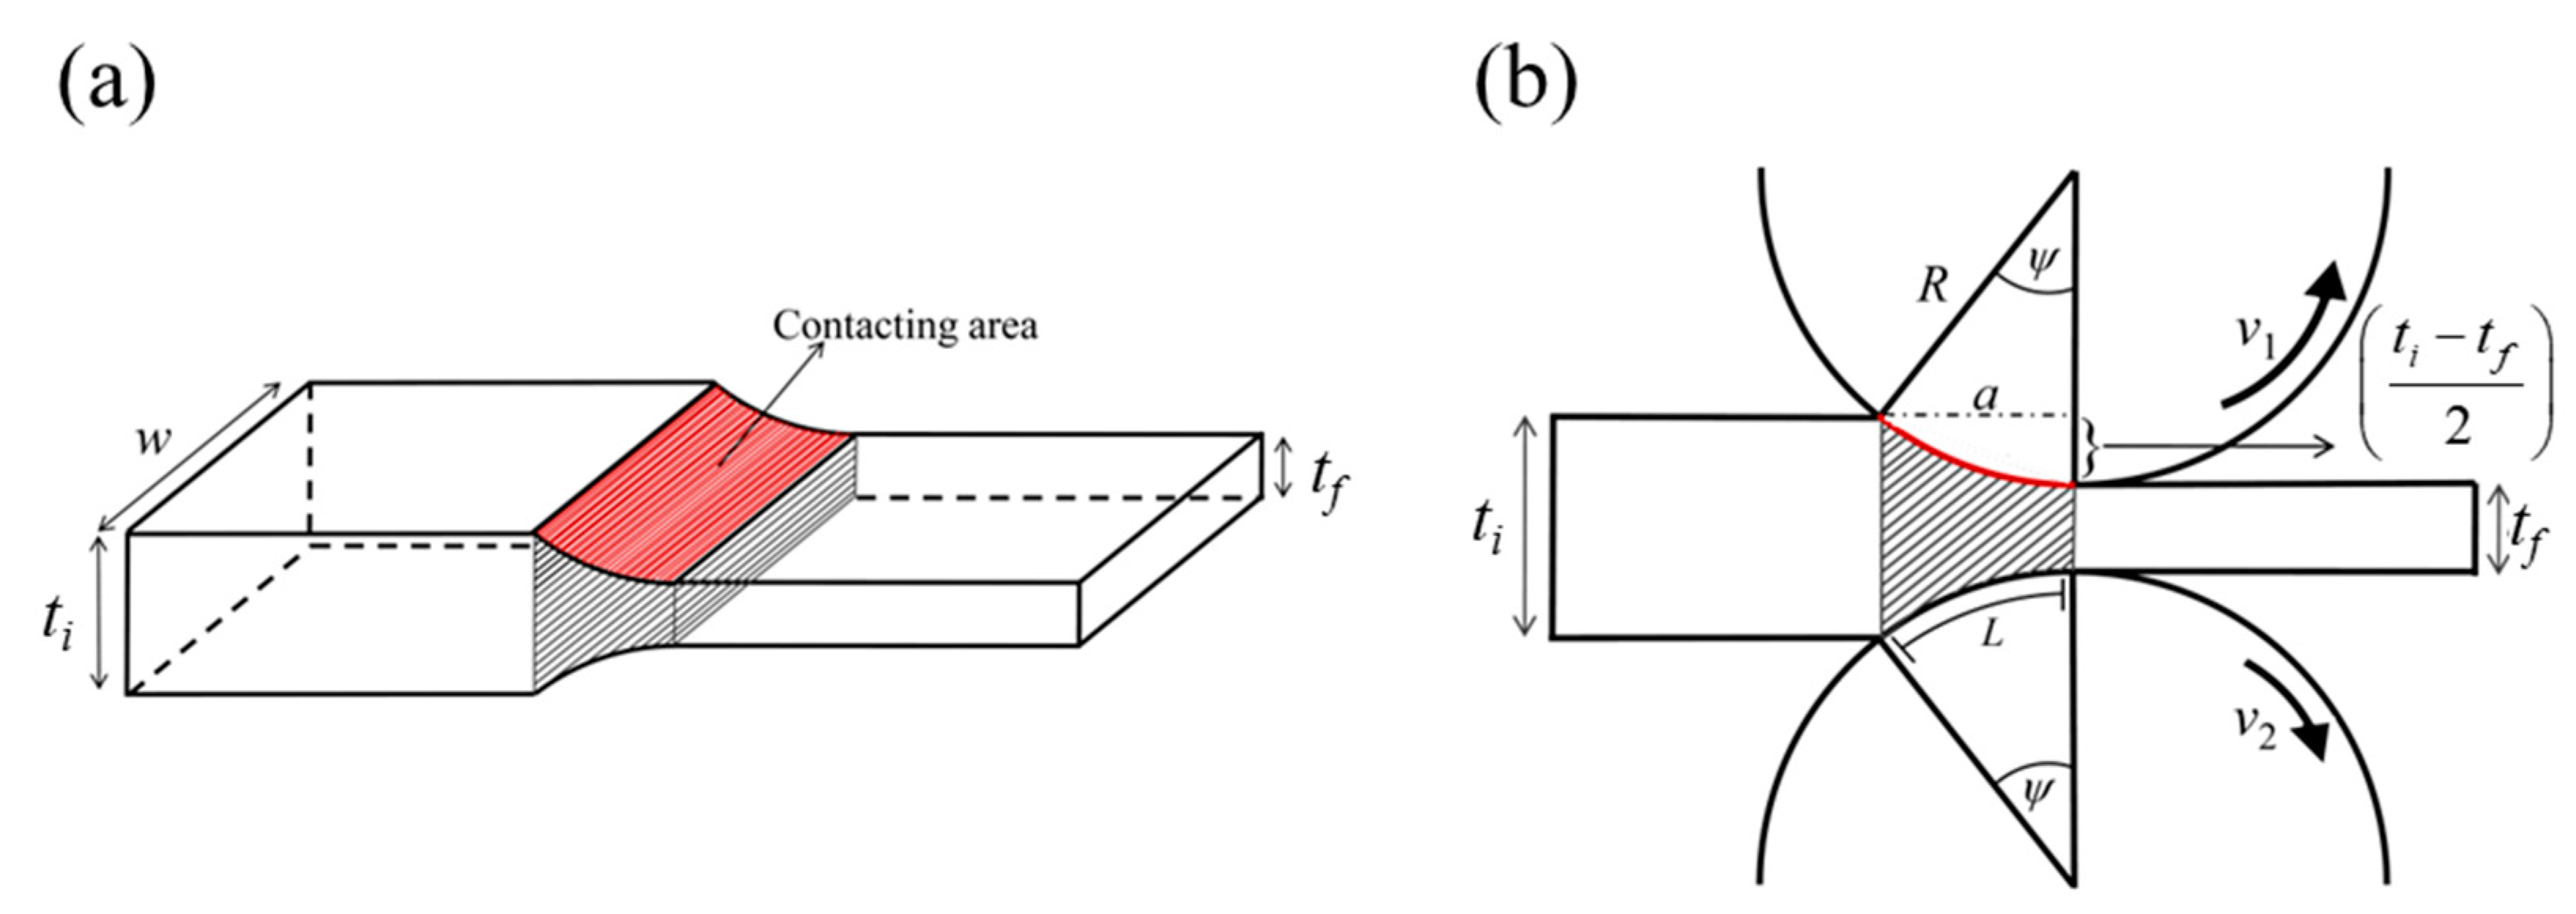
Two main factors which determine rolling load are material strength and deformation volume. The alloy strength increased as the number of passes increased (Figure 5 and Figure 6). The deformation volume can be estimated by considering the process geometry. According to Figure 8, the contacting area, A = wa, where w is the sheet width and a is the projected length of the contact. a is estimated as [32].
where R is the roll radius and ti, tf is the initial and final thickness of the process. In addition, the deformation volume V can be expressed as [32]
A and V were calculated for different conditions, and the values are listed in Table 4. The deformation volume decreased as the number of passes increased. The variation in the material strength and deformation volume influenced the rolling load in an opposite way as the number of passes increased. In other words, with a higher number of passes, a higher load should be applied to compensate for the strain hardening of the sheets, while the deformation volume decreases and allows for the load reduction. At the first and second passes of DSR, the effect of strain hardening was higher than that of the deformation volume; therefore, the rolling load increased (Figure 7). On the other hand, after the second pass, the deformation volume decreased significantly, and its influence was dominant compared to the effect of material strength.
Interestingly, the rolling load was lower for DSR than for ESR (Figure 7). The effects of rolling speed and rolling speed ratio on the rolling force have been reported in previous studies. During the course of ESR, the increase in the rolling speed, i.e., the increase in strain rate, reduced the rolling load [33]. During DSR, it was observed that the rolling force decreased with an increase of the rolling speed ratio for both Al and Cu [34]. Moreover, it was reported that the reduction of the rolling load in an interstitial free steel could be caused not only by employing a higher rolling speed ratio but also by using lubricant, which implied that the phenomenon was related to the frictional state at the roll surface [35]. Indeed, Tzou revealed that the frictional factor decreased by increasing the roll speed ratio [36]. Consequently, higher roll speed ratio suppressed sticking friction and reduced the rolling force, resulting in homogeneous deformation. This suggests that DSR could save rolling energy via the reduction in rolling load while it attains more effective grain refinement than ESR.
4. Conclusions
The strengthening of a 0.18 wt % C steel via differential speed rolling (DSR) was studied and compared to its counterpart produced via equal speed rolling (ESR). The resulting microstructure, hardness, and tensile properties were investigated, along with the rolling load during the process.
- 1.
- The grains were heavily elongated along the rolling direction after the second pass. As the number of passes increased, ultrafine grains firstly formed at the grain boundaries of the elongated grains, and later spread homogeneously throughout the thickness. The fine grains were surrounded by high angle grain boundaries, which consisted of a high dislocation density. The grain refinement via DSR (d = 0.38 ± 0.11 μm, fHAGB = 0.422) was more effective than via ESR (d = 0.65 ± 0.14 μm, fHAGB = 0.226).
- 2.
- The strength after DSR reached 780 MPa, which was the result of an effective strengthening by high angle grain boundaries. The ductility was relatively low (~4%) for the ultrafine grain structure because dislocation accumulation was limited by the glide of dislocations and the absorption of the dislocations into the grain boundaries.
- 3.
- The rolling load increased during the first two passes up to ~8 kN due to the material strengthening. Then, the load decreased to ~6.5 kN for the fourth pass because the deformation volume was reduced. The load during DSR (~6.5 kN) was lower than during ESR (~7 kN) due to the high rolling speed ratio lowering sticking friction.
Author Contributions
Conceptualization, Y.-G.K.; validation, J.-H.K. and Y.-G.K.; investigation, J.-H.K. and Y.-G.K.; writing—original draft preparation, J.-H.K.; writing—review and editing, J.-H.K. and Y.-G.K.; visualization, Y.-G.K.; project administration, Y.-G.K.; funding acquisition, Y.-G.K. All authors have read and agreed to the published version of the manuscript.
Funding
The research work was supported by the 2022 Yeungnam University Research Grant (#222A380056).
Institutional Review Board Statement
Not applicable.
Informed Consent Statement
Not applicable.
Data Availability Statement
The data presented in this study are available on request from the corresponding author. The data are not publicly available because they are part of an ongoing study.
Conflicts of Interest
The authors declare no conflict of interest.
References
- Bhujangrao, T.; Veiga, F.; Penalva, M.; Costas, A.; Ruiz, C. Three-dimensional finite element modelling of sheet metal forming for the manufacture of pipe components: Symmetry considerations. Symmetry 2022, 14, 228. [Google Scholar] [CrossRef]
- Ogawa, T.; Suzuki, Y.; Adachi, Y.; Yamaguchi, A.; Matsubara, Y. Effect of cold-rolling directions on recrystallization texture evolution of pure iron. Materials 2022, 15, 3083. [Google Scholar] [CrossRef] [PubMed]
- Wang, Z.; Dong, Y.; Li, J.; Chai, F.; Wang, L.; Liu, Q.; Fu, B.; Liu, M.; Wang, Z. The Role of Cold Rolling Reduction on the Microstructure and Mechanical Properties of Ultra-Low Carbon Bainitic Steel. Materials 2022, 15, 3070. [Google Scholar] [CrossRef] [PubMed]
- Niekurzak, M.; Kubińska-Jabcoń, E. Assessment of the Impact of Wear of the Working Surface of Rolls on the Reduction of Energy and Environmental Demand for the Production of Flat Products: Methodological Approach. Materials 2022, 15, 2334. [Google Scholar] [CrossRef] [PubMed]
- Stradomski, G.; Rydz, D.; Garstka, T.; Pałęga, M.; Dyl, T.; Szarek, A.; Szarek, J.Ł.; Dembiczak, T. Influence of Asymmetric Rolling Process on the Microstructure Properties of Bimetallic Sheet Metals. Materials 2022, 15, 2013. [Google Scholar] [CrossRef] [PubMed]
- Hamad, K.; Ko, Y.G. Continuous differential speed rolling for grain refinement of metals: Processing, microstructure, and properties. Crit. Rev. Solid State Mater. Sci. 2019, 44, 470–525. [Google Scholar] [CrossRef]
- Chang, L.; Cho, J.; Kang, S. Microstructure and mechanical properties of AM31 magnesium alloys processed by differential speed rolling. J. Mater. Processing Technol. 2011, 211, 1527–1533. [Google Scholar] [CrossRef]
- Kim, W.; Yoo, S.; Lee, J. Microstructure and mechanical properties of pure Ti processed by high-ratio differential speed rolling at room temperature. Scr. Mater. 2010, 62, 451–454. [Google Scholar] [CrossRef]
- Lee, J.-K.; Lee, D.N. Texture control and grain refinement of AA1050 Al alloy sheets by asymmetric rolling. Int. J. Mech. Sci. 2008, 50, 869–887. [Google Scholar] [CrossRef]
- Tóth, L.S.; Beausir, B.; Orlov, D.; Lapovok, R.; Haldar, A. Analysis of texture and R value variations in asymmetric rolling of IF steel. J. Mater. Processing Technol. 2012, 212, 509–515. [Google Scholar] [CrossRef]
- Lee, S.H.; Lee, D.N. Analysis of deformation textures of asymmetrically rolled steel sheets. Int. J. Mech. Sci. 2001, 43, 1997–2015. [Google Scholar] [CrossRef]
- Hamad, K.; Park, J.; Ko, Y.G. Finite element analysis of deformation behavior in Al-2.2 wt.%Mg alloy subjected to differential speed rolling. J. Mater. Eng. Perform. 2015, 24, 2990–3001. [Google Scholar] [CrossRef]
- Loorentz; Ko, Y.G. Effect of differential speed rolling strain on microstructure and mechanical properties of nanostructured 5052 Al alloy. J. Alloy. Compd. 2014, 586, S205–S209. [Google Scholar] [CrossRef]
- Ko, Y.G.; Widiantara, I.; Hamad, K. On the considerability of DSR (Differential Speed Rolling) as a severe plastic deformation method. Adv. Eng. Mater. 2017, 19, 1600722. [Google Scholar] [CrossRef]
- Kim, W.; Lee, K.; Choi, S.-H. Mechanical properties and microstructure of ultra fine-grained copper prepared by a high-speed-ratio differential speed rolling. Mater. Sci. Eng. A 2009, 506, 71–79. [Google Scholar] [CrossRef]
- Hamad, K.; Megantoro, R.; Ko, Y.G. Microstructure and texture evolution in low carbon steel deformed by differential speed rolling (DSR) method. J. Mater. Sci. 2014, 49, 6608–6619. [Google Scholar] [CrossRef]
- Wronski, S.; Bacroix, B. Texture and microstructure variation in asymmetrically rolled steel. Mater. Charact. 2016, 118, 235–243. [Google Scholar] [CrossRef]
- Hamad, K.; Ko, Y.G. Effect of roll speed ratio on microstructure evolution and mechanical properties of 0.18wt% carbon steel deformed by differential speed rolling. Mater. Lett. 2015, 160, 213–217. [Google Scholar] [CrossRef]
- Hamad, K.; Ko, Y.G. Annealing characteristics of ultrafine grained low-carbon steel processed by differential speed rolling method. Metall. Mater. Trans. A 2016, 47, 2319–2334. [Google Scholar] [CrossRef]
- Sakai, T.; Belyakov, A.; Kaibyshev, R.; Miura, H.; Jonas, J.J. Dynamic and post-dynamic recrystallization under hot, cold and severe plastic deformation conditions. Prog. Mater. Sci. 2014, 60, 130–207. [Google Scholar] [CrossRef] [Green Version]
- Valiev, R.R.; Islamgaliev, I. Alexandrov: Bulk nanostructured materials from severe plastic deformation. Prog. Mater. Sci. 2000, 45, 103–189. [Google Scholar] [CrossRef]
- Brandes, E.; Brook, G. 15.1 Elastic properties. In Smithells Metals Reference Book, 7th ed.; Butterworth-Heinemann: Bath, UK, 1992. [Google Scholar]
- Gladman, T.; Pickering, F. The effect of grain size on the mechanical properties of ferrous materials. In Yield, Flow and Fracture of Polycrystals, 1st ed.; Baker, T., Ed.; Applied Science Publishers: London, UK; New York, NY, USA, 1983; pp. 141–198. [Google Scholar]
- Langford, G.; Cohen, M. Strain hardening of iron by severe plastic deformation. Trans. ASM 1969, 62, 623–638. [Google Scholar]
- Huang, X.; Suzuki, K.; Watazu, A.; Shigematsu, I.; Saito, N. Mechanical properties of Mg-Al-Zn alloy with a tilted basal texture obtained by differential speed rolling. Mater. Sci. Eng. A 2008, 488, 214–220. [Google Scholar] [CrossRef]
- Valiev, R.; Kozlov, E.; Ivanov, Y.; Lian, J.; Nazarov, A.; Baudelet, B. Deformation behaviour of ultra-fine-grained copper. Acta Metall. Mater. 1994, 42, 2467–2475. [Google Scholar] [CrossRef]
- Ko, Y.G.; Shin, D.H.; Park, K.-T.; Lee, C.S. An analysis of the strain hardening behavior of ultra-fine grain pure titanium. Scr. Mater. 2006, 54, 1785–1789. [Google Scholar] [CrossRef]
- Fukuda, Y.; Oh-ishi, K.; Horita, Z.; Langdon, T. Processing of a low-carbon steel by equal-channel angular pressing. Acta Mater. 2002, 50, 1359–1368. [Google Scholar] [CrossRef]
- Son, Y.I.; Lee, Y.K.; Park, K.-T.; Lee, C.S.; Shin, D.H. Ultrafine grained ferrite–martensite dual phase steels fabricated via equal channel angular pressing: Microstructure and tensile properties. Acta Mater. 2005, 53, 3125–3134. [Google Scholar] [CrossRef]
- Park, K.-T.; Han, S.; Ahn, B.; Shin, D.; Lee, Y.; Um, K. Ultrafine grained dual phase steel fabricated by equal channel angular pressing and subsequent intercritical annealing. Scr. Mater. 2004, 51, 909–913. [Google Scholar] [CrossRef]
- Kim, W.; Kim, J.; Choo, W.; Hong, S.; Lee, J. Large strain hardening in Ti-V carbon steel processed by equal channel angular pressing. Mater. Lett. 2001, 51, 177–182. [Google Scholar] [CrossRef]
- Dieter, G.E. Mechanical Metallurgy; Metric, S.I., Ed.; McGraw-Hill Book Company: London, UK, 1988; pp. 593–596. [Google Scholar]
- McConnell, C.; Lenard, J. Friction in cold rolling of a low carbon steel with lubricants. J. Mater. Processing Technol. 2000, 99, 86–93. [Google Scholar] [CrossRef]
- Pan, D.; Sansome, D. An experimental study of the effect of roll-speed mismatch on the rolling load during the cold rolling of thin strip. J. Mech. Work. Technol. 1982, 6, 361–377. [Google Scholar] [CrossRef]
- Ko, Y.; Suharto, J.; Lee, J.; Park, B.; Shin, D. Effect of roll speed ratio on deformation characteristics of IF steel subjected to differential speed rolling. Met. Mater. Int. 2013, 19, 603–609. [Google Scholar] [CrossRef]
- Tzou, G.-Y. Relationship between frictional coefficient and frictional factor in asymmetrical sheet rolling. J. Mater. Processing Technol. 1999, 86, 271–277. [Google Scholar] [CrossRef]
Figure 1.
Optical micrographs of the microstructure after DSR and ESR. (a) After the first pass of DSR; (b) after the second pass of DSR; (c) after the fourth pass of DSR; (d) after the fourth pass of ESR.
Figure 1.
Optical micrographs of the microstructure after DSR and ESR. (a) After the first pass of DSR; (b) after the second pass of DSR; (c) after the fourth pass of DSR; (d) after the fourth pass of ESR.

Figure 2.
An EBSD inverse pole figure map of the microstructure after DSR and ESR. (a) After the first pass of DSR; (b) after the second pass of DSR; (c) after the fourth pass of DSR; (d) after the fourth pass of ESR. The color indicates the orientation of each grain.
Figure 2.
An EBSD inverse pole figure map of the microstructure after DSR and ESR. (a) After the first pass of DSR; (b) after the second pass of DSR; (c) after the fourth pass of DSR; (d) after the fourth pass of ESR. The color indicates the orientation of each grain.

Figure 3.
An EBSD grain boundary map of the microstructure after DSR and ESR. (a) After first pass of DSR; (b) after second pass of DSR, (c) after fourth pass of DSR; (d) after fourth pass of ESR. fHAGB is the fraction of high angle grain boundaries.
Figure 3.
An EBSD grain boundary map of the microstructure after DSR and ESR. (a) After first pass of DSR; (b) after second pass of DSR, (c) after fourth pass of DSR; (d) after fourth pass of ESR. fHAGB is the fraction of high angle grain boundaries.

Figure 4.
The bright field image of the microstructure after the fourth pass of (a) DSR and (b) ESR.
Figure 4.
The bright field image of the microstructure after the fourth pass of (a) DSR and (b) ESR.

Figure 5.
(a) Load-displacement curves for the samples acquired by nanoindentation. Indentation images for the samples: (b) prior to rolling; (c) after the first pass of DSR; (d) after the second pass of DSR; (e) after the fourth pass of DSR; and (f) after the fourth pass of ESR.
Figure 5.
(a) Load-displacement curves for the samples acquired by nanoindentation. Indentation images for the samples: (b) prior to rolling; (c) after the first pass of DSR; (d) after the second pass of DSR; (e) after the fourth pass of DSR; and (f) after the fourth pass of ESR.

Figure 6.
Stress-strain curves of the samples processed by rolling deformation.

Figure 7.
The load-stroke curves during rolling deformation.

Figure 8.
(a) Sample geometry and (b) a schematic side view during the DSR process. The contacting area and the deformation volume are shaded. w: sheet width; ti: initial thickness; tf: final thickness; R: roll radius; ψ: contact angle; v1 and v2: rolling velocities.
Figure 8.
(a) Sample geometry and (b) a schematic side view during the DSR process. The contacting area and the deformation volume are shaded. w: sheet width; ti: initial thickness; tf: final thickness; R: roll radius; ψ: contact angle; v1 and v2: rolling velocities.


Table 1.
Parameters, hardness, and elastic modulus (E), which were acquired from the nanoindentation analysis.
Table 1.
Parameters, hardness, and elastic modulus (E), which were acquired from the nanoindentation analysis.
| Condition | A (m2) | Hardness (GPa) | E (GPa) | |
|---|---|---|---|---|
| Before rolling | 0.989 | 1.78 × 10⁻⁹ | 1.10 | 209.80 |
| After 1-pass of DSR | 0.962 | 1.13 × 10⁻⁹ | 1.73 | 210.15 |
| After 2-pass of DSR | 0.956 | 0.90 × 10⁻⁹ | 2.18 | 208.45 |
| After 4-pass of DSR | 0.929 | 0.50 × 10⁻⁹ | 3.93 | 210.18 |
| After 4-pass of ESR | 0.934 | 0.79 × 10⁻⁹ | 2.50 | 210.05 |
hr: residual depth of penetration, hmax: maximum depth of penetration, A: true contact area at the maximum load.
Table 2.
The actual increment in yield strength (Δσ) and calculated Δσ of the samples after the fourth pass of DSR and ESR.
Table 2.
The actual increment in yield strength (Δσ) and calculated Δσ of the samples after the fourth pass of DSR and ESR.
| Condition | d (μm) | Actual Δσ (MPa) | Calculated Δσ (MPa) |
|---|---|---|---|
| Before rolling | 32 ± 4 | - | - |
| After 4-pass of DSR | 0.38 ± 0.11 | 600 | 694 |
| After 4-pass of ESR | 0.65 ± 0.14 | 527 | 508 |
d: mean lineal intercept grain size.
Table 3.
The process parameters, grain size evolution, and tensile properties of low carbon steels produced by severe plastic deformation (SPD).
Table 3.
The process parameters, grain size evolution, and tensile properties of low carbon steels produced by severe plastic deformation (SPD).
| C Content (wt %) | SPD Method | Strain | Number of Passes | Deformation Temperature (K) | d (μm) | Tensile Properties | Reference | ||
|---|---|---|---|---|---|---|---|---|---|
| Initial | Final | σy (MPa) | εtot (%) | ||||||
| 0.08 | ECAP | ~3 | 3 | 298 | ~45 | ~0.2 | 420 | 32 | [28] |
| 0.15 | ECAP | ~4 | 4 | 773 | 28 | ~0.8 | 581 | 17.6 | [29] |
| 0.15 | ECAP | ~4 | 4 | 773 | - | ~1.4 | 581 | 17.6 | [30] |
| 0.10 | ECAP | ~4 | 1 | 500 | - | ~0.3 | 650 | 35 | [31] |
| 0.18 | DSR | ~7.6 | 4 | 298 | 32 | 0.4 | 780 | 4 | Present study |
d: mean lineal intercept grain size, σy: yield strength, εtot: total elongation.
Table 4.
The calculated contacting area (A) and deformation volume (V). For relative values, the values of 1-pass of DSR were set as reference.
Table 4.
The calculated contacting area (A) and deformation volume (V). For relative values, the values of 1-pass of DSR were set as reference.
| Condition | A | V | ||
|---|---|---|---|---|
| Absolute (mm2) | Relative | Absolute (mm3) | Relative | |
| 1-pass of DSR | 372 | 1.00 | 1392 | 1.00 |
| 2-pass of DSR | 314 | 0.84 | 822 | 0.59 |
| 4-pass of DSR | 199 | 0.63 | 253 | 0.30 |
Publisher’s Note: MDPI stays neutral with regard to jurisdictional claims in published maps and institutional affiliations. |
© 2022 by the authors. Licensee MDPI, Basel, Switzerland. This article is an open access article distributed under the terms and conditions of the Creative Commons Attribution (CC BY) license (https://creativecommons.org/licenses/by/4.0/).
Share and Cite
MDPI and ACS Style
Kang, J.-H.; Ko, Y.-G. Strengthening of 0.18 wt % C Steel by Cold Differential Speed Rolling. Materials 2022, 15, 3717. https://0-doi-org.brum.beds.ac.uk/10.3390/ma15103717
AMA Style
Kang J-H, Ko Y-G. Strengthening of 0.18 wt % C Steel by Cold Differential Speed Rolling. Materials. 2022; 15(10):3717. https://0-doi-org.brum.beds.ac.uk/10.3390/ma15103717
Chicago/Turabian StyleKang, Jee-Hyun, and Young-Gun Ko. 2022. "Strengthening of 0.18 wt % C Steel by Cold Differential Speed Rolling" Materials 15, no. 10: 3717. https://0-doi-org.brum.beds.ac.uk/10.3390/ma15103717
Note that from the first issue of 2016, this journal uses article numbers instead of page numbers. See further details here.