
The Influence of Ce, La, and SiC Particles Addition on the Formability of an Al-Si-Cu-Mg-Fe SiCp-MMC


 , ,
, ,
Abstract
:
1. Introduction
2. Materials and Methods
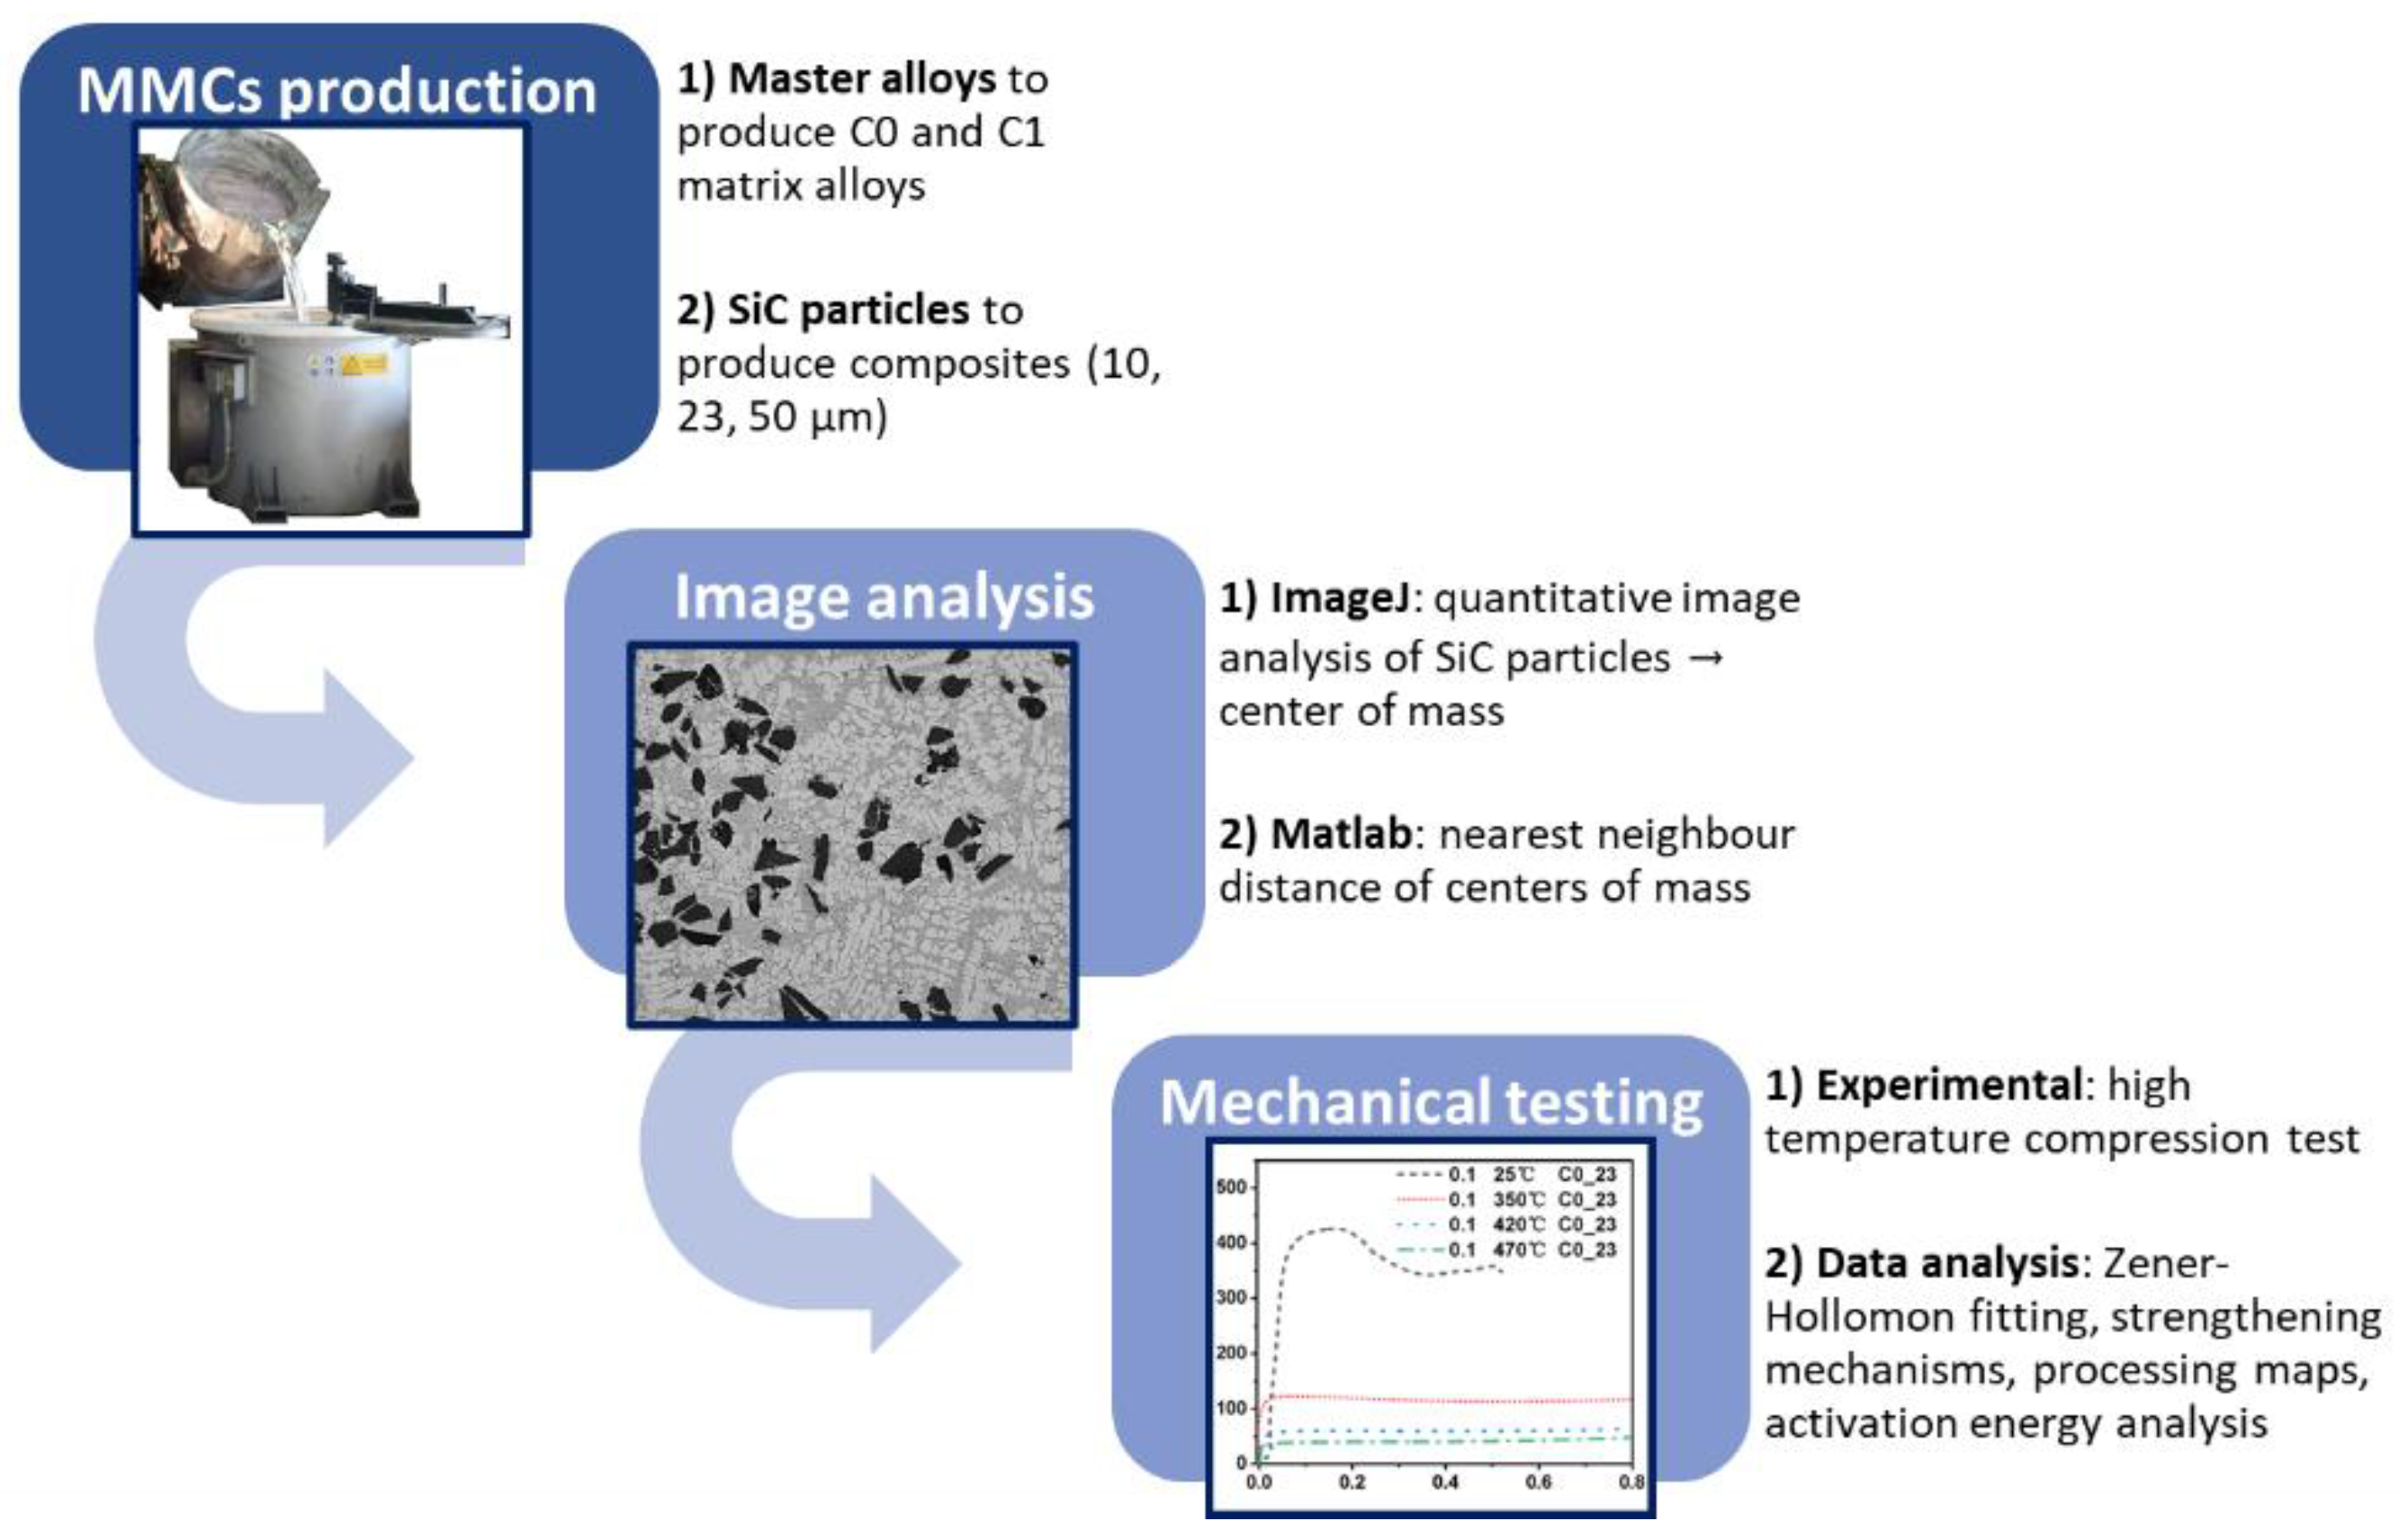
2.1. Material Production
2.2. Metallography
2.3. Mechanical Testing
3. Results
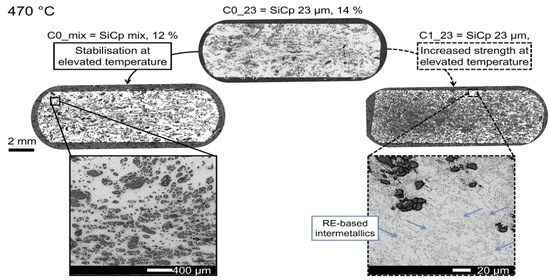
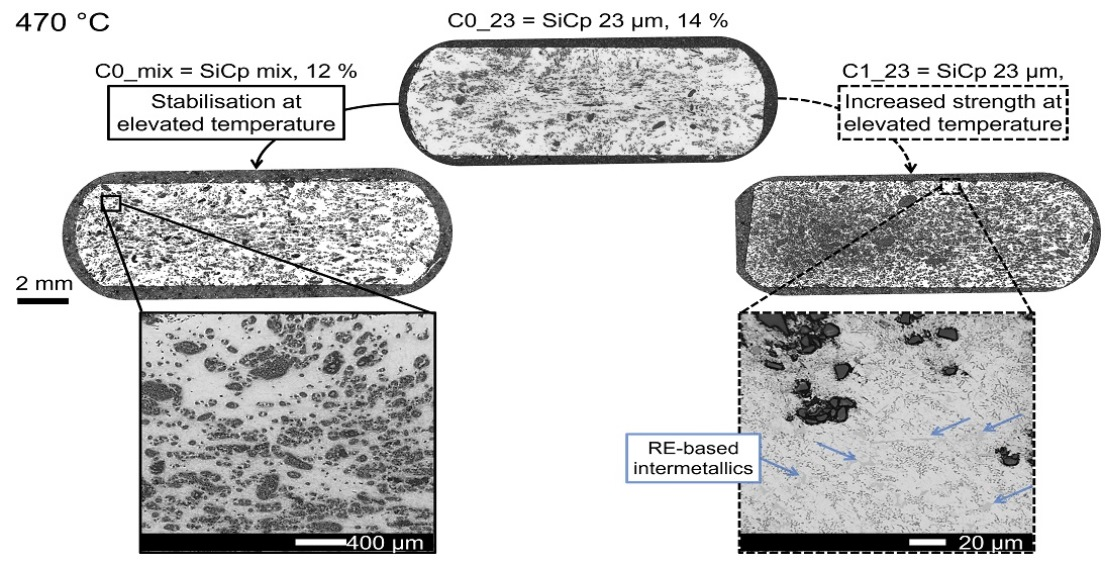
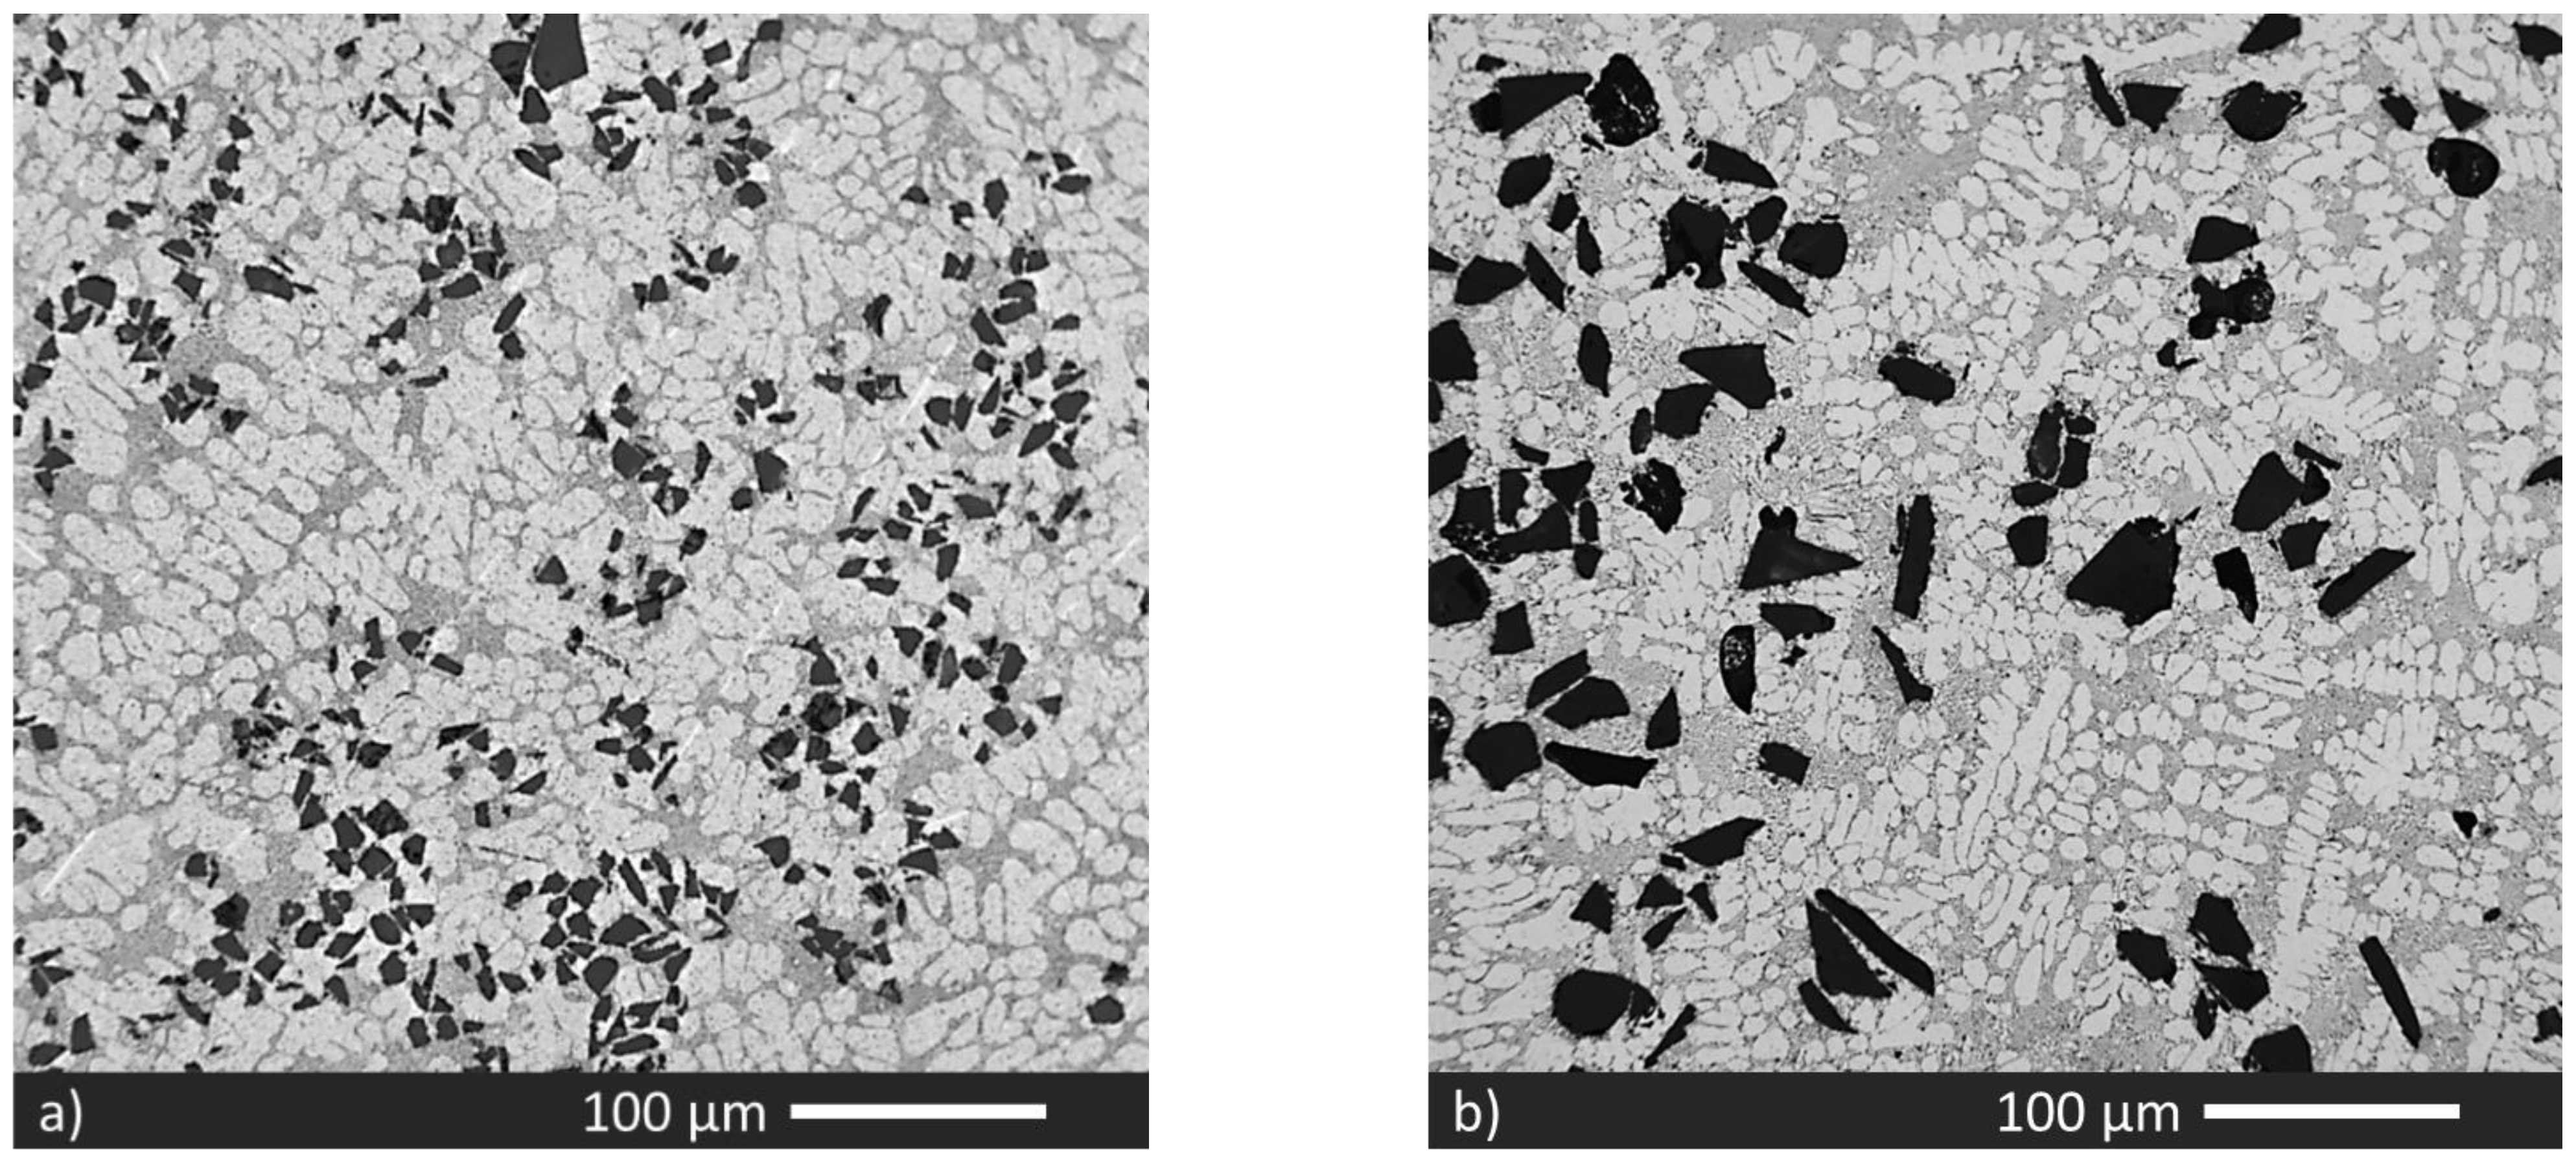
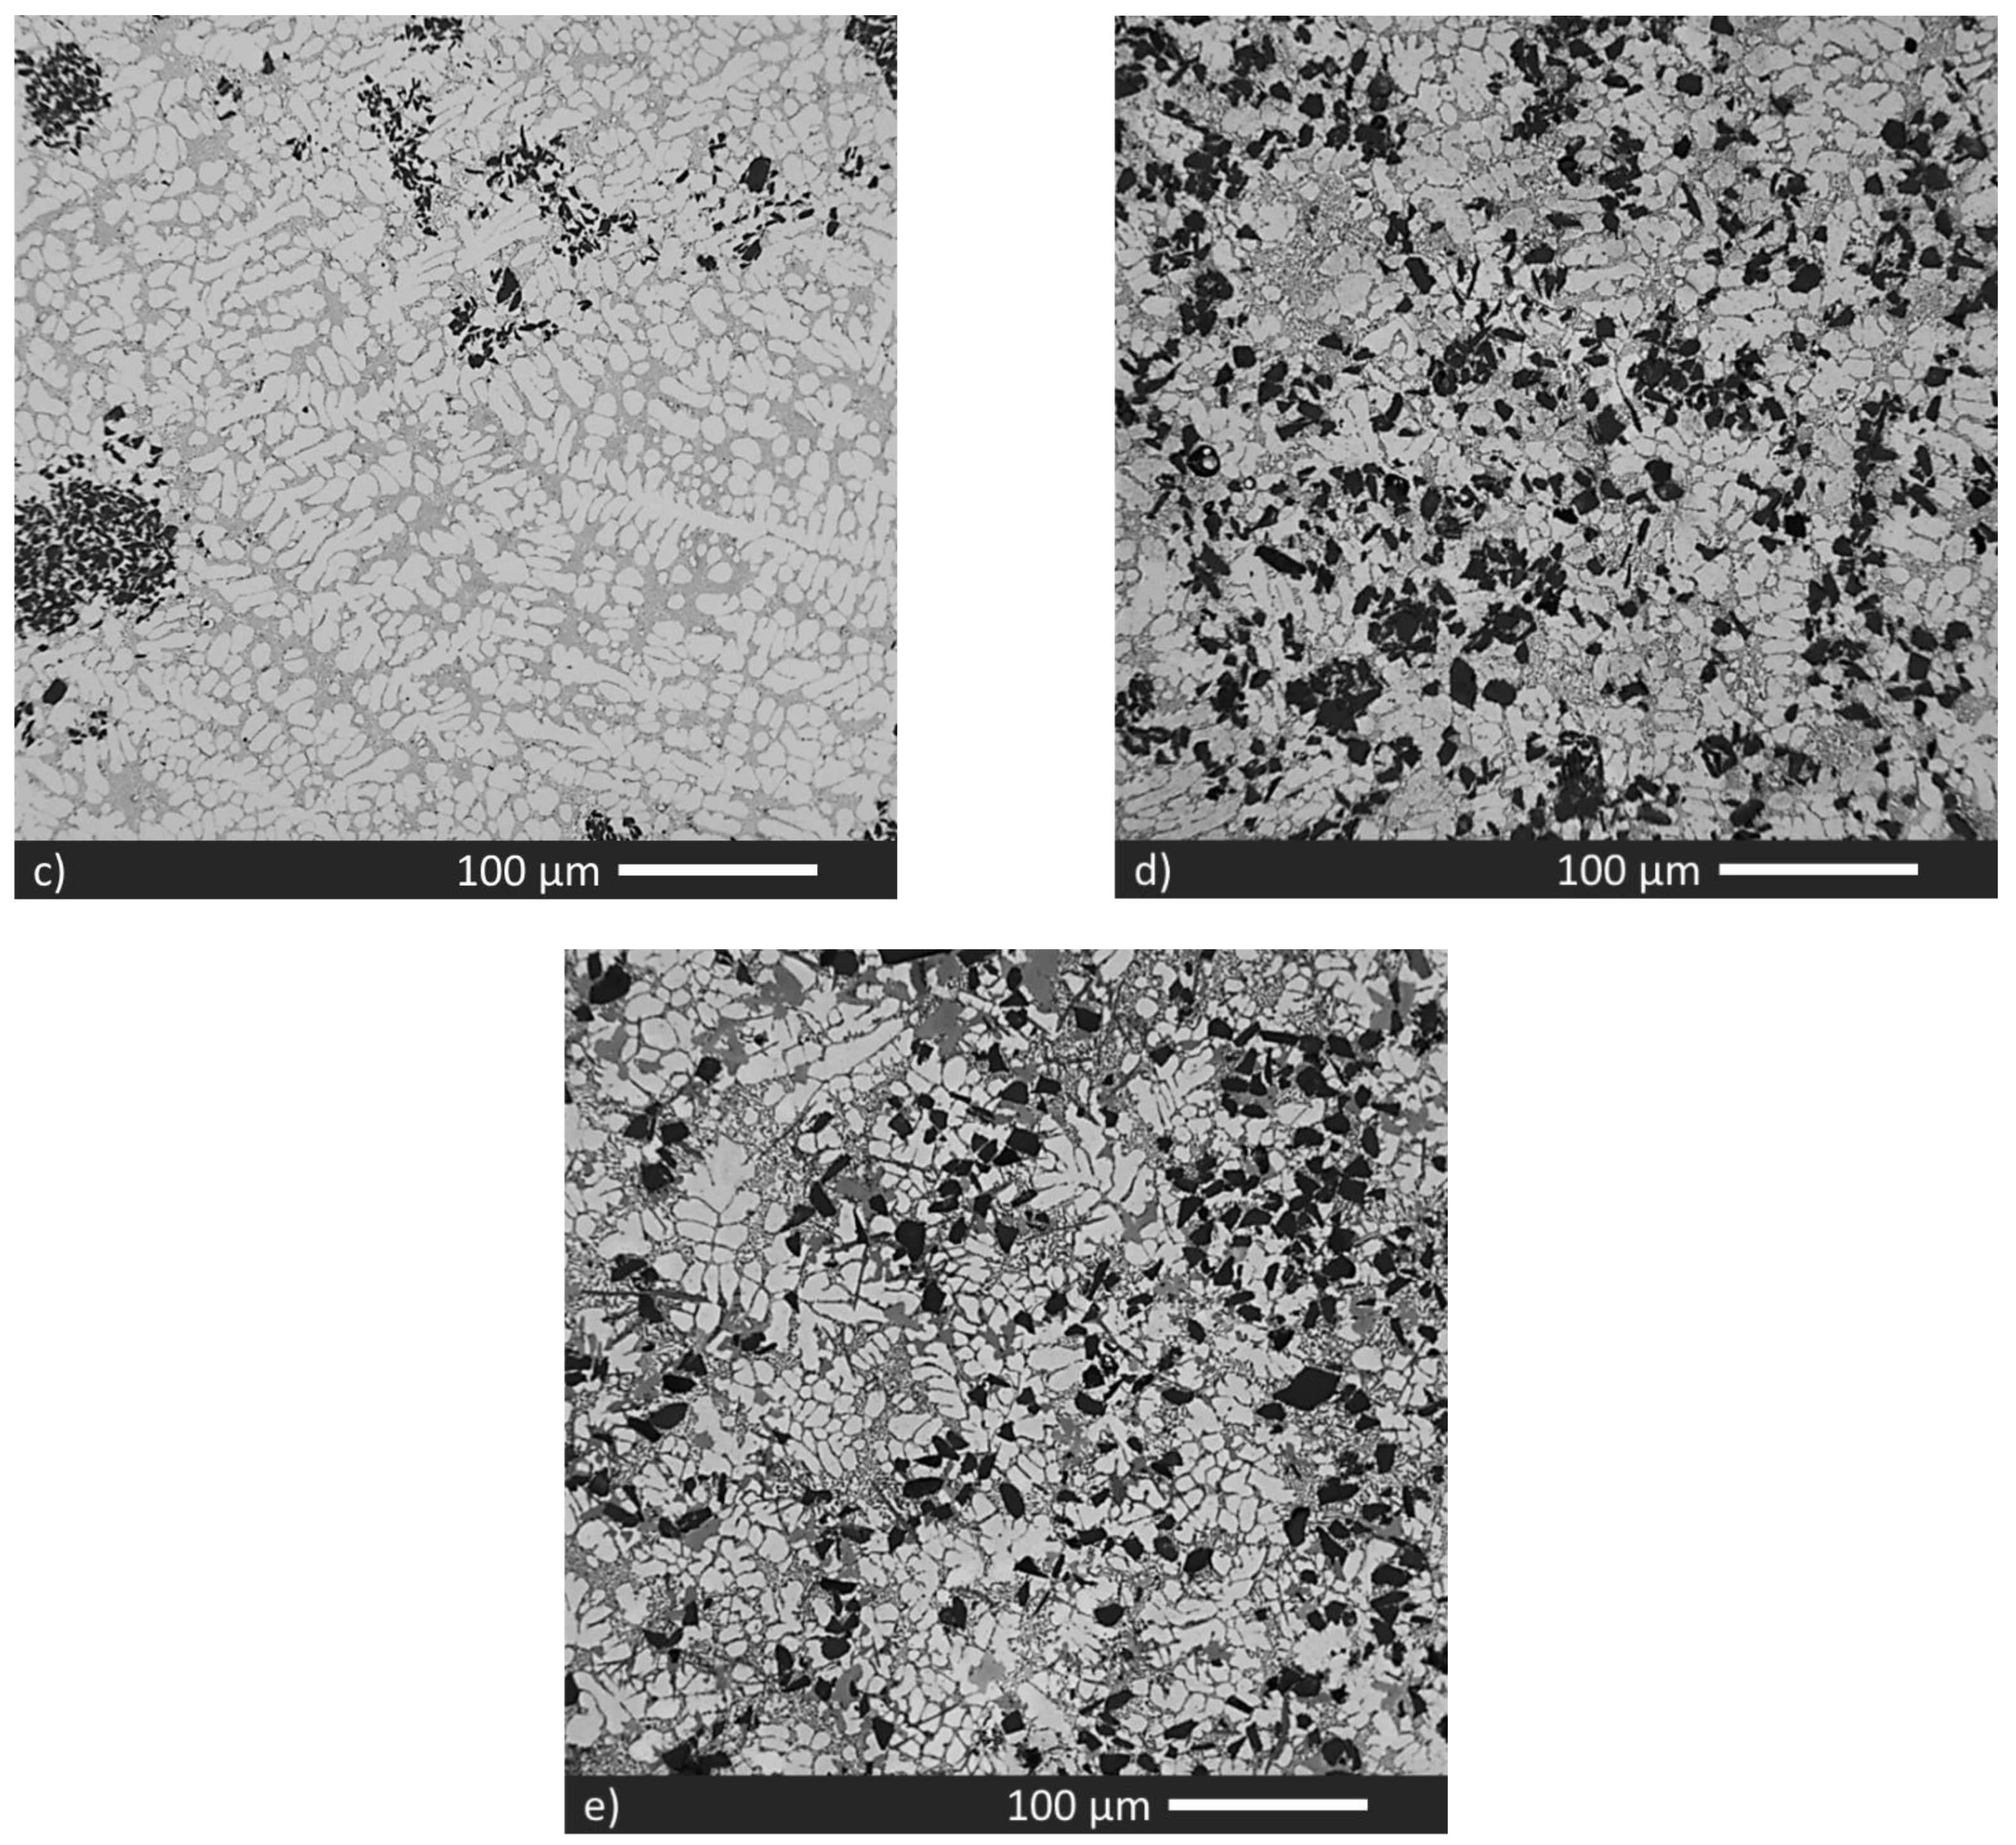
3.1. Microstructural Analysis
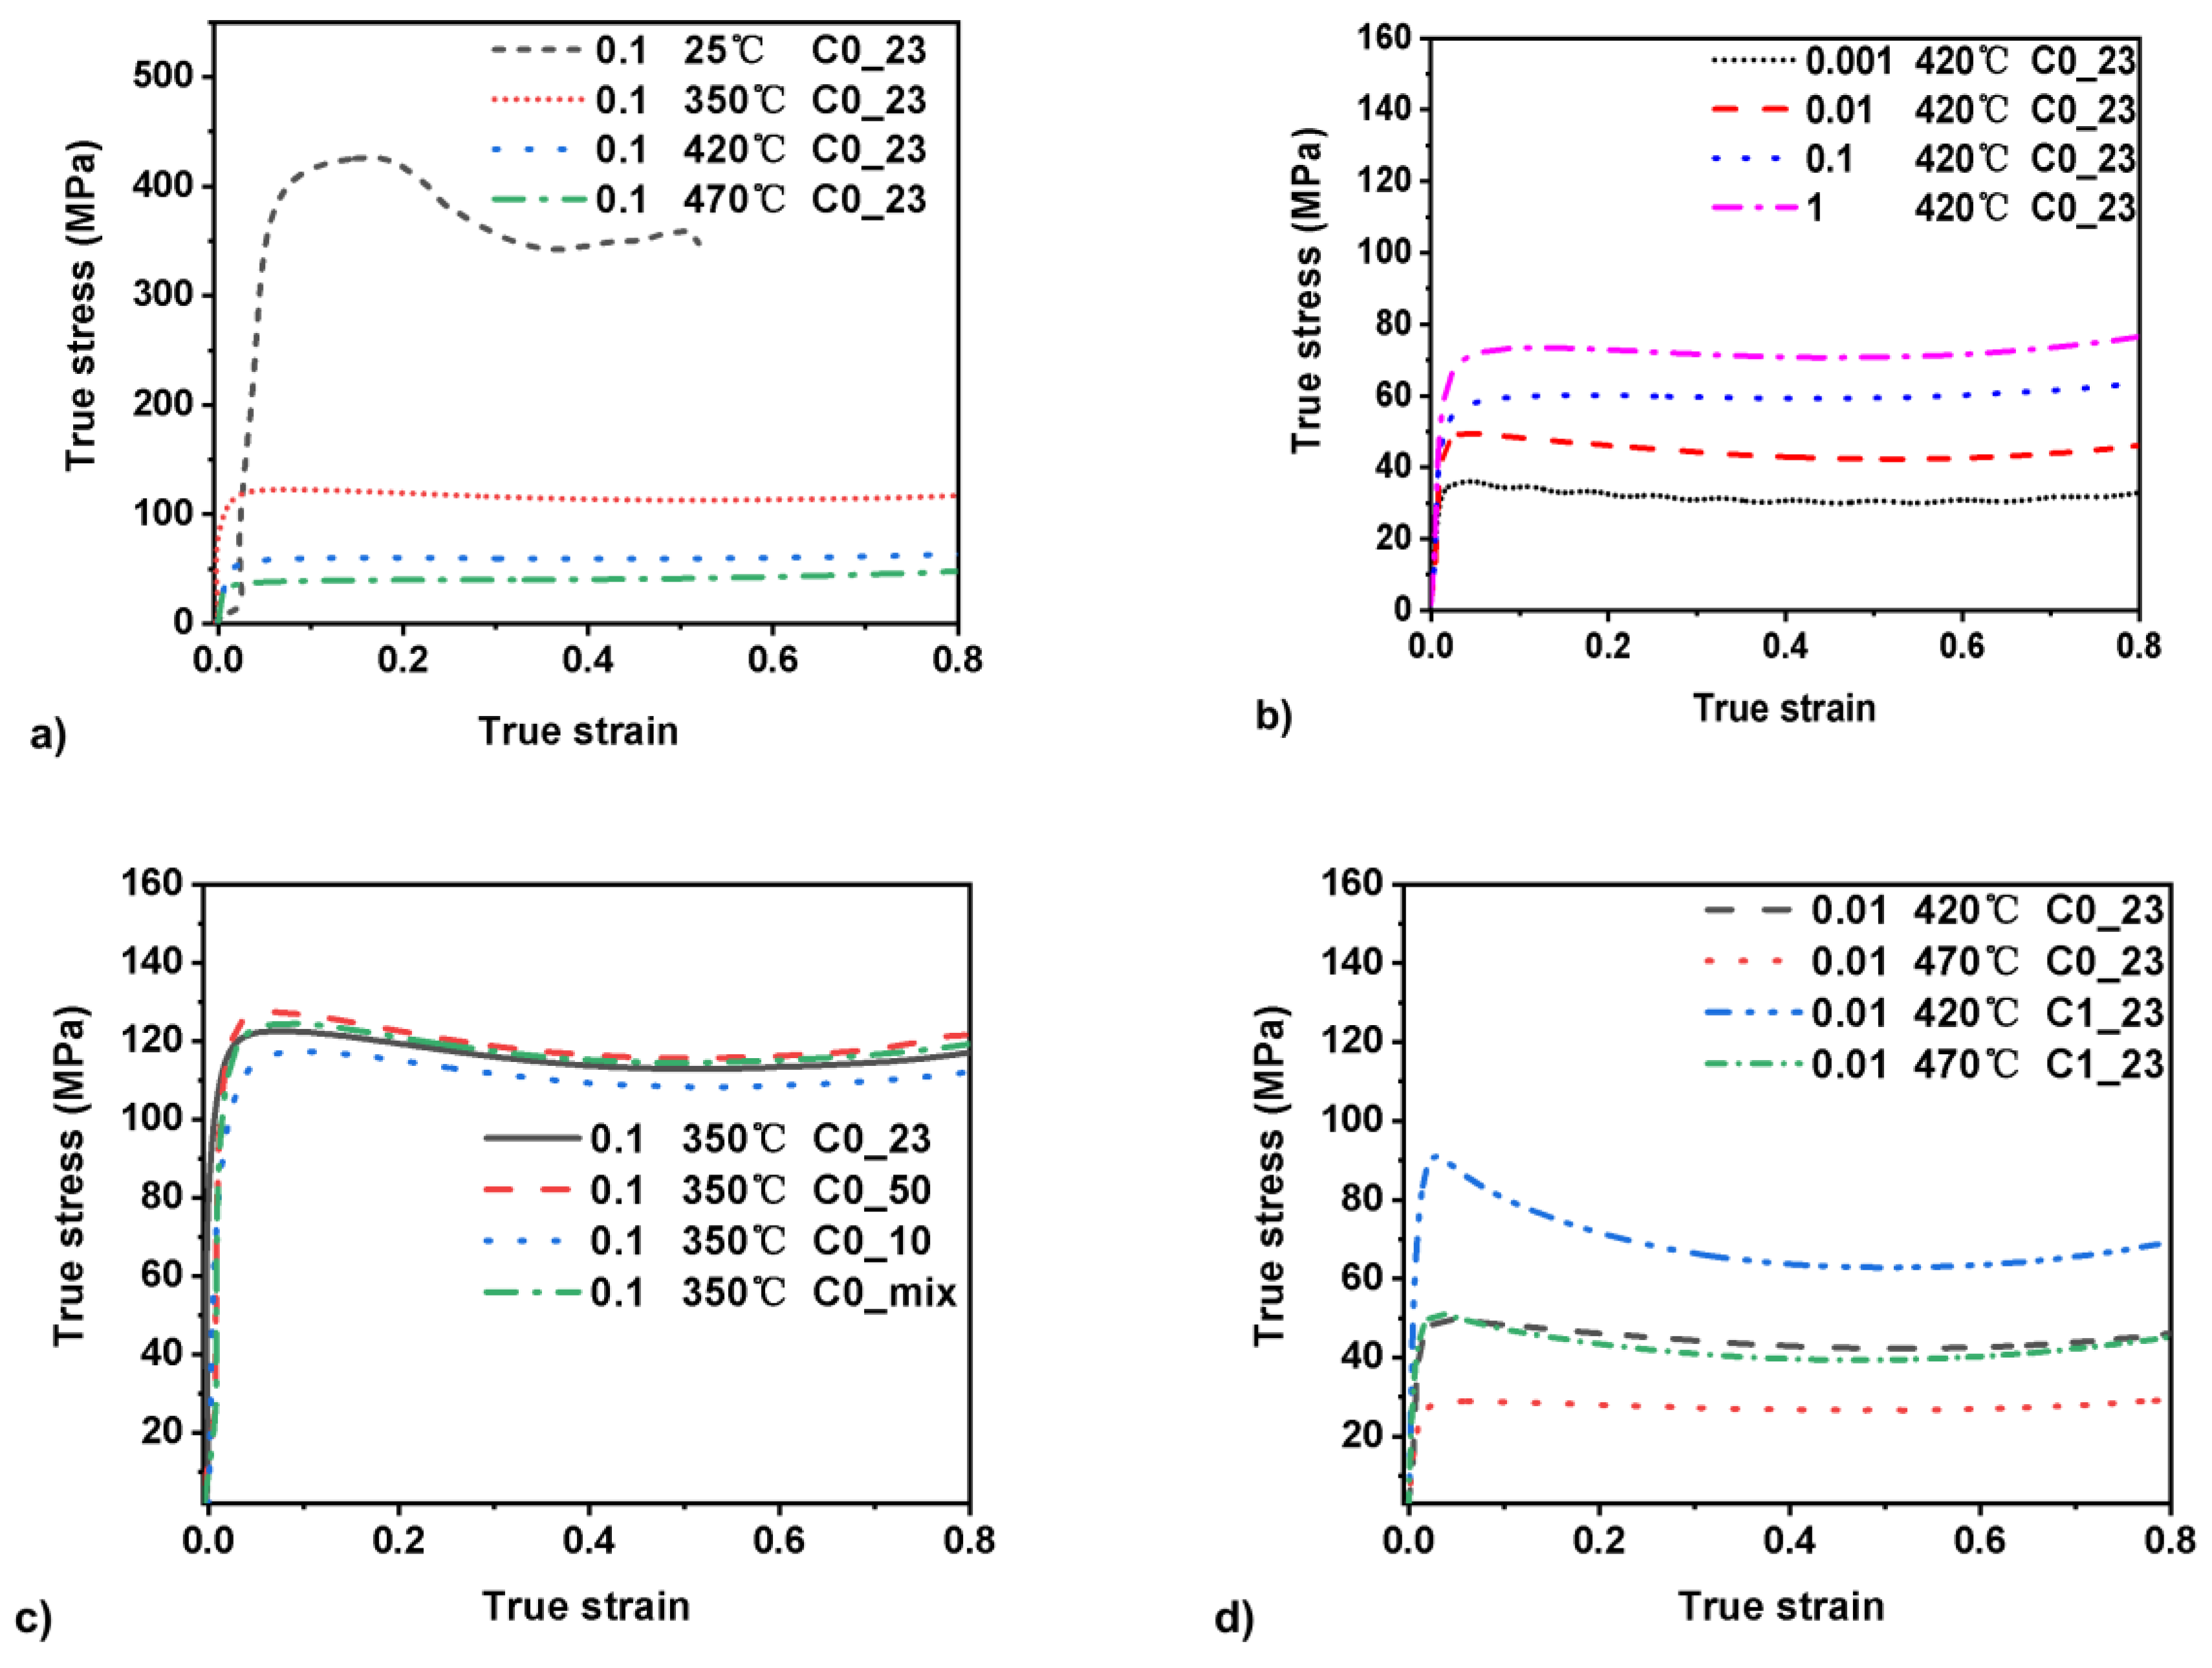
3.2. Mechanical Testing
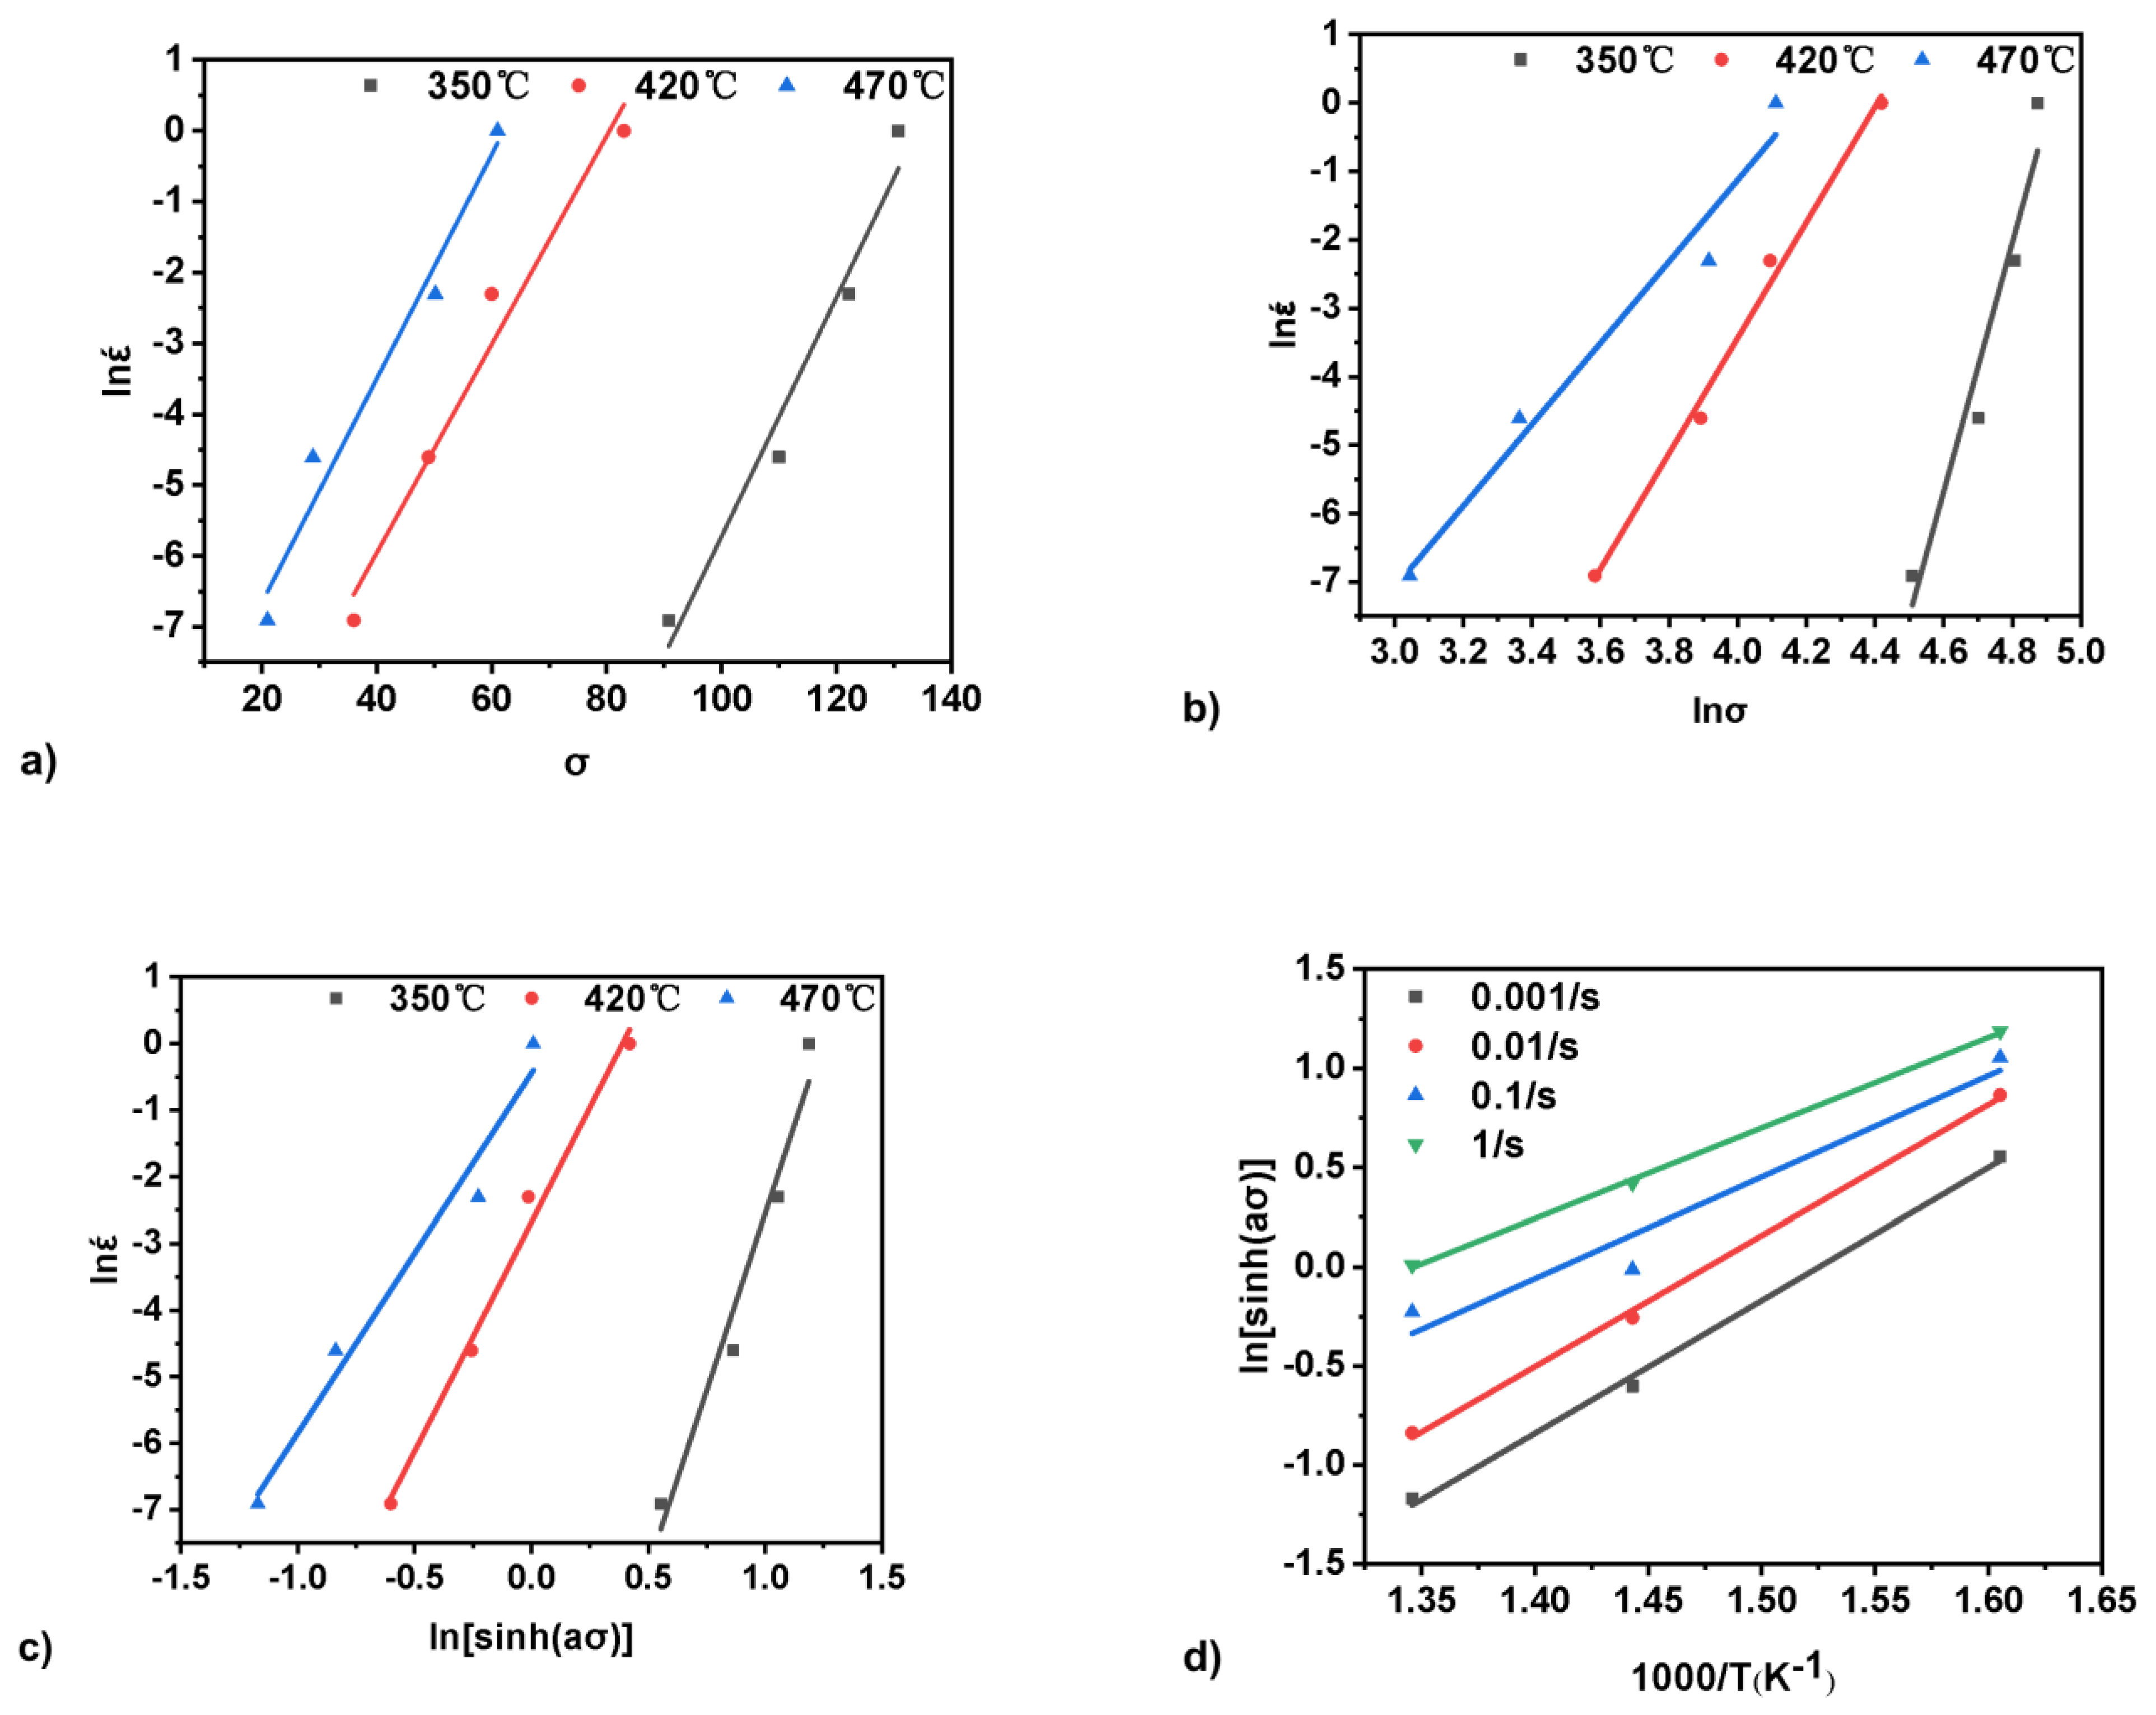
3.3. Zener−Hollomon Analysis
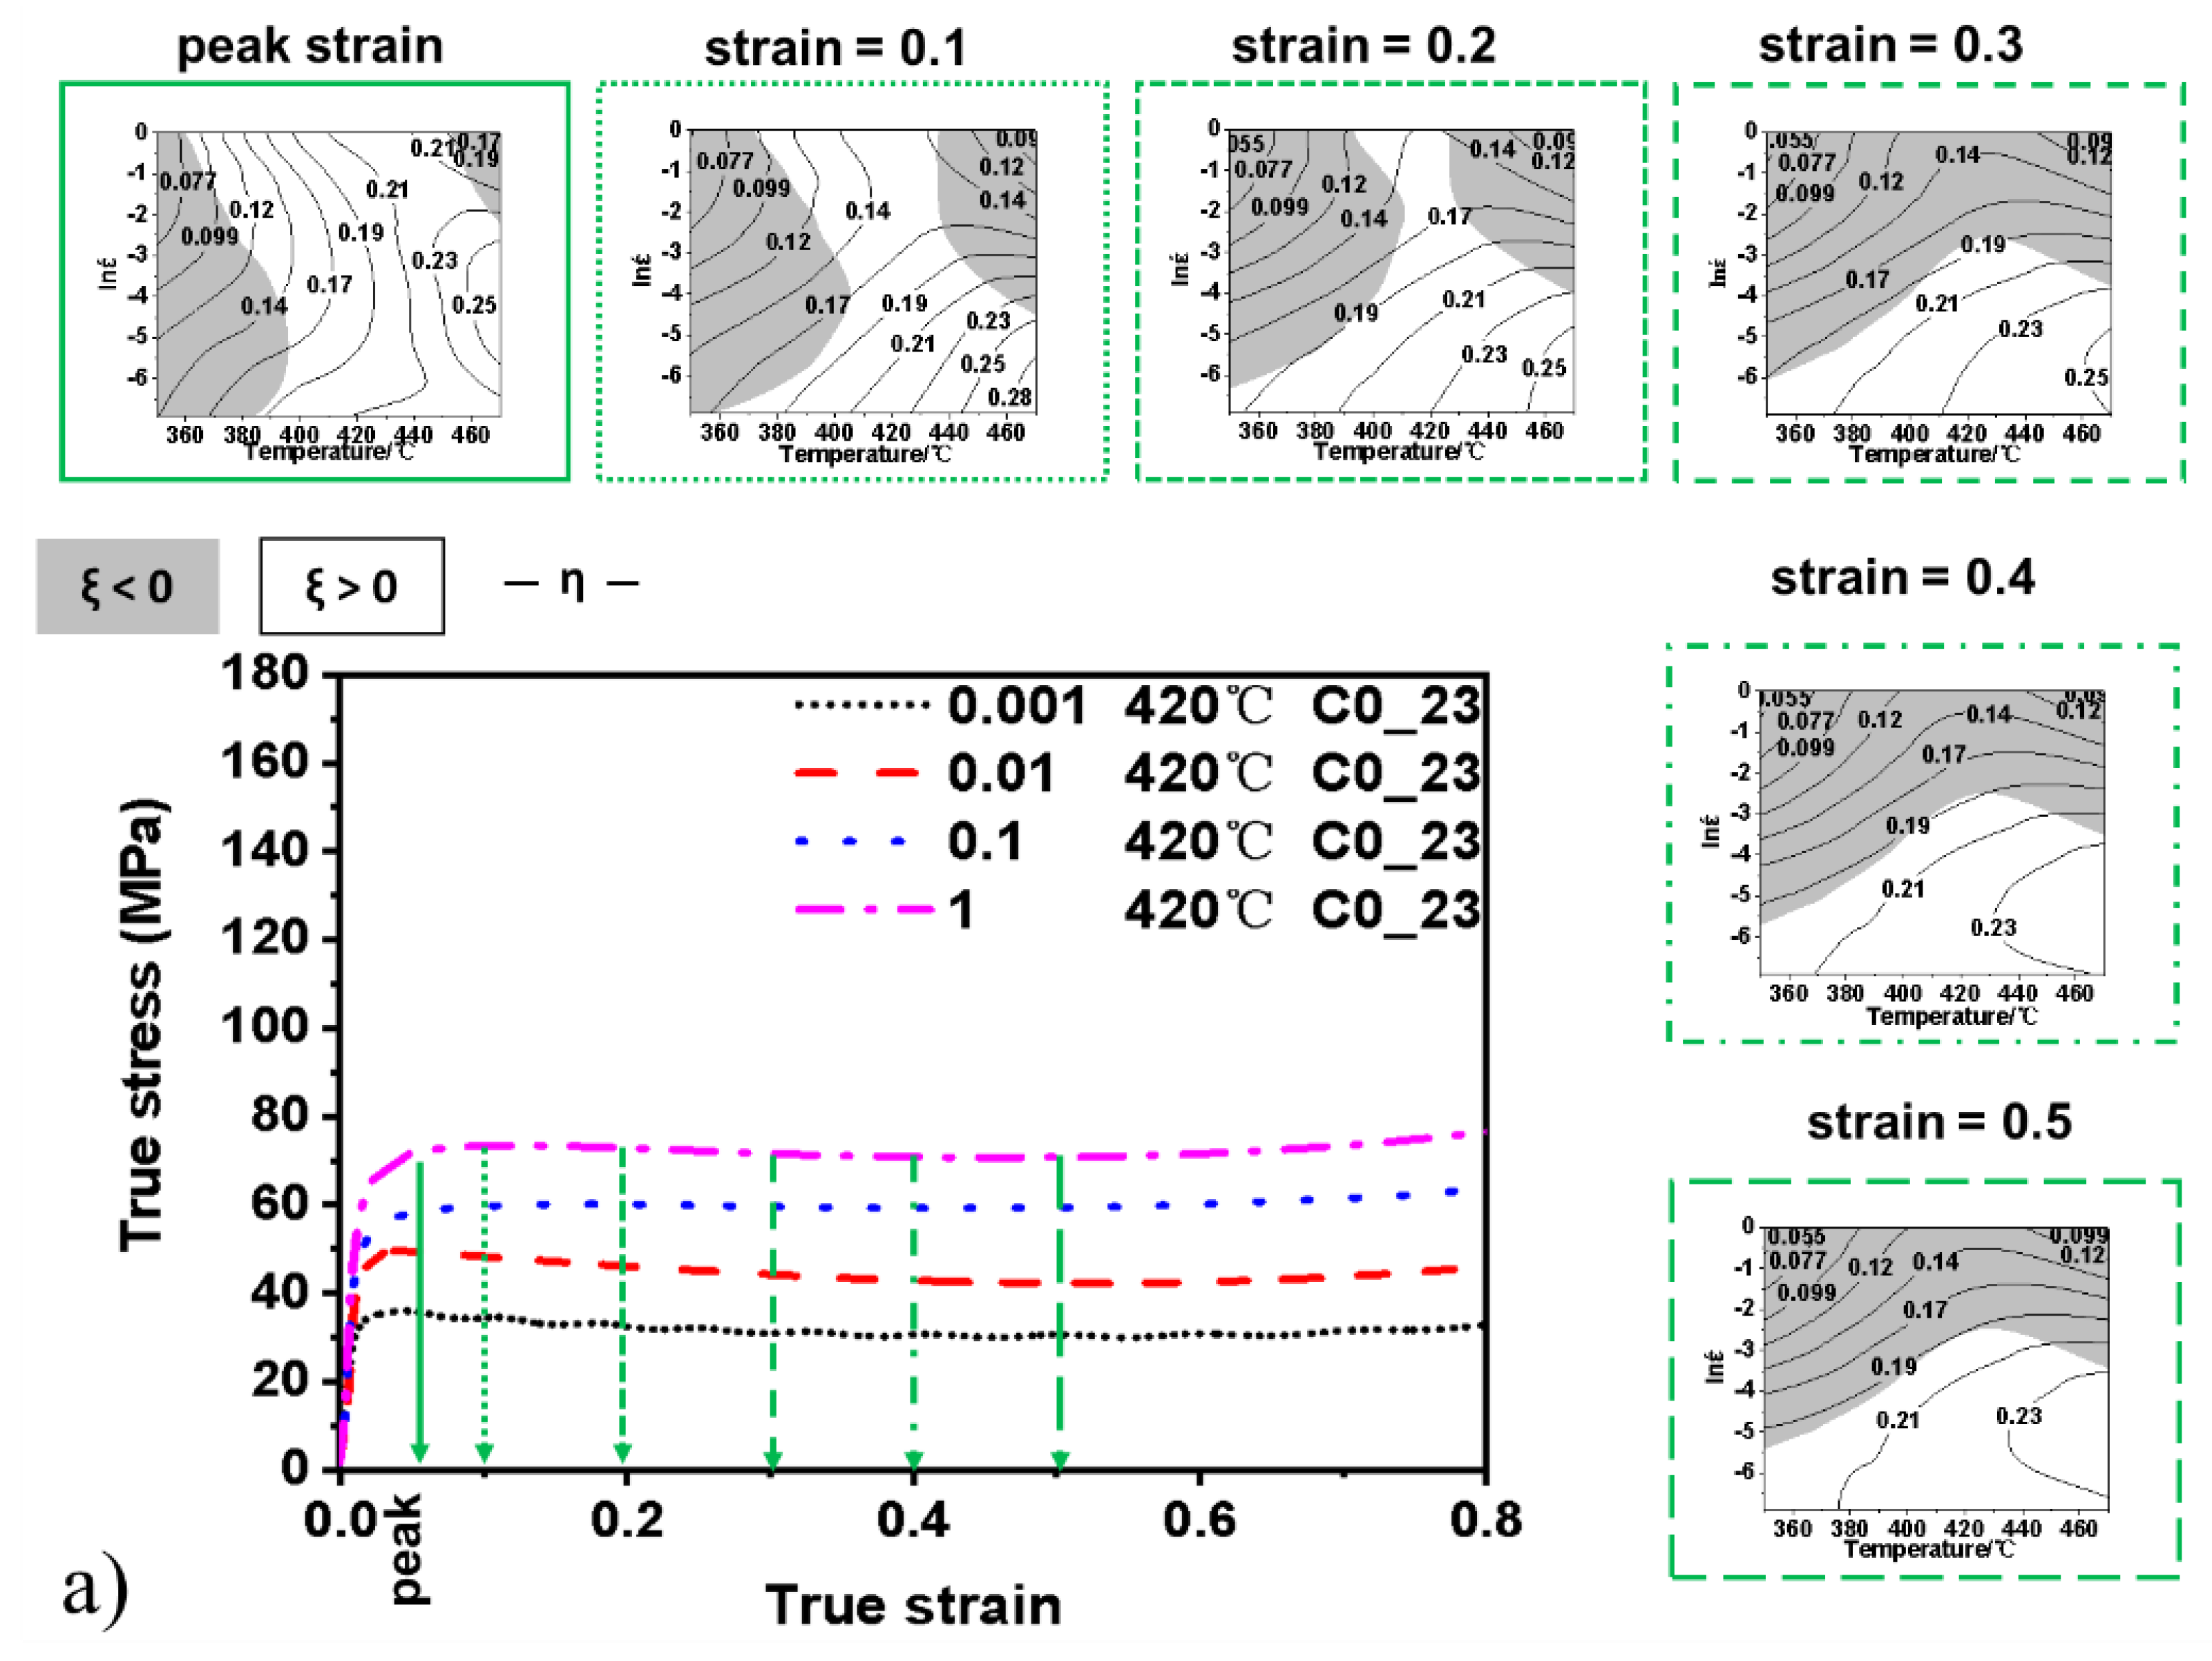
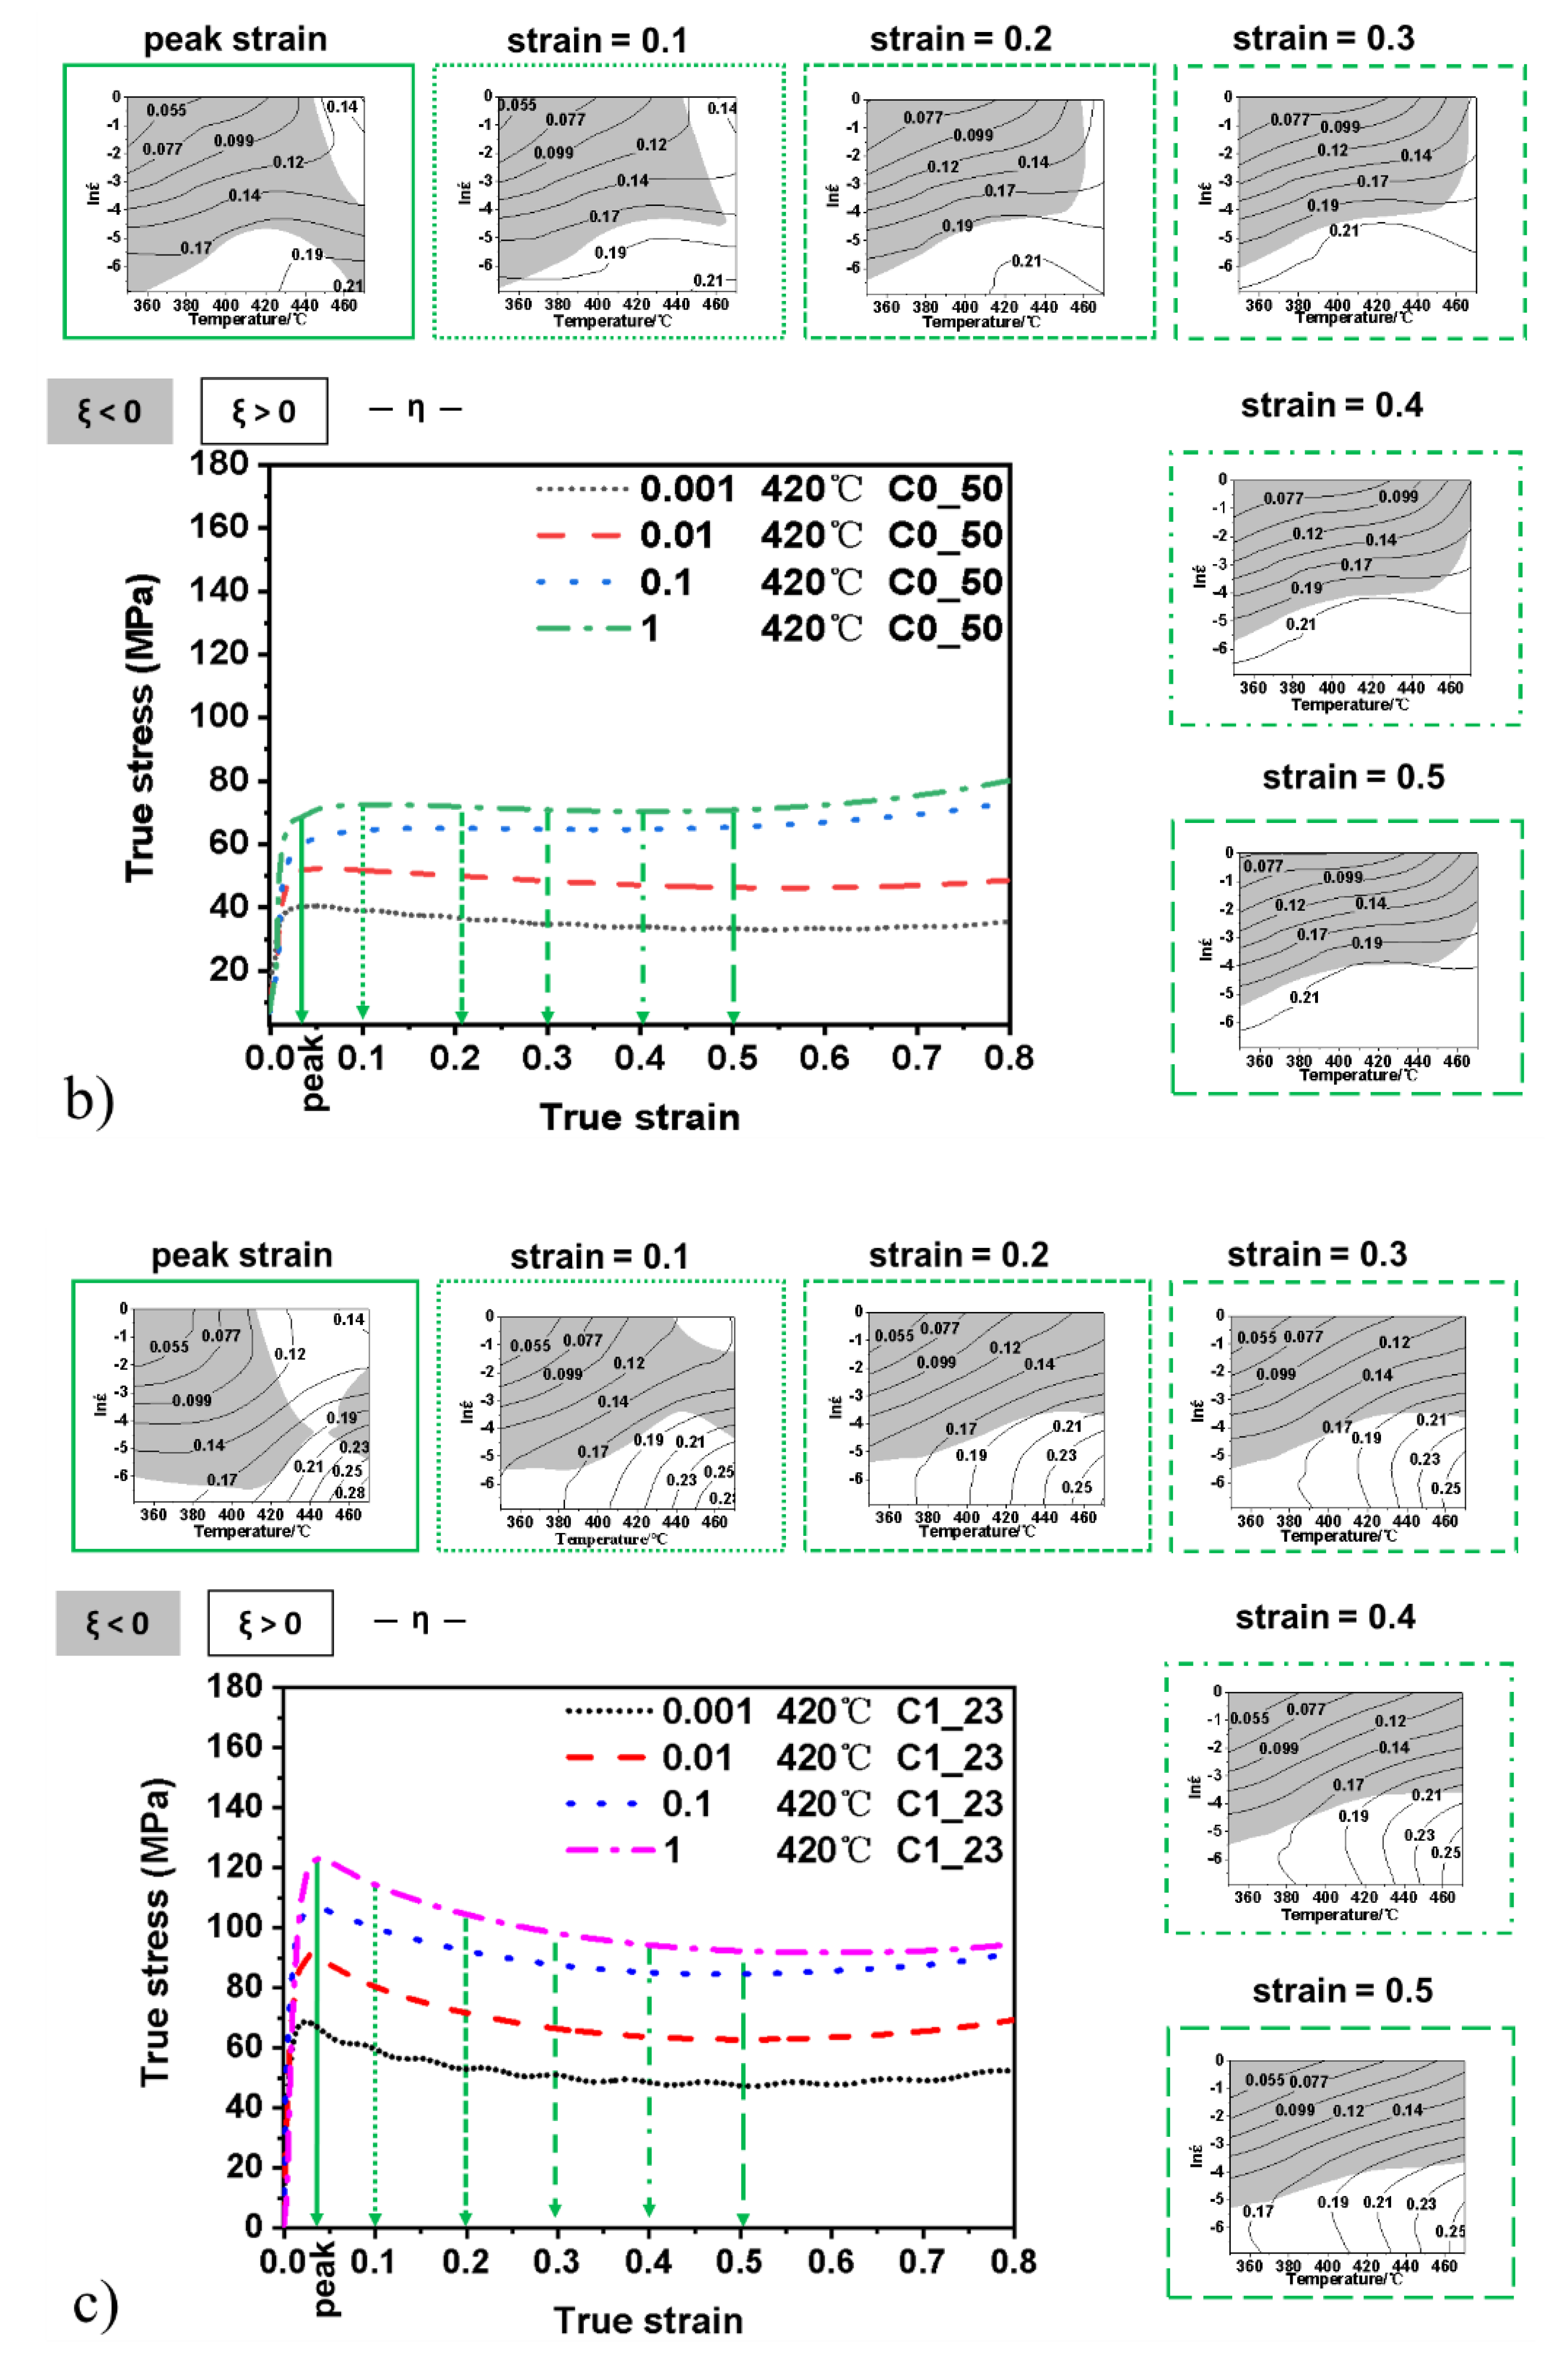
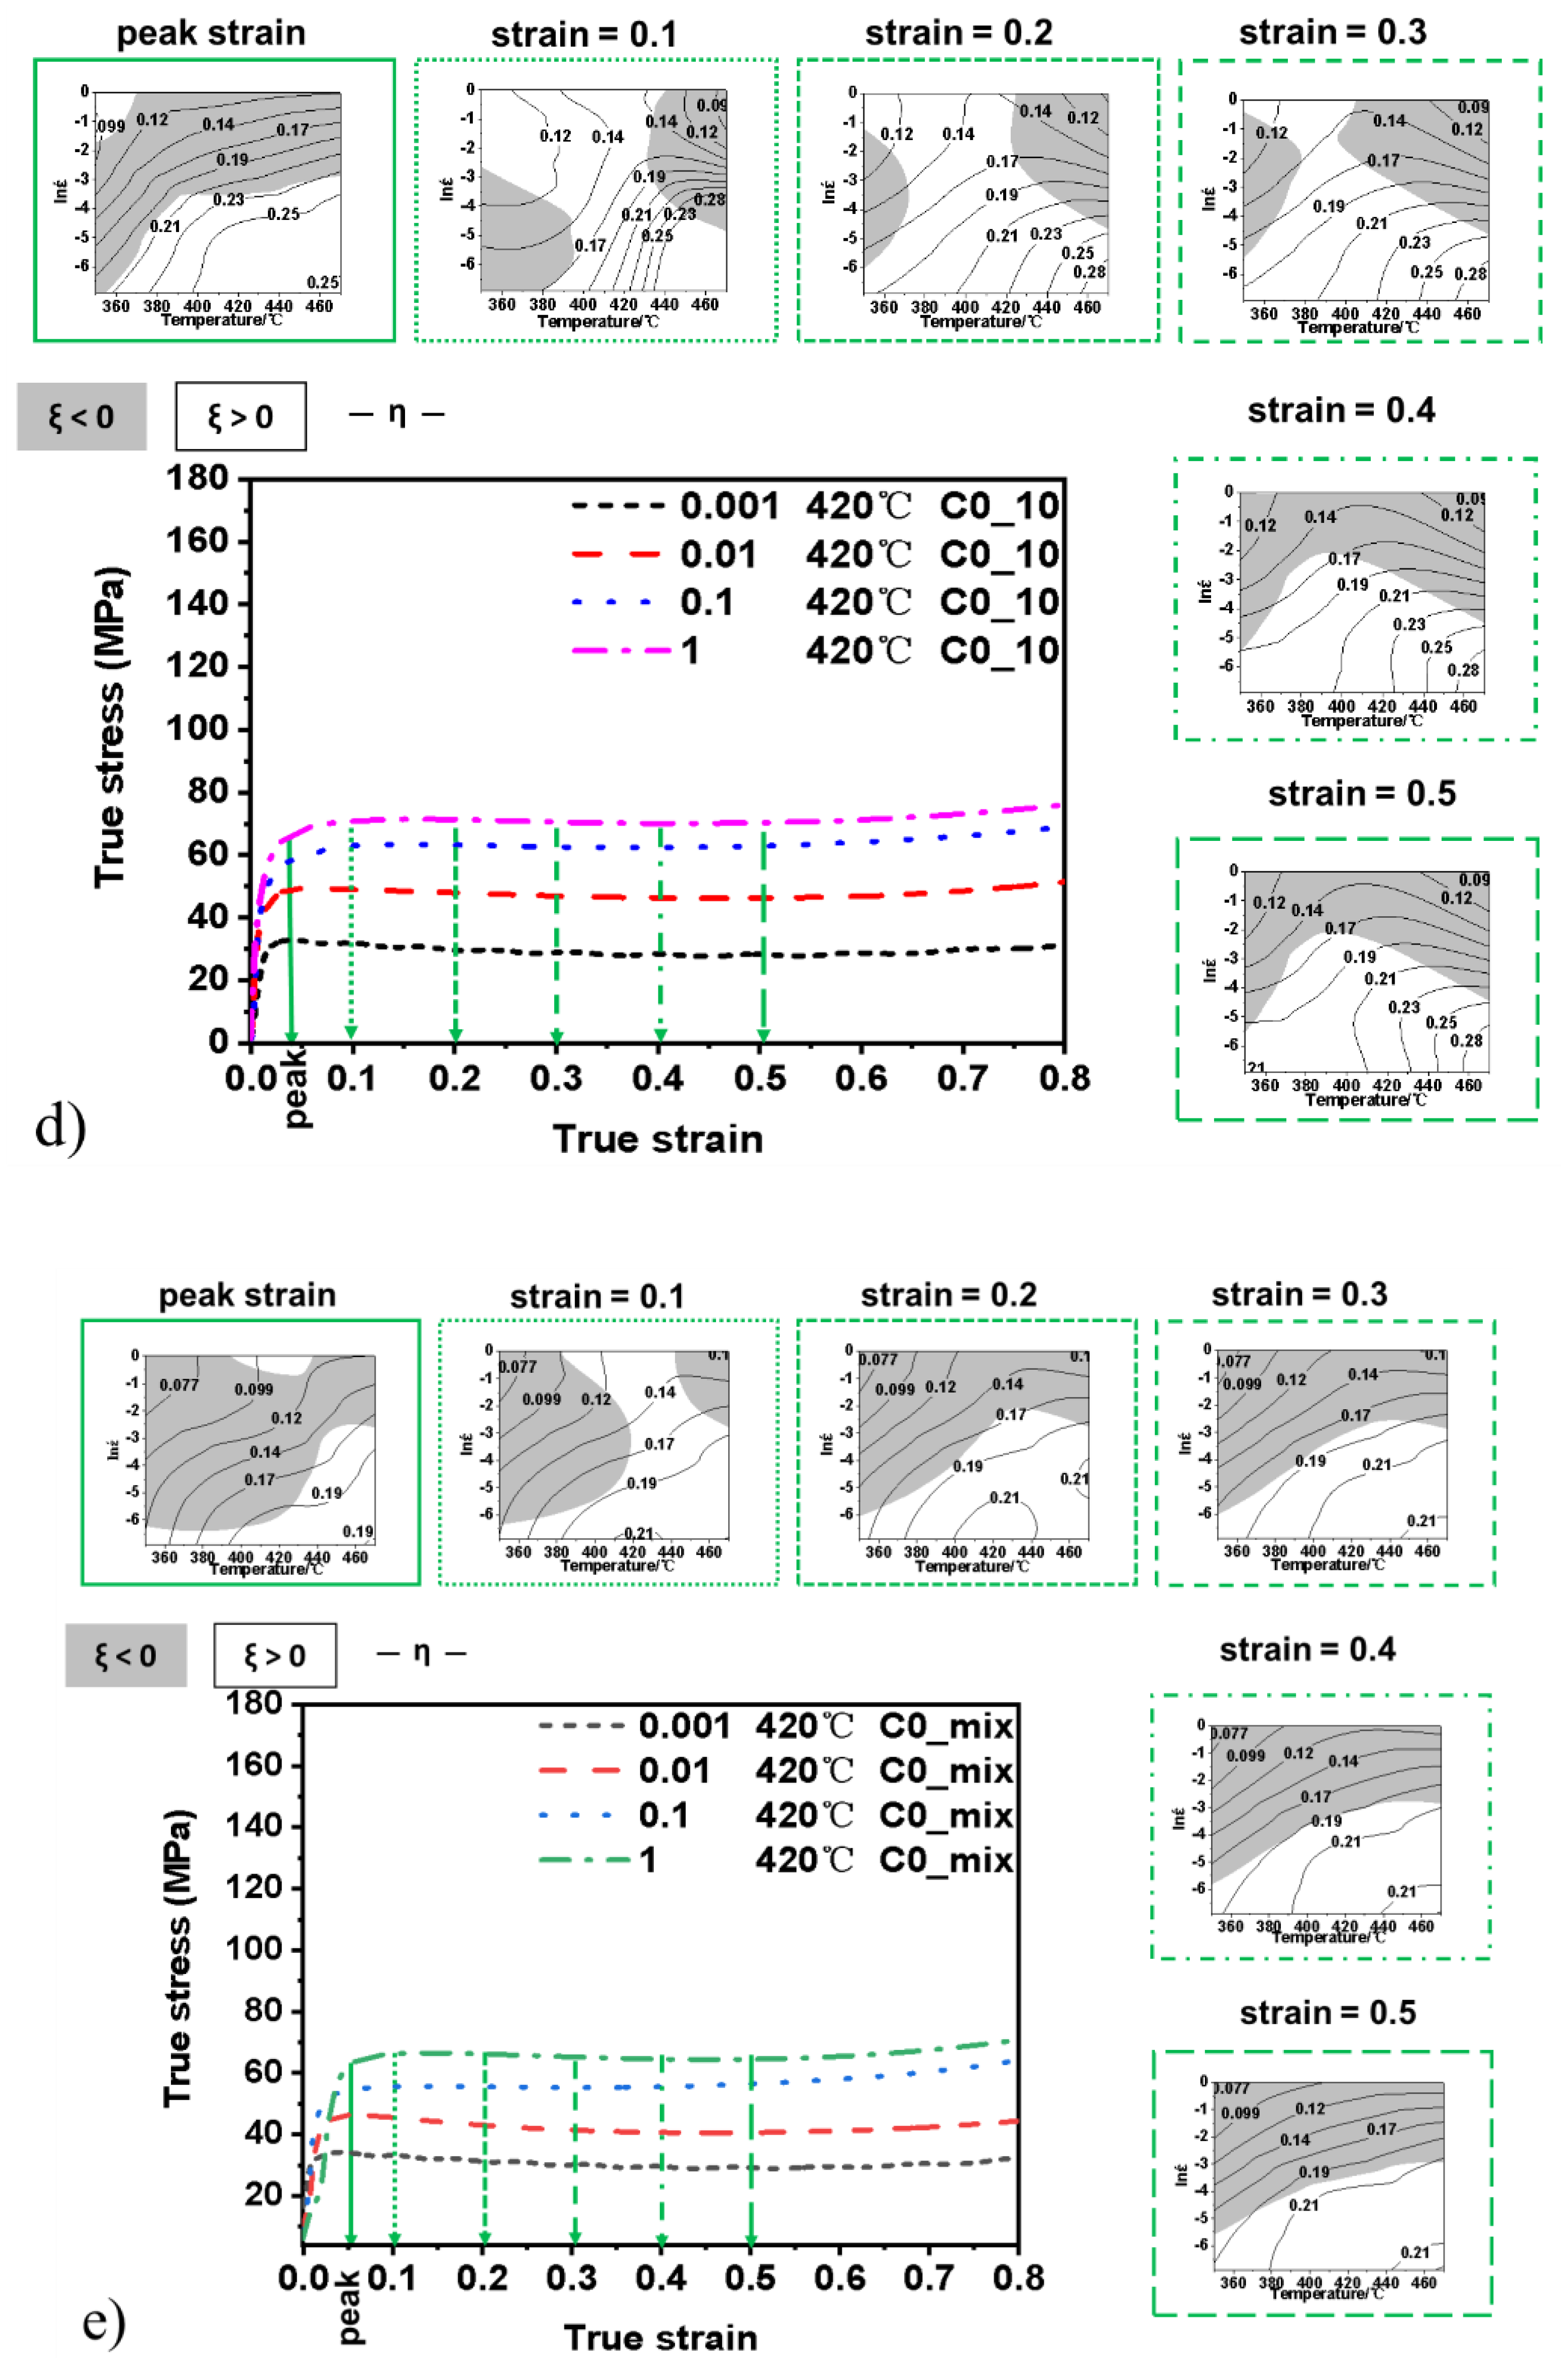
3.4. Processing Maps
4. Discussion
4.1. Strengthening Mechanisms
4.2. The Activation Energy
4.3. The Processing Maps
5. Conclusions
Author Contributions
Funding
Institutional Review Board Statement
Informed Consent Statement
Data Availability Statement
Acknowledgments
Conflicts of Interest
Nomenclature
| Letters and acronyms | |
| A [1/s] | material constant in the Zener–Hollomon model |
| b [m] | Burger’s vector |
| D [m2/s] | diffusion coefficient |
| d [m] | diameter |
| k = 1.381 × 10⁻²³ J/K | Boltzmann’s constant |
| f | fraction |
| G [GPa] | shear modulus |
| m | strain rate sensitivity exponent |
| n1 | material constant in the Zener–Hollomon model |
| n2 | material constant in the Zener–Hollomon model |
| QA [kJ/mol] | activation energy of plastic deformation |
| QD [kJ/mol] | activation energy of self-diffusion |
| r [m] | radius |
| R = 8.314 J/K·mol | the universal gas constant |
| T [K] | temperature |
| Greek letters | |
| α = β/n1 [1/MPa] | material constant in the Zener–Hollomon model |
| β [1/MPa] | material constant in the Zener–Hollomon model |
| ε | strain |
| [1/s] | strain rate |
| η | the efficiency of power dissipation |
| µ [Pa*s] | dynamic viscosity |
| ξ | instability criterion |
| σ [MPa] | stress |
| Δσ | strengthening contribution |
| Subscripts | |
| 0 | reference material |
| f | fibres |
| i, j | two arbitrary materials |
| int | intermetallic |
| θ | Al2Cu phase |
| LB | load bearing |
| MM | modulus mismatch |
| OS | Orowan strengthening |
| p | particles |
| SiC | silicon carbide |
| w | whiskers |
Appendix A. Experimental Procedure


Appendix B. Strengthening Mechanisms

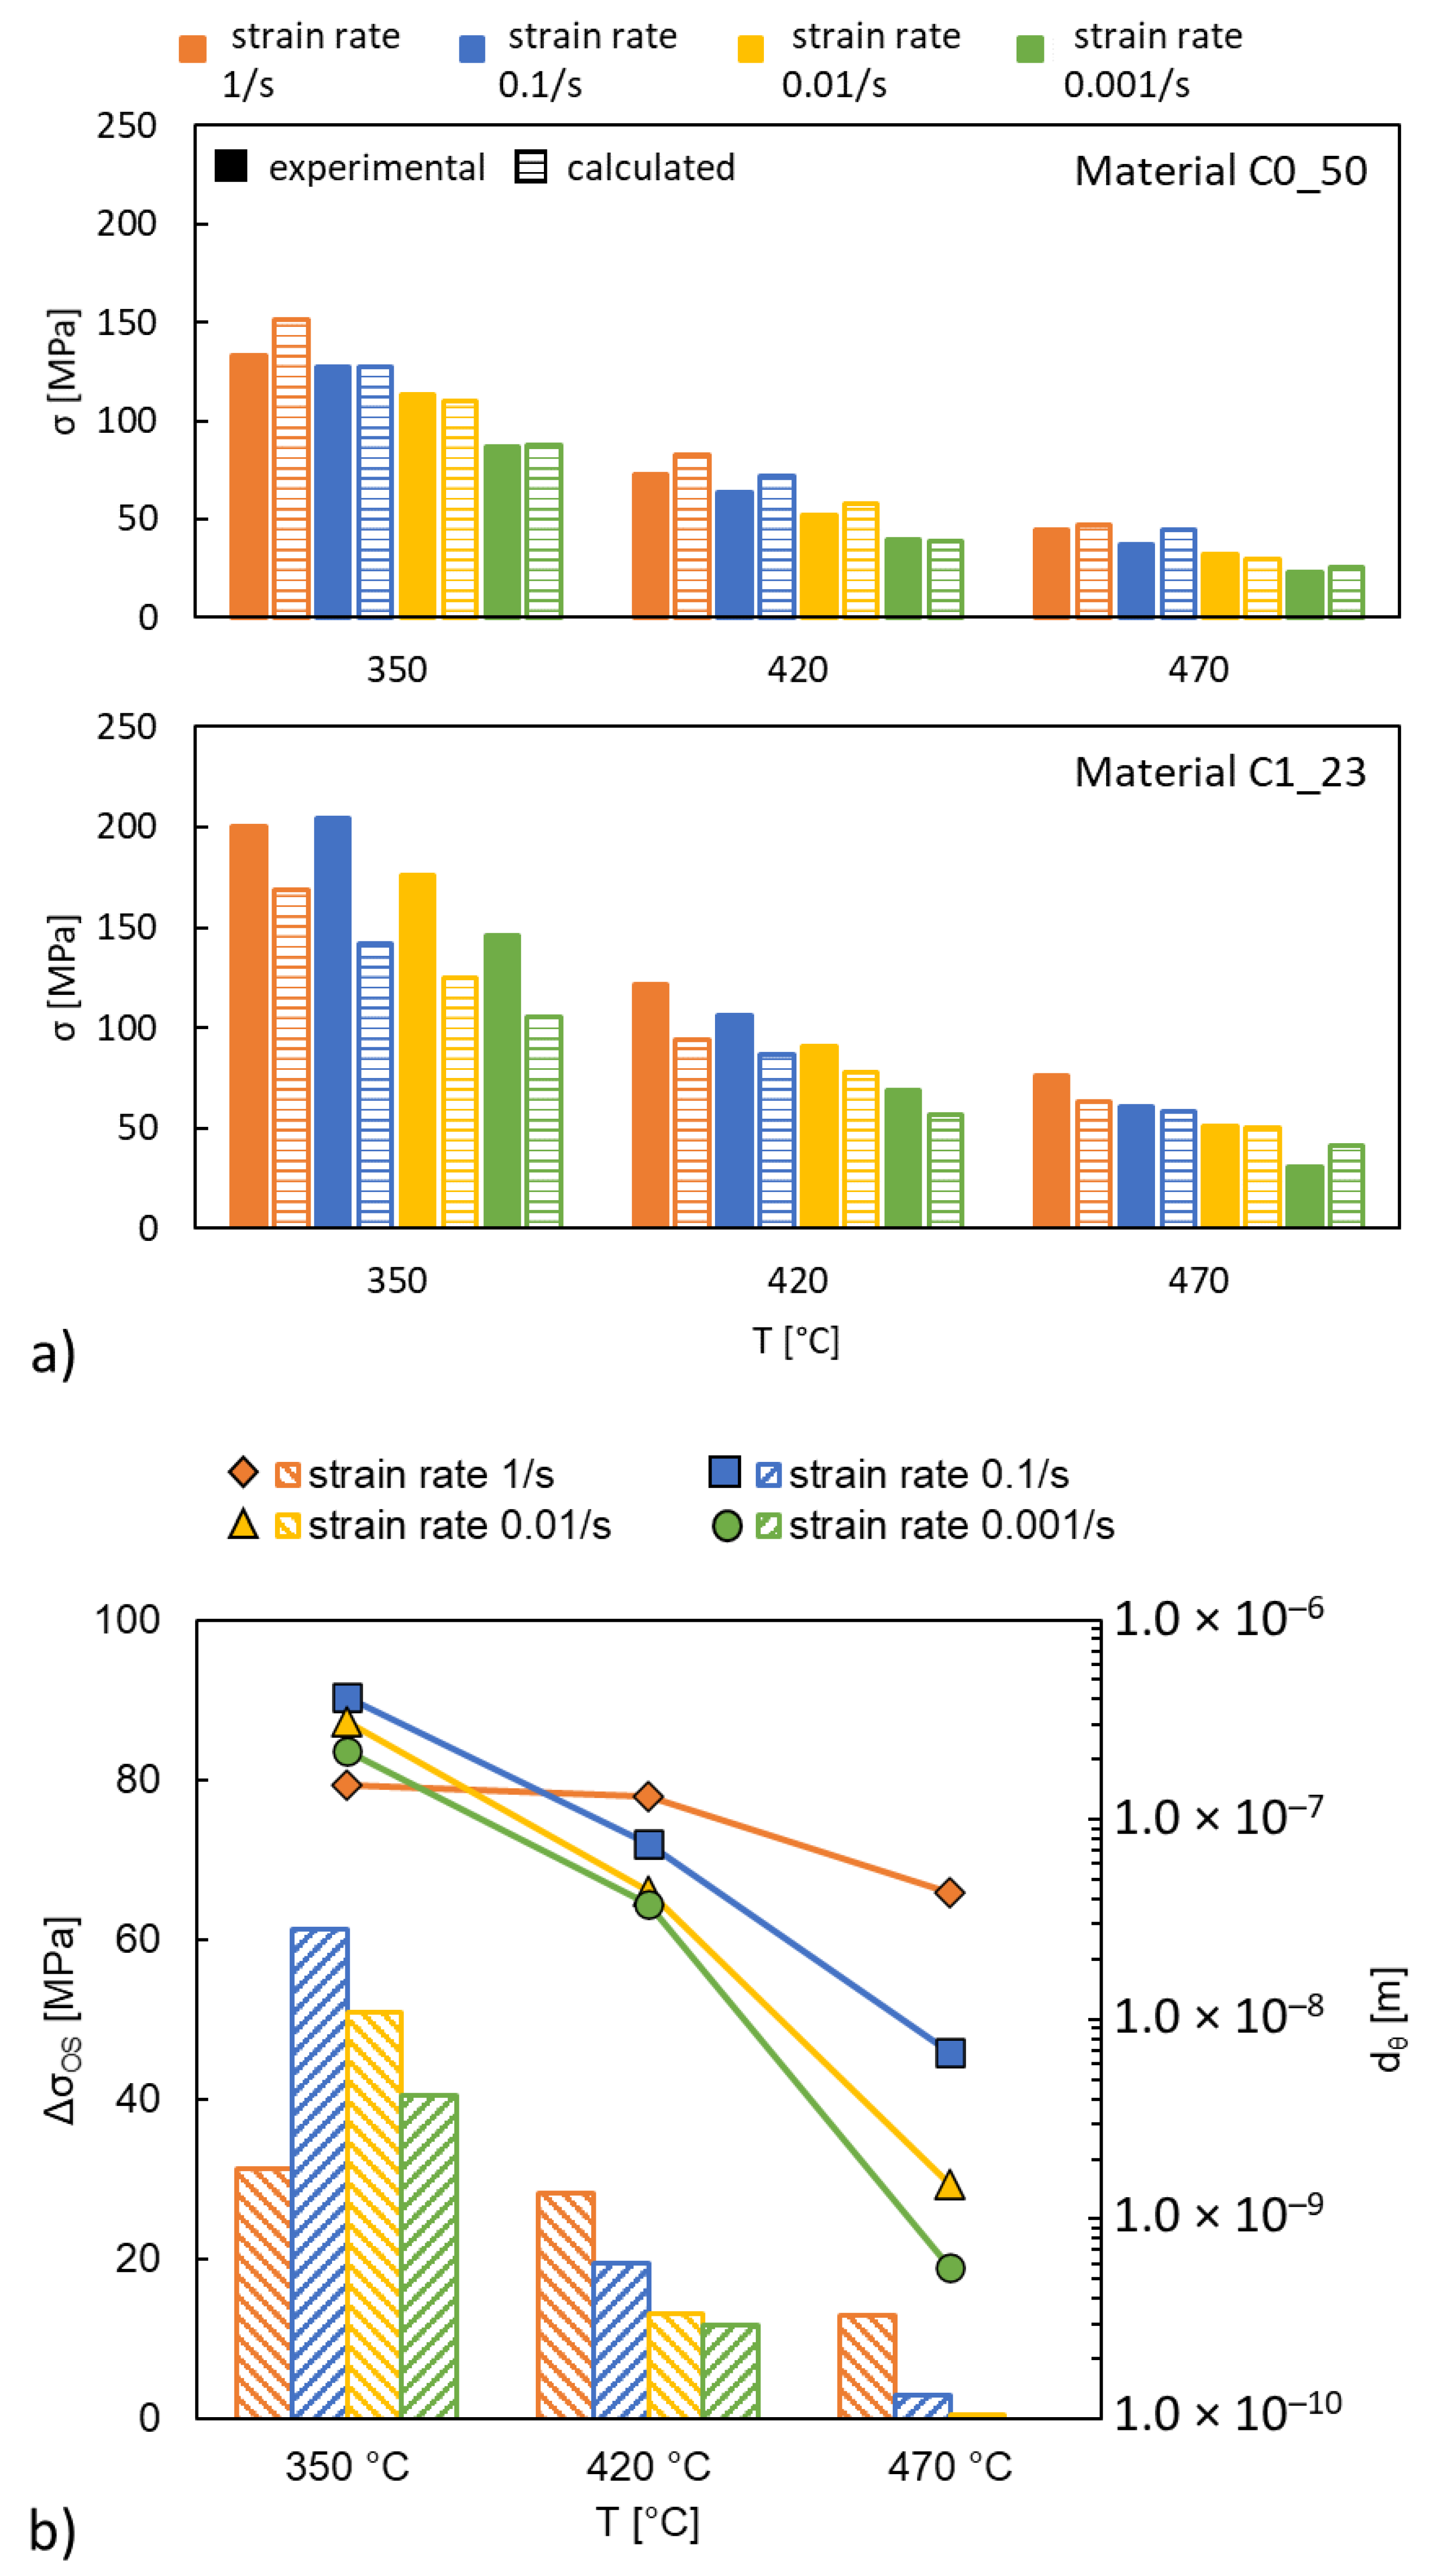
| Strength [MPa] | 1 | 0.1 | 0.01 | 0.001 | |||||
|---|---|---|---|---|---|---|---|---|---|
| Material | Temperature [°C] | Exp. | Calc. | Exp. | Calc. | Exp. | Calc. | Exp. | Calc. |
| C0_50 | 350 | 133 | 151 | 127 | 127 | 113 | 110 | 87 | 88 |
| 420 | 73 | 83 | 64 | 72 | 52 | 58 | 40 | 39 | |
| 470 | 45 | 47 | 37 | 45 | 32 | 30 | 23 | 26 | |
| C1_23 | 350 | 200 | 169 | 204 | 142 | 176 | 125 | 146 | 105 |
| 420 | 122 | 94 | 106 | 87 | 91 | 78 | 69 | 57 | |
| 470 | 76 | 63 | 61 | 58 | 51 | 50 | 31 | 41 | |
| 1 | 0.1 | 0.01 | 0.001 | |||||
|---|---|---|---|---|---|---|---|---|
| dθ [m] | ΔσOS [MPa] | dθ [m] | ΔσOS [MPa] | dθ [m] | ΔσOS [MPa] | dθ [m] | ΔσOS [MPa] | |
| 350 °C | 1.5 × 10⁻⁷ | 31.26 | 4.1 × 10⁻⁷ | 61.32 | 3.1 × 10⁻⁷ | 50.81 | 2.2 × 10⁻⁷ | 40.40 |
| 420 °C | 1.3 × 10⁻⁷ | 28.18 | 7.6 × 10⁻⁸ | 19.38 | 4.4 × 10⁻⁸ | 13.14 | 3.8 × 10⁻⁸ | 11.67 |
| 470 °C | 4.3 × 10⁻⁸ | 12.90 | 6.9 × 10⁻⁹ | 2.96 | 1.5 × 10⁻⁹ | 0.54 | 5.7 × 10⁻¹⁰ | 0.00 |
References
- International Energy Agency. Energy Technology Perspectives 2015, 2015th ed.; IEA Publications: Paris, France, 2015; ISBN 9789264233416. [Google Scholar]
- Serrenho, A.C.; Norman, J.B.; Allwood, J.M. The impact of reducing car weight on global emissions: The future fleet in Great Britain. Philos. Trans. R. Soc. A Math. Phys. Eng. Sci. 2017, 375, 20160364. [Google Scholar] [CrossRef] [PubMed] [Green Version]
- Yamagata, H.; Kurita, H.; Aniolek, M.; Kasprzak, W.; Sokolowski, J.H. Thermal and metallographic characteristics of the Al–20% Si high-pressure die-casting alloy for monolithic cylinder blocks. J. Mater. Process. Technol. 2008, 199, 84–90. [Google Scholar] [CrossRef]
- Das, D.K.; Mishra, P.C.; Singh, S.; Pattanaik, S. Fabrication and heat treatment of ceramic-reinforced aluminium matrix composites—A review. Int. J. Mech. Mater. Eng. 2014, 9, 6. [Google Scholar] [CrossRef] [Green Version]
- Mortensen, A.; Jin, I. Solidification processing of metal matrix composites. Int. Mater. Rev. 1992, 37, 101–128. [Google Scholar] [CrossRef]
- Ibrahim, I.A.; Mohamed, F.A.; Lavernia, E.J. Particulate reinforced metal matrix composites—A review. J. Mater. Sci. 1991, 26, 1137–1156. [Google Scholar] [CrossRef]
- Thomas, A.; Zervos, N.; Ekelund, A.; Awe, S.A. Simulation Study on the Thermomechanical Behaviour of Al-MMC Automotive Brake Discs. In Proceedings of the Eurobrake 2019, Dresden, Germany, 21–23 May 2019; pp. 1–12. [Google Scholar]
- Awe, S.A. Developing Material Requirements for Automotive Brake Disc. Mod. Concepts Mater. Sci. 2019, 2, 1–4. [Google Scholar] [CrossRef]
- D’Errico, F.; Casari, D.; Alemani, M.; Perricone, G.; Tosto, M. Industrial semisolid casting process for secondary aluminium alloys for decarbonising lightweight parts in automotive sector. MATEC Web Conf. 2020, 326, 06007. [Google Scholar] [CrossRef]
- Radha Krishnan, B.; Ramesh, M. Experimental Evaluation of Al-Zn-Al2O3 Composite on Piston Analysis by CAE Tools. Mech. Mech. Eng. 2019, 23, 212–217. [Google Scholar] [CrossRef] [Green Version]
- Stojanović, B. Application of aluminium hybrid composites in automotive industry. Teh. Vjesn. 2015, 22, 247–251. [Google Scholar] [CrossRef] [Green Version]
- Baisane, V.; Sable, Y.; Dhobe, M.; Sonawane, P. Recent development and challenges in processing of ceramics reinforced Al matrix composite through stir casting process: A Review. Int. J. Eng. Appl. Sci. IJEAS 2015, 2, 11–16. [Google Scholar]
- Mavhungu, S.T.; Akinlabi, E.T.; Onitiri, M.A.; Varachia, F.M. Aluminum Matrix Composites for Industrial Use: Advances and Trends. Procedia Manuf. 2017, 7, 178–182. [Google Scholar] [CrossRef]
- Rebba, B.; Ramanaiah, N. Evaluation of Mechanical Properties of Aluminium Alloy (Al-2024) Reinforced with Molybdenum Disulphide (MOS 2) Metal Matrix Composites. Procedia Mater. Sci. 2014, 6, 1161–1169. [Google Scholar] [CrossRef] [Green Version]
- Awe, S.A.; Thomas, A. The Prospects of Lightweight SICAlight Discs in the Emerging Disc Brake Requirements. In Proceedings of the Eurobrake 2021, Online, 17–21 May 2021; pp. 1–6. [Google Scholar]
- Peng, L.M.; Zhu, S.J.; Wang, F.G.; Chen, H.R. Creep behavior in an Al-Fe-V-Si alloy and SiC whisker-reinforced Al-Fe-V-Si composite. J. Mater. Sci. 1998, 3, 5643–5652. [Google Scholar] [CrossRef]
- Agrawal, E.; Tungikar, V. Wear performance of Al-TiC composite at elevated temperature. World J. Eng. 2022, 19, 346–351. [Google Scholar] [CrossRef]
- Xia, F.; Gao, X.S.; Liang, M.X.; Guo, Y.C.; Li, J.P.; Yang, Z.; Wang, J.L.; Zhang, L.L. Effect of thermal exposure on microstructure and high-temperature fatigue life of Al-Si piston alloys. J. Mater. Res. Technol. 2020, 9, 12926–12935. [Google Scholar] [CrossRef]
- Zhang, J.Y.; Zuo, L.J.; Feng, J.; Ye, B.; Kong, X.Y.; Jiang, H.Y.; Ding, W.J. Effect of thermal exposure on microstructure and mechanical properties of Al-Si-Cu-Ni-Mg alloy produced by different casting technologies. Trans. Nonferrous Met. Soc. China 2020, 30, 1717–1730. [Google Scholar] [CrossRef]
- Lattanzi, L.; Etienne, A.; Li, Z.; Manjunath, T.; Nixon, N.; Jarfors, A.E.W.; Awe, S.A. The influence of Ni and Zr additions on the hot compression properties of Al-SiCp composites. J. Alloys Compd. 2022, 905, 164160. [Google Scholar] [CrossRef]
- Du, A.; Jarfors, A.E.W.; Zheng, J.; Wang, K.; Yu, G. The influence of La and Ce on microstructure and mechanical properties of an Al-Si-Cu-Mg-Fe alloy at high temperature. Metals 2021, 11, 384. [Google Scholar] [CrossRef]
- Du, A.; Lattanzi, L.; Jarfors, A.W.E.; Zheng, J.; Wang, K.; Yu, G. On the hardness and elastic modulus of phases in sic-reinforced al composite: Role of la and ce addition. Materials 2021, 14, 6287. [Google Scholar] [CrossRef]
- Seetharaman, S.; Gupta, M. Fundamentals of Metal Matrix Composites. In Encyclopedia of Materials: Composites; Elsevier: Amsterdam, The Netherlands, 2021; pp. 11–29. ISBN 9780128197240. [Google Scholar]
- Rohatgi, P. Cast aluminum-matrix composites for automotive applications. JOM 1991, 43, 10–15. [Google Scholar] [CrossRef]
- Sun, W.; Duan, C.; Yin, W. Chip formation mechanism in machining of Al/SiCp composites based on analysis of particle damage. J. Manuf. Process. 2021, 64, 861–877. [Google Scholar] [CrossRef]
- Rezaei Ashtiani, H.R.; Parsa, M.H.; Bisadi, H. Constitutive equations for elevated temperature flow behavior of commercial purity aluminum. Mater. Sci. Eng. A 2012, 545, 61–67. [Google Scholar] [CrossRef]
- Hao, S.; Xie, J.; Wang, A.; Wang, W.; Li, J.; Sun, H. Hot deformation behaviors of 35%SiCp/2024Al metal matrix composites. Trans. Nonferrous Met. Soc. China 2014, 24, 2468–2474. [Google Scholar] [CrossRef]
- Patel, A.; Das, S.; Prasad, B.K. Compressive deformation behaviour of Al alloy (2014)-10wt.% SiCp composite: Effects of strain rates and temperatures. Mater. Sci. Eng. A 2011, 530, 225–232. [Google Scholar] [CrossRef]
- Prasad, Y.V.R.K.; Rao, K.P.; Sasidhara, S. Hot Working Guide, 2nd ed.; Prasad, Y.V.R.K., Rao, K.P., Sasidhara, S., Eds.; ASM International: Materials Park, OH, USA, 2015; ISBN 978-1-62708-091-0. [Google Scholar]
- Huang, Z.; Zhang, X.; Xiao, B.; Ma, Z. Hot deformation mechanisms and microstructure evolution of SiCp/2014Al composite. J. Alloys Compd. 2017, 722, 145–157. [Google Scholar] [CrossRef]
- Xiao, B.L.; Fan, J.Z.; Tian, X.F.; Zhang, W.Y.; Shi, L.K. Hot deformation and processing map of 15%SiCp/2009 Al composite. J. Mater. Sci. 2005, 40, 5757–5762. [Google Scholar] [CrossRef]
- Ramanathan, S.; Karthikeyan, R.; Ganasen, G. Development of processing maps for 2124Al/SiCp composites. Mater. Sci. Eng. A 2006, 441, 321–325. [Google Scholar] [CrossRef]
- Jarfors, A.E.W.; Du, A.; Yu, G.; Zheng, J.; Wang, K. On the sustainable choice of alloying elements for strength of aluminum-based alloys. Sustainability 2020, 12, 1059. [Google Scholar] [CrossRef] [Green Version]
- Laurent, V.; Chatain, D.; Eustathopoulos, N. Wettability of SiO2 and oxidized SiC by aluminium. Mater. Sci. Eng. A 1991, 135, 89–94. [Google Scholar] [CrossRef]
- Jonas, J.J.; Sellars, C.M.; Tegart, W.J.M.M. Strength and structure under hot-working conditions. Metall. Rev. 1969, 14, 1–24. [Google Scholar] [CrossRef]
- Prasad, Y.V.R.K.; Gegel, H.L.; Doraivelu, S.M.; Malas, J.C.; Morgan, J.T.; Lark, K.A.; Barker, D.R. Modeling of dynamic material behavior in hot deformation: Forging of Ti-6242. Metall. Trans. A 1984, 15, 1883–1892. [Google Scholar] [CrossRef]
- Ceschini, L.; Dahle, A.; Gupta, M.; Jarfors, A.E.W.; Jayalakshmi, S.; Morri, A.; Rotundo, F.; Toschi, S.; Singh, R.A. Aluminum and Magnesium Metal Matrix Nanocomposites; Engineering Materials; Springer: Singapore, 2017; ISBN 978-981-10-2680-5. [Google Scholar]
- Gladman, T. Precipitation hardening in metals. Mater. Sci. Technol. 1999, 15, 30–36. [Google Scholar] [CrossRef]
- Einstein, A. Über die von der molekularkinetischen Theorie der Wärme geforderte Bewegung von in ruhenden Flüssigkeiten suspendierten Teilchen. Ann. Phys. 1905, 322, 549–560. [Google Scholar] [CrossRef] [Green Version]
- Sutherland, W. LXXV. A dynamical theory of diffusion for non-electrolytes and the molecular mass of albumin. London Edinburgh Dublin Philos. Mag. J. Sci. 1905, 9, 781–785. [Google Scholar] [CrossRef] [Green Version]


| Matrix | Reinforcement | Applications | References |
|---|---|---|---|
| Al and Al alloys | Al2O3 | Piston rings, connecting rods | [10,11] |
| Al2O3-Cf | Engine blocks | [12,13] | |
| MoS2p | Drive shafts | [14] | |
| B2O3w | Piston rings | [12,13] | |
| SiCp | Brake rotors, pistons, propeller shafts | [15] | |
| SiCw | Connecting rods | [16] | |
| TiCp | Pistons, connecting rods | [17] |
| Matrix Alloy | Si | Cu | Ni | Fe | Mn | Ti | Mg | Ce | La | Al | Code Name | SiC Size [µm] |
|---|---|---|---|---|---|---|---|---|---|---|---|---|
| C0 | 10 | 0.2 | - | 0.1 | - | 0.1 | 0.8 | - | - | bal. | C0_23 | 23 |
| C0_50 | 50 | |||||||||||
| C0_10 | 10 | |||||||||||
| C0_mix | 23 + 50 + 10 1 | |||||||||||
| C1 | 10 | 1.9 | 1.9 | 0.1 | 0.8 | 0.3 | 0.8 | 1 | 1 | bal. | C1_23 | 23 |
| Material | SiC Fraction ± SD [wt.%] | SiC Size ± SD [µm] | 1NND ± SD [µm] | 2NND ± SD [µm] | 3NND ± SD [µm] |
|---|---|---|---|---|---|
| C0_23 | 14 ± 2.7% | 14 ± 0.9 | 14 ± 0.7 | 19 ± 1.1 | 24 ± 1.5 |
| C0_50 | 19 ± 2.1% | 32 ± 1.4 | 30 ± 2.5 | 41 ± 3.1 | 52 ± 3.3 |
| C1_23 | 14 ± 1.9% | 15 ± 1.1 | 16 ± 0.8 | 22 ± 1.2 | 28 ± 1.6 |
| C0_10 | 4 ± 1.6% | 12 ± 1.8 | 19 ± 4.7 | 32 ± 14.8 | 41 ± 17.1 |
| C0_mix | 12 ± 3.3% | 19 ± 1.5 | 18 ± 1.8 | 26 ± 2.7 | 33 ± 3.6 |
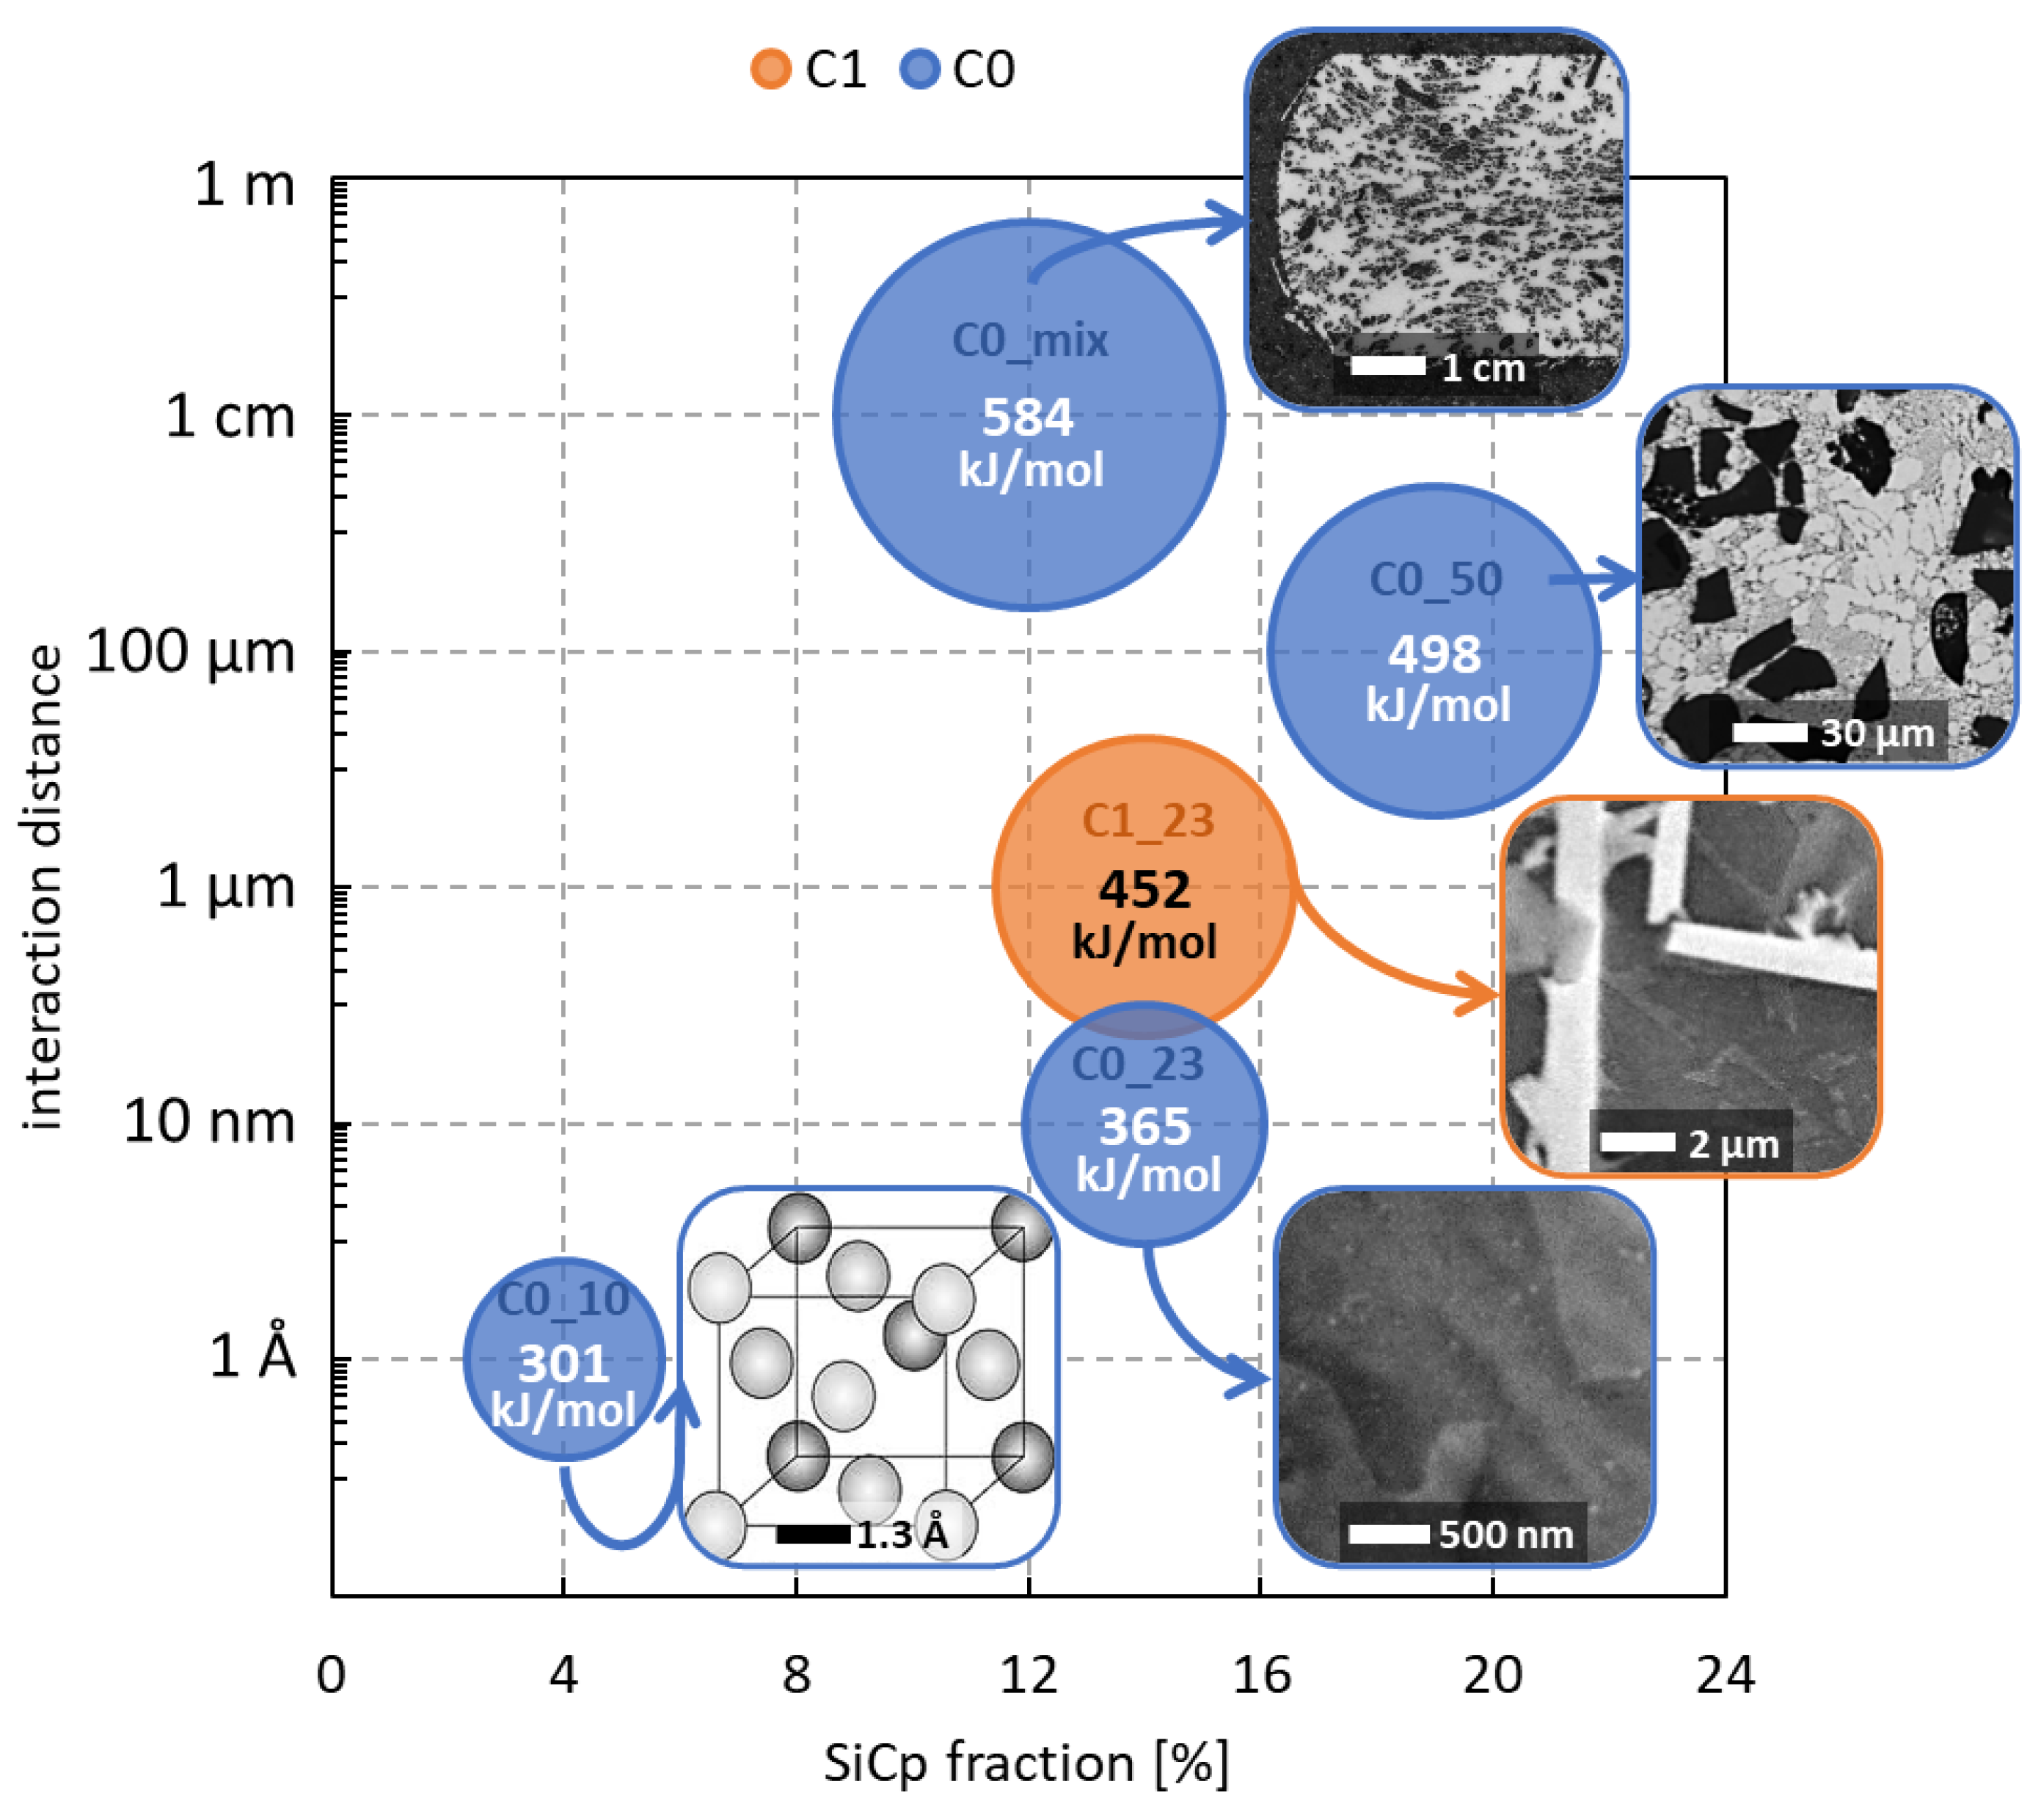
| Material | n1 | β [1/MPa] | α [1/MPa] | QA [kJ/mol] | n2 |
|---|---|---|---|---|---|
| C0_23 | 10.9 | 0.158 | 0.0145 | 365 | 7.63 |
| C0_50 | 12.2 | 0.224 | 0.0184 | 498 | 8.45 |
| C1_23 | 11.8 | 0.126 | 0.0107 | 452 | 8.10 |
| C0_10 | 8.62 | 0.146 | 0.0170 | 301 | 6.00 |
| C0_mix | 13.6 | 0.254 | 0.0187 | 584 | 9.07 |
| Strengthening Mechanism | Relation | Values |
|---|---|---|
| Matrix alloy | Equation (9) | CMM = 1.47 MPa·√m [21] |
| Load bearing [37] | Equation (10) | |
| Modulus mismatch [37] | Equation (11) | CMM = 1.47 MPa·√m [21] |
| Orowan [38] | Equation (12) | G = 41 GPa [22] b = 0.286 nm |
Publisher’s Note: MDPI stays neutral with regard to jurisdictional claims in published maps and institutional affiliations. |
© 2022 by the authors. Licensee MDPI, Basel, Switzerland. This article is an open access article distributed under the terms and conditions of the Creative Commons Attribution (CC BY) license (https://creativecommons.org/licenses/by/4.0/).
Share and Cite
Du, A.; Lattanzi, L.; Jarfors, A.E.W.; Zhou, J.; Zheng, J.; Wang, K.; Yu, G. The Influence of Ce, La, and SiC Particles Addition on the Formability of an Al-Si-Cu-Mg-Fe SiCp-MMC. Materials 2022, 15, 3789. https://0-doi-org.brum.beds.ac.uk/10.3390/ma15113789
Du A, Lattanzi L, Jarfors AEW, Zhou J, Zheng J, Wang K, Yu G. The Influence of Ce, La, and SiC Particles Addition on the Formability of an Al-Si-Cu-Mg-Fe SiCp-MMC. Materials. 2022; 15(11):3789. https://0-doi-org.brum.beds.ac.uk/10.3390/ma15113789
Chicago/Turabian StyleDu, Andong, Lucia Lattanzi, Anders E. W. Jarfors, Jie Zhou, Jinchuan Zheng, Kaikun Wang, and Gegang Yu. 2022. "The Influence of Ce, La, and SiC Particles Addition on the Formability of an Al-Si-Cu-Mg-Fe SiCp-MMC" Materials 15, no. 11: 3789. https://0-doi-org.brum.beds.ac.uk/10.3390/ma15113789