Article

Finite Element Analysis of the Mechanical Properties of Axially Compressed Square High-Strength Concrete-Filled Steel Tube Stub Columns Based on a Constitutive Model for High-Strength Materials

1
Hunan Tieyuan Civil Engineering Testing Co., Ltd., Changsha 410075, China
2
China Railway No. 3 Engineering Group Co., Ltd., Taiyuan 030001, China
3
School of Civil Engineering, Central South University, Changsha 410075, China
*
Author to whom correspondence should be addressed.
Submission received: 28 May 2022 / Revised: 14 June 2022 / Accepted: 15 June 2022 / Published: 18 June 2022
(This article belongs to the Special Issue Confined Concrete and Its Application in Structural Engineering)

Abstract

:
With the development of new concrete technology, high-strength concrete has been used worldwide. In particular, more economic benefits can be achieved by applying high-strength concrete-filled steel tube (HSCFST) columns in the concrete core walls of super high-rise buildings. A constitutive relation with high applicability for high-strength materials with different strength grades is proposed. Based on this constitutive model, a brick element model of 181 sets of axially compressed square HSCFST members is established and experimentally verified. The effects of the concrete strength, diameter-to-thickness ratio, and steel yield strength on the axial compressive capacities of these members were investigated based on finite element calculation results. The results showed that with an increase in the concrete strength, the ultimate bearing capacities of CS-CC, HS-HC, HS-CC, and CS-HC stub column members increased by 60%, 24%, 44%, and 21% at most, respectively. Additionally, as the steel yield strength increased, the ultimate bearing capacities of CS-CC, HS-HC, HS-CC, and CS-HC stub column members increased by 8.8%, 5.1%, 8.5%, and 5.2%, respectively, Hence, material strength has the greatest impact on CS-CC and HS-CC. The confinement effect of the square steel tube on the concrete weakens as the strength grade of steel or concrete increases. Notably, the confinement effect of steel tube on the concrete is strongest in CS-CC and weakest in the CS-HC. In addition, the confinement coefficients of square HSCFST stub columns with different combinations of concrete and steel strengths were analyzed. Based on the superposition principle in the ultimate state, a practical axial compressive capacity calculation formula for three types of square HSCFSTs is established. Compared with existing major design code formulas, the proposed formula is more accurate and concise and has a clear physical meaning.

1. Introduction

Due to their excellent structural properties, concrete-filled steel tube (CFST) columns have been widely applied in super high-rise buildings, urban bridges, long-span bridges, and engineering structures [1,2,3]. Compared with reinforced concrete columns, CFST columns have superior mechanical properties due to the interactions between the steel tube and the concrete. Specifically, in CFST columns, the three-dimensional compression of the concrete due to the confinement by the outer steel tube improves the compressive strength and deformation capacity of the concrete, and the lateral confinement of the concrete by the steel tube reduces the longitudinal stress of the steel tube in the ultimate state. Therefore, CFST columns have better flexural rigidity [4,5], bearing capacity [6], and seismic performance [7]. In addition, CFST columns have better fire [8] and corrosion resistance [9] due to the mutual protective effects of the steel tube and concrete. In practical engineering applications, the use of a CFST structure can significantly reduce the cross-sectional dimension of the columns, thereby reducing the material consumption by more than 50% [10]. CFST structures are easy to manufacture and weld on site and are convenient for concrete pouring with no need for formwork support [11].
In recent years, with the continuous development of materials technology, high-strength materials, such as high-strength steel (HSS), high-strength concrete (HSC), and ultrahigh-strength concrete (UHSC), have been gradually applied to engineering structures. HSS usually refers to steel with a nominal yield stress equal to or greater than 460 MPa [12]. Compared with normal-strength steel, HSS has the advantages of lower construction cost and greater environmental friendliness [13]. In addition, HSS is more suitable for lightweight, high-performance high-rise buildings and long-span structures due to its excellent strength-to-weight ratio, corrosion resistance, and welding performance. However, the application of HSS in practical engineering applications is limited due to the strict restrictions on steel strength grades and imperfect bearing capacity calculation formulas. Range and classification of HSC and UHSC have already been given by Sojobi et al. [14]. HSC has a compressive strength between 50 MPa and 90 MPa, and UHSC has a compressive strength of greater than 90 MPa. Although HSC and UHSC have far greater compressive strengths than normal-strength concrete, their higher brittleness and weaker ductility are not conducive to earthquake resistance and limit their applications in conventional concrete structures [15]. Despite the various restrictions in the application of high-strength materials, UHSC CFST column structures have been applied in the Abeno Harukas building in Osaka, the Star City complex in Sydney, and the Obayashi Technical Research Institute in Tokyo. These UHSC CFST column structures occupied less floor area due to their small cross-sectional areas, which resulted in an increased usable area and more economic benefits. Hence, HSCFST column structures have high research value and promising application prospects.
The steel tube has a lower confinement effect on the concrete, bearing capacity, and ductility in a square CFST column than in a circular CFST column, but square CFST columns are easy to connect and have large cross-sectional moments of inertia, high stability, and good adaptability in terms of earthquake and fire protection measures [16,17]. Researchers have carried out experimental, numerical, and finite element analysis studies on the mechanical properties and practical applications of square HSCFST columns. Yan et al. [18] conducted axial load tests on 32 square UHSC CFST stub columns. Their results showed that the confinement coefficient had a significant effect on the axial load–deformation curves of the specimens and that when the confinement coefficient was between 1.41 and 5.27, the specimens had good ductility. Lai [19] collected 124 sets of axial compression test data of HSCFSTs and compared them with the design method provided by the American Institute of Steel Construction (AISC) specification. Cai and Young [20] experimentally analyzed 26 square CFST stub columns (concrete strength: 34.9 MPa ≤ fc ≤ 112.7 MPa, steel strength: 629 MPa ≤ fs ≤ 1022 MPa) and conducted extensive numerical analyses on the confinement effect, material, geometry, and contact method. They also evaluated the applicability of the design codes for the compressive strengths of square and rectangular stub columns based on the test results and numerical calculation results. Existing studies have found that the interactions between the steel tube and concrete are related to the strength of the two materials. Therefore, it is necessary to propose formulas for calculating the confinement coefficient and the corresponding bearing capacity that take into account the effect of different material combinations based on the study of the HSCFST stub columns.
In this paper, three types of square HSCFSTs, namely, HSS tubes filled with normal-strength concrete (denoted as HS-CC hereinafter), HSS tubes filled with HSC (denoted as HS-HC hereinafter), and normal-strength steel tubes filled with HSC (denoted as CS-HC hereinafter) are used as the study object. The confinement coefficient of square HSCFST stub columns and a calculation formula for their axial compressive capacity are proposed based on the uniaxial constitutive relation of HSS and concrete proposed by Ding et al. [21] as well as theoretical derivation, numerical simulation, and statistical analysis. The main steps are as follows: A test database (yield strength: 235–960 MPa, compressive strength of concrete: 30–185 MPa) was constructed by collecting the published axial compression test data of square HSCFST stub columns to verify the unified constitutive relation of steel and concrete with different strength grades. The three types of square HSCFSTs with different strength grades were analyzed to find the variation patterns of their confinement effects and the differences in their confinement efficiencies, such as the steel tube yield strength, the concrete strength grade, and the width-to-thickness ratio (steel content). Based on the results of the finite element analysis and static equilibrium theory, the confinement coefficients of the three types of square HSCFSTs were established and the practical bearing capacity calculation formula for the axially compressed square HSCFST stub columns is proposed.

2. Introduction to the Constitutive Relation of the Materials

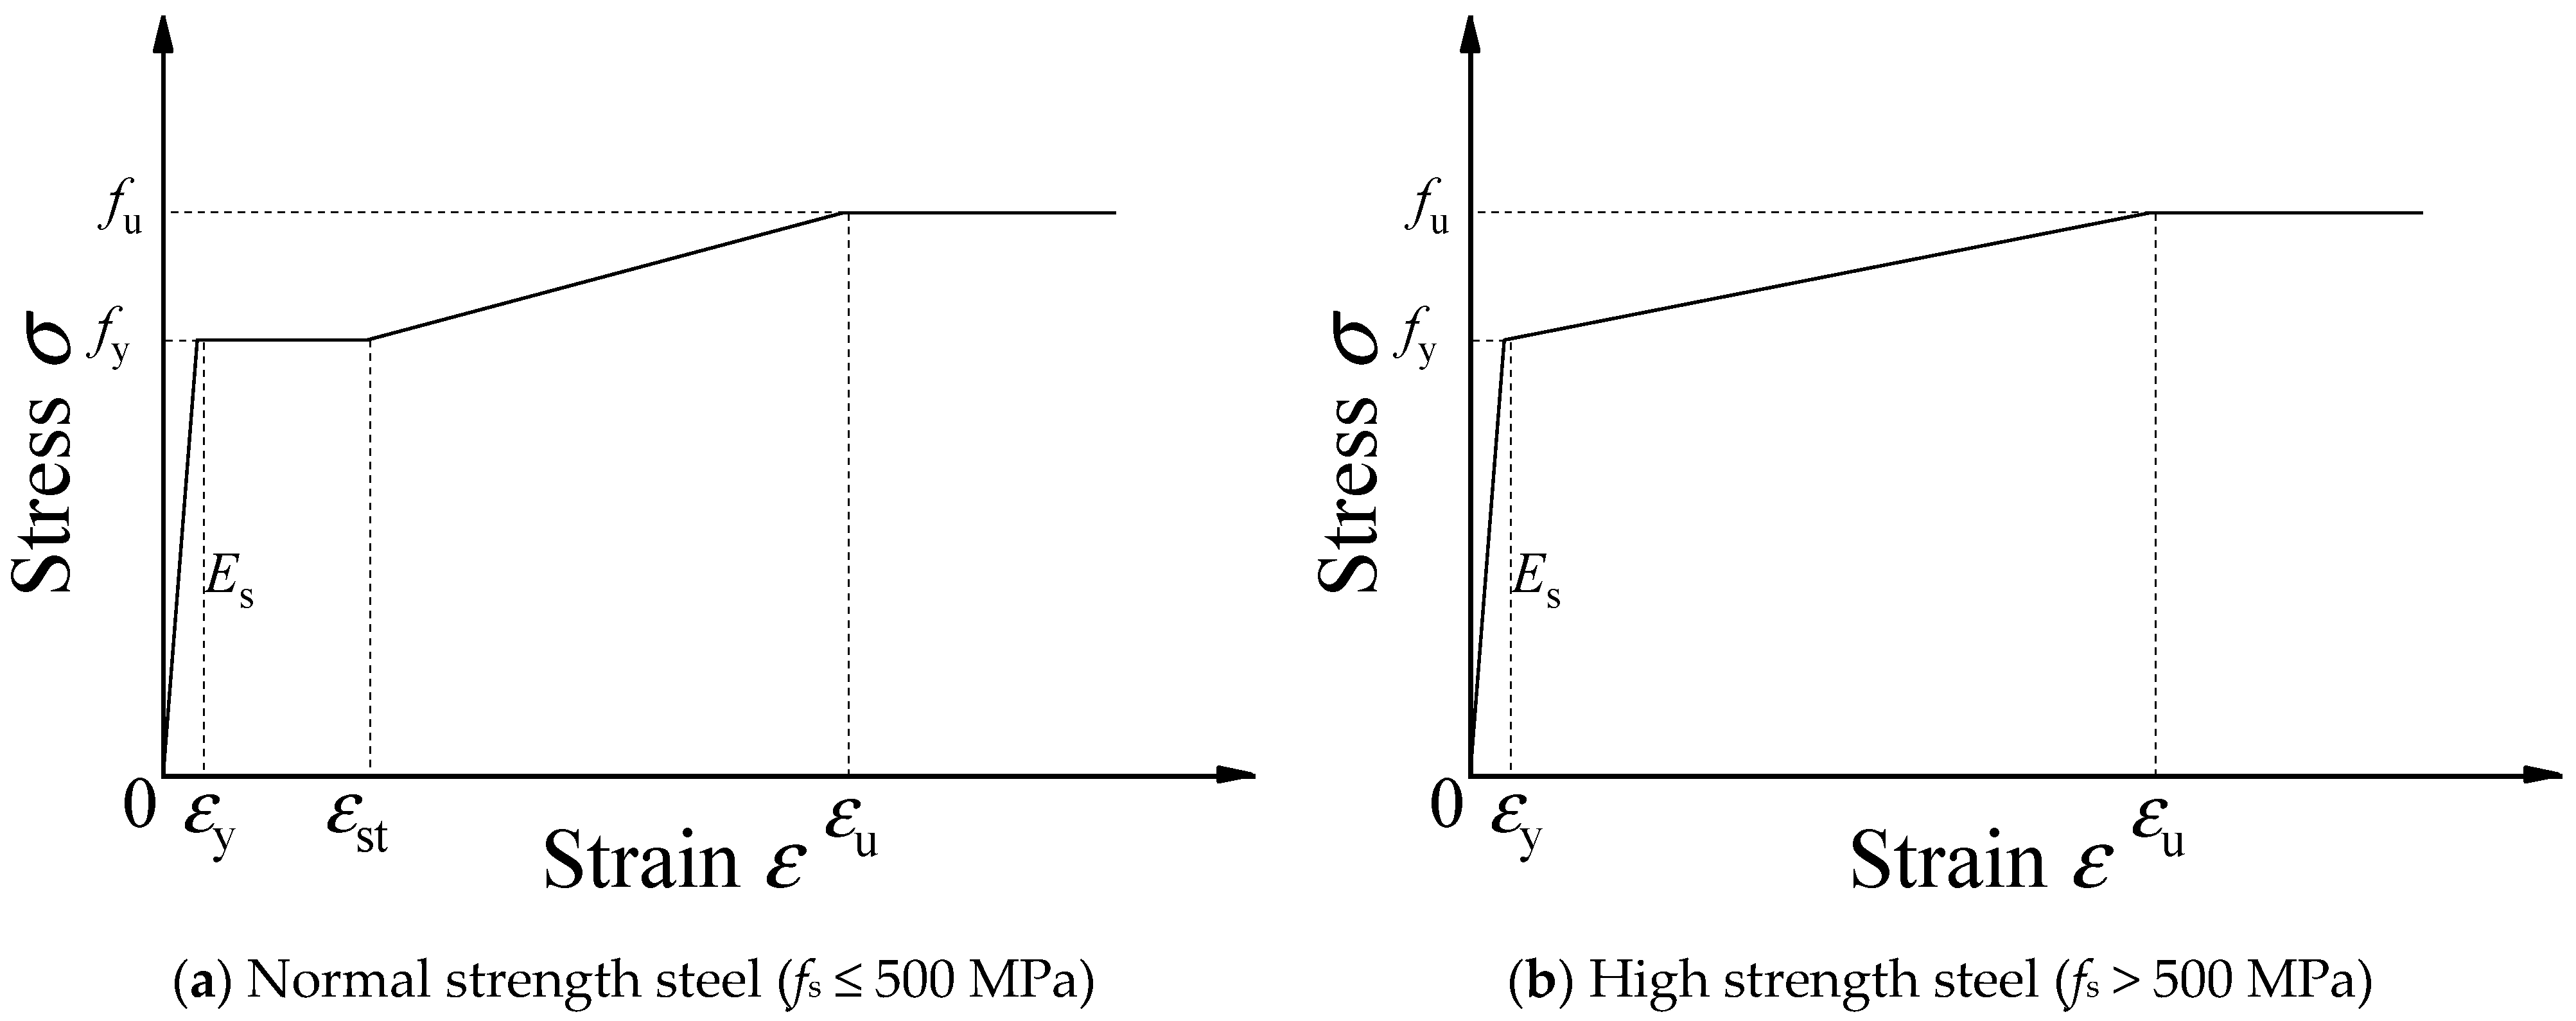
2.1. Stress–Strain Relation for Steel

The uniaxial tensile stress–strain relation for steel proposed by Ding et al. [22] can be expressed as follows:
σ = { E s ε ε ε y f s ε y < ε ε st f s + E st ( ε ε st ) ε st < ε ε u f u ε > ε u
where σ is the stress, Es is the elastic modulus (Es = 200 GPa), fs is the yield strength, fu is the ultimate strength, εy is the yield strain, εst is the strain corresponding to the end of the yield plateau, εu is the ultimate strength, and Est is the hardening modulus. Then, assuming that the stress of the steel remains constant as the strain increases, the stress–strain relation of the steel is shown in Figure 1. For HSS with no evident yield plateau, εst = εy, as shown in Figure 1b.
The literature suggests that the εst of hot-rolled steel with a clear yield plateau should be 0.02 and that the fu and εu of hot-rolled steel with different strength grades are expressed as follows:
f u 235 = 0.86 f y 235 + 0.72
ε u ε u , 235 = 1 1 + 0.15 ( f y / 235 1 ) 1.85
where εu,235 is the ultimate strength of Q235 carbon steel, where Q represents the yield limit of this material, and 235 refers to the yield stress being approximately 235 MPa.
Under axial compression, a CFST column is in a three-dimensional stress state due to the interactions between the steel tube and the core concrete. The equivalent stress σi and the equivalent strain εi are expressed as follows:
σ i = 1 2 [ ( σ 1 σ 2 ) 2 + ( σ 1 σ 3 ) 2 + ( σ 2 σ 3 ) 2 ]
ε i = 1 2 ( 1 + v s ) 2 [ ( ε 1 ε 2 ) 2 + ( ε 1 ε 3 ) 2 + ( ε 2 ε 3 ) 2 ]
where σ1, σ2, and σ3 and ε1, ε2, and ε3 are the principal stresses and strains, respectively, of the outer steel tube and vs. is the Poisson’s ratio of the steel tube, which is defined as follows:
v s = { 0.285 ε i 0.8 ε y 1.075 ( σ i / f y - 0.8 ) + 0.285 0.8 ε y < ε i ε y 0.5 ε i > ε y

2.2. Uniaxial Stress–Strain Curve of the Core Concrete

A unified constitutive relation applicable to concrete with different strength grades has been previously proposed [22]. The stress–strain relation of the core concrete in a CFST column can be expressed as follows:
y = { A i x + ( B i 1 ) x 2 1 + ( A i 2 ) x + B i x 2 x 1 x α i ( x 1 ) 2 + x x > 1
In the formula, the physical meaning of parameter Ai is the ratio of the elastic modulus to the peak secant modulus of the concrete, and Bi is a parameter that controls the degree of attenuation of the elastic modulus of the ascending segment of the stress–strain curve.
When concrete is subjected to uniaxial compression, y = σ/fc and x = ε/εc in Equation (7), where σ is the stress in MPa, fc is the axial compressive strength, fc = 0.4 fcu7/6, ε is the strain, εc is the peak compressive strain, and εc = 420 fcu7/18 × 10−6. At this time, i = 1, and A1 and B1 are the parameters of the ascending segment (A1 = 6.9 fcu−11/30, B1 = 1.67(A1 − 1)2), and α1 is a parameter of the descending segment (α1 = 4 × 10⁻³ fcu1.5 considering that the parameter of the descending segment is relatively low due to the high brittleness of concrete with a cube compressive strength exceeding 60 MPa).
To achieve the proposed stress–strain relation in the finite element model analysis, the Poisson’s ratio of the core concrete was defined as 0.2. The elastic modulus of concrete with different strengths is expressed as follows:
E c = 9500 f cu 1 / 3

3. Finite Element Theoretical Analysis

Due to the limitations of experimental conditions and material properties, the large amount of collected HSCFST test data still cannot cover the parameter matching required for the study. Therefore, it is necessary to use the ABAQUS finite element calculation software for calculation and analysis. The interactions between the steel tube and core concrete can be rationally analyzed by adopting suitable element types and meshing, material properties (constitutive model), steel tube–concrete interface simulation, loading method, and boundary conditions.

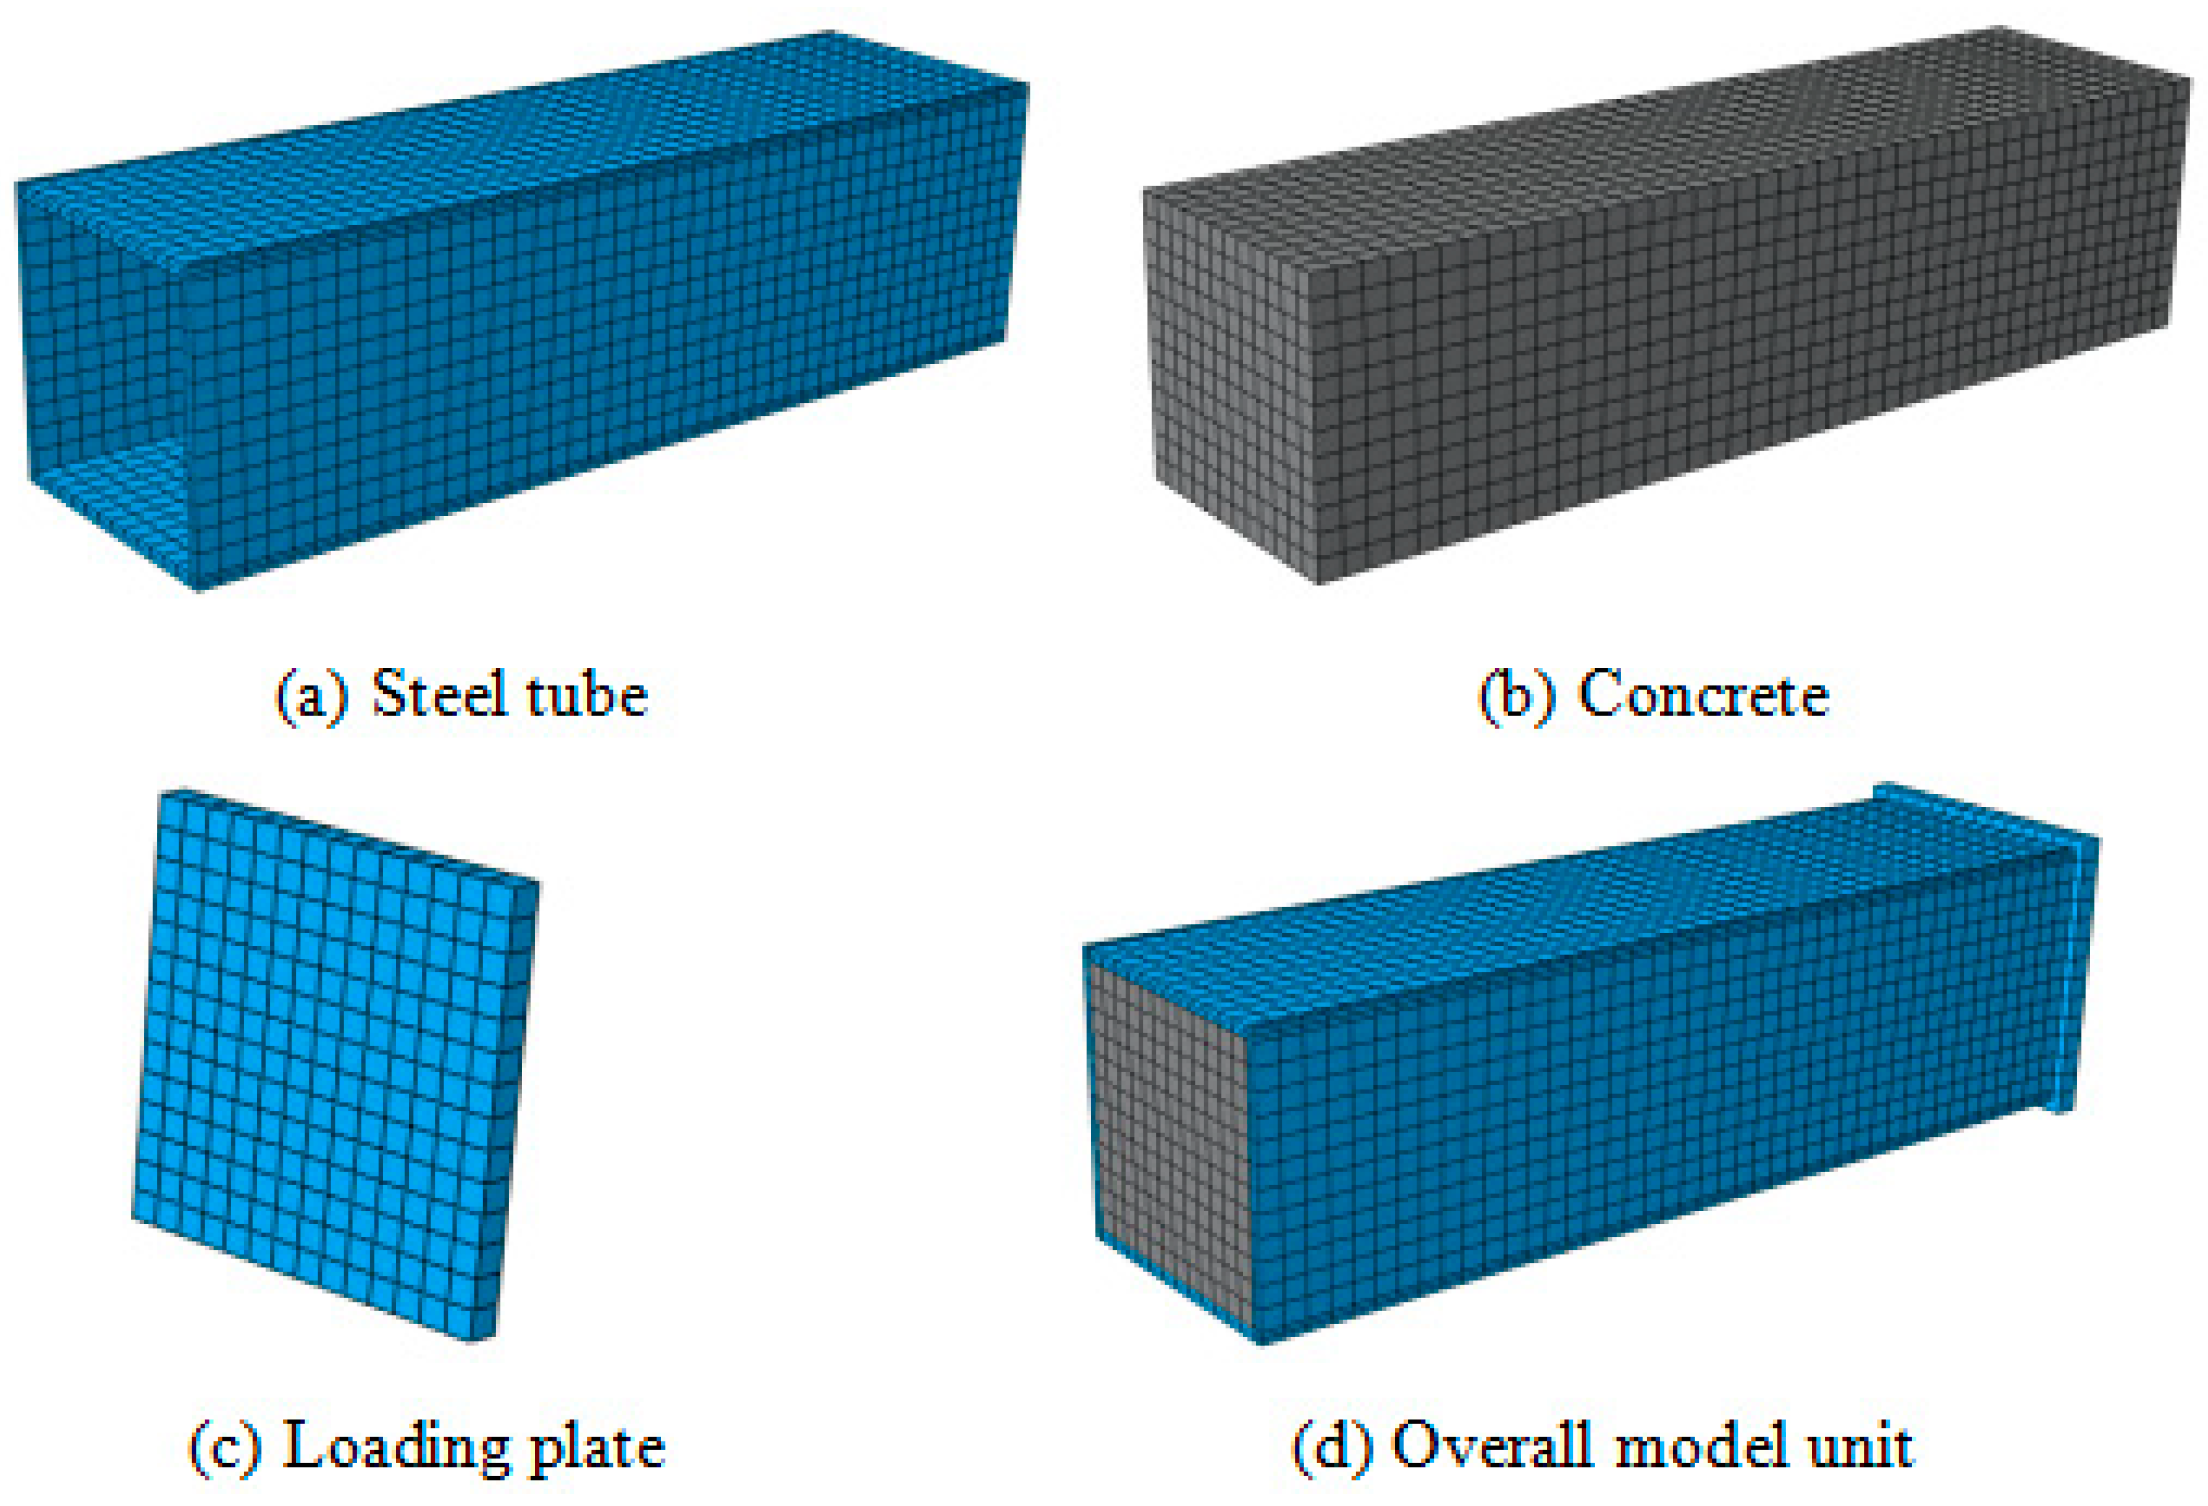
3.1. Element Type and Meshing

Both the outer steel tube and the core concrete are analyzed using refined modeling with three-dimensional eight-node brick elements (C3D8R), and each node has three translational degrees of freedom. In the study of mesh convergence, the optimal finite element mesh is determined to provide a relatively accurate solution at a relatively low computation cost. Hassanein [23] noted that mesh refinement has little effect on the numerical results and confirmed that its effect on the Nε curve was negligible by testing the mesh convergence of the model with a coarse mesh. Therefore, the axial element size is selected to be 2.5 times the lateral element size. Based on the study of mesh convergence, the cross-sectional element size of the square column is set at B/10, where B is the width of the square steel tube, as shown in Figure 2.

3.2. Material Constitutive Model

The material constitutive model for compressed steel and concrete with different strength grades is proposed based on Section 2. The Poisson’s ratio of the elastic part of concrete under uniaxial compressive stress ranges from 0.15 to 0.22, and the representative values of Poisson’s ratio of concrete are 0.19 to 0.2 in the American Society of Civil Engineers (ASCE) Standards and 0.2 in the National Standards of China. Hence, the Poisson’s ratio (νc) of concrete is set to 0.2 in the numerical simulation. The flow potential eccentricity e, the viscosity coefficient α, K, and fcc/fc are set at 0.1, 0.0005, 2/3, and 2/3, respectively. When the concrete strength is less than 100 MPa, the dilation angle is set to 40°, and when the concrete strength is greater than 100 MPa, the dilation angle is set to 30°. These parameter settings have been widely applied in finite element numerical simulations [24,25,26].

3.3. Interface Simulation

The interactions between the steel tube and concrete are usually simulated by the surface-to-surface contact technique. A contact surface pair composed of the inner surface of the steel tube and the outer surface of the core concrete is defined. A hard contact mode is set at the interface in the normal direction. This mode allows the interface to separate after stretching and disallows penetration after compression. The tangential contact can be simulated using the Coulomb friction model, with a friction coefficient of 0.5. There is almost no relative slip between the steel tube and the concrete of a stub column since they bear the load together. A rigid body loading plate with an elastic modulus of 1 × 10¹² MPa and a Poisson’s ratio of 1 × 10⁻⁷ is set at the top of the column. The contact between the loading plate and the column is taken as a tie connection, with high stiffness and good convergence. Therefore, the loading surface is taken as the master surface, and the column surface contacting the loading surface is the slave surface.

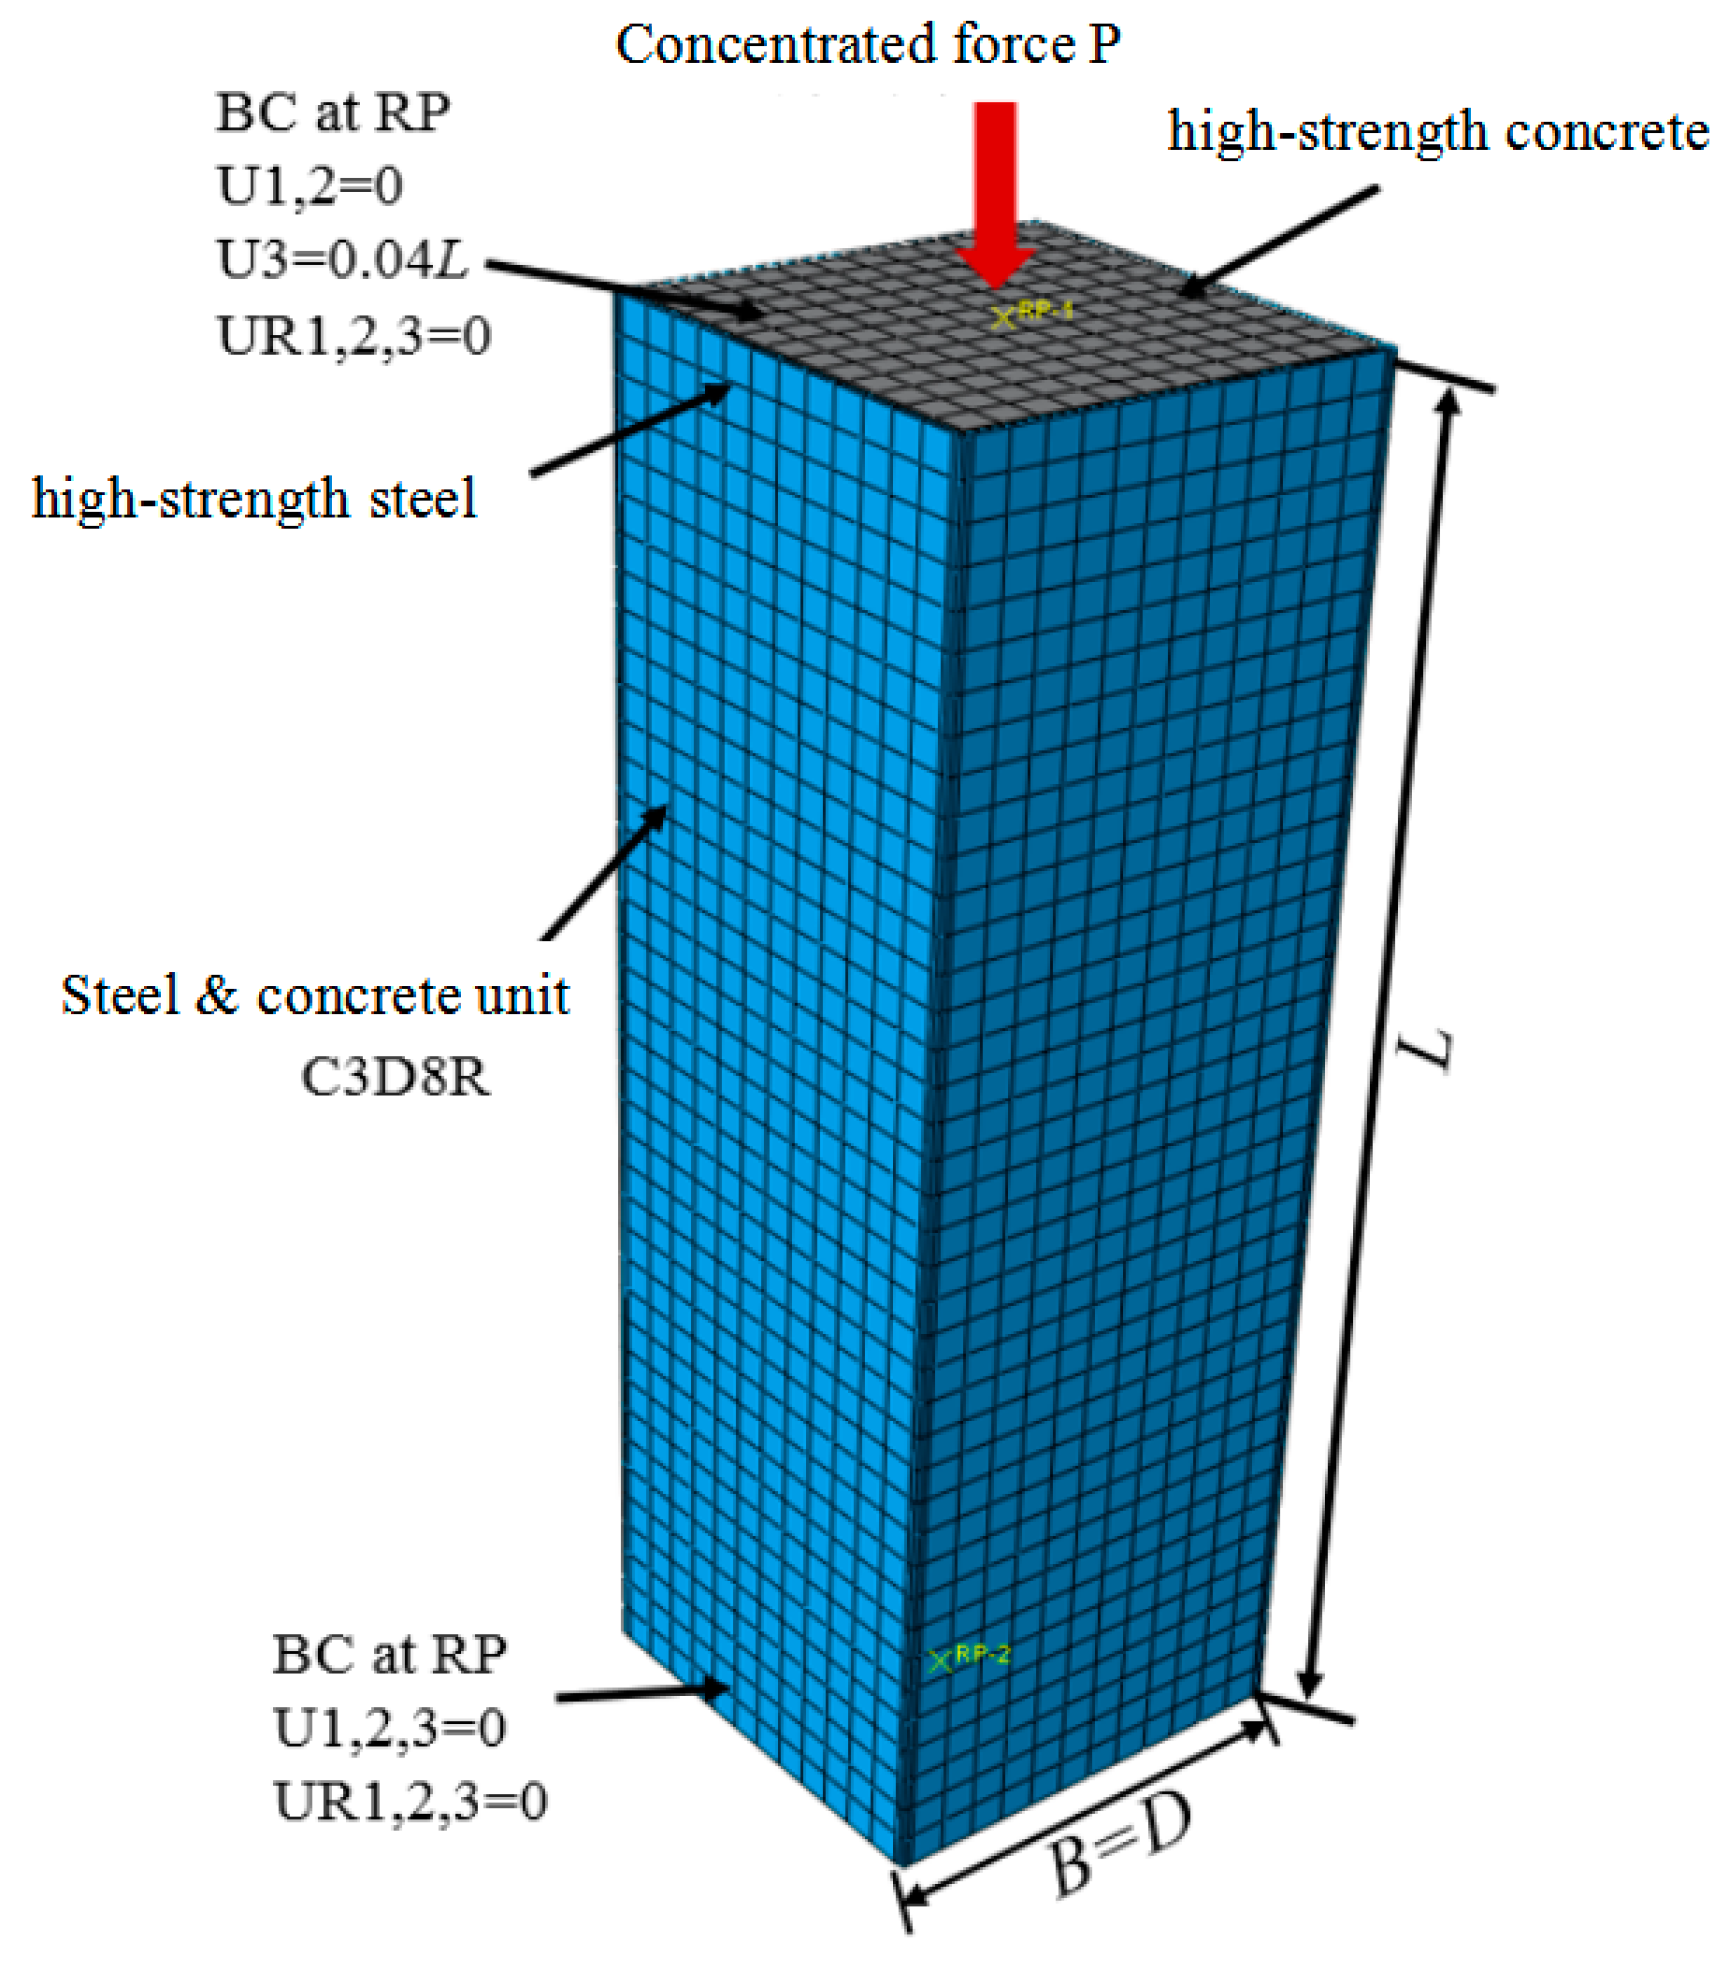
3.4. Boundary Conditions and Loading Methods

The bottom surface of the CFST column member has a fixed boundary condition, the top surface of the member has a free boundary, and only the displacement of the loading end in the loading direction is allowed. A static uniform load is proportionally applied in several load increments in displacement control mode on the top of the loading plate using the improved Riks method in the ABAQUS library. Equilibrium iteration is performed at each load increment, and the equilibrium path is tracked in the load–displacement space. This method is a strong nonlinear analysis method often used in static analysis. Nonlinear geometric parameters are introduced to handle large displacement analysis. The finite element model is shown in Figure 3.

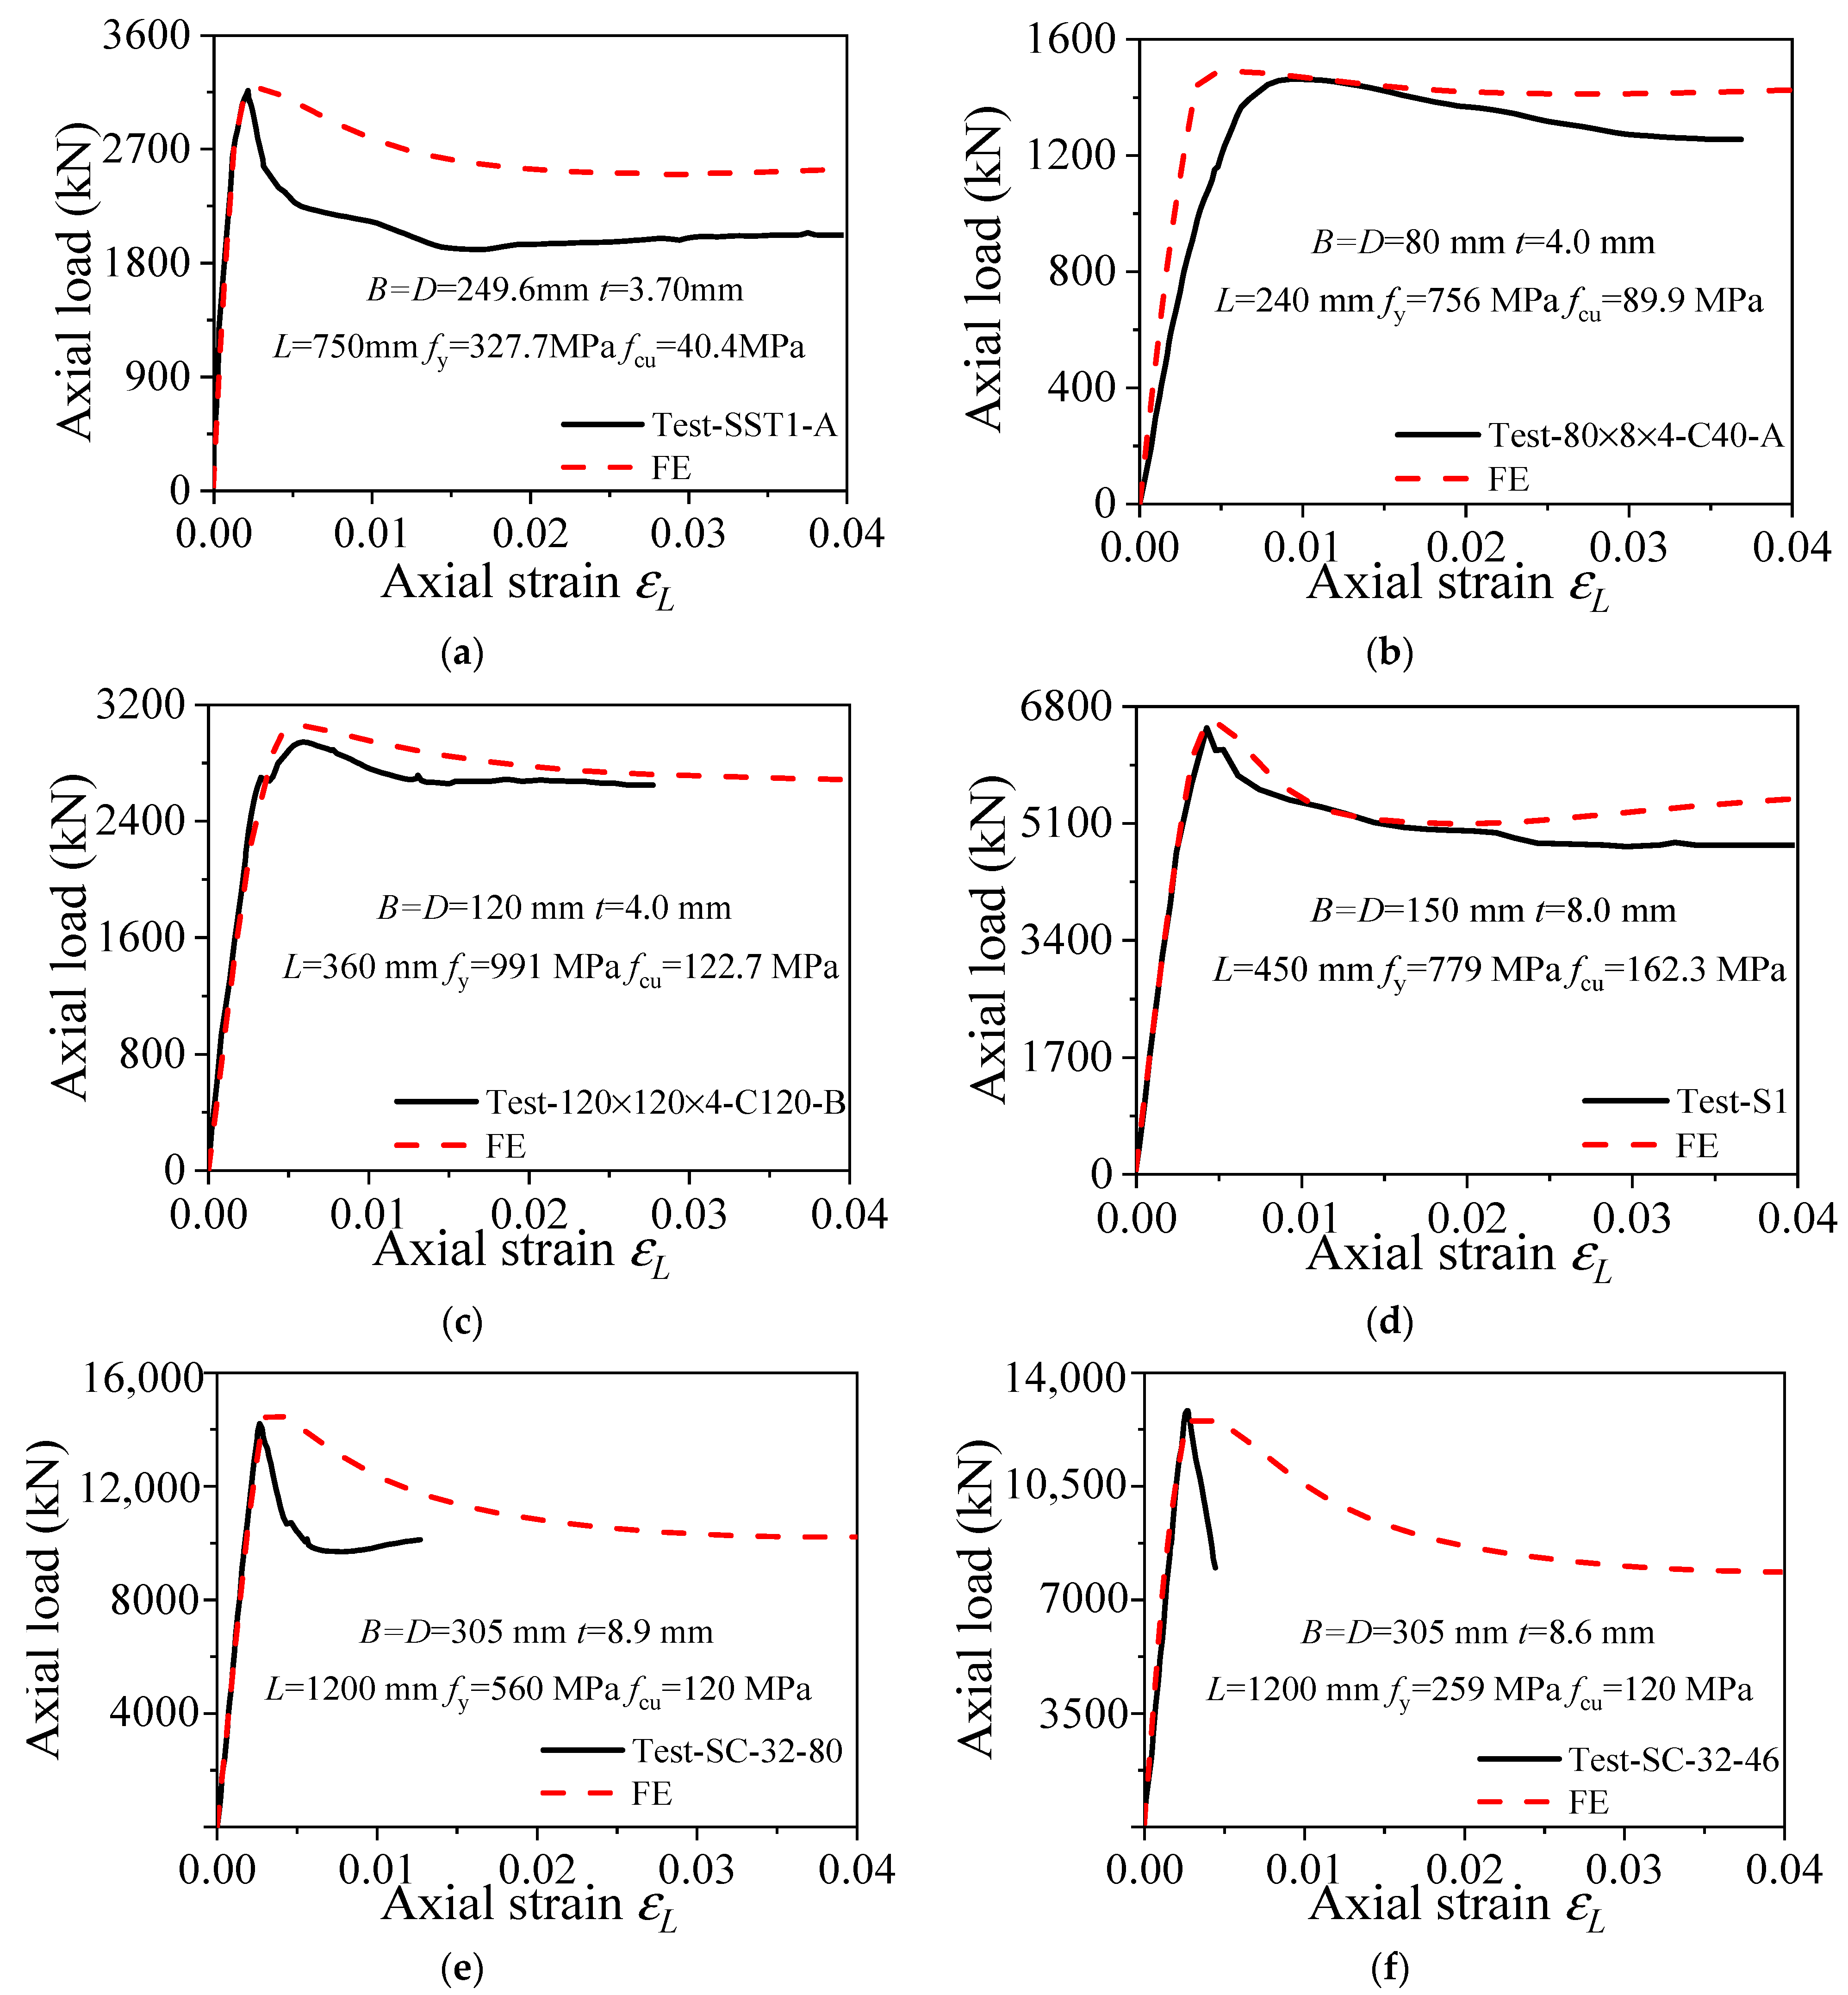
3.5. Model Validation

Figure 4 shows the 181 sets of experimental data samples collected from the literature on CFST columns composed of steel tubes and concrete with different strength grades. The test database does not contain data samples of axially compressed stub columns with excessive steel content, excessively small diameter-to-thickness ratios, or excessively large slenderness ratios. Considering that the materials in the constitutive model used in this study are hot-rolled steel and plain concretes, the test database also does not contain axial compression test data samples of stub columns containing stainless steel, aluminum alloys, or concrete reinforced with other materials (steel fiber, carbon fiber) under axial compression.
It can be observed that the constructed database contains a diameter-to-thickness ratio ranging from 20–120, a steel yield strength ranging from 175–1100 MPa, and a concrete compressive strength ranging from 20–190 MPa, which covers the general interest of engineering practice and academic research. All the published experimental results and relevant HSCFST parameters are shown in Appendix A Table A1.
The strength distribution pattern of the test data points is shown in Figure 4b. Approximately 82% of the test data points are concentrated in concrete strengths of less than 100 MPa, and 66% of the test data points are concentrated in D/t ratios ∈ [20, 60]. The concrete is categorized into normal-strength concrete (fcu < 100 MPa) and HSC (fcu ≥ 100 MPa) according to the dilation angle, and the steel is categorized into normal-strength steel (fs < 500 MPa) and HSS (fs ≥ 500 MPa) according to whether the steel has a yield plateau.
The finite element modeling method used in this paper is applied to compare and analyze the axial compression test results of the square HSCFST stub columns provided in the literature. The verification of the typical finite element model is shown in Figure 5, which compares the finite element simulation curve of a typical square CFST stub column under axial compression with the experimental results in the literature. The comparison of the analysis results in Appendix A Table A1 shows that the ratio (Nu,e/Nu,FE) of the measured ultimate bearing capacity (Nu,e) to the ultimate bearing capacity calculated based on the finite element model (Nu,FE) is 1.02, with a dispersion coefficient of 0.038. The Nu,FE values are generally in good agreement with Nu,e, especially in the elastic stage, during which the measured and calculated curves basically overlap. Figure 5 compares the finite element simulation curves of typical square HSCFST stub columns under axial compression and the experimental curves obtained from the literature. Hence, the bearing capacity–strain curves calculated based on the finite element model are generally in good agreement with the experimental curves obtained from the literature. There are obvious differences in the descending section of the test curve of some specimens, as shown in Figure 5a,e,f. Due to the influence of various factors in the experiment, the material strength cannot be fully exerted. After reaching the limit state, local defects may appear between the steel tube and concrete, manifesting as a rapid decrease in bearing capacity and poor ductility. Since only experimental data can be collected from the literature, and the specific conditions of the specimen and experimental status can only be known from pictures, so the influence of various defects is not considered in the modeling, and there are differences between some test curves and the descending section of the finite element calculation curve. After comprehensive consideration, this modeling method is reasonable and reliable.

3.6. Parameter Analysis

In the finite element model, the width (B = D), length (L), and wall thickness (t) of the square HSS tube are set to 500 mm, 1500 mm, and 3, 6, or 10 mm, respectively. The steel content (ρs) is between 0.02 and 0.08, the yield strength of the steel (fs) is 235, 345, 460, 550, 690, 780, or 960 MPa, and the cube compressive strength of the concrete (fcu) is 40, 70, 100, 120, 150, or 180 MPa. To explore the optimal combination of concrete strength and tube strength, these concrete strength and steel yield strength values were paired up to form a total of 126 model groups, and the model parameters are shown in Table 1. In this paper, HSS tubes filled with HSC were denoted as HS-HC, HSS tubes filled with normal-strength concrete were denoted as HS-CC, normal-strength steel tubes filled with HSC were denoted as CS-HC, and normal-strength steel tubes filled with normal-strength concrete were denoted as CS-CC. The three types of HSCFSTs, namely, HS-HC, HS-CC, and CS-HC, are the focus of analysis in this paper.
The effect of concrete strength on the mechanical properties of square HSCFST stub columns was analyzed using a steel tube wall thickness (t) of 6 mm and steel yield strengths (fs) of 345, 460, 690, and 960 MPa. Figure 6, Figure 7 and Figure 8 show the effect of different parameters on the axial compressive capacity of the square HSCFST stub columns. Specifically, the concrete strength grade, the steel yield strength, and the steel content all have a certain effect on the load–displacement curve and the bearing capacity.

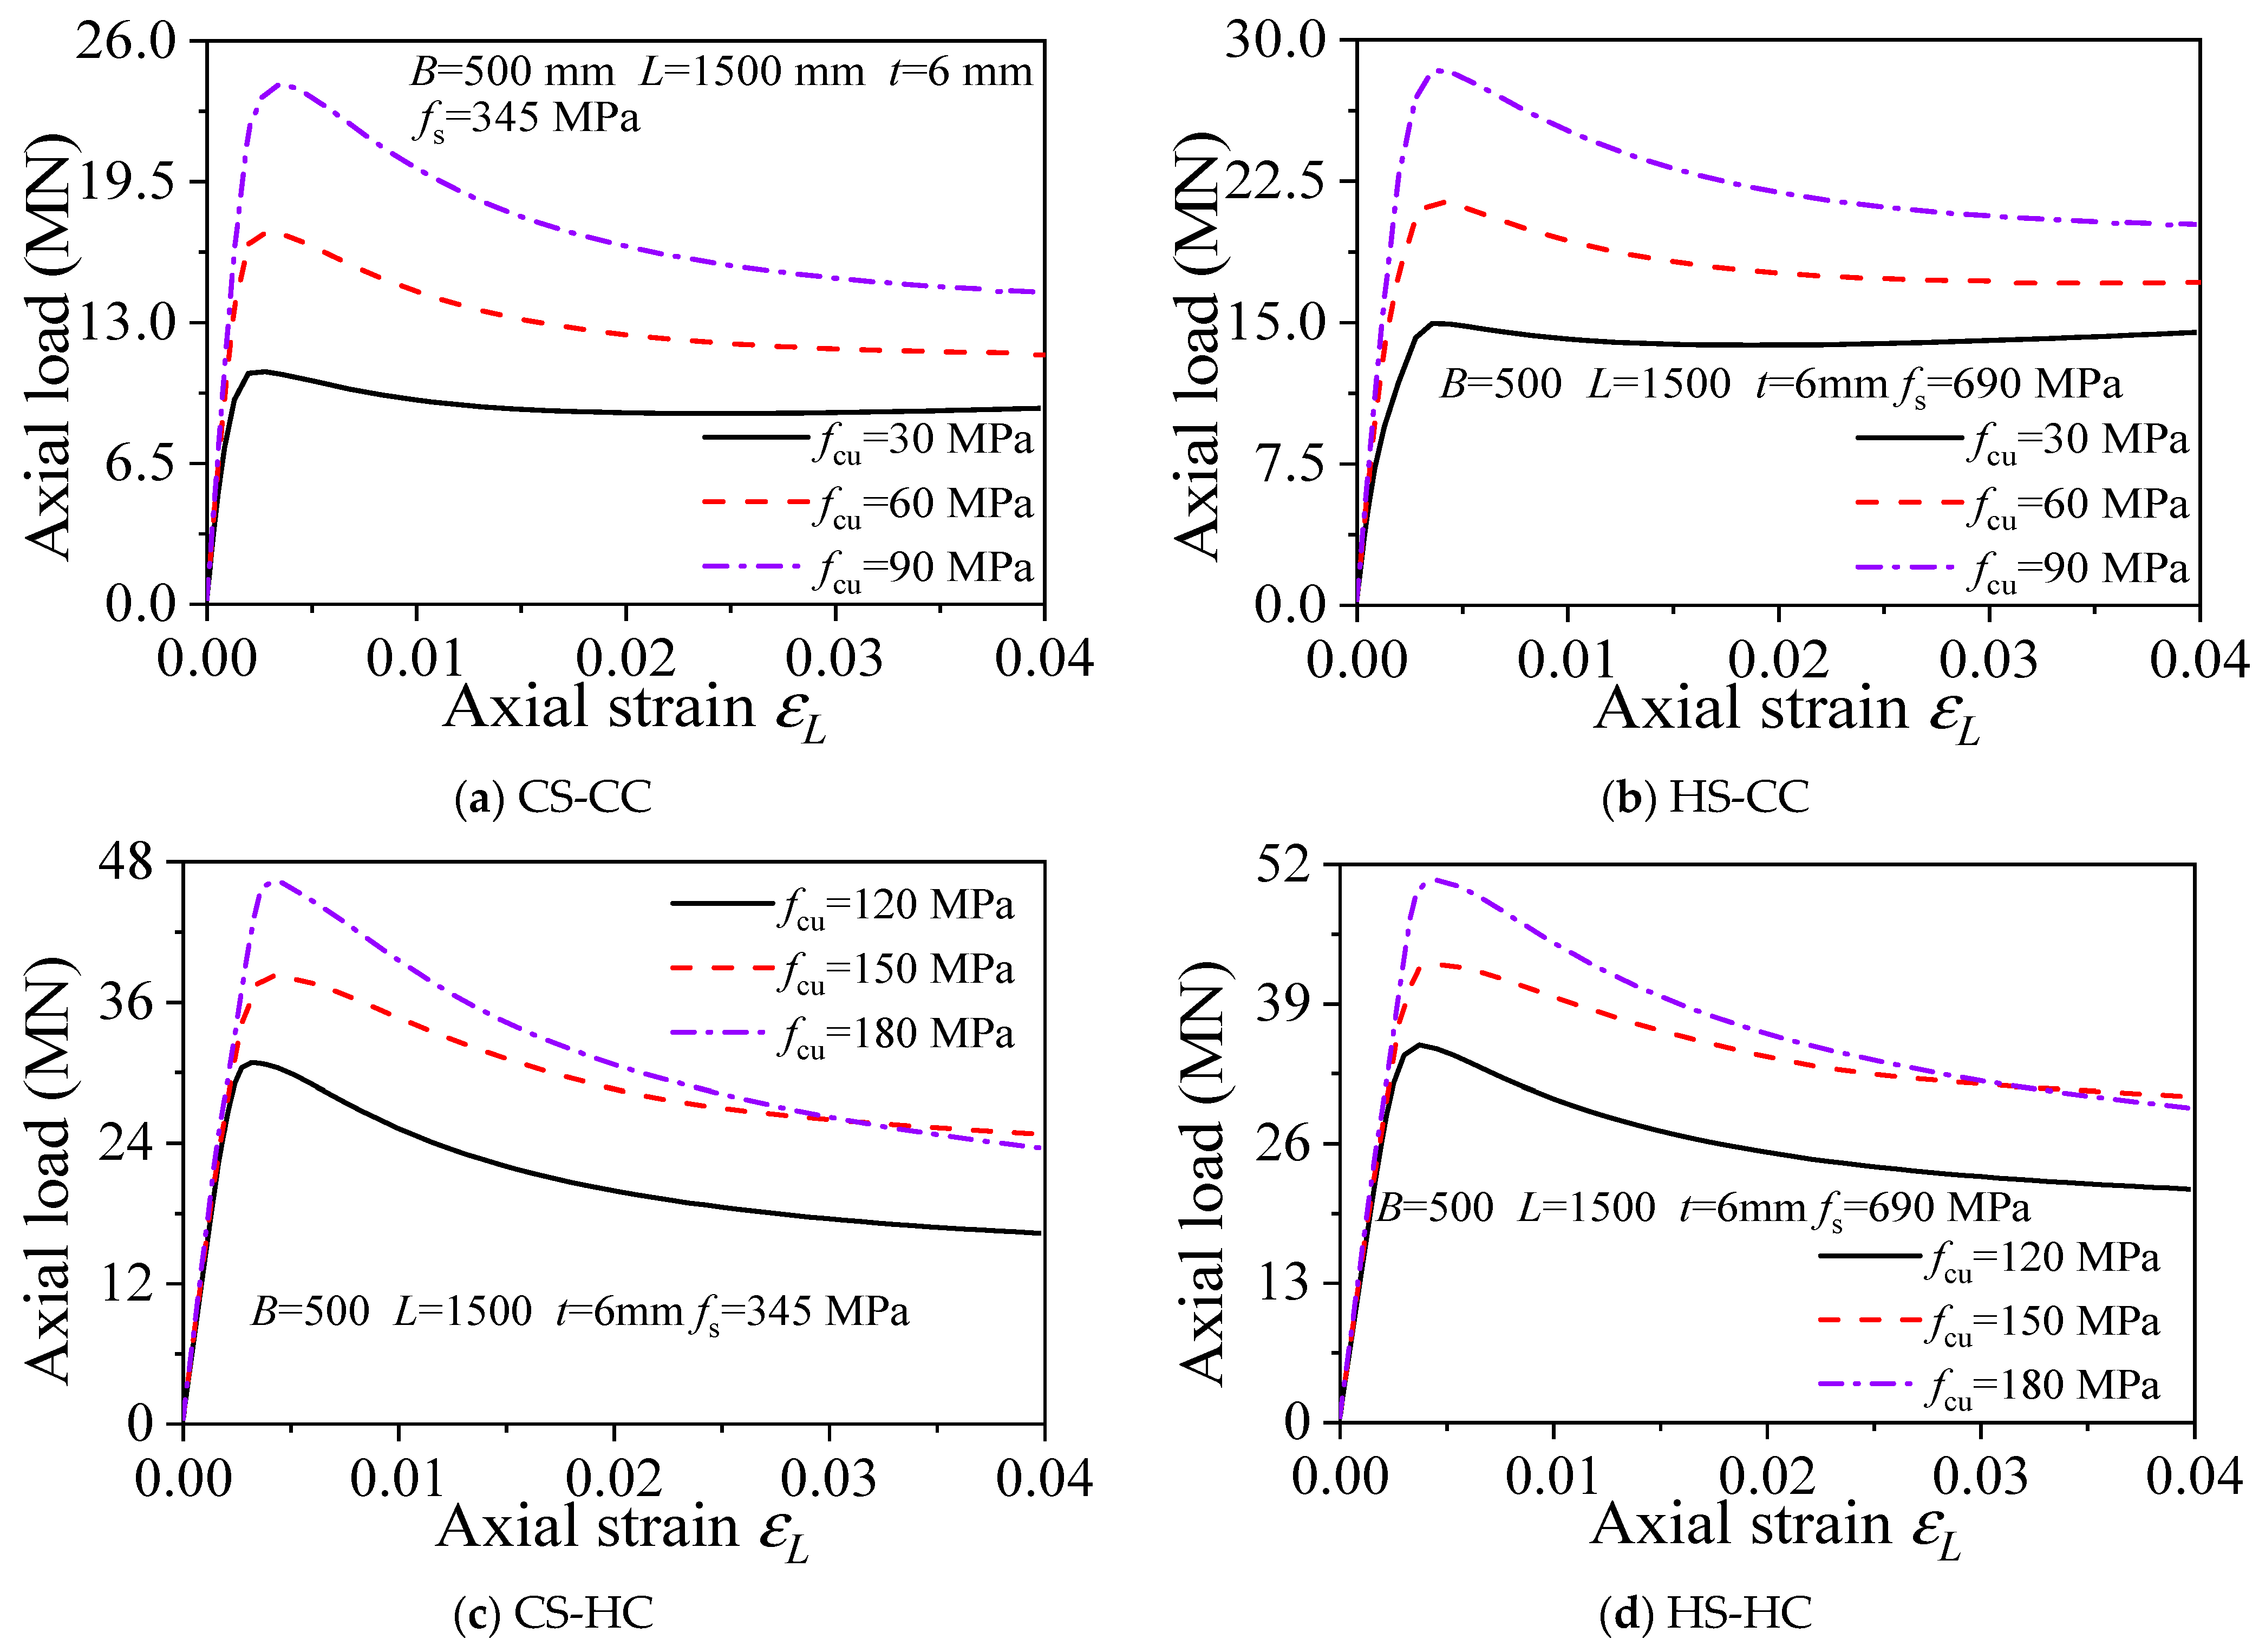
3.6.1. Concrete Strength fcu

Figure 6 shows the load–longitudinal strain (NL) curves of axially compressed square HSCFST columns with different fcu values. The effects of concrete strength on the mechanical properties of axially compressed square HS-HC, HS-CC, CS-HC, and CS-CC stub column members with a tube wall thickness (t) of 6 mm and concrete strengths (fcu) of 30, 60, 90, 120, 150, and 180 MPa were analyzed. The results show the following: (1) Under the premise that other parameters remain constant, the concrete strength fcu is one of the factors influencing the bearing capacity of the CFST members. The initial stiffness of the members is little affected by fcu, and the ductility increases with increasing fcu. (2) With an increase in the concrete strength, the ultimate bearing capacities of CS-CC, HS-HC, HS-CC, and CS-HC stub column members increased by 60%, 24%, 44%, and 21% at most, respectively. Hence, the concrete strength has the greatest impact on CS-CC, the second greatest impact on HS-CC, and the least impact on CS-HC.

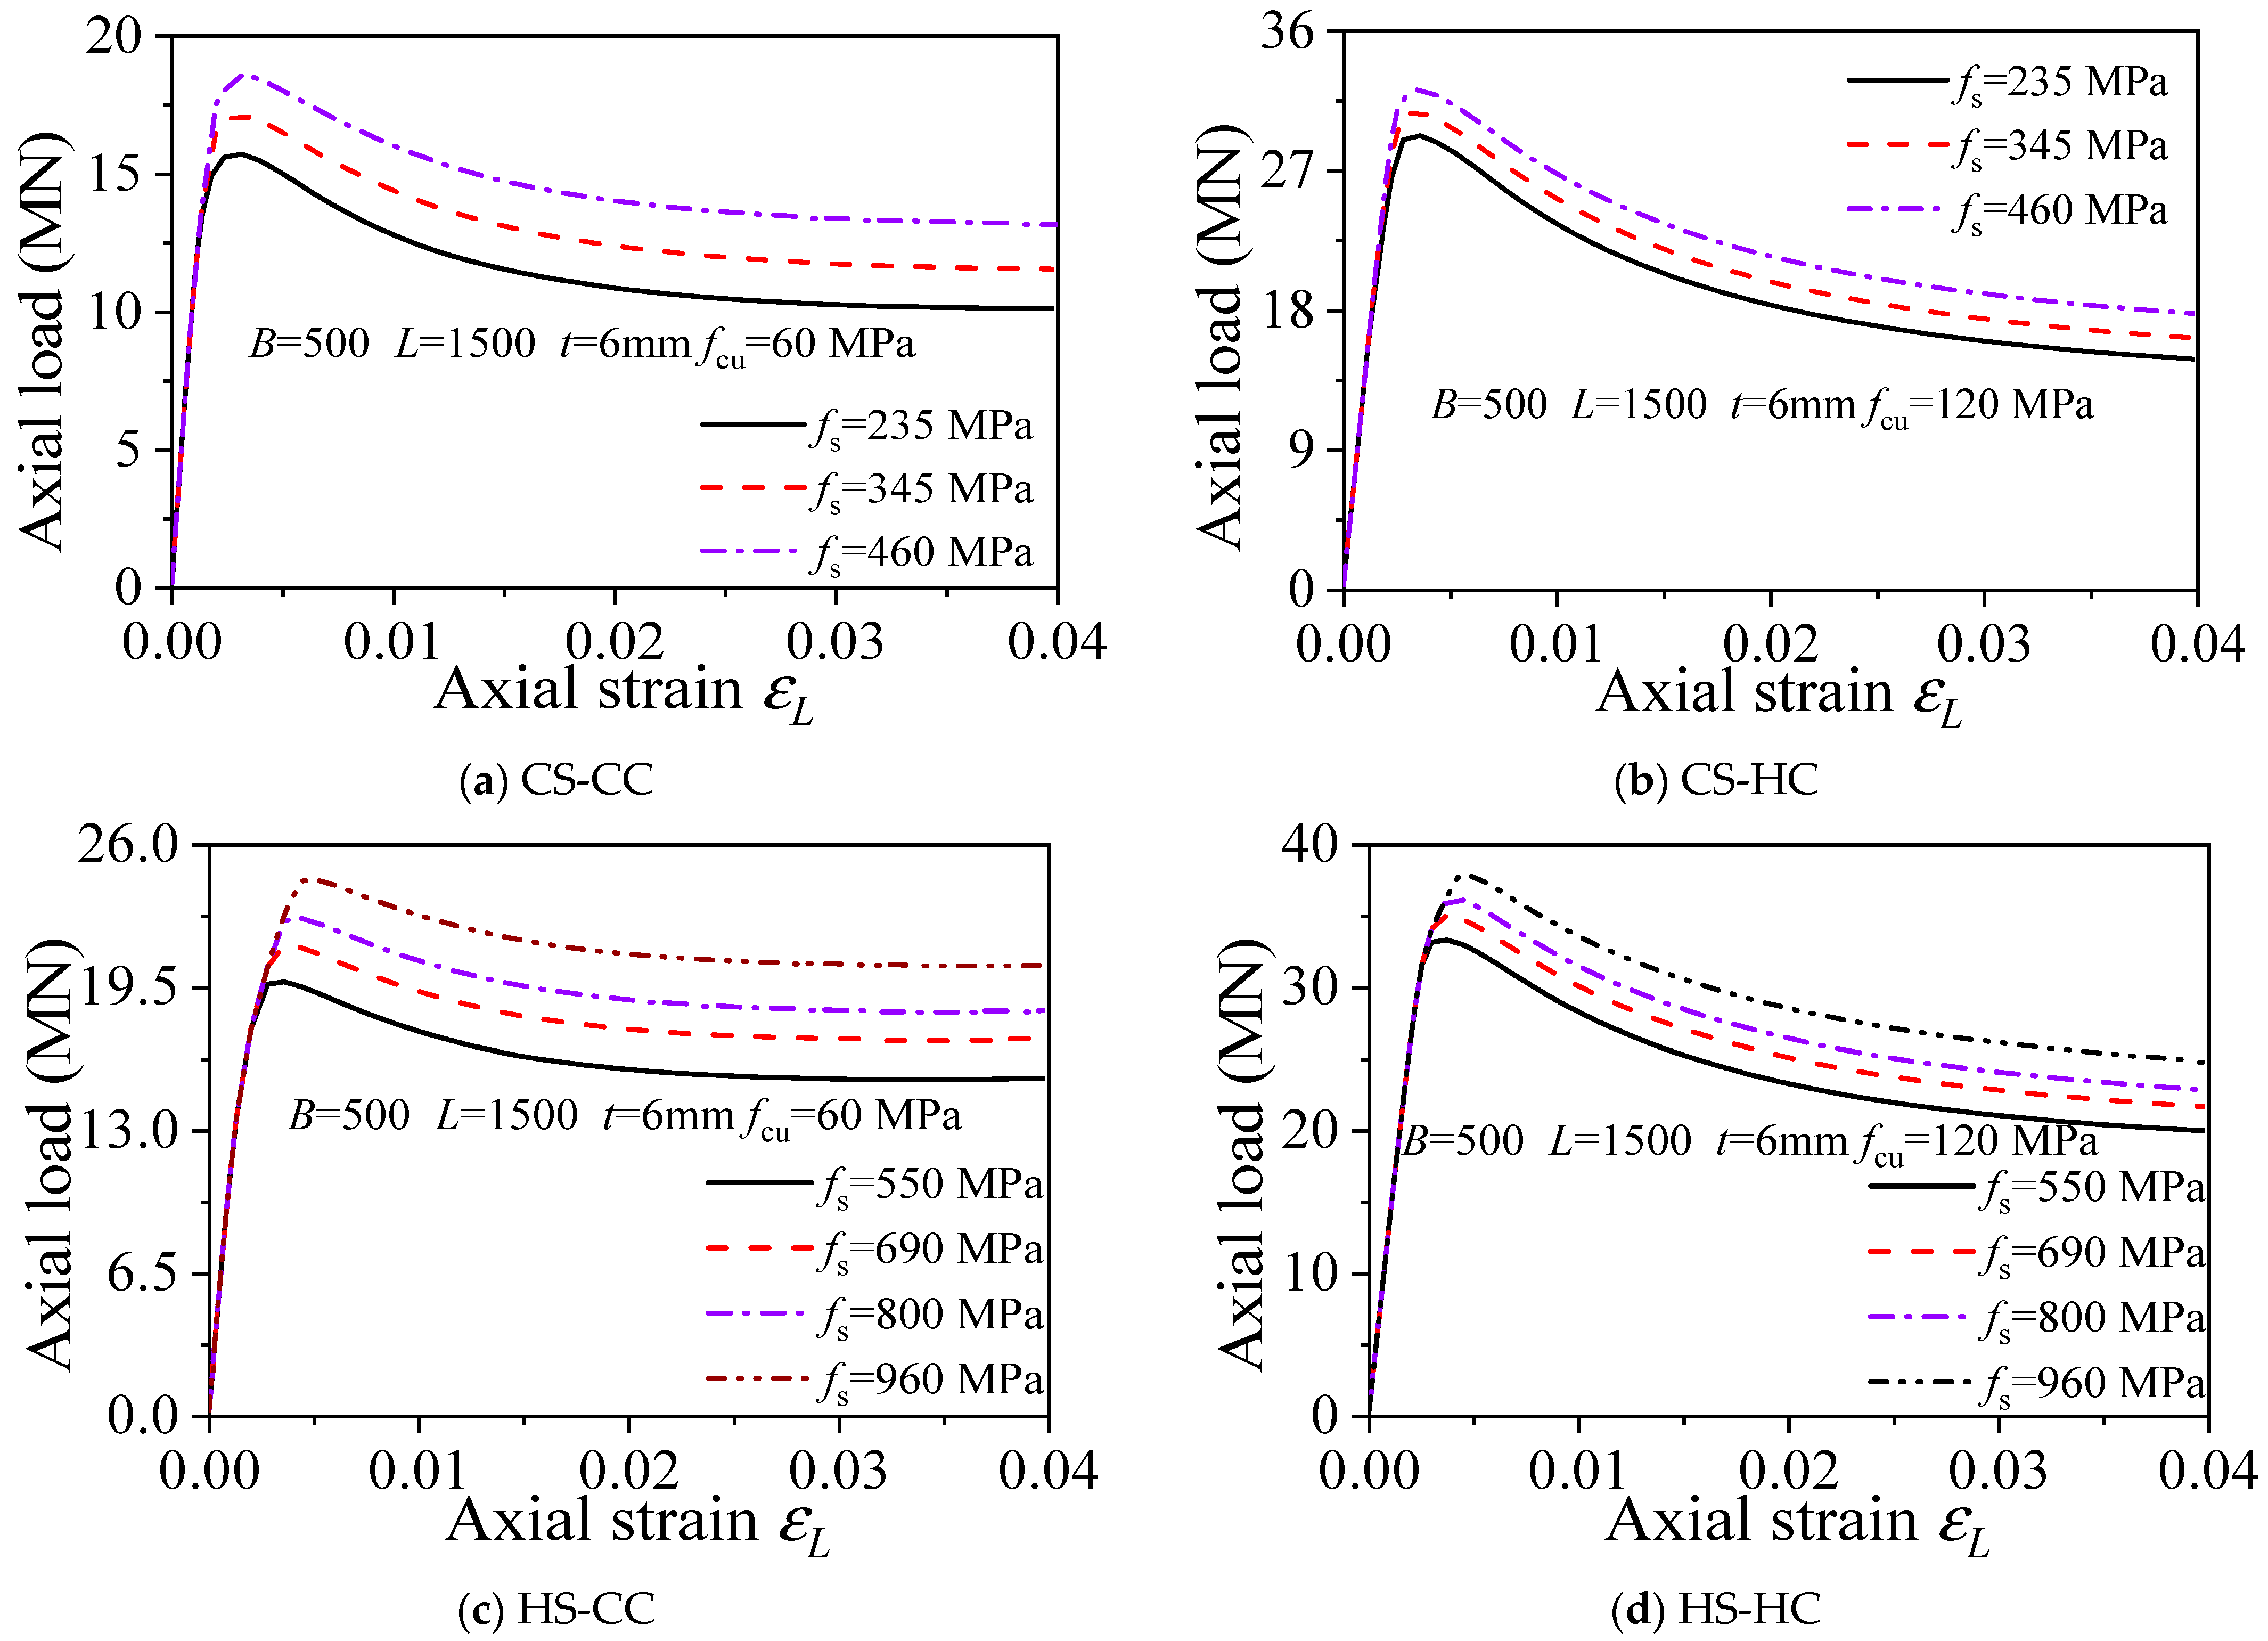
3.6.2. Steel Yield Strength fs

The effects of steel yield strength (fs) on the load–displacement curves of axially compressed square HS-HC, HS-CC, CS-HC, and CS-CC stub column members with a tube wall thickness (t) of 6 mm and steel yield strengths (fs) of 235, 345, 460, 550, 690, 800, and 960 MPa were analyzed, as shown in Figure 7. The analysis results show the following: (1) Under the premise that other parameters remain constant, the initial stiffness of the HS-HC, HS-CC, CS-HC, and CS-CC stub column members is almost the same, and the steel yield strength has almost no effect on the stiffness of the members. (2) The ultimate bearing capacity increases with increasing steel yield strength fs, which indicates that the steel yield strength is one of the factors influencing the bearing capacity of the CFST members. As the steel yield strength increased, the ultimate bearing capacities of CS-CC, HS-HC, HS-CC, and CS-HC stub column members increased by 8.8%, 5.1%, 8.5%, and 5.2%, respectively. Hence, steel yield strength has the greatest impact on CS-CC and HS-CC, the second greatest impact on HS-HC, and the least impact on CS-HC.

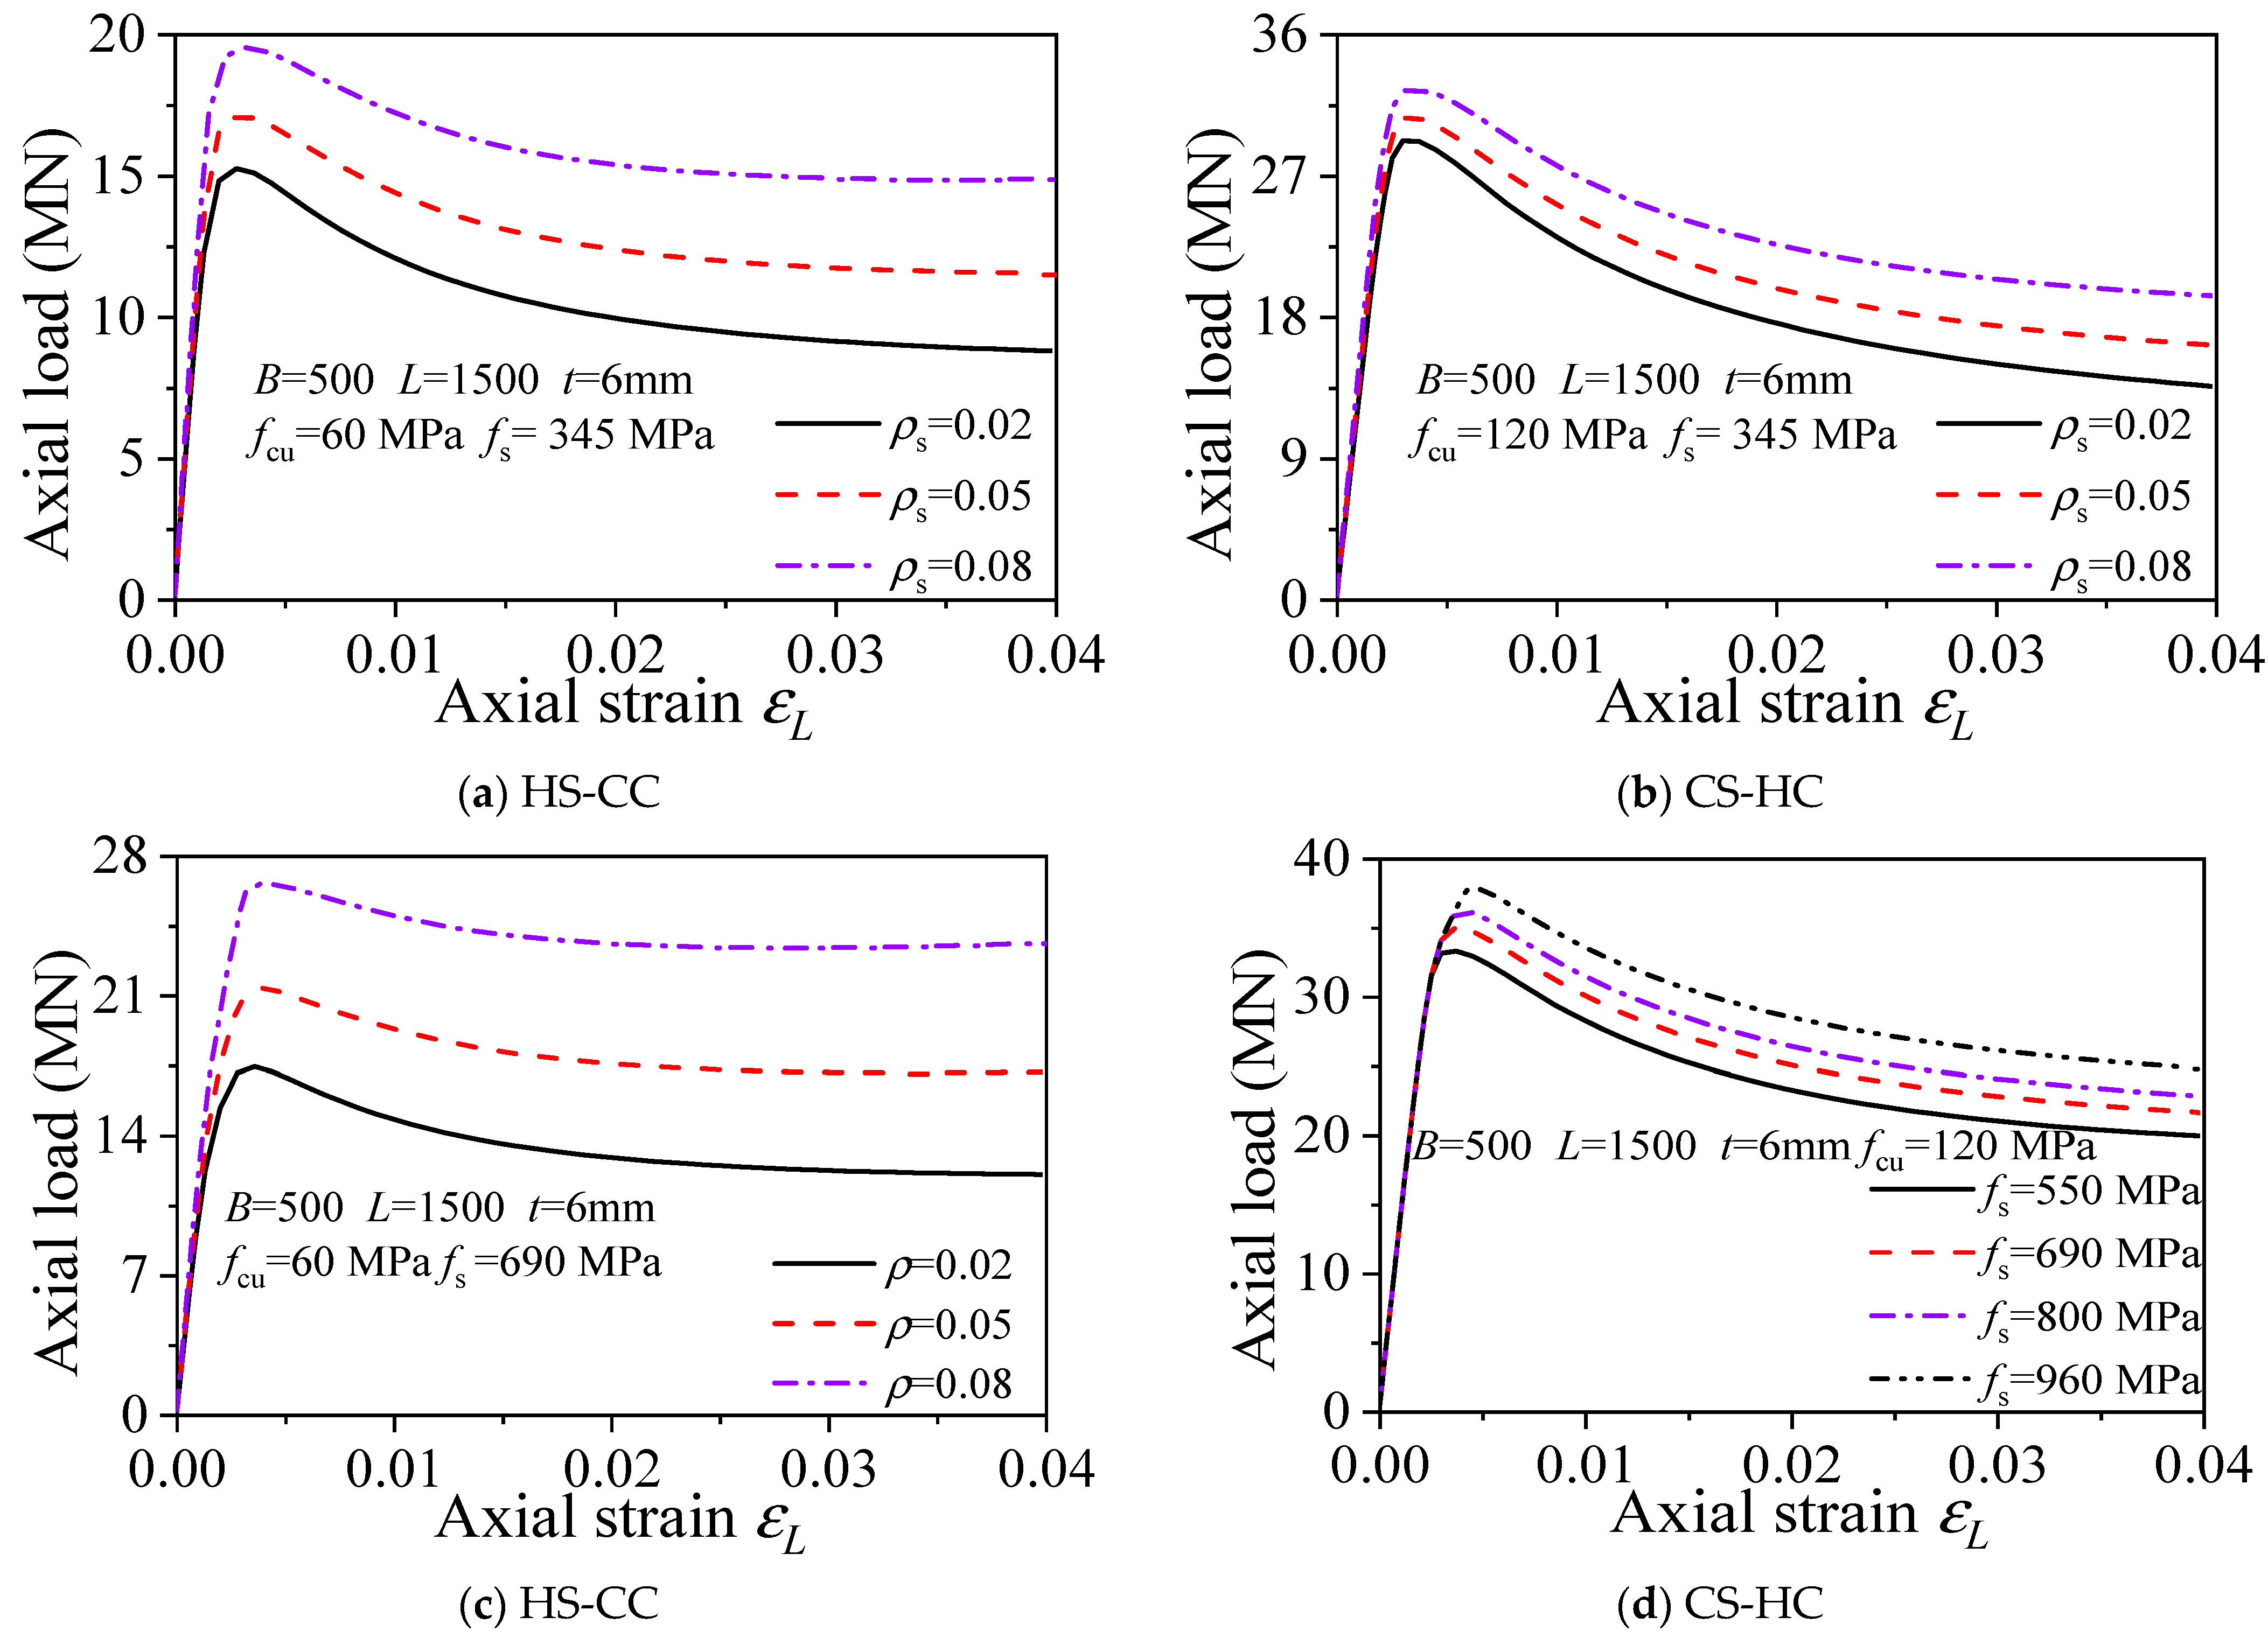
3.6.3. Width-to-Thickness Ratio (B/t)

Figure 8a–d shows the load–displacement curves of the axially compressed square CFST columns with different width-to-thickness ratios. The analysis results of the square HS-HC, HS-CC, CS-HC, and CS-CC stub columns with B = 500 mm and t = 6 mm show the following: (1) Under the premise that other parameters remain constant, the ultimate bearing capacities of the members increase as the width-to-thickness ratio decreases. When the thickness t decreased from 5 mm to 3 mm, the bearing capacities of HS-HC, HS-CC, CS-HC, and CS-CC stub columns increased by 14%, 24%, 5%, and 13%, respectively. Hence, the width-to-thickness ratio (D/t) has the greatest impact on HS-CC and the least impact on CS-HC. (2) Compared with concrete strength and the steel yield strength, the width-to-thickness ratio has a greater impact on the initial stiffness of the members. The greater the width-to-thickness ratio of a member is, the greater the initial stiffness of the member.
In summary, the influence of material strength and width-thickness ratio on bearing performance is complex. In order to explore the best configuration, it is recommended to use the linear weighting and optimization method proposed by Sojobi [30], which is a simplified multi-criteria decision-making optimization method which can be utilized to select the best structural configuration when several configurations are considered alongside several mechanical properties.

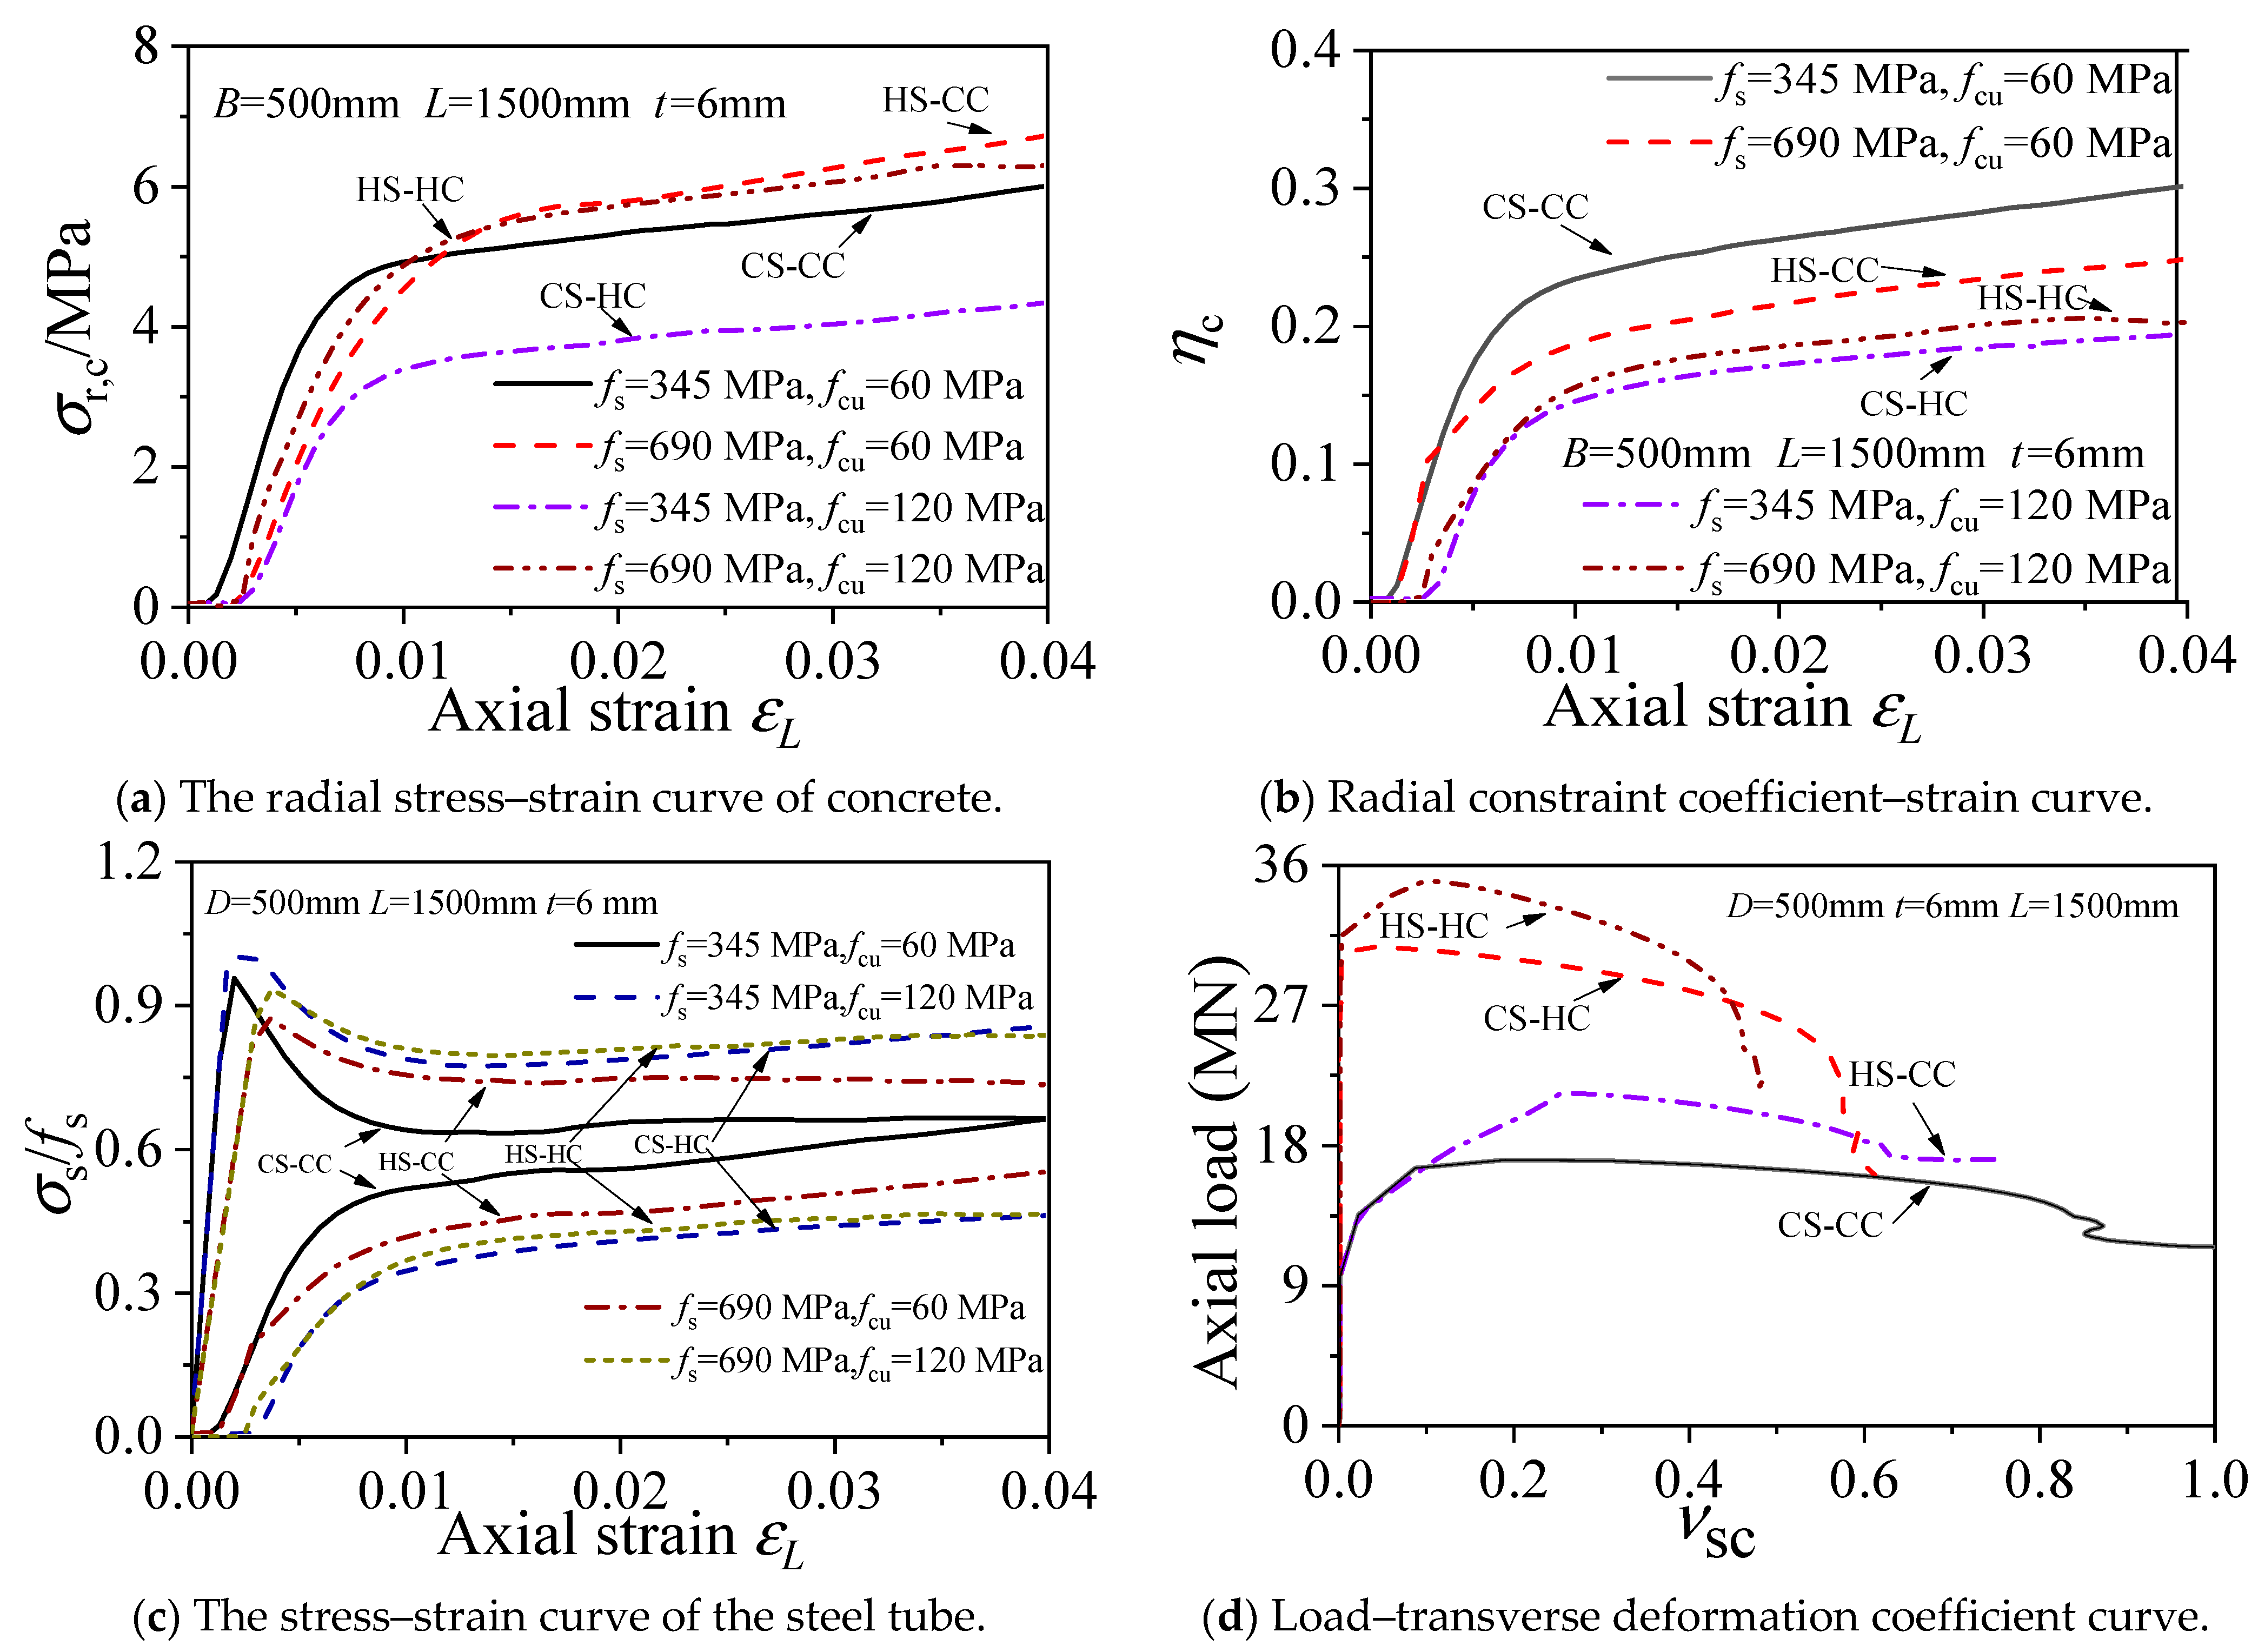
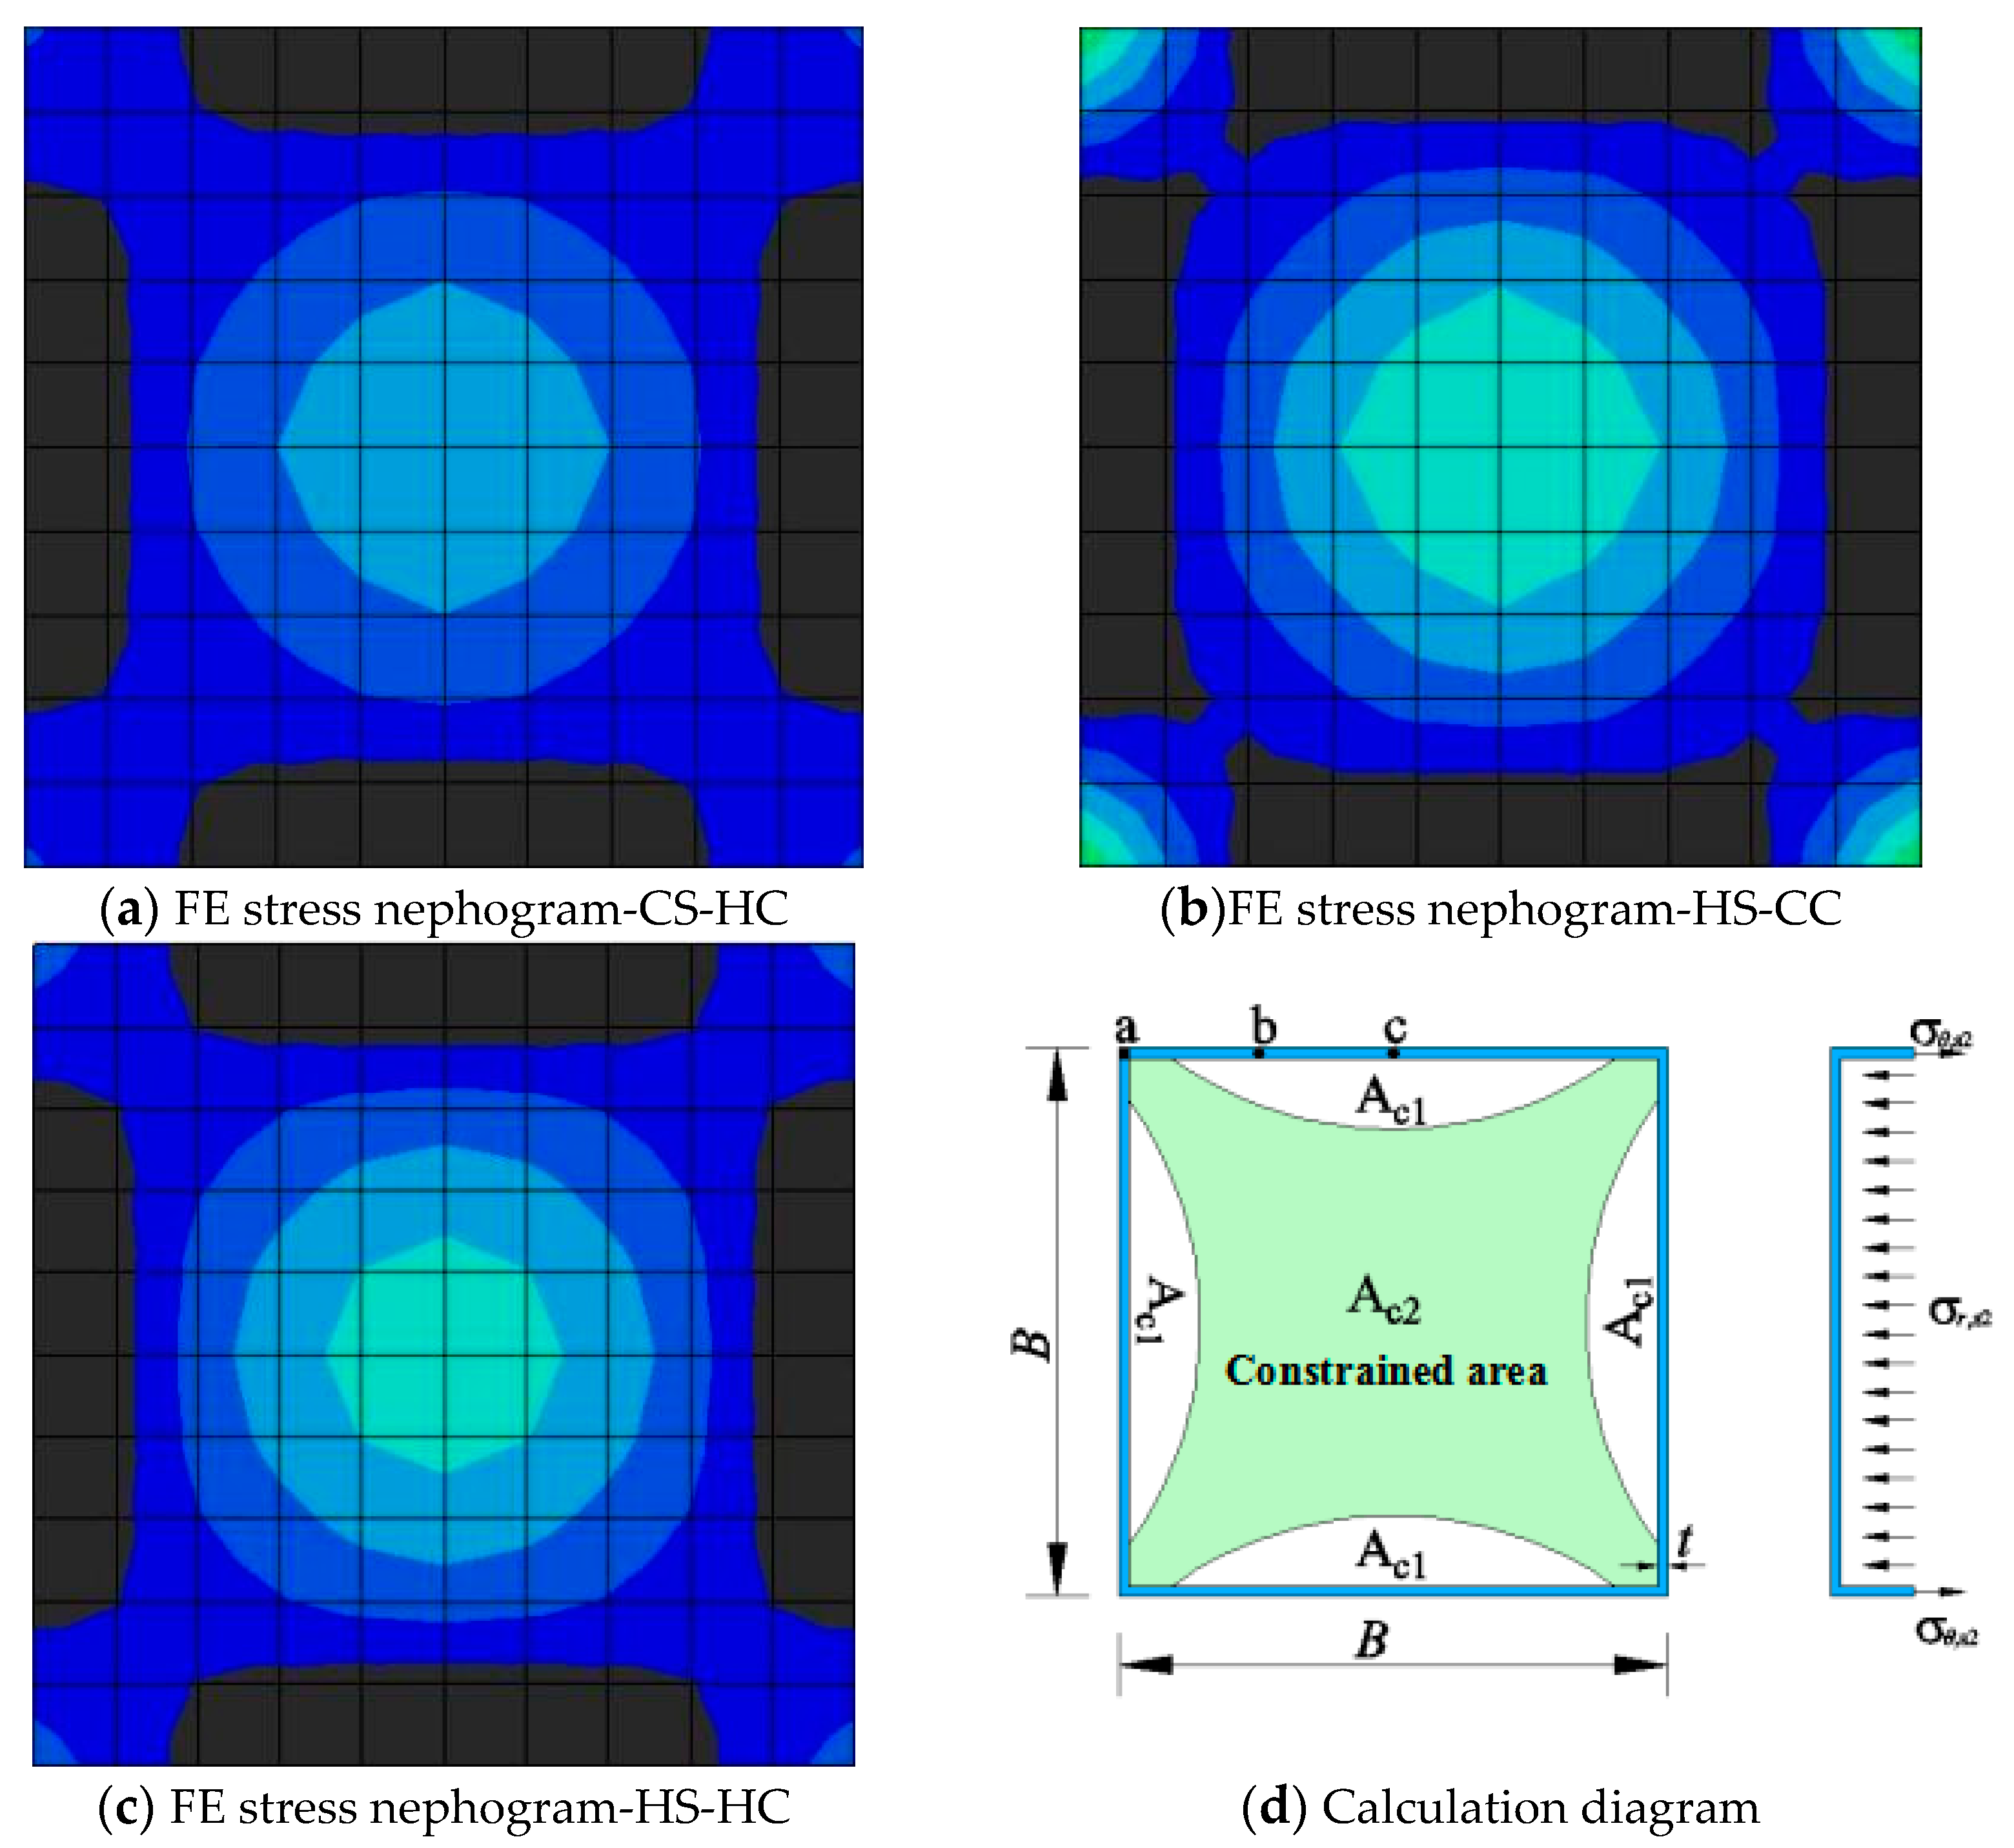
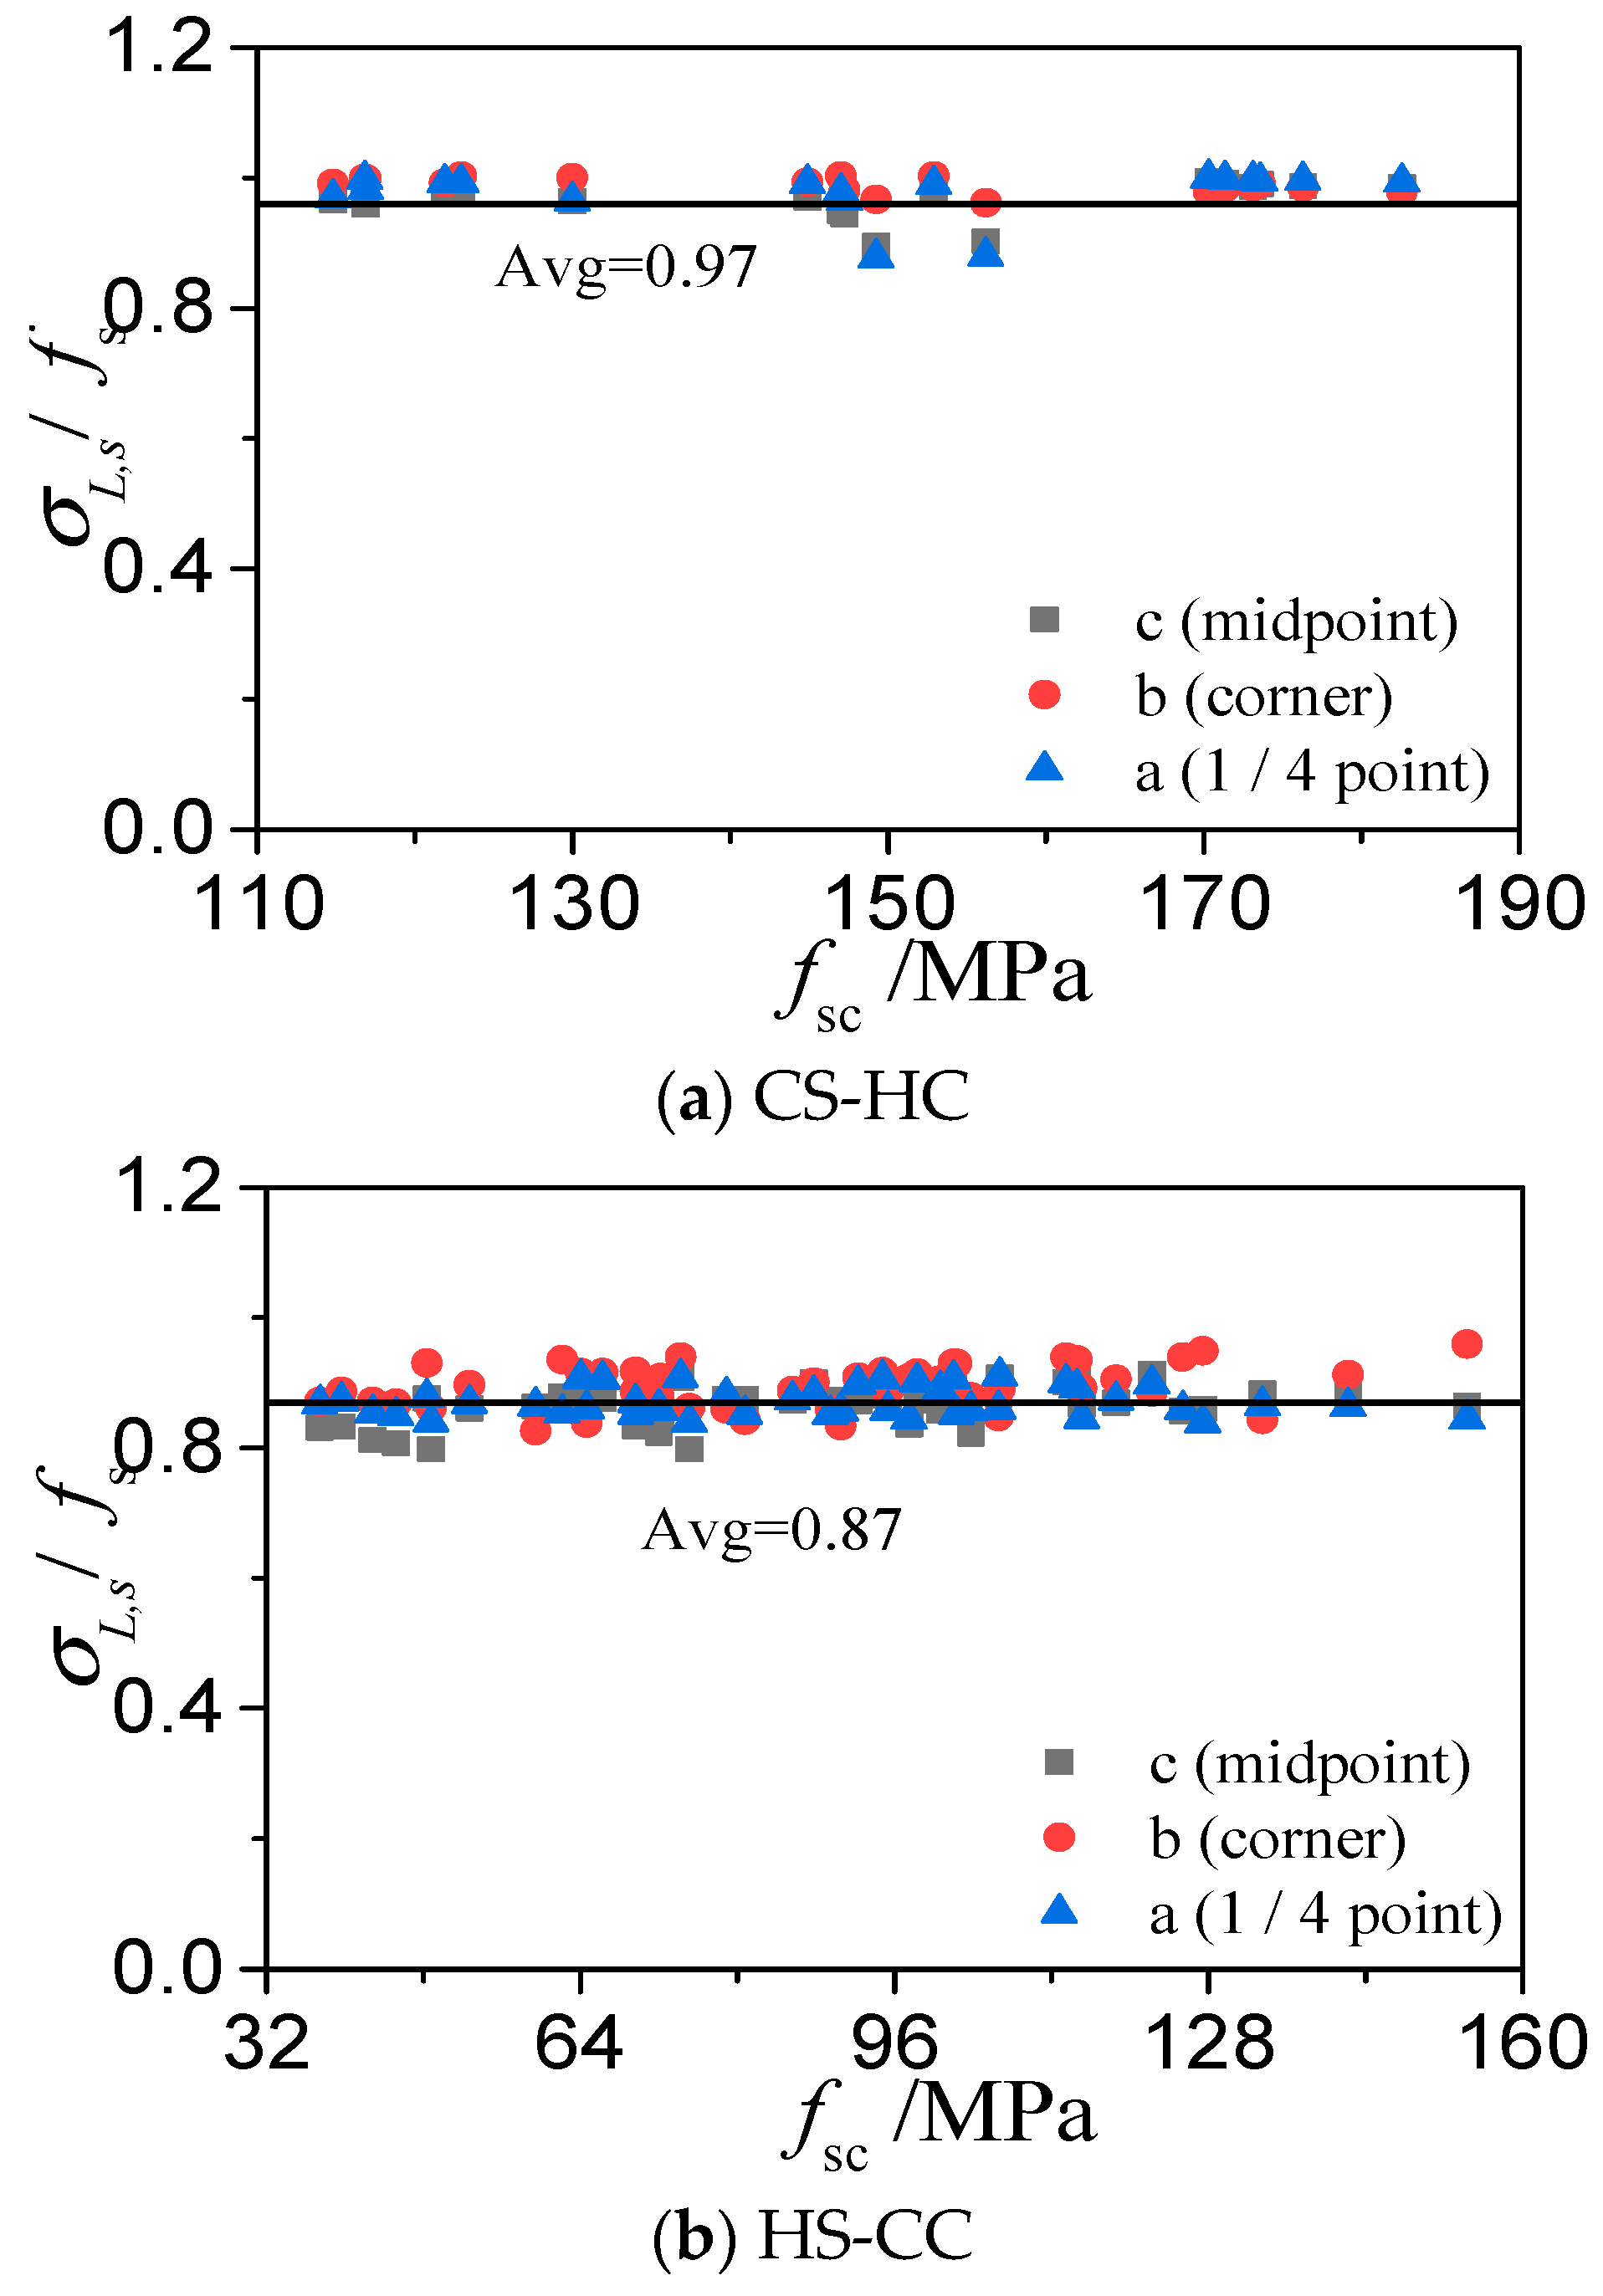
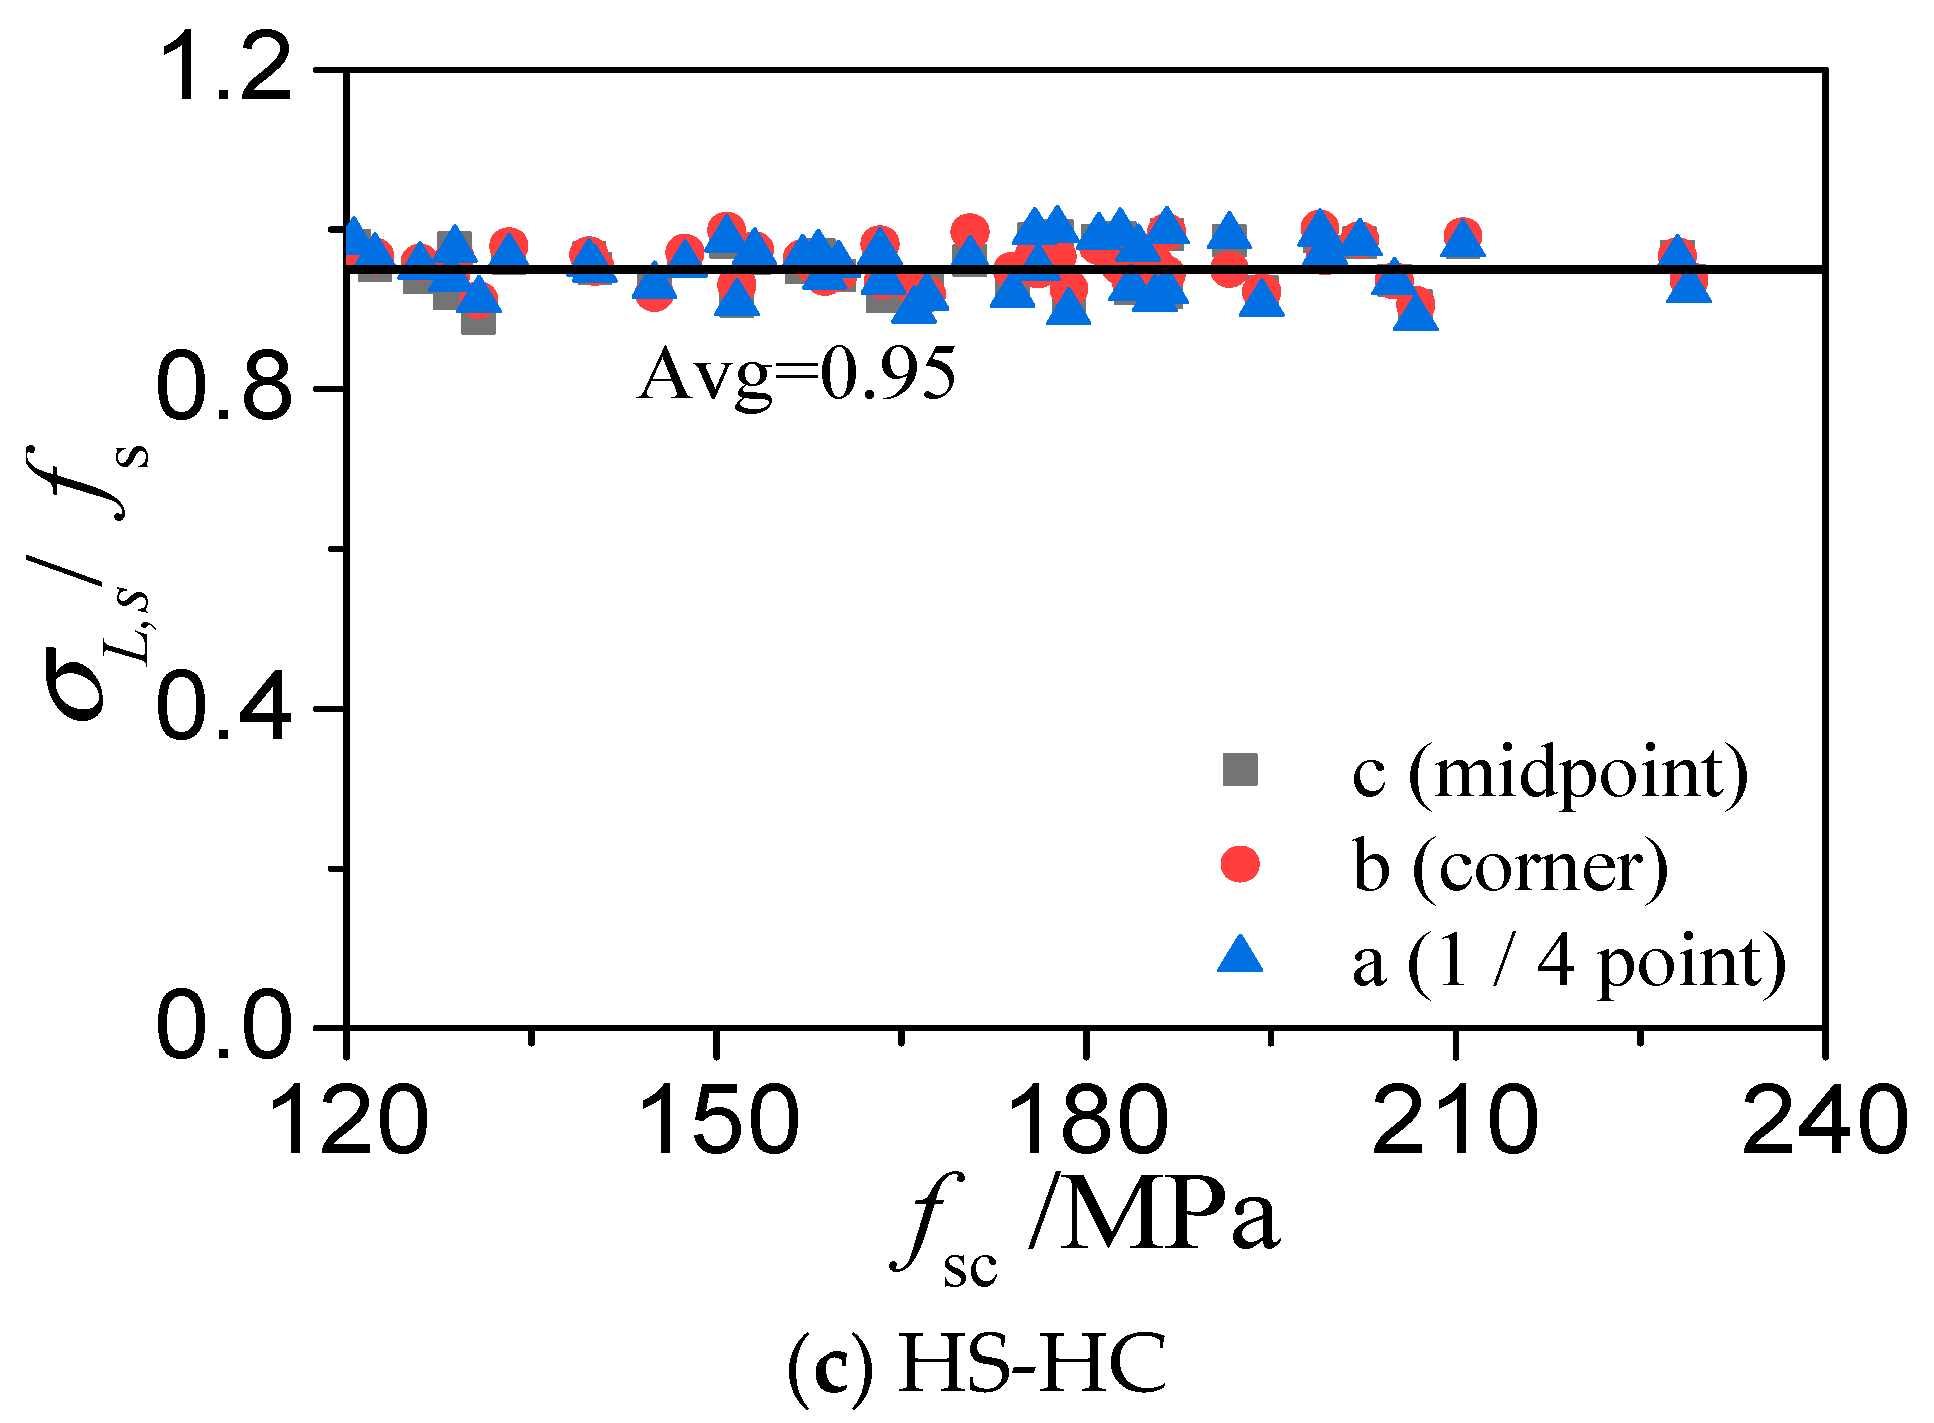
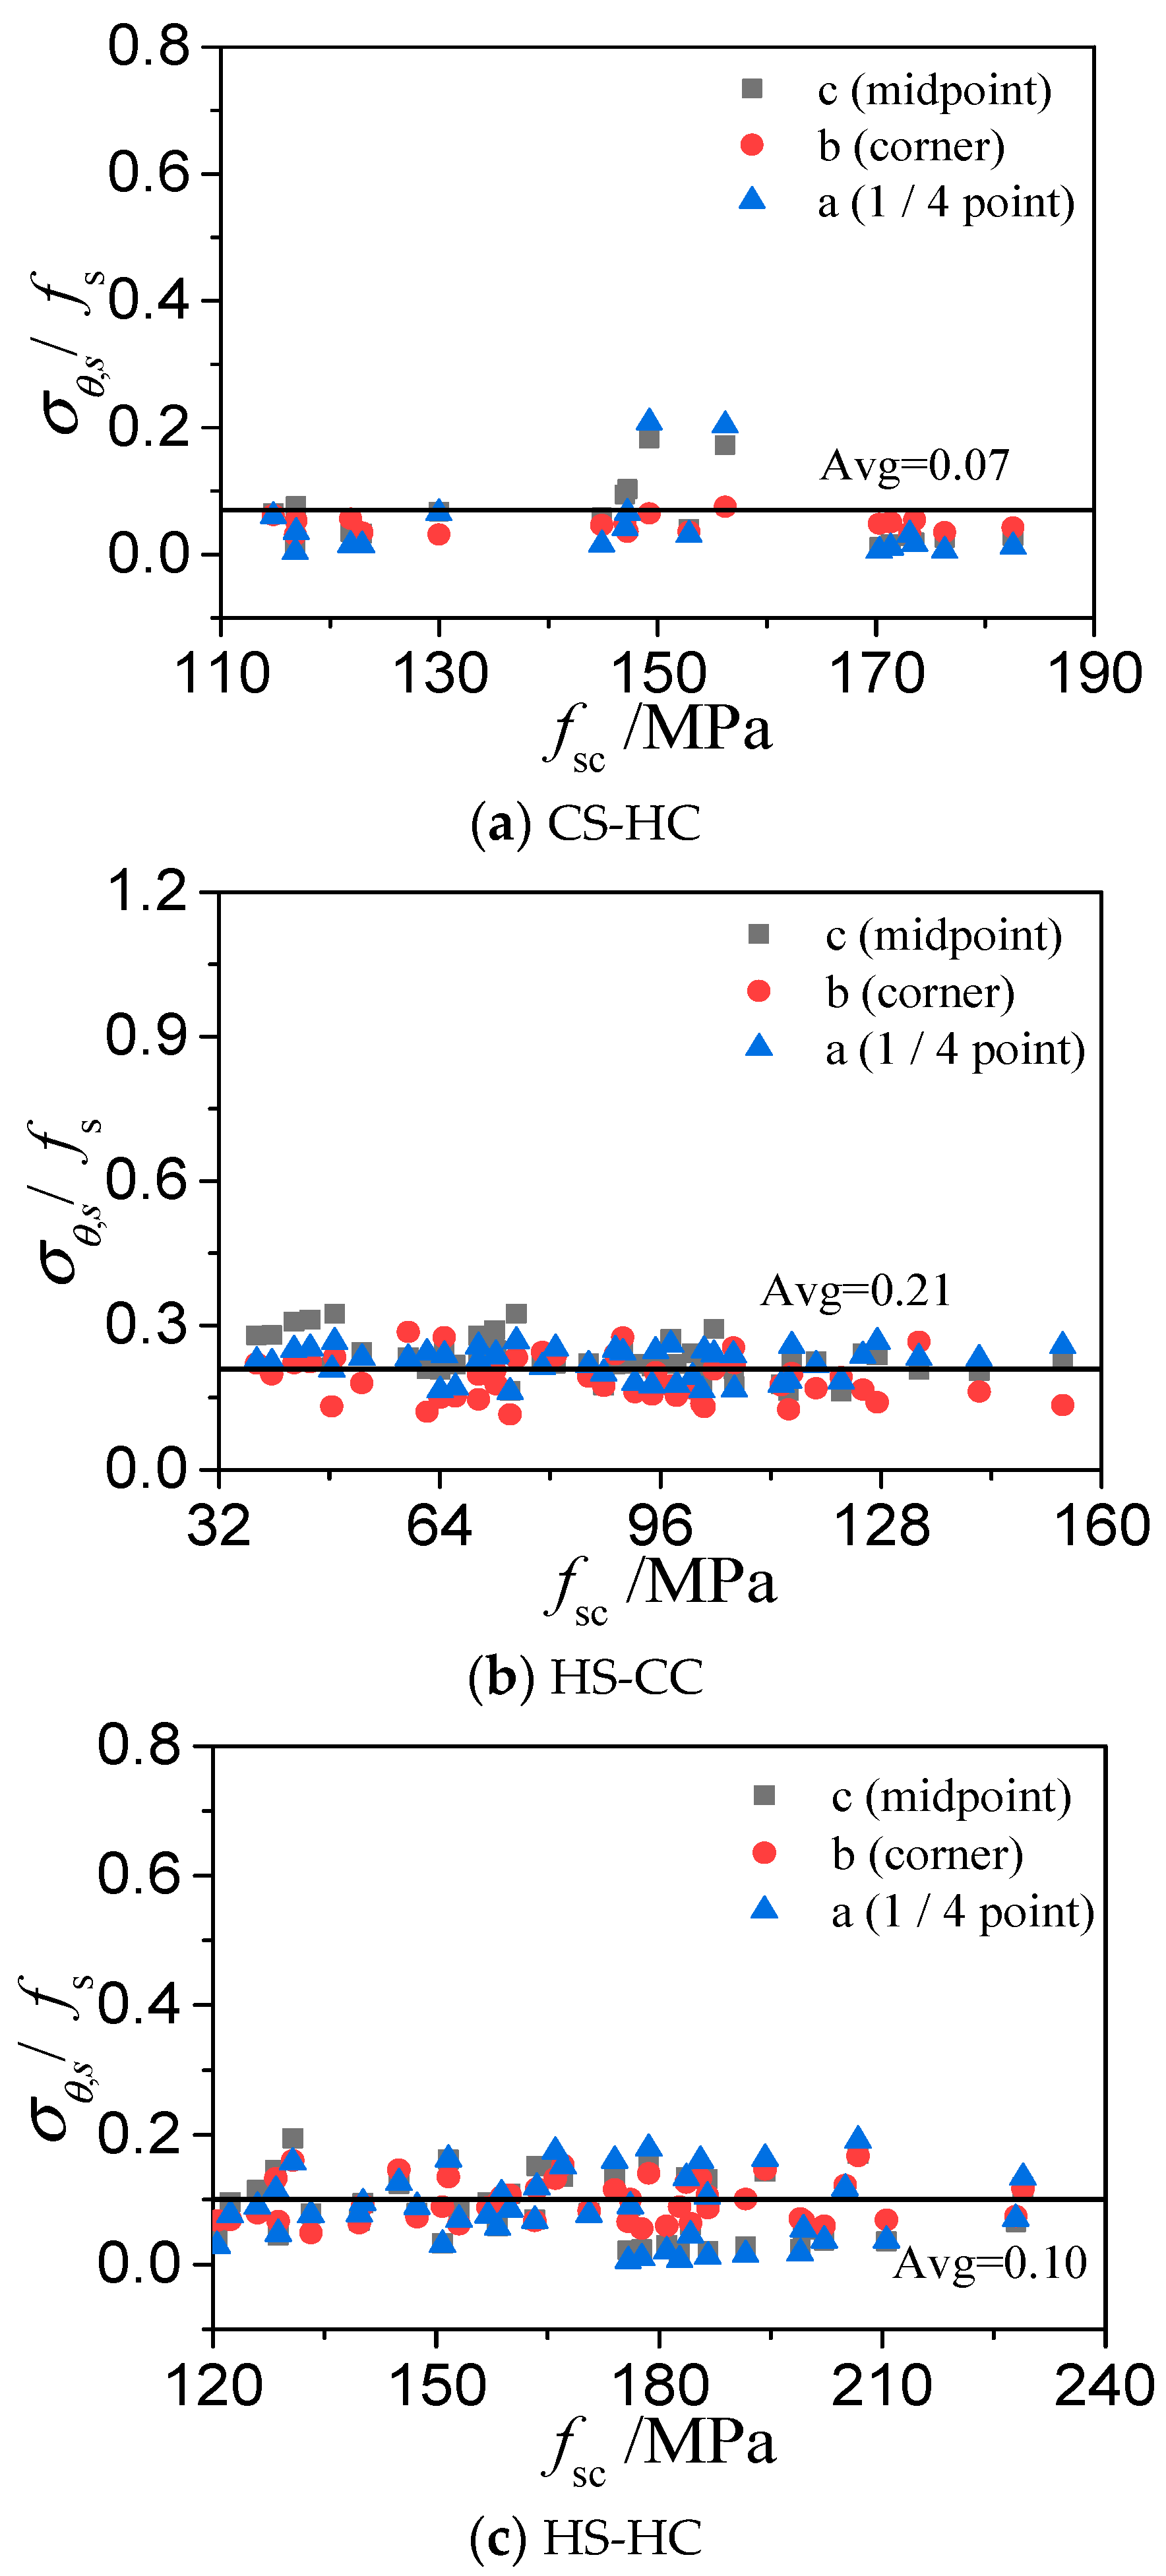
3.7. Analysis of the Confinement Effect

The variation pattern of the longitudinal stress–strain curves and circumferential stress–strain curves of the steel tube used by Ding [11] can reflect the confinement effect of the steel tube on the concrete in a square CFST stub column under axial compression. The confinement effect of the steel tube on the core concrete can be assessed through the equivalent radial stress of the concrete under lateral compression: σr,c = 2tσθ,s/(B − 2t). The confinement efficiency of the steel tube on the core concrete can be evaluated by the radial confinement coefficient and the time at which the longitudinal stress–strain curve of the steel tube intersects its circumferential stress–strain curve. Figure 9 compares the axial compressive stress and radial confinement coefficient of the square HSCFST stub columns and the common-strength CFST stub columns. As shown in the figure, (1) as the steel strength grade increases, the radial stress of the core concrete (σr,c) decreases during the early loading stage but increases during the late loading stage, whereas the radial confinement coefficient (ηc) decreases constantly. (2) As the concrete strength grade increases, the σr,c always decreases, whereas ηc decreases in the early loading stage but increases at the late loading stage. (3) During the loading process, the longitudinal stress of the steel tube gradually decreases after reaching the maximum point, while the circumferential stress of the steel tube gradually increases after reaching the minimum point. The intersection point of the longitudinal stress–strain curve and the circumferential stress–strain curve of CS-CC appears first, while that of CS-HC appears last because the HSC has not reached the peak stress when the common-strength steel buckles. Hence, CS-HC has the weakest confinement effect.

4. Calculation Formula for Bearing Capacity

4.1. Model Simplification and Formula Establishment

The model is simplified using the superposition principle and stress distribution analysis. Ac is the cross-sectional area of the concrete, Ac1 is the unconfined area of the concrete, Ac2 is the confined area of the concrete, B is the cross-sectional length or width of the steel tube of each strength grade, and t is the wall thickness of the steel tube of each strength grade. According to the stress distributions in Figure 10a–c, when the core concrete reaches the ultimate state, the relations between Ac, Ac1, and Ac2 are expressed as follows:
Ac1 = 0.25Ac
Ac2 = 0.75Ac
Figure 11 and Figure 12 show three points on the cross-sections of the steel tubes at the ultimate bearing capacities of the three types of HSCFST columns: the middle point b, the corner point a, and the 1/4 point c on the same side of the square. The ratio of the longitudinal stress (σL,s) to the nominal yield strength (fs) of the steel tube and the ratio of the circumferential stress (σθ,s) to the fs of the steel tube at these three points varies with the ultimate strength of the specimen (fsc = Nu/Asc, Asc = Ac + As), as shown in the figures. When a square HSCFST stub column reaches its axial compressive capacity, the relation between the axial stress and the yield stress and the relation between the circumferential stress and the yield stress of the steel tube are as follows:
σL,s = αfs
σθ,s = βfs
The relation between the radial stress of the core concrete and the circumferential stress of the steel tube shown in Figure 10 is as follows:
σ r , c = 2 t σ θ , s B
The relation between the axial compressive strength fL,c and the lateral stress σr,c of the core concrete in the reinforced zone is as follows:
fL,c = fc + 3.4σr,c
Based on the static equilibrium condition of the cross-section, the following equation can be obtained:
Nu = σL,cAc2 + fL,cAc1 + σL,sAs
According to Equations (11)–(15), the axial compressive capacity of the square HSCFST (Nu) can be expressed as follows:
Nu = fcAc + sAs
where K is the confinement coefficient of the square steel tube to the concrete. Table 2 shows the K values of the three types of square HSCFSTs and the K values of the CS-CC obtained from the literature. The CS-CC has the best confinement effect among the four types of CFSTs. Among the three types of square HSCFSTs, HS-CC has the best confinement effect, HS-HC has the second-best confinement effect, and CS-HC has the weakest confinement effect.

4.2. Formula Verification

Figure 13 compares the axial compressive capacities of the three types of square HSCFSTs calculated using the axial compressive capacity calculation formula and the experimental results of previous studies. In Figure 1, the average stress N/(As + Ac) is compared due to the large differences in the cross-sectional sizes of square CFST stub columns used in different axial compression tests. Table 2 shows the statistical results of the comparison between the measured bearing capacities and the bearing capacities calculated using Equation (16) or the finite element model. The bearing capacities calculated using Equation (16) or the finite element model are in good agreement with the measured bearing capacities, although the dispersion coefficient of Equation (16) is slightly larger.
At present, Eurocode 4 (EC4)-2004 [31], the British standard BS5400 [32], the Chinese standard GB50936-2014 [33], and American ACI standards [34] are the major design codes for calculating the axial compressive capacity of CFST. The applicability of the ultimate axial compressive capacities calculated by the formulas recommended in these design codes is analyzed in this paper using a bearing capacity database consisting of the experimental data from the 181 sets of CFST stub columns established in the previous section, and the relevant statistical results are shown in Table 3 and Figure 14. The average ratio of the Nu,exp to the Nu calculated based on the EC4-2004 is 0.99, with a dispersion coefficient of 0.172. The average ratio of Nu,exp to the Nu calculated based on the BS5400 is 1.39, with a dispersion coefficient of 0.142. The average ratio of Nu,exp to the Nu calculated based on the ACI standard is 1.07, with a dispersion coefficient of 0.160. The average ratio of Nu,exp to the Nu calculated based on the GB50936-2014 is 1.17, with a dispersion coefficient of 0.552. The Nu calculated based on Equation (16) is in best agreement with the Nu,exp.

5. Conclusions

(1)
A refined 3D finite element model consisting of 181 sets of axially compressed square HSCFST members is established using the unified constitutive relation of steel and concrete.
(2)
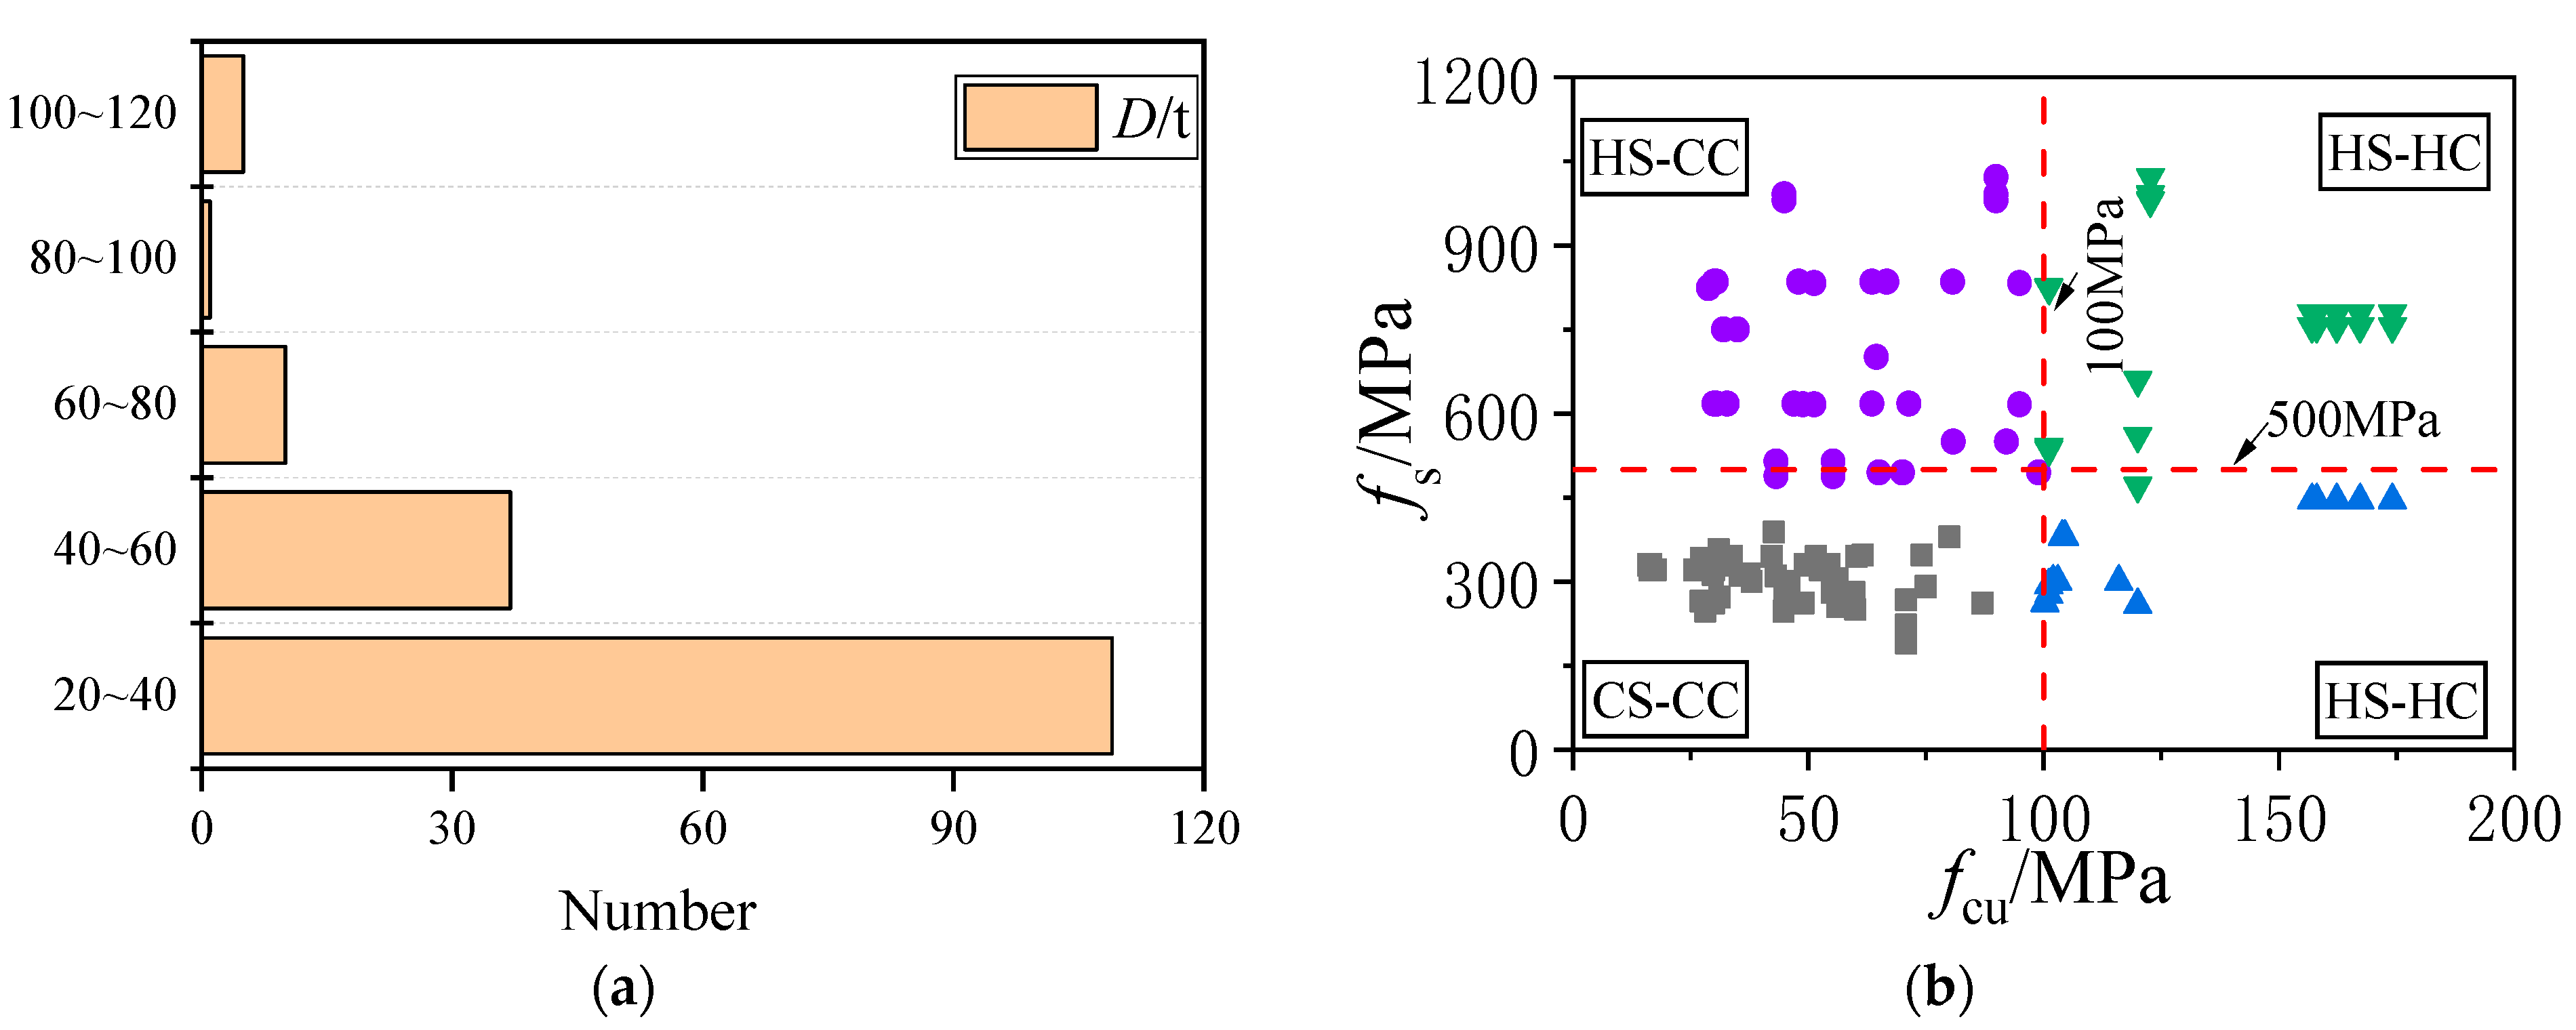
A total of 126 groups of examples were constructed to analyze the effects of the diameter-to-thickness ratio, concrete strength fcu, and steel strength fs on the bearing capacity and confinement effect of the members. Increasing the steel yield strength and reducing the concrete strength will weaken the confinement efficiency of the steel tube to the concrete. Among the four types of CFSTs, CS-CC has the strongest confinement effect, while CS-HC has the weakest confinement effect. Compared with concrete strength and the steel yield strength, the width-to-thickness ratio has a greater impact on the initial stiffness of the members. The greater the width-to-thickness ratio of a member is, the greater the initial stiffness of the member.
(3)
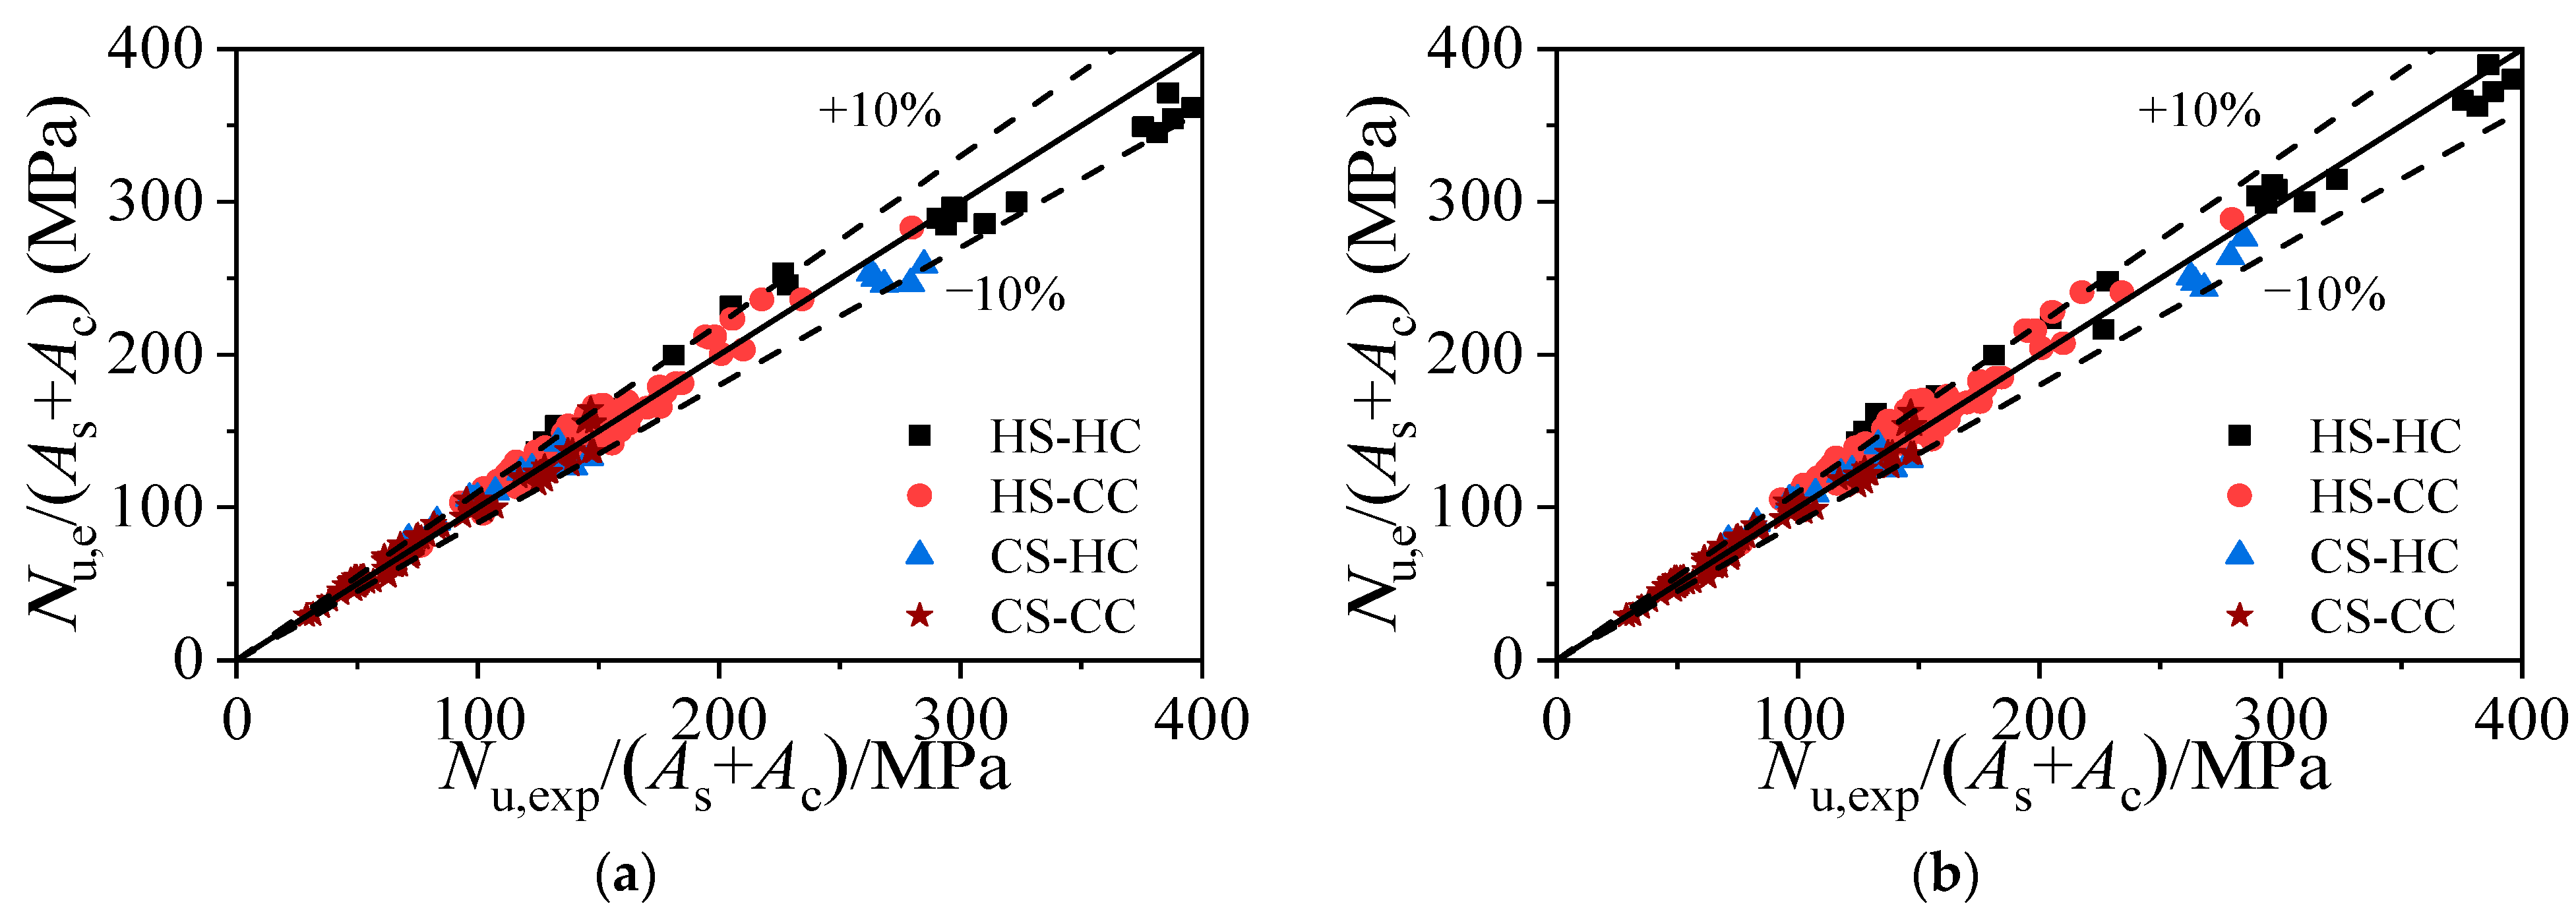
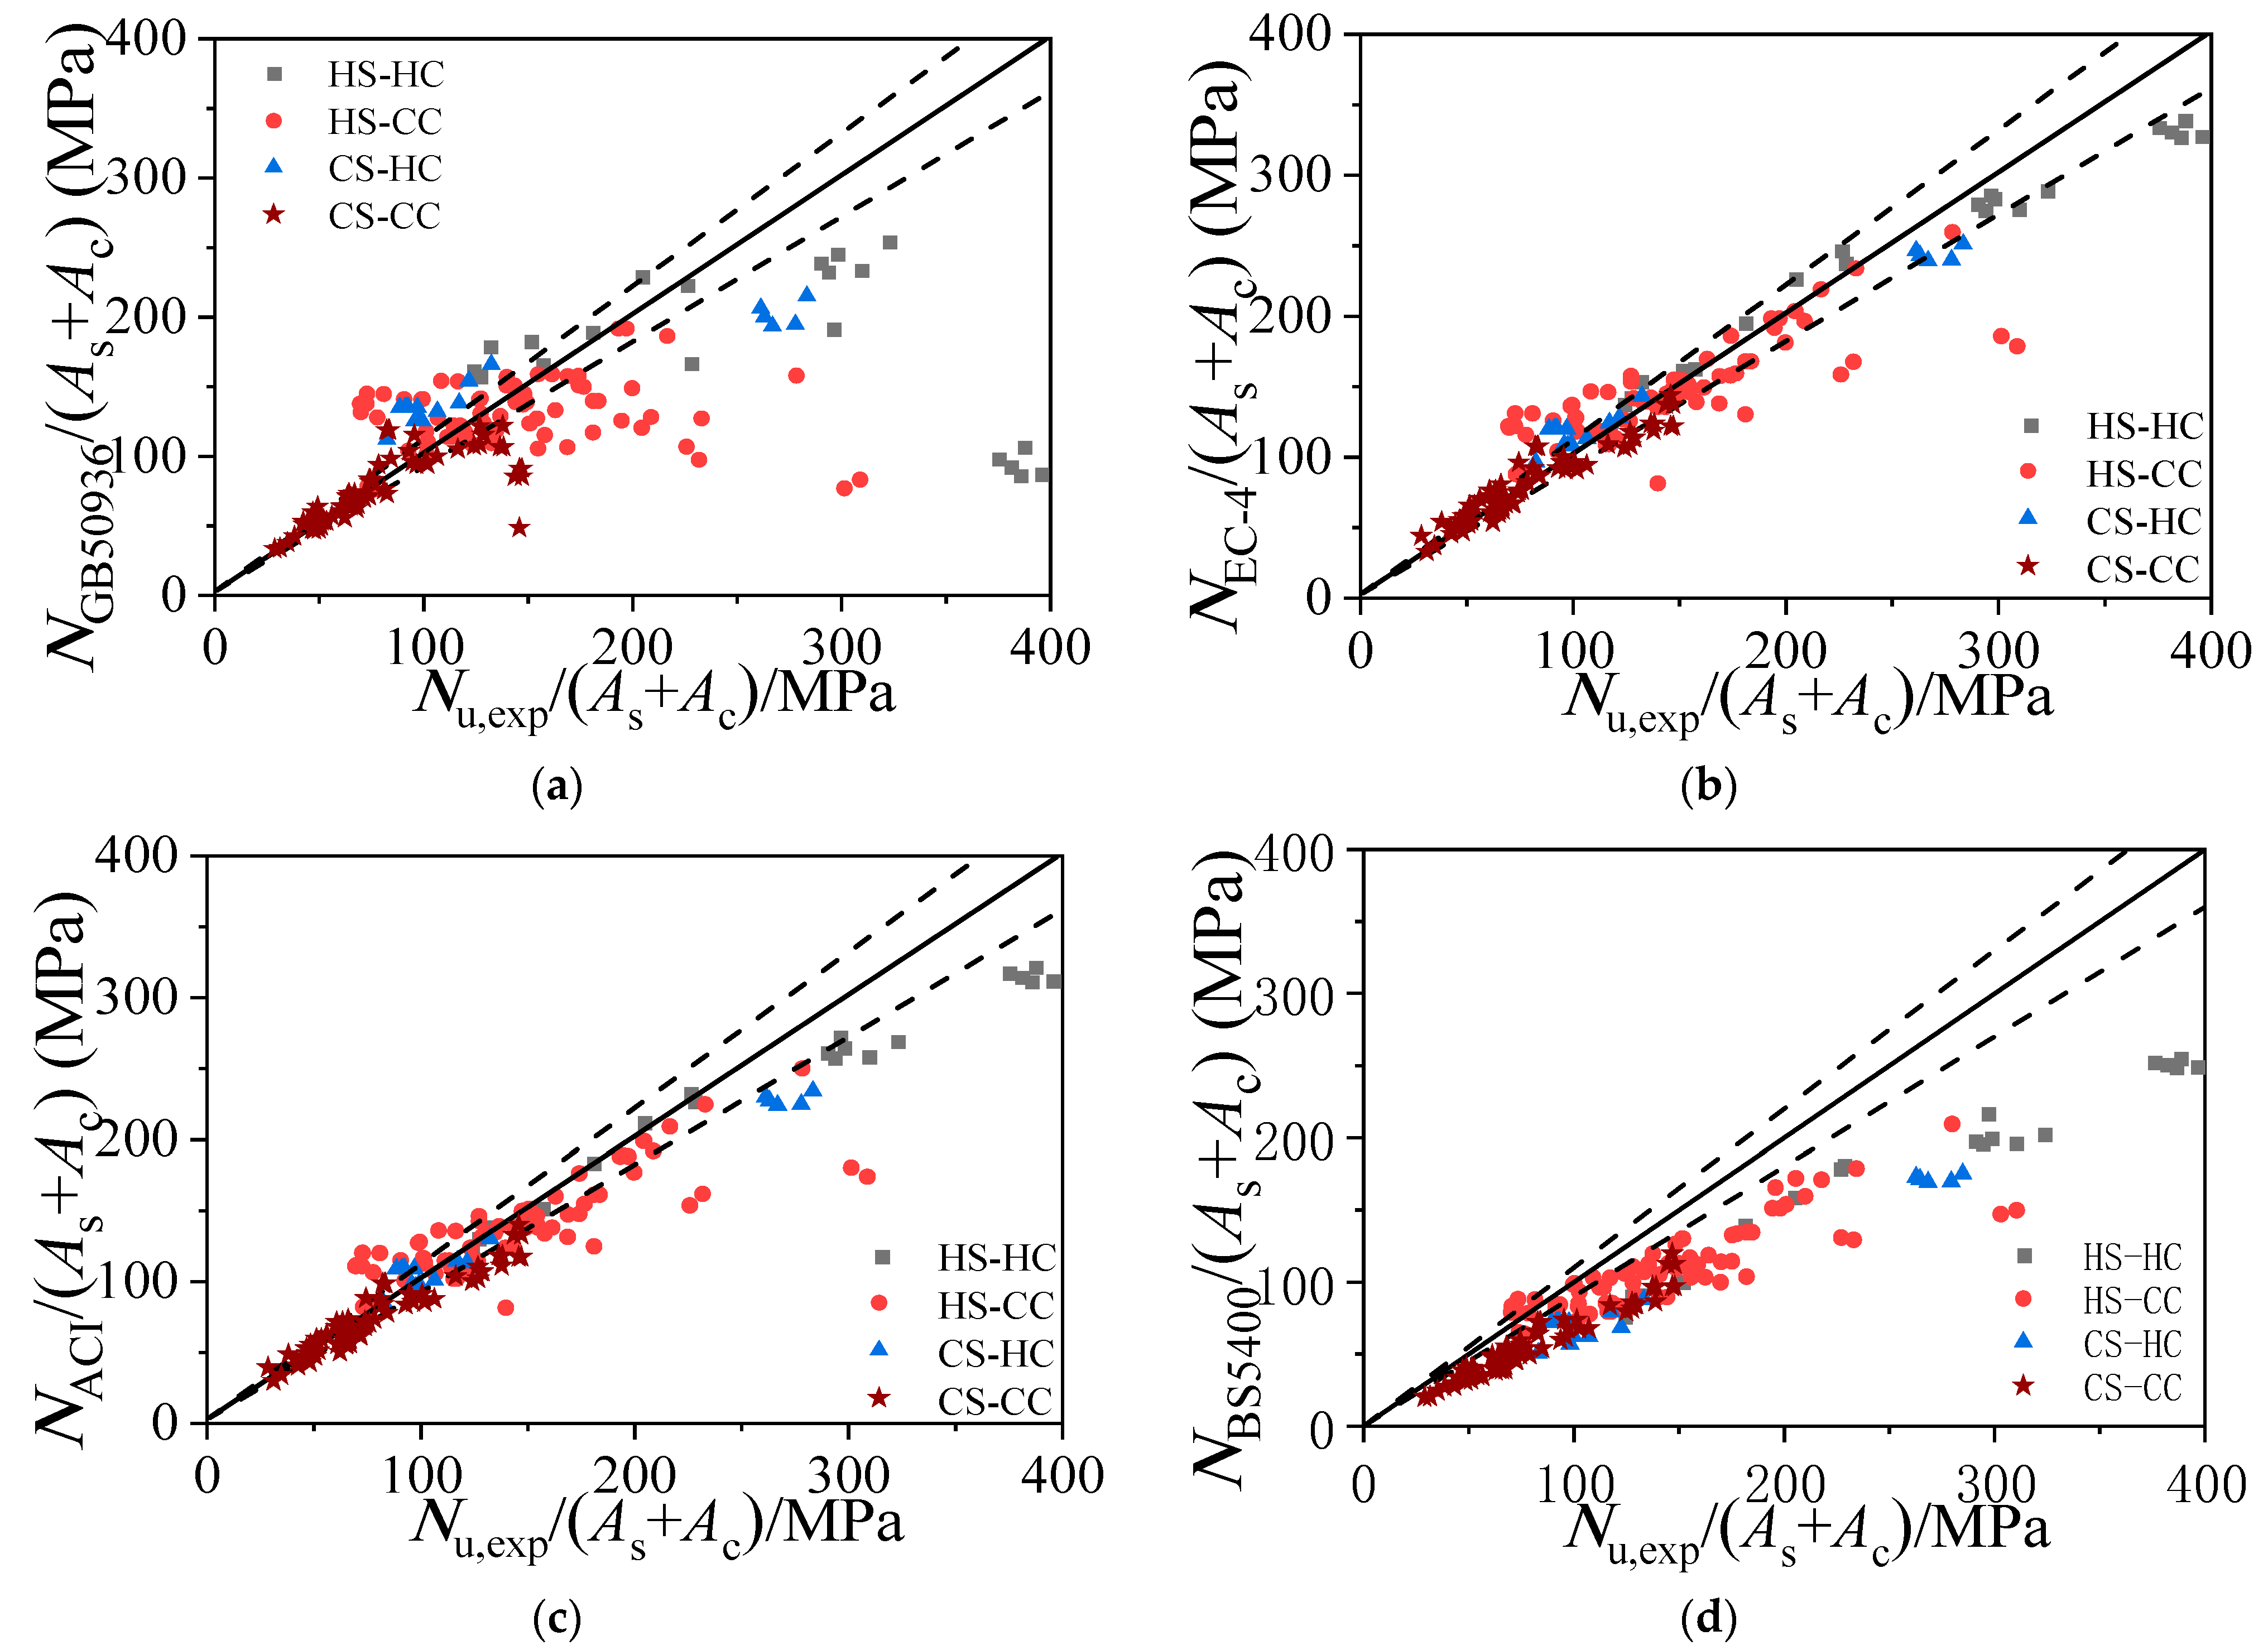
Based on the equilibrium condition, a practical formula considering the confinement coefficient for the ultimate bearing capacity of square CFST stub columns under axial loading with different material matches was proposed. The proposed formula shows a better calculation accuracy and clearer physical meaning of HSCFST compared with major code formulae.

Author Contributions

Conceptualization, B.L. and F.D.; methodology, B.L.; software, D.L. and S.H.; validation, H.W., D.L. and F.D.; formal analysis, B.L.; resources, Z.C.; data curation, S.H.; writing—original draft preparation, F.L.; writing—review and editing, D.L. All authors have read and agreed to the published version of the manuscript.

Funding

The research work was financially supported by the National Natural Science Foundation of China (Grant No. 52008400) and the Science Fund for Distinguished Young Scholars of Hunan (Grant No. 2019JJ20029).

Institutional Review Board Statement

Not applicable.

Informed Consent Statement

Not applicable.

Data Availability Statement

Not applicable.

Acknowledgments

Thanks for Testing Research Fund from Hunan Tieyuan Civil Engineering Te-sting Co., Ltd.

Conflicts of Interest

The authors declare no conflict of interest.

Appendix A

Table A1. Comparison between finite element calculation results and literature experimental results of high-strength concrete-filled square steel tube stub columns.
Specimen NumberLiteratureD × t × L/mmfcu/MPafy/MPaNu,e/kNNu,FE/kNNu,Eq/kNNu,e/Nu,FENu,e/Nu,Eq
NS1[35]186×3×5584030015551628 1694 0.96 0.92
NS7246×3×73847.530030952918 3005 1.06 1.03
NS13306×3×91847.528140034179 4281 0.96 0.93
NS16306×3×91858.7528146584985 5087 0.93 0.92
S2[36]127×4.34×609.632.535710951144 1220 0.96 0.90
S3127×4.55×609.629.7532211131189 1152 0.94 0.97
S4127×5.67×609.629.7531212021225 1310 0.98 0.92
C10K6-1-6-1[37]150×4.5×185580.00 379.81895 1758 1841 1.08 1.03
C10K6-1-6-2150×4.5×185580.00 379.81889 1758 1841 1.07 1.03
C10K6-1-6-3150×4.5×185580.00 379.81886 1758 1841 1.07 1.02
C10K6-1-6-4150×4.5×185580.00 379.81892 1758 1841 1.08 1.03
C10K6-1-6-5150×4.5×185580.00 379.81862 1758 1841 1.06 1.01
C10K6-1-6-6150×4.5×185580.00 379.81890 1758 1841 1.07 1.03
C12K6-1-6-1150×4.5×185594.00 379.82066.11935 1984 1.07 1.04
C12K6-1-6-2150×4.5×185594.00 379.82196.42017 2017 1.09 1.09
C12K6-1-6-3150×4.5×185594.00 379.82096.11935 2182 1.08 0.96
C12K6-1-6-4150×4.5×185594.00 379.82090.11935 2100 1.08 1.00
C12K6-1-6-5150×4.5×185594.00 379.82006.71935 1853 1.04 1.08
C12K6-1-6-6150×4.5×185594.00 379.82083.51935 1935 1.08 1.08
HSS1[38]110×5×3303575018361819 2024 1.01 0.91
HSS2110×5×3303575018321866 2024 0.98 0.91
HSS8160×5×48037.575028682918 3127 0.98 0.92
HSS9160×5×48037.575029222964 3220 0.99 0.91
CSC40SD8[39]150×8.275×45343.2 488.3835003326 3188 1.05 1.10
CSC50SD9150×8.275×45155.3 488.3835753518 3381 1.02 1.06
CR4-A-8[40]148×4.38×4448726221082145 2211 0.98 0.95
CR4-A-2 148×4.38×44435.426211531135 1201 1.02 0.96
CR4-A-4-1 148×4.38×44450.526214141435 1501 0.99 0.94
CR4-A-4-2148×4.38×44450.526214021435 1501 0.98 0.93
CR4-A-4-3210×5.48×6304629431832830 2961 1.10 1.07
CR4-C-4-3210×4.5×6304627727132534 2637 1.07 1.03
CR4-C-8215×4.38×64590.326238374028 4221 0.920.91
CR4-D-4-1323×4.38×64551.37526249505311 5457 0.93 0.91
CR6-A-2144×6.36×43231.7561825722615 2831 0.98 0.91
CR6-A-4-1144×6.36×43250.62561828082866 3082 0.98 0.91
CR6-A-4-2144×6.36×43250.62561827652655 2871 1.04 0.96
CR6-A-8144×6.36×4328761833993125 3342 1.09 1.02
CR6-C-2211×6.36×63331.7561839205342 5663 1.08 1.02
CR6-D-4-1319×6.36×95751.37561877807138 7630 1.09 1.02
CR6-D-4-2318×6.36×95451.37561874737108 7598 1.05 0.98
CR6-D-8319×6.36×95795.161810,35710,568 11,060 0.98 0.94
CR8-A-2120×6.47×36031.7583528192794 3039 1.01 0.93
CR8-A-4-1120×6.47×36050.62583529572971 3216 1.00 0.92
CR8-A-4-2120×6.47×36050.62583529612971 3216 1.00 0.92
CR8-A-8119×6.47×3578783533183100 3343 1.07 0.99
CR8-C-2175×6.47×52531.7583542104343 4707 0.97 0.89
CR8-C-4-2175×6.47×52550.62583545424733 5097 0.96 0.89
CR8-C-8175×6.47×5258783553665121 5485 1.05 0.98
CR8-D-2265×6.47×79531.7583565466691 7249 0.98 0.90
CR8-D-4-1264×6.47×79251.37583571177286 7841 0.98 0.91
CR8-D-4-2265×6.47×79551.37583571727303 7860 0.98 0.91
CR8-D-8265×6.47×79590.383589908613 9171 1.04 0.98
CR4-A-9211×5.48×633101.129447734552 4950 0.99 0.96
CR4-C-9211×4.5×633101.127743714282 4694 1.02 0.93
CR6-A-9211×8.83×633113.87553670087079 70080.99 0.95
CR6-C-9204×5.95×612101.154053035766 54030.92 0.90
CR8-A-4-3180×9.45×54048.87582568036640 6587 1.02 1.03
CR8-A-9180×9.45×540101.182574026786 74021.09 0.93
CR8-C-9180×6.6×540101.182458735446 58731.08 0.91
R7-1[41]106×4×3209949517491658 1739 1.05 1.01
R7-2106×4×3209949518241658 1739 1.10 1.05
R10-1140×4×4209949527522604 2712 1.06 1.01
R10-2140×4×4209949528282604 2712 1.09 1.04
R1-1120×4×3607049517011669 1760 1.02 0.97
R1-2120×4×3607049516571669 1760 0.99 0.94
R4-1130×4×3907049520201884 1984 1.07 1.02
R4-2130×4×3907049520181884 1984 1.07 1.02
R7-1106×4×3189949517491658 1739 1.05 1.01
R7-2106×4×3189949518241658 1739 1.10 1.05
R10-1140×4×4209949527522604 2712 1.06 1.01
R10-2140×4×4209949528282604 2712 1.09 1.04
A1[42]120×5.8×3609330016971566 1773 1.08 0.96
A2120×5.8×36011630019191840 2078 1.04 0.92
A3-1200×5.8×6009330039963892 4243 1.03 0.94
A3-2200×5.8×6009330038623892 4162 0.99 0.93
A9-1120×4×3606549517391609 1701 1.08 1.02
A9-2120×4×3606549517181609 1701 1.07 1.01
A12-1130×4×3906549519631814 1914 1.08 1.03
A12-2130×4×3906549519881814 1914 1.10 1.04
HSSC1[43]110×5×33064.50 7012203.00 2048 2195 1.08 1.00
HSSC2110×5×33064.50 7012234.00 2048 2195 1.09 1.02
HSSC3140×5×42064.50 7012942.00 2842 3031 1.04 0.97
HSSC4140×5×42064.50 7012840.00 2842 3031 1.00 0.94
80 × 80 × 4-C120-A 80×4×240122.70 7561504.00 1896 18981.00 1.00
80 × 80 × 4-C80-B 80×4×24089.90 102217911687 1811 1.06 0.99
80 × 80 × 4-C120-B80×4×240122.70 102218981896 18981.00 1.00
100 × 100 × 4-C40-B 100×4×299.544.90 98020091852 2003 1.08 1.00
100 × 100 × 4-C80-B 100×4×299.589.90 98021772210 2360 0.99 0.92
100 × 100 × 4-C120-B 100×4×299.5122.70 98022662431 22660.93 0.89
120 × 120 × 4-C40-B 120×4×36044.90 99125572338 2522 1.09 1.01
120 × 120 × 4-C80-B 120×4×35989.90 99128532868 3052 0.99 0.93
120 × 120 × 4-C80-B-r 120×4×35989.90 99127982868 3052 0.98 0.92
120 × 120 × 4-C120-B 120×4×360122.70 99129503089 29500.95 0.88
SC-32-80[30]305×8.9×1200120.00 56014,11614,401 14,1160.98 0.93
SC-48-80305×6.1×1200120.00 66012,30712,749 12,3070.97 0.86
SC-32-46305×8.6×1200120.00 25911,39010,942 11,999 1.04 0.95
SC-48-46305×5.8×1200120.00 47111,56811,138 11,5681.04 0.91
S1[44]150×8×450162.30 77965366510 65361.00 0.99
S2150×8×450167.20 77967156358 67151.06 1.00
S3150×8×450157.00 77966166867 66160.96 1.02
S4150×8×450174.10 77972767557 72760.96 1.06
S5150×8×450158.00 77969746532 69741.07 1.07
S6150×12×450162.30 75685857765 85851.10 1.08
S7150×12×450167.20 75684527850 84521.08 1.06
S8150×12×450157.00 75686877674 86871.03 1.10
S9150×12×450174.10 75687308723 87301.00 1.07
S10150×12×450158.00 75689128135 89121.10 1.00
S11150×12.5×450162.30 44659536355 6049 0.94 0.98
S12150×12.5×450167.20 44659116439 5703 0.92 1.04
S13150×12.5×450157.00 44660396265 6572 0.96 0.92
S14150×12.5×450174.10 44664096557 6557 0.98 0.98
S15150×12.5×450158.00 44662856282 5976 1.00 1.05
C1-1[45]100.3×4.18×30080.80 55014901464 1552 1.02 0.96
C1-2101.5×4.18×30080.80 55015351504 1593 1.02 0.96
C2-1101.2×4.18×30092.10 55017401601 1691 1.09 1.03
C2-2100.7×4.18×30092.10 55017751587 1676 1.12 1.06
C3182.8×4.18×54080.80 55035903727 3890 0.96 0.92
C4181.8×4.18×54092.10 55042104028 4191 1.05 1.00
C5-1120.7×4.18×36080.80 55014501462 1550 0.99 0.94
C5-2119.3×4.18×36080.80 55014251454 1543 0.98 0.92
C6-1119.6×4.18×36092.10 55015601546 1635 1.01 0.95
C6-2120.5×4.18×36092.10 55017001556 1645 1.09 1.03
C7-1179.7×4.18×54080.80 55025302703 2838 0.94 0.89
C8-1180.4×4.18×54092.10 55029702897 3031 1.03 0.98
C9-2160.7×4.18×48080.80 55018201852 1959 0.98 0.93
C10-1160.1×4.18×48092.10 55018801976 2083 0.95 0.90
C10-2160.6×4.18×48092.10 55021001966 2073 1.07 1.01
C12-1199.2×4.18×60092.10 55029002801 2936 1.04 0.99
C12-2199.8×4.18×60092.10 55028002759 2893 1.01 0.97

References

  1. Han, L.H.; Li, W.; Bjorhovde, R. Developments and advanced applications of concrete-filled steel tubular (CFST) structures: Members. J. Constr. Steel Res. 2014, 100, 211–228. [Google Scholar] [CrossRef]
  2. Ralston, M.; Korman, R. Composite System Stiffened with 19000-psiMix. Eng. News Rec. 1989, 222, 44–53. [Google Scholar]
  3. Abed, F.; Alhamaydeh, M.; Abdalla, S. Experimental and numerical investigations of the compressive behavior of concrete filled steel tubes (CFSTs). J. Constr. Steel Res. 2013, 80, 429–439. [Google Scholar] [CrossRef]
  4. Uy, B. Local and post-local buckling of concrete filled steel welded box columns. J. Constr. Steel Res. 2018, 47, 47–72. [Google Scholar] [CrossRef]
  5. Bradford, M.A.; Loh, H.Y.; Uy, B. Slenderness limits for filled circular steel tubes. J. Constr. Steel Res. 2002, 58, 243–252. [Google Scholar] [CrossRef]
  6. Yu, Z.; Ding, F.; Cai, C.S. Experimental behavior of circular concrete-filled steel tube stub columns. J. Constr. Steel Res. 2007, 63, 165–174. [Google Scholar] [CrossRef]
  7. Aboutaha, R.; Machado, R. Seismic resistance of steel-tubed high-strength reinforced-concrete columns. J. Struct. Eng. 1999, 125, 485–494. [Google Scholar] [CrossRef]
  8. Han, L.H.; Huo, J.S.; Yang, Y.F. Concrete-filled HSS columns after exposure to the Iso-834 standard fire. Adv. Steel Constr. 2002, 2, 1127–1134. [Google Scholar]
  9. Chen, M.; Lin, B.; Huang, H. Research on the Bearing Capacity of Corroded Circular Concrete Filled Steel Tubular Short Columns. Prog. Steel Build. Struct. 2018, 20, 73–81. [Google Scholar]
  10. Zhong, S.T. Comparison of behaviors and economics for concrete-filled steel tube with circular and square cross-sections. NCREE 2003, 20, 199–206. [Google Scholar]
  11. Ding, F.X.; Lu, D.R.; Bai, Y.; Zhou, Q.S.; Ni, M.; Yu, Z.W.; Jiang, G.S. Comparative study of square stirrup-confined concrete-filled steel tubular stub columns under axial loading. Thin-Walled Struct. 2016, 98, 443–453. [Google Scholar] [CrossRef]
  12. Patel, V.I.; Hassanein, M.F.; Thai, H.T.; Abadi, H.A.; Elchalakani, M.; Bai, Y. Ultra-high strength circular short CFST columns: Axisymmetric analysis, behaviour and design. Eng. Struct. 2019, 179, 268–283. [Google Scholar] [CrossRef]
  13. Ekmekyapar, T.; AL-Eliwi, B.J.M. Experimental behaviour of circular concrete filled steel tube columns and design specifications. Thin-Walled Struct. 2016, 105, 220–230. [Google Scholar] [CrossRef]
  14. Sojobi, A.O.; Aladegboye, O.J.; Awolusi, T.F. Green interlocking paving units. Constr. Build. Mater. 2018, 173, 600–614. [Google Scholar] [CrossRef]
  15. Tys, A.; Kai, X.B. Performance of axially-loaded concrete-filled steel tubular circular columns using ultra-high strength concrete. Structures 2020, 24, 163–176. [Google Scholar]
  16. Jin, L.; Fan, L.; Li, D.; Du, X. Size effect of square concrete-filled steel tubular columns subjected to lateral shear and axial compression: Modelling and formulation. Thin-Walled Struct. 2020, 157, 107158. [Google Scholar] [CrossRef]
  17. Yin, F.; Zhang, J.; Xu, P. Summary of Research on Concrete Filled Steel Tubular (CFST) Columns. Adv. Mater. Res. 2012, 594–597, 891–895. [Google Scholar] [CrossRef]
  18. Yan, Y.; Xu, L.; Li, B.; Chi, Y.; Yu, M.; Zhou, K.; Song, Y. Axial behavior of ultra-high performance concrete (UHPC) filled stocky steel tubes with square sections. J. Constr. Steel Res. 2019, 158, 417–428. [Google Scholar] [CrossRef]
  19. Lai, Z.; Varma, A.H. High-strength rectangular CFT members: Database, modeling, and design of short columns. J. Struct. Eng. 2018, 144, 04018036. [Google Scholar] [CrossRef]
  20. Cai, Y.; Su, M.; Chen, X.; Young, B. High strength steel square and rectangular tubular stub columns infilled with concrete. J. Constr. Steel Res. 2021, 179, 106536. [Google Scholar] [CrossRef]
  21. Ding, F.; Cao, Z.; Lyu, F.; Huang, S.; Hu, M.; Lin, Q. Practical design equations of the axial compressive capacity of circular CFST stub columns based on finite element model analysis incorporating constitutive models for high-strength materials. Case Stud. Constr. Mater. 2022, 16, e01115. [Google Scholar] [CrossRef]
  22. Ding, F.; Wu, X.; Xiang, P.; Yu, Z. New Damage Ratio Strength Criterion for Concrete and Lightweight Aggregate Concrete. ACI Struct. J. 2021, 118, 165–178. [Google Scholar]
  23. Hassanein, M.F. Numerical modelling of concrete-filled lean duplex slender stainless steel tubular stub columns. J. Constr. Steel Res. 2010, 66, 1057–1068. [Google Scholar] [CrossRef]
  24. Lu, D.R.; Wang, W.J.; Ding, F.; Liu, X.M.; Fang, C.J. The impact of stirrups on the composite action of concrete-filled steel tubular stub columns under axial loading. Structures 2021, 30, 786–802. [Google Scholar] [CrossRef]
  25. Ding, F.; Wang, W.; Lu, D.; Liu, X. Study on the behavior of concrete-filled square double-skin steel tubular stub columns under axial loading. Structures 2020, 23, 665–676. [Google Scholar] [CrossRef]
  26. Xu, Y. Confinement effect and efficiency of concentrically loaded RACFCST stub columns. Materials 2021, 15, 154. [Google Scholar]
  27. Ding, F.; Zhu, J.; Cheng, S.; Liu, X. Comparative study of stirrup-confined circular concrete-filled steel tubular stub columns under axial loading. Thin-Walled Struct. 2018, 123, 294–304. [Google Scholar] [CrossRef] [Green Version]
  28. Xiong, M.X.; Xiong, D.X.; Liew, J. Axial performance of short concrete filled steel tubes with high- and ultra-high- strength materials. Eng. Struct. 2017, 136, 494–510. [Google Scholar] [CrossRef]
  29. Varma, A.H.; Sause, R.; Ricles, J.M.; Li, Q. Development and validation of fiber model for high-strength square concrete-filled steel tube beam-columns. ACI Struct. J. 2005, 102, 73–84. [Google Scholar]
  30. Sojobi, A.O.; Liew, K.M. Flexural behaviour and efficiency of CFRP-laminate reinforced recycled concrete beams: Optimization using linear weighted sum method. Compos. Struct. 2021, 260, 113259. [Google Scholar] [CrossRef]
  31. BS EN 1994-1-1:2004 Eurocode 4; Design of Composite Steel and Concrete Structures General Rules and Rules for Buildings. British Standards Institution: London, UK, 2004; pp. 1–121.
  32. BS 5400-5:2005; Steel, Concrete and Composite Bridges. Part 5: Code of Practice for Design of Composite Bridges. British Standards Institution: London, UK, 2005; pp. 1–48.
  33. GB 50936-2014; Technical Code for Concrete Filled Steel Tubular Structures. China Architecture & Building Press: Beijng, China, 2014; pp. 1–184.
  34. American Concrete Institute. Commentary on Building Code Requirements for Structural Concrete (ACI 318R-14); ACI: Detroit, MI, USA, 2011; pp. 1–524. [Google Scholar]
  35. Uy, B. Axial compressive strenth of short steel and composite columns fabricated with high strength steel plate. Steel Compos. Struct. 2001, 1, 171–185. [Google Scholar] [CrossRef]
  36. Schneider, S.P. Axially loaded concrete-filled steel tubes. J. Struct. Eng. 1999, 124, 1125–1138. [Google Scholar] [CrossRef]
  37. Lue, D.M.; Liu, J.; Yen, T. Experimental study on rectangular CFT columns with high-strength concrete. J. Constr. Steel Res. 2007, 63, 37–44. [Google Scholar] [CrossRef]
  38. Uy, B. Strength of short concrete filled high strength steel box columns. J. Constr. Steel Res. 2001, 57, 113–134. [Google Scholar] [CrossRef]
  39. Du, Y.; Chen, Z.; Liewc, J.Y.R.; Xiong, M. Rectangular concrete-filled steel tubular beam-columns using high-strength steel: Experiments and design. J. Constr. Steel Res. 2017, 131, 1–18. [Google Scholar] [CrossRef]
  40. Sakino, K.; Nakahara, H.; Morino, S. Behavior of Centrally Loaded Concrete-Filled Steel-Tube Short Columns. J. Struct. Eng. 2004, 130, 180–188. [Google Scholar] [CrossRef]
  41. Liu, D. Tests on high-strength rectangular concrete-filled steel hollow section stub columns. J. Constr. Steel Res. 2005, 61, 902–911. [Google Scholar] [CrossRef]
  42. Liu, D.; Gho, W.M. Axial load behaviour of high-strength rectangular concrete-filled steel tubular stub columns. Thin-Walled Struct. 2005, 43, 1131–1142. [Google Scholar] [CrossRef]
  43. Aslani, F.; Uy, B.; Tao, Z.; Mashiri, F. Behaviour and design of composite columns incorporating compact high-strength steel plates. J. Constr. Steel Res. 2015, 107, 94–110. [Google Scholar] [CrossRef]
  44. Xiong, M.; Xiong, D.; RichardLiew, J.Y. Behaviour of steel tubular members infilled with ultra high strength concrete. J. Constr. Steel Res. 2017, 138, 168–183. [Google Scholar] [CrossRef]
  45. Liu, D.; Gho, W.M.; Yuan, J. Ultimate capacity of high-strength rectangular concrete-filled steel hollow section stub columns. J. Constr. Steel Res. 2003, 59, 1499–1515. [Google Scholar] [CrossRef]
Figure 1. Uniaxial stress–strain curve of steel with or without yield plateau.
Materials 15 04313 g001
Figure 2. Schematic diagram of model unit.
Materials 15 04313 g002
Figure 3. Mesh size selection and schematic view of the FE model.
Materials 15 04313 g003
Figure 4. Distribution of test data of CFST stub columns. (a) Diameter-to-thickness ratio distribution of steel tube. (b) Different material matches distribution.
Materials 15 04313 g004
Figure 5. Comparison of FE and experimental load–strain curves of HSCFST. (a) Test-SST1-A [27]; (b) Test-80804-C40-A [20]; (c) Test-1201204-C120-B [20]; (d) Test-S1 [28]; (e) Test-SC-32-80 [29]; (f) Test- SC-32-46 [29].
Materials 15 04313 g005
Figure 6. Influence of concrete strength on the load–strain curve.
Materials 15 04313 g006
Figure 7. Influence of steel yield strength on the load–strain curve.
Materials 15 04313 g007
Figure 8. This is a figure. Schemes follow the same formatting.
Materials 15 04313 g008
Figure 9. Comparison of axial compressive properties between high-strength specimen and ordinary specimen.
Materials 15 04313 g009
Figure 10. Simplified stress distribution model at the mid-height section of CFST stub columns.
Materials 15 04313 g010
Figure 11. Average ratio of longitudinal stress to yield strength of a high-strength steel tube.
Materials 15 04313 g011aMaterials 15 04313 g011b
Figure 12. Average ratio of circumferential stress to yield strength of a high-strength steel tube.
Materials 15 04313 g012
Figure 13. Comparison of experimental results with Equation (16) and FE, respectively. (a) Comparison of average ultimate stress from test and Equation (16). (b) Comparison of average ultimate stress from test and FE.
Materials 15 04313 g013
Figure 14. This is a figure. Schemes follow the same formatting. (a) Comparison of ultimate bearing stress obtained from test results and GB50936. (b) Comparison of ultimate bearing stress obtained from test results and EC4. (c) Comparison of ultimate bearing stress obtained from test results and ACI. (d) Comparison of ultimate bearing stress obtained from test results and BS5400.
Materials 15 04313 g014
Table 1. Model parameter matching table.
TypesfsfcLBDtD/tL/D
CS-CC2353015005005003167500
CS-CC60500500683
CS-CC905005001050
CS-HC1205005003167
CS-HC150500500683
CS-HC1805005001050
CS-CC3453015005005003167500
CS-CC60500500683
CS-CC905005001050
CS-HC1205005003167
CS-HC150500500683
CS-HC1805005001050
CS-CC4603015005005003167500
CS-CC60500500683
CS-CC905005001050
CS-HC1205005003167
CS-HC150500500683
CS-HC1805005001050
HS-CC5503015005005003167500
HS-CC60500500683
HS-CC905005001050
HS-HC1205005003167
HS-HC150500500683
HS-HC1805005001050
HS-CC6903015005005003167500
HS-CC60500500683
HS-CC905005001050
HS-HC1205005003167
HS-HC150500500683
HS-HC1805005001050
HS-CC8003015005005003167500
HS-CC60500500683
HS-CC905005001050
HS-HC1205005003167
HS-HC150500500683
HS-HC1805005001050
HS-CC9603015005005003167500
HS-CC60500500683
HS-CC905005001050
HS-HC1205005003167
HS-HC150500500683
HS-HC1805005001050
Table 2. Parameter value and comparison of steel constitutive model.
Match TypeFormulaαβKQuantityEquation (16)FE
AverageDispersionAverageDispersion
CS-CCNu = fcAc + KfsAs0.960.191.20741.020.0831.080.043
HS-CC0.870.211.14680.960.0830.980.062
HS-HC0.950.101.07201.030.0801.020.061
CS-HC0.970.071.06191.000.0910.990.058
total 1.000.0651.020.038
Table 3. Summary of available formulas in well-known national codes.
ReferenceFormulasAverage Values
(Nu,exp/Nu,ref)
Dispersion Coefficient
(Nu,exp/Nu,ref)
CS-
CC
HS-
CC
CS-
HC
HS-
HC
TotalCS-
CC
HS-
CC
CS-
HC
HS-
HC
Total
GB50936
(2014)
N 0 = ( 1 . 212 + B θ + C θ 2 ) f c A s c θ = A s A c f f c 1.061.170.911.841.170.3000.4730.2960.7330.552
EC4
(2004)
N E C 4 = η a A s f y + A c f c ( 1 + η c t D f y f c ) η a = 0.25 ( 3 + 2 λ ¯ ) 1 . 0 , η c = 4.9 18.5 λ ¯ + 17 λ ¯ 2 1.0 ; λ ¯ = N p l , R k N c r , N p l , R k = A s f y + A c f c N c r = π 2 ( E s I s + 0 . 6 E c I c ) L 2 0.991.000.93 1.030.990.1310.1250.1390.1040.172
BS 5400
(1979)
N u = A s f y / γ s + 0.675 f c u A c / γ c 1.431.321.511.101.390.0760.1760.1110.1110.142
ACI-318
(2011)
N A C I = A s f y + 0.85 f c A c 1.071.071.031.101.070.1240.2010.1270.0920.160
Publisher’s Note: MDPI stays neutral with regard to jurisdictional claims in published maps and institutional affiliations.

