
A Comprehensive Study of a Novel Explosively Hardened Pure Titanium Alloy for Medical Applications
 , , ,
, , ,  , , and
Abstract
:1. Introduction
2. Material and Research Methodology
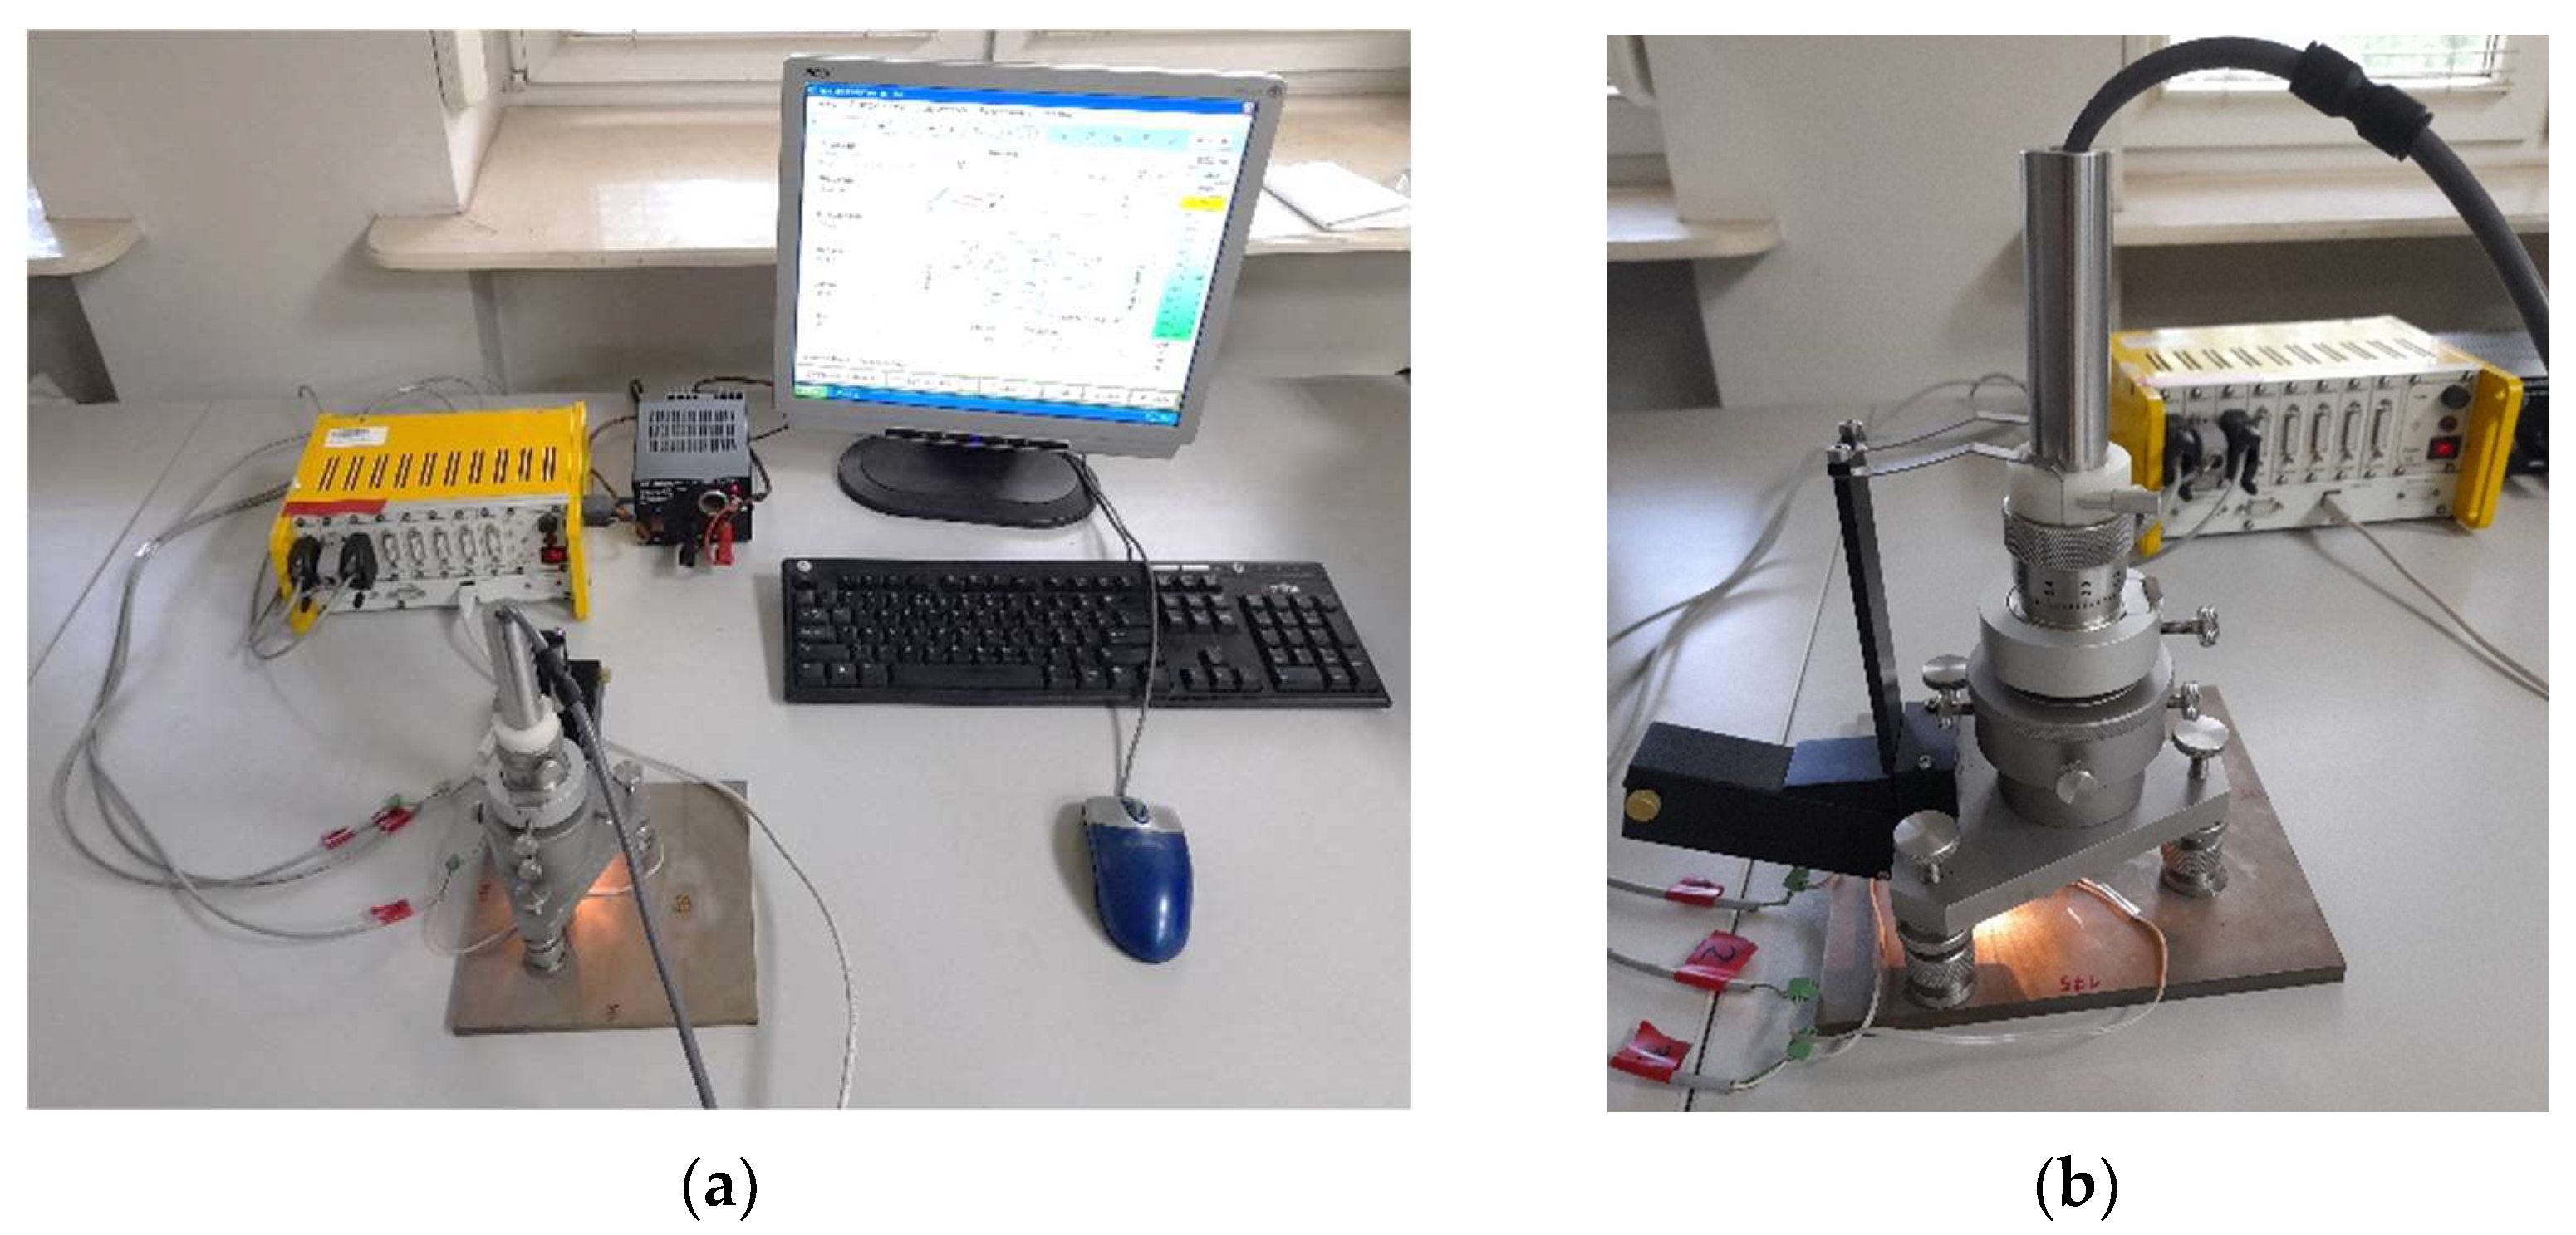
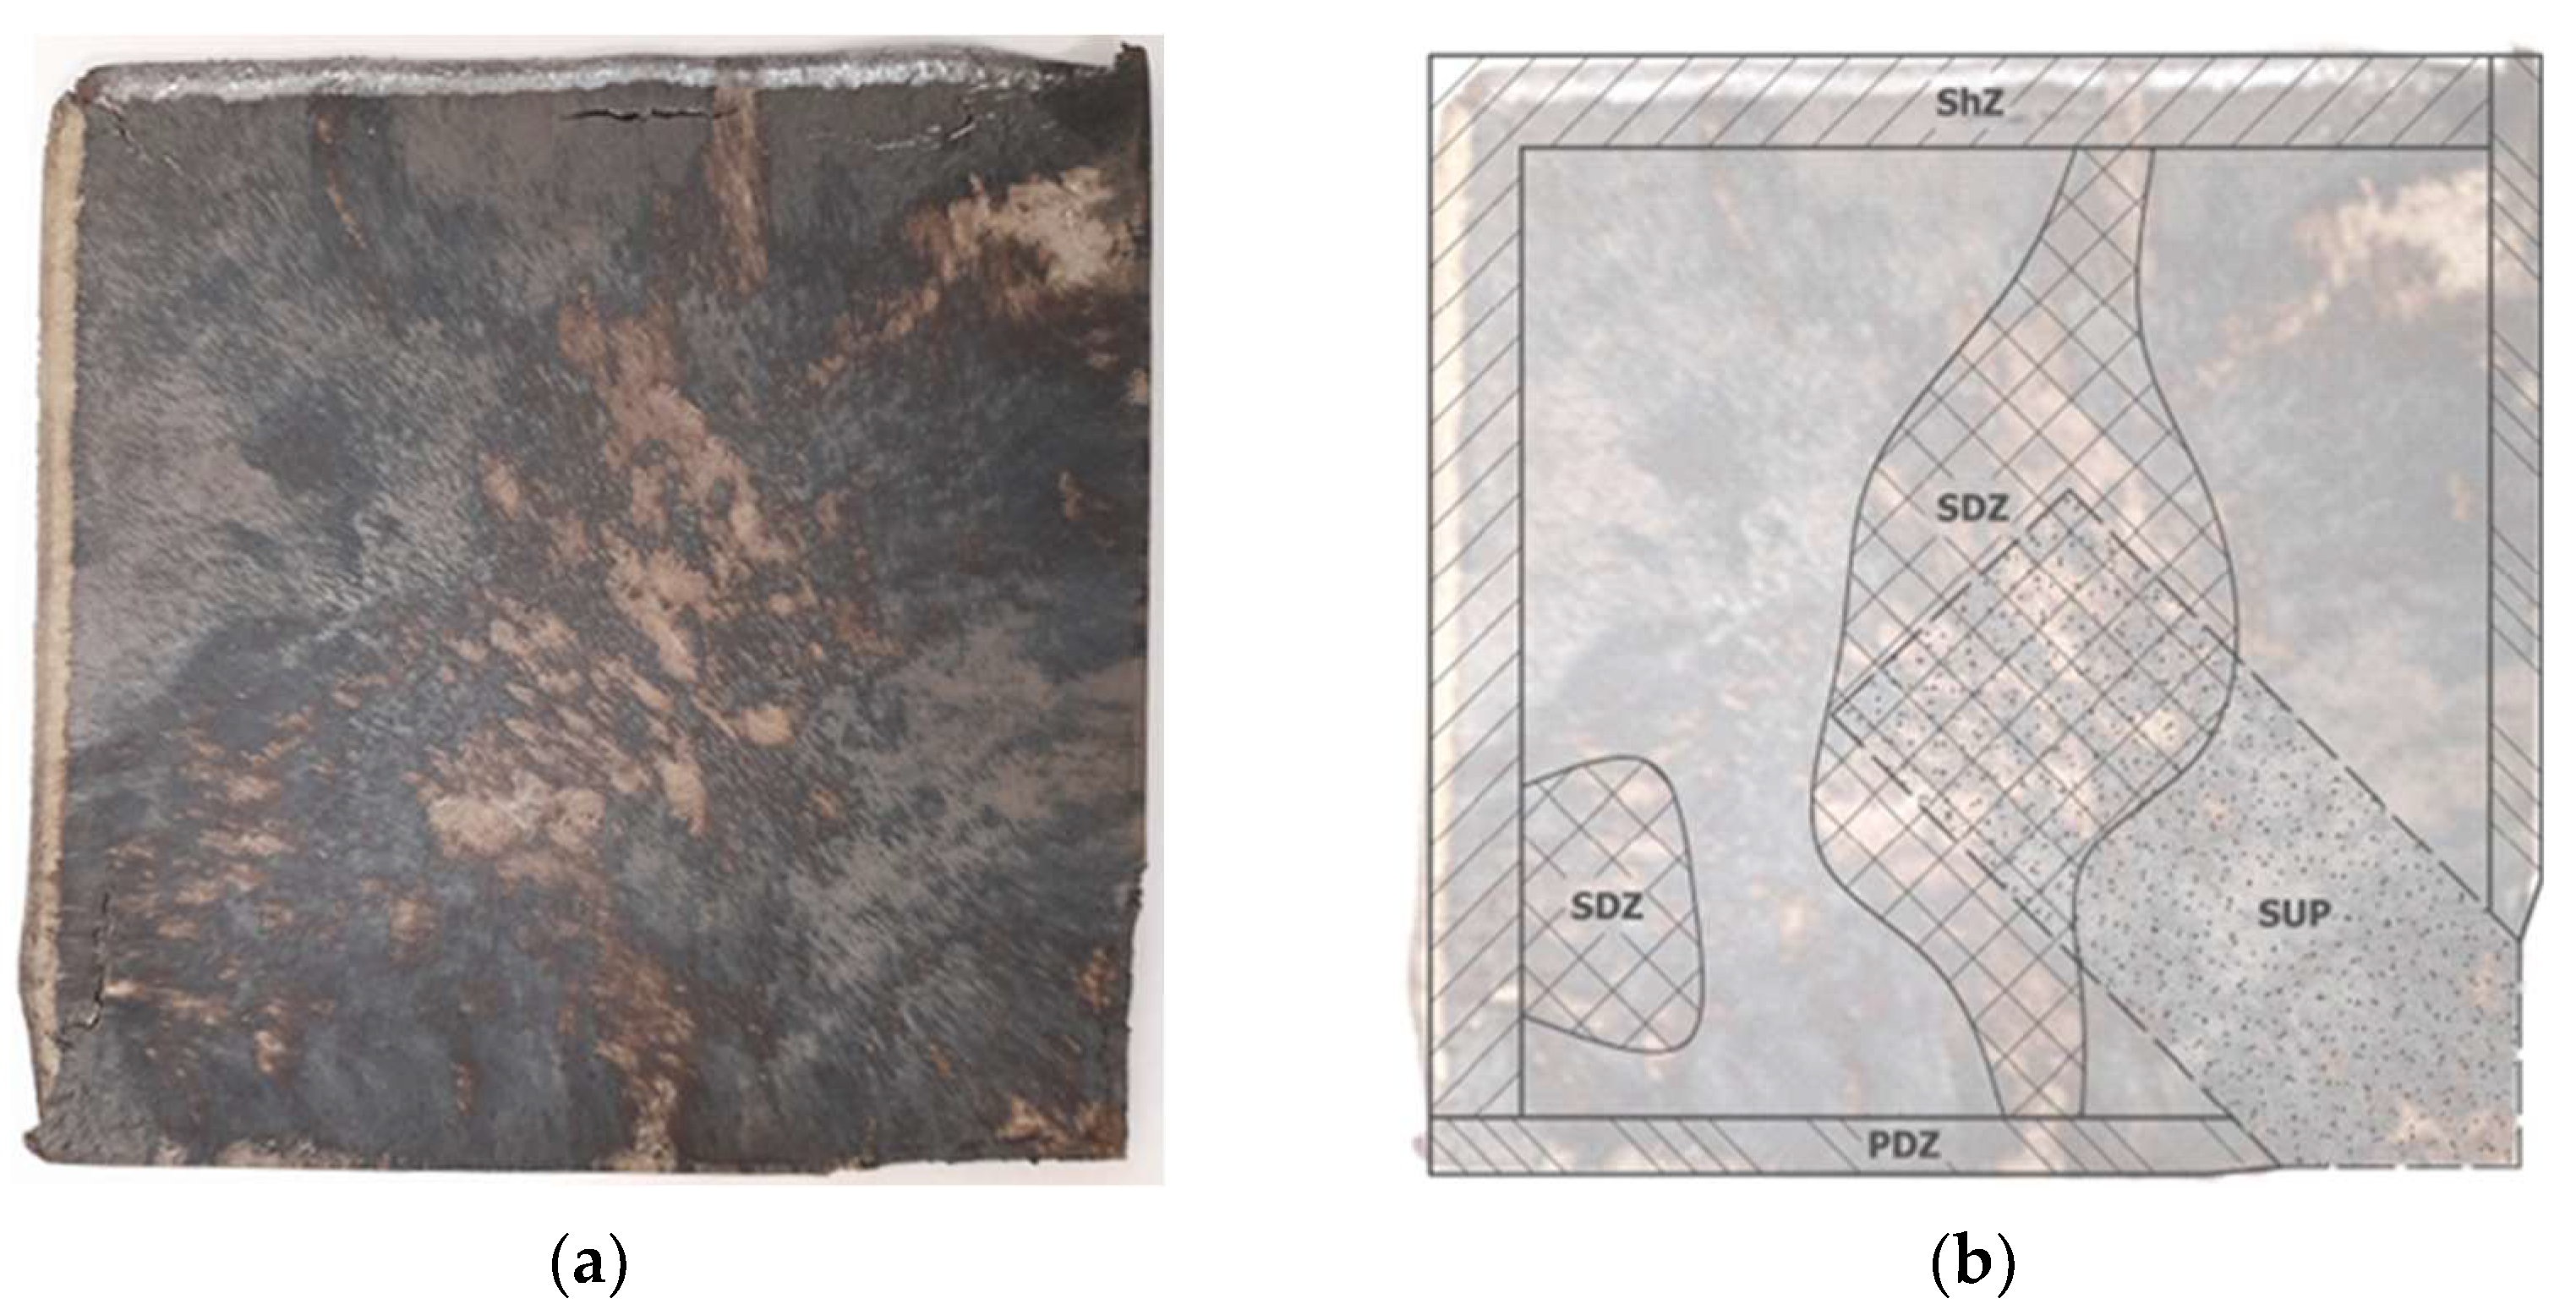
2.1. Sample Preparation
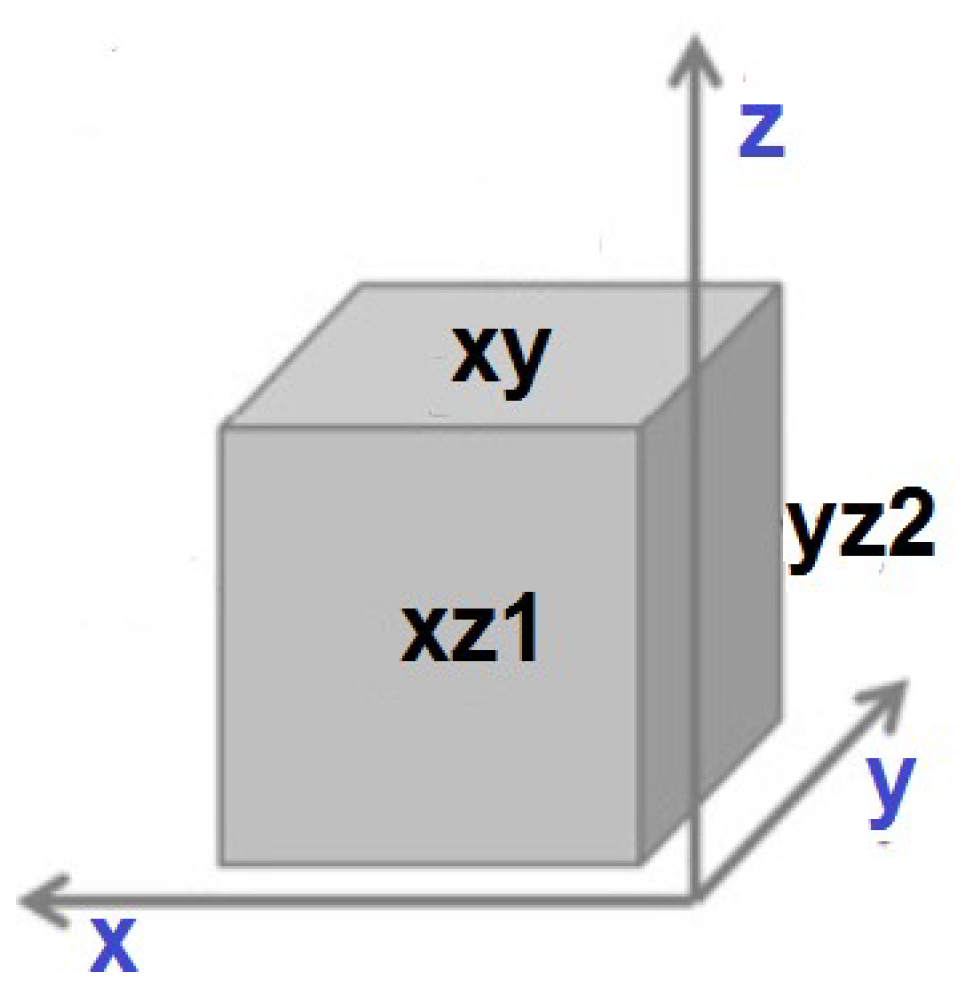
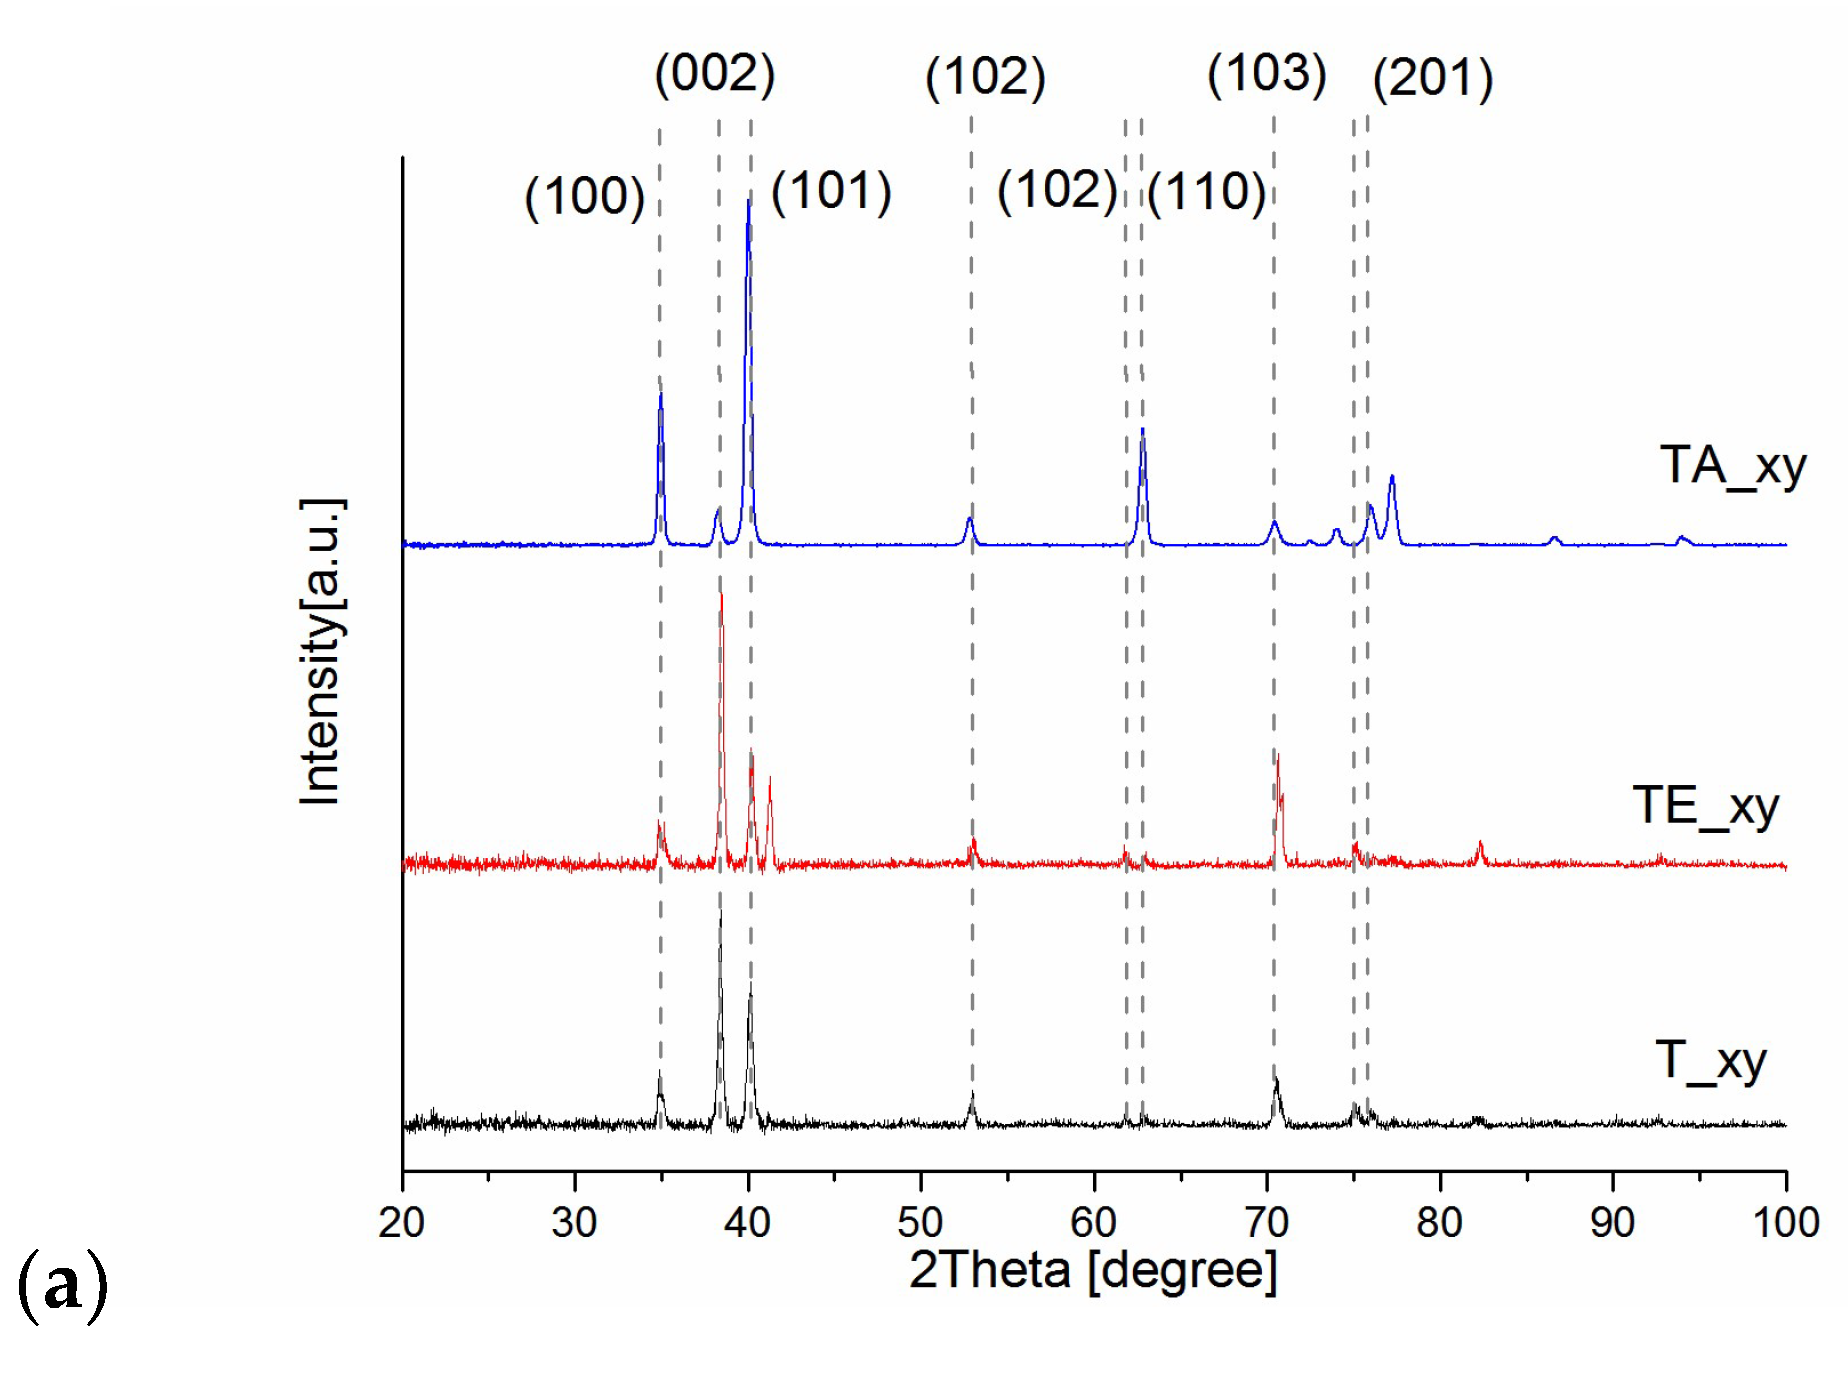
2.2. WAXS Investigation
2.3. Mechanical Properties—Low Cycle Fatigue Test
2.4. Mechanical Properties—Residual Stresses
2.5. Corrosion
3. Cellular Studies
3.1. Materials
3.2. Cytotoxicity on Extracts
3.3. Cell Adhesion and Proliferation Study in Direct Contact
3.4. ECM Secretion Tests in Direct Contact
3.5. Direct Red 80—Collagen Deposit Detection
3.6. Alizarin Red—Calcium Deposit Detection
4. Research Results
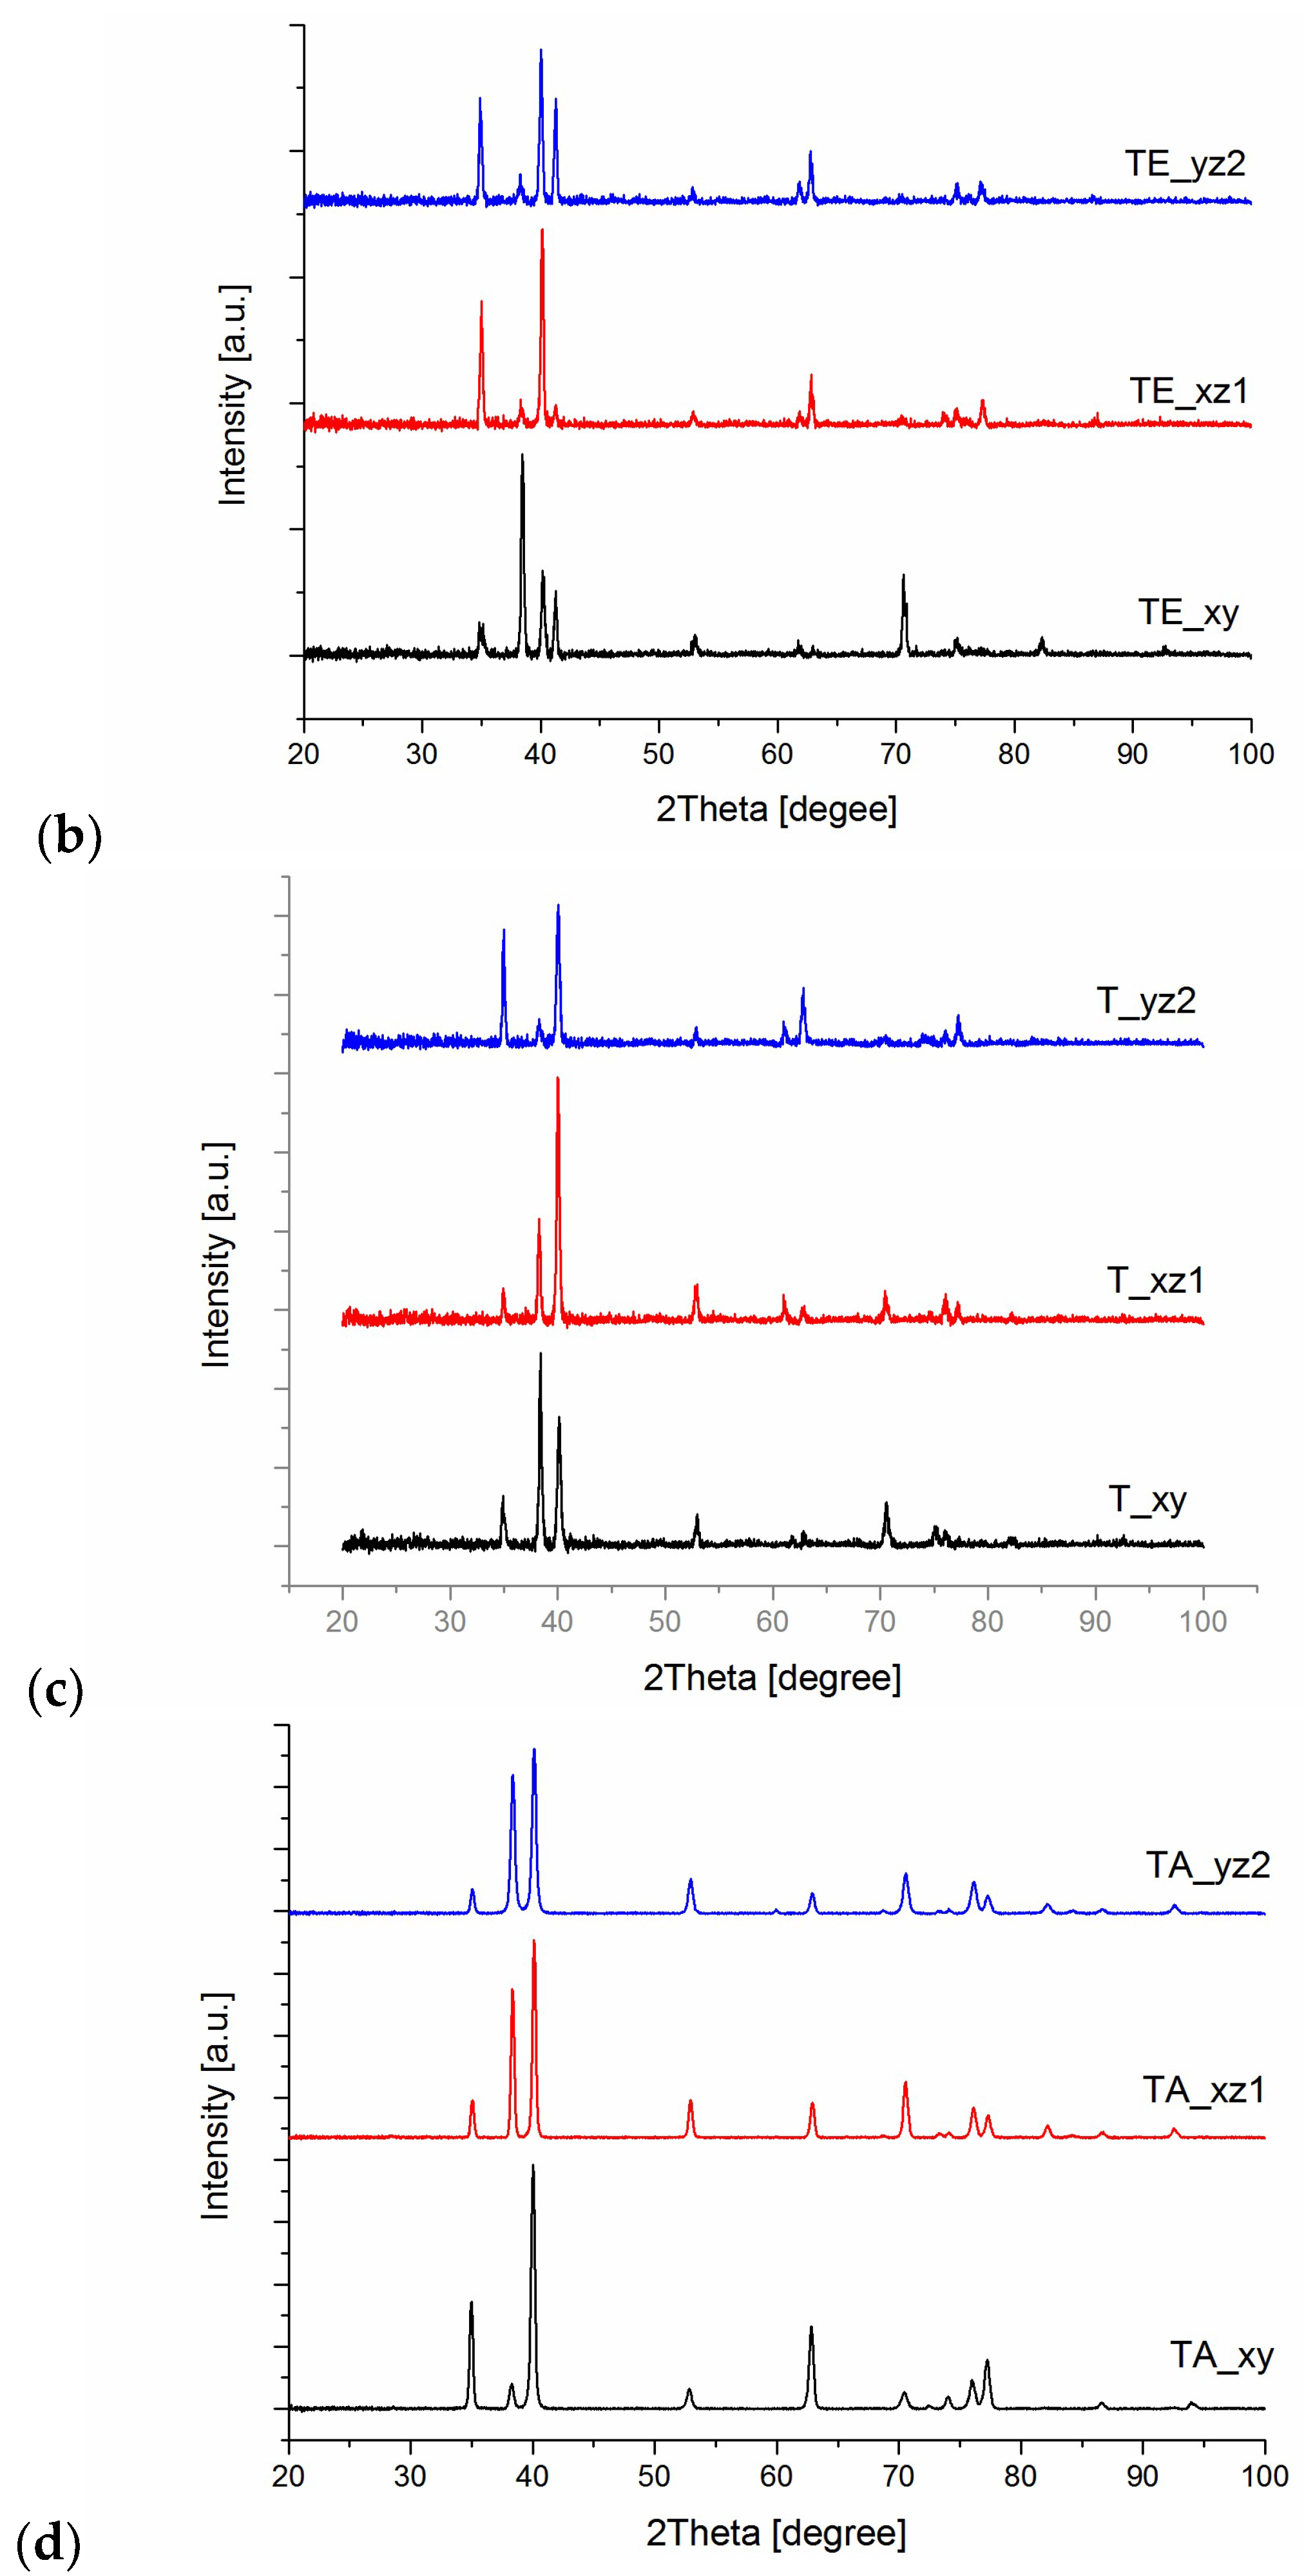
4.1. WAXS Results
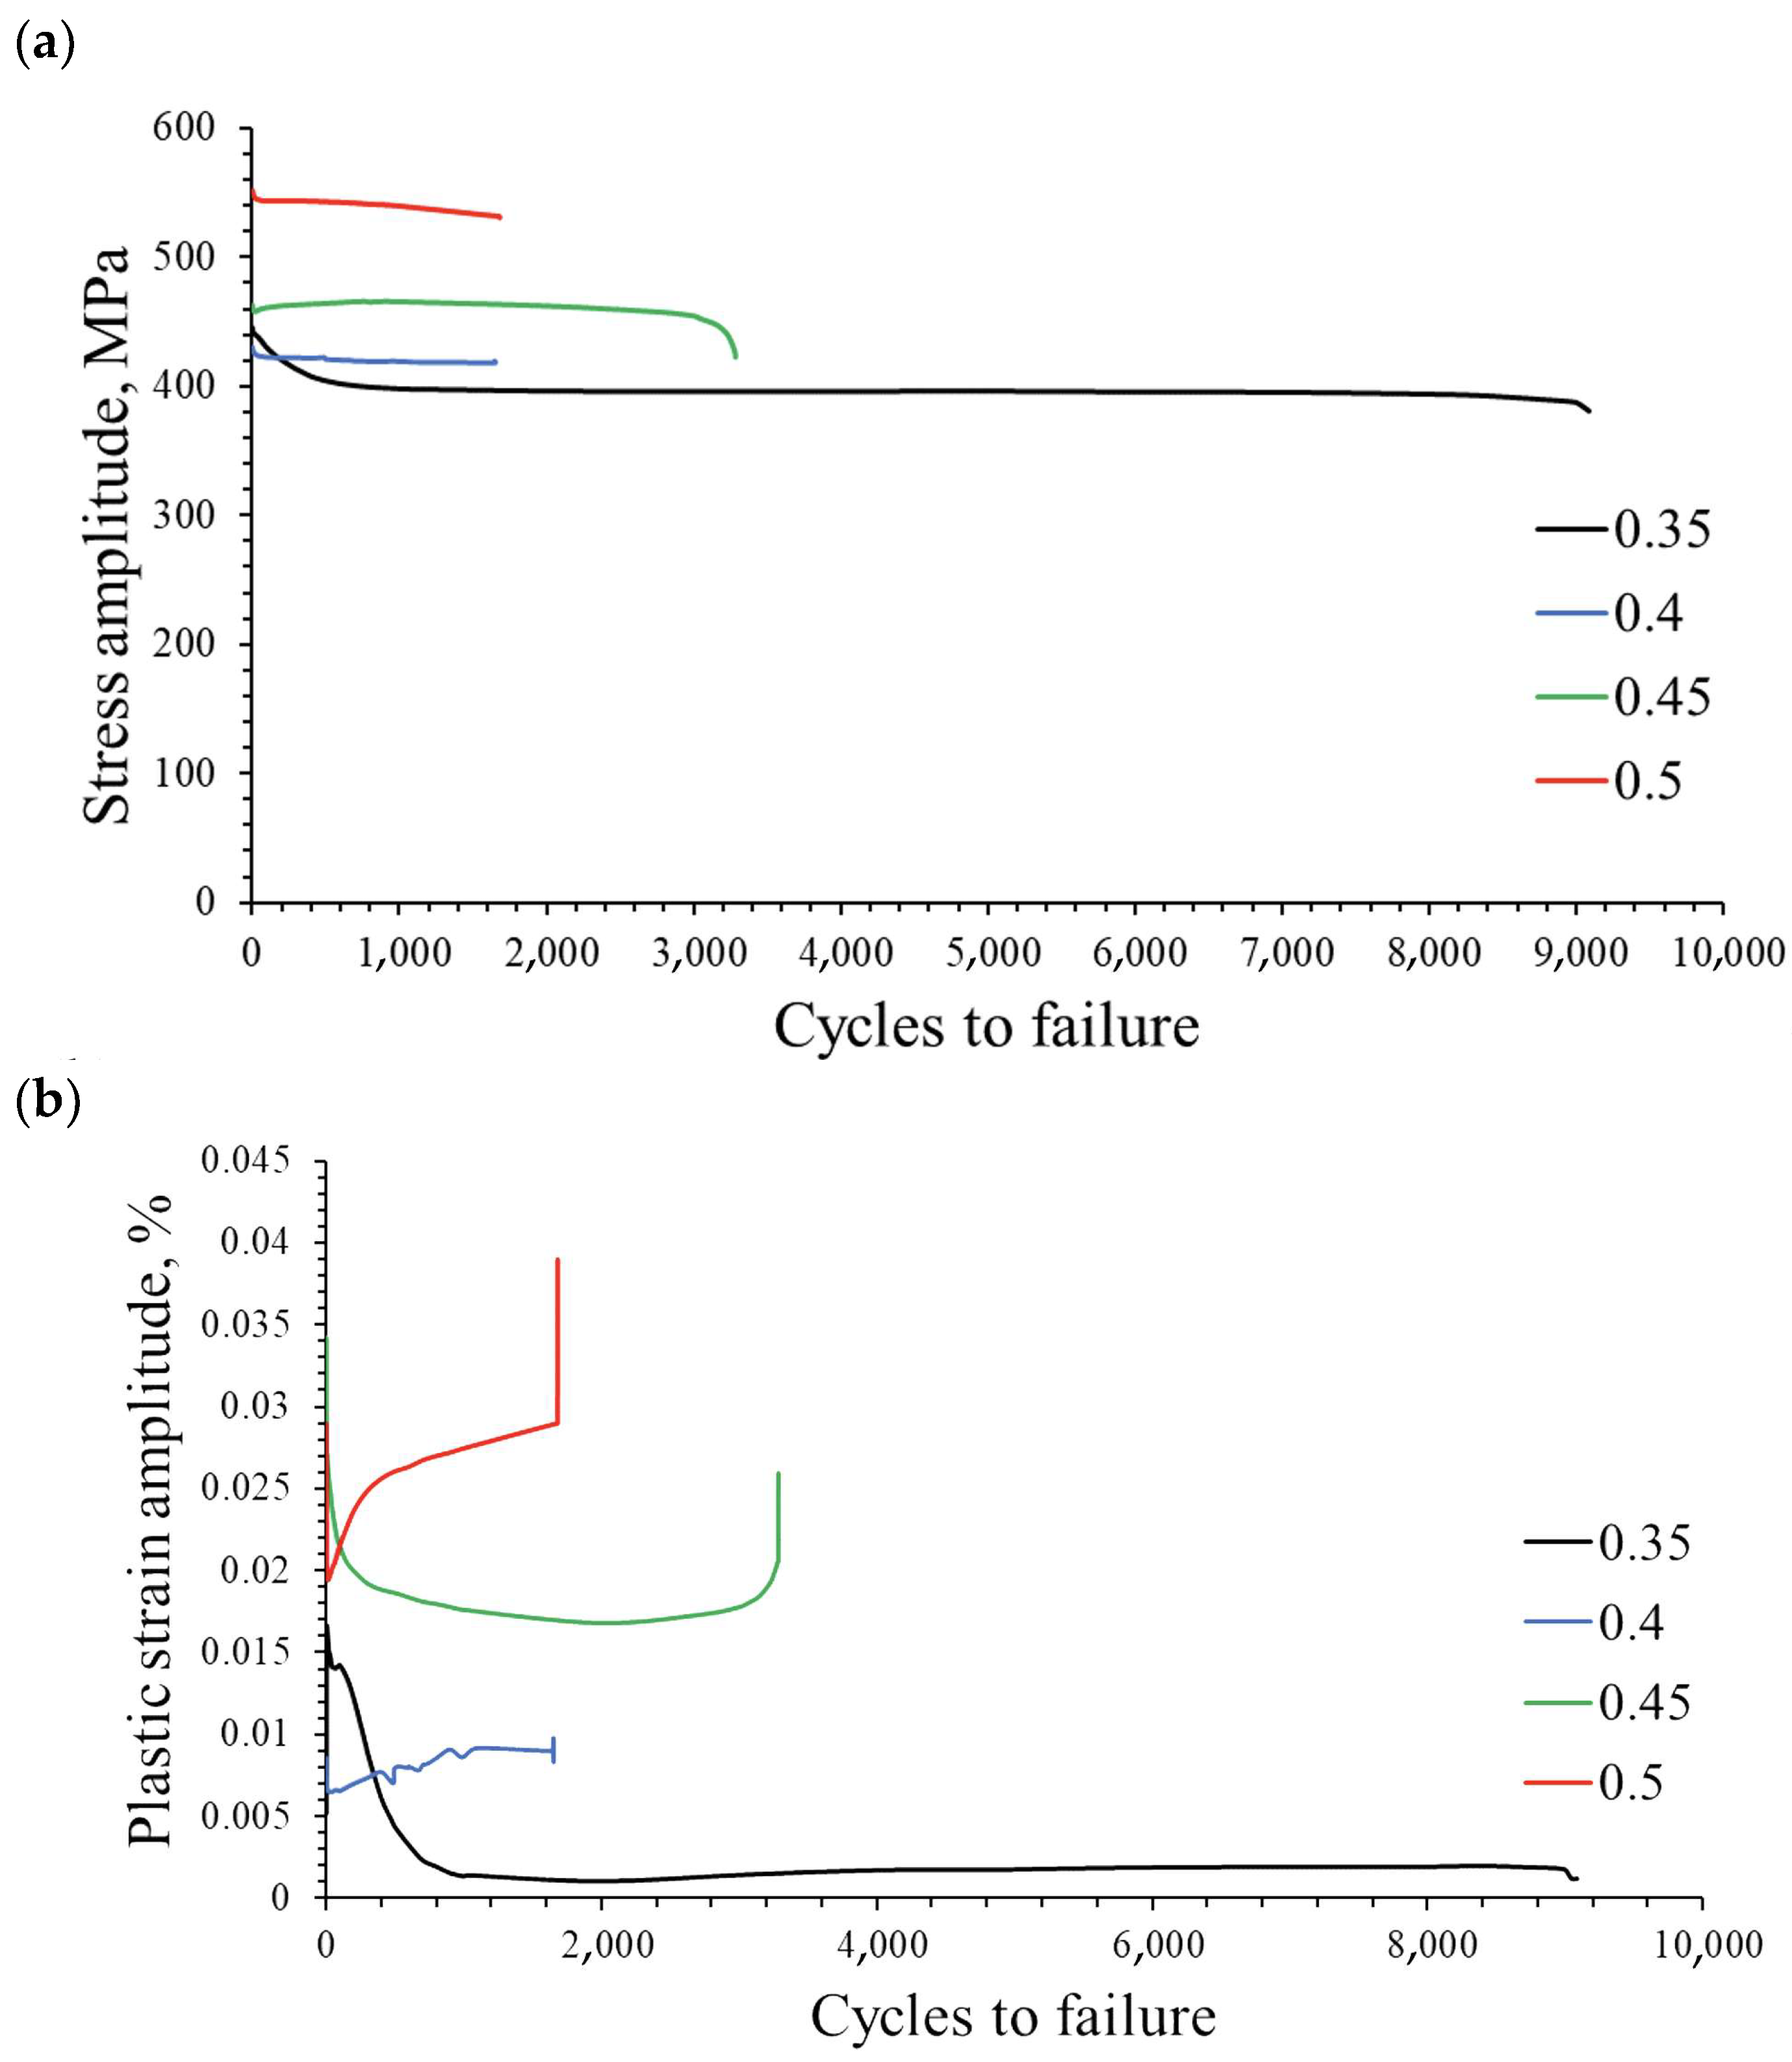
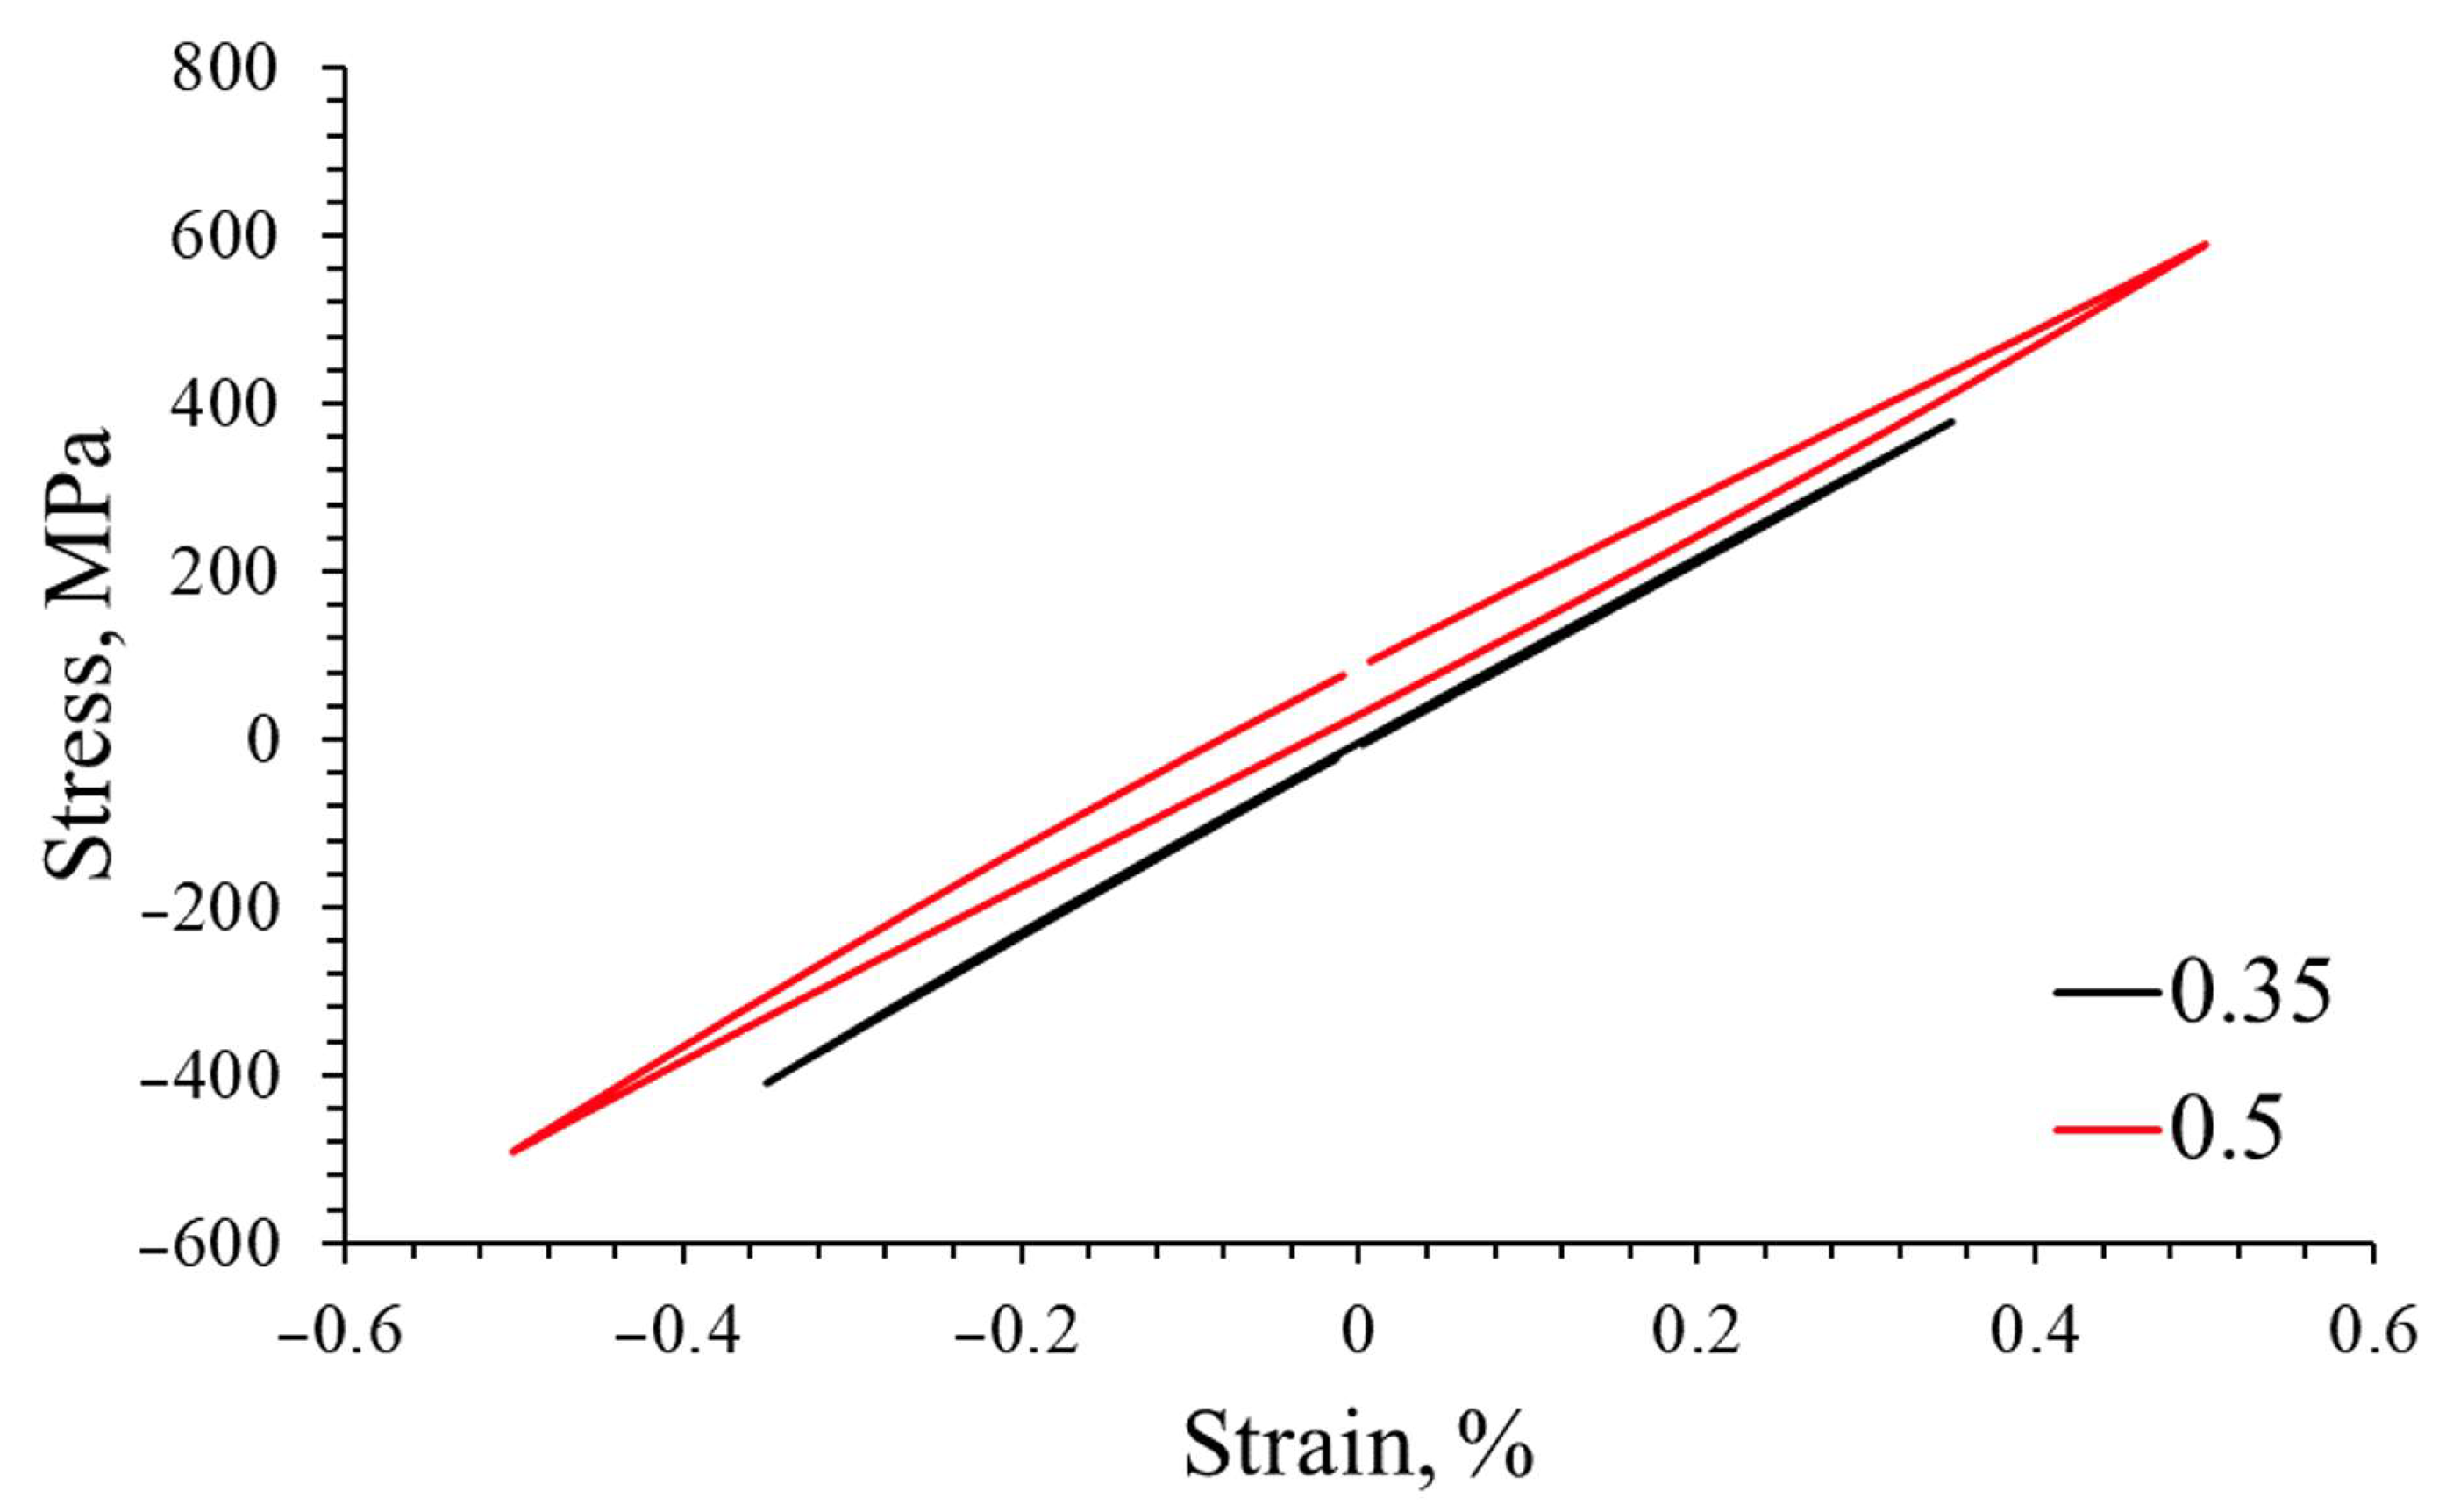
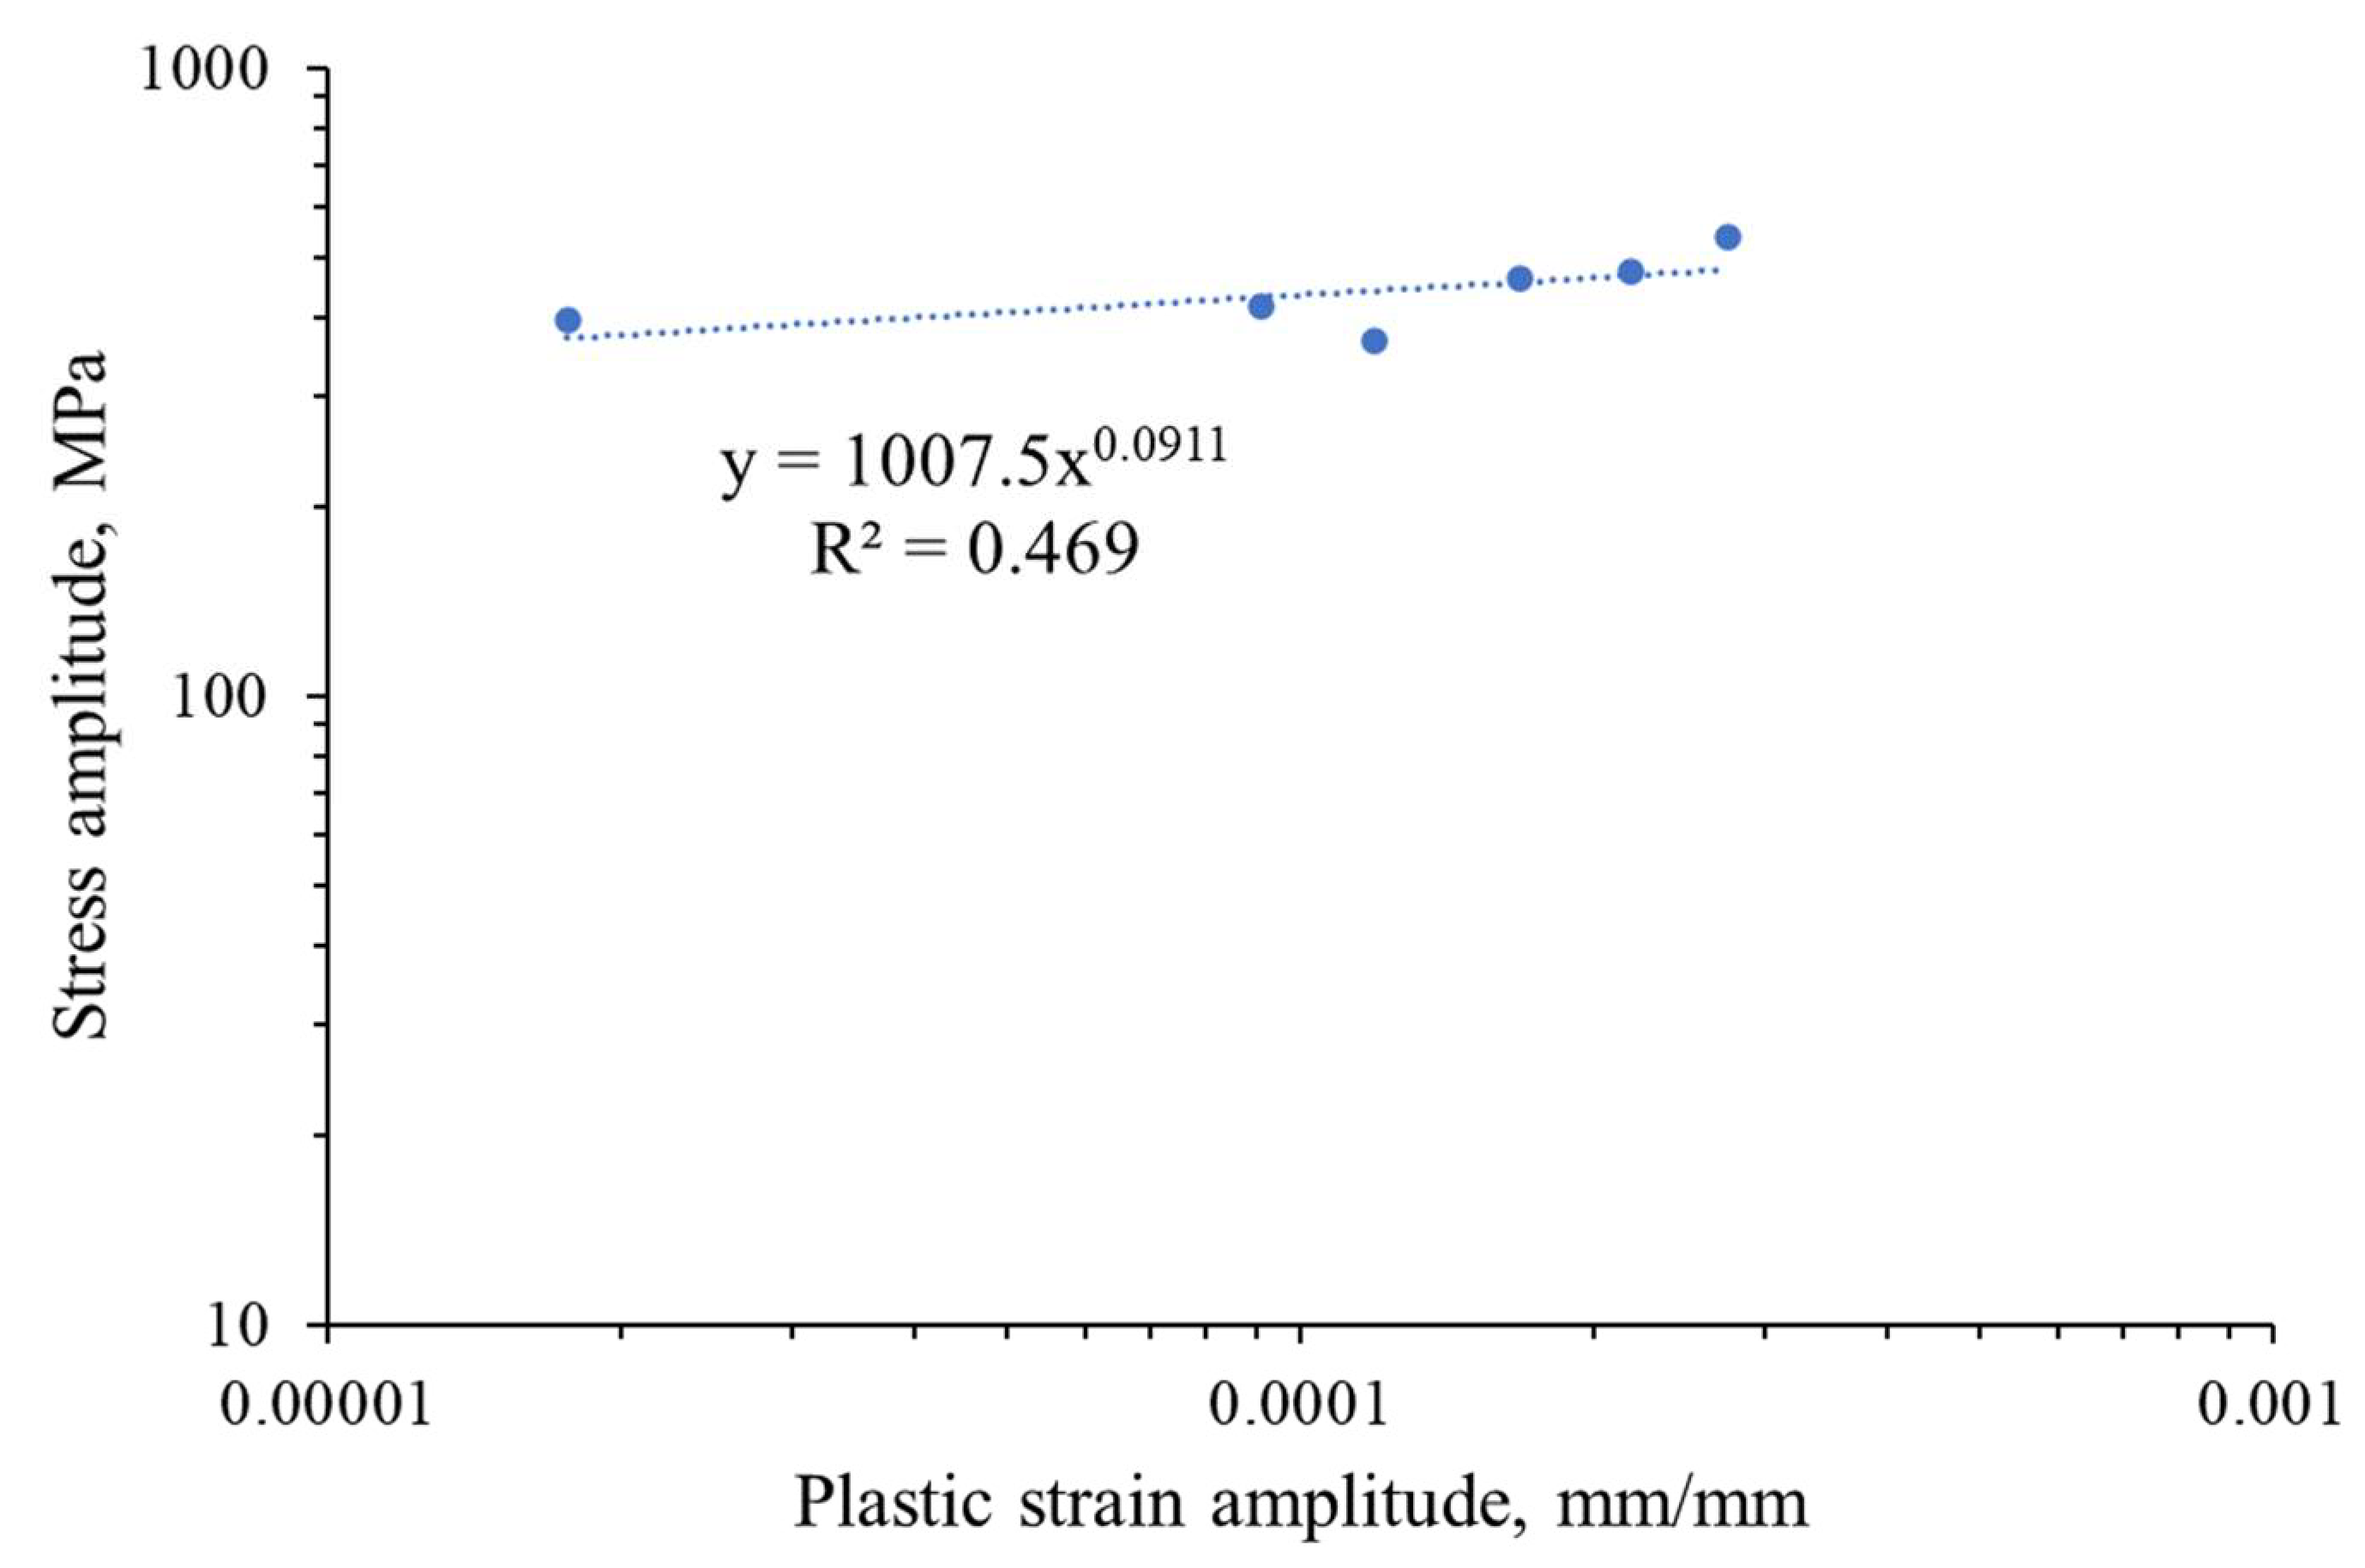
4.2. Mechanical Properties—Low Cycle Fatigue Test
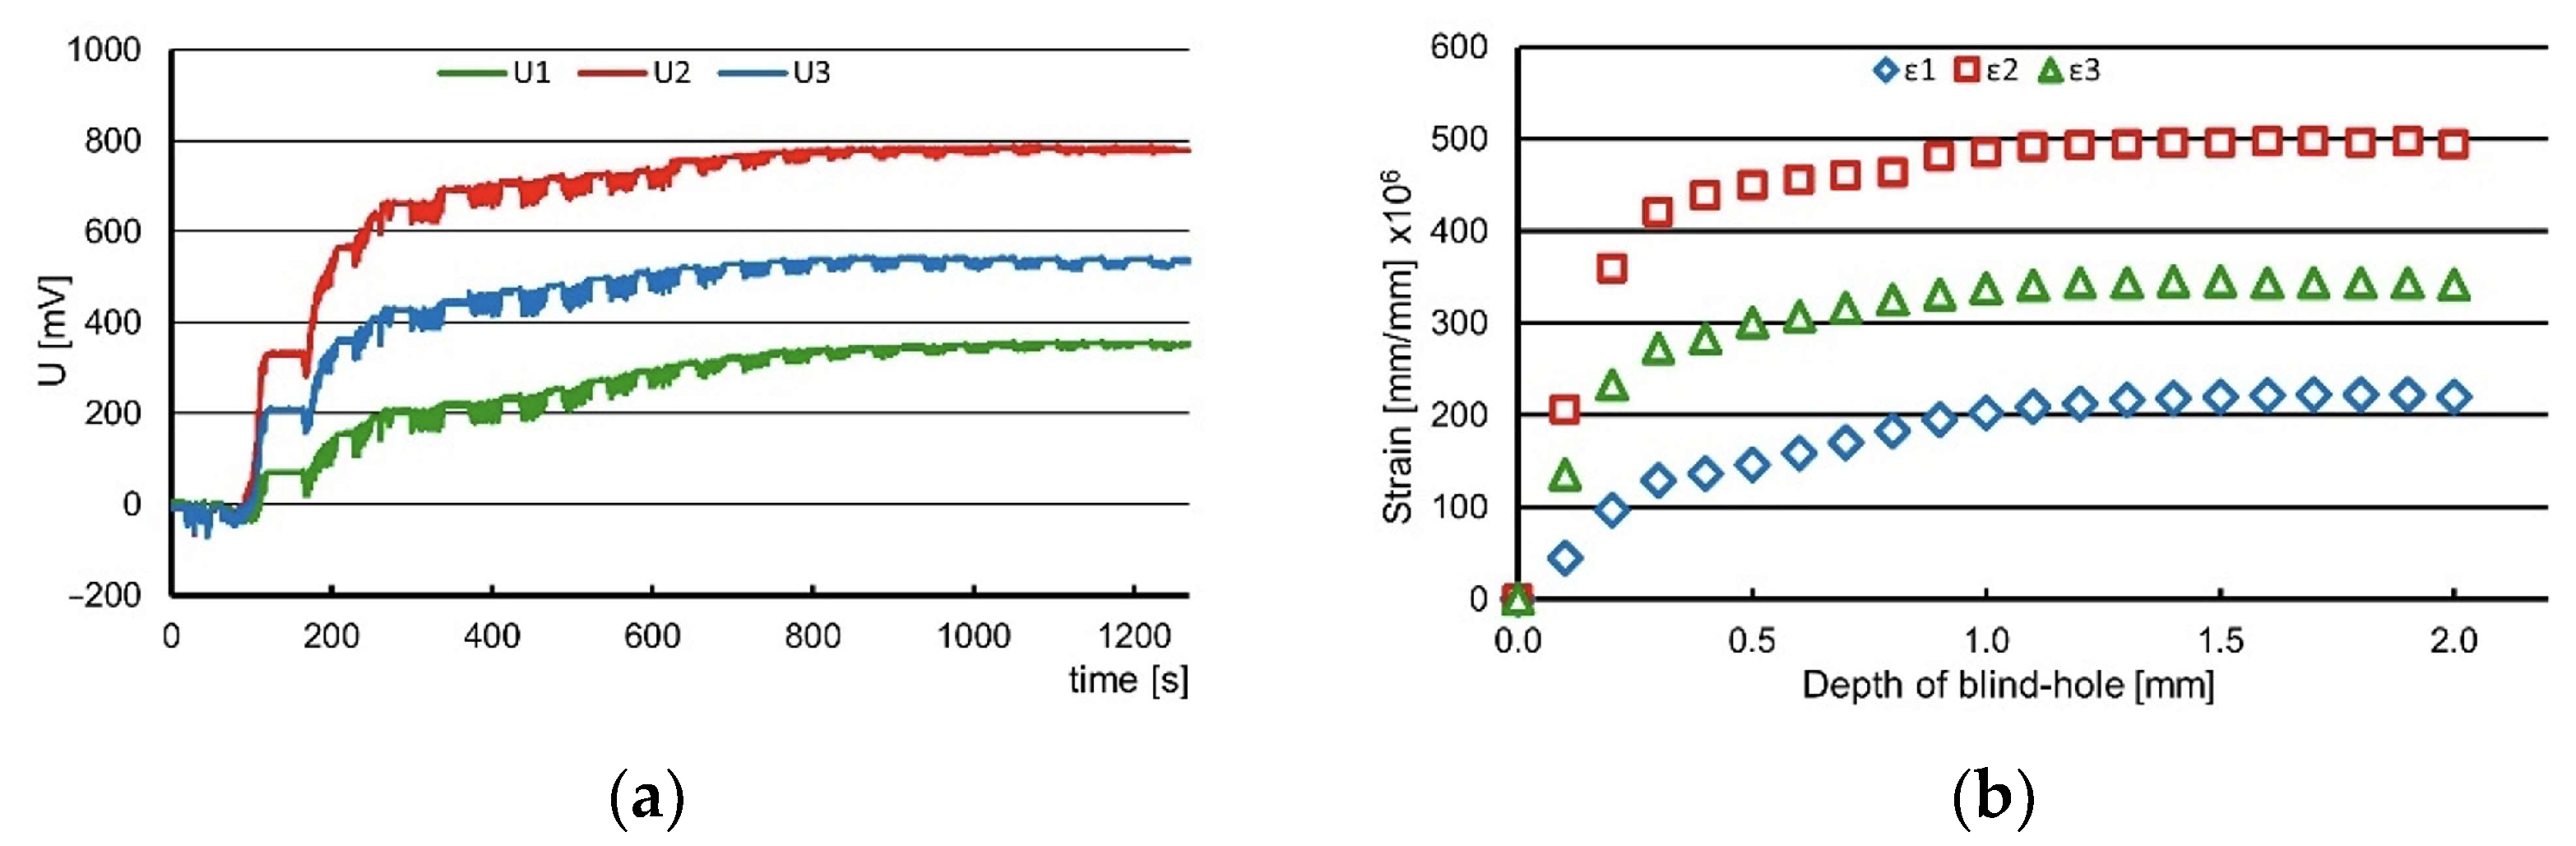
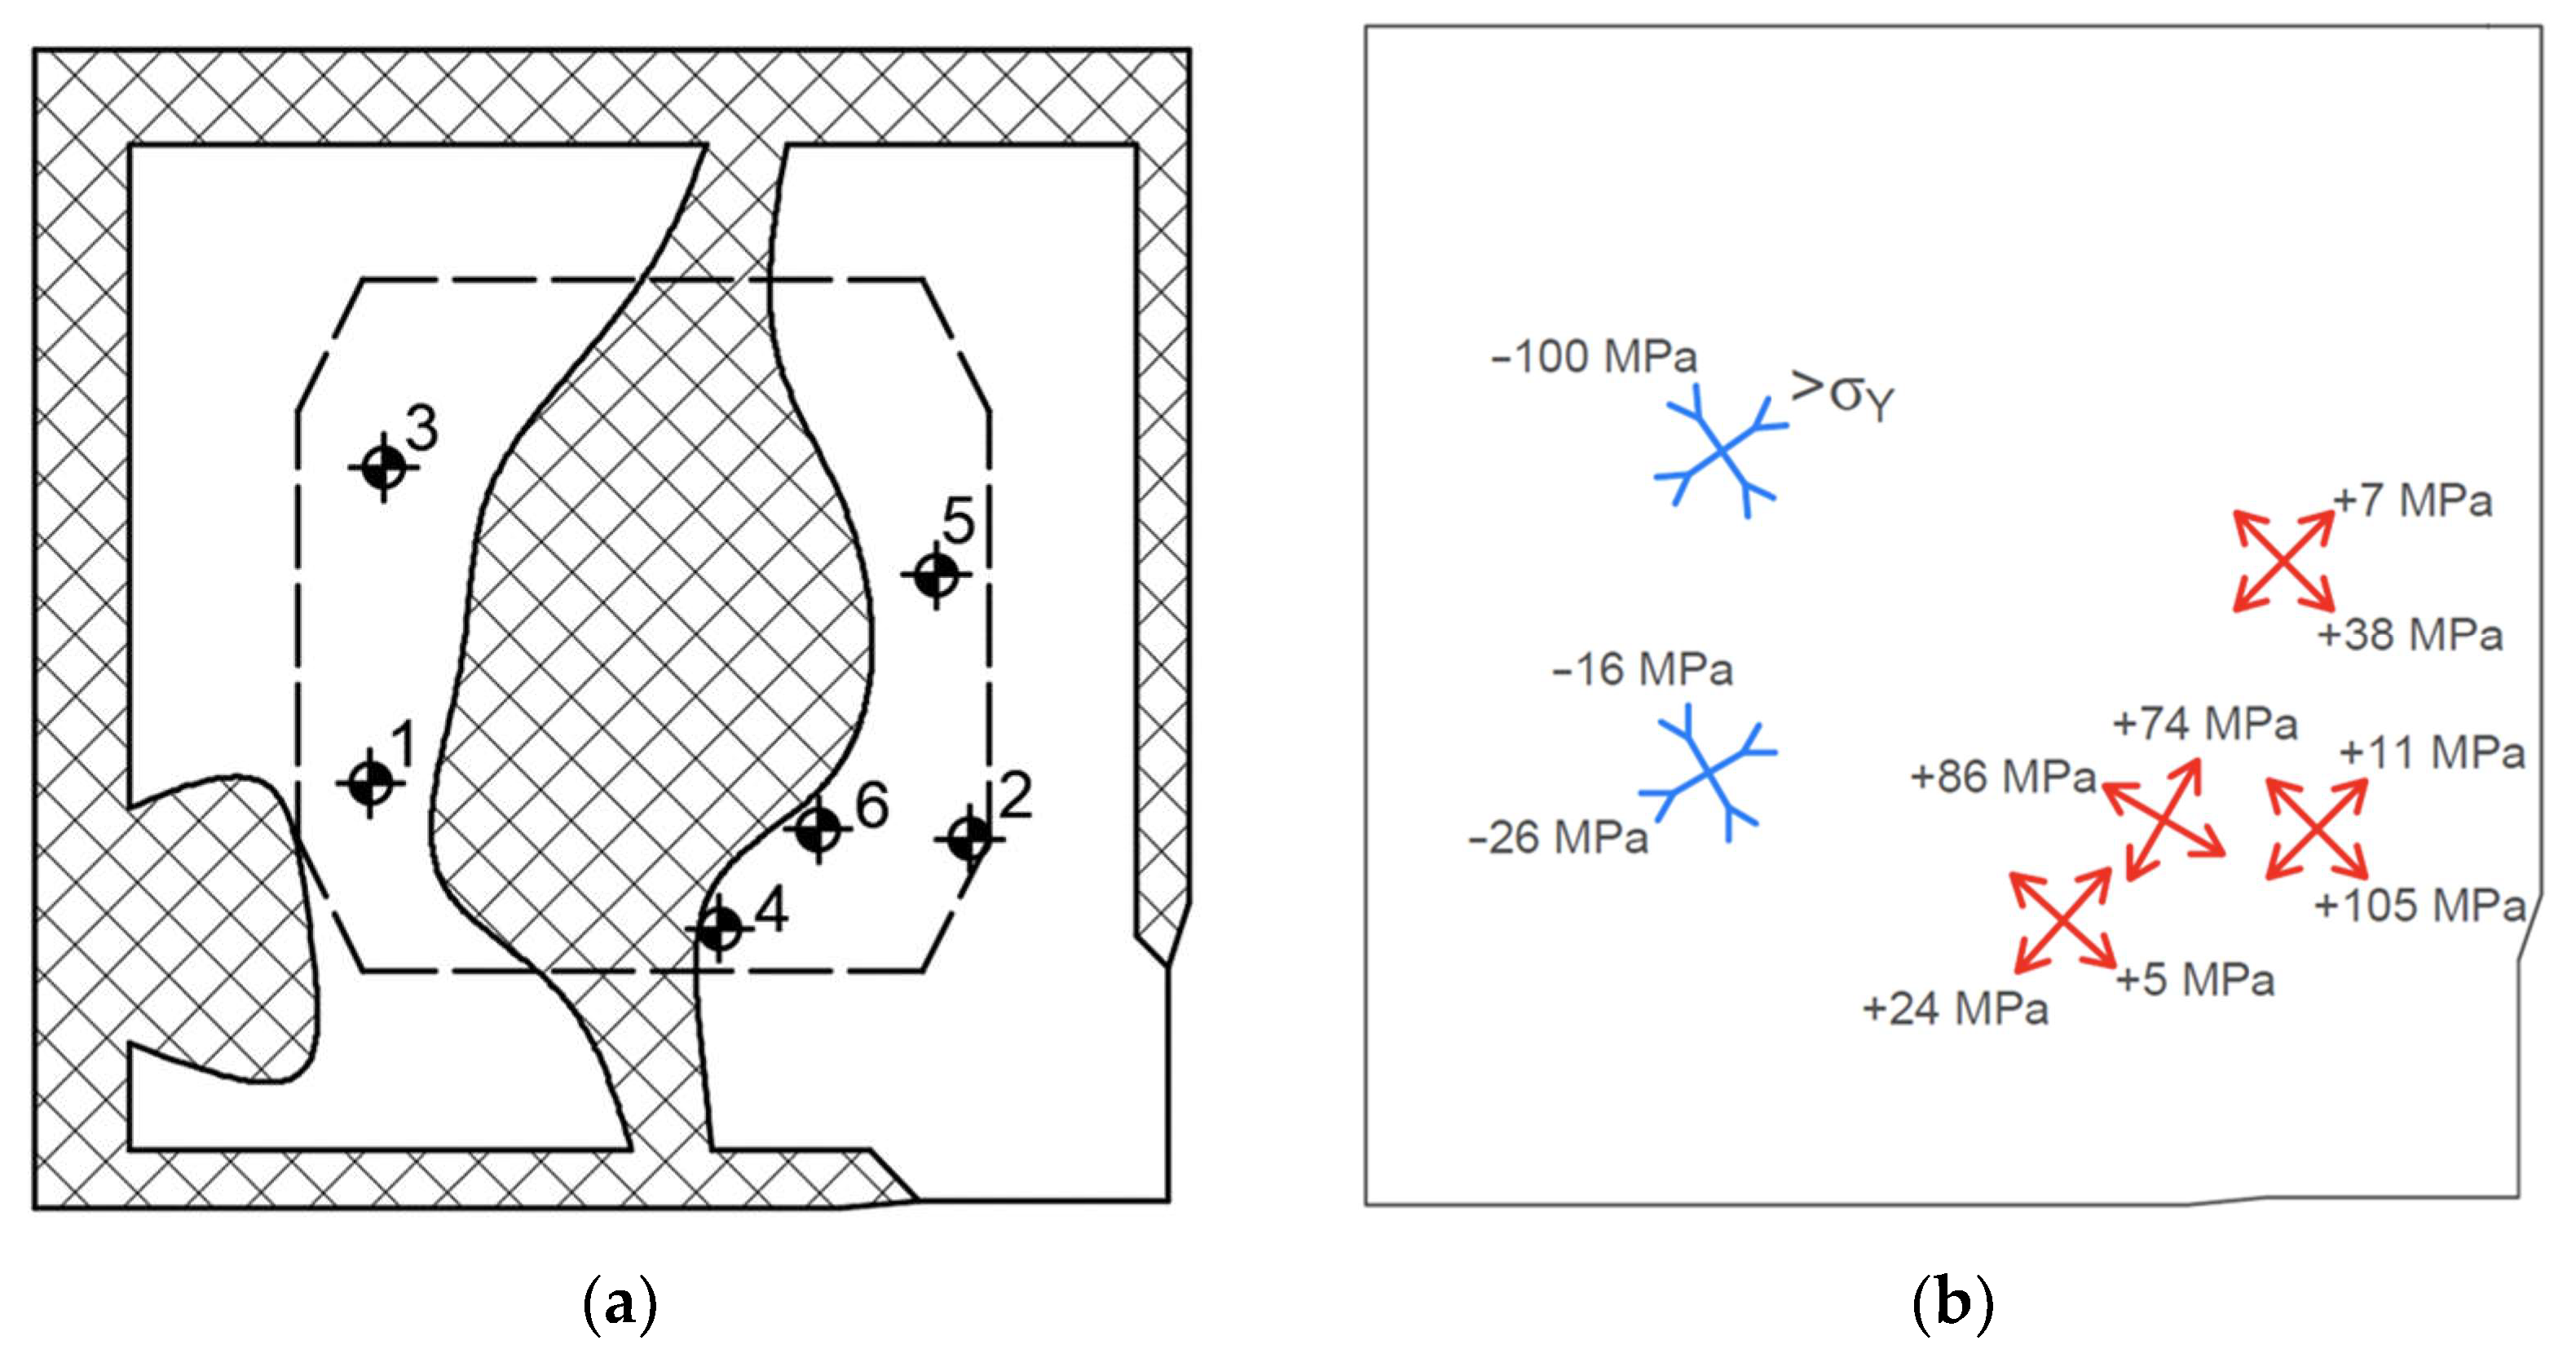
4.3. Mechanical Properties—Residual Stresses
- U—output voltage [V];
- U0—supply voltage [V];
- N—coefficient depending on the bridge type—for quarter-bridge N = 1;
- K—strain gauge constant;
- A—coefficient of output signal amplification.
- σmax, σmin—principal stresses;
- ε1, ε2, ε3—strains measured on strain gauges number 1, 2 and 3;
- A, B—coefficients depending on material properties and geometry of rosette and hole;
- α—angle between strain gauge no. 1 and the direction of the nearest principal stress.
4.4. Corrosion
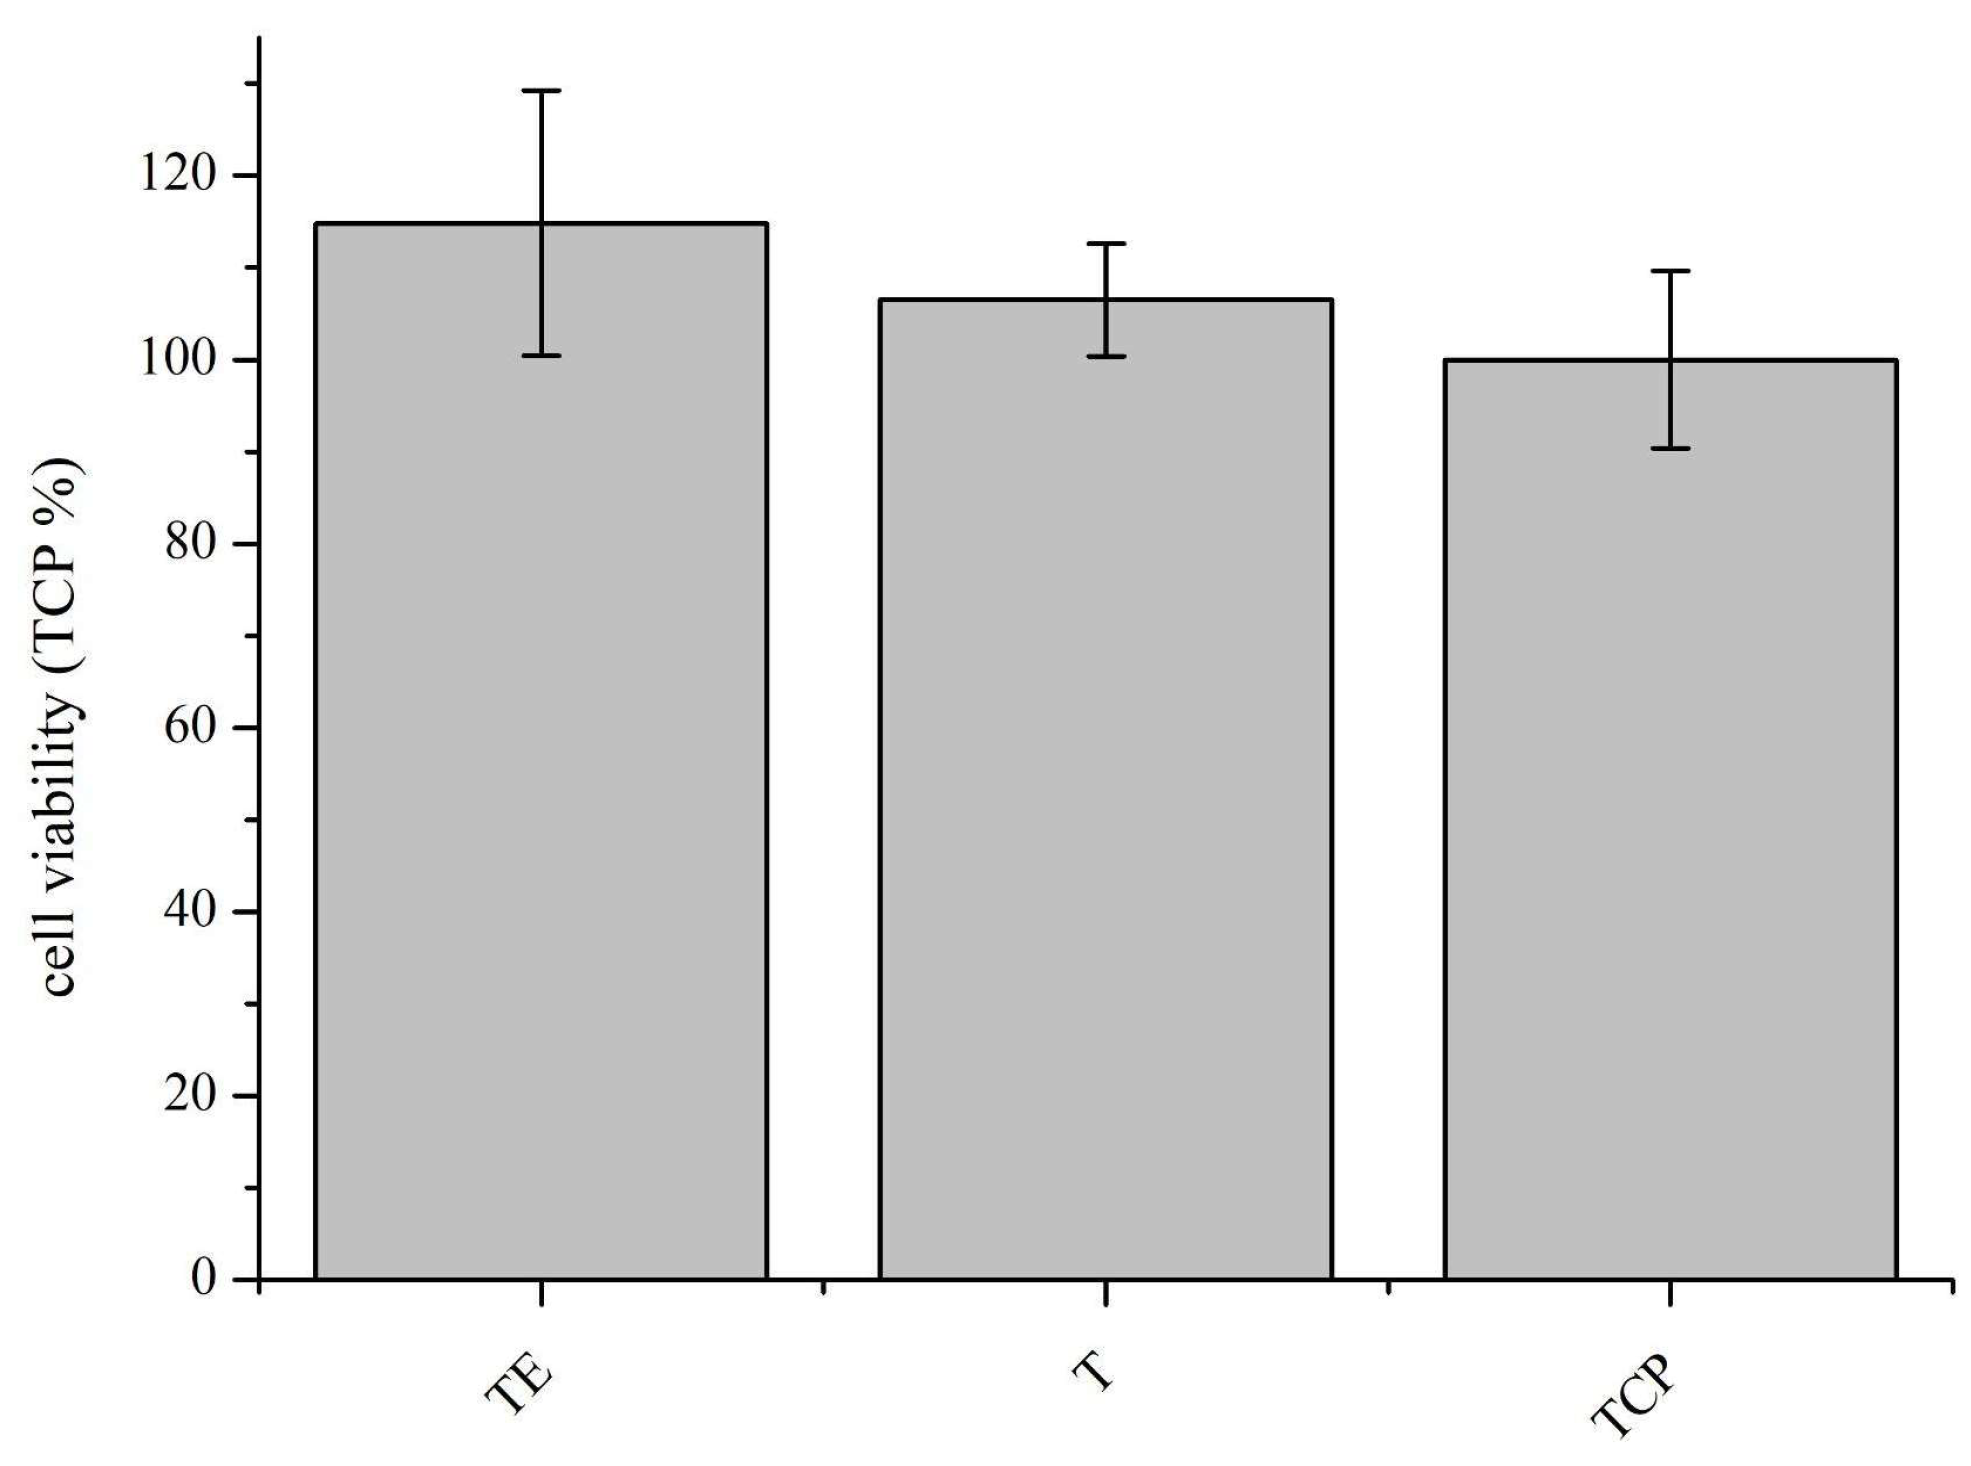
4.5. Cytotoxicity
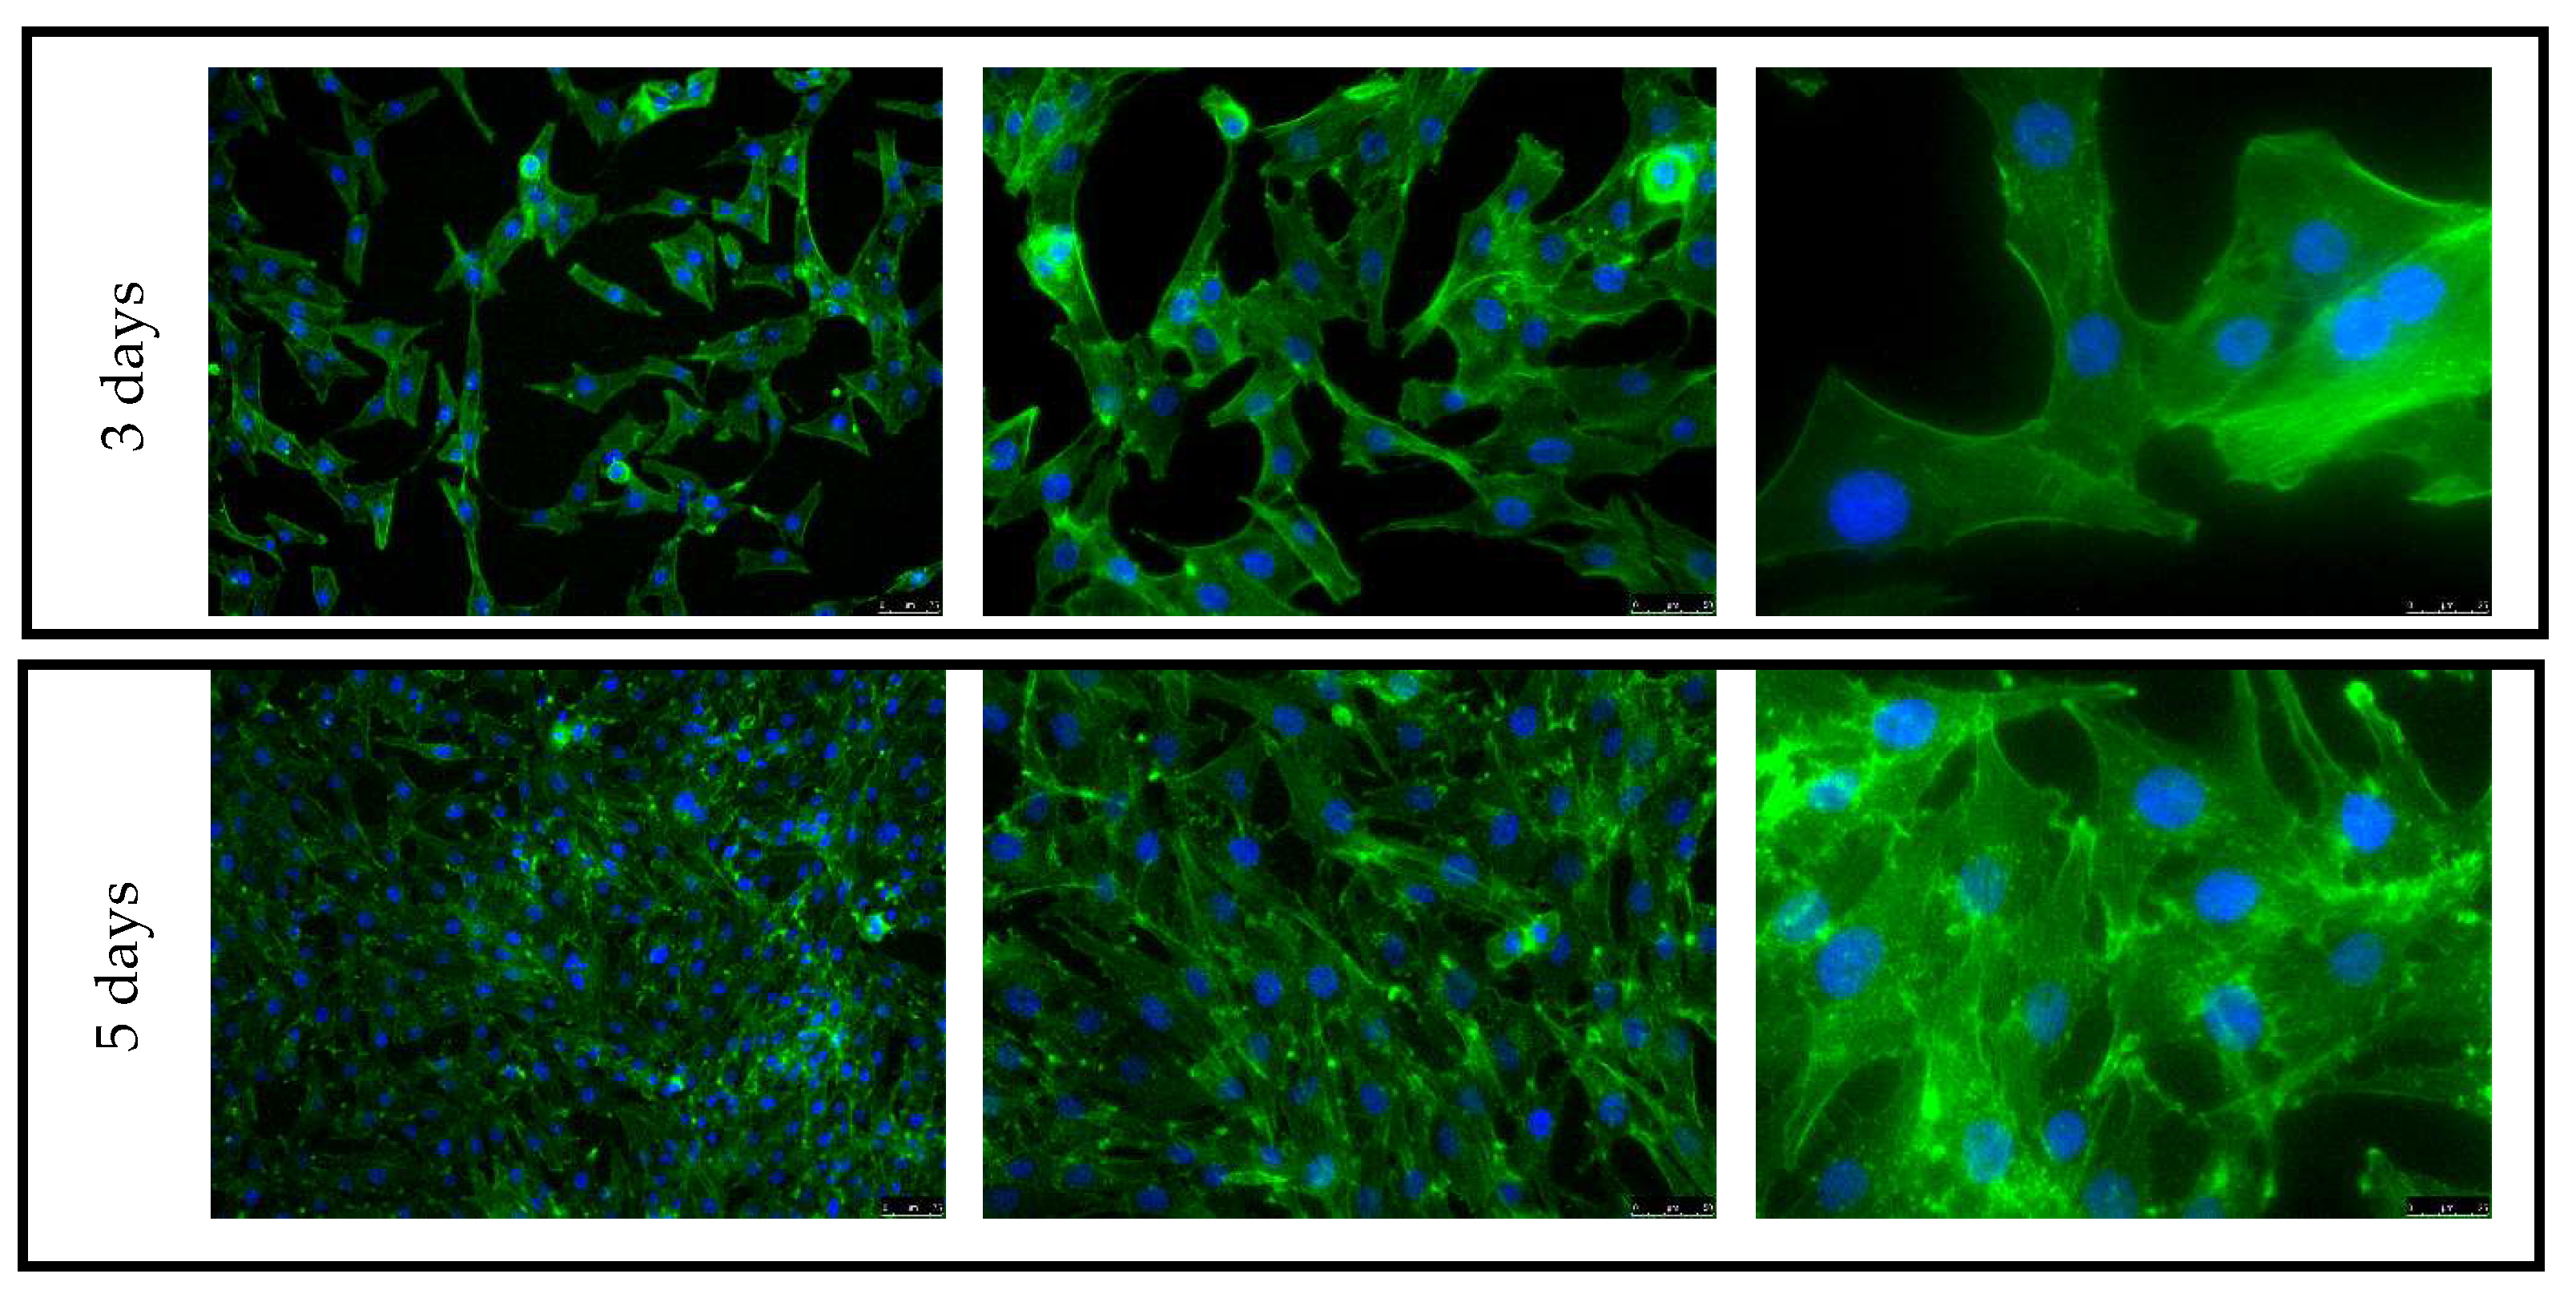
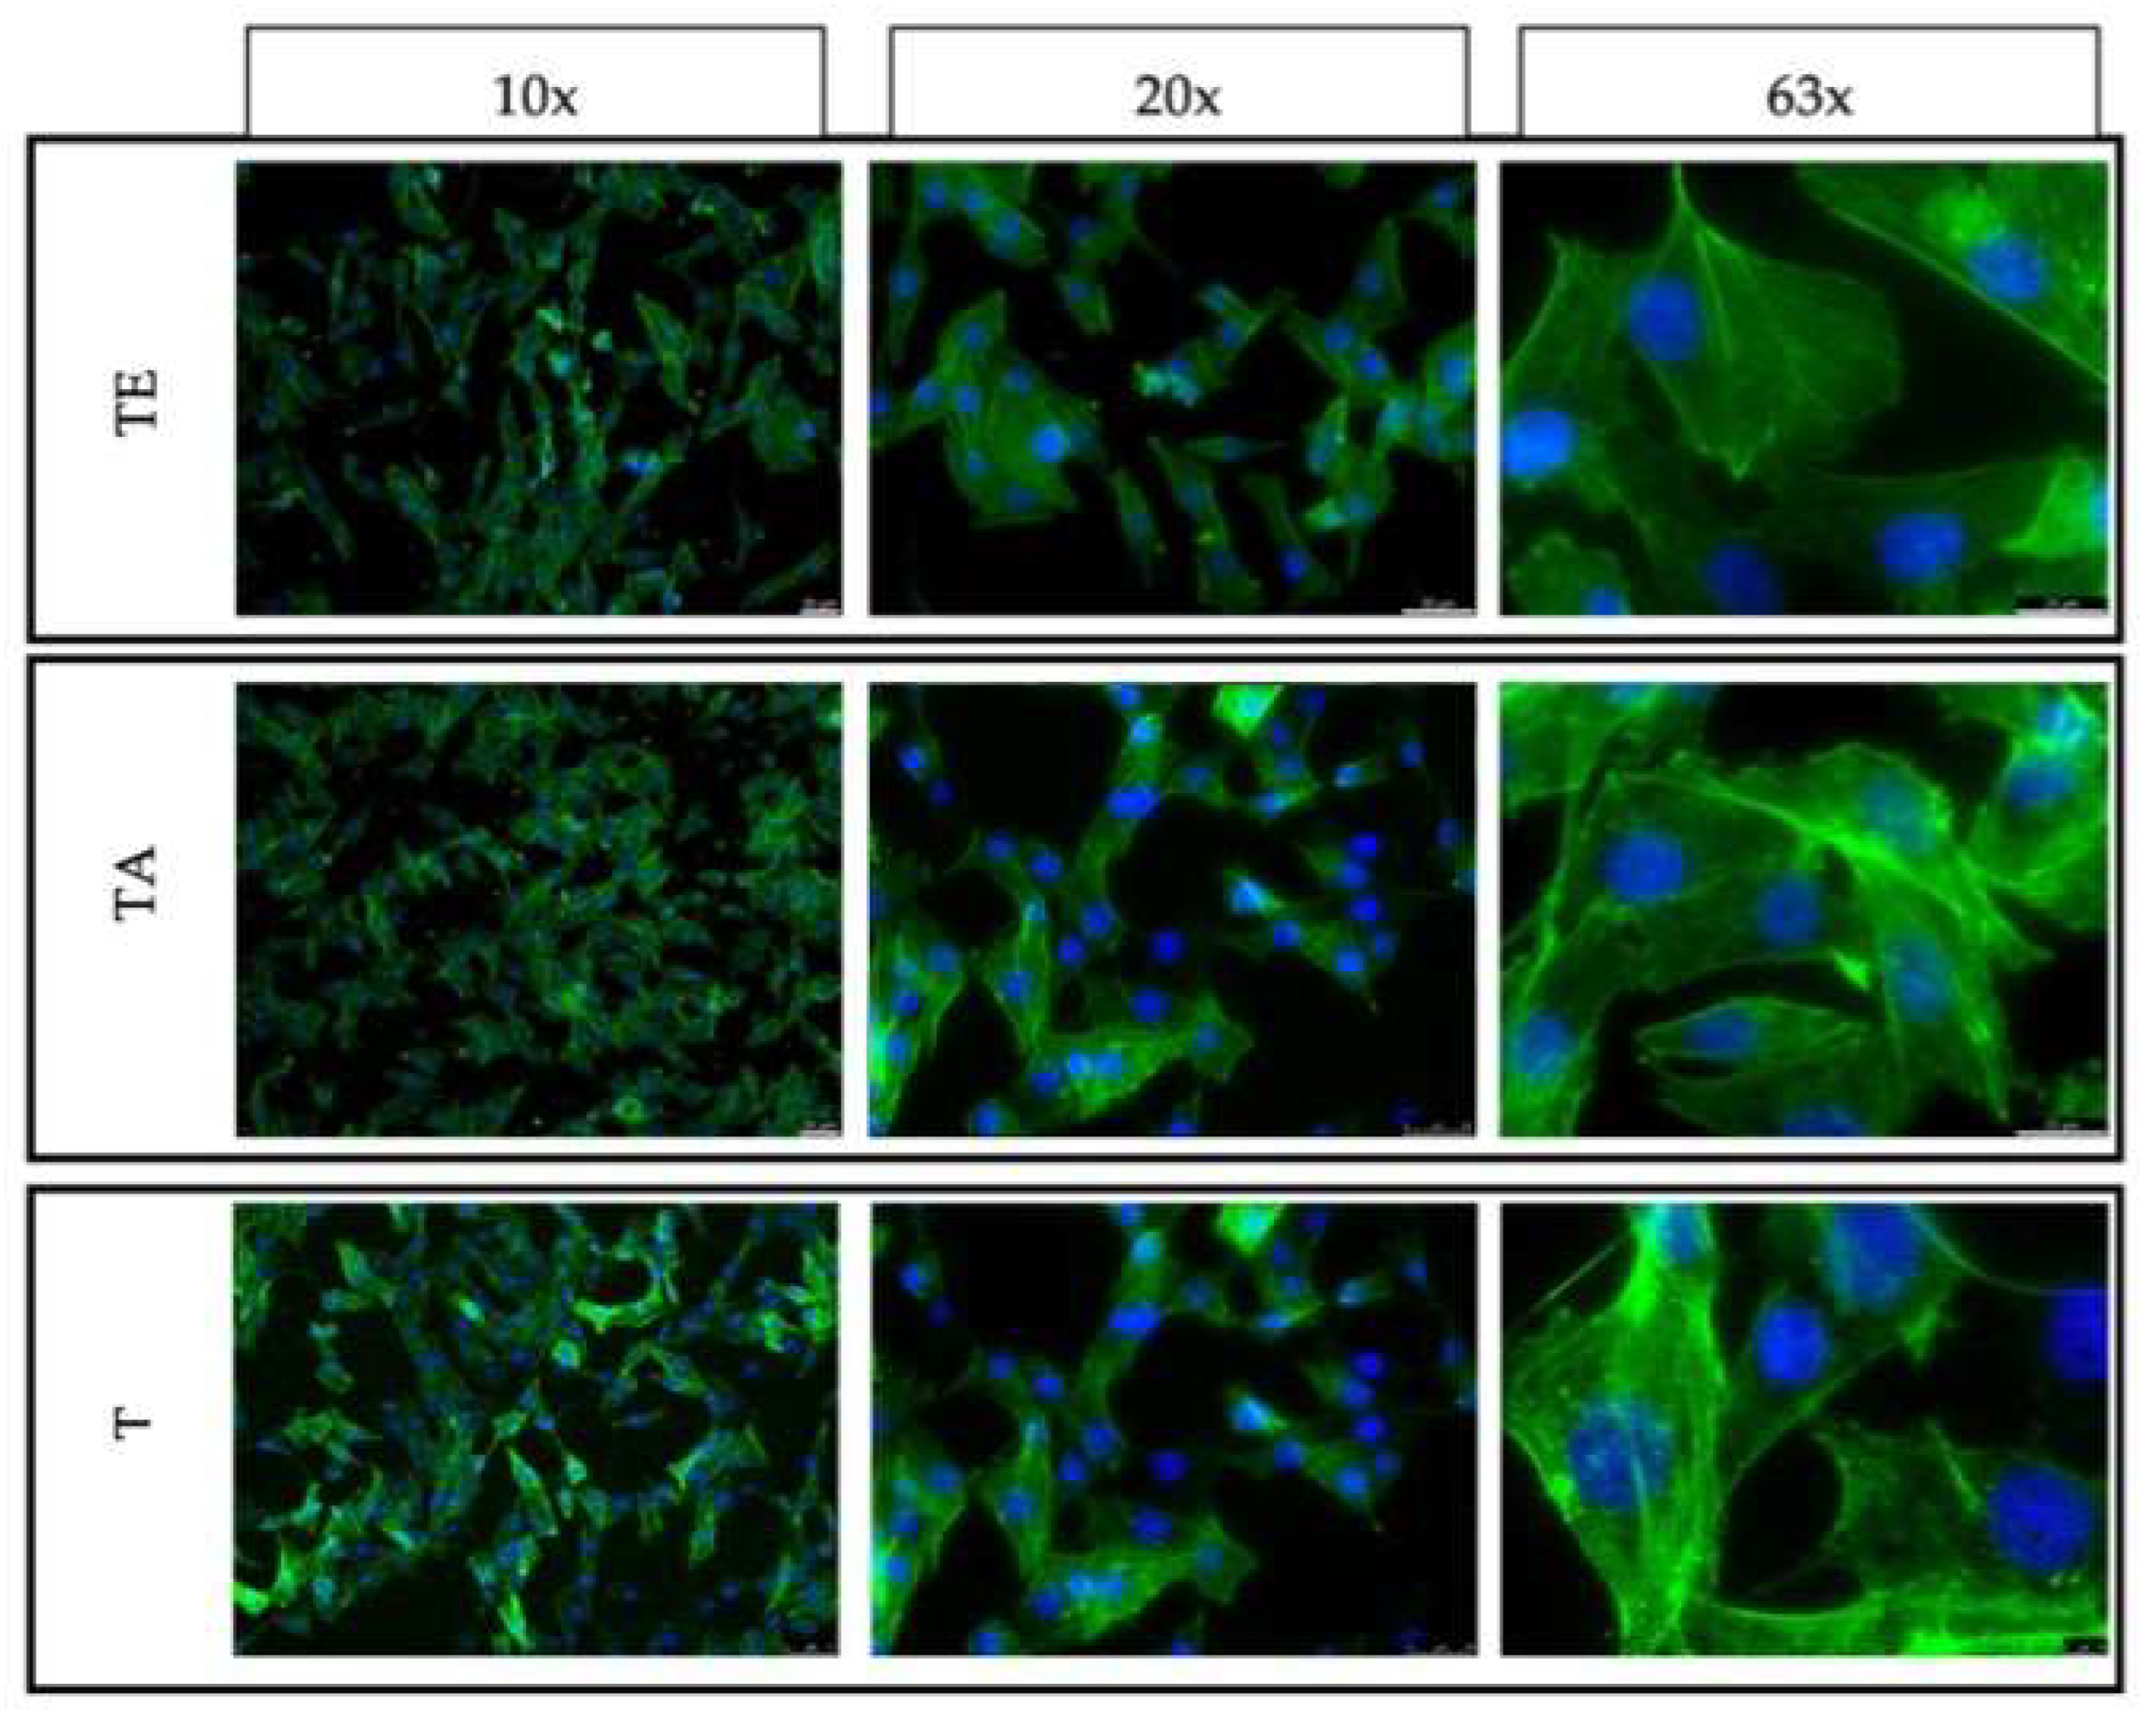
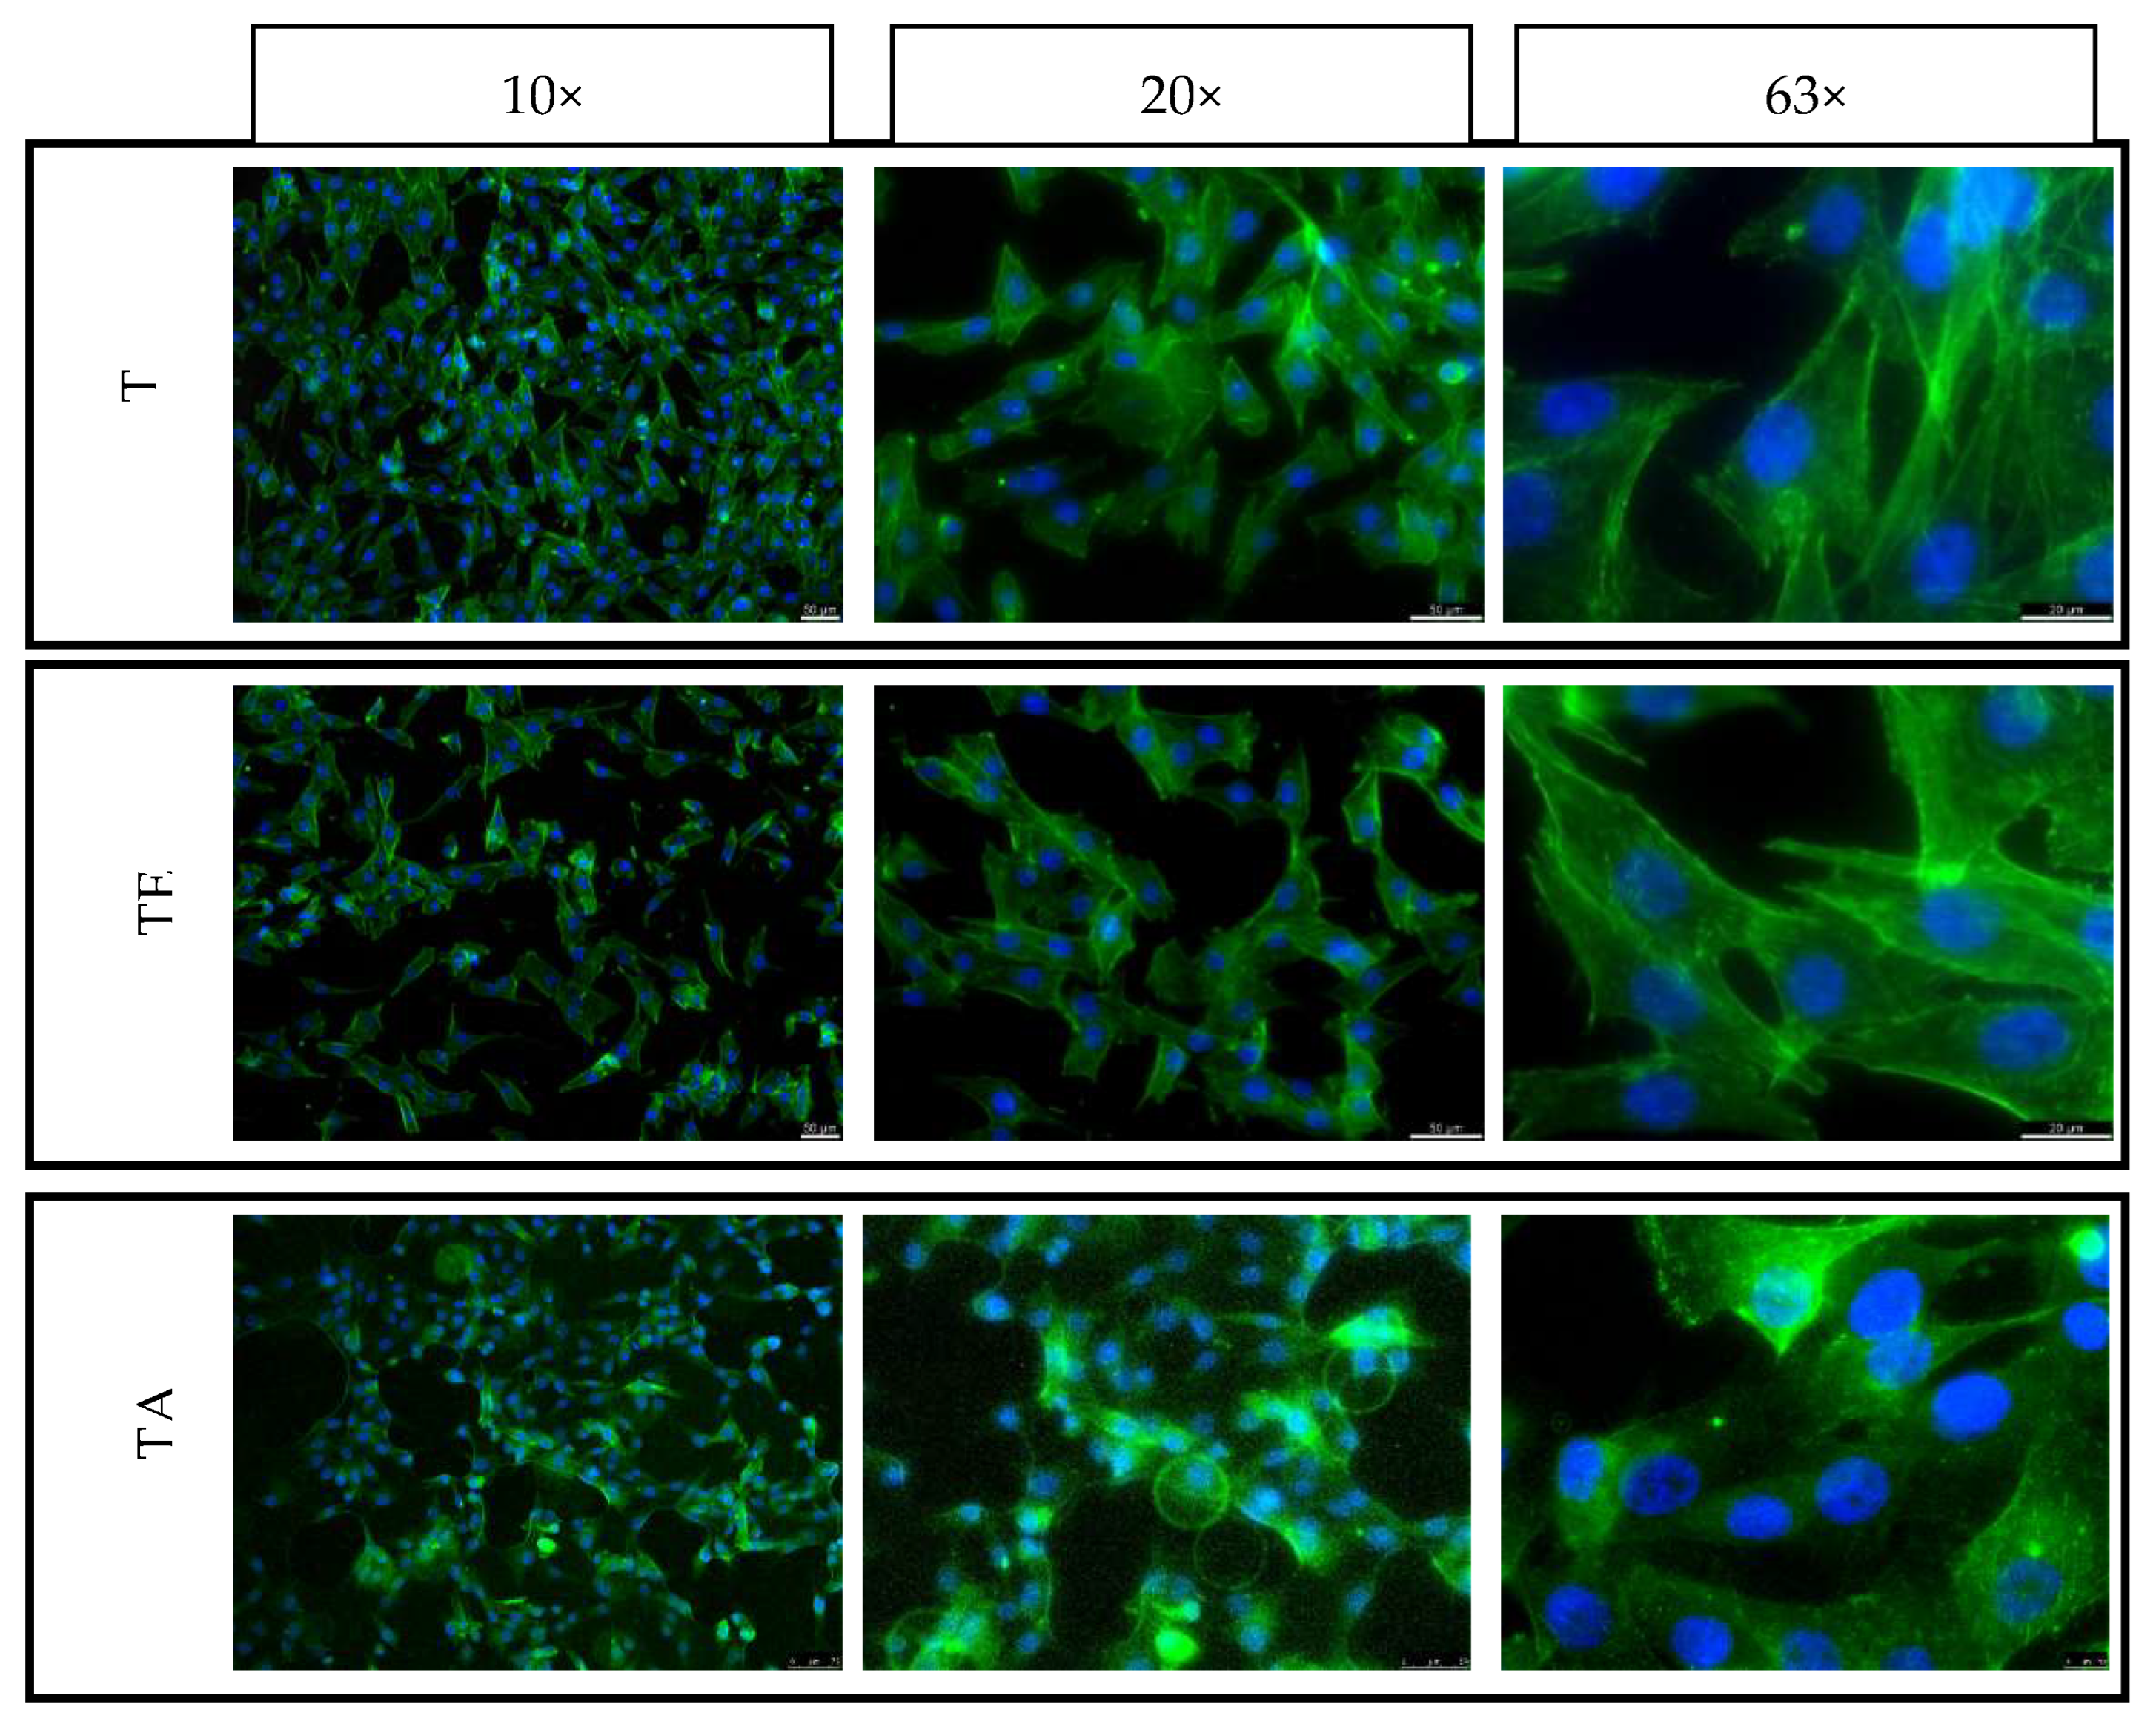
4.6. Adhesion, Spreading and Proliferation of Osteoblasts
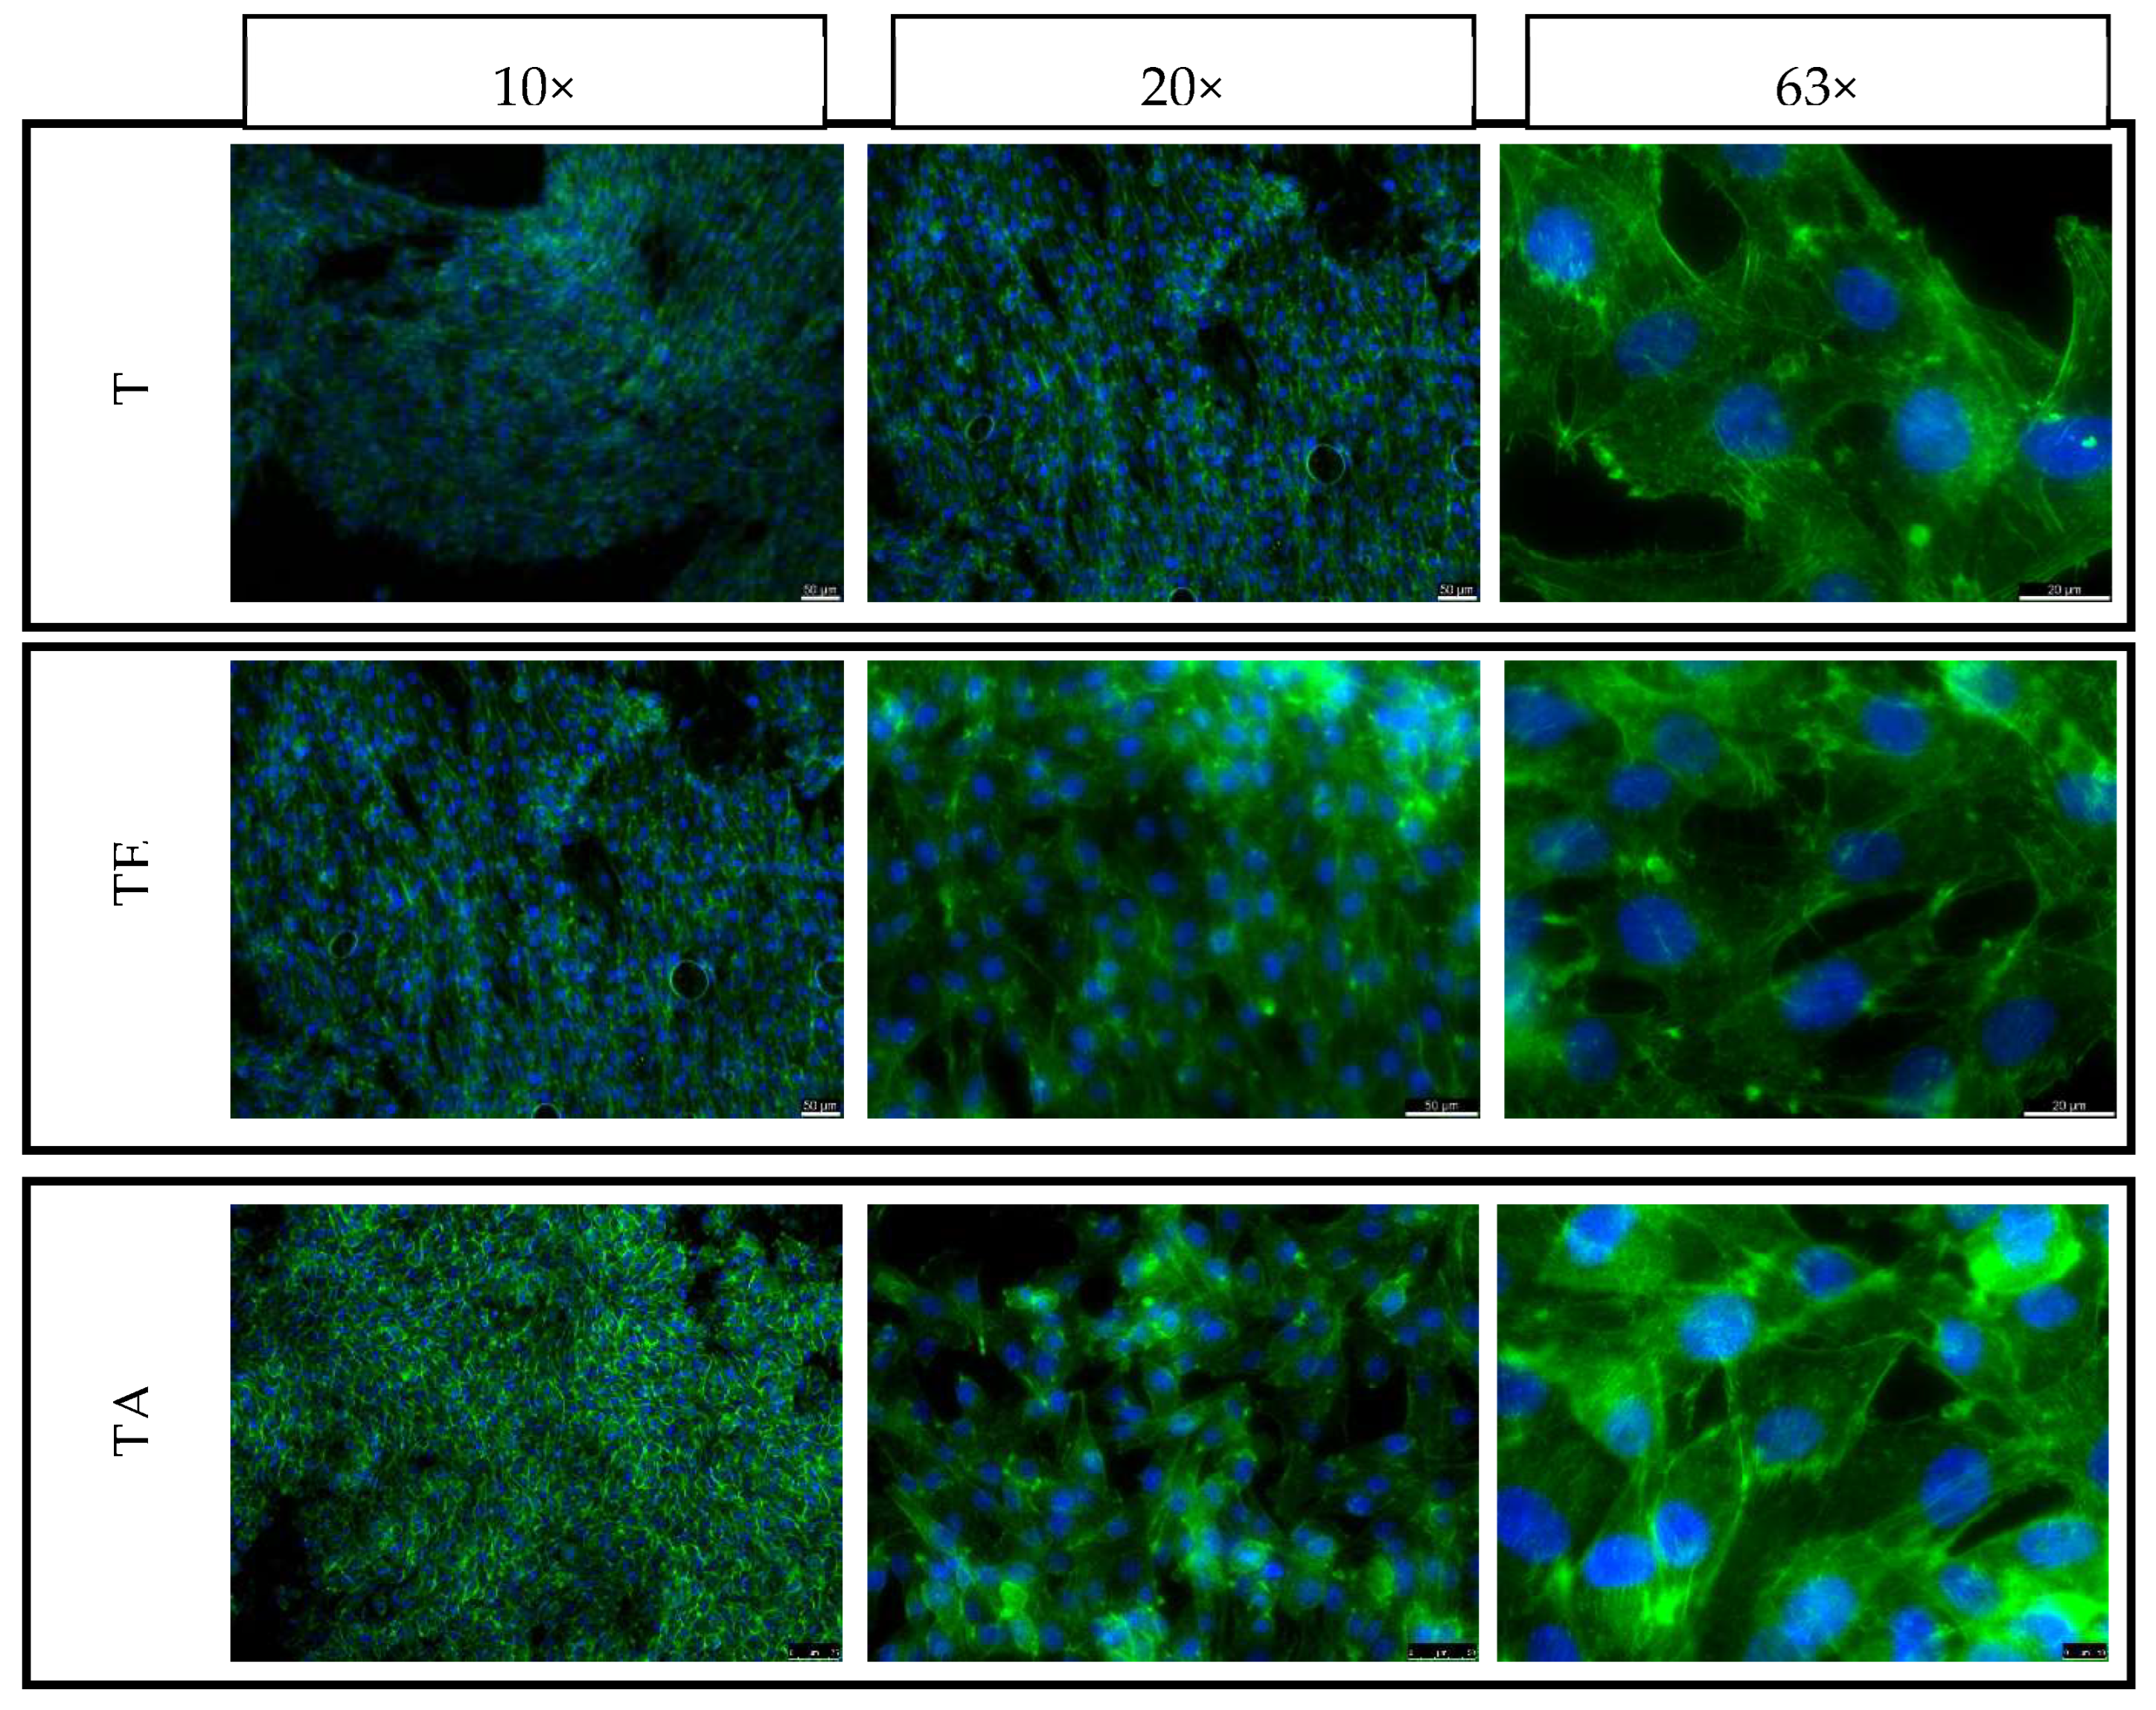
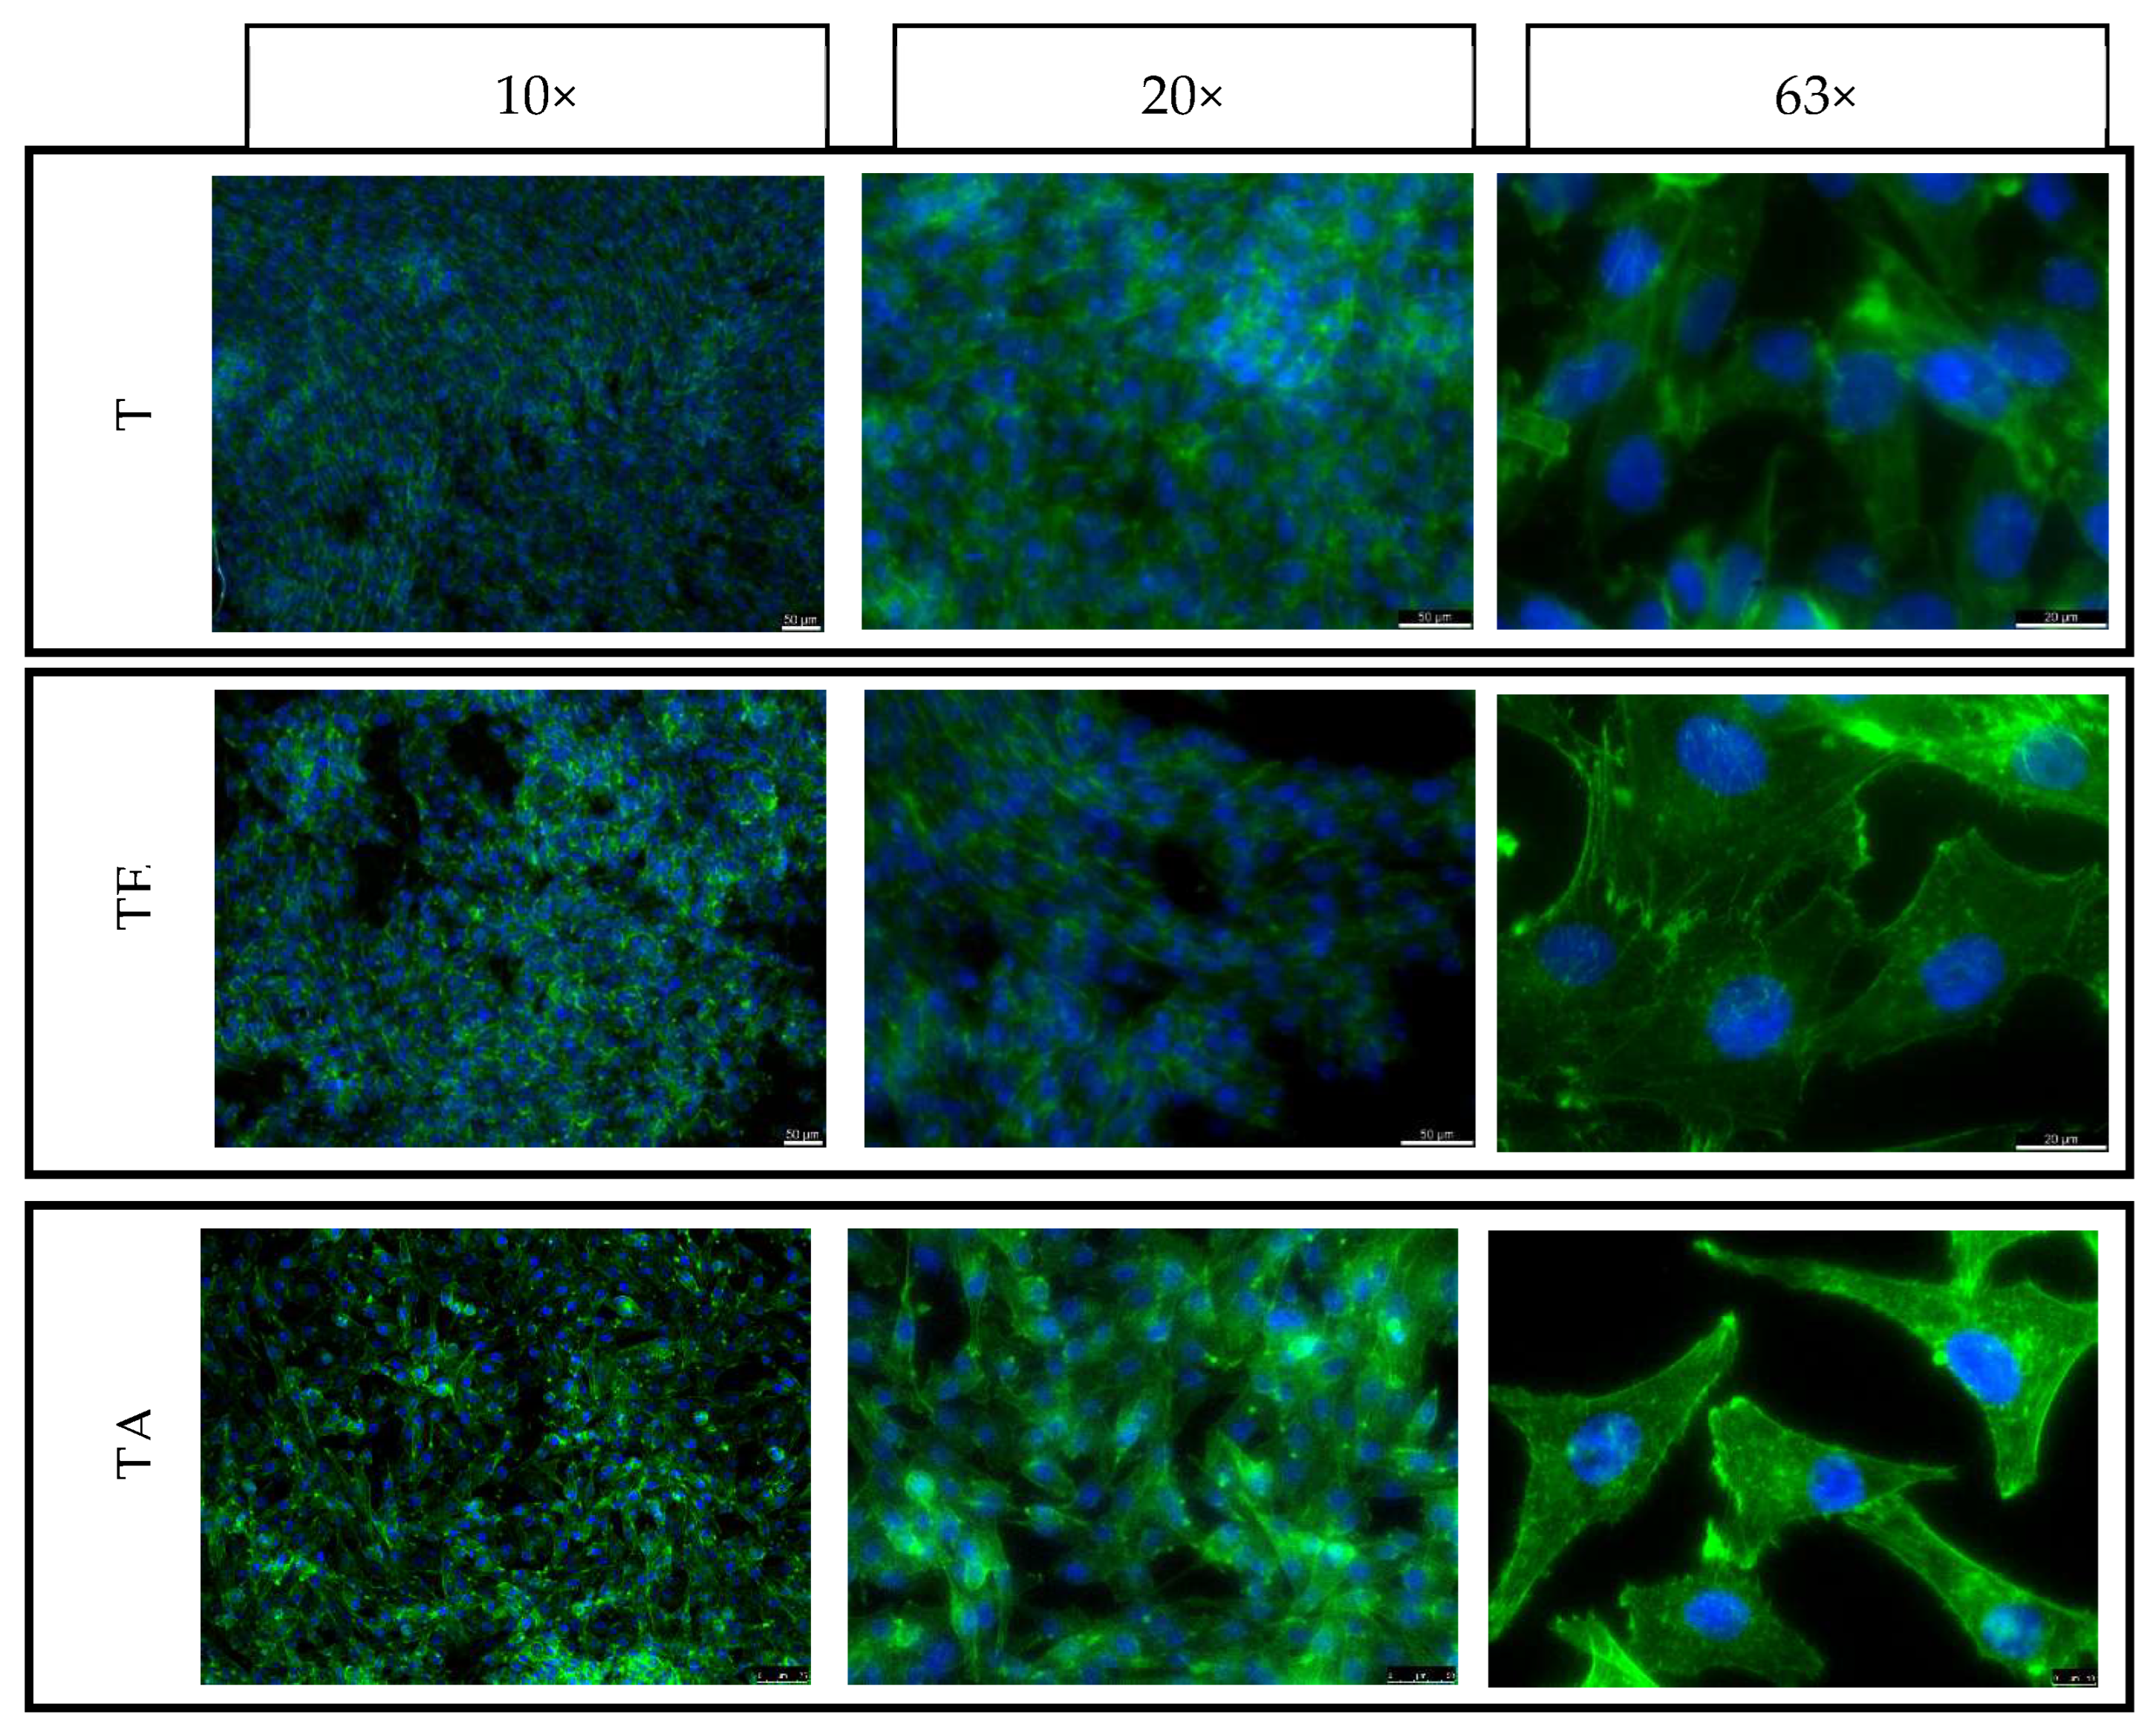
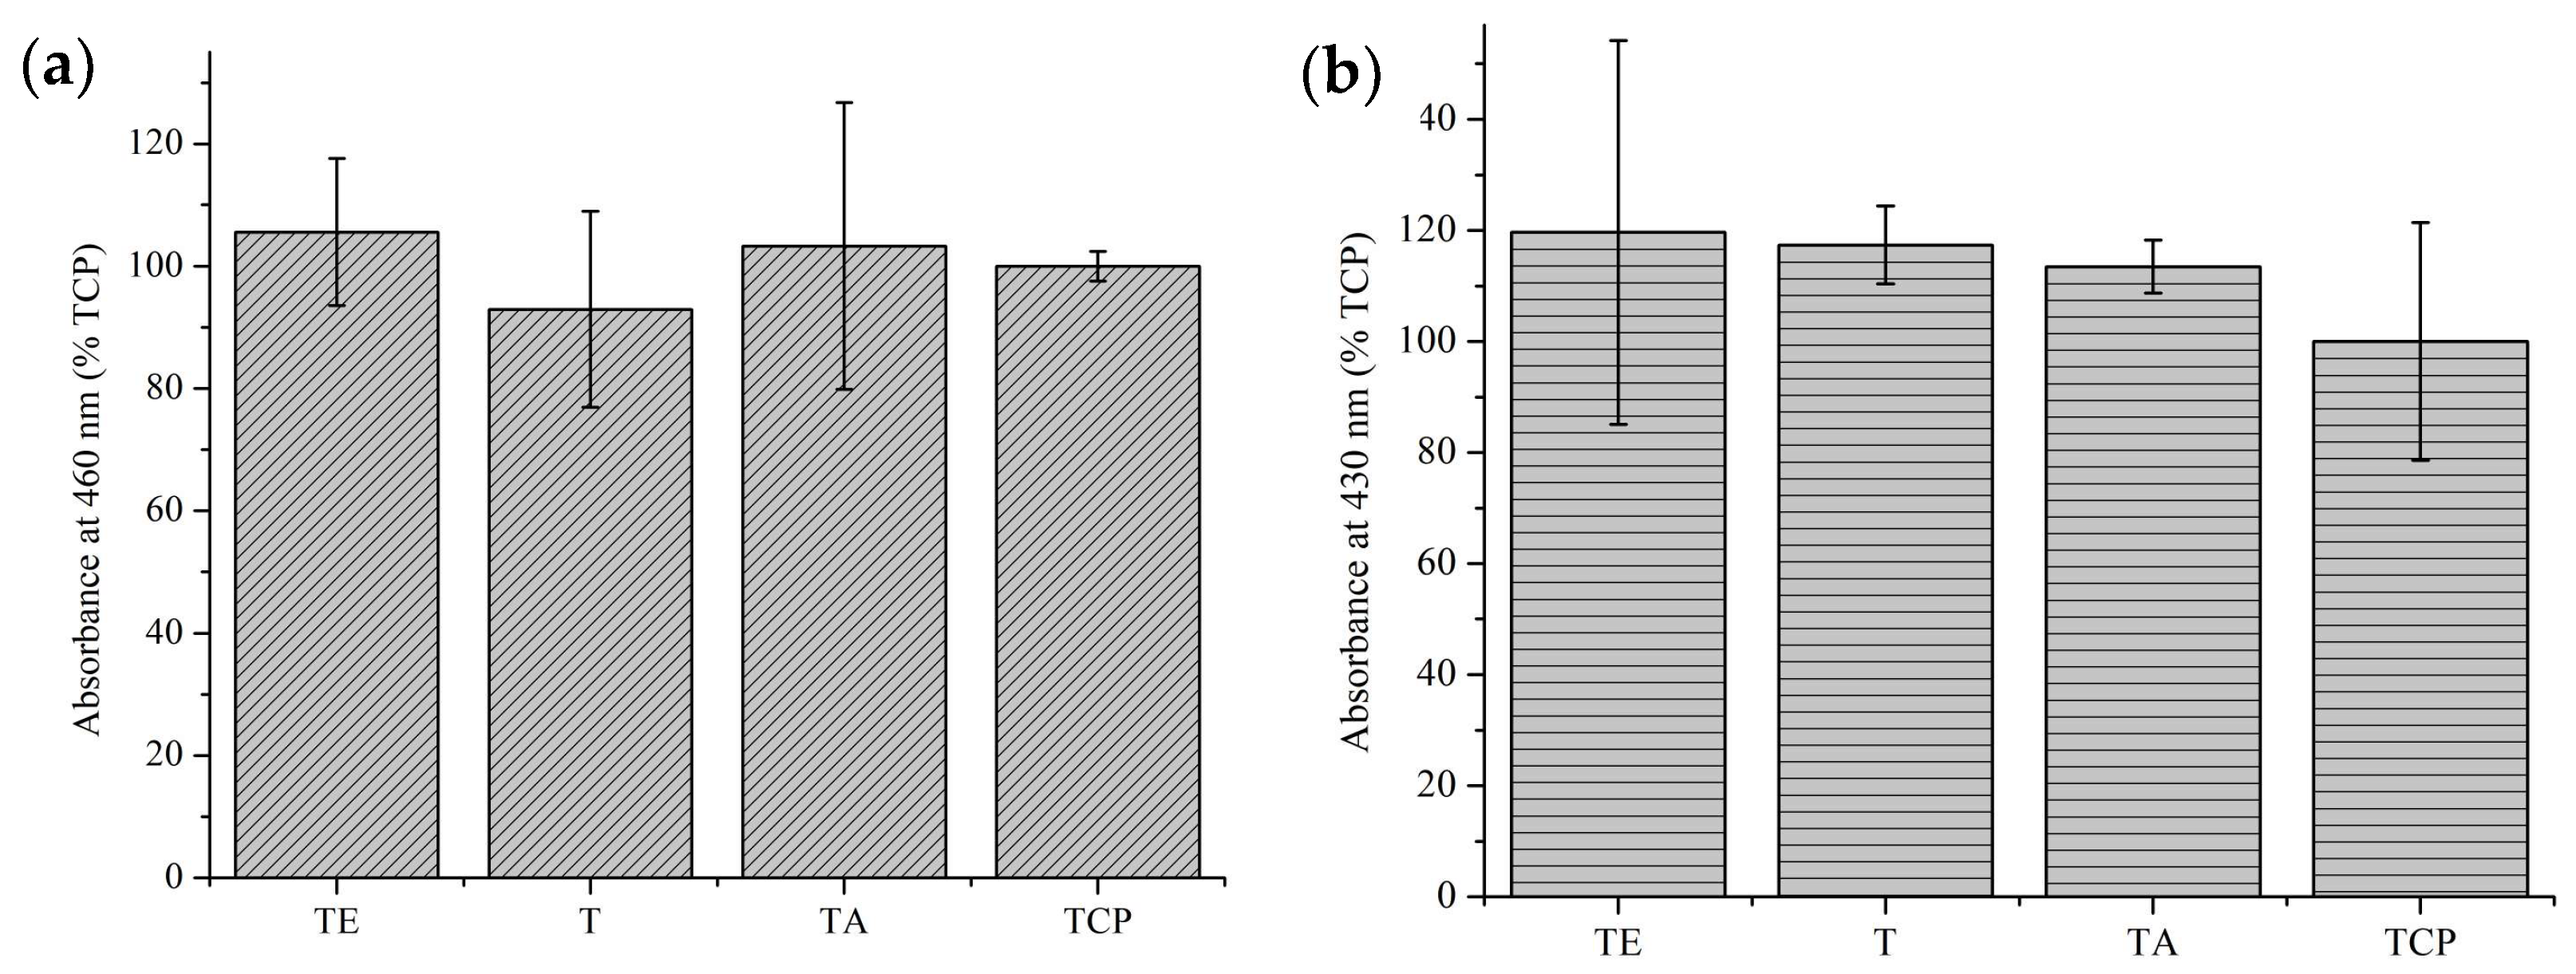
4.7. ECM Secretion Tests in Direct Contact
5. Conclusions
- Phase structure analyses via WAXS confirmed that explosive-induced α phase-ω martensitic transformation occurred in the whole volume of the titanium after explosive deformation. Additionally, crystallographic anisotropy was observed in all of the analyzed samples.
- Residual stresses are very non-uniform, both when considering the near-surface layer or deep into the material. The presence of a layer with a different, strongly changing distribution of residual stresses—the thickness of which ranges between 0.2 mm and 0.8 mm—was found. Below this layer, the state of residual stresses stabilizes.
- The corrosion tests allow us to conclude that, following deformation by explosion, the corrosion properties do not change significantly.
- The titanium deformed by explosion indicates similar biocompatibility as pure non-deformed titanium and is commonly implanted in titanium ally (type). The phase composition and crystallographic orientation do not influence the morphology of bone cells.
Author Contributions
Funding
Institutional Review Board Statement
Informed Consent Statement
Data Availability Statement
Conflicts of Interest
References
- ASTM F67-13; Standard Specification for Unalloyed Titanium, for Surgical Implant Applications (UNS R50250, UNS R50400, UNS R50550, UNS R50700). ASTM: West Conshohocken, PA, USA, 2017.
- ASTM F136; Standard Specification for Wrought Titanium-6Aluminum-4Vanadium ELI (Extra Low Interstitial) Alloy for Surgical Implant Applications (UNS R56401). ASTM: West Conshohocken, PA, USA, 2021.
- Aslantas, K.; Demir, B.; Guldibi, A.S. A comparative study on the machinability of β-type novel Ti29Nb13Ta4.6Zr (TNTZ) biomedical alloys under micro-milling operation. J. Manuf. Syst. 2023, 92, 135–146. [Google Scholar] [CrossRef]
- Ezugwu, E.O.; Da Silva, R.B.; Sales, W.F.; Machado, A.R. Overview of the machining of titanium alloys. Encycl. Sustain. Technol. 2017, 2, 487–506. [Google Scholar] [CrossRef]
- Holgers, K.M.; Thomsen, P.; Tjellstrom, A.; Bjursten, L.M. Immunohistochemical study of the soft tissue around long-term skin-penetrating titanium implants. Biomaterials 1995, 16, 611–616. [Google Scholar] [CrossRef]
- Engelhart, S.; Segal, R.J. Allergic Reaction to Vanadium Causes a Diffuse Eczematous Eruption and Titanium Alloy Orthopedic Implant Failure. Cutis 2017, 99, 245–249. [Google Scholar] [PubMed]
- Egusa, H.; Ko, N.; Shimazu, T.; Yatani, H. Suspected association of an allergic reaction with titanium dental implants: A clinical report. J. Prosthet. Dent. 2008, 100, 344–347. [Google Scholar] [CrossRef] [PubMed]
- Javed, F.; Al-hezaimi, K.; Almas, K.; Romanos, G.E. Is Titanium Sensitivity Associated with Allergic Reactions in Patients with Dental Implants. Clin. Implant. Dent. Relat. Res. 2013, 15, 47–52. [Google Scholar] [CrossRef] [PubMed]
- Müller, K.; Valentine-Thon, E. Hypersensitivity to titanium: Clinical and laboratory evidence. Neuro Endocrinol. Lett. 2007, 27, 31–35. [Google Scholar]
- du Preez, L.A.; Bütow, K.W.; Swart, T.J. Implant failure due to titanium hypersensitivity/allergy?—Report of a case. SADJ 2007, 62, 22–25. [Google Scholar]
- Sicilia, A.; Cuesta, S.; Coma, G. Titanium allergy in dental implant patients: A clinical study on 1500 consecutive patients. Clin. Oral. Implant. Res. 2008, 19, 823–835. [Google Scholar] [CrossRef]
- Hosoki, M.; Nishigawa, K.; Miyamoto, Y.; Ohe, G.; Matsuka, Y. Allergic contact dermatitis caused by titanium screws and dental implants. J. Prosthodont. Res. 2016, 60, 213–219. [Google Scholar] [CrossRef]
- Butler, P.; Gorgis, J.; Viberg, B.; Overgaard, S. Low evidence for implementation of well-documented implants regarding risk of early revision: A systematic review on total hip arthroplasty. EFORT Open. Rev. 2021, 6, 3–8. [Google Scholar] [CrossRef] [PubMed]
- Pijls, B.G.; Meessen, J.M.T.A.; Tucker, K. MoM total hip replacements in Europe: A NORE report. EFORT Open. Rev. 2019, 4, 423–429. [Google Scholar] [CrossRef] [PubMed]
- Holgers, K.M.; Roupe, G.; Tjellstrom, A.; Bjursten, L.M. Clinical, immunological and bacteriological evaluation of adverse reactions to skin-penetrating titanium implants in the headand neck region. Contact Dermat. 1992, 27, 1–7. [Google Scholar] [CrossRef] [PubMed]
- Han, X.; Sawada, T.; Schille, C.; Schweizer, E.; Scheideler, L.; Geis-Gerstorfer, J.; Rupp, F.; Spintzyk, S. Comparative Analysis of Mechanical Properties and Metal-Ceramic Bond Strength of Co-Cr Dental Alloy Fabricated by Different Manufacturing Processes. Materials 2018, 11, 1801. [Google Scholar] [CrossRef]
- Grosgogeat, B.; Vaicelyte, A.; Gauthier, R.; Janssen, C.; Le Borgne, M. Toxicological Risks of the Cobalt–Chromium Alloys in Dentistry: A Systematic Review. Materials 2022, 15, 5801. [Google Scholar] [CrossRef]
- Zhang, M.; Lv, B.; Zhang, F.; Feng, X. Explosion Deformation and Hardening Behaviours of Hadfield Steel Crossing. ISIJ Int. 2012, 52, 2093–2095. [Google Scholar] [CrossRef]
- Gloc, M.; Przybysz-Gloc, S.; Wachowski, M.; Kosturek, R.; Lewczuk, R.; Szachogłuchowicz, I.; Paziewska, P.; Maranda, A.; Ciupiński, Ł. Research on Explosive Hardening of Titanium Grade 2. Materials 2023, 16, 847. [Google Scholar] [CrossRef]
- Cerreta, E.; Gray, G.T.; Lawson, A.C. The influence of oxygen content on the α to ω phase transformation and shock hardening of titanium. J. Appl. Phys. 2006, 100, 013530. [Google Scholar] [CrossRef]
- Marola, S.; Bosia, S.; Veltro, A.; Fiore, G.; Manfredi, D.; Lombardi, M.; Battezzati, L. Residual stresses in additively manufactured AlSi10Mg: Raman spectroscopy and X-ray diffraction analysis. Mat. Des. 2021, 202, 109550. [Google Scholar] [CrossRef]
- ISO 12106:2017; Metallic Materials, Fatigue Testing, Axial-Strain-Controlled Method. ISO: Geneva, Switzerland, 2017; p. 38.
- ASTM Standard E 837; Determining Residual Stress by the Hole-Drilling Strain-Gage Method. ASTM: West Conshohocken, PA, USA, 2013.
- Tech Note TN-503-6; Measurement of Residual Stresses by the Hole-Drilling Strain Gage Method. Micro-Measurements: Wendell, NC, USA, 1993.
- Shafi, M.P.; Bose, C.A. Impact of crystalline defects and size on X-ray line broadening: A phenomenological approach for tetragonal SnO2 nanocrystals. AIP Adv. 2015, 5, 057137. [Google Scholar] [CrossRef]
- Guo, Y.; Jia, B.; Zhou, Q.; Chen, W.; Ren, Y.; Liu, R.; Arab, A.; Ran, C.; Chen, P. Enhancement of mechanical properties of commercially pure titanium by shock induced gradient microstructure with martensitic transformation. Mat. Sci. Eng. A 2022, 863, 144542. [Google Scholar] [CrossRef]
- Trinkle, D.R.; Hennig, R.G.; Srinivasan, S.G.; Hatch, D.M.; Jones, M.D.; Stokes, H.T.; Albers, R.C.; Wilkins, J.W. New Mechanism for the α to ω Martensitic Transformation in Pure Titanium. Phys. Rev. Lett. 2003, 91, 025701. [Google Scholar] [CrossRef] [PubMed]
- Chen, L.; Wang, Y.; Hao, X.; Zhang, X.; Liu, H. Lightweight refractory high entropy alloy coating by laser cladding on Ti–6Al–4V surface. Vacuum 2021, 183, 109823. [Google Scholar] [CrossRef]
- Luo, L.; Su, Y.; Guo, J.; Fu, H. Formation of titanium hydride in Ti–6Al–4V alloy. J. Alloys Comp. 2006, 425, 140–144. [Google Scholar] [CrossRef]
- Jamieson, J.C. Crystal Structures of Titanium, Zirconium, and Hafnium at High Pressures. Science 1963, 140, 72–73. [Google Scholar] [CrossRef] [PubMed]
- ISO 10993-5:2009; Biological Evaluation of Medical Devices, Part 5: Tests for In Vitro Cytotoxicity. ISO: Geneva, Switzerland, 2009; p. 34.


| Substance | Contents [g/dm3] |
|---|---|
| NaCl | 6.0 |
| KCl | 0.075 |
| CaCl2 | 0.1 |
| NaHCO3 | 0.1 |
| Cyclic Strength Coefficient, K′ [MPa] | Cyclic Strain Hardening Exponent, n′ | Coefficient of Determination, R2 |
|---|---|---|
| 1007.5 | 0.0911 | 0.469 |
| Number of measuring point | |||||||||
| # 1 | # 2 | # 3 | |||||||
| depth [mm] | 0.0 | 0.5 | 1.0 | 0.0 | 0.5 | 1.0 | 0.0 | 0.2 | 1.0 |
| residual stresses σ [MPa] and angular orientation α [°] | |||||||||
| σmax | −16 | −1 | 25 | 105 | 76 | 47 | −100 | 26 | 4 |
| σmin | −26 | −34 | −51 | 11 | 10 | 7 | >σY | −74 | −124 |
| Number of measuring point | |||||||||
| # 4 | # 5 | # 6 | |||||||
| depth [mm] | 0.0 | 0.3 | 1.0 | 0.0 | 0.7 | 1.0 | 0.0 | 0.6 | 1.0 |
| residual stresses σ [MPa] and angular orientation α [°] | |||||||||
| σmax | 24 | −186 | 59 | 38 | 71 | 198 | 86 | 42 | 35 |
| σmin | 5 | −292 | −7 | 7 | −19 | 96 | 74 | −23 | −11 |
| Material | U [mV] | I [nA/cm2] | Corrosion Rate (CR) [mm/year] |
|---|---|---|---|
| T (pure titanium non deformed | −469 | 4.6 | 0.00008 |
| TE (pure titanium deformed) | −490 | 5.5 | 0.0001 |
Disclaimer/Publisher’s Note: The statements, opinions and data contained in all publications are solely those of the individual author(s) and contributor(s) and not of MDPI and/or the editor(s). MDPI and/or the editor(s) disclaim responsibility for any injury to people or property resulting from any ideas, methods, instructions or products referred to in the content. |
© 2023 by the authors. Licensee MDPI, Basel, Switzerland. This article is an open access article distributed under the terms and conditions of the Creative Commons Attribution (CC BY) license (https://creativecommons.org/licenses/by/4.0/).
Share and Cite
Gloc, M.; Przybysz, S.; Dulnik, J.; Kołbuk, D.; Wachowski, M.; Kosturek, R.; Ślęzak, T.; Krawczyńska, A.; Ciupiński, Ł. A Comprehensive Study of a Novel Explosively Hardened Pure Titanium Alloy for Medical Applications. Materials 2023, 16, 7188. https://0-doi-org.brum.beds.ac.uk/10.3390/ma16227188
Gloc M, Przybysz S, Dulnik J, Kołbuk D, Wachowski M, Kosturek R, Ślęzak T, Krawczyńska A, Ciupiński Ł. A Comprehensive Study of a Novel Explosively Hardened Pure Titanium Alloy for Medical Applications. Materials. 2023; 16(22):7188. https://0-doi-org.brum.beds.ac.uk/10.3390/ma16227188
Chicago/Turabian StyleGloc, Michał, Sylwia Przybysz, Judyta Dulnik, Dorota Kołbuk, Marcin Wachowski, Robert Kosturek, Tomasz Ślęzak, Agnieszka Krawczyńska, and Łukasz Ciupiński. 2023. "A Comprehensive Study of a Novel Explosively Hardened Pure Titanium Alloy for Medical Applications" Materials 16, no. 22: 7188. https://0-doi-org.brum.beds.ac.uk/10.3390/ma16227188