Article

Low Temperature Synthesis and Characterization of AlScMo3O12

Department of Chemistry & Biochemistry, the University of Toledo, Toledo, OH 43606, USA
*
Author to whom correspondence should be addressed.
Submission received: 26 December 2014 / Revised: 13 January 2015 / Accepted: 10 February 2015 / Published: 16 February 2015
(This article belongs to the Section Advanced Materials Characterization)

Abstract

:
Recent interest in low and negative thermal expansion materials has led to significant research on compounds that exhibit this property, much of which has targeted the A2M3O12 family (A = trivalent cation, M = Mo, W). The expansion and phase transition behavior in this family can be tuned through the choice of the metals incorporated into the structure. An undesired phase transition to a monoclinic structure with large positive expansion can be suppressed in some solid solutions by substituting the A-site by a mixture of two cations. One such material, AlScMo3O12, was successfully synthesized using non-hydrolytic sol-gel chemistry. Depending on the reaction conditions, phase separation into Al2Mo3O12 and Sc2Mo3O12 or single-phase AlScMo3O12 could be obtained. Optimized conditions for the reproducible synthesis of stoichiometric, homogeneous AlScMo3O12 were established. High resolution synchrotron diffraction experiments were carried out to confirm whether samples were homogeneous and to estimate the Al:Sc ratio through Rietveld refinement and Vegard’s law. Single-phase samples were found to adopt the orthorhombic Sc2W3O12 structure at 100 to 460 K. In contrast to all previously-reported A2M3O12 compositions, AlScMo3O12 exhibited positive thermal expansion along all unit cell axes instead of contraction along one or two axes, with expansion coefficients (200–460 K) of αa = 1.7 × 10⁻⁶ K−1, αb = 6.2 × 10⁻⁶ K−1, αc = 2.9 × 10⁻⁶ K−1 and αV = 10.8 × 10⁻⁶ K−1, respectively.

Graphical Abstract

1. Introduction

Expansion is an important property of a material for many applications [1,2,3,4]. While positive thermal expansion materials are a well-established field, negative thermal expansion (NTE) materials have only been thoroughly studied for a couple of decades [5,6,7,8,9,10,11,12,13,14,15,16,17,18,19,20,21,22,23,24,25,26,27,28,29,30,31,32,33,34,35,36,37,38]. NTE materials contract upon heating, which is described by a negative thermal expansion coefficient α. This unusual behavior is found in a number of corner-sharing polyhedral networks. In most materials, longitudinal vibrations along the bonds between neighboring atoms cause bond expansion upon heating, but other mechanisms outweigh the bond expansion in NTE materials. A frequently found mechanism is the occurrence of low energy phonon modes that induce the tilting of rigid or quasi-rigid polyhedra in corner-shared networks [24,27,39,40,41]. NTE materials that possess stiff M–O bonds and linear M–O–M linkages can exhibit transverse vibrations of the oxygen atoms that decrease the distances between the metal atoms. Such motions can cause coupled rotations of the corner-sharing polyhedra, resulting in contraction of the entire structure (Figure 1).
Figure 1. The mechanism of negative thermal expansion due to transverse atomic vibrations: (a) transverse motion of an oxygen atom in an M–O–M linkage; and (b) cooperative rocking of polyhedra causing a decrease in average metal-metal distances. The squares correspond to the locations of the metal atoms before (solid) and after (dotted) tilting.
Materials 08 00700 g001
NTE materials are of particular interest due to their potential to control the expansion of other materials in composites, especially in applications where compounds are subjected to repeated changes in temperature. Ideally, NTE compounds can be integrated as fillers into other materials to form a composite with an altered expansion coefficient, which can be controlled in positive ranges, negative ranges or even held at zero [3,4,42,43,44,45,46,47,48]. An alternative approach that has received recent attention is the formation of substituted NTE materials, in which the intrinsic expansion coefficient of the material can be tuned to match other materials. However, potential applications of these materials in optical or electronic composites, or as substrates or coatings, depend on the absence of discontinuous phase transitions in the working temperature range.
The A2M3O12 family of negative thermal expansion materials, where A is a trivalent metal and M is either molybdenum or tungsten, is of particular interest. A wide range of cations can be substituted into the structure, which can result in materials with a single cation on each site or with cation mixtures on the A or M sites [32,35,49,50]. Many A2M3O12 compounds have been found to display a reversible temperature-induced phase transition between orthorhombic and monoclinic phases at high and low temperatures, respectively. The absence or occurrence of phase transitions depends strongly on the cations present in the structure [35,51]. The monoclinic phase exhibits positive thermal expansion (PTE) for all compositions, while most orthorhombic materials display volume NTE. The expansion behavior in the orthorhombic phase is anisotropic, with NTE along one or two unit cell axes and PTE along the remaining axes. Generally, for compositions that contain a single A-site cation, a lowering of the phase transition temperature is observed for larger or more electropositive cations [51]. Larger cations are also associated with more negative expansion coefficients [52]. In a number of systems, mixing of two trivalent A-site cations results in intermediate expansion coefficients that approximately follow the rule of mixtures and allows the preparation of solid solutions with close to zero thermal expansion [53,54,55,56,57]. However, mixed A-site cations can also result in more complex behavior. For example, Ari et al. reported that the phase transition temperatures of Al2−xCrxMo3O12, Al2−xFexMo3O12 and Cr2−xFexMo3O12 obey the rule of mixtures, while the expansion coefficients show very distinct behavior in the different systems [58]. For Al2−xCrxMo3O12 and Cr2−xFexMo3O12, a linear decrease in the expansion coefficient with increasing fraction of Cr3+ is observed, while Al2−xFexMo3O12 compositions show more positive expansion coefficients than either Al2Mo3O12 or Fe2Mo3O12, indicating that other factors must play a role as well. Another interesting observation is that AlInW3O12 adopts an orthorhombic structure and shows approximately zero volume expansion between room temperature and 1000 K [35]. This is intriguing, as In2W3O12 adopts the monoclinic structure up to 473 K [59], while Al2W3O12 undergoes the monoclinic-to-orthorhombic transition at 267 K [51]. The ability to not only tune expansion coefficients, but also suppress the undesirable phase transition to the monoclinic PTE phase is useful for potential applications [58]. A better understanding of how cation mixing influences phase transition behavior and stabilizes the orthorhombic NTE structure at lower temperatures is clearly desirable.
Low temperature synthetic approaches are attractive for the preparation of mixed metal oxides, as high temperature routes often require large numbers of grind/heat cycles to achieve homogeneous particles. One such method is the non-hydrolytic sol gel (NHSG) process, which was shown to provide an elegant route to mixed metal oxides [60,61,62,63,64]. It was previously demonstrated that this chemistry can be applied to the synthesis of A2M3O12 compounds. Reports included the preparation of Ga2Mo3O12 [65], which cannot be obtained by solid-state routes, a new polymorph of Y2Mo3O12 [66] and the crystallization of MgAIVM3O12 (AIV = Zr, Hf; M = Mo, W) compositions [67]. Many other compositions were obtained at considerably lower temperatures than samples prepared by other methods [68]. This demonstrates that the NHSG approach offers the potential to obtain compounds with cations that do not readily form A2M3O12 compositions (e.g., Ga) and that the intimate mixing in solution can result in more facile crystallization. These observations suggest that this method should also be suitable for combining cations with considerably different ionic radii under optimized reaction conditions. In this paper, we demonstrate the extension of NHSG methods to AlScMo3O12, a quaternary AA’M3O12 compound, where A and A’ are two different trivalent metals with very different radii (Sc r63+ = 75 pm; Al r63+ = 39 pm) [69]. While AlScMo3O12 can be obtained by traditional ceramic methods [55], the ability to prepare NTE materials at lower temperatures by NHSG chemistry gives access to smaller particles, which are expected to result in better dispersion and property transfer in filler/matrix composites.
Solution-based routes offer much better kinetics than high-temperature, solid-state approaches; however, they may produce inhomogeneous products if different precursors react at different rates in solution. The relative reaction rates can often be modified through the careful choice of reaction variables. Low temperature routes give access to a considerable number of tunable variables, like solvent system, precursor reactivity, concentrations, temperature and time, which allows optimization of the reaction conditions to obtain homogeneous, stoichiometric products. Here, we present a study on the synthesis of AlScMo3O12 as a function of synthetic variables in NHSG routes. Conditions were optimized to obtain a single-phase homogeneous material with the desired stoichiometry. Samples were characterized by high-resolution diffraction to address whether single-phase powders were obtained, and the expansion behavior was determined by variable temperature diffraction experiments.

2. Experimental Section

Reactions were carried out in dried glassware using a glove box and standard Schlenk techniques. Starting metal halides included aluminum chloride (AlCl3, Strem Chemicals, 99.99%, Newburyport, MA, USA), scandium chloride (ScCl3, Strem Chemicals, 99.99%, Newburyport, MA, USA) and molybdenum chloride (MoCl5, Strem Chemicals, 99.6%, Newburyport, MA, USA). In a typical reaction, 0.133 g of AlCl3, 0.151 g of ScCl3 and 0.820 g of MoCl5 were added to a glass ampoule (1:1:3 millimolar ratio). Under stirring, 10 mL of acetonitrile were added. The ampoule was capped with a septum and transferred to a Schlenk line, where 1.8 mL (12.8 mmol) of diisopropyl ether were added by syringe. The solution was allowed to stir for about 1 h during and between the addition of solvent and ether. The ampoule was cooled in liquid nitrogen, evacuated and flame sealed. It was heated at 150 °C for a period of 7 days. The ampoule was then opened in air, and a dark brown/black tar-like product was recovered by evaporation. To obtain a powder, the tar-like product was heated at 300 °C for 3 h. This dark grey powder, which still contains organic residues and is generally amorphous, will be referred to as the “raw” product for the remainder of this paper. The reaction variables explored during synthesis included the type of solvent (CH3CN and CHCl3), the volume of solvent (3 to 20 mL), temperature (110 to 150 °C) and heating time (3 to 27 days).
Heat treatments were performed on the raw samples to induce crystallization. Raw samples were heated either stepwise to 500, 600 and 700 °C or directly to 700 °C over a period of 2 to 2.5 h, annealed at each temperature for 3 h and quenched in air. Samples were characterized using powder X-ray diffraction (PXRD), thermogravimetric analysis (TGA), scanning electron microscopy (SEM) and energy dispersive X-ray spectroscopy (EDS). PXRD data were collected on a PANalytical X’Pert Pro diffractometer with an X’Celerator detector in Bragg-Brentano geometry using Cu Kα radiation. High-resolution PXRD data were obtained at Argonne National Laboratory’s beamline 11-BM at wavelengths of 0.41348, 0.41334 and 0.41388 Å during separate visits. Samples were packed inside 0.8-mm Kapton capillaries. PXRD patterns were analyzed using Jade and the PDF2 database, and refinements were carried out in Topas Academic. Variable temperature diffraction data were also collected at 11-BM at temperatures between 100 and 460 K with approximately 40 K steps between datasets. Thermogravimetric analysis was carried out on a TA Instruments SDT 2960 Simultaneous TGA-DTA to determine the amount of residual organics in the raw samples and the decomposition temperature of the crystalline samples obtained after heat treatment. Air was used as the carrier gas at a flow rate of 110 to 120 mL/min. Raw samples were heated at 10 °C/min to 700 °C, followed by an isothermal treatment for 15 min and cooling to room temperature. A second heating cycle at 10 °C/min to 1200 °C was initiated upon completion of the first cycle. Scanning electron microscopy was carried out on a JEOL JSM-6100 microscope with a Bruker Quantax EDS system with an XFlash 5100 detector. Images were collected at 2 kV on uncoated samples. EDS measurements were carried out at 15 kV using the point, multipoint and mapping approaches. Mapping results were utilized to get a general idea of the sample homogeneity, while numerical results reported in this manuscript were obtained by averaging point or multipoint analysis results for a number of individual grains. Homogeneous samples are expected to give very similar numbers for all point measurements, leading to small statistical errors on the average stoichiometry, while inhomogeneous samples will return different ratios for different grains and the resulting large errors on averages.

3. Results and Discussion

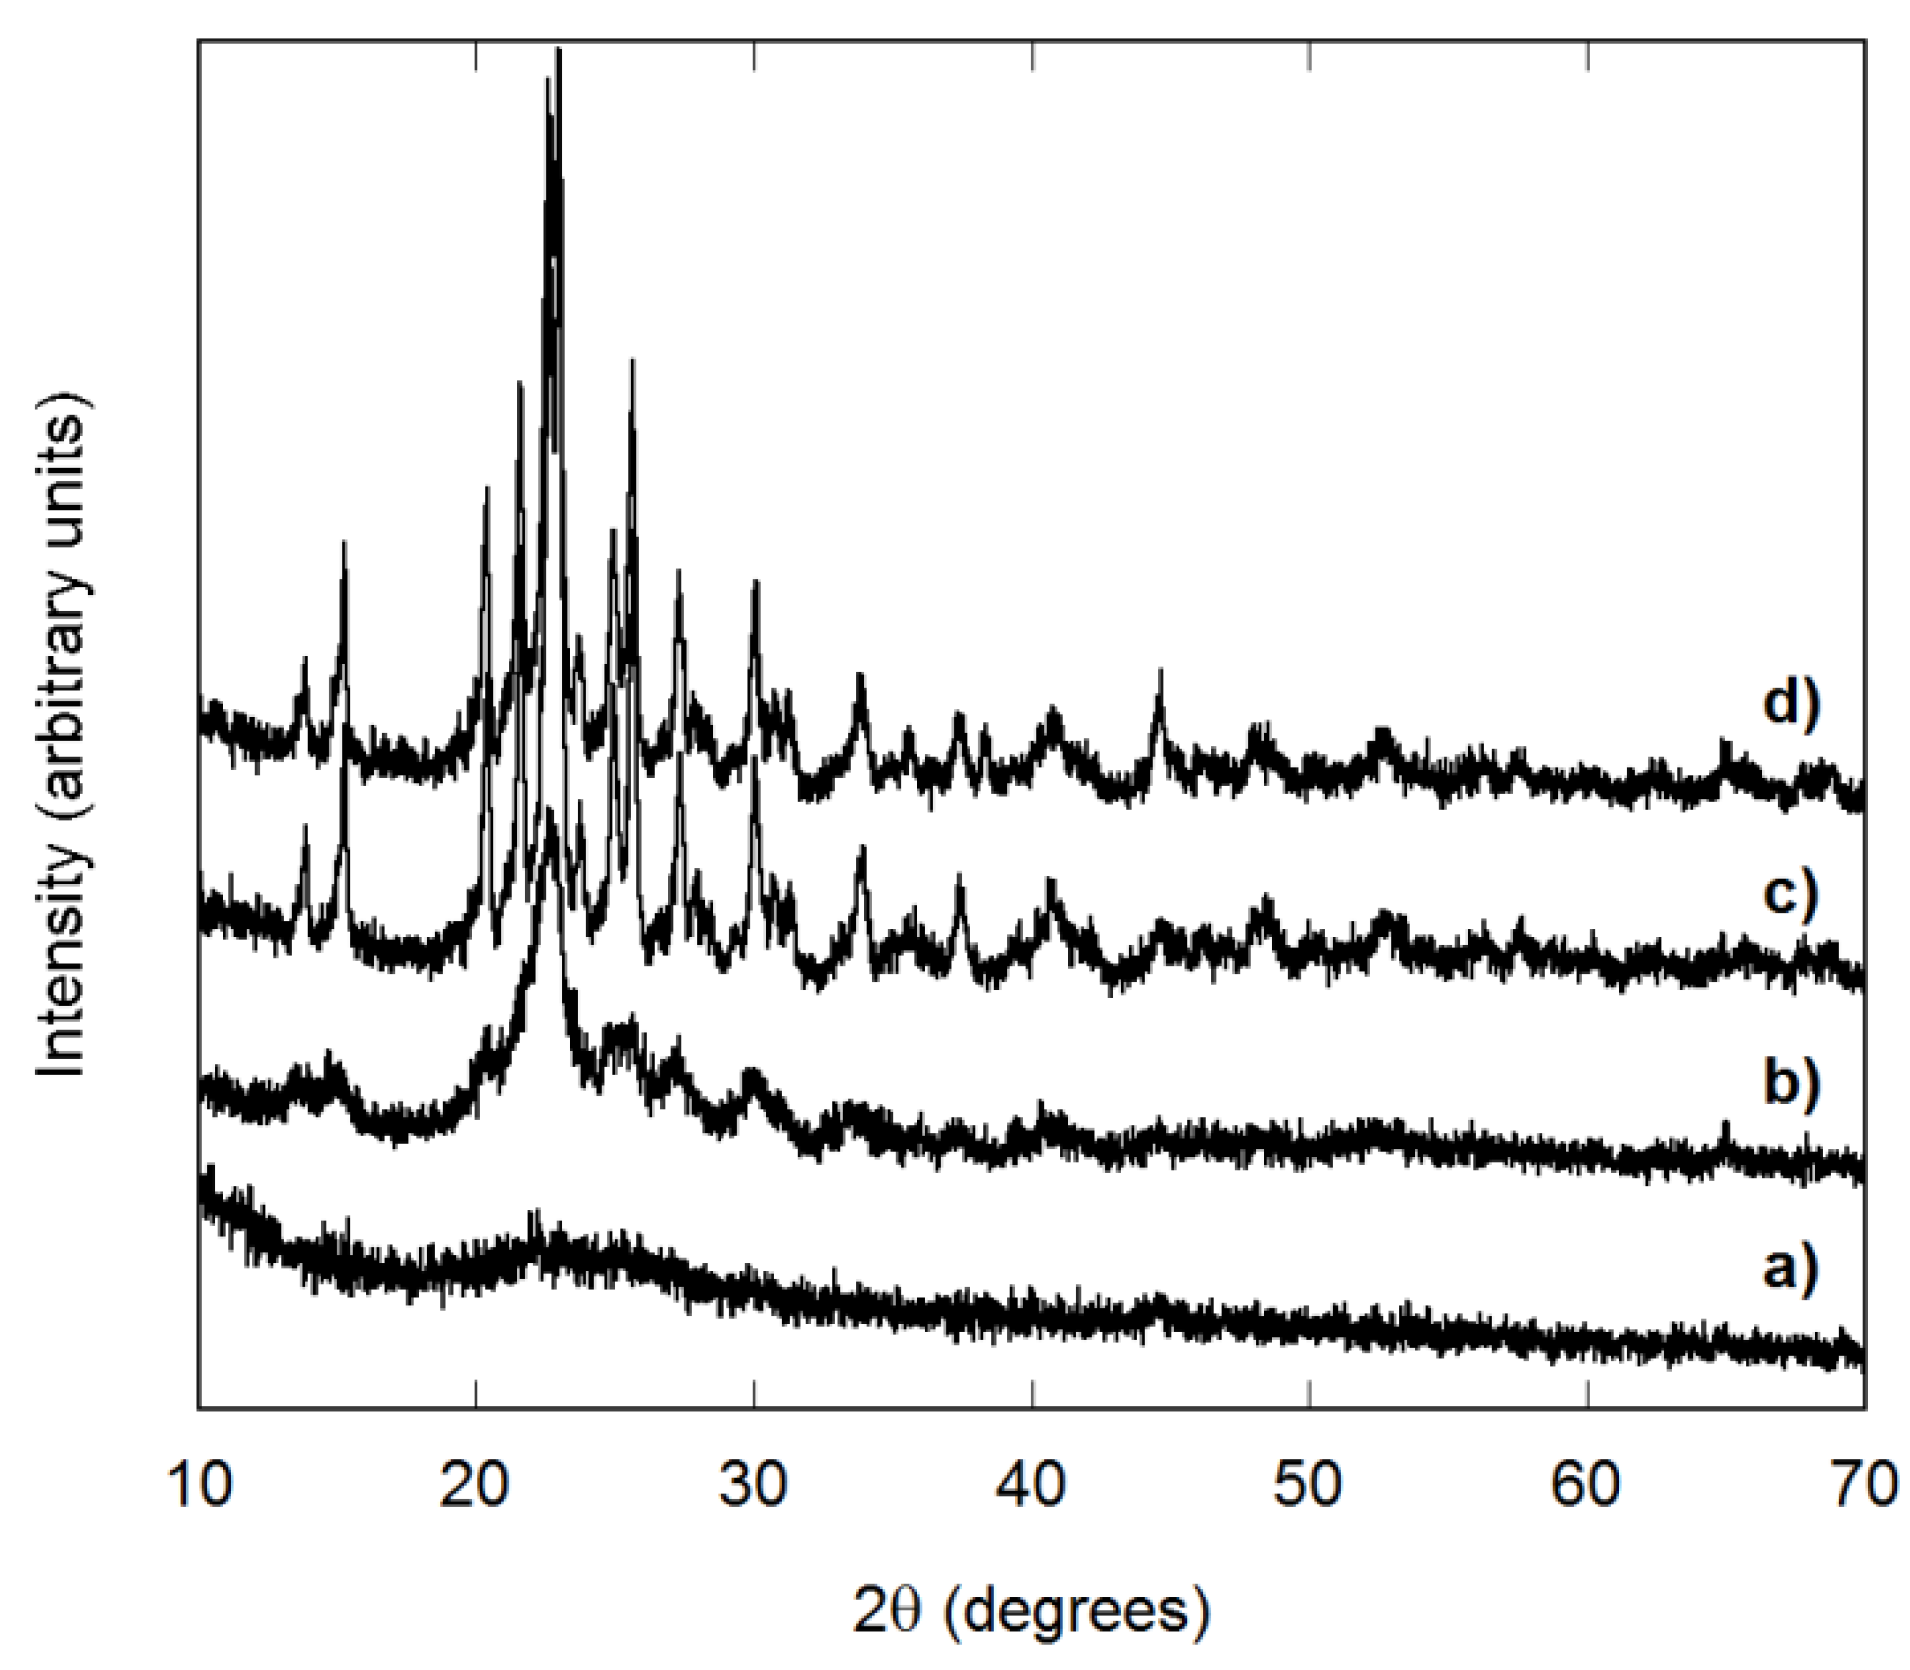
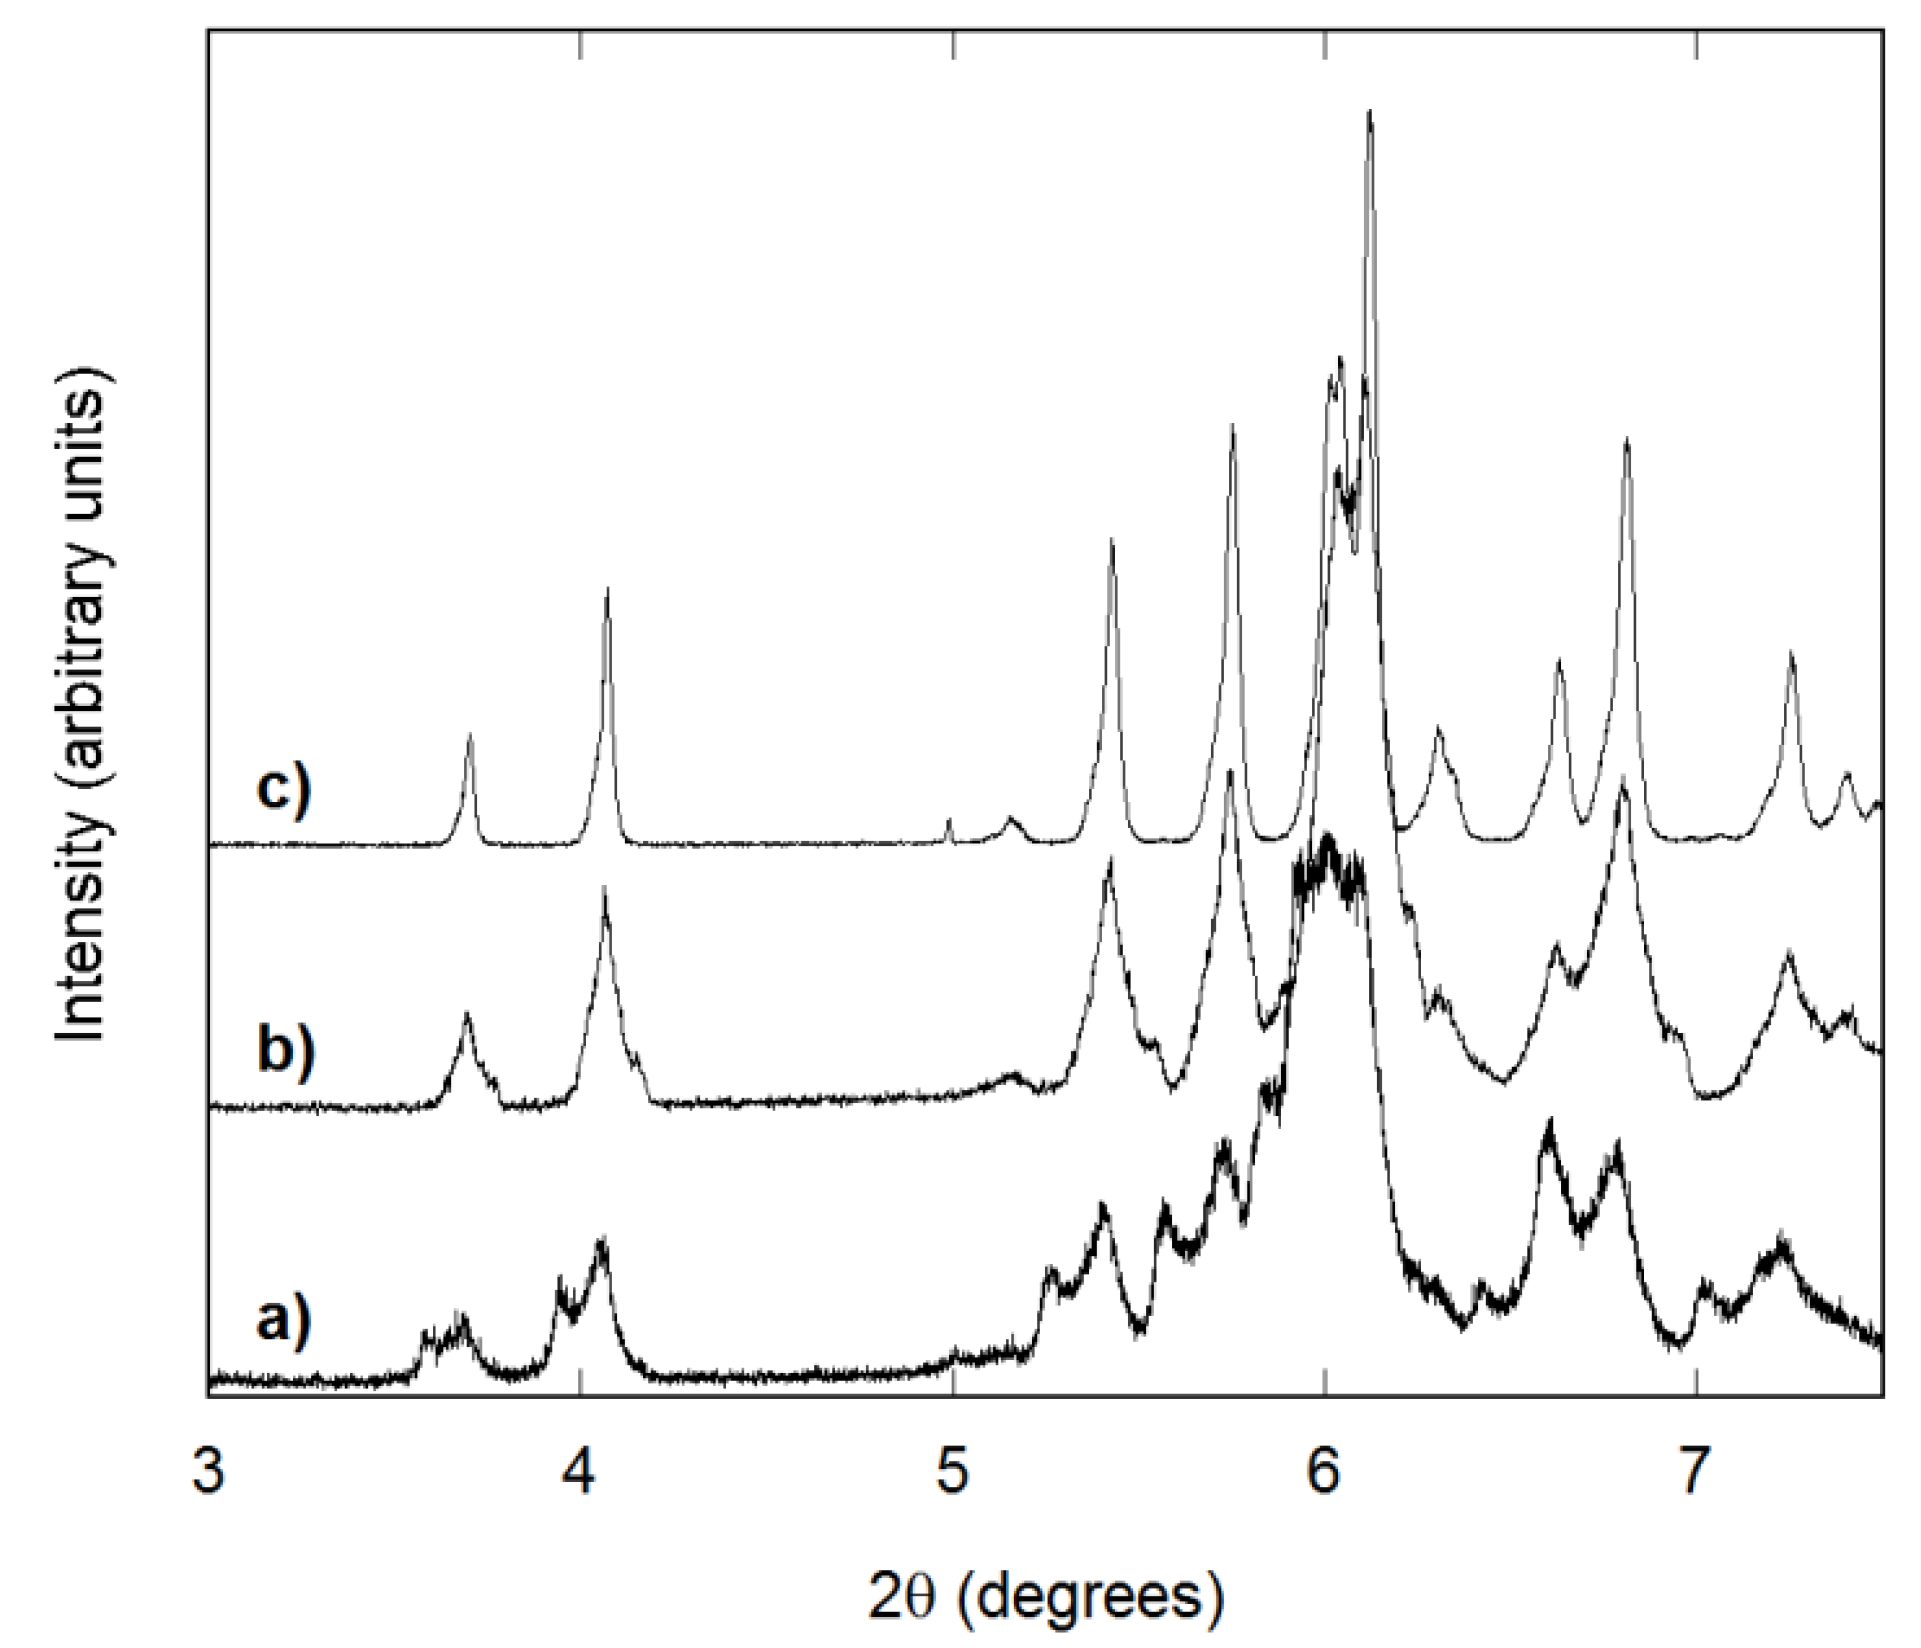
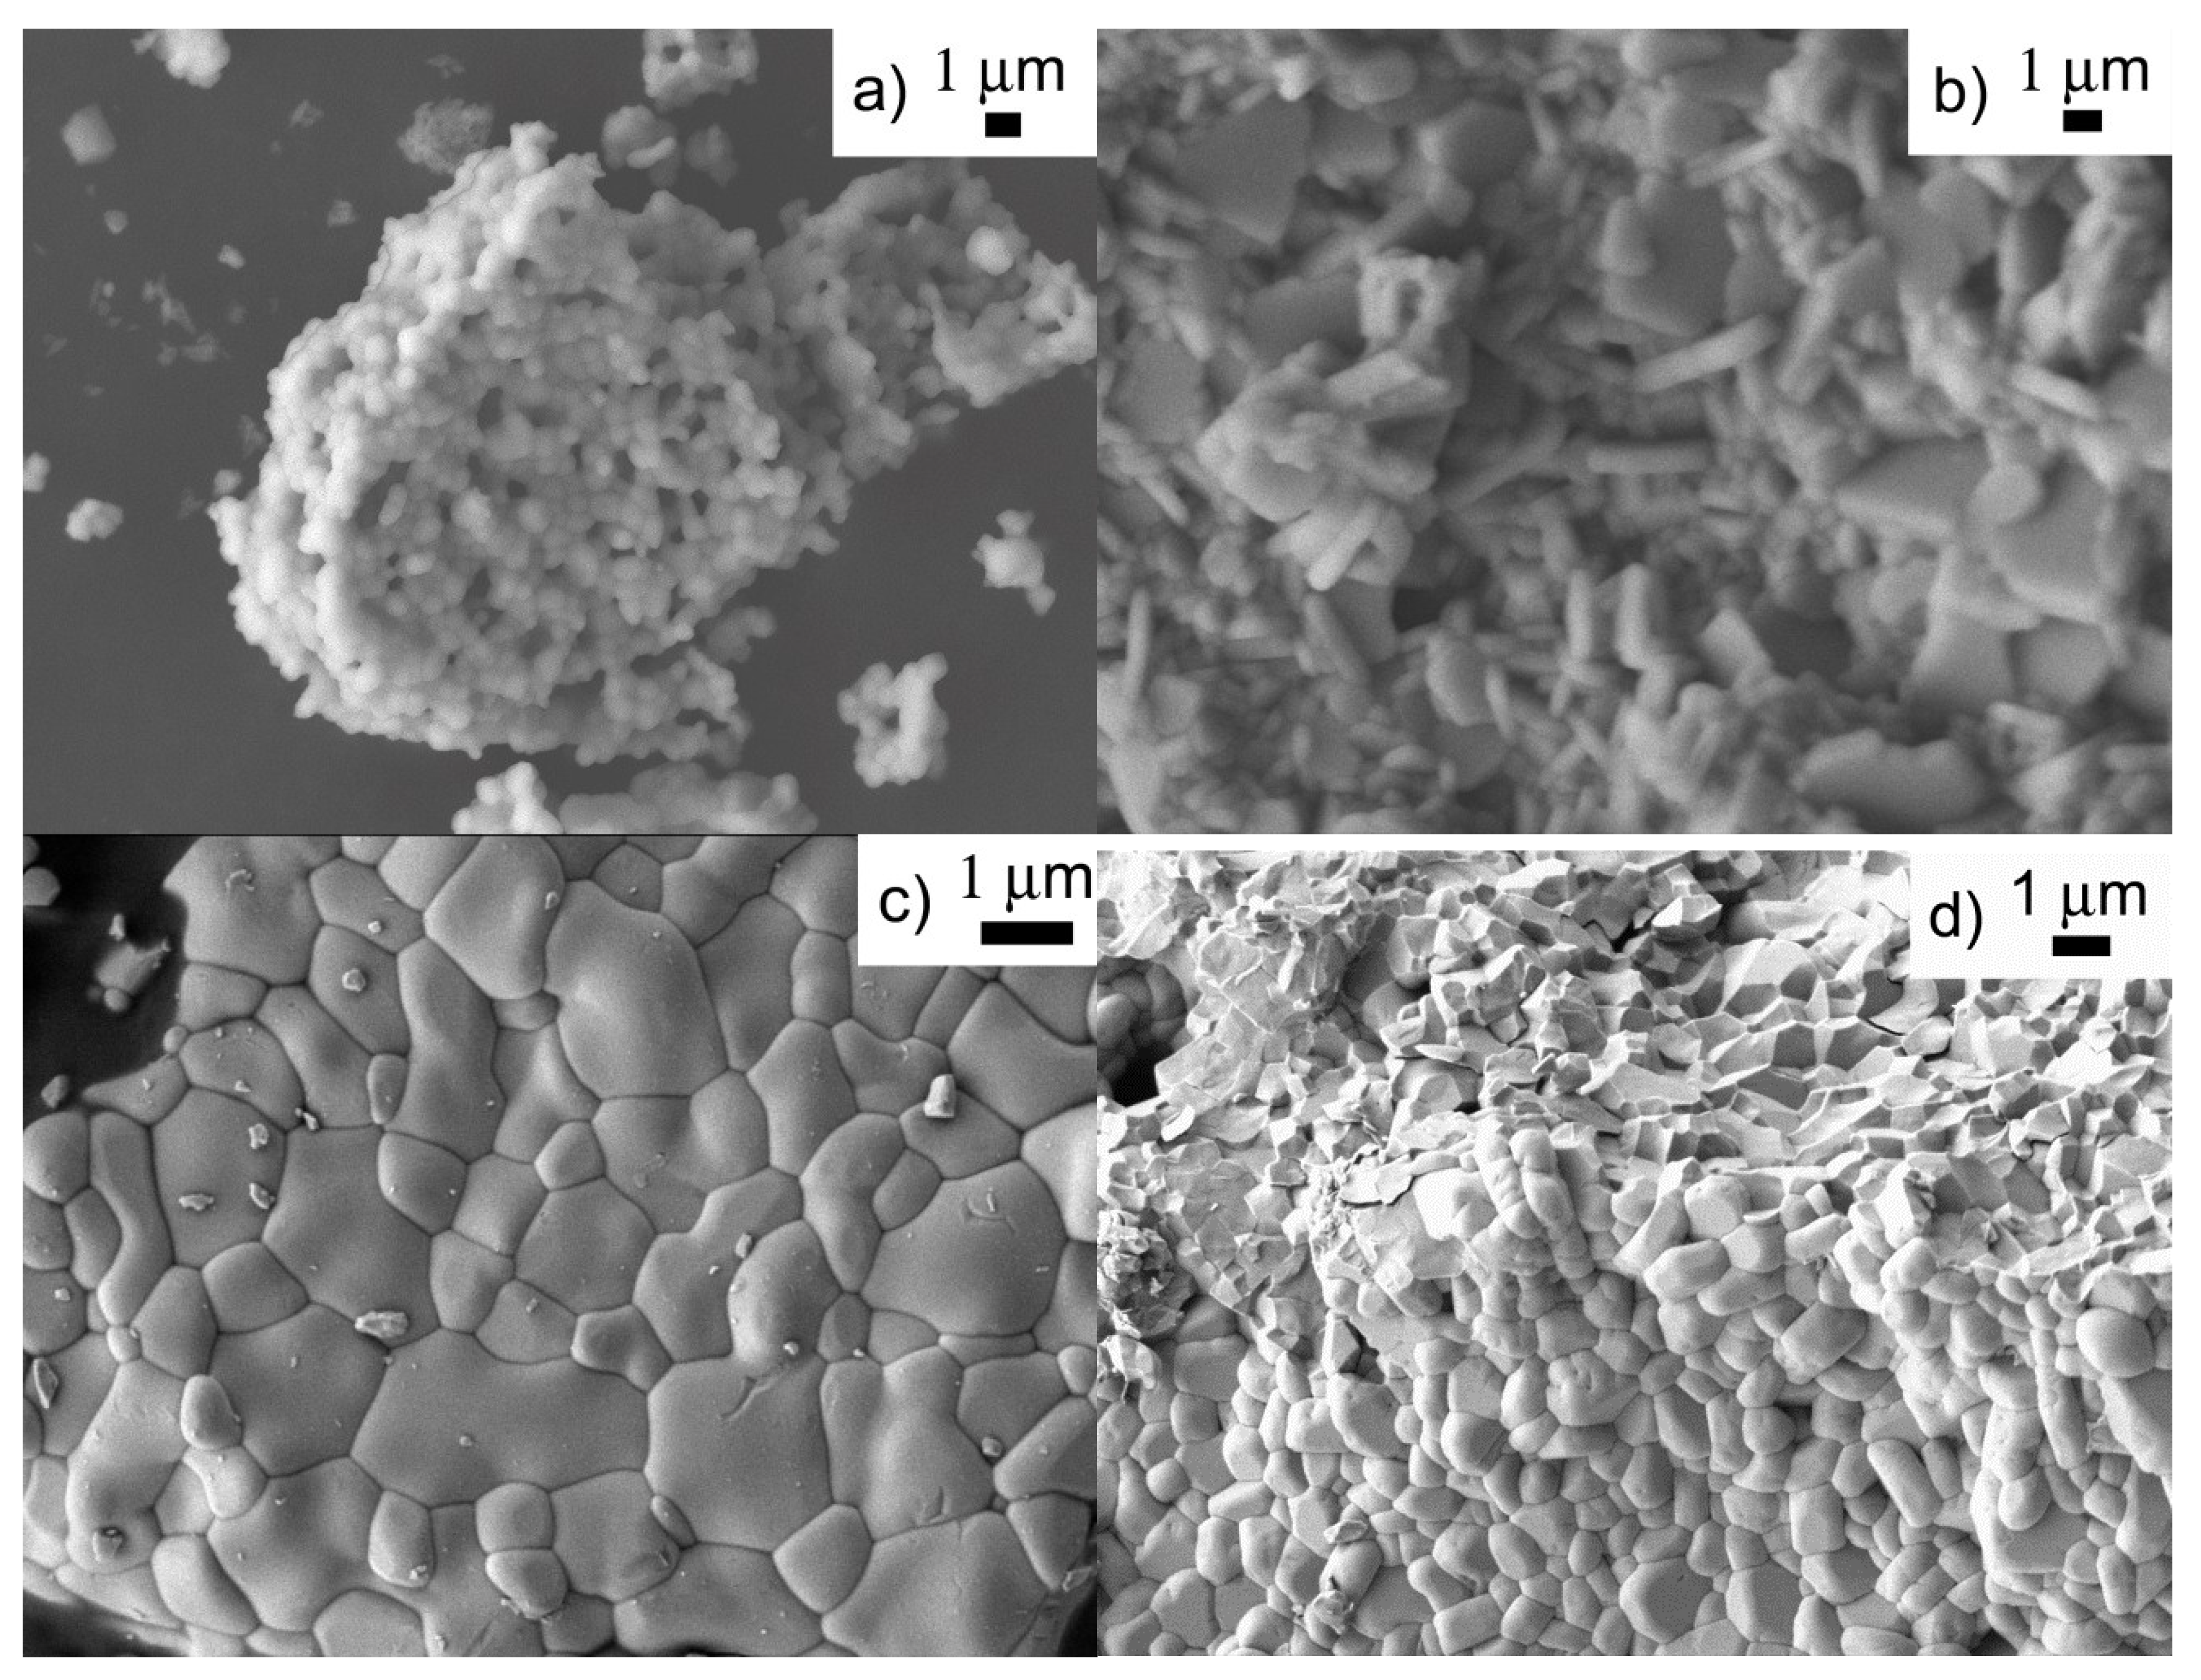
3.1. Reaction Completeness and Crystallization Behavior

All raw samples recovered in this project contained significant amounts of organics, as expected from their dark grey color. TGA data showed between 15 and 80 wt.% of organic residues, which burned off at temperatures up to 500 °C, suggesting that heat treatments should be carried out at this temperature or higher. The second TG-DTA run showed that the crystalline samples decomposed at temperatures around 900 °C. This decomposition is a result of the volatility of MoO3. Pure MoO3 evaporates above 750 °C, and many molybdates start losing MoO3 at similar or slightly higher temperatures. Al2Mo3O12 is known to decompose around 900 °C in TGA experiments, while Sc2Mo3O12 is stable to temperatures in excess of 1200 °C [68]. The decomposition temperature of the samples is similar to Al2Mo3O12, indicating that AlScMo3O12 may phase separate into Al2Mo3O12 and Sc2Mo3O12 before it decomposes. For a small number of samples, evaporation of 1–5 wt.% of unreacted MoO3 was observed at 750 °C, indicating an incomplete reaction. Most samples showed no losses up to 900 °C and total weight losses consistent with the targeted AlScMo3O12 stoichiometry.
All raw samples recovered in this project were amorphous (Figure 2a). PXRD studies showed starting crystallization after heating to 500 °C for 3 h (Figure 2b), but samples recovered after 500 or 600 °C heat treatments were still not fully crystalline. Continued heating to 700 °C for 3 h generally resulted in well-crystallized samples (Figure 2c). Most samples matched the PDF card for Fe2Mo3O12 (33-0661), which suggests approximately stoichiometric AlScMo3O12, as the size of the Fe3+ cation in octahedral coordination is halfway between Al3+ and Sc3+. As direct heat treatments of raw samples to 700 °C gave equal or better crystallinity (Figure 2d), most samples were directly heated to 700 °C for 3 h. Longer heating at 700 °C (up to 24 h) did not improve crystallinity, and heating at 750 °C or higher led to weight loss due to MoO3 evaporation and a shift in peak positions towards those of the PDF card for Sc2Mo3O12 (72-2078). The observation of significant weight losses during extended heat treatments (12 wt.% after 24 h at 800 °C) indicates that the higher decomposition temperatures observed by TGA are a result of the fast heating rate, which does not allow the sample to reach thermal equilibrium.
Figure 2. Laboratory PXRD data for AlScMo3O12 samples: (a) as recovered; (b) heated to 500 °C; (c) heated stepwise to 500, 600 and 700 °C; and (d) heated directly to 700 °C.
Materials 08 00700 g002

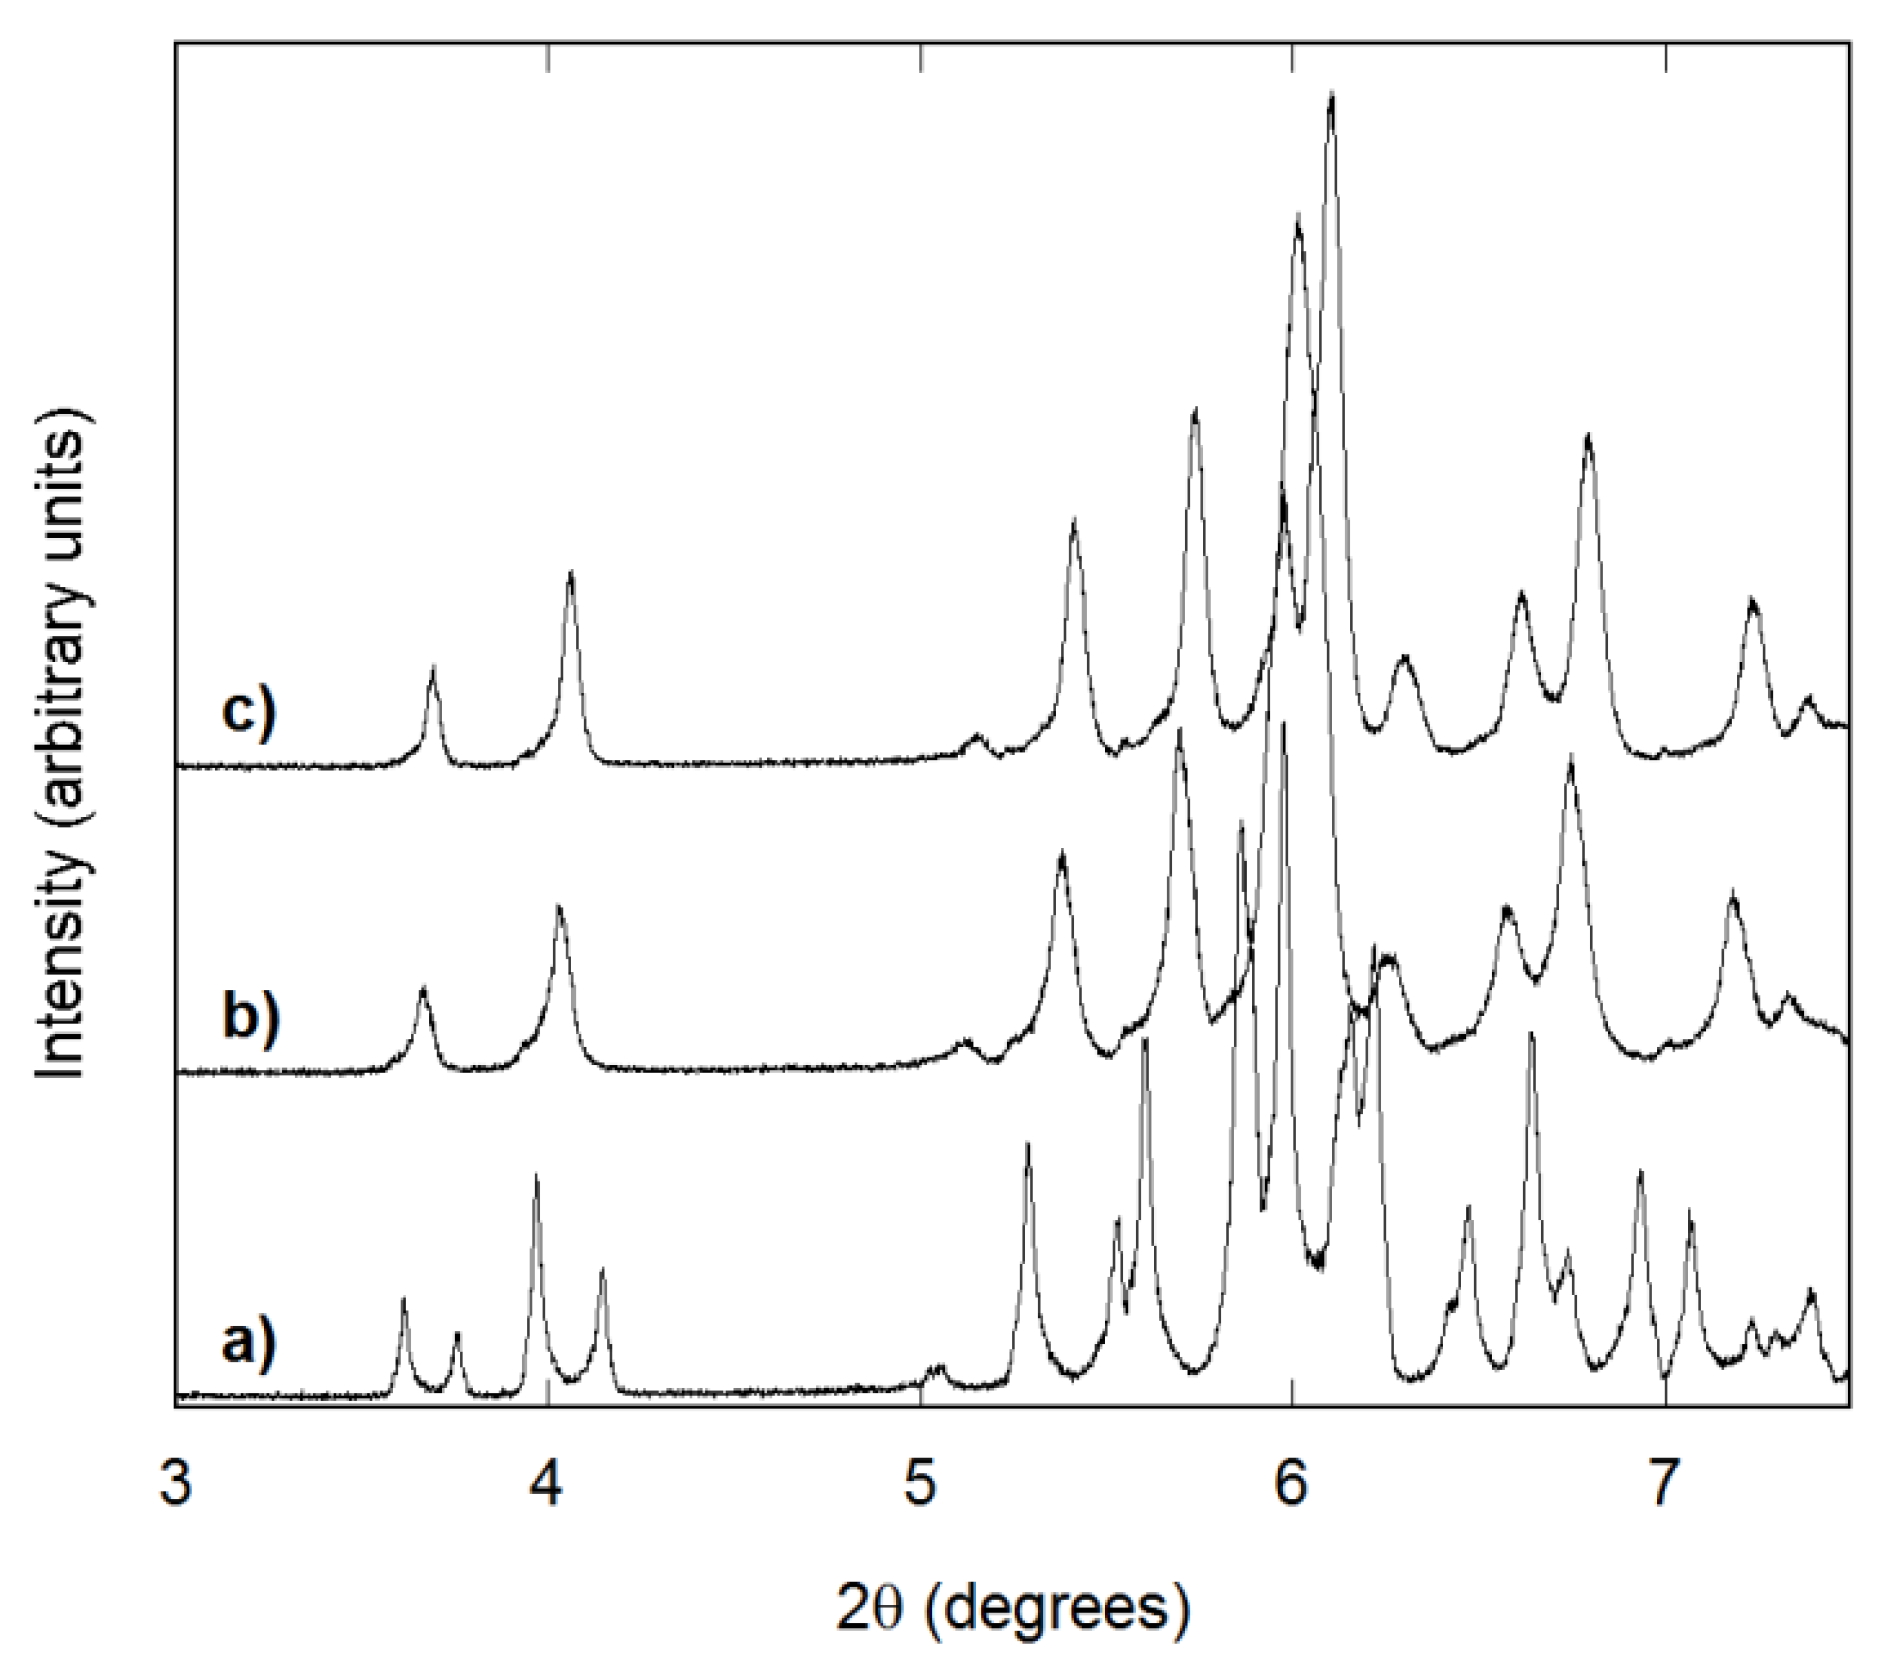
3.2. Structure and Homogeneity of Samples

Al2Mo3O12 and Sc2Mo3O12 both belong to the A2M3O12 family; however, they adopt different structures at room temperature, with Al2Mo3O12 displaying the monoclinic A2M3O12 structure below 473 K [70], while Sc2Mo3O12 crystallizes in the orthorhombic A2M3O12 phase above 178 K [71]. This made it necessary to investigate whether AlScMo3O12 forms the monoclinic or orthorhombic A2M3O12 structure at room temperature. These structures are closely related, and it is also possible that samples consist of multiple phases with different compositions. Laboratory PXRD data can be used to identify whether samples form two distinct Al- and Sc-rich phases, which result in two overlapping patterns, but are not adequate to address more subtle differences. Samples may be composed of several phases with similar compositions or of particles with a continuous variation in stoichiometry, which results in broad, unresolved peaks in laboratory data. High resolution data can resolve small differences in lattice constants and may reveal split peaks corresponding to multiple phases in cases when laboratory data give single, broad peaks.
All samples prepared in this research were characterized by high resolution diffraction experiments at a synchrotron. Initially, data were visually inspected to determine whether samples were composed of a single phase or whether multiple phases were present. Samples with broad, completely unresolved peaks in the synchrotron data were not further analyzed, while all other datasets were subjected to refinements to extract lattice constants and structural information. It was found that single-phase, stoichiometric AlScMo3O12 samples crystallized in the orthorhombic A2M3O12 structure in space group Pnca. All single-phase samples were successfully analyzed by Rietveld refinement, while multiphase samples were either refined by the Rietveld method or treated by the Pawley method when too many phases were present for stable Rietveld refinements.
Most samples prepared in CH3CN showed split or broad peaks, even in laboratory PXRD patterns, which indicates inhomogeneous samples with several distinct compositions or a wide range of similar compositions, respectively. Temperature and reaction time affected the crystallinity of the samples. Reactions at 130 °C required long heating times (3–4 weeks) to obtain single-phase material, and most samples still showed a shoulder corresponding to a small fraction of a scandium-rich phase (~10%–15%) in the high resolution data. Shorter times resulted either in split or very broad peaks (Figure 3). A solvent volume of 10 or 15 mL gave the sharpest peaks. The change in homogeneity with time suggests that the AlxSc2−xMo3O12 compositions have some solubility in CH3CN and that the quaternary compound AlScMo3O12 is thermodynamically favored, most likely due to entropic contributions.
Figure 3. Synchrotron diffraction patterns of AlScMo3O12 samples prepared in 15 mL of CH3CN by heating at 130 °C for: (a) 7 days; (b) 17 days; and (c) 27 days.
Materials 08 00700 g003
Reactions in CH3CN at 150 °C produced samples with broad or split peaks after three to seven days. Reasonable crystallinity was obtained after two weeks; but longer heating (up to four weeks) did not improve homogeneity, and the peaks always remained broad. Several reactions at 170 °C were also conducted with varying solvent volumes. Most samples showed broad peaks, while a few samples resulted in sharp, single peaks. No trends as a function of solvent volume were obvious, and samples reproduced under identical conditions could give sharp or broad peaks, indicating that other factors, like the presence of nucleation sites on the glassware, may have influenced the outcome. Reactions at 110 °C were not attempted in CH3CN, as unreasonable reaction times would be necessary to produce homogeneous samples. TGA experiments on raw samples showed weight losses ranging from 20 to 50 wt.% for 130 °C reactions, 35 to 60 wt.% for 150 °C reactions and 50 to 70 wt.% for 170 °C reactions, indicating that higher reaction temperatures resulted in the incorporation of larger quantities of organic residues in the precipitates. The presence of large quantities of organic material may also contribute to the poor reproducibility of reaction outcomes at 170 °C.
Reactions carried out in CHCl3 showed a strong dependence on reaction temperature. All samples prepared at 150 °C gave X-ray patterns with clearly split peaks, indicating the formation of several A2M3O12 phases with different compositions. Reactions at 130 °C generally resulted in broad peaks in the laboratory PXRD patterns, especially for large (20 mL) and small (5 mL) solvent volumes. It was found that decreasing the reaction temperature to 110 °C gave better homogeneity. In addition, increasing the reaction time resulted in sharper peaks, with 3-day reactions producing broad, split peaks, while gradual sharpening was observed after seven days of reaction and sharp peaks for 12-day reactions (Figure 4). As the results for reactions at 110 to 150 °C clearly indicated that lower temperatures gave superior homogeneity, reactions at 170 °C were not carried out in CHCl3. TGA analysis showed that the amount of organic residues increased with reaction temperature (15–45 wt.% at 110 °C, 40–70 wt.% at 130 °C and 55–80 wt.% at 150 °C), similar to reactions in CH3CN. Overall, the amount of residual organics was slightly higher for reactions in CHCl3. This could be related to the poorer solubility of many metal halides in this solvent compared to CH3CN.
Figure 4. Synchrotron diffraction patterns of AlScMo3O12 samples prepared in 10 mL of CHCl3 by heating at 110 °C for: (a) 3 days; (b) 7 days; and (c) 12 days. All samples were crystallized at 700 °C for 3 h.
Materials 08 00700 g004
While the observation of unsplit, sharp peaks is an indicator of single-phase, homogeneous samples, it is also important to address whether the target composition AlScMo3O12 was achieved. As a first approximation, AlxSc2−xMo3O12 can be regarded as a solid solution of Al2Mo3O12 and Sc2Mo3O12, and the composition of samples can be estimated from PXRD data through extraction of lattice constants using Vegard’s law. However, it is important to keep in mind that Al2Mo3O12 adopts the monoclinic A2M3O12 structure below 473 K [70], while Sc2Mo3O12 crystallizes in the orthorhombic A2M3O12 phase above 178 K [71]. The monoclinic cell is a distorted superstructure of the orthorhombic phase, with a cell volume twice that of the high-temperature structure [71]. The phase transition from monoclinic to orthorhombic symmetry usually involves a discontinuous change in cell volume per formula unit of about 1.5%–2%. Thus, Vegard’s law calculations could be set up in two different ways, by using half the cell volume of monoclinic Al2Mo3O12 as the 100% Al boundary or by extrapolating the cell volume of orthorhombic Al2Mo3O12 at room temperature. This extrapolation is not trivial, as the volume expansion of orthorhombic Al2Mo3O12 is not linear, but instead changes from small positive up to 775 K to negative at higher temperatures [70]. For this reason, calculations were set up using the monoclinic Al2Mo3O12 cell volume. Analyses were carried out on high-resolution synchrotron data, which facilitated the assignment of samples as single-phase or multiple phases. For a few samples, data were not refinable, as the patterns consisted of too many overlapping peaks. For all other samples, single or multiphase Rietveld refinements were set up in Topas Academic. It was found that the cell volumes of most single-phase samples corresponded to compositions between Al1.2Sc0.8Mo3O12 and Al0.8Sc1.2Mo3O12. Similar results were obtained for the major phase in samples with one major and one smaller secondary phase. Refinement results for selected samples are summarized in Table 1.
Table 1. Reaction conditions and refinement results for selected AlScMo3O12 samples.
Tsynth (°C)SolventVsolv (mL)tsynth (days)# of phasesSpace groupPhase fractionV (Å3)%Sc Vegard
130CH3CN1074+Pnca *11%1022.114
31%1088.0936
27%1123.2854
31%1153.4268
130CH3CN10172Pnca 89%1124.95 54
Pnca11%1184.4984
130CH3CN10272Pnca86%1107.5846
Pnca14%1154.6269
150CH3CN9142Pnca 74%1125.15 54
Pnca26%1173.7178
170CH3CN971Pnca100%1115.9950
170CH3CN972Pnca56%1075.8630
Pnca44%1131.8058
110CHCl3532Pnca71%1112.7348
Pnca29%1200.1191
110CHCl31071Pnca100%1100.9843
110CHCl315121Pnca100%1102.1143
130CHCl31572P 21/c6%2060.658
Pnca94%1121.0752
* All phases were modeled as orthorhombic to ensure stable refinement.
SEM images of the crystalline samples showed particle sizes ranging from 100 nm to 2 µm. Most samples prepared in CH3CN were composed of small, rounded particles that formed agglomerates (Figure 5a). Only a couple of acetonitrile samples showed distinctly faceted particles (Figure 5b). In contrast, all samples recovered from reactions in CHCl3 consisted of dense conglomerates of impinging grains (Figure 5c,d). The particle sizes of chloroform samples were clearly limited by neighboring grains impeding further growth. EDS spot analysis confirmed Al:Sc:Mo compositions ranging from (1.1 ± 0.2):(0.9 ± 0.3):3 to (0.9 ± 0.2):(1.3 ± 0.4):3 (all measurements were normalized to the amount of Mo) for single-phase samples with unit cell volumes corresponding to 40%–60% Al and Sc occupancy. In contrast to the results for single-phase samples, averaging of EDS spot analysis results for samples with multiple A2M3O12 phases resulted in very high standard deviations, indicating that samples contained a range of compositions in different grains.
Figure 5. SEM images of samples prepared in: (a) CH3CN at 150 °C; (b) CH3CN at 170 °C for 7 days; (c) CHCl3 at 170 °C; and (d) CHCl3 at 110 °C. All images were recorded using heat-treated samples.
Materials 08 00700 g005

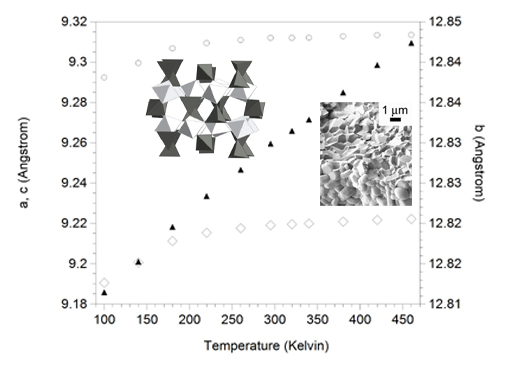
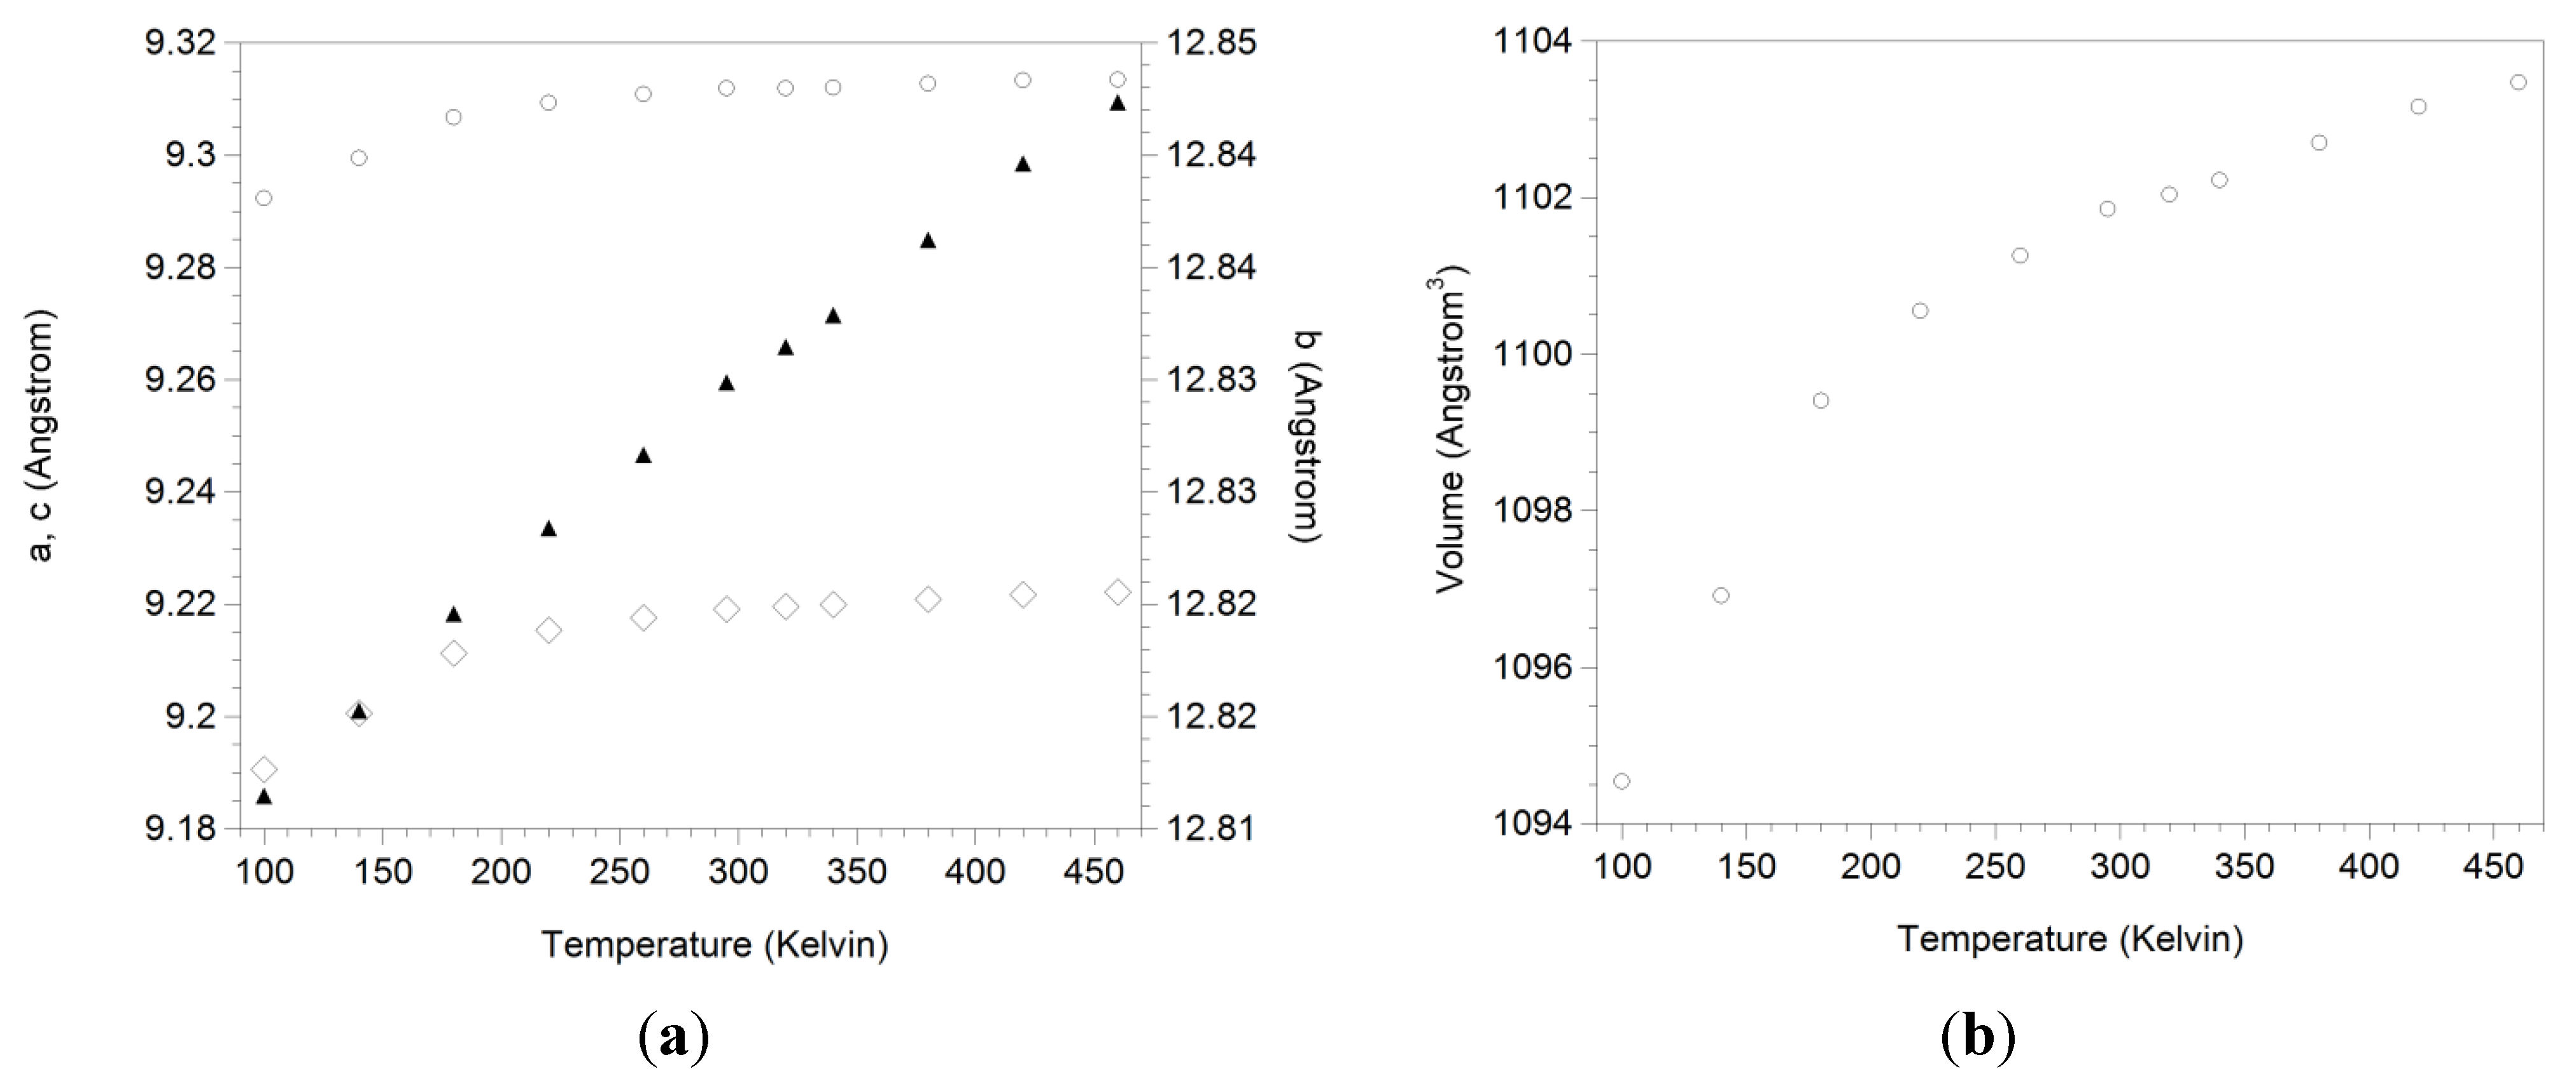
3.3. Expansion Behavior of AlScMo3O12

The intrinsic expansion behavior of AlScMo3O12 was determined by variable temperature X-ray diffraction experiments at 11-BM, using a highly crystalline and stoichiometric sample (prepared in CHCl3 at 110 °C for 12 days). Data were collected at temperatures between 100 and 460 K, and lattice constants were extracted by Rietveld refinement (Table 2). All unit cell axes showed positive expansion. This result was surprising, as A2M3O12 compounds that adopt the Pnca polymorph generally display NTE along one or two unit cell axes, with positive expansion along the remaining axes, which can result in positive, zero or negative volume expansion. Our observations also differ from the results obtained by Wu et al. on AlxSc2−xMo3O12 samples prepared by ceramic methods [55], who reported positive αb and αc values for compositions with at least 50% Al, paired with a small negative αa value for AlScMo3O12, and approximately zero expansion along the a-axis for Al0.7Sc1.3Mo3O12. This could be due to the different temperature ranges investigated (100 to 460 K versus 298 to 1073 K) or result from small errors in lattice constants due to changes in sample height that commonly occur in laboratory variable temperature XRD experiments. Such changes are difficult to correct unless data are collected over a wide angular range on samples mixed with an internal standard. In addition, the samples measured by Wu et al. were prepared by firing at 800 °C for 24 h. In our hands, such heat treatments resulted in significant weight losses (~12%) due to evaporation of MoO3 for both NHSG and solid-state samples. Thus, it is possible that the starting stoichiometry was not preserved in the previous study, as no elemental analysis was presented. It is interesting to note here that even after complete decomposition at 1100 °C, the strong, sharp Sc2Mo3O12 peaks made it impossible to detect the Al2O3 phase, which must also be present. Thus, partial decomposition of a sample may not be detectable by XRD methods. A further complication in the analysis of AlxSc2−xMo3O12 prepared by ceramic methods may result from the broad peaks observed for compositions containing 50% to 85% Al on the A-site. This could indicate slightly inhomogeneous samples.
Table 2. Rietveld refinement results of variable temperature diffraction data of AlScMo3O12.
T (K)Rp (%)a (Å)b (Å)c (Å)β (°)V (Å3)%Sc
10011.715.7719.29118.382125.642189.0446.4
1009.29.29212.8169.19190.01094.5451.6
1409.19.29912.8209.20190.01096.9150.9
1808.79.30712.8259.21190.01099.4050.7
2208.49.30912.8289.21590.01100.5550.6
2608.69.31112.8329.21890.01101.2650.5
2958.59.31212.8359.21990.01101.8550.4
3208.79.31212.8369.22090.01102.0450.6
3408.89.31212.8389.22090.01102.2250.7
3809.09.31312.8419.22190.01102.7050.5
4209.09.31312.8459.22290.01103.1652.0
4609.19.31312.8479.22290.01103.4750.4
Our results make AlScMo3O12 the first reported material crystallizing in the orthorhombic Sc2W3O12 structure that does not show zero expansion or NTE along any cell axis. The expansion behavior of all axes was linear above 200 K. The relative expansion coefficients for the 200 to 460 K temperature range were determined to be αa = (1.7 ± 0.2) × 10−6 K−1, αb = (6.2 ± 0.1) × 10−6 K−1, αc = (2.9 ± 0.3) × 10−6 K−1 and αV = (10.8 ± 0.6) × 10−6 K−1, respectively. A significant contraction of the a- and c-axes was observed upon cooling below 200 K (Figure 6). These data were excluded from the calculation of expansion coefficients. The more pronounced decrease in cell volume below 200 K suggested that the material may be approaching the orthorhombic to monoclinic phase transition. To address whether the monoclinic phase had already formed at 100 K, this dataset was refined using both the orthorhombic and monoclinic structures. The orthorhombic structure still provided a better fit to the data, indicating that the phase transition must occur below 100 K. Unfortunately, the available experimental setup does not allow collection of data at lower temperatures. DSC did not show any evidence of a phase transition above 110 K either.
Figure 6. Expansion data of (a) unit cell axes a (◇), b (▲) and c (○); and (b) unit cell volume of AlScMo3O12.
Materials 08 00700 g006
Our results indicate that the mixing of Al and Sc on the A-site resulted in a significant suppression of the orthorhombic to monoclinic phase transition temperature to a temperature at least 80 K lower than that of either parent compound. This is a significant observation and, to our knowledge, constitutes the first time that such a significant suppression of the phase transition has been characterized by high-resolution diffraction studies combined with Rietveld analysis, which can distinguish the small structural differences between the orthorhombic and monoclinic polymorphs much more reliably than any other method. Generally, phase transition temperatures between those of the parent compounds are observed, which in many cases follow Vegard’s law. The only well-established exception to this is AlInW3O12, which is expected to undergo the phase transition below room temperature [35]. Unfortunately, the exact transition temperature has never been reported. The only other report of a significantly lower phase transition temperature is found in Li’s study of Fe2−xYxMo3O12 [72], which stated that Fe1.5Y0.5Mo3O12 remained orthorhombic to temperatures below 103 K. This conclusion was based on the absence of significant changes in Raman spectra down to 103 K. However, the changes in Raman spectra are fairly subtle and should be backed up by other methods. The assignment of an orthorhombic structure was based on visual interpretation of laboratory XRD patterns. Close inspection of the patterns displayed in the paper shows the presence of a small peak at the same angle where a characteristic peak for the monoclinic phase would be expected. Thus, the absence of a phase transition upon cooling could also be due to the fact that the material is already monoclinic at room temperature. It would be interesting to study Fe2−xYxMo3O12 compositions by variable temperature high-resolution diffraction and Rietveld analysis to conclusively establish their structures.
The exact cause of the unprecedented suppression of the phase transition temperature requires further investigation. It is possible that the significant difference in size of the trivalent cations ( r A l 3 + / r S c 3 + = 0.72 ) contributes to this behavior. This would also suggest a significant lowering of the phase transition temperature for other cation combinations that result in similar differences. It is interesting to note that the difference in ionic radii between aluminum and indium is even more pronounced (In r63+ = 80 pm) and that AlInW3O12 does not transform to an orthorhombic structure above room temperature. A low-temperature study aimed at determining its phase transition temperature, as well as an investigation of AlInMo3O12 could establish whether the size difference of the A-site cations is the determining factor in the lowering of the transition temperature. The preparation and study of mixed cation systems containing Al3+ and Y3+ or a small lanthanide could further elucidate whether our hypothesis is correct.

4. Conclusions

The synthesis of AlScMo3O12 was optimized using the NHSG method at low temperatures. Syntheses should be carried out in CHCl3 at low temperatures for extended periods of time. The most homogeneous AlxSc2−xMo3O12 samples with a 1:1:3 molar ratio of Al:Sc:Mo were obtained at 110 °C in 10 mL of CHCl3 with reaction times of 12 days. Heat treatments of raw samples at 700 °C for as short as 3 h produced highly crystalline products. Longer heat treatments at 700 °C did not improve crystallinity, indicating that crystallinity was not due to sintering, but rather due to atomic-level homogeneity in the raw samples. All single-phase samples adopted the orthorhombic A2M3O12 structure, and this phase persisted at temperatures down to 100 K. It seems likely that the material approaches the orthorhombic to monoclinic phase transition at this temperature based on the evolution of unit cell volume with temperature. This temperature is considerably lower than the phase transition temperature of either Al2Mo3O12 or Sc2Mo3O12. In contrast to all other materials in the A2M3O12 family for which expansion data have been reported, AlScMo3O12 displays positive thermal expansion along all unit cell axes.

Acknowledgments

This work was supported by a National Science Foundation Research Experience for Undergraduates grant under Contract Number NSF 1004921 and by NSF Grant DMR-0545517. Use of the Advanced Photon Source at 11-BM was supported by the U.S. Department of Energy, Office of Science, Office of Basic Energy Sciences, under Contract No. DE-AC02-06CH11357.

Author Contributions

Cora Lind devised the ideas and experimental methods described in this manuscript and conducted the training of all co-authors in the experimental methods and data analysis. Anne Sendecki, Alyssa Main and Rebecca Truitt each participated in the University of Toledo’s REU program for one summer each, prepared and analyzed the samples, including one trip to APS, and summarized their findings. Ilka Hermes spent a research module working on the synthesis and characterization of the samples. Rebecca Truitt compiled and analyzed all previous results obtained in this project, prepared targeted samples and analyzed synchrotron data collected during multiple trips by Rietveld refinement. All authors contributed to the writing of this manuscript, and have approved its final version.

Conflicts of Interest

The authors declare no conflict of interest.

References

  1. Takenaka, K. Negative thermal expansion materials: Technological key for control of thermal expansion. Sci. Technol. Adv. Mater. 2012, 13, 013001:1–013001:11. [Google Scholar] [CrossRef]
  2. Roy, R.; Agrawal, D.K.; McKinstry, H.A. Very low thermal expansion coefficient materials. Annu. Rev. Mater. Sci. 1989, 19, 59–81. [Google Scholar] [CrossRef]
  3. Lommens, P.; de Meyer, C.; Bruneel, E.; de Buysser, K.; van Driessche, I.; Hoste, S. Synthesis and thermal expansion of ZrO2/ZrW2O8 composites. J. Eur. Ceram. Soc. 2005, 25, 3605–3610. [Google Scholar] [CrossRef]
  4. Tani, J.-I.; Takahashi, M.; Kido, H. Fabrication and thermal expansion properties of ZrW2O8/Zr2WP2O12 composites. J. Eur. Ceram. Soc. 2010, 30, 1483–1488. [Google Scholar] [CrossRef]
  5. Phillips, A.E.; Goodwin, A.L.; Halder, G.J.; Southon, P.D.; Kepert, C.J. Nanoporosity and exceptional negative thermal expansion in single-network cadmium cyanide. Angew. Chem. 2008, 47, 1396–1399. [Google Scholar] [CrossRef] [Green Version]
  6. Sleight, A.W. Isotropic negative thermal expansion. Annu. Rev. Mater. Sci. 1998, 28, 29–43. [Google Scholar] [CrossRef]
  7. Attfield, M.P.; Sleight, A.W. Strong negative thermal expansion in siliceous faujasite. Chem. Commun. 1998, 5, 601–602. [Google Scholar] [CrossRef]
  8. Reisner, B.A.; Lee, Y.; Hanson, J.C.; Jones, G.A.; Parise, J.B.; Corbin, D.R.; Toby, B.H.; Freitag, A.; Larese, J.Z.; Kahlenberg, V. Understanding negative thermal expansion and “trap door” cation relocations in zeolite rho. Chem. Commun. 2000, 22, 2221–2222. [Google Scholar] [CrossRef]
  9. Attfield, M.P.; Sleight, A.W. Exceptional negative thermal expansion in AlPO4-17. Chem. Mater. 1998, 10, 2013–2019. [Google Scholar] [CrossRef]
  10. Chapman, K.W.; Chupas, P.J. Anomalous thermal expansion of cuprites: A combined high resolution pair distribution function and geometric analysis. Chem. Mater. 2009, 21, 425–431. [Google Scholar] [CrossRef]
  11. Evans, J.S.O.; Mary, T.A.; Vogt, T.; Subramanian, M.A.; Sleight, A.W. Negative thermal expansion in ZrW2O8 and HfW2O8. Chem. Mater. 1996, 8, 2809–2823. [Google Scholar] [CrossRef]
  12. Korthuis, V.; Khosrovani, N.; Sleight, A.W.; Roberts, N.; Dupree, R.; Warren, W.W. Negative thermal expansion and phase transitions in the ZrV2−xPxO7 series. Chem. Mater. 1995, 7, 412–417. [Google Scholar] [CrossRef]
  13. Li, J.; Yokochi, A.; Amos, T.G.; Sleight, A.W. Strong negative thermal expansion along the O-Cu-O linkage in CuScO2. Chem. Mater. 2002, 14, 2602–2606. [Google Scholar] [CrossRef]
  14. Lind, C.; Wilkinson, A.P.; Hu, Z.B.; Short, S.; Jorgensen, J.D. Synthesis and properties of the negative thermal expansion material cubic ZrMo2O8. Chem. Mater. 1998, 10, 2335–2337. [Google Scholar] [CrossRef]
  15. Kozy, L.C.; Tahir, M.N.; Lind, C.; Tremel, W. Particle size and morphology control of the negative thermal expansion material cubic zirconium tungstate. J. Mater. Chem. 2009, 19, 2760–2765. [Google Scholar] [CrossRef]
  16. Lightfoot, P.; Woodcock, D.A.; Maple, M.J.; Villaescusa, L.A.; Wright, P.A. The widespread occurrence of negative thermal expansion in zeolites. J. Mater. Chem. 2001, 11, 212–216. [Google Scholar] [CrossRef]
  17. Chapman, K.W.; Chupas, P.J.; Kepert, C.J. Direct observation of a transverse vibrational mechanism for negative thermal expansion in Zn(CN)2: An atomic pair distribution function analysis. J. Am. Chem. Soc. 2005, 127, 15630–15636. [Google Scholar] [CrossRef] [PubMed]
  18. Evans, J.S.O.; Hanson, P.A.; Ibberson, R.M.; Duan, N.; Kameswari, U.; Sleight, A.W. Low-temperature oxygen migration and negative thermal expansion in ZrW2−xMoxO8. J. Am. Chem. Soc. 2000, 122, 8694–8699. [Google Scholar] [CrossRef]
  19. Korcok, J.L.; Katz, M.J.; Leznoff, D.B. Impact of metallophilicity on “colossal” positive and negative thermal expansion in a series of isostructural dicyanometallate coordination polymers. J. Am. Chem. Soc. 2009, 131, 4866–4871. [Google Scholar] [CrossRef] [PubMed]
  20. Evans, J.S.O. Negative thermal expansion materials. J. Chem. Soc. Dalton Trans. 1999, 19, 3317–3326. [Google Scholar] [CrossRef]
  21. Lind, C. Two decades of negative thermal expansion research: Where do we stand? Materials 2012, 5, 1125–1154. [Google Scholar] [CrossRef]
  22. Ernst, G.; Broholm, C.; Kowach, G.R.; Ramirez, A.P. Phonon density of states and negative thermal expansion in ZrW2O8. Nature 1998, 396, 147–149. [Google Scholar] [CrossRef]
  23. Azuma, M.; Chen, W.-T.; Seki, H.; Czapski, M.; Olga, S.; Oka, K.; Mizumaki, M.; Watanuki, T.; Ishimatsu, N.; Kawamura, N.; et al. Colossal negative thermal expansion in BiNiO3 induced by intermetallic charge transfer. Nat. Commun. 2011, 2, 347–348. [Google Scholar] [CrossRef] [PubMed]
  24. Huang, L.P.; Kieffer, J. Structural origin of negative thermal expansion in high-temperature silica polymorphs. Phys. Rev. Lett. 2005, 95, 215901. [Google Scholar] [CrossRef] [PubMed]
  25. Mittal, R.; Chaplot, S.L.; Schober, H.; Mary, T.A. Origin of negative thermal expansion in cubic ZrW2O8 revealed by high pressure inelastic neutron scattering. Phys. Rev. Lett. 2001, 86, 4692–4695. [Google Scholar] [CrossRef] [PubMed]
  26. Ramirez, A.P.; Kowach, G.R. Large low temperature specific heat in the negative thermal expansion compound ZrW2O8. Phys. Rev. Lett. 1998, 80, 4903–4906. [Google Scholar] [CrossRef]
  27. Tucker, M.G.; Goodwin, A.L.; Dove, M.T.; Keen, D.A.; Wells, S.A.; Evans, J.S.O. Negative thermal expansion in ZrW2O8: Mechanisms, rigid unit modes, and neutron total scattering. Phys. Rev. Lett. 2005, 95, 255501:1–255501:4. [Google Scholar] [CrossRef]
  28. Evans, J.S.O.; Hu, Z.; Jorgensen, J.D.; Argyriou, D.N.; Short, S.; Sleight, A.W. Compressibility, phase transitions, and oxygen migration in zirconium tungstate, ZrW2O8. Science 1997, 275, 61–65. [Google Scholar] [CrossRef] [PubMed]
  29. Goodwin, A.L.; Calleja, M.; Conterio, M.J.; Dove, M.T.; Evans, J.S.O.; Keen, D.A.; Peters, L.; Tucker, M.G. Colossal positive and negative thermal expansion in the framework material Ag3[Co(CN)6]. Science 2008, 319, 794–797. [Google Scholar] [CrossRef] [PubMed]
  30. Mary, T.A.; Evans, J.S.O.; Vogt, T.; Sleight, A.W. Negative thermal expansion from 0.3 to 1050 Kelvin in ZrW2O8. Science 1996, 272, 90–92. [Google Scholar] [CrossRef]
  31. Perottoni, C.A.; da Jornada, J.A.H. Pressure-induced amorphization and negative thermal expansion in ZrW2O8. Science 1998, 280, 886–889. [Google Scholar] [CrossRef] [PubMed]
  32. Evans, J.S.O.; Mary, T.A.; Sleight, A.W. Negative thermal expansion in a large molybdate and tungstate family. J. Solid State Chem. 1997, 133, 580–583. [Google Scholar] [CrossRef]
  33. Evans, J.S.O.; Mary, T.A.; Sleight, A.W. Negative thermal expansion materials. Phys. B 1997, 241, 311–316. [Google Scholar] [CrossRef]
  34. Khosrovani, N.; Sleight, A.W. Strong anisotropic thermal expansion in oxides. Int. J. Inorg. Mater. 1999, 1, 3–10. [Google Scholar] [CrossRef]
  35. Mary, T.A.; Sleight, A.W. Bulk thermal expansion for tungstate and molybdates of the type A2M3O12. J. Mater. Res. 1999, 14, 912–915. [Google Scholar] [CrossRef]
  36. Sleight, A. Materials science: Zero-expansion plan. Nature 2003, 425, 674–676. [Google Scholar] [CrossRef] [PubMed]
  37. Sleight, A.W. Thermal contraction. Endeavour 1995, 19, 64–68. [Google Scholar] [CrossRef]
  38. Sleight, A.W. Compounds that contract on heating. Inorg. Chem. 1998, 37, 2854–2860. [Google Scholar] [CrossRef]
  39. David, W.I.F.; Evans, J.S.O.; Sleight, A.W. Direct evidence for a low-frequency phonon mode mechanism in the negative thermal expansion compound ZrW2O8. Europhys. Lett. 1999, 46, 661–666. [Google Scholar] [CrossRef]
  40. Pryde, A.K.A.; Hammonds, K.D.; Dove, M.T.; Heine, V.; Gale, J.D.; Warren, M.C. Rigid unit modes and the negative thermal expansion in ZrW2O8. Phase Transit. 1997, 61, 141–153. [Google Scholar] [CrossRef]
  41. Tao, J.Z.; Sleight, A.W. The role of rigid unit modes in negative thermal expansion. J. Solid State Chem. 2003, 173, 442–448. [Google Scholar] [CrossRef]
  42. Badrinarayanan, P.; Mac Murray, B.; Kessler, M.R. Zirconium tungstate reinforced cyanate ester composites with enhanced dimensional stability. J. Mater. Res. 2009, 24, 2235–2242. [Google Scholar] [CrossRef]
  43. Balch, D.K.; Dunand, D.C. Copper-zirconium tungstate composites exhibiting low and negative thermal expansion influenced by reinforcement phase transformations. Metall. Mater. Trans. A 2004, 35A, 1159–1165. [Google Scholar] [CrossRef]
  44. Chu, X.; Huang, R.; Yang, H.; Wu, Z.; Lu, J.; Zhou, Y.; Li, L. The cryogenic thermal expansion and mechanical properties of plasma modified ZrW2O8 reinforced epoxy. Mater. Sci. Eng. A 2011, 528, 3367–3374. [Google Scholar] [CrossRef]
  45. De Buysser, K.; Lommens, P.; de Meyer, C.; Bruneel, E.; Hoste, S.; van Driessche, I. ZrO2-ZrW2O8 composites with tailor-made thermal expansion. Ceramics-Silikaty 2004, 48, 139–144. [Google Scholar]
  46. Haman, K.; Badrinarayanan, P.; Kessler, M.R. Effect of a zirconium tungstate filler on the cure behavior of a cyanate ester resin. ACS Appl. Mater. Interfaces 2009, 1, 1190–1195. [Google Scholar] [CrossRef] [PubMed]
  47. Lind, C.; Coleman, M.R.; Kozy, L.C.; Sharma, G.R. Zirconium tungstate/polymer nanocomposites: Challenges and opportunities. Phys. Status Solidi B 2011, 248, 123–129. [Google Scholar] [CrossRef]
  48. Yang, X.; Cheng, X.; Yan, X.; Yang, J.; Fu, T.; Qiu, J. Synthesis of ZrO2/ZrW2O8 composites with low thermal expansion. Compos. Sci. Technol. 2007, 67, 1167–1171. [Google Scholar] [CrossRef]
  49. Suzuki, T.; Omote, A. Negative thermal expansion in (HfMg)(WO4)3. J. Am. Ceram. Soc. 2004, 87, 1365–1367. [Google Scholar] [CrossRef]
  50. Evans, J.S.O.; Mary, T.A.; Sleight, A.W. Structure of Zr2(WO4)(PO4)2 from powder X-ray data—Cation ordering with no superstructure. J. Solid State Chem. 1995, 120, 101–104. [Google Scholar] [CrossRef]
  51. Sleight, A.W.; Brixner, L.H. A new ferroelastic transition in some A2(MO4)3 molybdates and tungstates. J. Solid State Chem. 1973, 7, 172–174. [Google Scholar] [CrossRef]
  52. Forster, P.M.; Yokochi, A.; Sleight, A.W. Enhanced negative thermal expansion in Lu2W3O12. J. Solid State Chem. 1998, 140, 157–158. [Google Scholar] [CrossRef]
  53. Zhu, J.; Yang, J.; Cheng, X. Synthesis and tunable thermal expansion property of Al2−dScdW3O12. Solid State Sci. 2012, 14, 187–190. [Google Scholar] [CrossRef]
  54. Wu, M.M.; Liu, X.Z.; Chen, D.F.; Huang, Q.Z.; Wu, H.; Liu, Y.T. Structure, phase transition, and controllable thermal expansion behaviors of Sc2−xFexMo3O12. Inorg. Chem. 2014, 53, 9206–9212. [Google Scholar] [CrossRef] [PubMed]
  55. Wu, M.M.; Peng, J.; Cheng, Y.Z.; Xiao, X.L.; Chen, D.F.; Hu, Z.B. Structural and controllable thermal expansion properties of Sc2−xAlxMo3O12. J. Alloy. Compd. 2013, 577, 295–298. [Google Scholar] [CrossRef]
  56. Wu, M.M.; Peng, J.; Han, S.B.; Hu, Z.B.; Liu, Y.T.; Chen, D.F. Phase transition and negative thermal expansion properties of Sc2−xCrxMo3O12. Ceram. Int. 2012, 38, 6525–6529. [Google Scholar] [CrossRef]
  57. Wu, M.M.; Peng, J.; Zu, Y.; Liu, R.D.; Hu, Z.B.; Liu, Y.T.; Chen, D.F. Thermal expansion properties of Lu2−xFexMo3O12. Chin. Phys. B 2012, 11, 1–6. [Google Scholar]
  58. Ari, M.; Jardim, P.M.; Marinkovic, B.A.; Rizzo, F.; Ferreira, F.F. Thermal expansion of Cr2xFe2−2xMo3O12, Al2xFe2−2xMo3O12 and Al2xCr2−2xMo3O12 solid solutions. J. Solid State Chem. 2008, 181, 1472–1479. [Google Scholar] [CrossRef]
  59. Baiz, T.I.; Heinrich, C.P.; Banek, N.A.; Vivekens, B.L.; Lind, C. In-situ non-ambient X-ray diffraction studies of indium tungstate. J. Solid State Chem. 2012, 187, 195–199. [Google Scholar] [CrossRef]
  60. Arnal, P.; Corriu, R.J.P.; Leclercq, D.; Mutin, P.H.; Vioux, A. Preparation of Transition metal oxides by a non-hydrolytic sol-gel process. Mater. Res. Soc. Symp. Proc. 1994, 346, 339–344. [Google Scholar] [CrossRef]
  61. Hay, J.N.; Raval, H.M. Preparation of inorganic oxides via a non-hydrolytic sol-gel route. J. Sol-Gel Sci. Technol. 1998, 13, 109–112. [Google Scholar] [CrossRef]
  62. Lafond, V.; Mutin, P.H.; Vioux, A. Non-hydrolytic sol-gel routes based on alkyl halide elimination: Toward better mixed oxide catalysts and new supports—Application to the preparation of a SiO2-TiO2 epoxidation catalyst. J. Mol. Catal. A 2002, 182, 81–88. [Google Scholar] [CrossRef]
  63. Lind, C.; Gates, S.D.; Pedoussaut, N.M.; Baiz, T.I. Novel materials through non-hydrolytic sol-gel processing: Negative thermal expansion oxides and beyond. Materials 2010, 3, 2567–2587. [Google Scholar] [CrossRef]
  64. Vioux, A.; Leclercq, D. Non-aqueous routes to sol-gel. Heterog. Chem. Rev. 1996, 3, 65–73. [Google Scholar] [CrossRef]
  65. Gates, S.D.; Colin, J.A.; Lind, C. Non-hydrolytic sol-gel synthesis, properties, and high-pressure behavior of gallium molybdate. J. Mater. Chem. 2006, 16, 4214–4219. [Google Scholar] [CrossRef]
  66. Gates, S.D.; Lind, C. Polymorphism in yttrium molybdate Y2Mo3O12. J. Solid State Chem. 2007, 180, 3510–3514. [Google Scholar] [CrossRef]
  67. Baiz, T.I.; Gindhart, A.M.; Kraemer, S.K.; Lind, C. Synthesis of MgHf(WO4)3 and MgZr(WO4)3 using a non-hydrolytic sol-gel method. J. Sol-Gel Sci. Technol. 2008, 47, 128–130. [Google Scholar] [CrossRef]
  68. Gates, S.D. Cation Influence on Negative Thermal Expansion in the A2M3O12 Family. Ph.D. Thesis, the University of Toledo, Toledo, OH, USA, 2008. [Google Scholar]
  69. Shannon, R.D. Revised effective ionic-radii and systematic studies of interatomic distances in halides and chalcogenides. Acta Crystallogr. A 1976, 32, 751–767. [Google Scholar] [CrossRef]
  70. Tyagi, A.K.; Achary, S.N.; Mathews, M.D. Phase transition and negative thermal expansion in A(2)(MoO4)(3) system (A = Fe3+, Cr3+ and Al3+). J. Alloy. Compd. 2002, 339, 207–210. [Google Scholar] [CrossRef]
  71. Evans, J.S.O.; Mary, T.A. Structural phase transitions and negative thermal expansion in Sc2(MoO4)3. Int. J. Inorg. Mater. 2000, 2, 143–151. [Google Scholar] [CrossRef]
  72. Li, Z.Y.; Song, W.B.; Liang, E.J. Structures, phase transition, and crystal water of Fe2−xYxMo3O12. J. Phys. Chem. C 2011, 115, 17806–17811. [Google Scholar] [CrossRef]

