
Effects of Wet/Dry-Cycling and Plasma Treatments on the Properties of Flax Nonwovens Intended for Composite Reinforcing


 ,
,
Abstract
:
1. Introduction
2. Results and Discussion

| Reference | Wet/Dry Treatment (Cycles) | Corona-Plasma (min) | Argon Plasma (min) | Ethylene Plasma (min) |
|---|---|---|---|---|
| NW SC | 0 | - | - | - |
| NW C | 4 | - | - | - |
| NW C-Et10 | 4 | - | - | 10 |
| NW C-Ar5 | 4 | - | 2.5 + 2.5 | - |
| NW C-Ar10 | 4 | - | 5 + 5 | - |
| NW C-Ar20 | 4 | - | 10 + 10 | - |
| NW C-Ar30 | 4 | - | 15 + 15 | - |
| NW C-Ar5-Et5 | 4 | - | 5 | 5 |
| NW C-Ar5-Et10 | 4 | - | 5 | 10 |
| NW C-Cr20 | 4 | 20 | - | - |
| NW C-Cr1010 | 4 | 10 + 10 | - | - |
| NW C-Cr1010-Et10 | 4 | 10 + 10 | - | 10 |
2.1. Surface Characterization
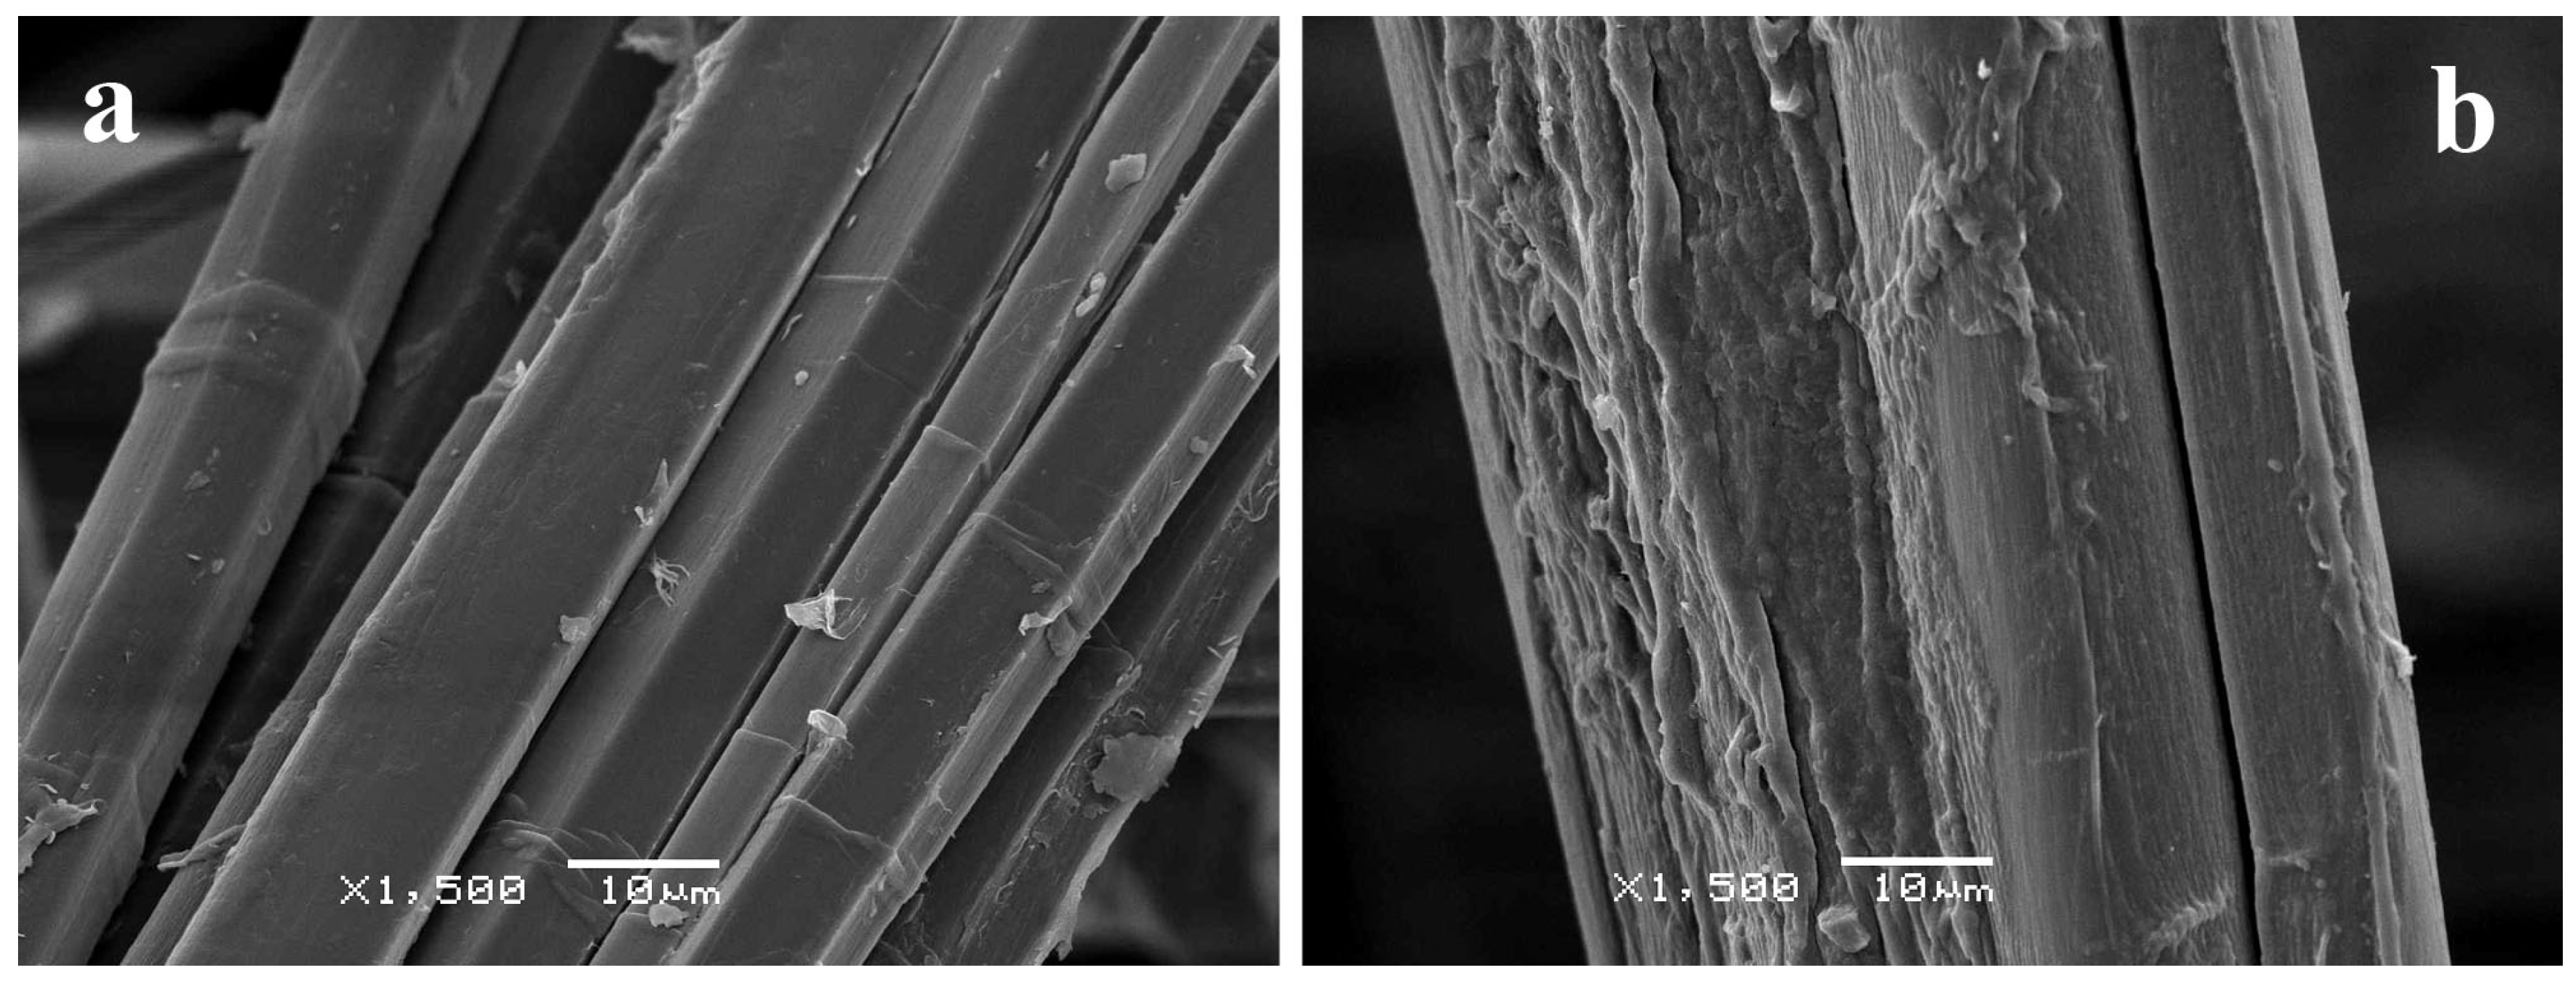
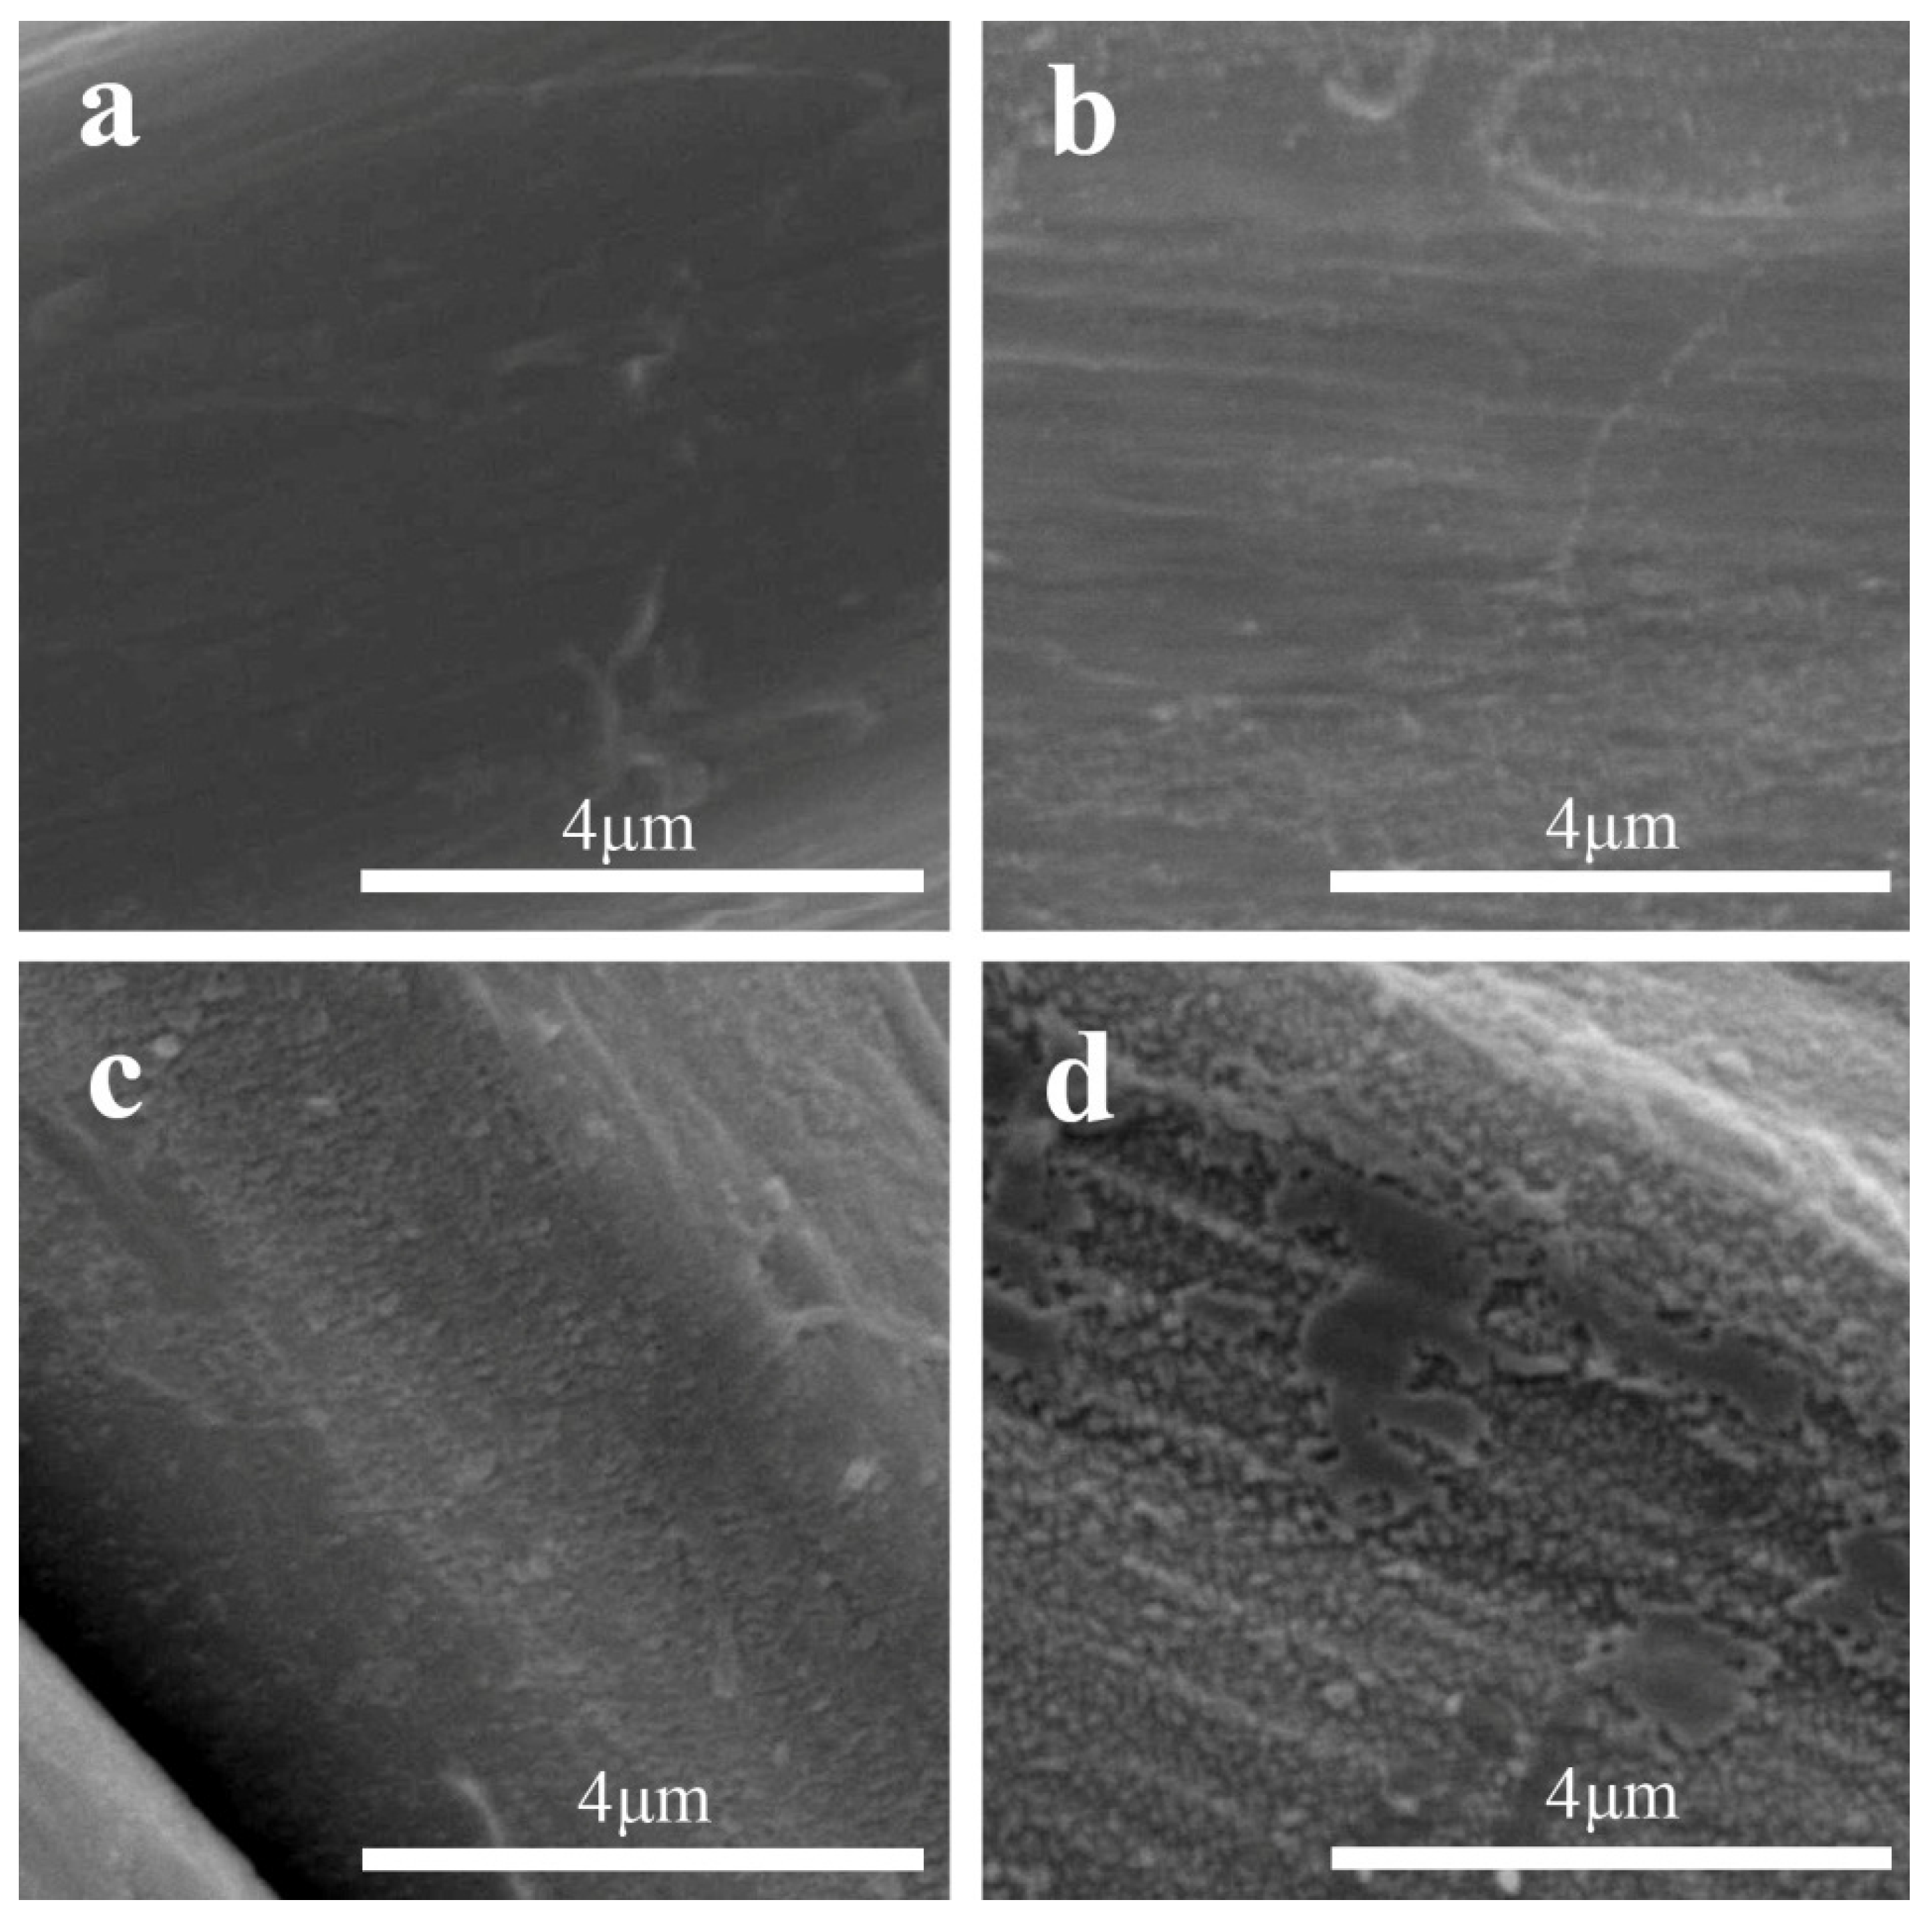
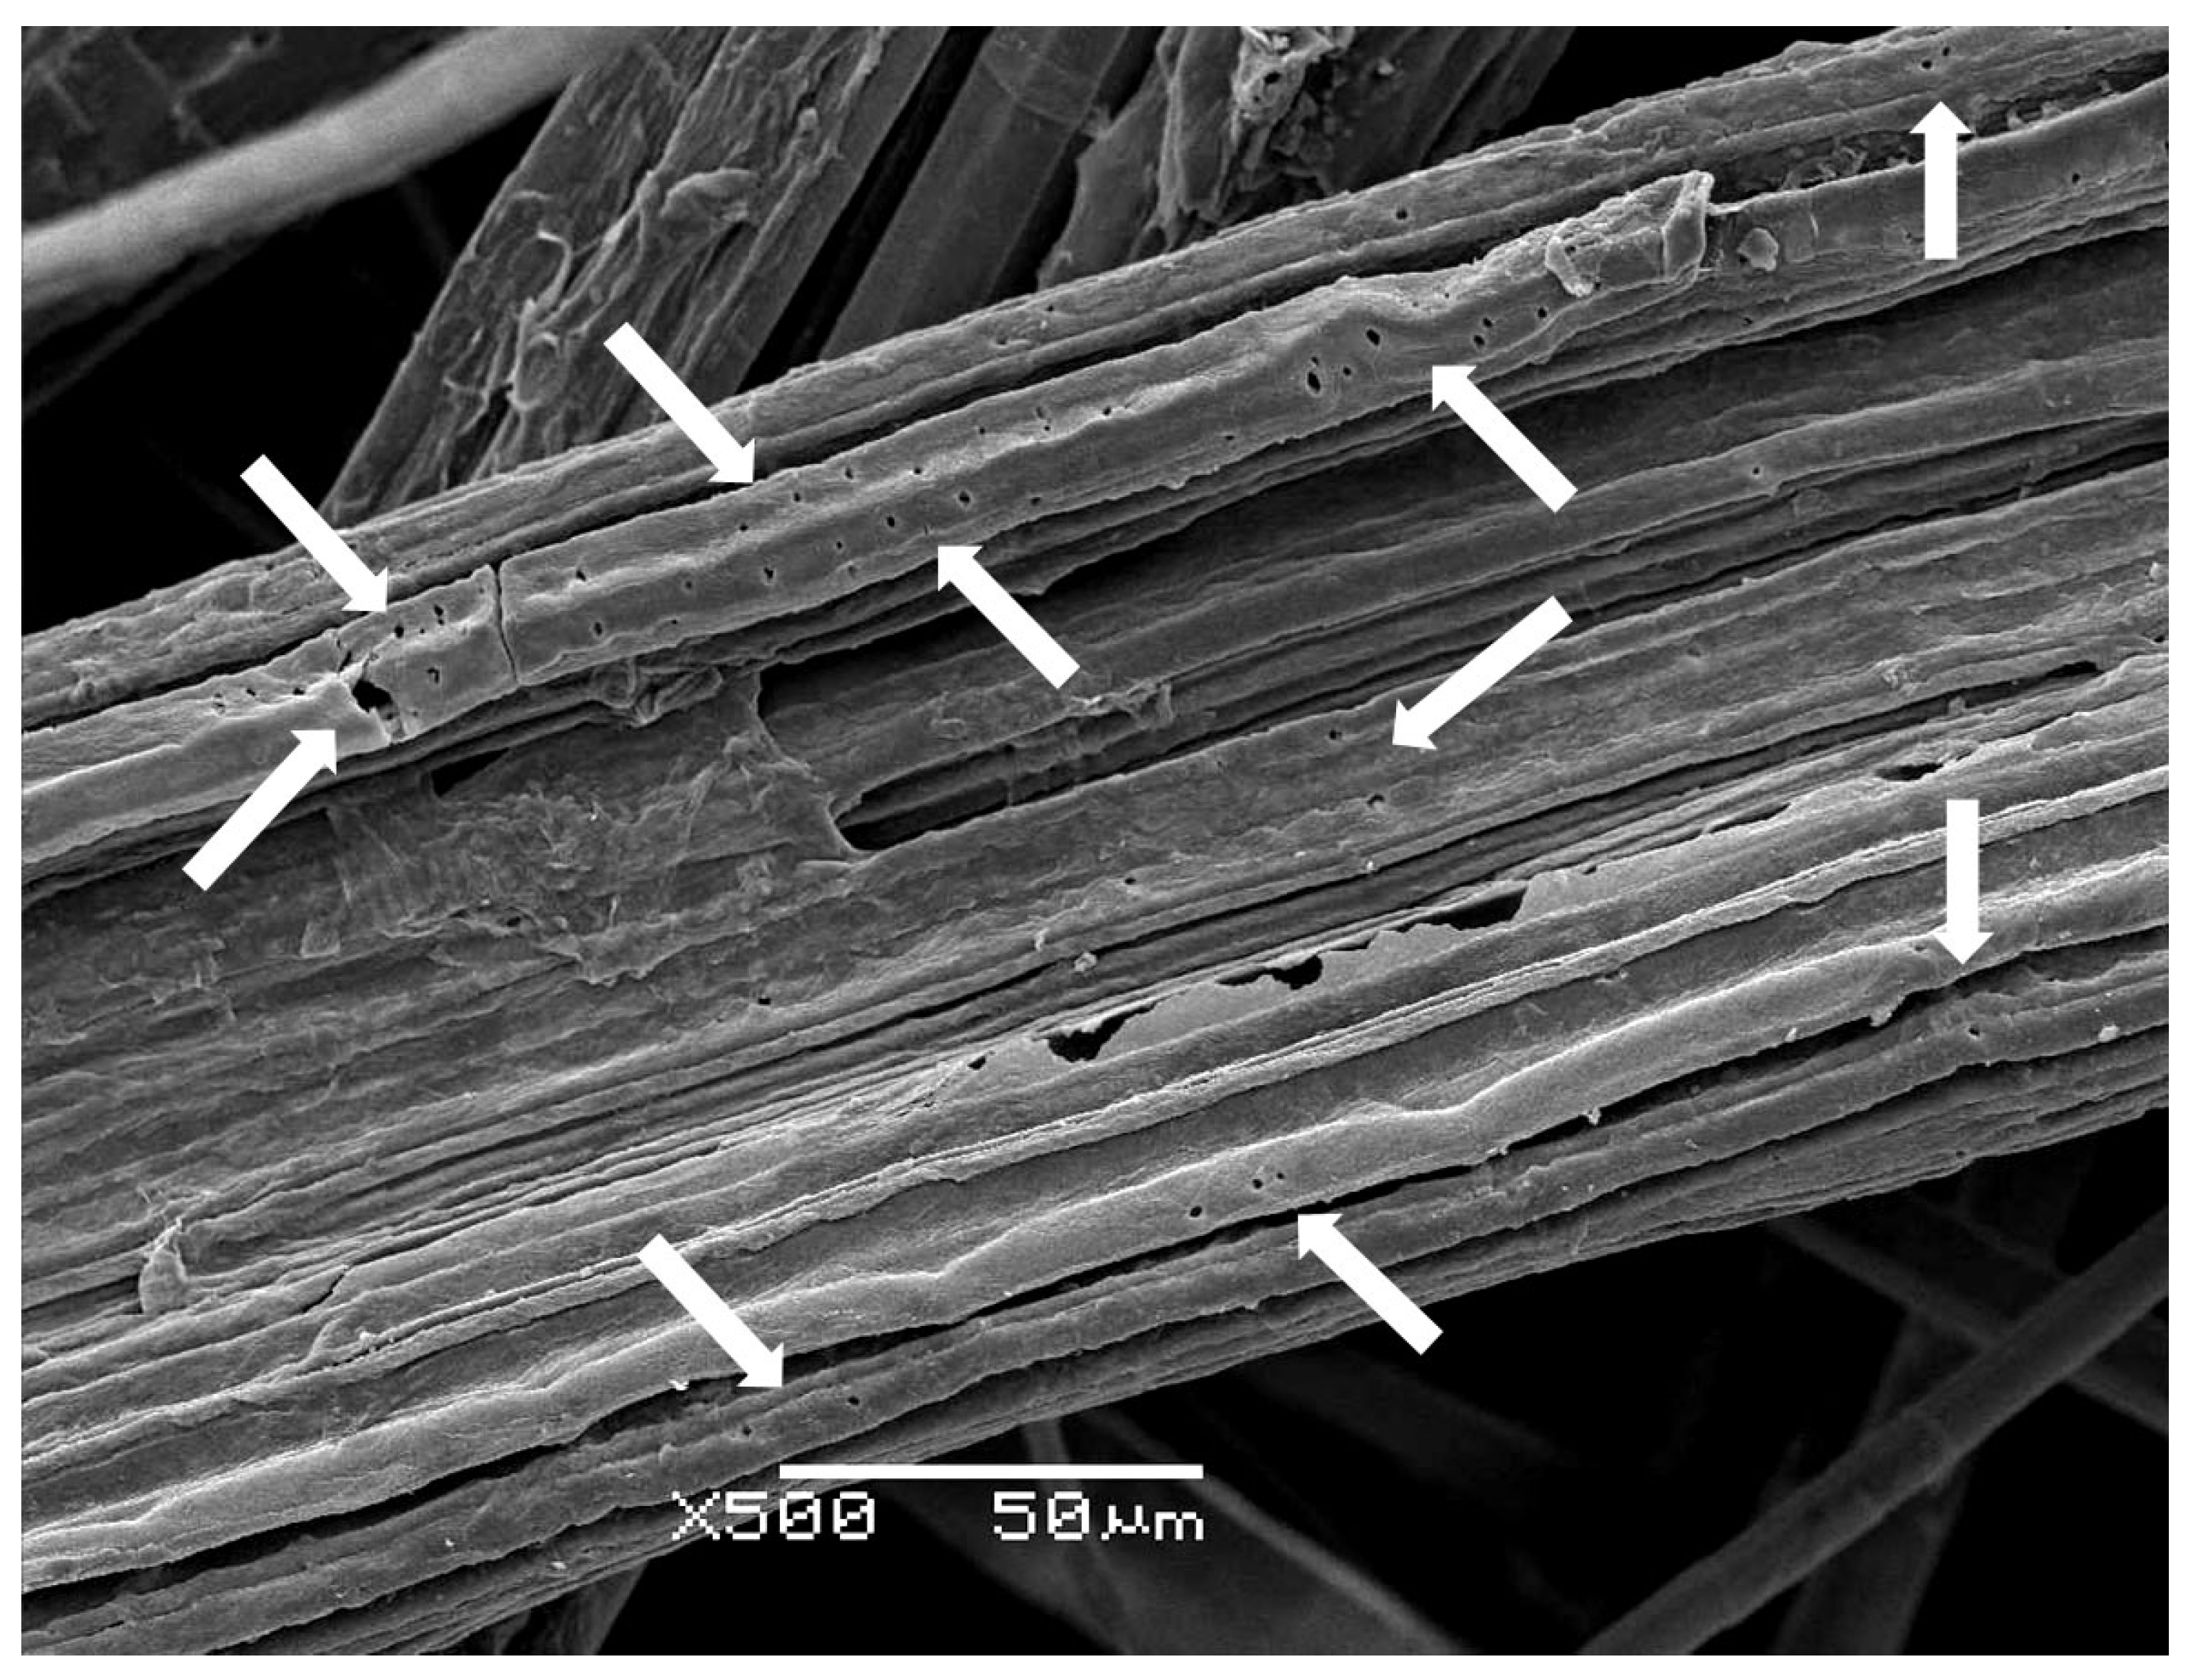
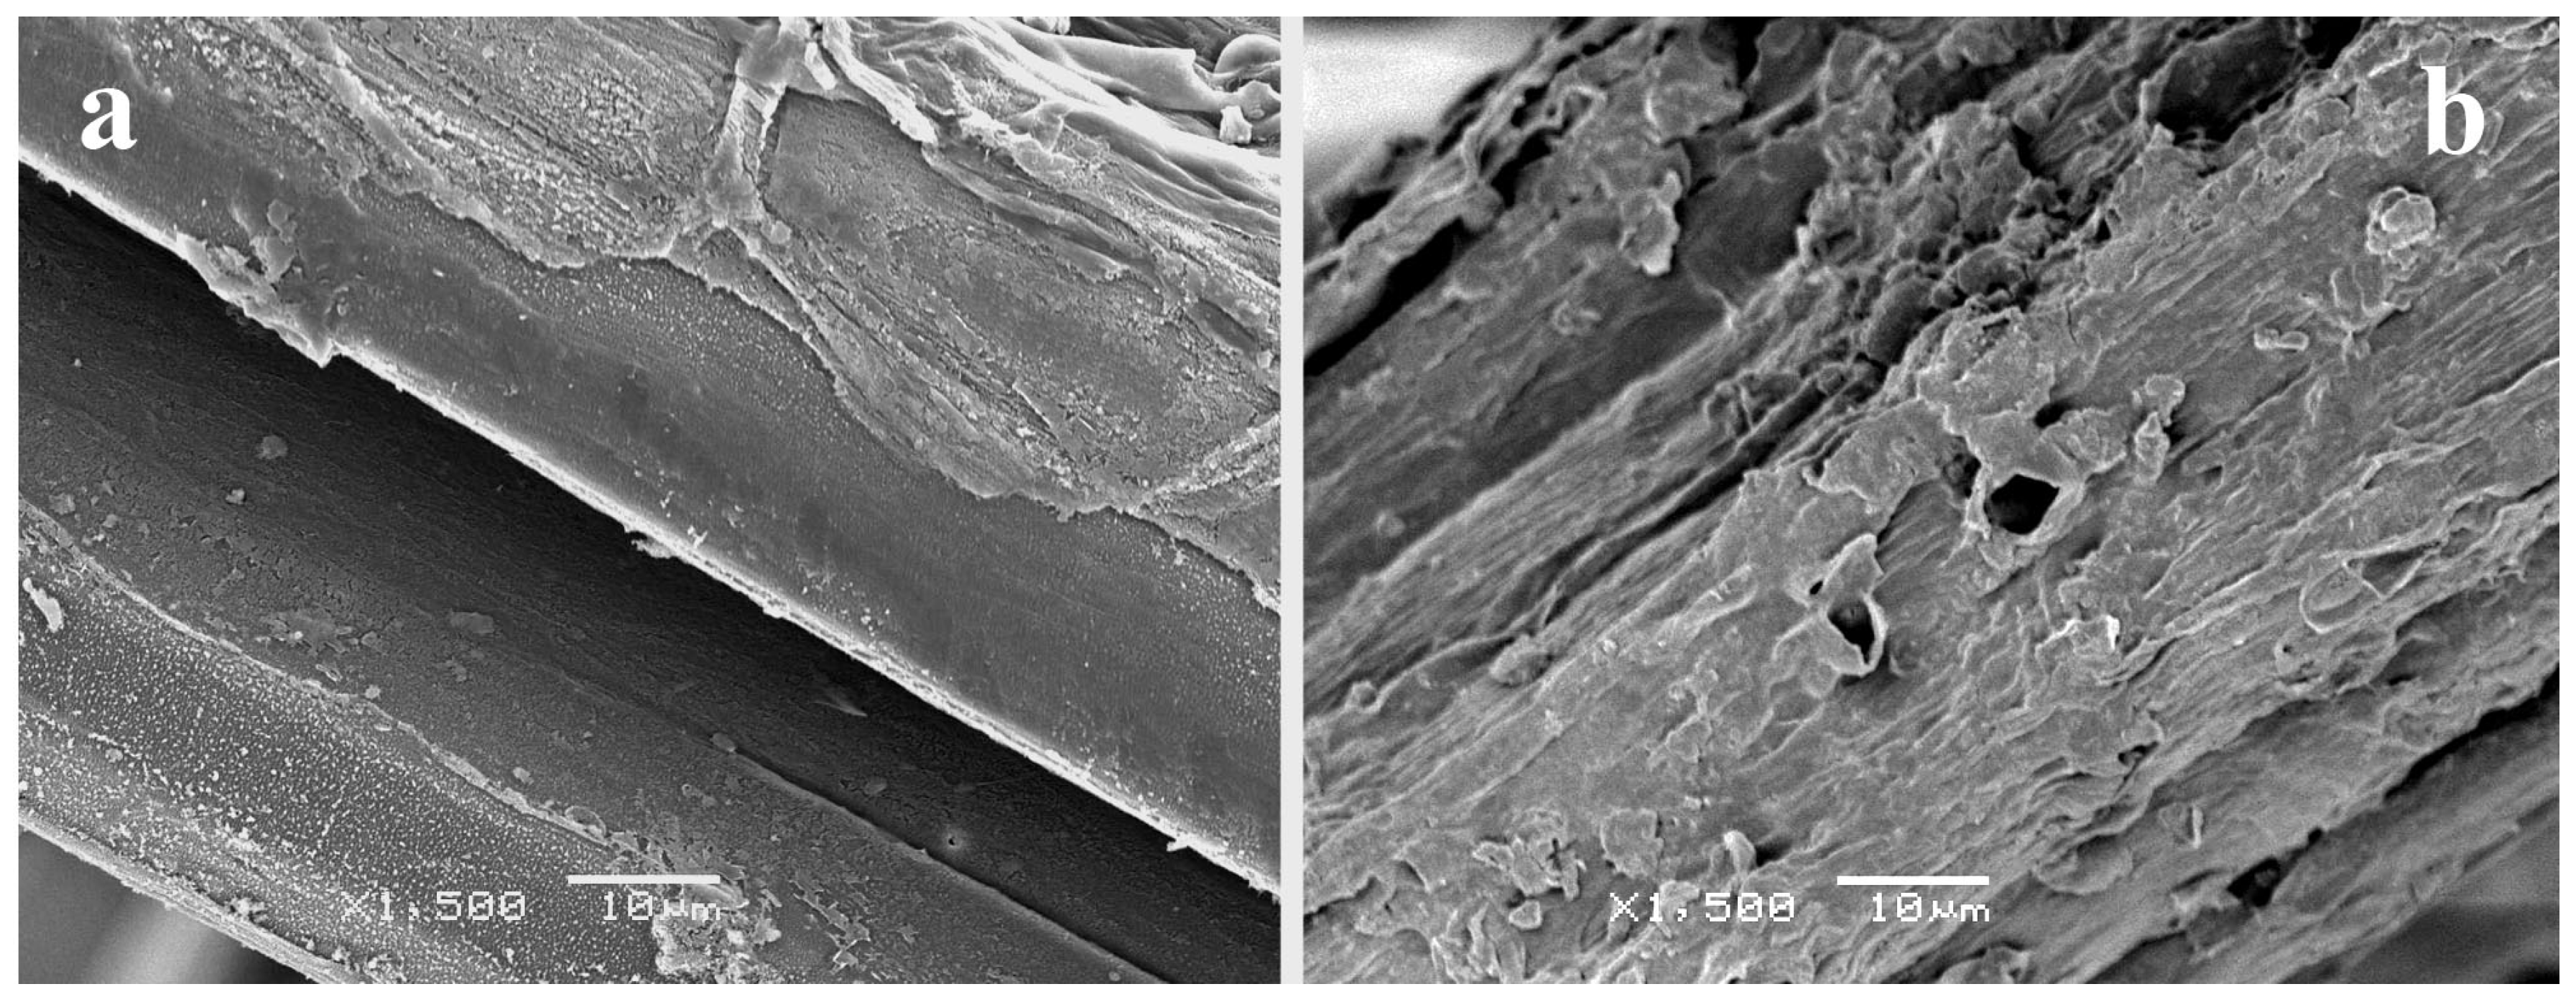
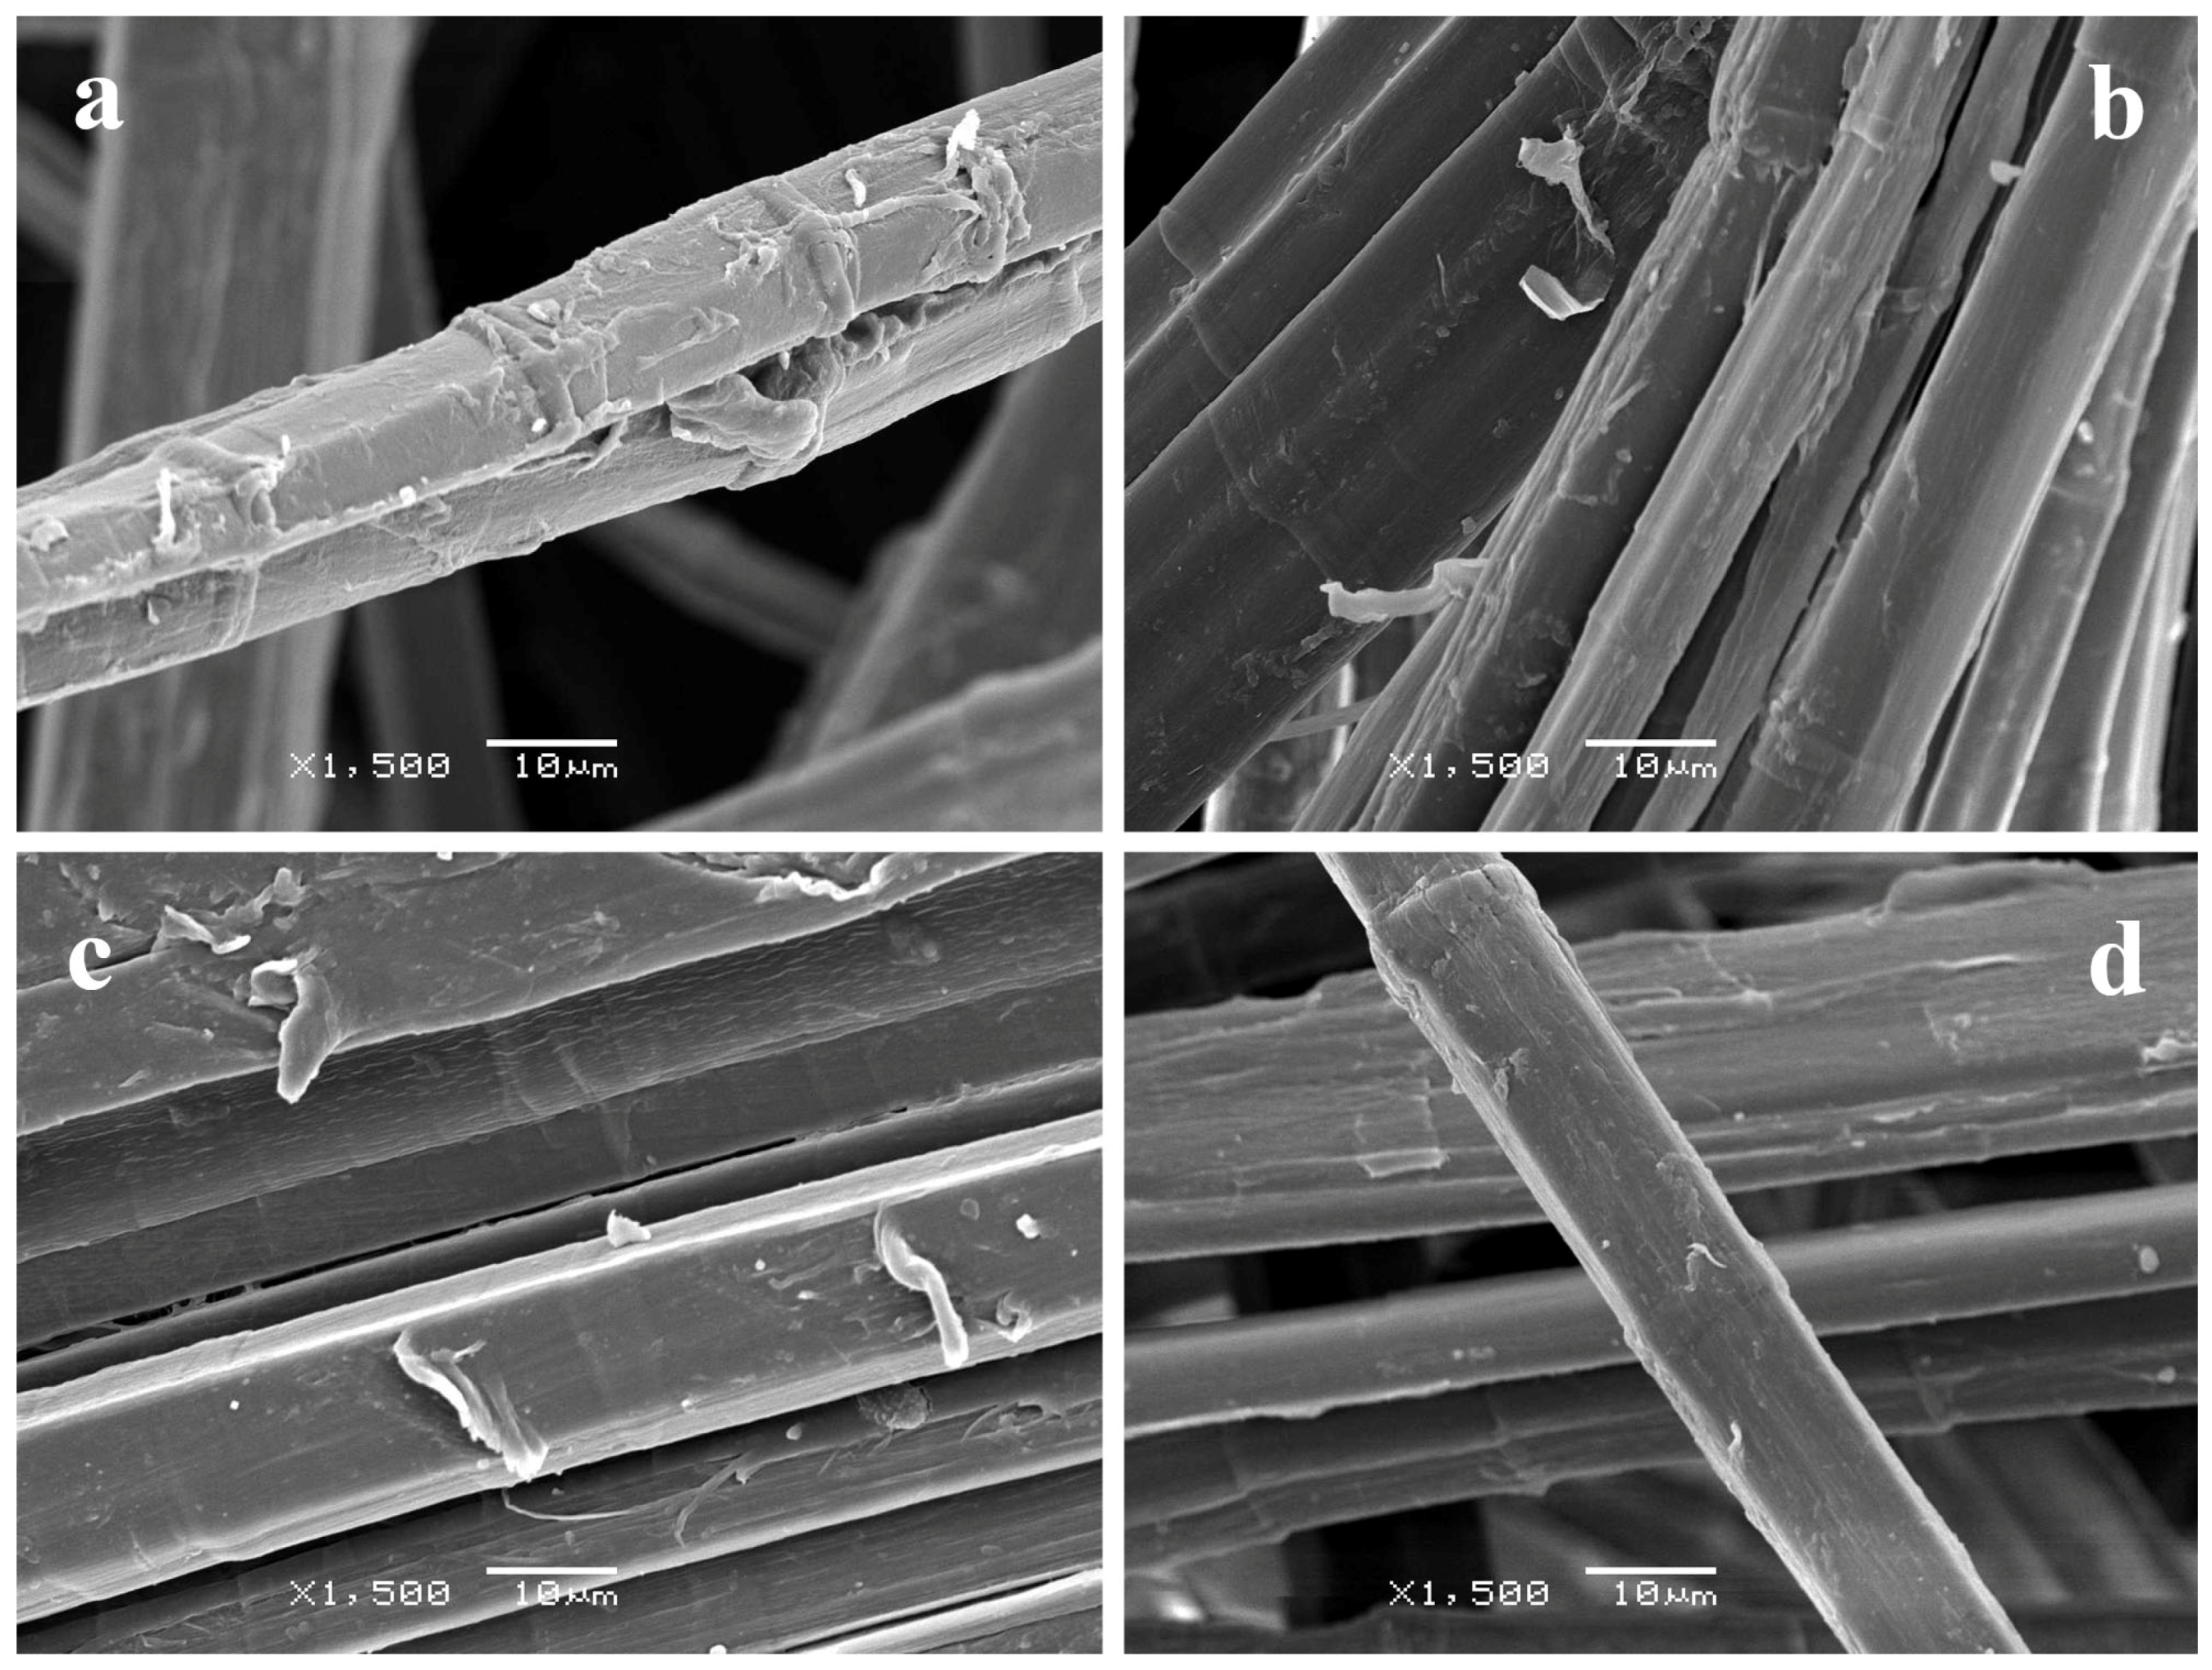
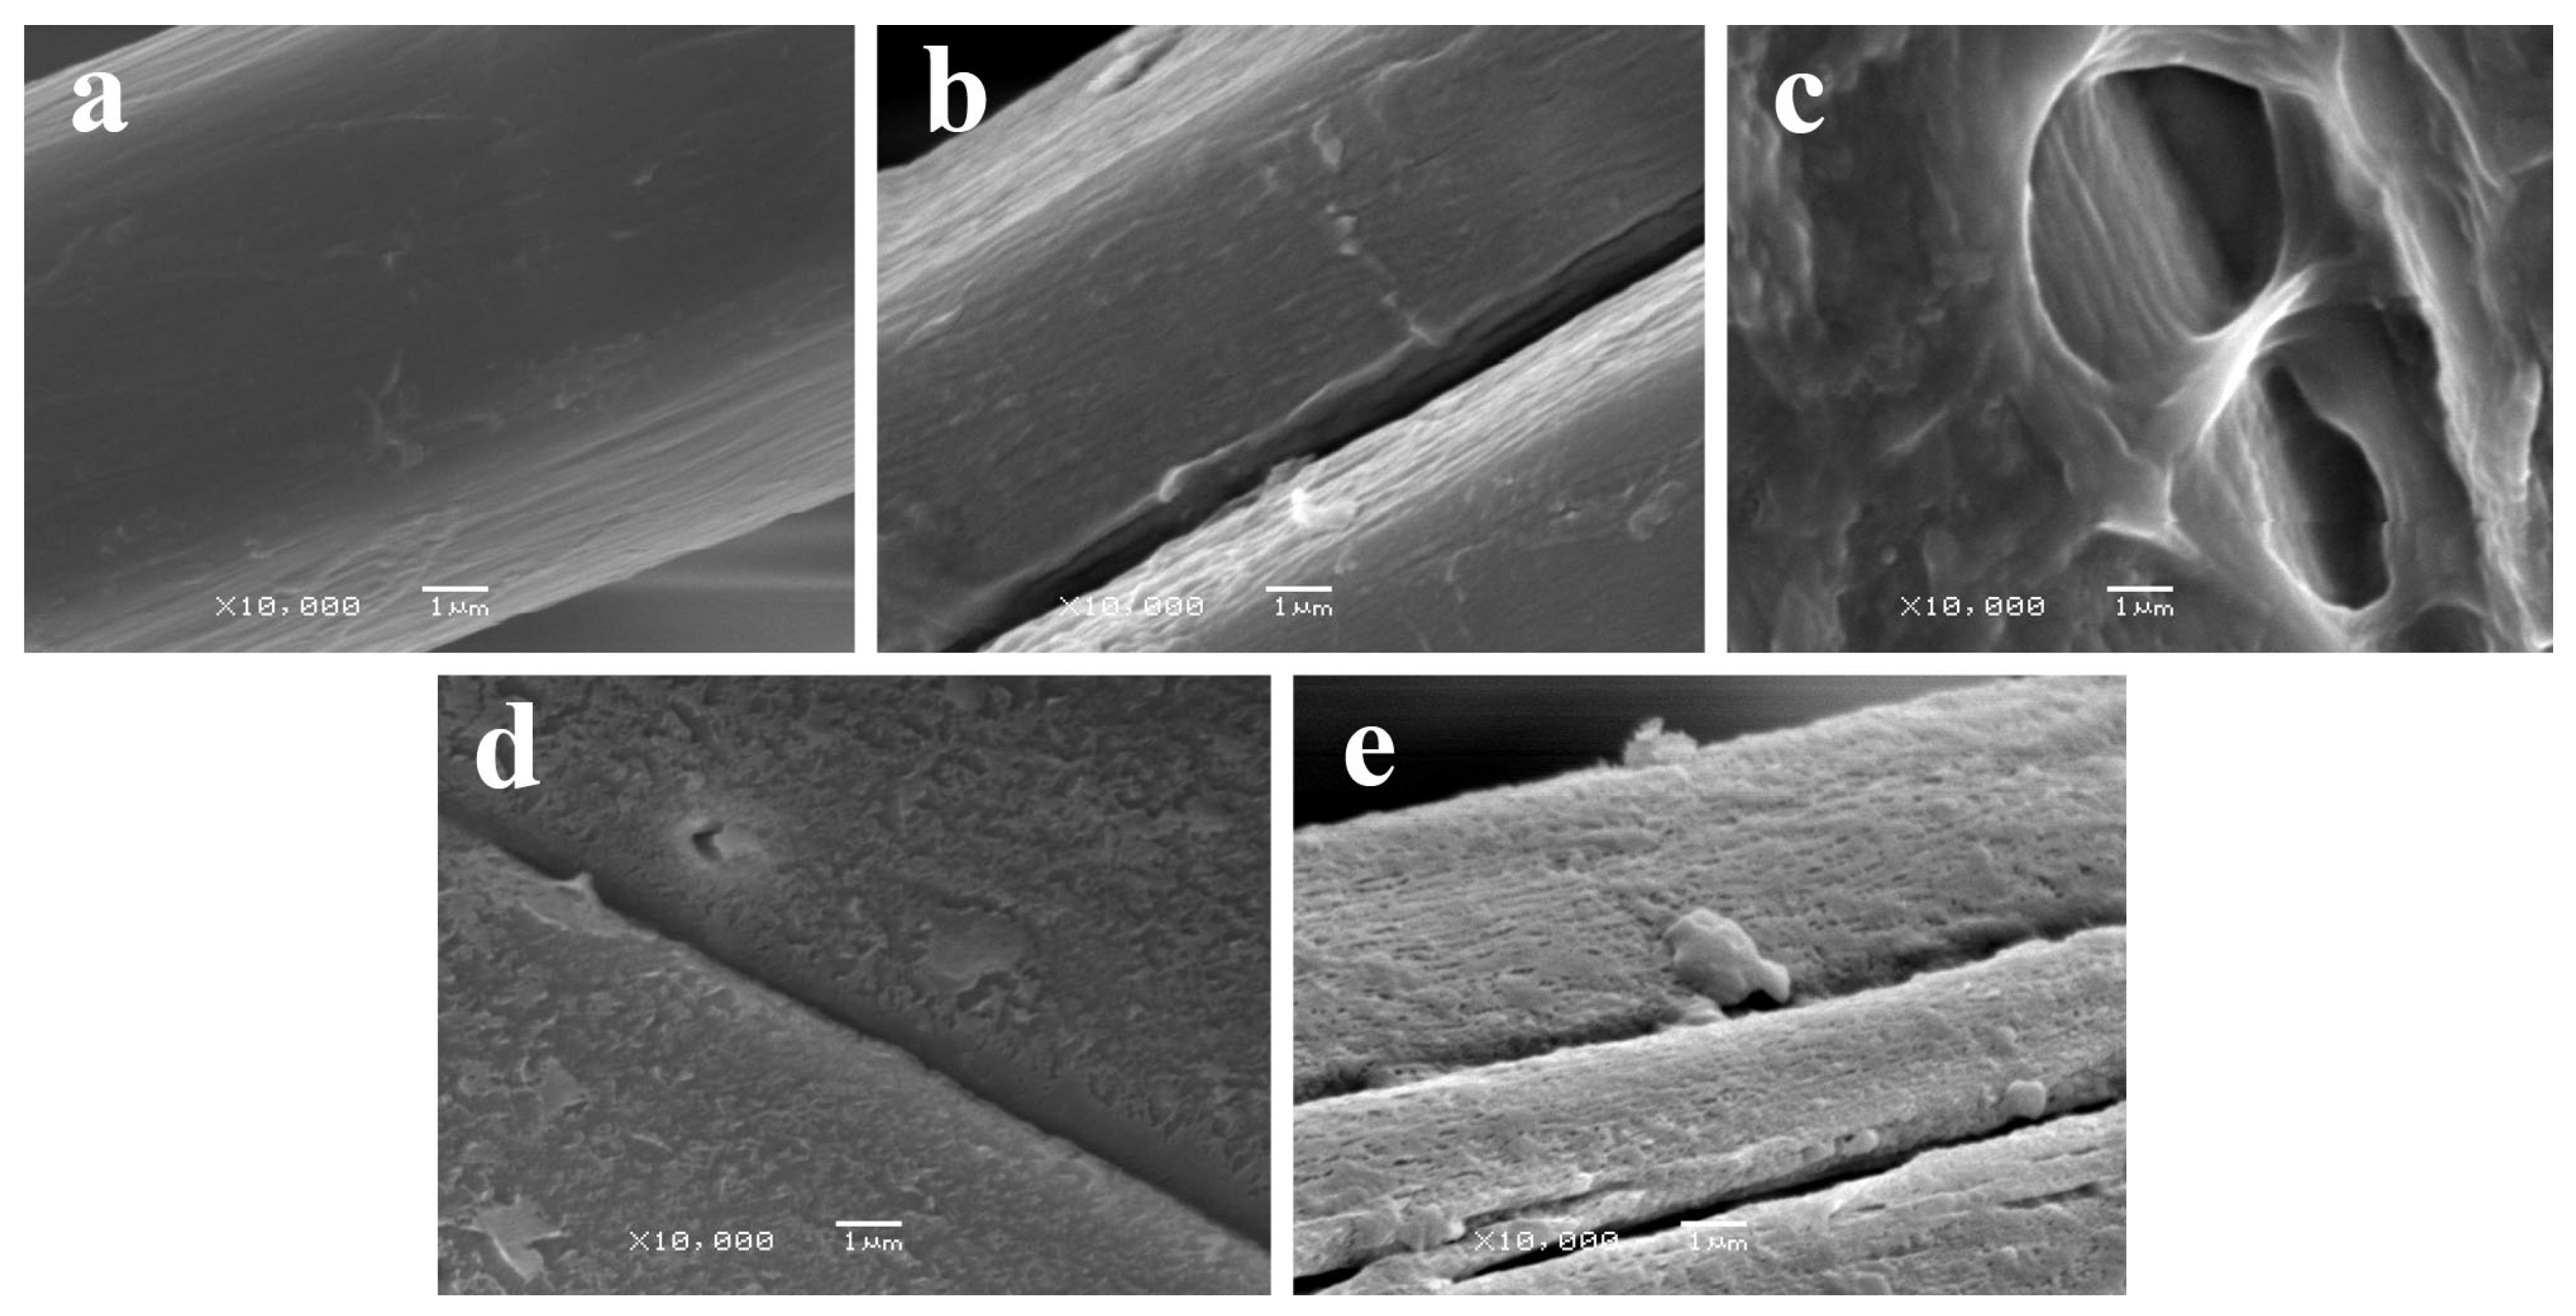
2.1.1. SEM Analysis


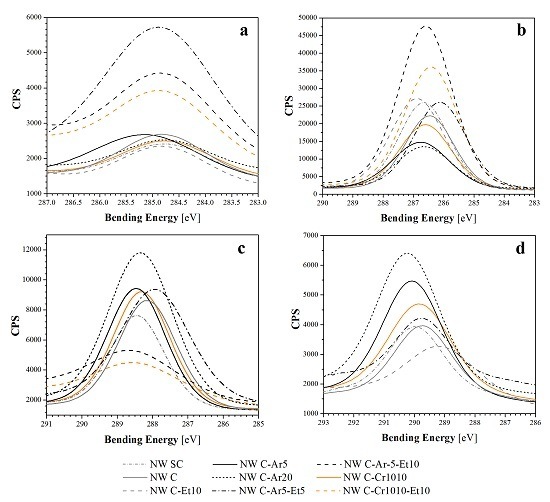
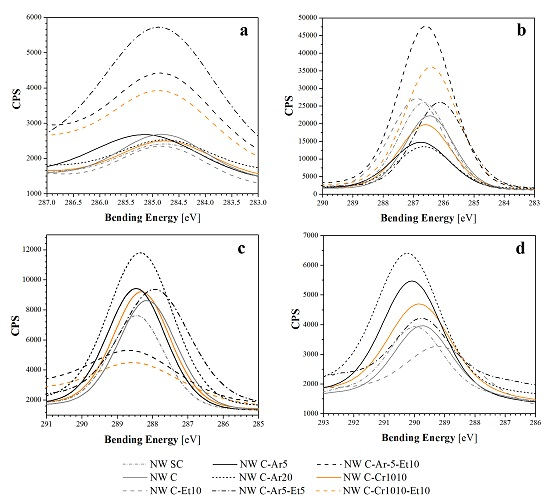
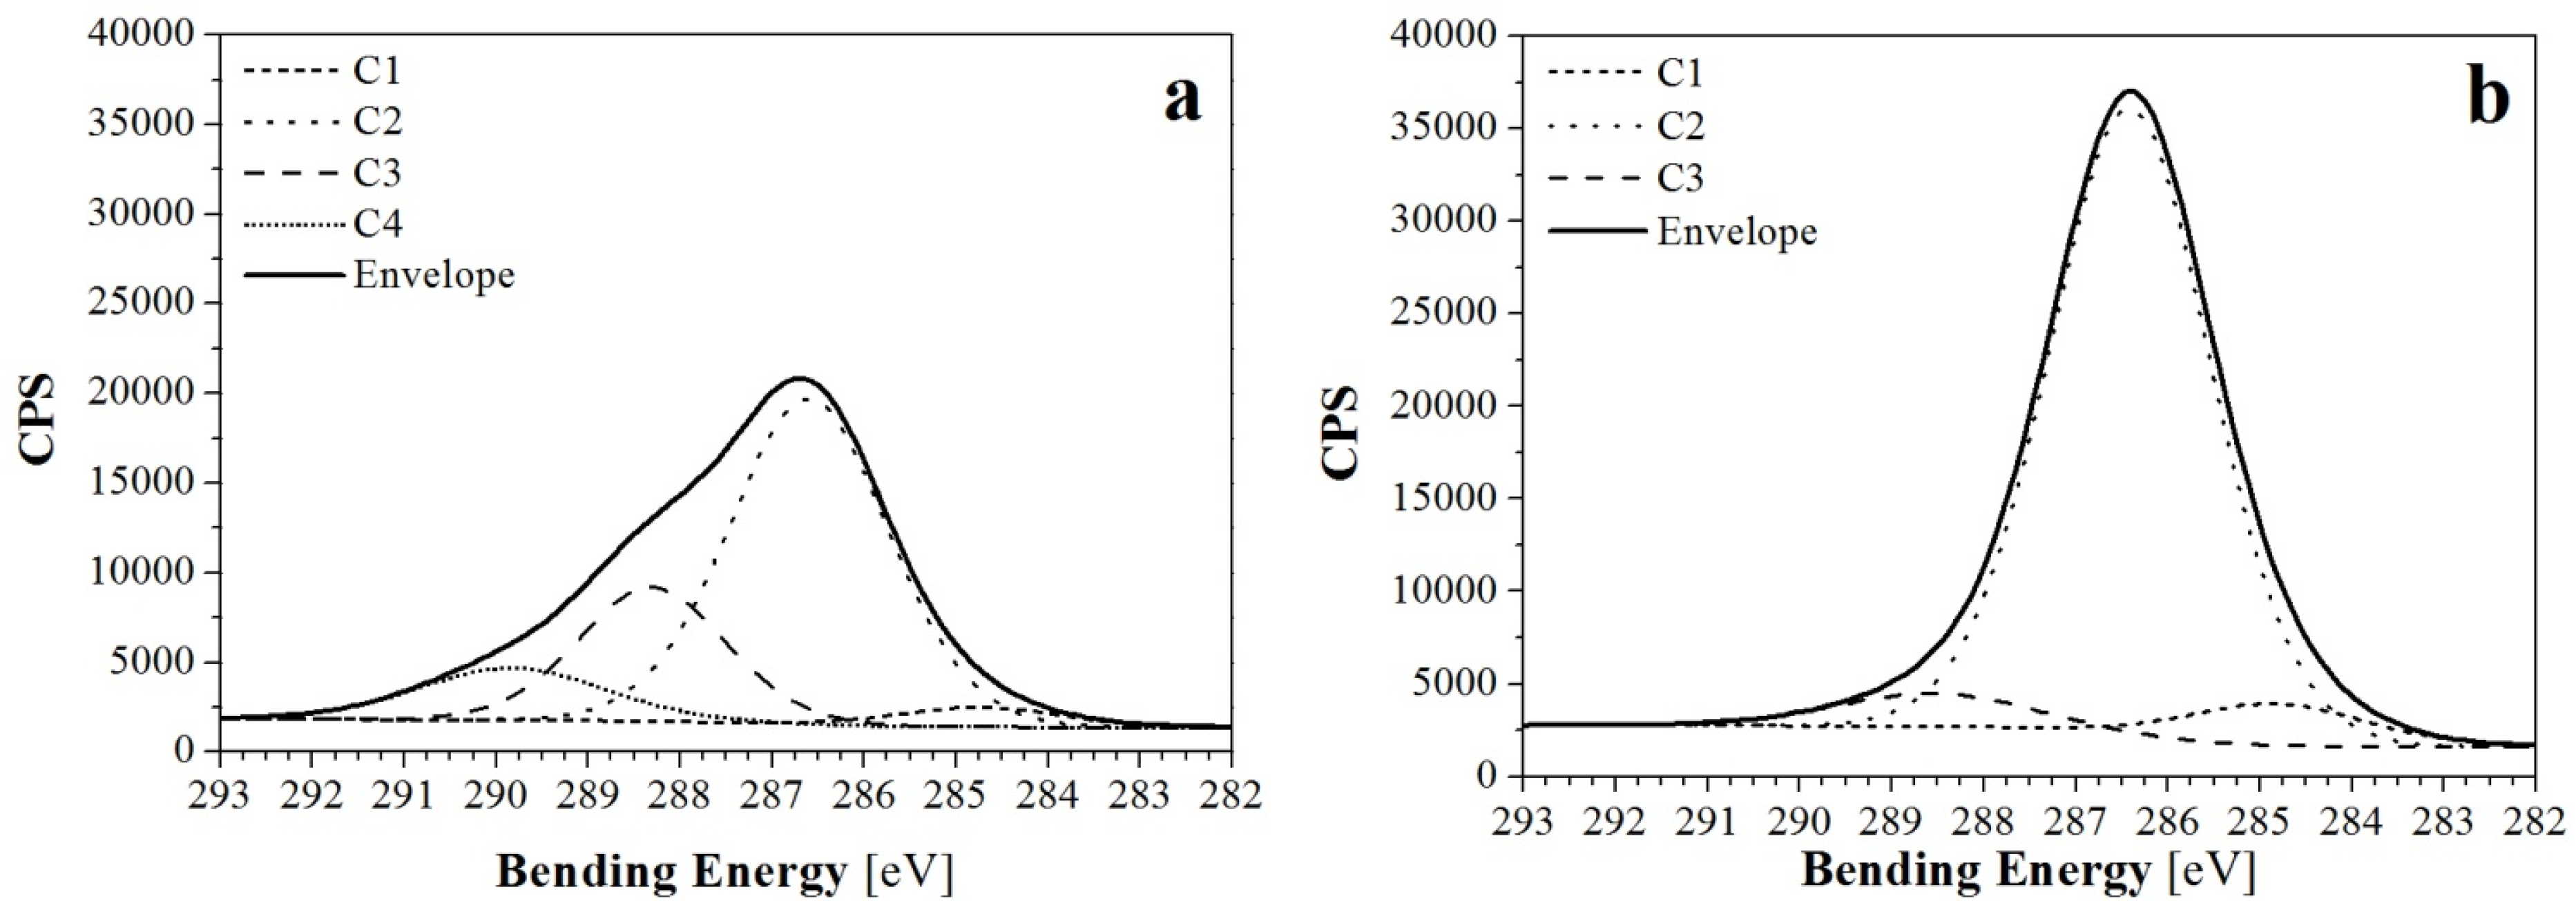
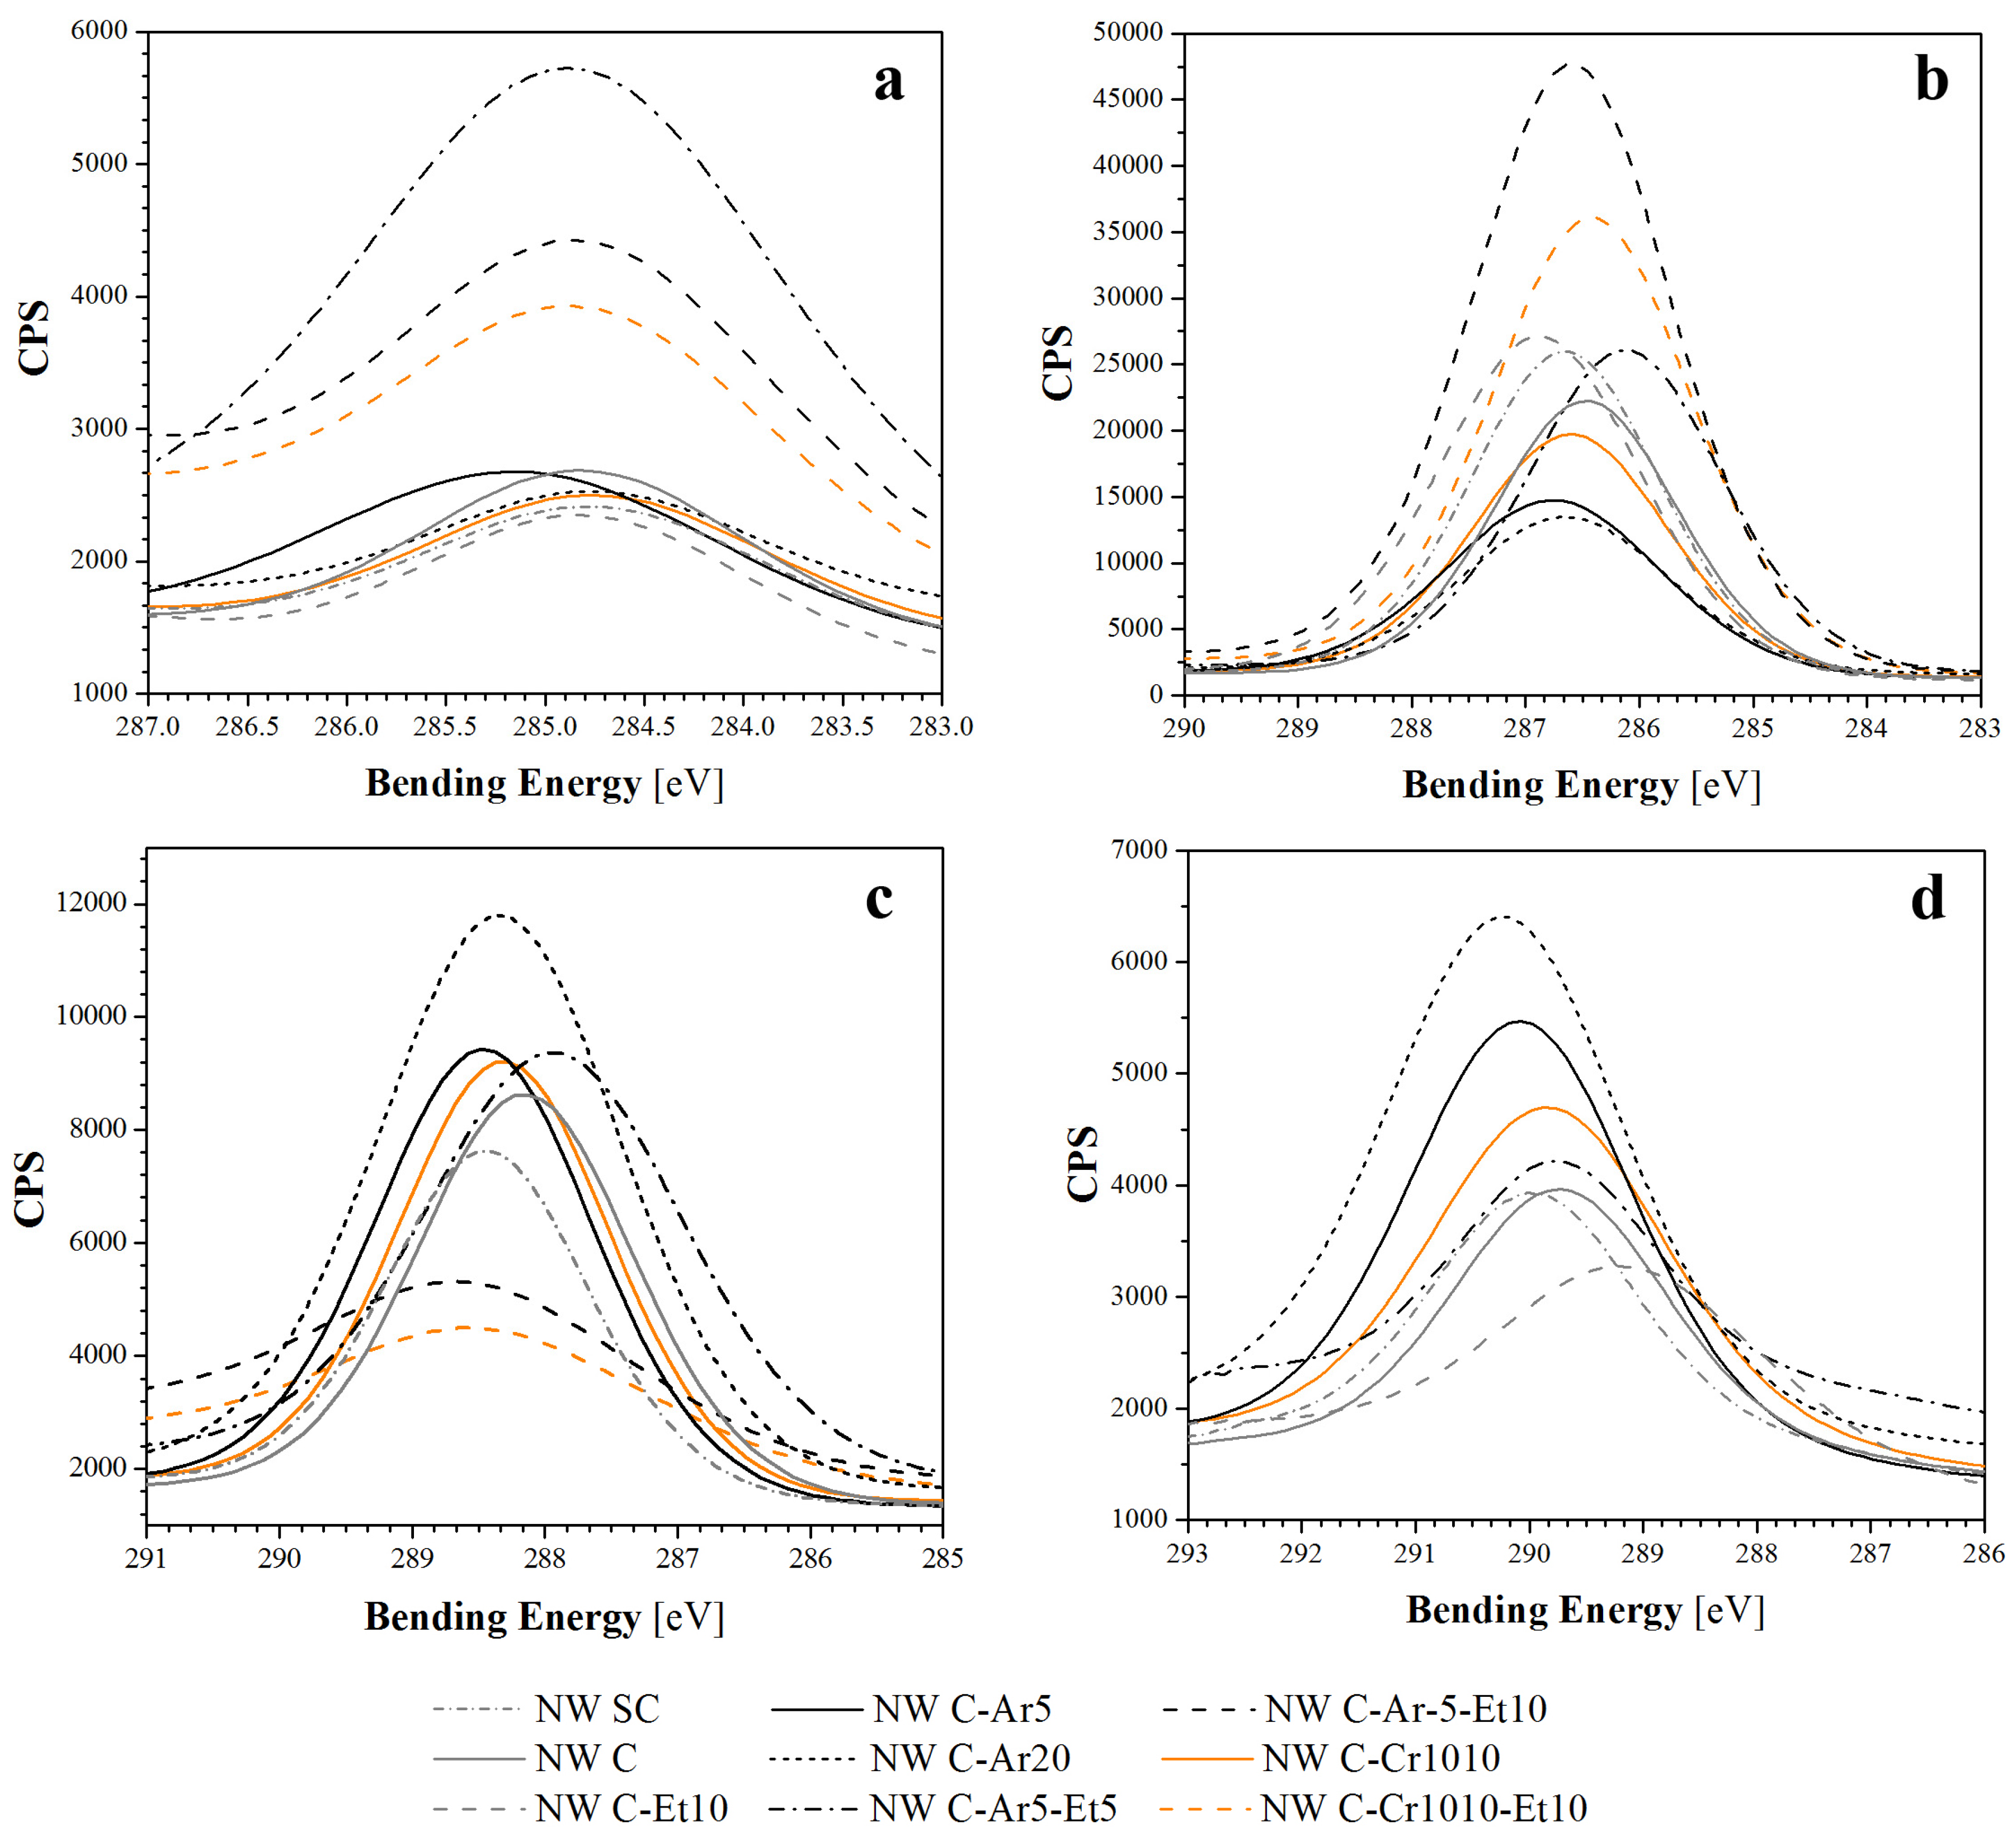
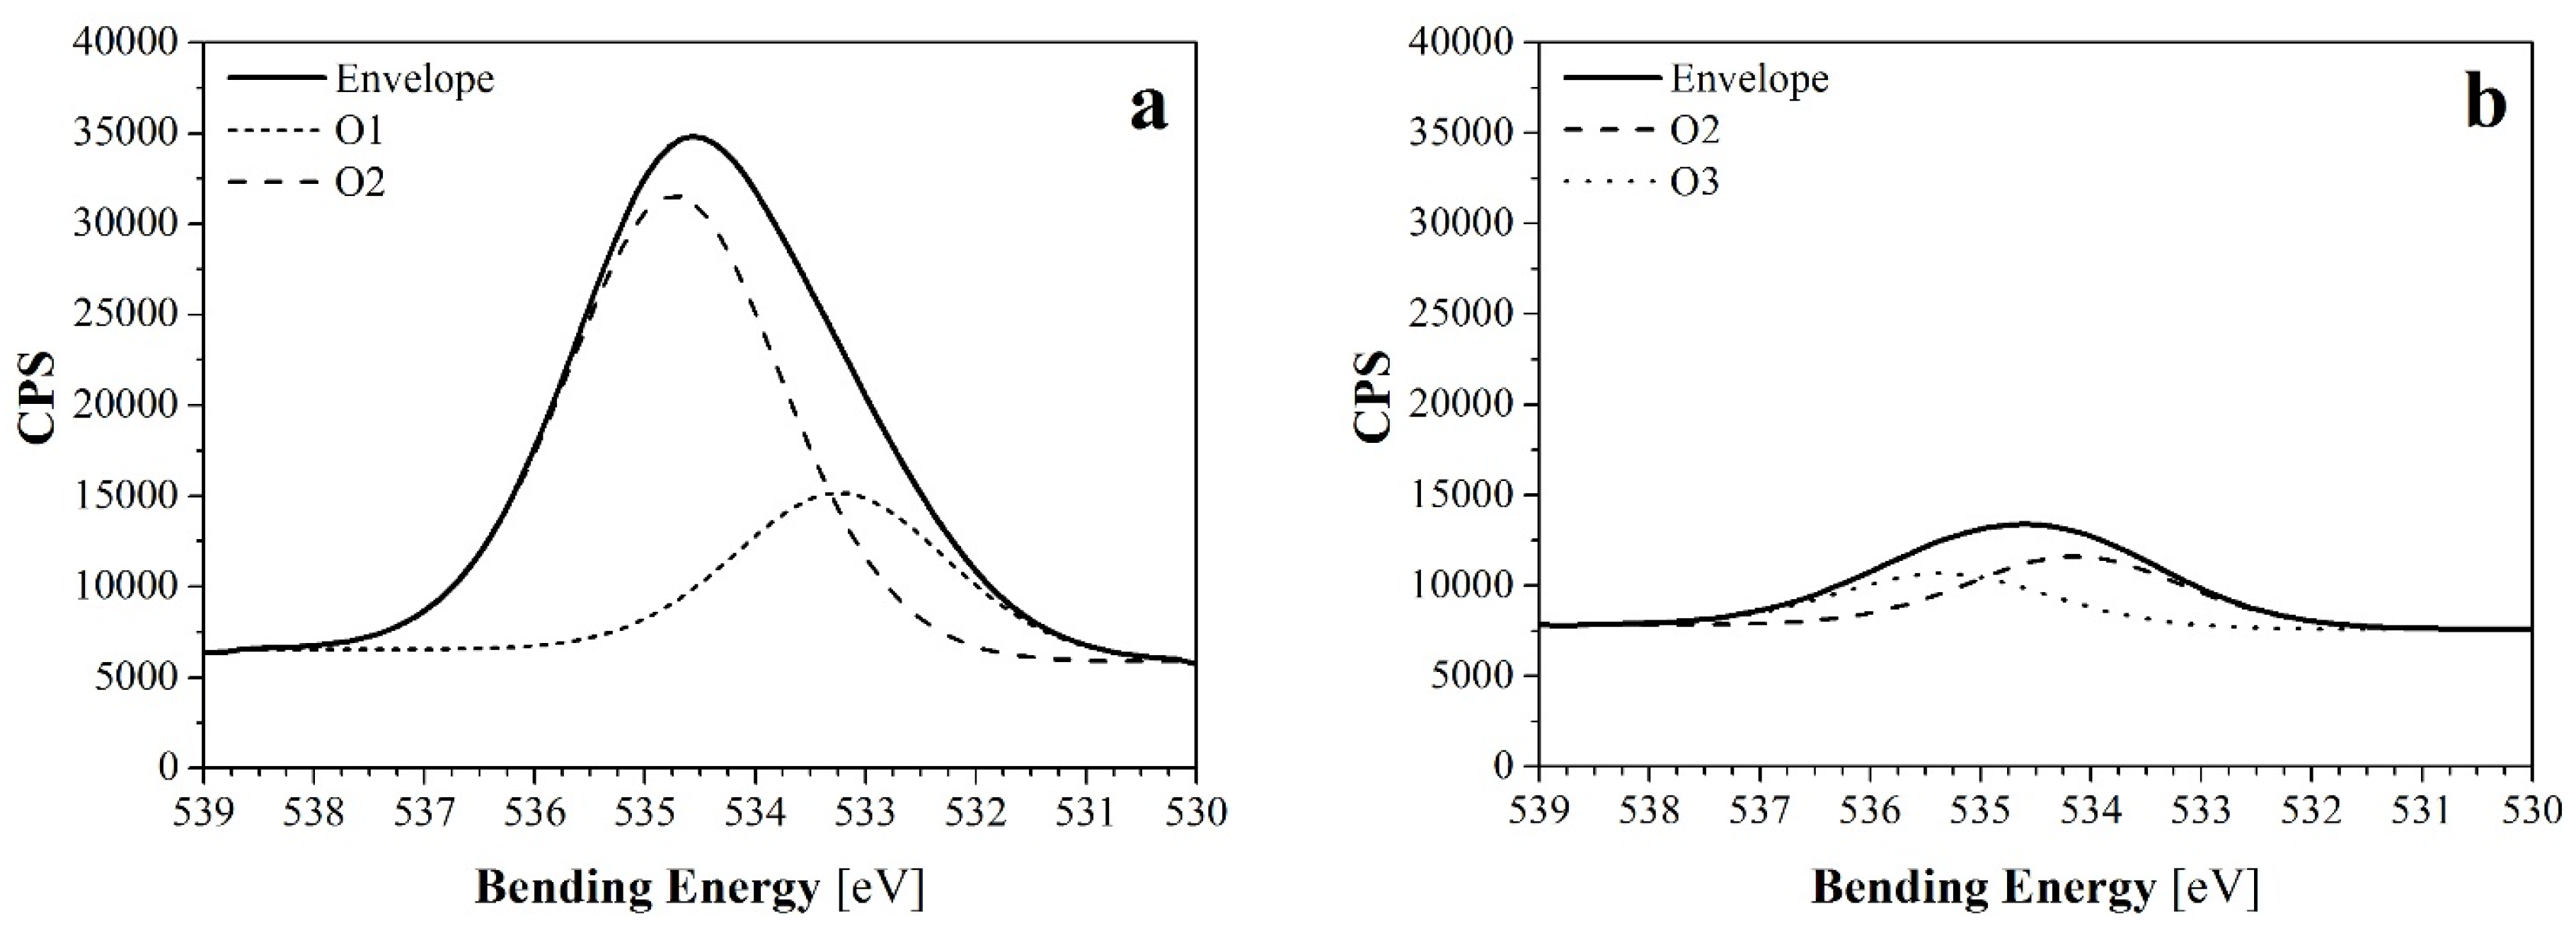
2.1.2. XPS Analysis
| Reference | Elemental Composition (Atomic %) | O/C Ratio |
|---|---|---|
 | ||
| NW SC |  | 0.23 |
| NW C |  | 0.27 |
| NW C-Et10 |  | 0.07 |
| NW C-Ar5 |  | 0.51 |
| NW C-Ar10 |  | 0.37 |
| NW C-Ar20 |  | 0.61 |
| NW C-Ar30 |  | 0.41 |
| NW C-Ar5-Et5 |  | 0.23 |
| NW C-Ar5-Et10 |  | 0.05 |
| NW C-Cr20 |  | 0.34 |
| NW C-Cr1010 |  | 0.36 |
| NW C-Cr1010-Et10 |  | 0.07 |


2.2. Wetting Properties
2.2.1. Water Retention Values
| Reference | WRV (%) | Moisture Regain (%) | Contact Angle (°) | Absorption Time | Breaking Force (N) | Strain at Break (%) |
|---|---|---|---|---|---|---|
| NW SC | 33.0 ± 1.7 | 5.3 | 115 | >1 h | 12.0 ± 0.4 | 4.7 ± 2.2 |
| NW C | 14.8 ± 7.3 | 4.4 | 116 | >1 h | 11.4 ± 5.0 | 39.8 ± 13.0 |
| NW C-Et10 | 10.8 ± 4.2 | 3.9 | 116 | >1 h | 12.7 ± 3.9 | 47.6 ± 0.8 |
| NW C-Ar5 | 16.0 ± 5.8 | 4.0 | 108 | 30 min | 14.9 ± 6.9 | 52.6 ± 11.5 |
| NW C-Ar10 | 16.5 ± 9.0 | 4.2 | 94 | 15 min | 15.8 ± 0.6 | 58.7 ± 2.0 |
| NW C-Ar20 | 15.9 ± 6.4 | 4.2 | 94 | 36 s | 16.7 ± 0.2 | 47.4 ± 9.8 |
| NW C-Ar30 | 18.9 ± 5.3 | 4.0 | 83 | 4 s | 13.5 ± 3.7 | 81.0 ± 11.8 |
| NW C-Ar5-Et5 | 14.1 ± 7.5 | 4.1 | 117 | >1 h | 17.8 ± 5.7 | 47.9 ± 11.2 |
| NW C-Ar5-Et10 | 12.2 ± 6.9 | 4.1 | 116 | >1 h | 29.0 ± 1.6 | 53.2 ± 0.8 |
| NW C-CR1010 | 17.2 ± 5.9 | 4.2 | 80 | 50 ms | 12.8 ± 2.0 | 41.7 ± 4.0 |
| NW C-CR20 | 15.0 ± 8.1 | 4.1 | 74 | 5 ms | 7.9 ± 1.1 | 56.9 ± 15.7 |
| NW C-CR1010-Et10 | 15.0 ± 7.5 | 4.1 | 127 | >1 h | 28.7 ± 1.2 | 38.2 ± 2.4 |
2.2.2. Moisture Regain
2.2.3. Contact Angles
2.3. Thermal Stability
| Reference | Moisture Loss (%) | Inflection Point (°C) 2nd Step | Inflection Point (°C) 3rd Step | Solid Residue (%) |
|---|---|---|---|---|
| NW SC | 2.9 | 375 | 677 | 2.9 |
| NW C | 2.5 | 376 | 677 | 3.5 |
| NW C-Et10 | 2.6 | 376 | 675 | 2.3 |
| NW C-Ar5 | 2.5 | 374 | 677 | 3.0 |
| NW C-Ar10 | 2.5 | 375 | 676 | 2.6 |
| NW C-Ar20 | 2.6 | 375 | 677 | 2.3 |
| NW C-Ar30 | 2.5 | 376 | 674 | 2.5 |
| NW C-Ar5-Et5 | 2.5 | 373 | 673 | 2.9 |
| NW C-Ar5-Et10 | 2.5 | 372 | 673 | 2.9 |
| NW C-CR1010 | 2.5 | 374 | 675 | 5.9 |
| NW C-CR20 | 2.5 | 376 | 673 | 3.3 |
| NW C-CR1010-Et10 | 2.5 | 369 | 672 | 3.9 |

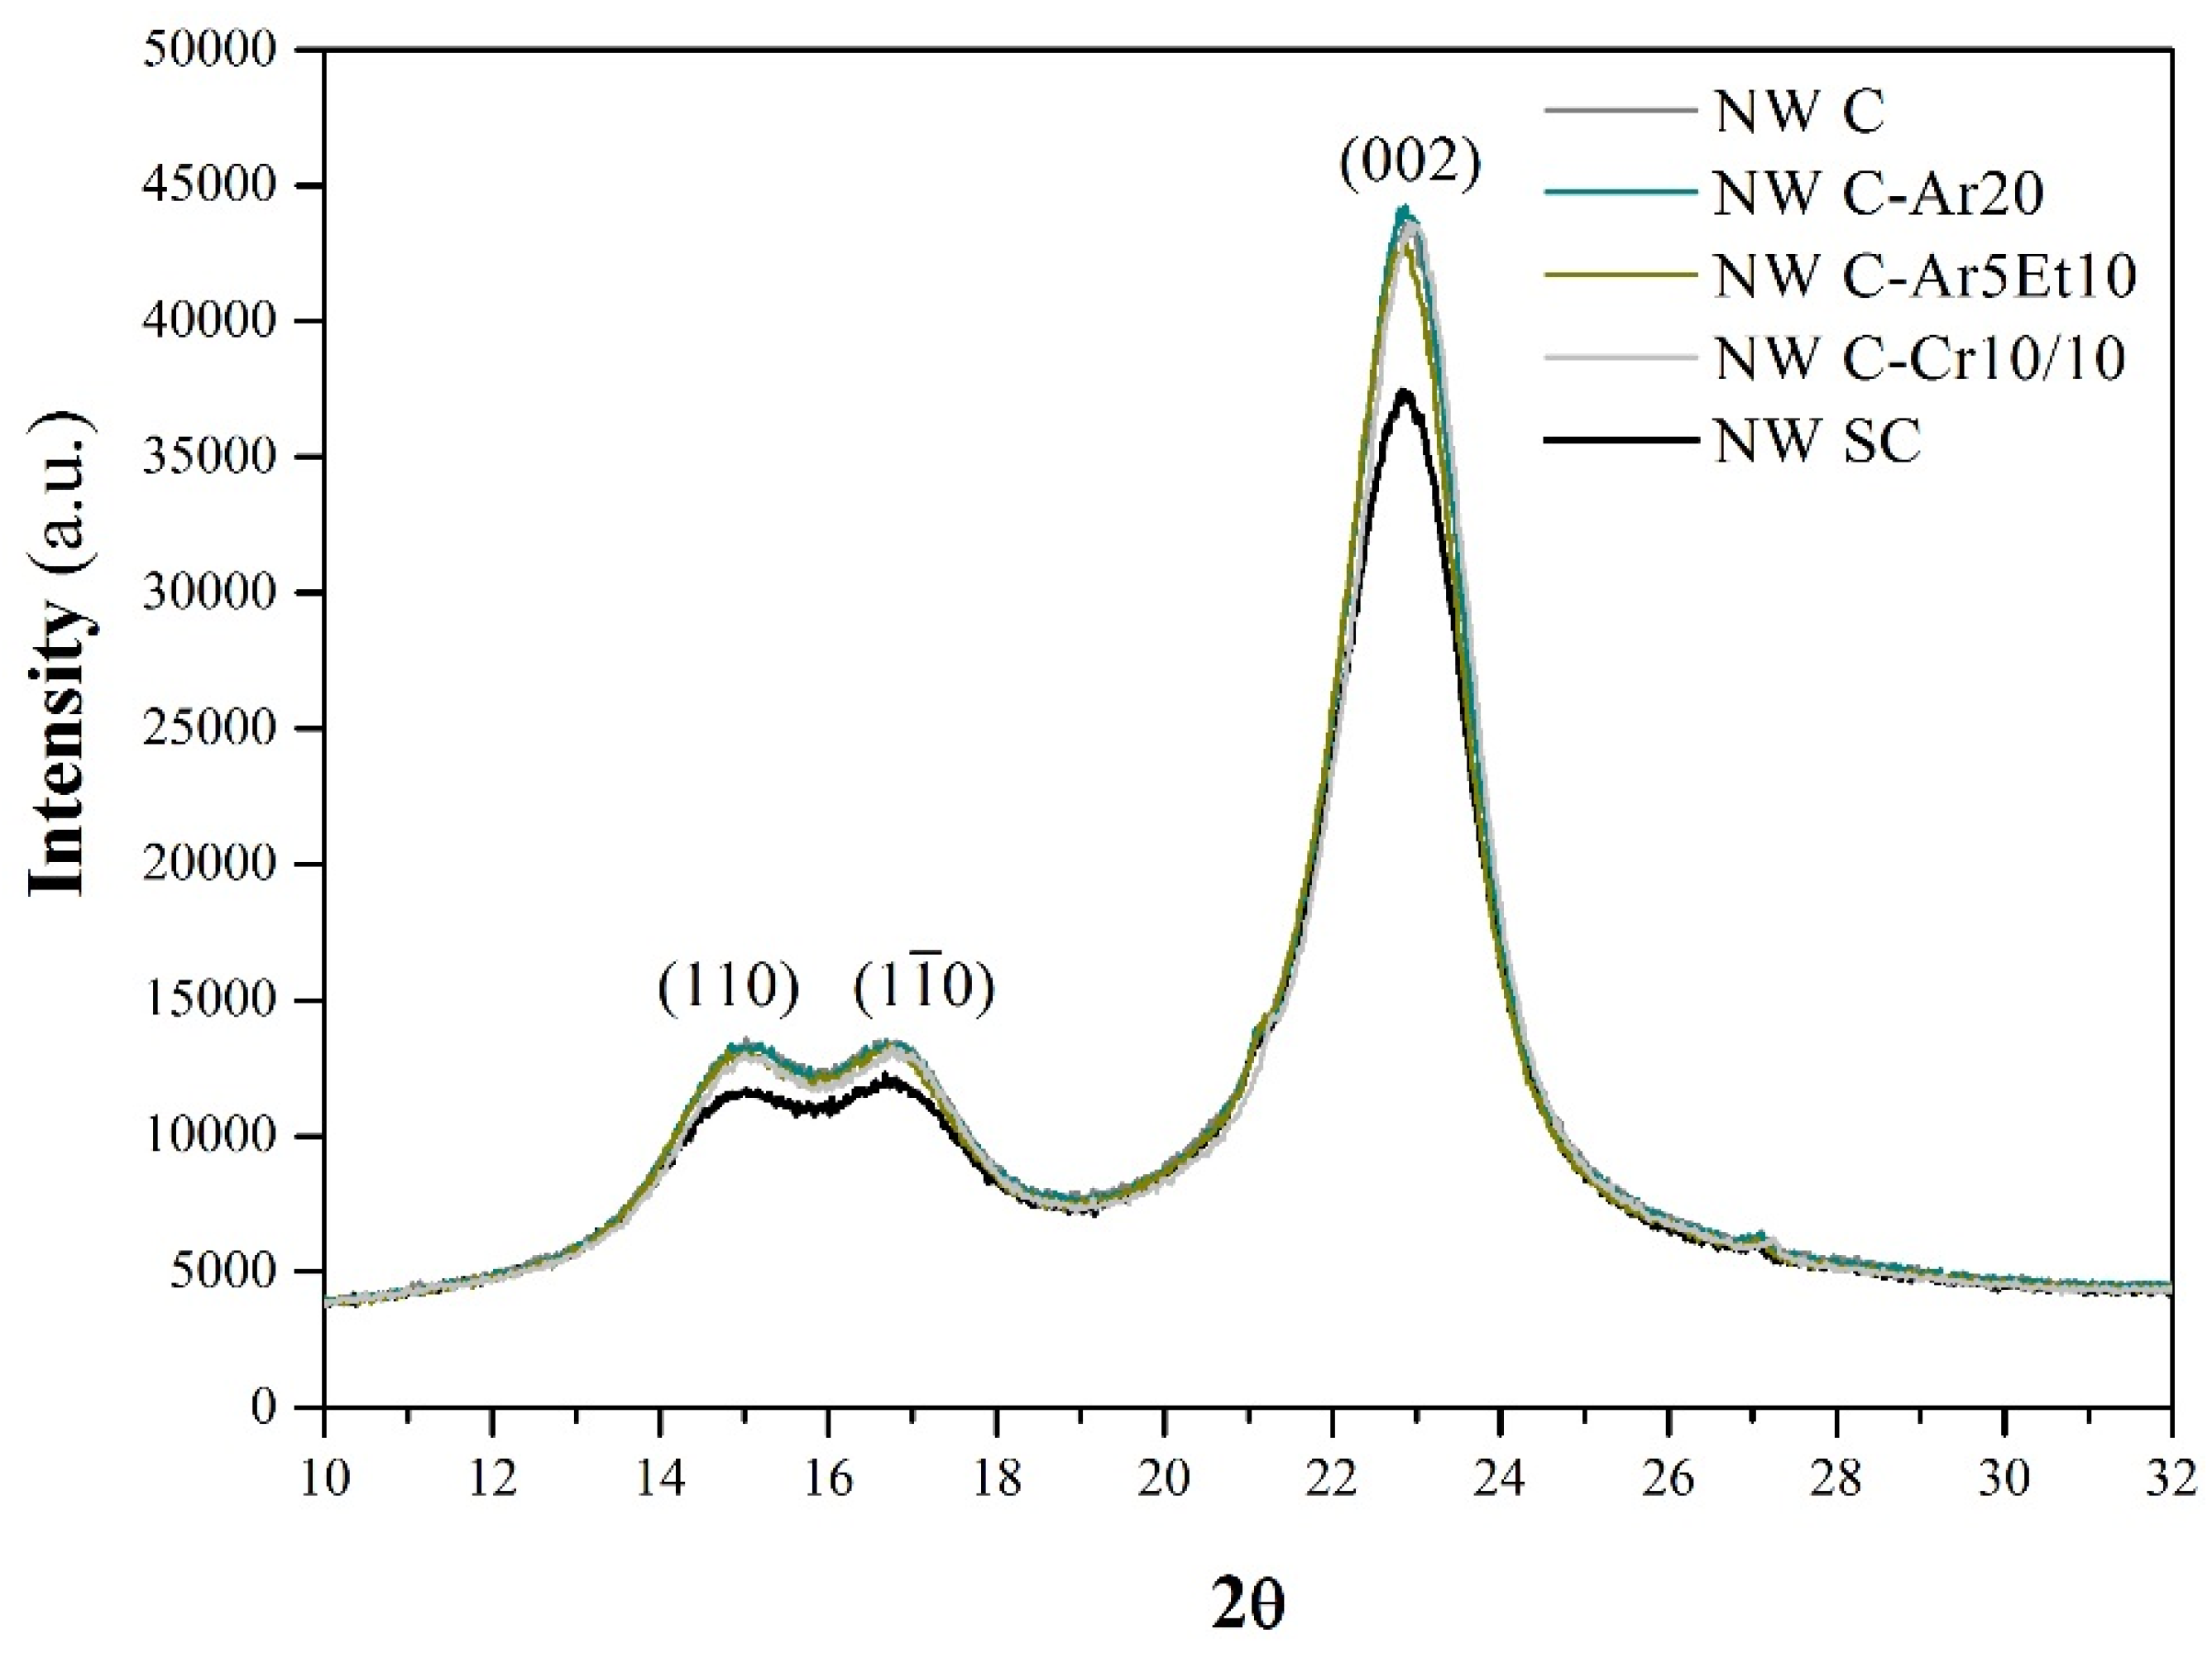
2.4. Fiber Crystallinity

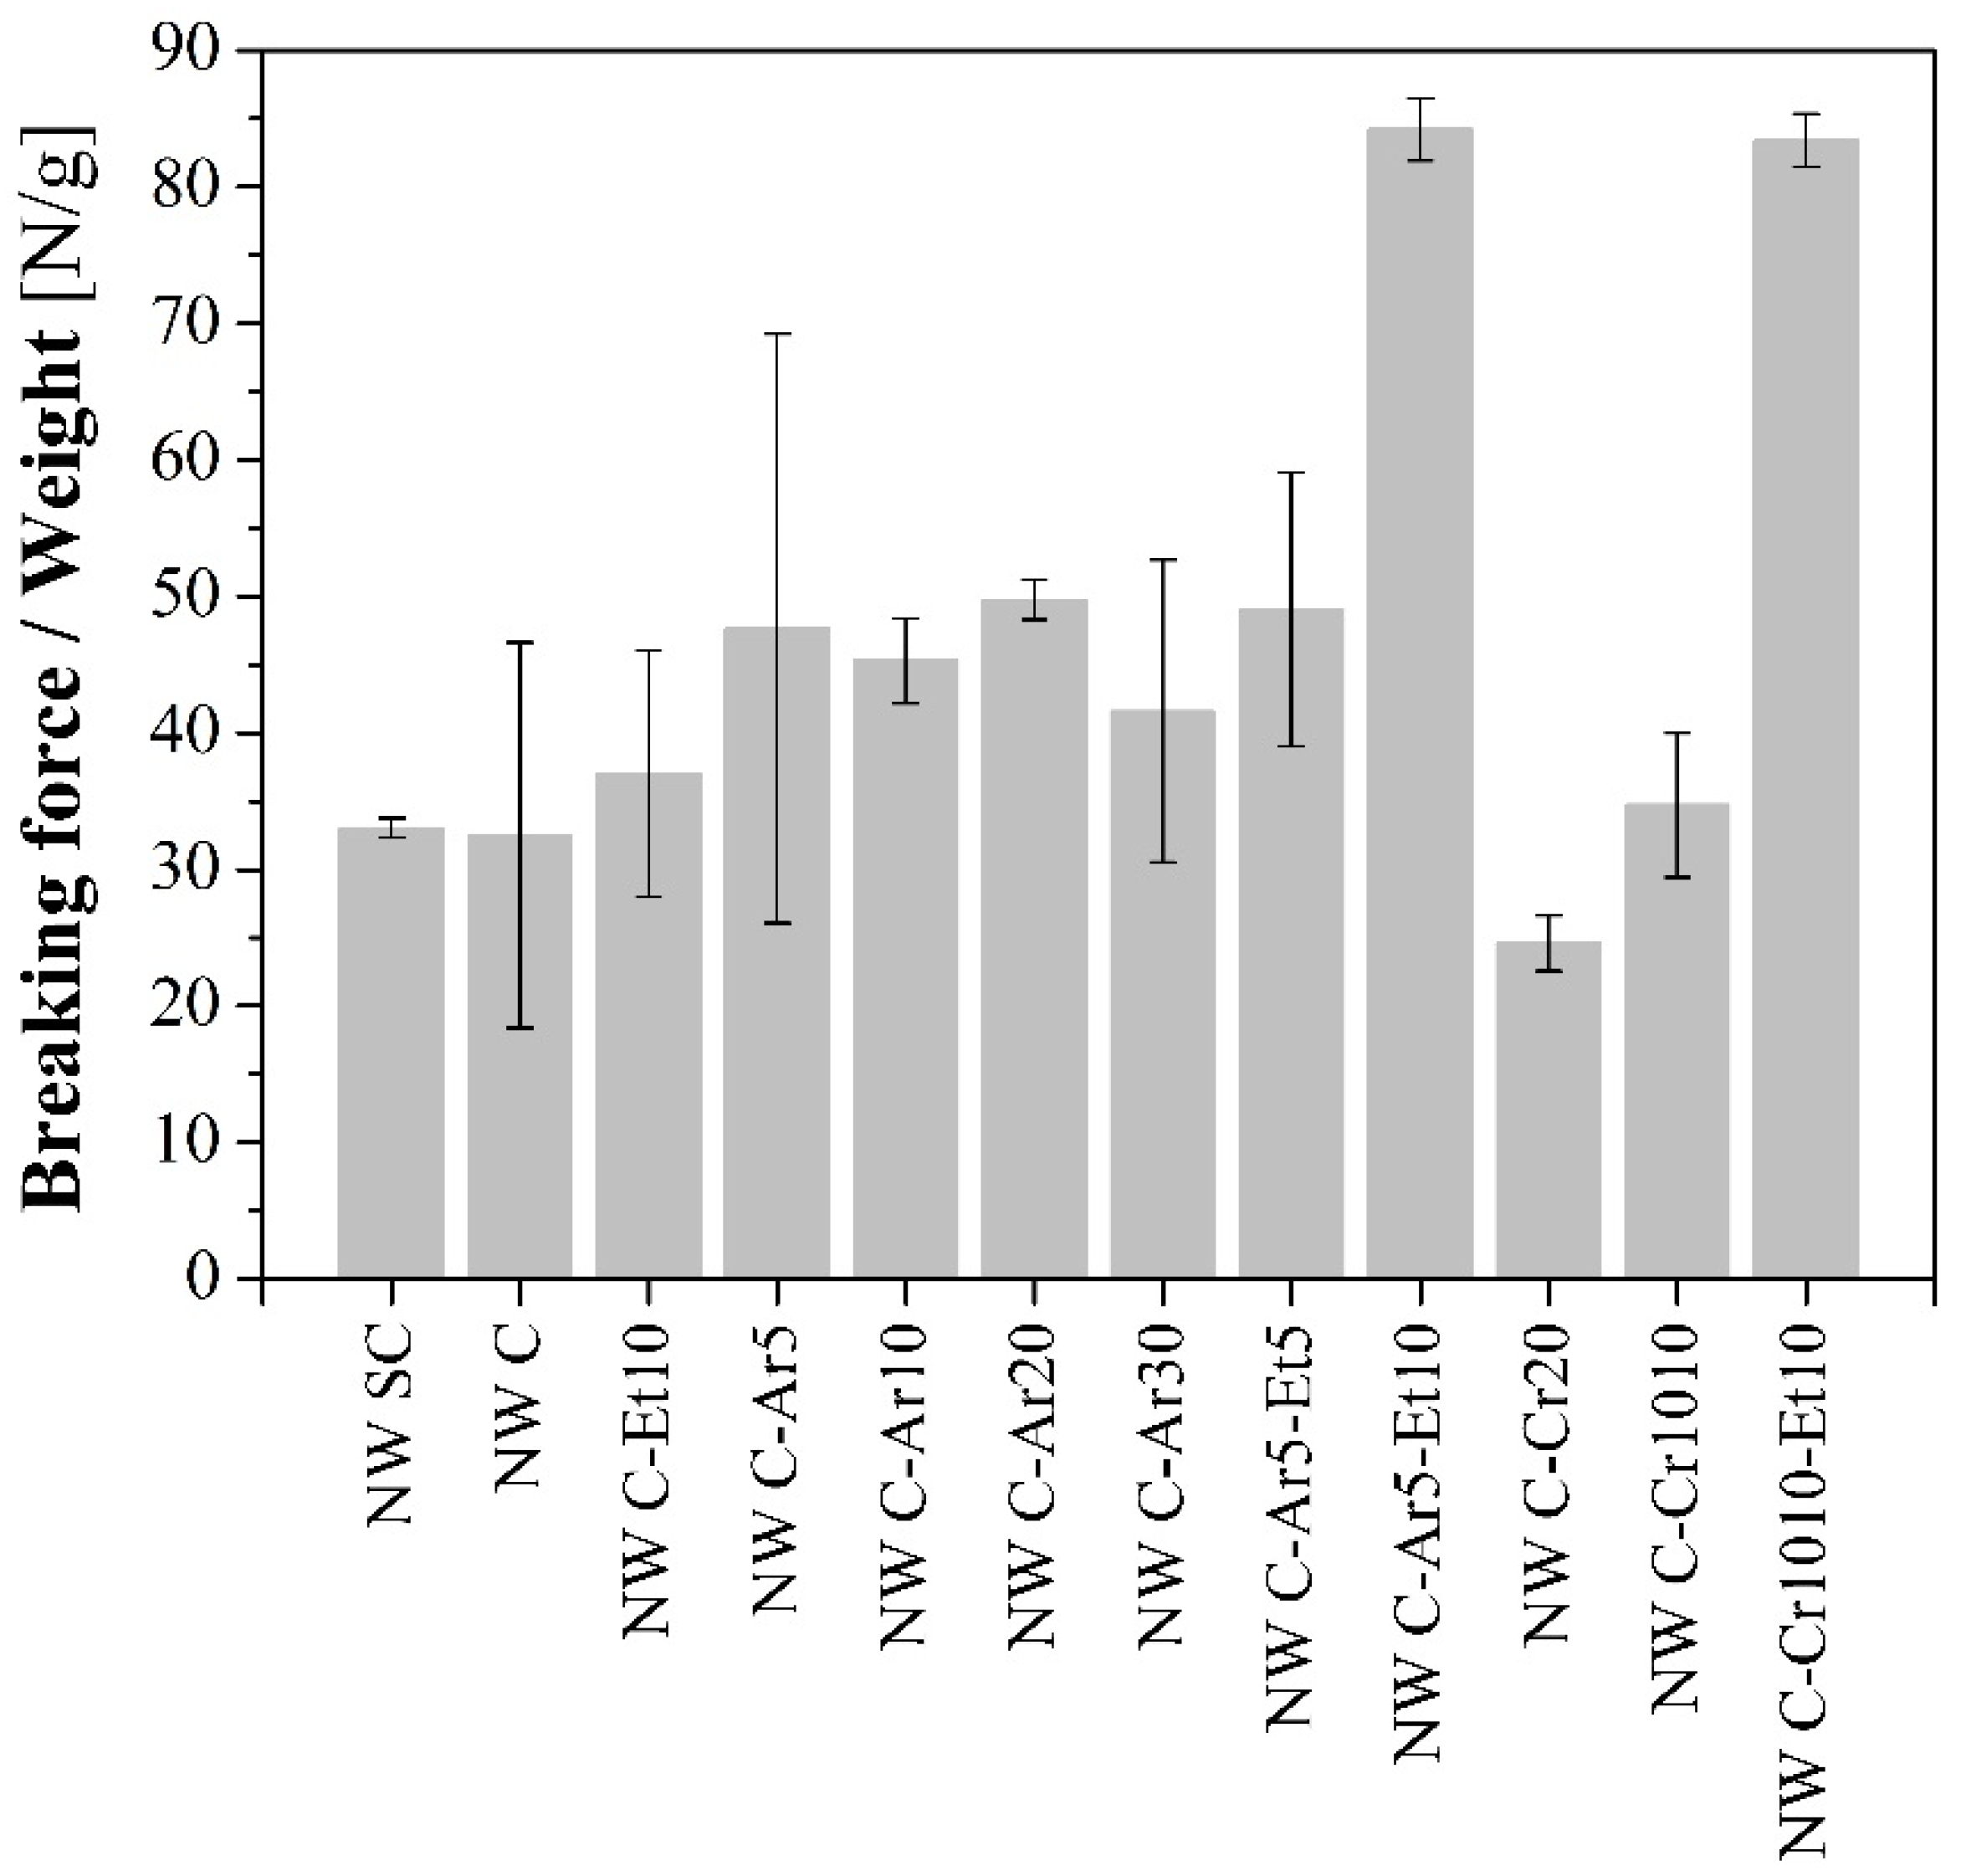
2.5. Mechanical Properties

2.6. Considerations for Reinforcement Applications
3. Experimental Section
3.1. Materials
3.2. Nonwoven Preparation
3.3. Nonwoven Treatment
3.3.1. Wet/Dry Cycling Treatment
3.3.2. Plasma Treatments
3.4. Characterization of the NW Fibers
3.4.1. Surface Characterization
3.4.2. Wetting Properties
3.4.3. Thermal Stability
3.4.4. Fiber Crystallinity
3.4.5. Mechanical Properties
4. Conclusions
Acknowledgments
Author Contributions
Conflicts of Interest
References
- Saheb, D.N.; Jog, J.P. Natural fiber polymer composites: A review. Adv. Polym. Technol. 1999, 18, 351–363. [Google Scholar] [CrossRef]
- Thomas, S.; Pothan, L.A. Natural Fibre Reinforced Polymer Composites. From Macro to Nanoscale; Old City Publishing: Paris, France, 2009. [Google Scholar]
- Faruk, O.; Bledzki, A.; Fink, H.; Sain, M. Biocomposites reinforced with natural fibers: 2000–2010. Prog. Polym. Sci. 2012, 37, 1552–1596. [Google Scholar] [CrossRef]
- Yan, L.; Chouw, N.; Jayaraman, K. Flax fibre and its composites—A review. Compos. Part B Eng. 2014, 56, 296–317. [Google Scholar] [CrossRef]
- Ardanuy, M.; Claramunt, J.; Toledo Filho, R.D. Cellulosic fiber reinforced cement-based composites: A review of recent research. Constr. Build. Mater. 2015, 79, 115–128. [Google Scholar] [CrossRef] [Green Version]
- Claramunt, J.; Ardanuy, M.; García-Hortal, J.A.; Filho, R.D.T. The hornification of vegetable fibers to improve the durability of cement mortar composites. Cem. Concr. Compos. 2011, 33, 586–595. [Google Scholar] [CrossRef]
- Ardanuy, M.; Claramunt, J.; Ventura, H.; Manich, A.M. Effect of water treatment on the fiber-matrix bonding and durability of cellulose fiber cement composites. J. Biobased Mater. Bioenergy 2015, 9, 1–7. [Google Scholar] [CrossRef]
- Inagaki, N. Plasma Surface Modification and Plasma Polymerization; Taylor & Francis: Lancaster, PA, USA, 1996. [Google Scholar]
- Shishoo, R. Plasma Technologies for Textiles; Woodhead Publishing Series in Textiles, Elsevier Science: Cambridge, UK, 2007. [Google Scholar]
- Sabharwal, H.S.; Denes, F.; Nielsen, L.; Young, R.A. Free-radical formation in jute from argon plasma treatment. J. Agric. Food Chem. 1993, 41, 2202–2207. [Google Scholar] [CrossRef]
- Wang, C.X.; Qiu, Y.P. Two sided modification of wool fabrics by atmospheric pressure plasma jet: Influence of processing parameters on plasma penetration. Surf. Coat. Technol. 2007, 201, 6273–6277. [Google Scholar] [CrossRef]
- Samanta, K.K.; Jassal, M.; Agrawal, A.K. Improvement in water and oil absorbency of textile substrate by atmospheric pressure cold plasma treatment. Surf. Coat. Technol. 2009, 203, 1336–1342. [Google Scholar] [CrossRef]
- Zille, A.; Oliveira, F.R.; Souto, A.P. Plasma treatment in textile industry. Plasma Process. Polym. 2015, 12, 98–131. [Google Scholar] [CrossRef] [Green Version]
- Lee, S.G.; Choi, S.-S.; Park, W.H.; Cho, D. Characterization of surface modified flax fibers and their biocomposites with PHB. Macromol. Symp. 2003, 197, 89–100. [Google Scholar] [CrossRef]
- Aguilar-Rios, A. Improving the bonding between henequen fibers and high density polyethylene using atmospheric pressure ethylene-plasma treatments. Express Polym. Lett. 2014, 8, 491–504. [Google Scholar] [CrossRef]
- Xu, X.; Wang, Y.; Zhang, X.; Jing, G.; Yu, D.; Wang, S. Effects on surface properties of natural bamboo fibers treated with atmospheric pressure argon plasma. Surf. Interface Anal. 2006, 38, 1211–1217. [Google Scholar] [CrossRef]
- Bozaci, E.; Sever, K.; Sarikanat, M.; Seki, Y.; Demir, A.; Ozdogan, E.; Tavman, I. Effects of the atmospheric plasma treatments on surface and mechanical properties of flax fiber and adhesion between fiber-matrix for composite materials. Compos. Part B Eng. 2013, 45, 565–572. [Google Scholar] [CrossRef]
- Johansson, L.-S.; Campbell, J.M.; Koljonen, K.; Stenius, P. Evaluation of surface lignin on cellulose fibers with XPS. Appl. Surf. Sci. 1999, 144–145, 92–95. [Google Scholar] [CrossRef]
- Yuan, X.; Jayaraman, K.; Bhattacharyya, D. Effects of plasma treatment in enhancing the performance of woodfibre-polypropylene composites. Compos. Part A Appl. Sci. Manuf. 2004, 35, 1363–1374. [Google Scholar] [CrossRef]
- Hua, Z.Q.; Sitaru, R.; Denes, F.; Young, R.A. Mechanisms of oxygen- and argon-RF-plasma-induced surface chemistry of cellulose. Plasmas Polym. 1997, 2, 199–224. [Google Scholar] [CrossRef]
- Johansson, K. Plasma modification of natural cellulosic fibres. In Plasma Technologies for Textiles; Shishoo, R., Ed.; Woodhead Publishing Limited: Cambridge, UK, 2007; pp. 247–281. [Google Scholar]
- Claramunt, J.; Ardanuy, M.; García-Hortal, J.A. Effect of drying and rewetting cycles on the structure and physicochemical characteristics of softwood fibres for reinforcement of cementitious composites. Carbohydr. Polym. 2010, 79, 200–205. [Google Scholar] [CrossRef]
- Wang, B.; Sharma-Shivappa, R.R.; Olson, J.W.; Khan, S.A. Production of polyhydroxybutyrate (PHB) by Alcaligenes latus using sugarbeet juice. Ind. Crops Prod. 2013, 43, 802–811. [Google Scholar] [CrossRef]
- Wang, C.; Chen, J.-R. Studies on surface graft polymerization of acrylic acid onto PTFE film by remote argon plasma initiation. Appl. Surf. Sci. 2007, 253, 4599–4606. [Google Scholar] [CrossRef]
- Morent, R.; De Geyter, N.; Verschuren, J.; De Clerck, K.; Kiekens, P.; Leys, C. Non-thermal plasma treatment of textiles. Surf. Coat. Technol. 2008, 202, 3427–3449. [Google Scholar] [CrossRef]
- Keller, A. Compounding and mechanical properties of biodegradable hemp fibre composites. Compos. Sci. Technol. 2003, 63, 1307–1316. [Google Scholar] [CrossRef]
- Relvas, C.; Castro, G.; Rana, S.; Fangueiro, R. Characterization of physical, mechanical and chemical properties of quiscal fibres: The influence of atmospheric DBD plasma treatment. Plasma Chem. Plasma Process. 2015, 35, 863–878. [Google Scholar] [CrossRef]
- Tserki, V.; Zafeiropoulos, N.E.; Simon, F.; Panayiotou, C. A study of the effect of acetylation and propionylation surface treatments on natural fibres. Compos. Part A Appl. Sci. Manuf. 2005, 36, 1110–1118. [Google Scholar] [CrossRef]
- Fang, L.; Catchmark, J.M. Structure characterization of native cellulose during dehydration and rehydration. Cellulose 2014, 21, 3951–3963. [Google Scholar] [CrossRef]
- Morshed, M.M.; Alam, M.M.; Daniels, S.M. Plasma treatment of natural jute fibre by RIE 80 plus plasma tool. Plasma Sci. Technol. 2010, 12, 325–329. [Google Scholar] [CrossRef]
- Jazbec, K.; Šala, M.; Mozetič, M.; Vesel, A.; Gorjanc, M. Functionalization of cellulose fibres with oxygen plasma and ZnO nanoparticles for achieving UV protective properties. J. Nanomater. 2015, 2015, 1–9. [Google Scholar] [CrossRef]
- Pivec, T.; Persin, Z.; Kolar, M.; Maver, T.; Dobaj, A.; Vesel, A.; Maver, U.; Stana-Kleinschek, K. Modification of cellulose non-woven substrates for preparation of modern wound dressings. Text. Res. J. 2014, 84, 96–112. [Google Scholar] [CrossRef]
- Ventura, H.; Ardanuy, M.; Capdevila, X.; Cano, F.; Tornero, J.A. Effects of needling parameters on some structural and physico-mechanical properties of needle-punched nonwovens. J. Text. Inst. 2014, 105, 1–11. [Google Scholar] [CrossRef]
- Standard Test Method for Water Retention of Textile Fibers (Centrifugue Procedure); Standard ASTM D 2402-1; ASTM International: West Conshohocken, PA, USA, 2001.
- Testing of Pulp, Determination of the Dry Weight of Baled Pulp, Determination by Means of Testing Single Bales; Standard DIN 54351:1977-11; Beuth Verlag: Berlin, Germany, 1977.
- Segal, L.; Creely, J.J.; Martin, A.E.; Conrad, C.M. An empirical method for estimating the degree of crystallinity of native cellulose using the X-ray diffractometer. Text. Res. J. 1959, 29, 786–794. [Google Scholar] [CrossRef]
- Textiles. Tensile Properties of Fabrics. Part 1: Determination of Maximum Force and Elongation at Maximum Force using the Strip Method; Standard UNE-EN ISO 13934-1:1999; AENOR: Madrid, Spain, 1999.
© 2016 by the authors; licensee MDPI, Basel, Switzerland. This article is an open access article distributed under the terms and conditions of the Creative Commons by Attribution (CC-BY) license (http://creativecommons.org/licenses/by/4.0/).
Share and Cite
Ventura, H.; Claramunt, J.; Navarro, A.; Rodriguez-Perez, M.A.; Ardanuy, M. Effects of Wet/Dry-Cycling and Plasma Treatments on the Properties of Flax Nonwovens Intended for Composite Reinforcing. Materials 2016, 9, 93. https://0-doi-org.brum.beds.ac.uk/10.3390/ma9020093
Ventura H, Claramunt J, Navarro A, Rodriguez-Perez MA, Ardanuy M. Effects of Wet/Dry-Cycling and Plasma Treatments on the Properties of Flax Nonwovens Intended for Composite Reinforcing. Materials. 2016; 9(2):93. https://0-doi-org.brum.beds.ac.uk/10.3390/ma9020093
Chicago/Turabian StyleVentura, Heura, Josep Claramunt, Antonio Navarro, Miguel A. Rodriguez-Perez, and Mònica Ardanuy. 2016. "Effects of Wet/Dry-Cycling and Plasma Treatments on the Properties of Flax Nonwovens Intended for Composite Reinforcing" Materials 9, no. 2: 93. https://0-doi-org.brum.beds.ac.uk/10.3390/ma9020093