Article

Investigation of Pozzolanic Reaction in Nanosilica-Cement Blended Pastes Based on Solid-State Kinetic Models and 29Si MAS NMR

1
New Transportation Research Center, Korea Railroad Research Institute (KRRI), Uiwang-si, Gyeonggi-do 16105, Korea
2
Department of Civil Engineering, University of New Mexico, Albuquerque, NM 87131, USA
3
Infra Structure Team, Technical Division, GS E&C, Seoul 110-130, Korea
4
Department of Civil Engineering, Kyunganm University, Changwon-si 631-701, Korea
*
Author to whom correspondence should be addressed.
These authors contributed equally to this work.
Submission received: 5 October 2015 / Accepted: 21 January 2016 / Published: 6 February 2016
(This article belongs to the Special Issue Utilisation of By-Product Materials in Concrete)

Abstract

:
The incorporation of pozzolanic materials in concrete has many beneficial effects to enhance the mechanical properties of concrete. The calcium silicate hydrates in cement matrix of concrete increase by pozzolanic reaction of silicates and calcium hydroxide. The fine pozzolanic particles fill spaces between clinker grains, thereby resulting in a denser cement matrix and interfacial transition zone between cement matrix and aggregates; this lowers the permeability and increases the compressive strength of concrete. In this study, Ordinary Portland Cement (OPC) was mixed with 1% and 3% nanosilica by weight to produce cement pastes with water to binder ratio (w/b) of 0.45. The specimens were cured for 7 days. 29Si nuclear magnetic resonance (NMR) experiments are conducted and conversion fraction of nanosilica is extracted. The results are compared with a solid-state kinetic model. It seems that pozzolanic reaction of nanosilica depends on the concentration of calcium hydroxide.

1. Introduction

For the last two decades, material characterization techniques for cement hydration analysis have made significant progress. For example, magic angle spinning (MAS) nuclear magnetic resonance (NMR), thermal gravimetric analysis (TGA), Fourier transform infrared spectroscopy (FTIR), transmission electron microscope (TEM), and nanoindentation have been extensively used to explain the kinetics of cement hydration and to analyze hardened cement microstructure [1,2,3,4]. Integration of these tools can also provide good insight on some microstructural features of hardened cement paste [5,6]. These tools enable further illustration of the long-debated morphology of calcium-silicate-hydrate (C–S–H) gel and the role of water molecules in controlling the mechanical behavior and fluid transport in cement and concrete [7,8,9]. For example, NMR spectra and TEM images confirm the fact that the silicate chain in C–S–H gel is formed by omitting the bridging tetrahedra [2]. C–S–H is the major hydration product of Portland cement and represents the “glue” material in cement that is responsible for strength, fracture, and dimensional stability of hydrated cement [10,11].
Ordinary Portland cement (OPC) clinker includes C3S, C2S, C3A, and C4AF for the corresponding chemical composition of 3CaO·SiO2, 2CaO·SiO2, 3CaO·Al2O3, and 4CaO·Al2O3·Fe2O3, respectively. Hydrated OPC components include C–S–H and calcium-hydroxide (CH).
It has been established by numerous investigations that concrete properties can be improved by using nanoparticles [12,13,14,15,16]. Nanoparticles such as TiO2, ZnO2, fullerenes, carbon nanotubes, silica, alumina, and clays have been examined to improve the strength, stiffness, and ductility characteristics of cementitious materials [17,18]. Some of the nanoparticles were shown to blend with the cement during hydration and create nucleates that enabled further growth of C–S–H [19,20]. The effect of nanosilica on the reduction of calcium leaching in cement were also reported [21,22]. Nanosilica has been investigated by many researchers and has been shown to significantly improve the strength and durability of concrete [13], to soften concrete behavior at relatively high content [23], and to improve the physical properties of oil-well cement was also investigated [24]. Research has shown that the very high surface area of nanoparticles plays a significant role in this process. Other uses for nanoparticles, such as Fe2O3 and carbon nanotubes as sensors inside the cement matrix and TiO2 for self-cleaning concrete, have also been reported [13,25].
In this study, we investigate conversion fraction of nanosilica for hardened OPC mixed with nanosilica and cured for 7 days. Type II OPC pastes with water to binder ratio (w/b) of 0.45 were prepared and compared with those incorporating 1% and 3% nanosilica by weight of OPC. The microstructural characteristics of the hardened OPC pastes were investigated by using 29Si MAS NMR.

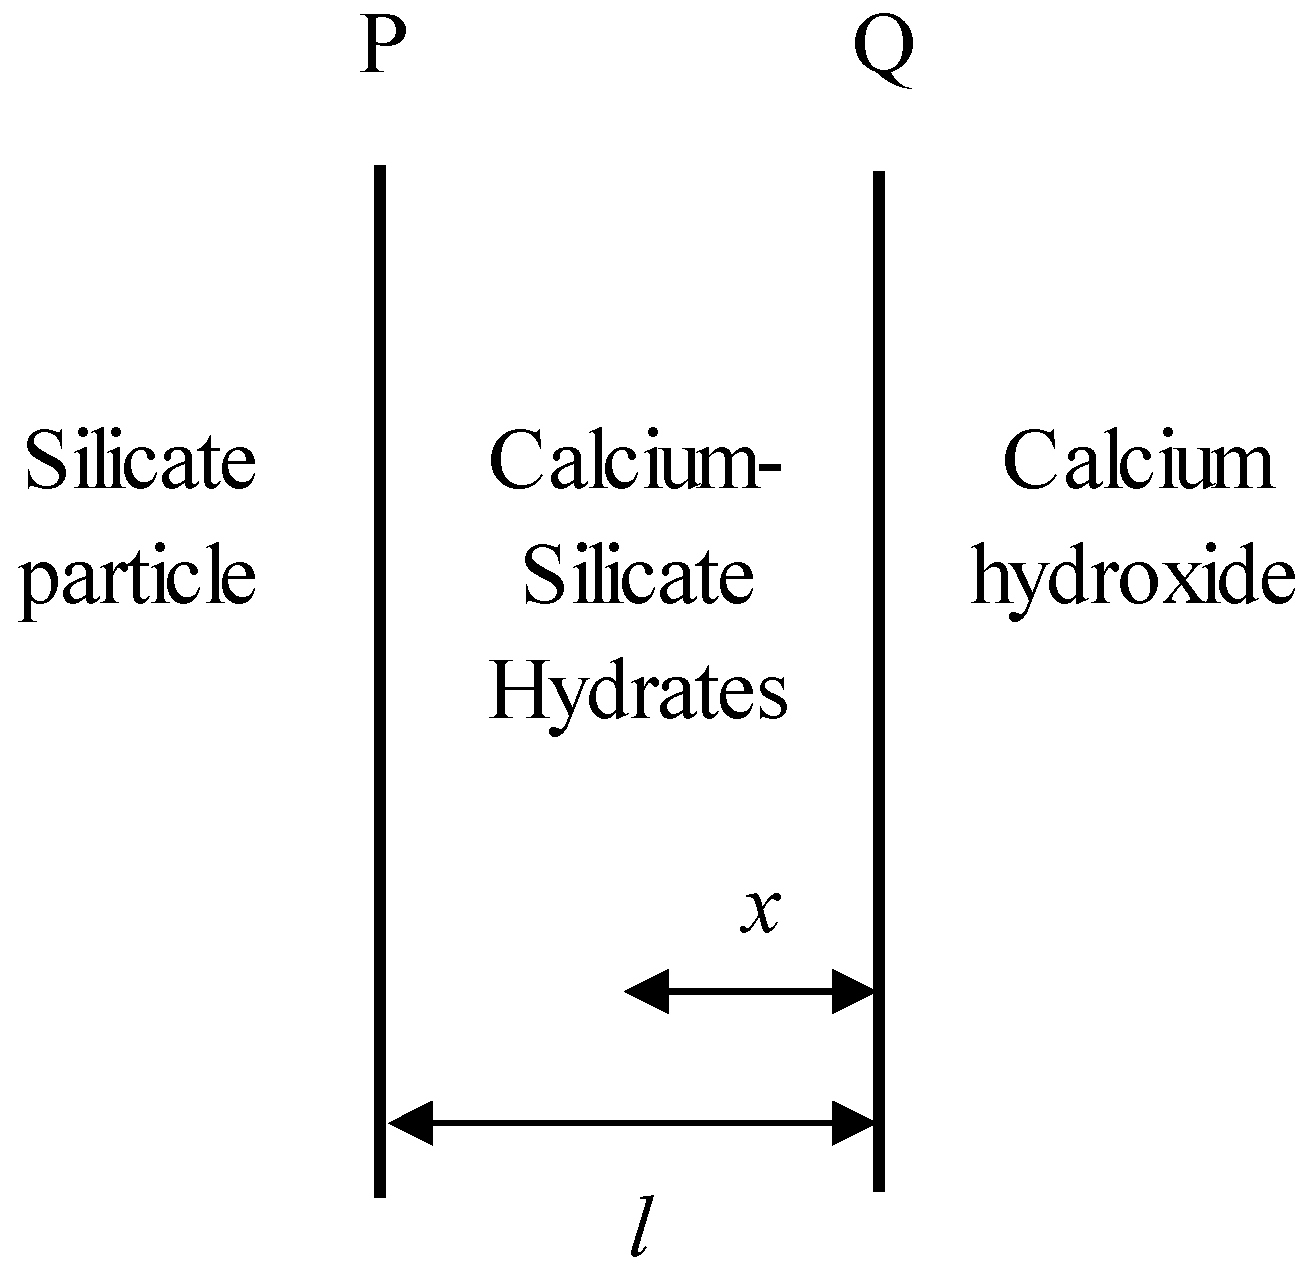
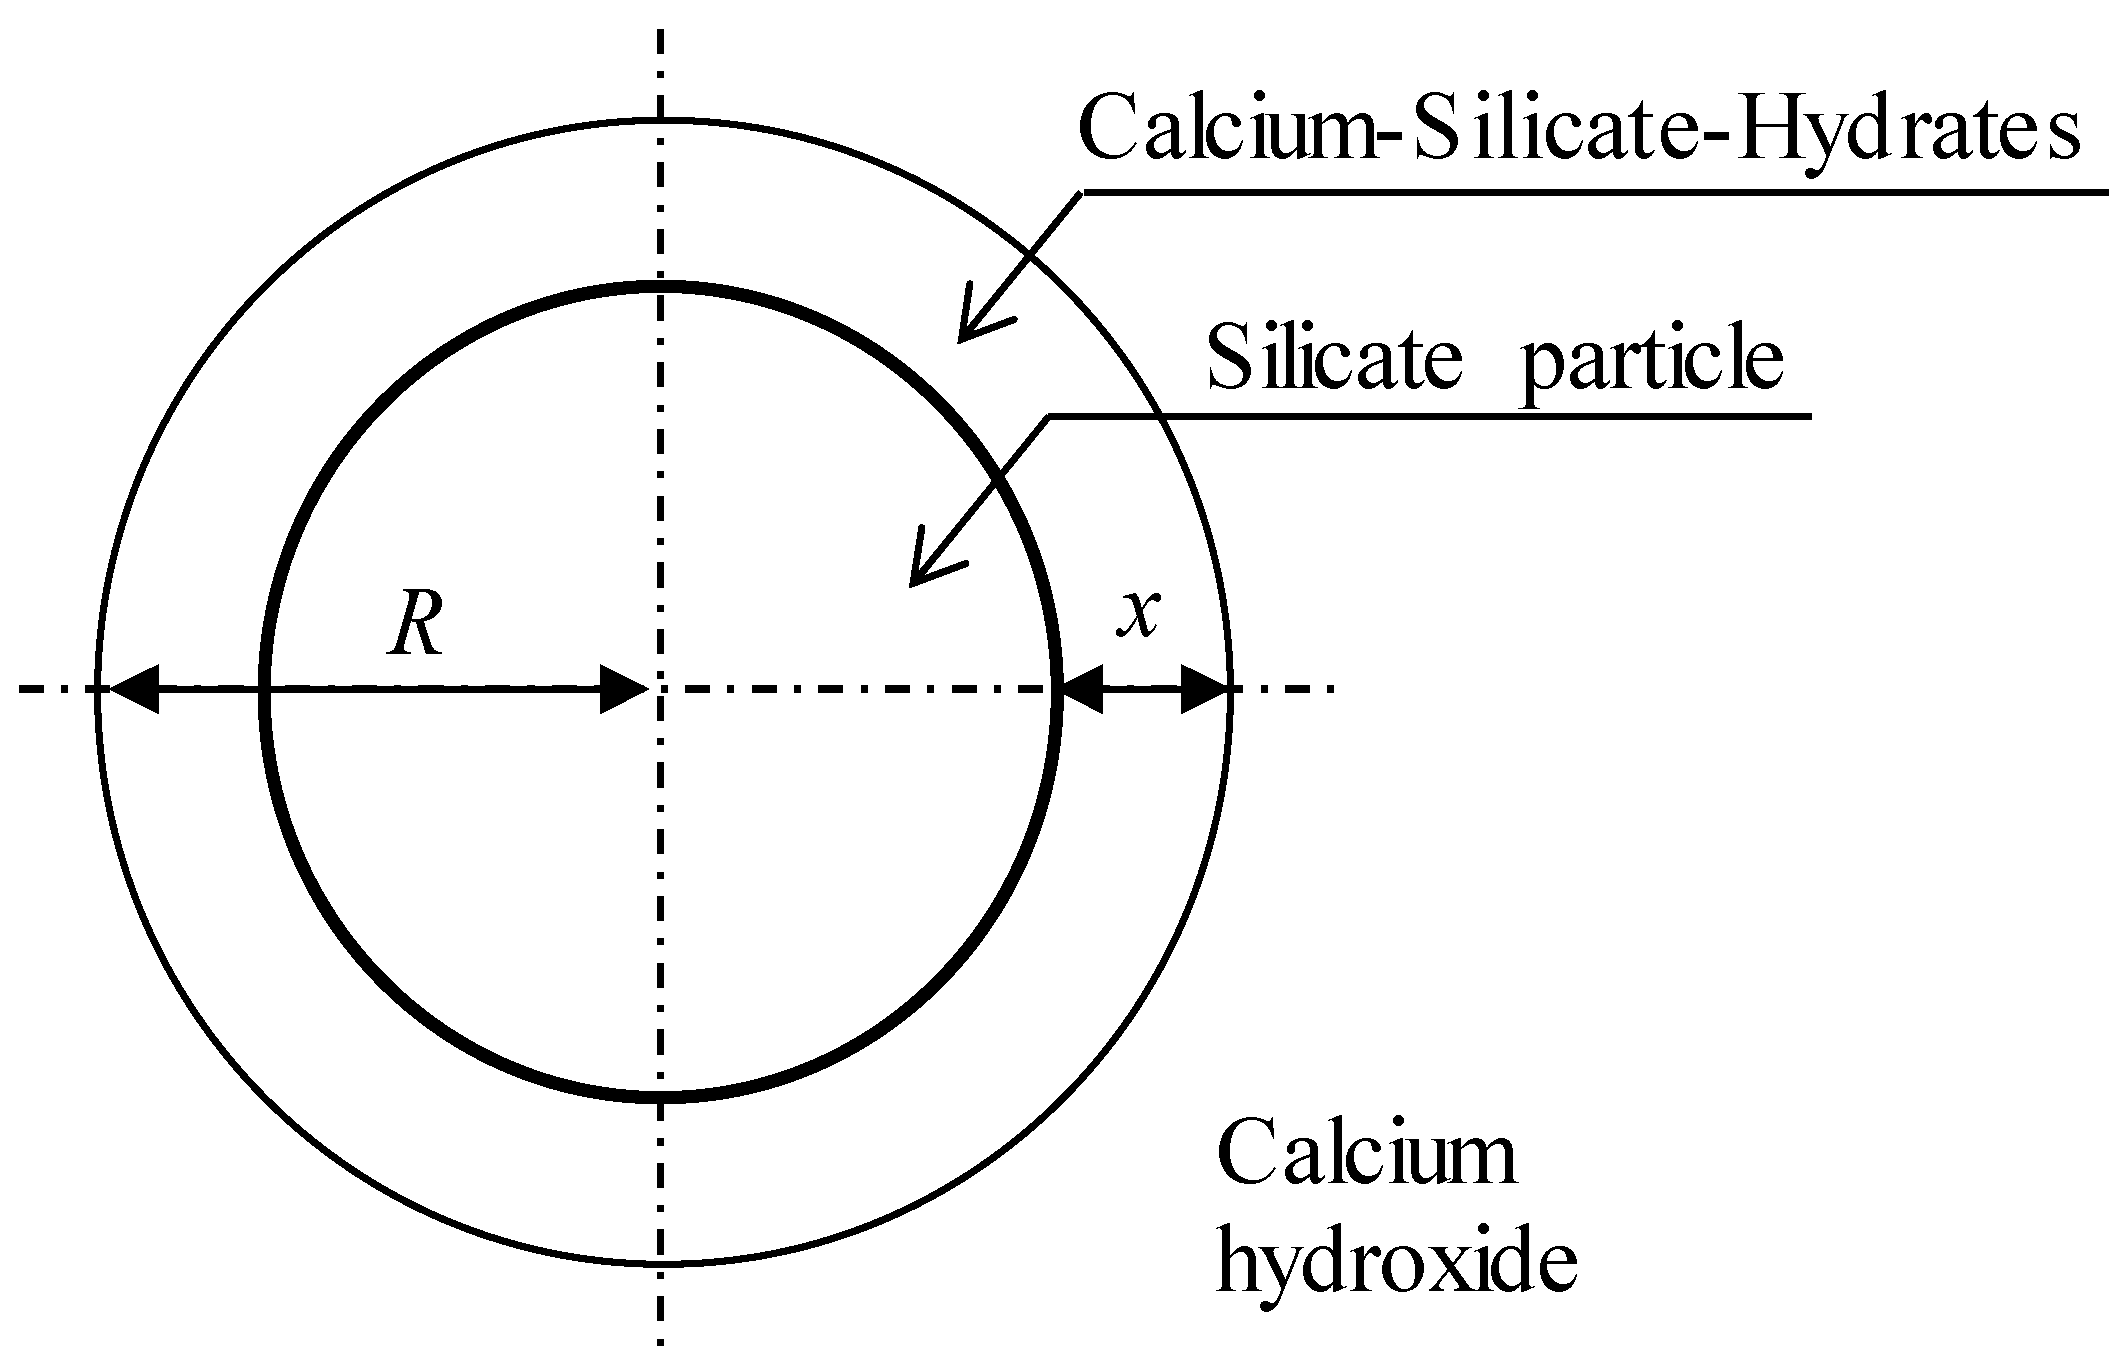
2. Solid-State Kinetic Models

The conversion fraction of silicate particles reacted in silicate blended cement pastes has been simulated using Jander’s model [26], as shown in Equation (1),
R 2 ( 1 ( 1 α p ) 1 / 3 ) 2 = k D t
where R is the radius of a silicate particle. αp is the conversion fraction at time t. The relative diffusion coefficient of kD is calculated as
k D = 2 D ( m C S H m C H ) ( C w ρ C S H )
where D is the diffusion coefficient. mCSH and mCH are the molecular weights of C–S–H and CH, respectively. Cw is the concentration of CH at interface P as shown in Figure 1. ρCSH is the density of C–S–H.
As Jander’s model is oversimplified from the simplest rate equation of the parabolic law [27], where αp is proportional to the thickness of product l for an infinite flat plane diffusion model, it is only effective for low conversion values (i.e., low x/R values) [28]. Therefore, for the conversion fraction of nanosilica particles, the use of Jander’s model might not be appropriate, as it is known that nanosilica has high conversion fraction values [29].
Figure 1. Schematic representation of one-dimensional diffusion through a flat plane.
Materials 09 00099 g001
The conversion fraction of nanosilica particles might be calculated more effectively using the Ginstling–Broushtein model [28] as the model to consider the steady-state solution of Fick’s first law for radial diffusion in a sphere [30].
Considering a spherical particle shape for nanosilica as shown in Figure 2, the conversion fraction of nanosilica particle is shown in Equation (3),
R 2 ( 1 2 3 α p ( 1 α p ) 2 / 3 ) = k D t
where,
k D = 2 D ( m C S H n ) ( C m ρ C S H )
where n is the stoichiometric coefficient of the reaction and it is 1.0 for pozzolanic reaction of nanosilica and CH. Cm is the concentration of CH at the original particle surface, as shown in Figure 2. It is noticeable that the unit for the concentration Cw in Equation (2) and and Cm in Equation (4) is kg/m3 and mol/m3, respectively.
Figure 2. Schematic representation of radial diffusion in a sphere.
Materials 09 00099 g002

3. Experiments

3.1. Materials

The compositions of Type II OPC are presented in Table 1. A water to binder ratio (w/b) of 0.45 was used for all specimens, incorporating nanosilica or not. The nanosilica used was AEROSIL® 380, which has an average BET surface area of 380 m2/g and an average particle diameter of 7 nm. For 1% and 3% nanosilica specimens, 1% and 3% weights of cements are substituted by nanosilica. The procedures for mixing the hydraulic cement pastes followed the ASTM standards [31]. For 29Si MAS NMR of the hardened OPC pastes, a cylinder, ϕ 10 mm × 10 mm height, was prepared for each type of mixture. The specimens were molded in a tube for a day and then cured in water for 7 days of aging. Specimens were cured under tap water with a controlled temperature of 20 °C for ambient curing condition.
Table 1. Type II OPC compositions.
Compositionw/w (%)
C3S51.0
C2S24.0
C3A6.0
C4AF11.0
It is noticeable that although a special technique to disperse nanosilica was not necessary to make ϕ 10 mm × 10 mm specimens for this study, it might be required for the practical use of nanosilica to have higher pozzolanic reactivity than the use of other silica-rich products, such as silica fume or fly ash.

3.2. 29Si MAS NMR

Over the years, nuclear magnetic resonance (NMR) has been proven to be an efficient methodology to examine chemical bonds in different materials. For solid-state NMR, the magic angle spinning (MAS) method is applied in order to avoid large peak broadenings caused by several nuclear interactions. This is conducted by spinning the sample at frequencies of 1–35 kHz around an axis-oriented 54.7° to the magnetic field [32]. NMR has helped in identifying the nanostructure of silicate composites. 29Si NMR has been used to examine the polymerization of a silicate tetrahedron in synthetic C–S–H [33,34]. Silicate polymerization represents the number of bonds generated by the silicate tetrahedron. A silicate tetrahedron having the number of n shared oxygen atoms is expressed as Qn where n is the number of shared oxygen atoms, up to 4. The intensity of the silicate Q connections in hydrated cement can be investigated using 29Si MAS NMR. Q0 is typically observed in hydrated cement due to the remaining tricalcium silicate (C3S) and dicalcium silicate (C2S), while Q1, Q2, and Q3 are typically detected in silicate due to the layered structure of C–S–H, as shown in Figure 3. Q4 is the polymerization of quartz and can be observed in silica-rich products such as fly ash, silica fume, and nanosilica.
Figure 3. Silicate connections detected from the analysis of 29Si magic angle spinning nuclear magnetic resonance (MAS NMR) spectra.
Materials 09 00099 g003
Due to “the next nearest neighbor” of a silicate tetrahedron, the chemical shifts for silicate have significant variations [34,35,36]. Such variation necessitates performing statistical deconvolution analysis of the 29Si MAS NMR spectra to identify the different chemical shift peaks representing silica polymerization type Q0 to Q4, and their corresponding intensity representing their existing fraction in C–S–H. From the calculated intensity of Qns, the average degree of C–S–H connectivity Dc is calculated [37] as:
D c = Q 1 + 2 Q 2 + 3 Q 3 Q 1 + Q 2 + Q 3
A high value of Dc represents high polymerization of C–S–H. From the extensive studies of the structure of C–S–H by 29Si MAS NMR, it is suggested that the polymerization of C–S–H depends on its compositional calcium-silicate (C/S) ratio and the humidity in the interlayer water [38,39]. Furthermore, the degree of hydration hc of a hydrated OPC paste is defined as the weighted average of the degree of reactivity of the four major OPC components of C3S, C2S, C3A, and C4AF [11]. The C–S–H chain length is also calculated as:
l = 2 ( 1 + Q 2 Q 1 )
Considering that Q1 and Q2 represent the end-chain and the intermediate silicates, respectively, an l of 3 is the C–S–H silicate chain having three silicate connections. If the value of l is more than 3, it represents a longer chain than the C–S–H silicate chain having three silicate connections, as schematically shown in Figure 4.
Figure 4. Schematic representation of silicate polymerization.
Materials 09 00099 g004
In this study, the 29Si chemical shifts are respectively referenced relative to tetramethylsilane Si(CH3)4 (TMS) at 0 ppm, using Si[(CH3)3]8Si8O20 (Q8M8) as a secondary reference (the major peak being at 11.6 ppm relative to TMS).

4. Results and Discussion

4.1. Full Reaction Time

Full reaction time when a silicate particle is fully reacted can be examined. The time to complete pozzolanic reaction is calculated with the reference value of kD. Considering the value of kD as 1.269 × 10⁻¹⁷ m2/s [40], the full reaction time to complete the reaction is calculated as 760 to 2280 days with respect to kinetic models for silica fume particles having a diameter of 100 μm, as shown in Figure 5a. However, the full reaction time of nanosilica particles having a diameter of 100 nm is calculated as 66 to 197 s with respect to kinetic models as shown in Figure 5b.
Figure 5. Full reaction time of silicate particles according to particle diameters ranging to (a) 120 μm and (b) 120 nm, JD model and GB model represent Jander’s model in Equation (1) and Ginstling-Broushtein model in Equation (3) respectively.
Materials 09 00099 g005

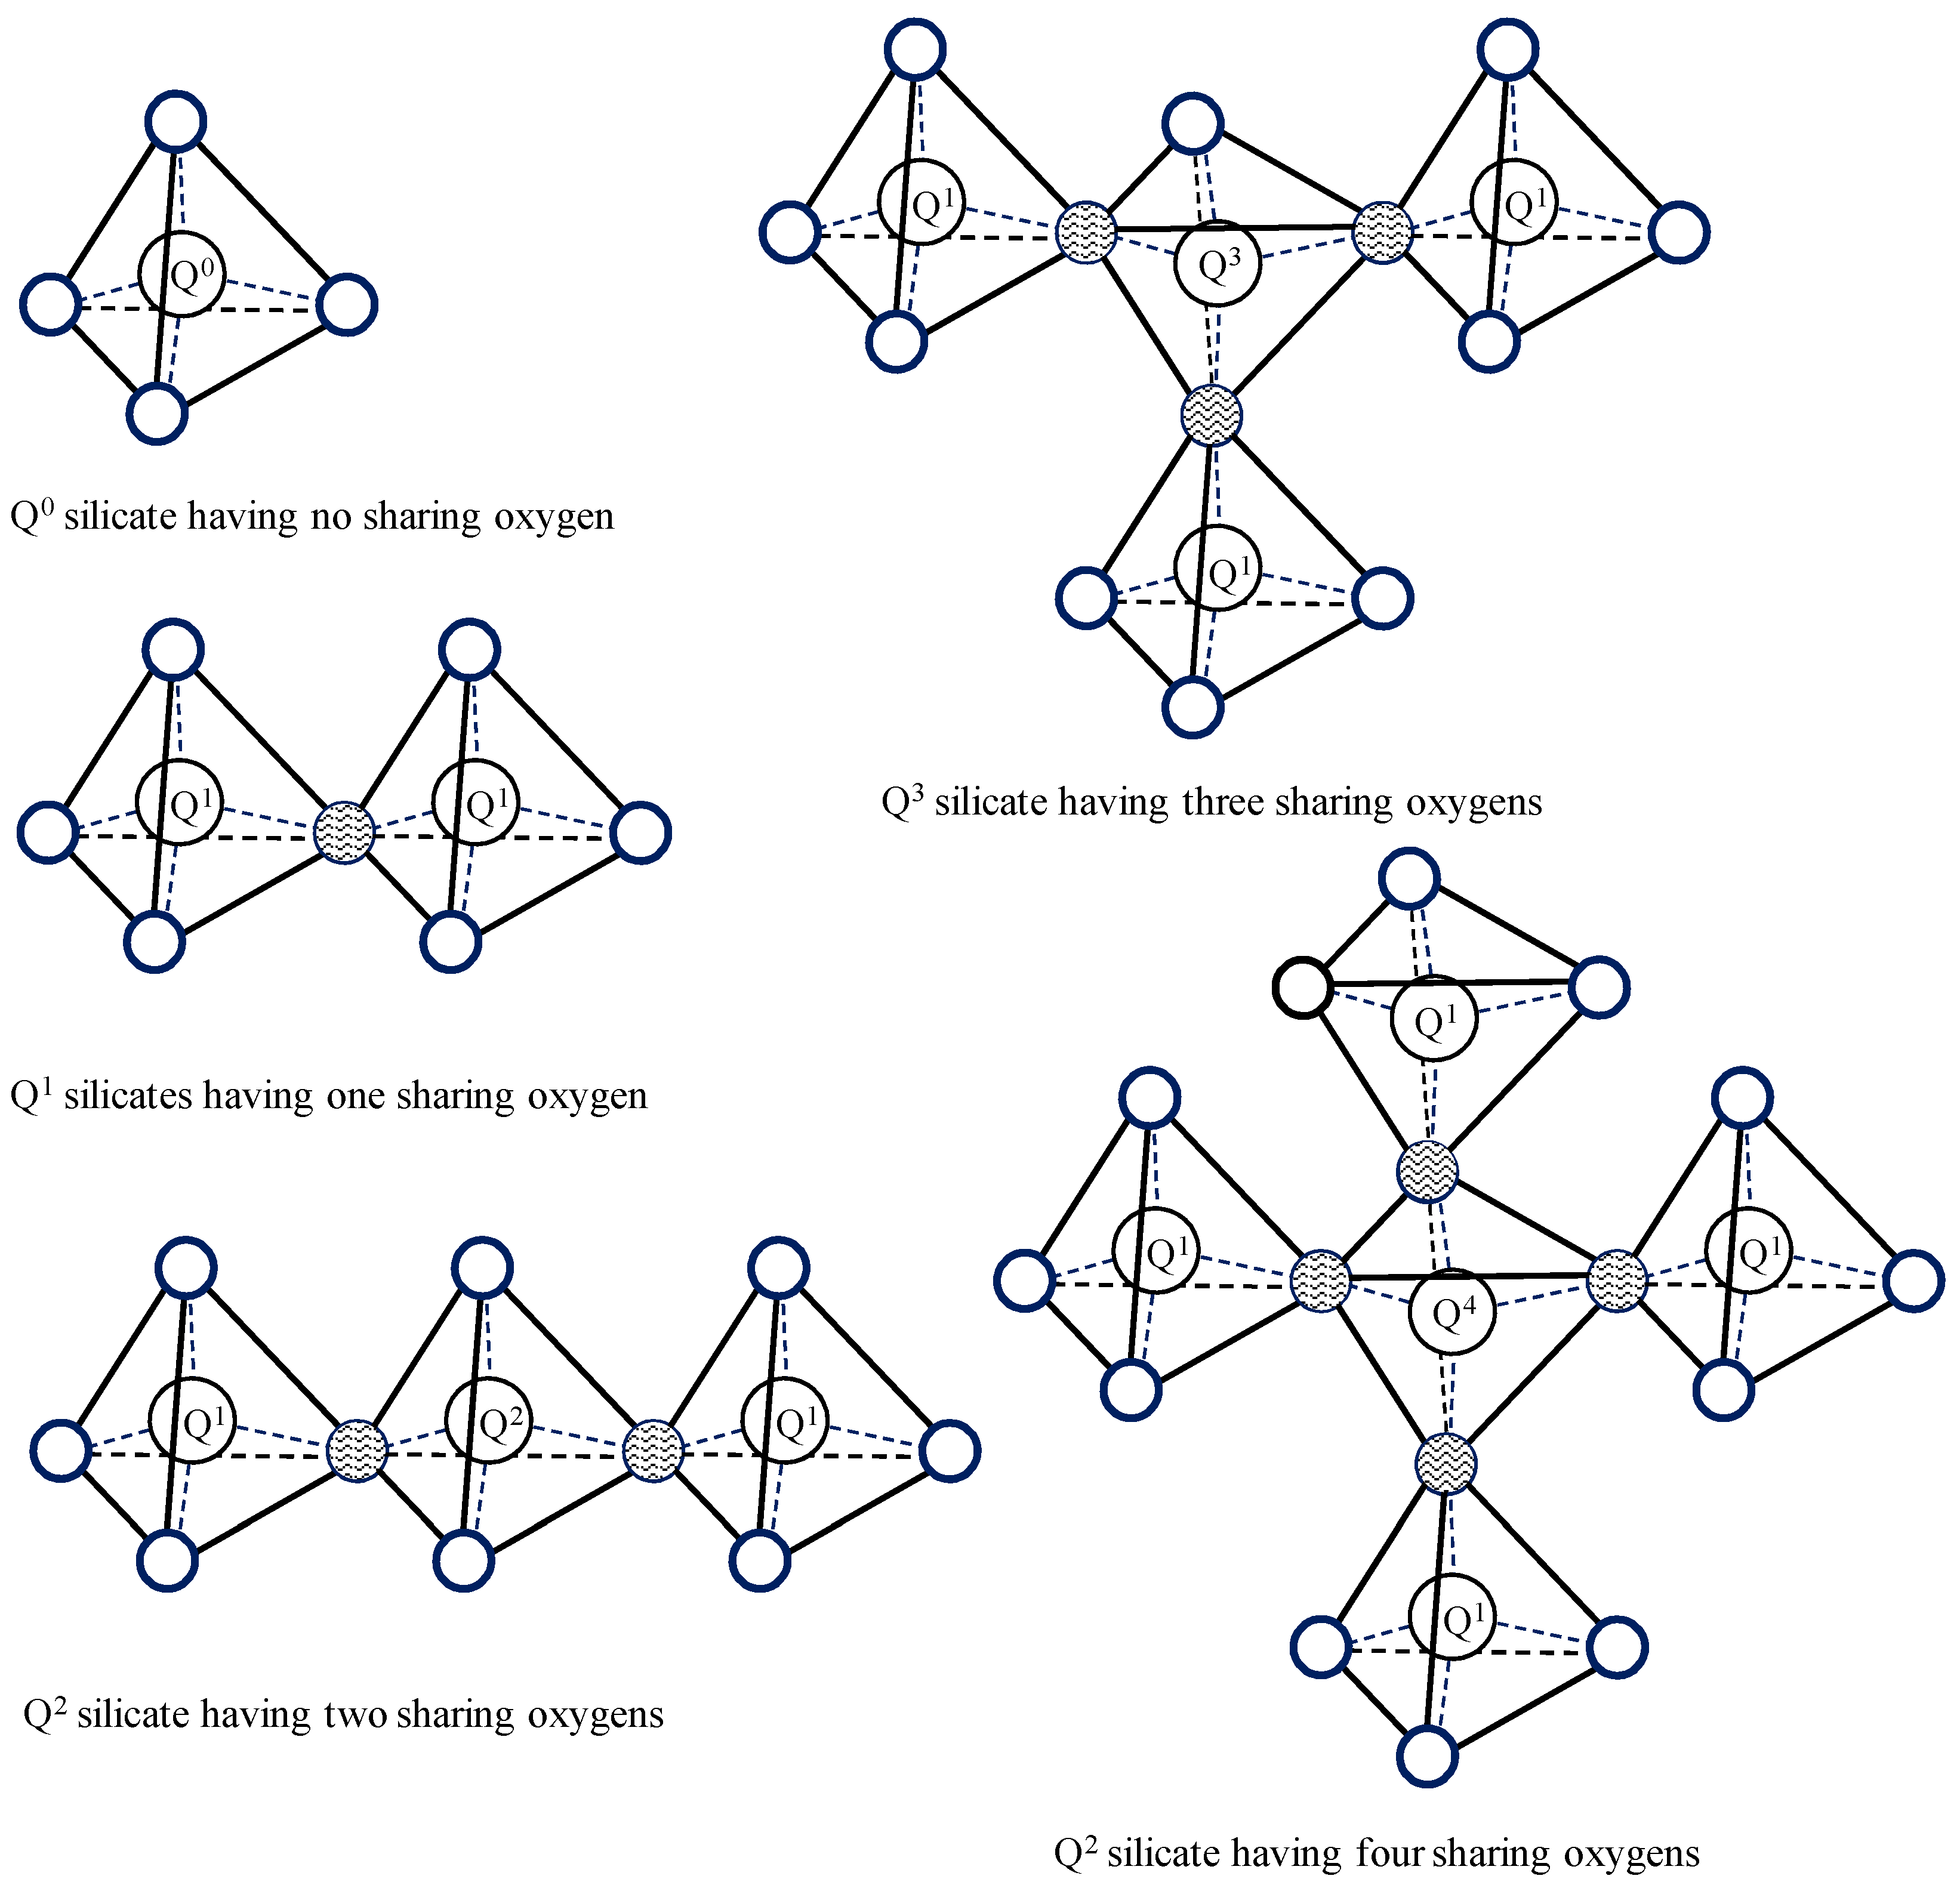
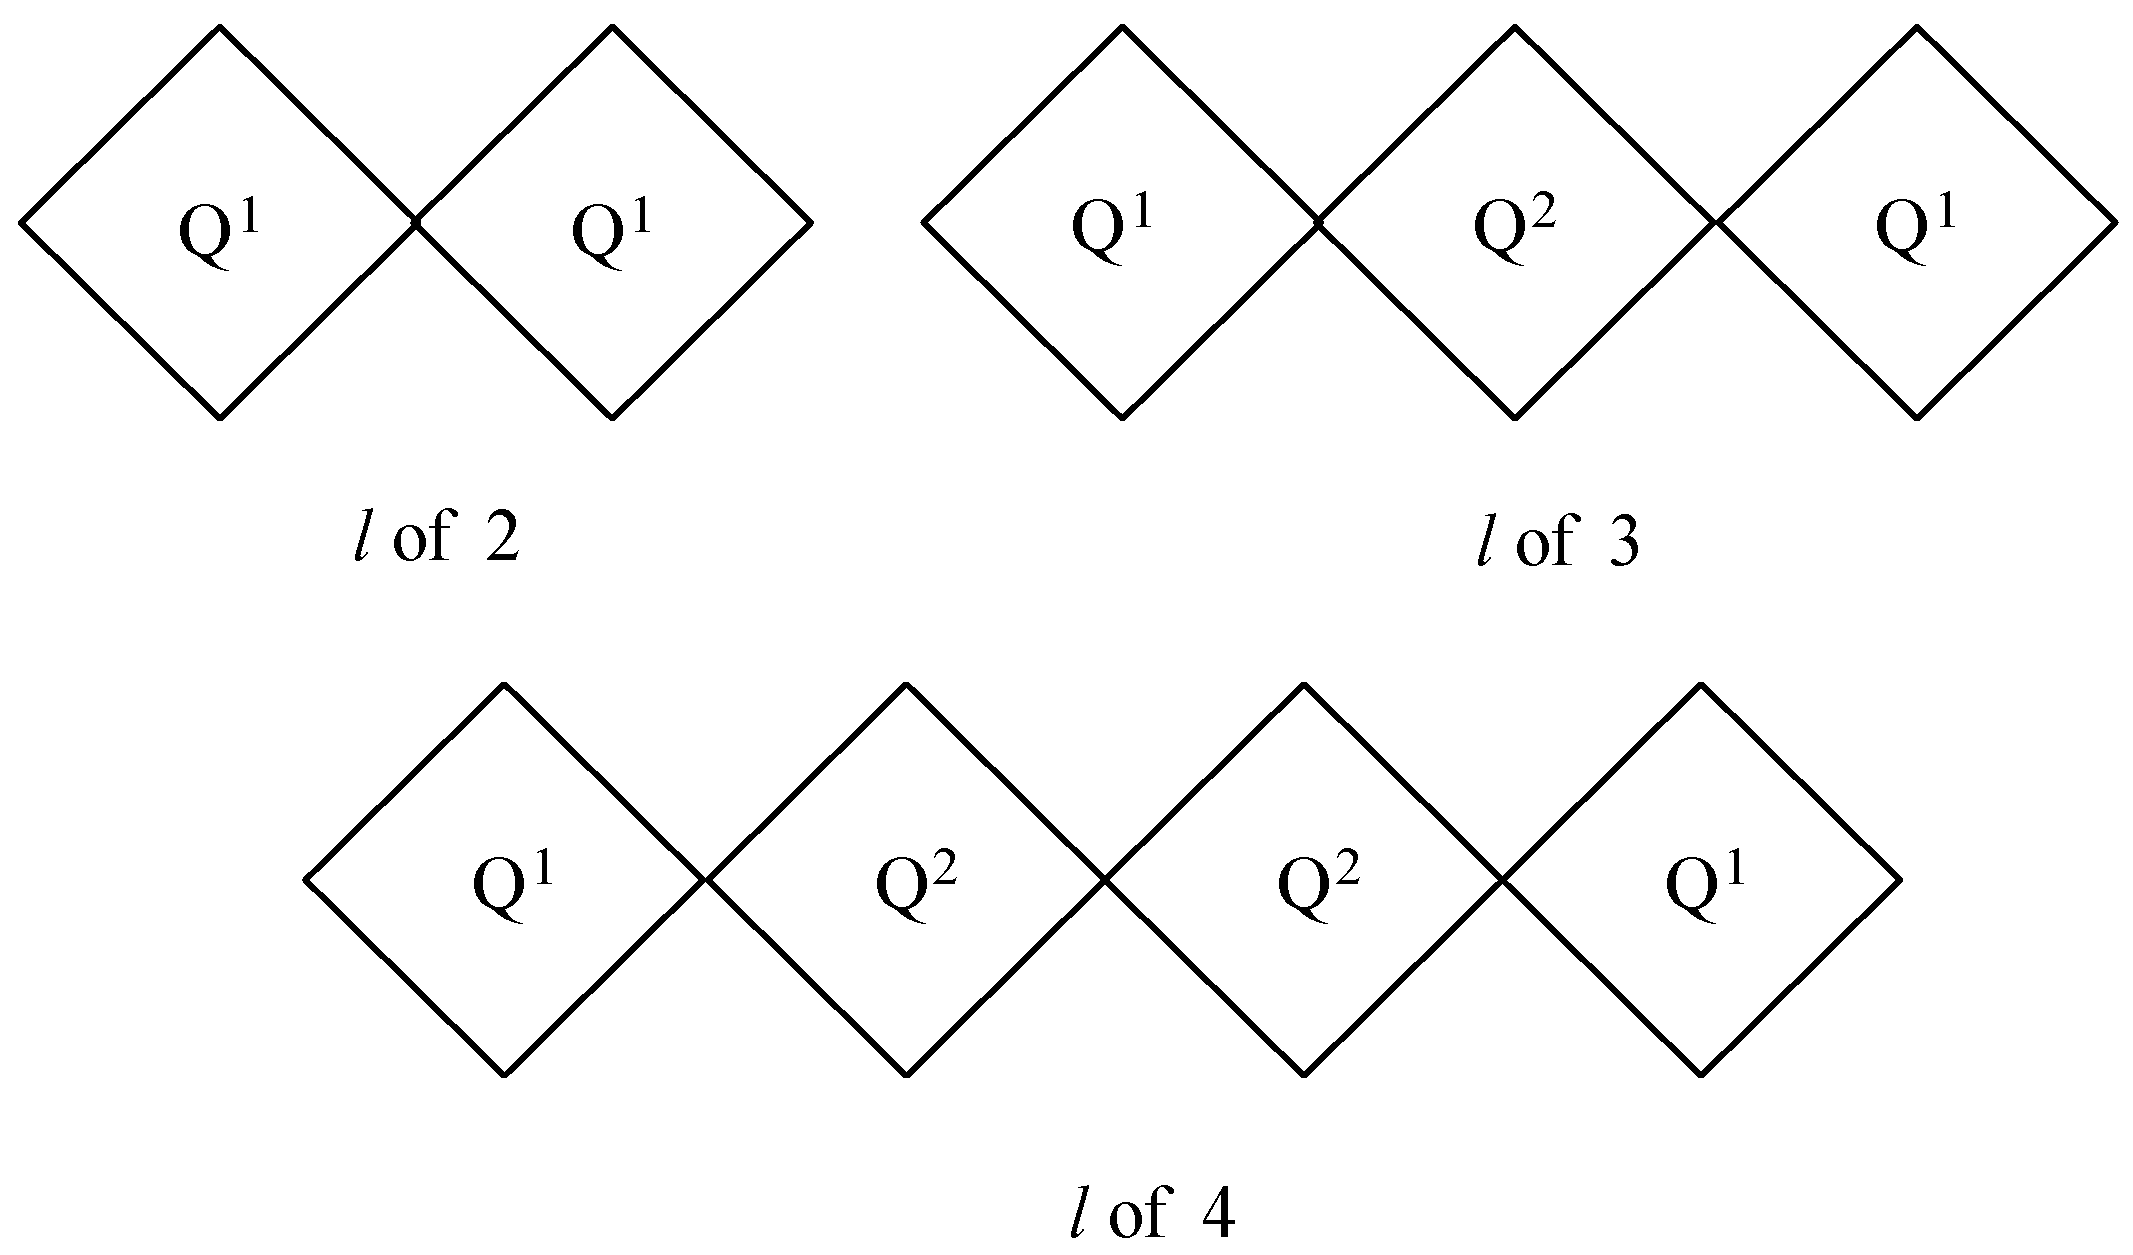
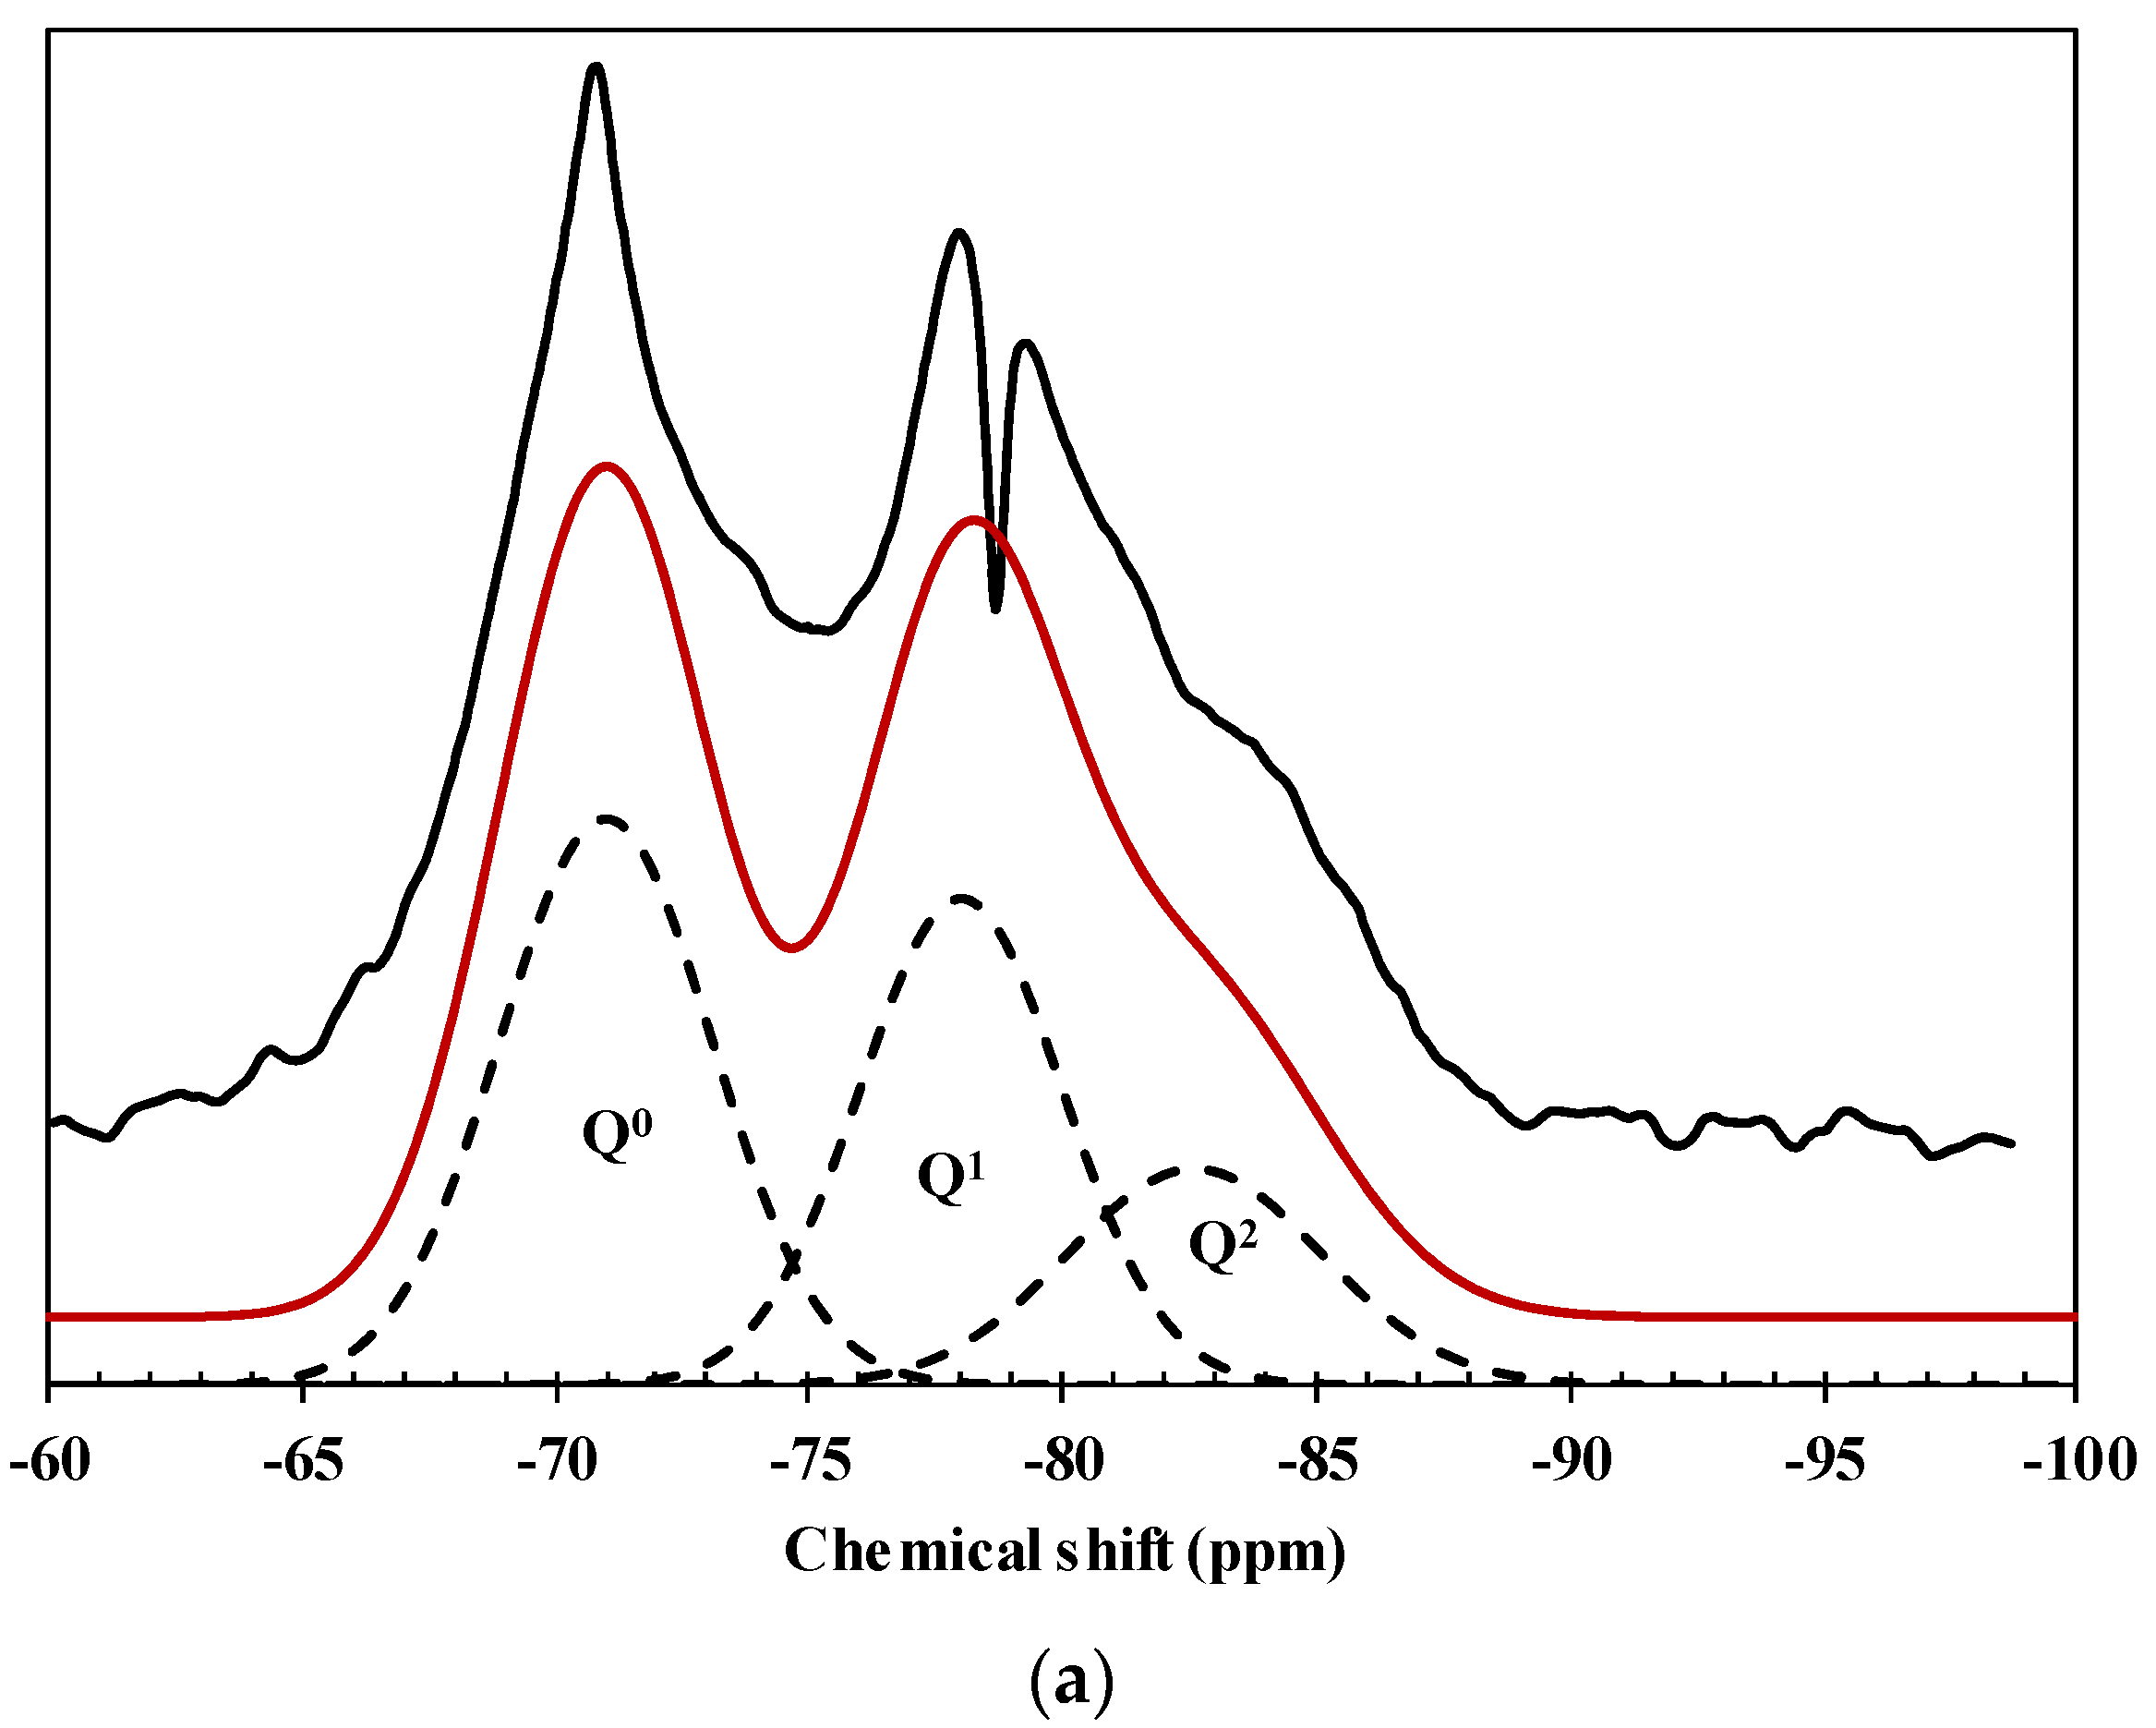
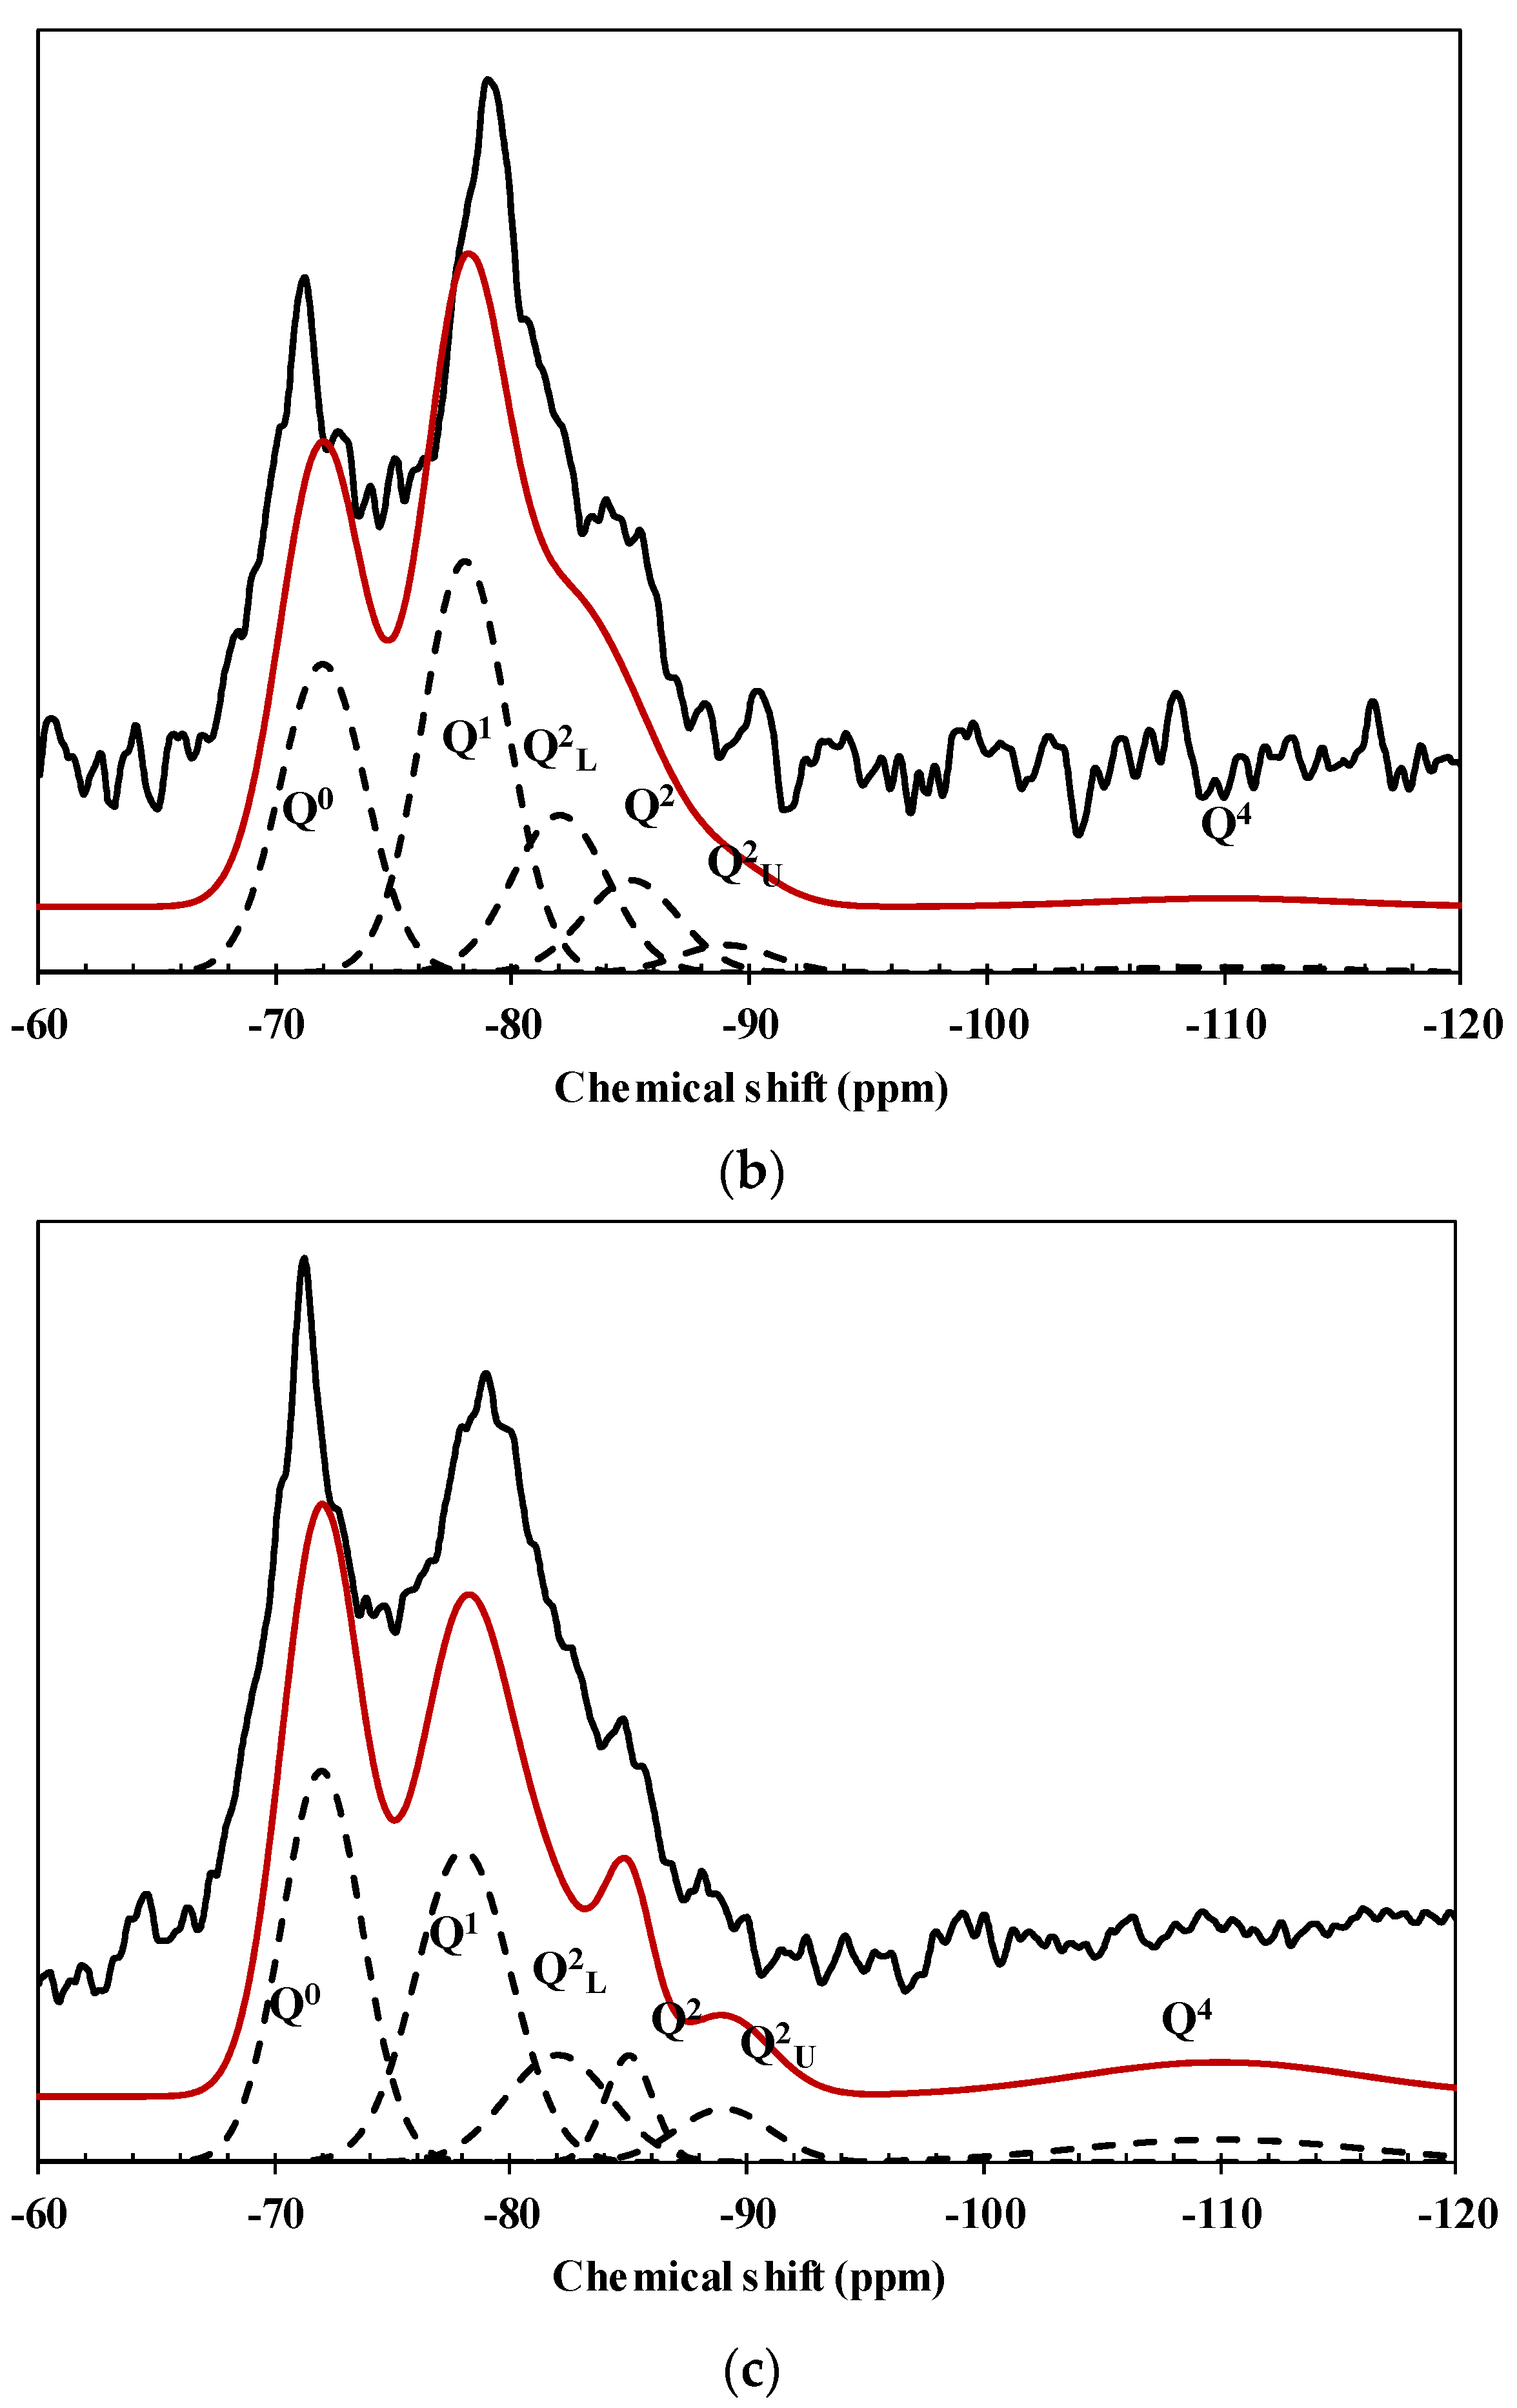
4.2. The Conversion Fraction from 29Si MAS NMR Results

The resulted MAS NMR for hardened cement pastes containing no nanosilica, 1% nanosilica, and 3% nanosilica are shown in Figure 6. The NMR spectra were deconvoluted and the corresponding Qn intensities were presented in Table 2 with the average degree of C–S–H connectivity Dc in Equation (5) and the C–S–H chain length l in Equation (6). It is noticeable that although some types of nanoparticles show the resonance of Q3 due to the isolated silanol groups and Si–O–Si bond in nanoparticles [41], Q3 was not shown for the nanosilica powder used in this study. The highest degree of polymerization of 1.43 and a chain length of 3.50 were observed with hardened cement paste incorporating 1% nanosilica. Similar chain length for the synthetic C–S–H without nanoparticles and the tendency to increase chain length was also shown by adding nanoparticles [41].
Table 2. NMR results and silicate polymerization. Dc : Average degree of C–S–H connectivity; l: C–S–H chain length.
SpeciemnsQ0 (%)Q1 (%)Q2 (%)Q3 (%)Q4 (%)Dcl
No nanosilica44.036.020.01.363.11
1% nanosilica29.639.429.51.51.433.50
3% nanosilica35.533.224.07.31.423.44
The conversion fraction of nanosilica can be estimated from the de-convoluted intensities of Qns. We start by evaluating the total number of silicate tetrahedrons, ΣQ, calculated as
Σ Q = b 0 [ ( 1 p S ) ( p C 3 S ψ C 3 S + p C 2 S ψ C 2 S ) + p S ψ S ] N A
where NA is the Avogadro constant. ψC3S, ψC2S, and ψS are the molecular weights of C3S, C2S, and S, which are 0.228 kg/mol, 0.172 kg/mol, and 0.06 kg/mol, respectively [11]. p is the weight fraction of the subscribed components in the OPC and nanosilica binder. b0 is the initial weight of the binder (in grams) in 1 g of paste calculated as:
b 0 = 1 1 + w / b 0
where w/b0 is the initial water to binder ratio of OPC paste incorporated to nanosilica. The conversion fraction of nanosilica αS, which can be estimated by considering Q4 intensity observations from the de-convoluted NMR spectra as:
α S = 1 Q 4 Σ Q Σ Q 4 , S
where ΣQ4,S is the number of silicate tetrahedron in nanosilica as:
Σ Q 4 , S = b 0 ( p S ψ S ) N A
The calculation procedure of the conversion fractions αS for hardened cement paste specimens incorporating 1% and 3% nanosilica are presented in Table 3. The conversion fraction of hardened cement paste incorporating 1% nanosilica, 66.2%, is higher than that of hardened cement paste incorporating 3% nanosilica, 41.2%.
Figure 6. NMR spectra of (a) 0; (b) 1%; and (c) 3% nanosilica (black, red, and dotted lines as spectrum from NMR experiments, total spectrum by summing all Q spectra, and each Q spectrum, respectively).
Materials 09 00099 g006aMaterials 09 00099 g006b
Table 3. The procedure to calculate conversion fraction of nanosilica.
Equation1% Nanosilica3% Nanosilica
Equation (7) Σ Q = b 0 [ ( 0.99 ) ( 0.51 0.228 + 0.24 0.172 ) + 0.01 0.06 ] N A = 3.763 b 0 N A Σ Q = b 0 [ ( 0.97 ) ( 0.51 0.228 + 0.24 0.172 ) + 0.03 0.06 ] N A = 4.023 b 0 N A
Equation (10) Σ Q 4 , S = b 0 ( 0.01 0.06 ) N A = 0.167 b 0 N A Σ Q 4 , S = b 0 ( 0.03 0.06 ) N A = 0.5 b 0 N A
Equation (9) Q 4 = 1.5 % Q 4 = 7.3 %
α S = 1 ( 0.015 ) 3.763 b 0 N A 0.167 b 0 N A = 0.662 α S = 1 ( 0.073 ) 4.023 b 0 N A 0.5 b 0 N A = 0.412
α S = 66.2 % α S = 41.2 %

4.3. The Effect of CH Concentration

While the full reaction time for nanosilica having a diameter of 7 nm is in a second as shown in Figure 5b, the conversion fractions of nanosilica for hardened cement paste incorporating 1% and 3% nanosilica were shown as 66.2% and 41.2%, respectively, for 7 days of curing time from NMR experiments. By considering the solid-state kinetic models in Equations (1) and (3), the calculated conversion fractions from NMR indicate that the reaction of nanosilica depends on not only its particle size R, but also the concentration of calcium hydroxide (CH) around the particles Cw and Cm in Equations (2) and (4). If there is enough concentration of CH around nanosilica particles, nanosilica particles will react with CH and be immediately converted to C–S–H. However, if there is not enough concentration of CH around the nanosilica particles, the pozzolanic reaction of nanosilica particles will decrease.
Considering the properties of C–S–H [8] and CH as presented in Table 4, the minimum CH concentration during the time of the nanosilica reaction is calculated as 8.768 × 10⁻⁴ kg/m3 (1.185 × 10⁻² mol/m3) for the reference values of kD [39] and D [42] presented in Table 4. If the CH concentration keeps higher than the minimum value during the time of nanosilica reaction, the nanosilica particles having a diameter of 7 nm will fully react in a second. However, NMR experiments showed that the nanosilica particles did not react fully for 7 days. The average CH concentrations for 7 days can be calculated as 1.027 × 10⁻¹⁰ kg/m3 and 32.836 × 10⁻¹⁰ kg/m3 for hardened cement paste incorporating 1% and 3% nanosilica showing the conversion fractions of 66.2% and 41.2% for 7 days, respectively, from the GB model in Equation (3). Similar values are calculated using the JD model in Equation (1) as 1.288 × 10⁻¹⁰ kg/m3 and 36.818 × 10⁻¹⁰ kg/m3 for hardened cement paste incorporating 1% and 3% nanosilica, respectively. The CH concentrations are much lower than the minimum CH concentration of 8.768 × 10⁻⁴ kg/m3. Such tiny CH concentrations may correspond to a single, isolated, nanoSiO2 particle. It is noticeable that the calculated average CH concentration in this study means the average CH concentration during the reaction of a nanoparticle, not the amount of total CH in the hydrated cement. As a special technique to disperse nanosilica was not used to make specimens in this study, there exists a possibility of nanosilica particle aggregation. The aggregation of nanosilica also occurs as a result of the presence of ions such as Ca2+ or K+ released into the pore solution. Therefore, further research is warranted to confirm the effect of CH concentration for pozzolanic reaction of nanosilica excluding nanosilica particle aggregation.
Table 4. The minimum CH concentration for the full conversion of nanosilica.
Reference ValuesThe Minimum CH Concentration from Equations (2) and (4)
k D = 1.269 × 10 17 m 2 / s [ 39 ] D = 7.42 × 10 12 m 2 / s [ 42 ] m C S H = 0.188 k g / m o l [ 8 ] ρ C S H = 2604 k g / m 3 [ 8 ] m C H = 0.074 k g / m o l C w = ρ C S H k D 2 D ( m C H m C S H ) = 8.768 × 10 4 kg / m 3
C m = C w / m C H = 1.185 × 10 2 m o l / m 3

5. Conclusions

The pozzolanic reaction of nanosilica in OPC pastes without nanosilica and including 1% and 3% nanosilica were examined using kinetic models and 29Si MAS NMR. The Type II OPC pastes were hydrated for 7 days. The methodology to extract the conversion fraction of nanosilica from the chemical shift spectra of 29Si MAS NMR experiments was presented. The hydrated cement paste incorporating 1% nanosilica showed a higher conversion fraction of 66.2% than the hydrated cement paste incorporating 3% nanosilica, with a conversion fraction of 41.2%. While the full reaction time for nanosilica particles having a diameter of 7 nm is in seconds, the nanosilica particles for both hardened cement pastes incorporating 1% and 3% nanosilica did not fully react for 7 days of curing time. Considering these results, the CH concentration around nanosilica particles might be limited due to some reason such as isolation, even with the amount of CH in the hydrated cement is sufficient. Therefore, it seems that the reaction of nanosilica depends on the concentration of calcium hydroxide (CH) around the particles as well as its particle size. From the solid-state kinetic models, it was shown that the average CH concentrations for 7 days are much lower than the minimum CH concentration of 8.768 × 10⁻⁴kg/m3.

Acknowledgments

The authors would like to acknowledge that this research was supported by a grant from R&D Program of the Korea Railroad Research Institute, Korea. The third and fourth authors would like to acknowledge the Construction Technology Research Program (CTRP) Grant funded by the Korean government (MLIT) (Code 11-Technology Innovation-F04) and the National Research Foundation (NRF) Grant funded by the Korean government (MOE) (no. 2013R1A1A2062784), respectively.

Author Contributions

All authors contributed equally to this work.

Conflicts of Interest

The authors declare no conflict of interest.

References

  1. Yu, P.; Kirpatrick, R.J.; Poe, B.; McMillan, P.F.; Cong, X. Structure of calcium silicate hydrate (C–S–H): Near-, Mid- and Far- infrared spectroscopy. J. Am. Ceram. Soc. 1999, 82, 742–748. [Google Scholar] [CrossRef]
  2. Richardson, I.G. Tobermorite/Jennite- and Tobermorite/Calcium Hydroxide-Based models for the structure of C–S–H: Applicability to hardened pastes of tricalcium silicate, β-dicalcium silicate, Portland cement, and blends of Portland cement with blast-durnace slag, Metakaolin, or silica fume. Cem. Concr. Res. 2004, 34, 1733–1777. [Google Scholar]
  3. Korb, J.-P.; Monteilhet, L.; McDonald, P.J.; Mitchell, J. Microstructure and texture of hydrated cement-based materials: A proton field cycling relaxometry approach. Cem. Concr. Res. 2007, 37, 297–302. [Google Scholar] [CrossRef]
  4. Garcia Lodeiro, I.; Macphee, D.E.; Palomo, A.; Fernandez-Jimenez, A. Effect of alkalis on fresh C–S–H gels. FTIR analysis. Cem. Concr. Res. 2009, 39, 147–153. [Google Scholar] [CrossRef]
  5. Scrivener, K.; Kirkpatrick, R.J. Innovation in use and research on cementitious material. Cem. Concr. Res. 2008, 38, 128–136. [Google Scholar] [CrossRef]
  6. Stark, J. Recent advances in the field of cement hydration and microstructural analysis. Cem. Concr. Res. 2011, 41, 666–678. [Google Scholar] [CrossRef]
  7. Jennings, H.M. A model for the microstructure of calicum silicate hydrate in cement paste. Cem. Concr. Res. 2000, 30, 101–116. [Google Scholar] [CrossRef]
  8. Allen, A.J.; Thomas, J.J. Analysis of C–S–H gel and cement paste by small-angle neutron scattering. Cem. Concr. Res. 2007, 37, 319–324. [Google Scholar] [CrossRef]
  9. Patural, L.; Porion, P.; van Damme, H.; Govin, A.; Grosseau, P.; Ruot, B.; Deves, O. A pulsed field gradient and NMR imaging investigations of the water retention mechanism by cellulose ethers in mortars. Cem. Concr. Res. 2010, 40, 1378–1385. [Google Scholar] [CrossRef] [Green Version]
  10. Larbi, J.A. Microstructure of the interfacial zone around aggregate particles in concrete. Heron 1993, 38, 1–69. [Google Scholar]
  11. Jennings, H.M.; Tennis, P.D. Model for the developing microstructure in Portland cement pastes. J. Am. Ceram. Soc. 1994, 77, 3161–3172. [Google Scholar] [CrossRef]
  12. Halim, S.C.; Brunner, T.J.; Grass, R.N.; Bohner, M.; Stark, W.J. Preparation of an ultra fast binding cement from calcium silicate-based mixed oxide nanoparticles. Nanotechnology 2007, 18, 1–6. [Google Scholar] [CrossRef] [PubMed]
  13. Sanchez, F.; Sobolev, K. Nanotechnology in concrete—A review. Constr. Build. Mater. 2010, 24, 2060–2071. [Google Scholar] [CrossRef]
  14. Harsh, S.; Arora, A.K.; Thomas, V.; Ali, M.M. Studies on cement hydration in the presence of nanosilica. Cem. Int. 2014, 3, 74–78. [Google Scholar]
  15. Lee, H.-S.; Cho, H.-K.; Wang, X.-Y. Experimental investigation and theoretical modeling of nanosilica activity in concrete. J. Nanomater. 2014, 2014. [Google Scholar] [CrossRef]
  16. DeWindt, L.; Deneele, D.; Maubec, N. Kinetics of lime/bentonite pozzolanic reactions at 20 and 50 °C: Batch tests and modeling. Cem. Concr. Res. 2014, 59, 34–42. [Google Scholar] [CrossRef] [Green Version]
  17. Li, X.; Gao, H.; Scrivens, W.A.; Fei, D.; Thakur, V.; Sutton, M.A.; Reynolds, A.P.; Myrick, M.L. Structural and mechanical characterization of nanoclay-reinforced agarose nanocomposites. Nanotechnology 2005, 16, 2020–2029. [Google Scholar] [CrossRef] [PubMed]
  18. Chaipanich, A.; Nochaiya, T.; Wongkeo, W.; Torkittikul, P. Compressive strength and microstructure of carbon nanotubes-fly ash cement composites. Mater. Sci. Eng. A 2010, 527, 1063–1067. [Google Scholar] [CrossRef]
  19. Jo, B.-W.; Kim, C.-H.; Tae, G.-H.; Park, J.-B. Characteristics of cement mortar with nano-SiO2 particles. Constr. Build. Mater. 2007, 21, 1351–1355. [Google Scholar] [CrossRef]
  20. Lothenbach, B.; Saout, G.L.; Gallucci, E.; Scrivener, K. Influence of limestone on the hydration of Portland cements. Cem. Concr. Res. 2008, 38, 848–860. [Google Scholar] [CrossRef]
  21. Gaitero, J.J.; Ibarra, Y.S.; Campillo, I. Silica nanoparticle addition to control the calcium-leaching in cement-based materials. Phys. State Solid 2006, 203, 1313–1318. [Google Scholar] [CrossRef]
  22. Gaitero, J.J.; Campillo, I.; Guerrero, A. Reduction of the calcium leaching rate of cement paste by addition of silica nanoparticles. Cem. Concr. Res. 2008, 38, 1112–1118. [Google Scholar] [CrossRef] [Green Version]
  23. Kim, J.J.; Fan, T.; Reda Taha, M.M. Homogenization model examining the effect of nanosilica on concrete strength and stiffness. Trans. Res. Rec. 2010, 2141, 28–35. [Google Scholar] [CrossRef]
  24. Choolaei, M.; Rashidi, A.M.; Ardjmand, M.; Yadegari, A. The effect of nanosilica on the physical properties of oil well cement. Mater. Sci. Eng. A 2012, 538, 288–294. [Google Scholar] [CrossRef]
  25. Norris, A.; Saafi, M.; Romine, P. Temperature and moisture monitoring in concrete structures using embedded nanotechnology/microelectromechanical systems (MEMS) sensors. Constr. Build. Mater. 2008, 22, 111–120. [Google Scholar] [CrossRef]
  26. Barnes, P. Structure and Performance of Cements; Applied Science Publishers: London, UK; New York, NY, USA, 1983. [Google Scholar]
  27. Booth, F. A note on the theory of surface diffusion reactions. Trans. Faraday Soc. 1948, 44, 796–801. [Google Scholar] [CrossRef]
  28. Khawam, A.; Flanagan, D.R. Solid-state kinetic models: Basic and mathematical fundamentals. J. Phys. Chem. B 2006, 110, 17315–17328. [Google Scholar] [CrossRef] [PubMed]
  29. Kim, J.J.; Rahman, M.K.; Al-Majed, A.A.; Al-Zahrani, M.M.; Reda Taha, M.M. Nanosilica effects on composition and silicate polymerization in hardened cement paste cured under high temperature and pressure. Cem. Concr. Compos. 2013, 43, 78–85. [Google Scholar] [CrossRef]
  30. Crank, J. The Mathematics of Diffusion, 2nd ed.; Clarendon Press: Oxford, UK, 1975. [Google Scholar]
  31. ASTM-C305. Standard Practice for Mechanical Mixing of Hydraulic Cement Pastes and Mortars of Plastic Consistency; ASTM International: West Conshohocken, PA, USA, 1999. [Google Scholar]
  32. Macomber, R.S. A Complete Introduction to Modern NMR Spectroscopy; John Wiley & Sons: New York, NY, USA, 1998. [Google Scholar]
  33. Lippmaa, E.; Mägi, M.; Samoson, A.; Engelhardt, G.; Grimmer, A.R. Structural studies of silicates by solid-state high-resolution 29Si NMR. Am. Chem. Soc. 1980, 102, 4889–4893. [Google Scholar] [CrossRef]
  34. Wieker, W.; Grimmer, A.-R.; Winkler, A.; Mägi, M.; Tarmak, M.; Lippmaa, E. Solid-state high-resolution 29Si NMR spectroscopy of synthetic 14 Å, 11 Å and 9 Å tobermorites. Cem. Concr. Res. 1982, 12, 333–339. [Google Scholar] [CrossRef]
  35. Young, J.F. Investigations of calcium silicate hydrate structure using silicon-29 nuclear magnetic resonance spectroscopy. Am. Cerm. Soc. 1988, 71, C118–C120. [Google Scholar]
  36. Grutzeck, M.; Benesi, A.; Fanning, B. Silicon-29 magic-angle spinning nuclear magnetic resonance study of calcium silicate hydrates. Am. Ceram. Soc. 1989, 72, 665–668. [Google Scholar] [CrossRef]
  37. Saoût, G.L.; Le’colier, E.; Rivereau, A.; Zanni, H. Chemical structure of cement aged at normal and elevated temperatures and pressures, Part II: Low permeability class G oilwell cement. Cem. Concr. Res. 2006, 36, 428–433. [Google Scholar] [CrossRef]
  38. Bell, G.M.M.; Benstedm, J.; Glasser, F.P.; Lachowski, E.E.; Roberts, D.R.; Taylor, M.J. Study of calcium silicate hydrates by solid state high resolution 29Si nuclear magnetic resonance. Adv. Cem. Res. 1990, 3, 23–37. [Google Scholar] [CrossRef]
  39. Cong, X.; Kirkpatrick, R.J. 29Si MAS NMR study of the structure of calcium silicate hydrate. Adv. Cem. Based Mater. 1996, 3, 144–156. [Google Scholar] [CrossRef]
  40. Yajun, J.; Cahyadi, J.H. Simulation of silica fume blended cement hydration. Mater. Struct. 2004, 37, 397–404. [Google Scholar] [CrossRef]
  41. Monasterio, M.; Gaitero, J.J.; Erkizia, E.; Bustos, A.M.G.; Miccio, L.A.; Dolado, J.S.; Cerveny, S. Effect of addition of silica- and amine functionalized silica-nanoparticles on the microstructure of calcium silicate hydrate (C–S–H) gel. J. Colloid Interface Sci. 2015, 450, 109–118. [Google Scholar] [CrossRef] [PubMed]
  42. Ten, B.Y. Calculation of SiO2 diffusion coefficients based on kinetic curves of silica grain dissolution. Glass Ceram. 2004, 61, 13–14. [Google Scholar] [CrossRef]

